EP3699296A1 - Verfahren zur überwachung von zuständen durch sequenzanalyse - Google Patents
Verfahren zur überwachung von zuständen durch sequenzanalyse Download PDFInfo
- Publication number
- EP3699296A1 EP3699296A1 EP20157266.6A EP20157266A EP3699296A1 EP 3699296 A1 EP3699296 A1 EP 3699296A1 EP 20157266 A EP20157266 A EP 20157266A EP 3699296 A1 EP3699296 A1 EP 3699296A1
- Authority
- EP
- European Patent Office
- Prior art keywords
- disease
- cells
- clonotypes
- sequencing
- sequences
- Prior art date
- Legal status (The legal status is an assumption and is not a legal conclusion. Google has not performed a legal analysis and makes no representation as to the accuracy of the status listed.)
- Pending
Links
- 238000000034 method Methods 0.000 title claims abstract description 270
- 238000012544 monitoring process Methods 0.000 title description 32
- 238000012300 Sequence Analysis Methods 0.000 title 1
- 208000037265 diseases, disorders, signs and symptoms Diseases 0.000 claims abstract description 249
- 201000010099 disease Diseases 0.000 claims abstract description 248
- 206010028980 Neoplasm Diseases 0.000 claims abstract description 97
- 201000011510 cancer Diseases 0.000 claims abstract description 39
- 238000012163 sequencing technique Methods 0.000 claims description 160
- 210000004027 cell Anatomy 0.000 claims description 142
- 210000001744 T-lymphocyte Anatomy 0.000 claims description 112
- 210000003719 b-lymphocyte Anatomy 0.000 claims description 105
- 210000004369 blood Anatomy 0.000 claims description 103
- 239000008280 blood Substances 0.000 claims description 103
- 108091008874 T cell receptors Proteins 0.000 claims description 74
- 102000016266 T-Cell Antigen Receptors Human genes 0.000 claims description 68
- 108090000623 proteins and genes Proteins 0.000 claims description 50
- 239000000427 antigen Substances 0.000 claims description 44
- 108091007433 antigens Proteins 0.000 claims description 44
- 102000036639 antigens Human genes 0.000 claims description 44
- 239000002773 nucleotide Substances 0.000 claims description 44
- 125000003729 nucleotide group Chemical group 0.000 claims description 44
- 101100395211 Trichoderma harzianum his3 gene Proteins 0.000 claims description 42
- 108010047041 Complementarity Determining Regions Proteins 0.000 claims description 32
- 108700005091 Immunoglobulin Genes Proteins 0.000 claims description 23
- 102000018358 immunoglobulin Human genes 0.000 claims description 21
- 108700042075 T-Cell Receptor Genes Proteins 0.000 claims description 19
- 230000015572 biosynthetic process Effects 0.000 claims description 16
- 108010002162 IgK Proteins 0.000 claims description 12
- 238000003786 synthesis reaction Methods 0.000 claims description 7
- 238000007403 mPCR Methods 0.000 claims description 5
- 208000023275 Autoimmune disease Diseases 0.000 abstract description 45
- 238000003745 diagnosis Methods 0.000 abstract description 15
- 239000000090 biomarker Substances 0.000 abstract description 9
- 238000001712 DNA sequencing Methods 0.000 abstract description 5
- 238000004393 prognosis Methods 0.000 abstract description 4
- 230000001976 improved effect Effects 0.000 abstract description 3
- 239000000523 sample Substances 0.000 description 198
- 238000012360 testing method Methods 0.000 description 169
- 238000004422 calculation algorithm Methods 0.000 description 153
- 238000003199 nucleic acid amplification method Methods 0.000 description 151
- 230000003321 amplification Effects 0.000 description 150
- 230000009266 disease activity Effects 0.000 description 116
- 108020004414 DNA Proteins 0.000 description 112
- 238000003752 polymerase chain reaction Methods 0.000 description 89
- 238000011282 treatment Methods 0.000 description 71
- 238000002560 therapeutic procedure Methods 0.000 description 65
- 239000002299 complementary DNA Substances 0.000 description 64
- 238000004458 analytical method Methods 0.000 description 63
- 239000003814 drug Substances 0.000 description 58
- 208000024891 symptom Diseases 0.000 description 57
- 201000006417 multiple sclerosis Diseases 0.000 description 56
- 150000007523 nucleic acids Chemical group 0.000 description 56
- 229940079593 drug Drugs 0.000 description 55
- 201000000596 systemic lupus erythematosus Diseases 0.000 description 55
- 108091032973 (ribonucleotides)n+m Proteins 0.000 description 53
- 238000006243 chemical reaction Methods 0.000 description 53
- 108091028043 Nucleic acid sequence Proteins 0.000 description 52
- 102000039446 nucleic acids Human genes 0.000 description 50
- 108020004707 nucleic acids Proteins 0.000 description 50
- 230000000295 complement effect Effects 0.000 description 45
- 108091008875 B cell receptors Proteins 0.000 description 44
- 235000018102 proteins Nutrition 0.000 description 40
- 102000004169 proteins and genes Human genes 0.000 description 40
- DDRJAANPRJIHGJ-UHFFFAOYSA-N creatinine Chemical compound CN1CC(=O)NC1=N DDRJAANPRJIHGJ-UHFFFAOYSA-N 0.000 description 38
- 238000001514 detection method Methods 0.000 description 38
- 208000015181 infectious disease Diseases 0.000 description 36
- 210000001519 tissue Anatomy 0.000 description 35
- 230000008859 change Effects 0.000 description 31
- 238000013459 approach Methods 0.000 description 30
- 238000001574 biopsy Methods 0.000 description 30
- 230000035945 sensitivity Effects 0.000 description 28
- 239000012634 fragment Substances 0.000 description 27
- 230000004044 response Effects 0.000 description 27
- 206010039073 rheumatoid arthritis Diseases 0.000 description 27
- 206010020751 Hypersensitivity Diseases 0.000 description 26
- 210000000987 immune system Anatomy 0.000 description 26
- 208000026935 allergic disease Diseases 0.000 description 25
- 239000003550 marker Substances 0.000 description 25
- 230000000694 effects Effects 0.000 description 23
- 230000001965 increasing effect Effects 0.000 description 23
- 206010069754 Acquired gene mutation Diseases 0.000 description 22
- 230000037439 somatic mutation Effects 0.000 description 22
- 206010036807 progressive multifocal leukoencephalopathy Diseases 0.000 description 21
- 239000011324 bead Substances 0.000 description 20
- 210000002700 urine Anatomy 0.000 description 20
- 229940109239 creatinine Drugs 0.000 description 19
- 210000001503 joint Anatomy 0.000 description 19
- 150000003431 steroids Chemical class 0.000 description 19
- 241000699666 Mus <mouse, genus> Species 0.000 description 18
- 239000013566 allergen Substances 0.000 description 18
- 150000001413 amino acids Chemical group 0.000 description 18
- 230000006378 damage Effects 0.000 description 18
- 210000000056 organ Anatomy 0.000 description 18
- 230000001154 acute effect Effects 0.000 description 17
- 230000007815 allergy Effects 0.000 description 17
- 230000014509 gene expression Effects 0.000 description 17
- 230000028993 immune response Effects 0.000 description 17
- 230000004054 inflammatory process Effects 0.000 description 17
- 230000008569 process Effects 0.000 description 17
- 238000012549 training Methods 0.000 description 17
- 108700028369 Alleles Proteins 0.000 description 16
- 206010016256 fatigue Diseases 0.000 description 16
- 238000009396 hybridization Methods 0.000 description 16
- 239000012678 infectious agent Substances 0.000 description 16
- 230000003907 kidney function Effects 0.000 description 16
- 239000000463 material Substances 0.000 description 16
- 238000002483 medication Methods 0.000 description 16
- 238000003753 real-time PCR Methods 0.000 description 16
- 108091093088 Amplicon Proteins 0.000 description 15
- 108091034117 Oligonucleotide Proteins 0.000 description 15
- 238000011493 immune profiling Methods 0.000 description 15
- 210000003734 kidney Anatomy 0.000 description 15
- 230000007420 reactivation Effects 0.000 description 15
- 239000007787 solid Substances 0.000 description 15
- 206010061218 Inflammation Diseases 0.000 description 14
- 210000004698 lymphocyte Anatomy 0.000 description 14
- 238000002595 magnetic resonance imaging Methods 0.000 description 14
- 206010002556 Ankylosing Spondylitis Diseases 0.000 description 13
- 108010074051 C-Reactive Protein Proteins 0.000 description 13
- 102100032752 C-reactive protein Human genes 0.000 description 13
- 238000009534 blood test Methods 0.000 description 13
- 210000001175 cerebrospinal fluid Anatomy 0.000 description 13
- 230000009467 reduction Effects 0.000 description 13
- 238000002965 ELISA Methods 0.000 description 12
- 208000002193 Pain Diseases 0.000 description 12
- 238000002790 cross-validation Methods 0.000 description 12
- 239000002988 disease modifying antirheumatic drug Substances 0.000 description 12
- 238000002509 fluorescent in situ hybridization Methods 0.000 description 12
- 238000011862 kidney biopsy Methods 0.000 description 12
- 230000007774 longterm Effects 0.000 description 12
- 238000002493 microarray Methods 0.000 description 12
- 230000006798 recombination Effects 0.000 description 12
- 238000005215 recombination Methods 0.000 description 12
- 230000002829 reductive effect Effects 0.000 description 12
- 102000004190 Enzymes Human genes 0.000 description 11
- 108090000790 Enzymes Proteins 0.000 description 11
- 229920002153 Hydroxypropyl cellulose Polymers 0.000 description 11
- 230000036541 health Effects 0.000 description 11
- 235000010977 hydroxypropyl cellulose Nutrition 0.000 description 11
- 238000010348 incorporation Methods 0.000 description 11
- 206010025135 lupus erythematosus Diseases 0.000 description 11
- 238000002255 vaccination Methods 0.000 description 11
- 241000282412 Homo Species 0.000 description 10
- 241000699670 Mus sp. Species 0.000 description 10
- 210000004556 brain Anatomy 0.000 description 10
- 230000001684 chronic effect Effects 0.000 description 10
- 230000000875 corresponding effect Effects 0.000 description 10
- 238000011161 development Methods 0.000 description 10
- 230000018109 developmental process Effects 0.000 description 10
- 210000004602 germ cell Anatomy 0.000 description 10
- 230000036407 pain Effects 0.000 description 10
- 108090000765 processed proteins & peptides Proteins 0.000 description 10
- 241000894006 Bacteria Species 0.000 description 9
- 102100027207 CD27 antigen Human genes 0.000 description 9
- 101000914511 Homo sapiens CD27 antigen Proteins 0.000 description 9
- 108060003951 Immunoglobulin Proteins 0.000 description 9
- 206010003246 arthritis Diseases 0.000 description 9
- 230000001580 bacterial effect Effects 0.000 description 9
- 208000029742 colonic neoplasm Diseases 0.000 description 9
- 210000002865 immune cell Anatomy 0.000 description 9
- 230000002757 inflammatory effect Effects 0.000 description 9
- 230000003993 interaction Effects 0.000 description 9
- 102100026008 Breakpoint cluster region protein Human genes 0.000 description 8
- 206010009944 Colon cancer Diseases 0.000 description 8
- 208000009329 Graft vs Host Disease Diseases 0.000 description 8
- FBOZXECLQNJBKD-ZDUSSCGKSA-N L-methotrexate Chemical compound C=1N=C2N=C(N)N=C(N)C2=NC=1CN(C)C1=CC=C(C(=O)N[C@@H](CCC(O)=O)C(O)=O)C=C1 FBOZXECLQNJBKD-ZDUSSCGKSA-N 0.000 description 8
- LMEKQMALGUDUQG-UHFFFAOYSA-N azathioprine Chemical compound CN1C=NC([N+]([O-])=O)=C1SC1=NC=NC2=C1NC=N2 LMEKQMALGUDUQG-UHFFFAOYSA-N 0.000 description 8
- 230000008901 benefit Effects 0.000 description 8
- 238000010586 diagram Methods 0.000 description 8
- 238000001502 gel electrophoresis Methods 0.000 description 8
- 208000024908 graft versus host disease Diseases 0.000 description 8
- 210000002216 heart Anatomy 0.000 description 8
- 229960000485 methotrexate Drugs 0.000 description 8
- 239000012071 phase Substances 0.000 description 8
- 229960004618 prednisone Drugs 0.000 description 8
- XOFYZVNMUHMLCC-ZPOLXVRWSA-N prednisone Chemical compound O=C1C=C[C@]2(C)[C@H]3C(=O)C[C@](C)([C@@](CC4)(O)C(=O)CO)[C@@H]4[C@@H]3CCC2=C1 XOFYZVNMUHMLCC-ZPOLXVRWSA-N 0.000 description 8
- 210000002966 serum Anatomy 0.000 description 8
- 230000000392 somatic effect Effects 0.000 description 8
- 230000004083 survival effect Effects 0.000 description 8
- 108700042077 T-Cell Receptor beta Genes Proteins 0.000 description 7
- 210000005006 adaptive immune system Anatomy 0.000 description 7
- 239000003435 antirheumatic agent Substances 0.000 description 7
- 238000003556 assay Methods 0.000 description 7
- 210000001124 body fluid Anatomy 0.000 description 7
- 210000001185 bone marrow Anatomy 0.000 description 7
- 230000007423 decrease Effects 0.000 description 7
- 230000003247 decreasing effect Effects 0.000 description 7
- 238000009826 distribution Methods 0.000 description 7
- 239000007850 fluorescent dye Substances 0.000 description 7
- 238000003384 imaging method Methods 0.000 description 7
- 239000003018 immunosuppressive agent Substances 0.000 description 7
- 238000009169 immunotherapy Methods 0.000 description 7
- 238000002347 injection Methods 0.000 description 7
- 239000007924 injection Substances 0.000 description 7
- 230000003902 lesion Effects 0.000 description 7
- 210000005036 nerve Anatomy 0.000 description 7
- 230000002441 reversible effect Effects 0.000 description 7
- 238000000926 separation method Methods 0.000 description 7
- 238000002054 transplantation Methods 0.000 description 7
- 208000035473 Communicable disease Diseases 0.000 description 6
- PMATZTZNYRCHOR-CGLBZJNRSA-N Cyclosporin A Chemical compound CC[C@@H]1NC(=O)[C@H]([C@H](O)[C@H](C)C\C=C\C)N(C)C(=O)[C@H](C(C)C)N(C)C(=O)[C@H](CC(C)C)N(C)C(=O)[C@H](CC(C)C)N(C)C(=O)[C@@H](C)NC(=O)[C@H](C)NC(=O)[C@H](CC(C)C)N(C)C(=O)[C@H](C(C)C)NC(=O)[C@H](CC(C)C)N(C)C(=O)CN(C)C1=O PMATZTZNYRCHOR-CGLBZJNRSA-N 0.000 description 6
- 108010036949 Cyclosporine Proteins 0.000 description 6
- 241000701022 Cytomegalovirus Species 0.000 description 6
- 102000053602 DNA Human genes 0.000 description 6
- 238000000018 DNA microarray Methods 0.000 description 6
- UETNIIAIRMUTSM-UHFFFAOYSA-N Jacareubin Natural products CC1(C)OC2=CC3Oc4c(O)c(O)ccc4C(=O)C3C(=C2C=C1)O UETNIIAIRMUTSM-UHFFFAOYSA-N 0.000 description 6
- 238000000636 Northern blotting Methods 0.000 description 6
- 108091005461 Nucleic proteins Proteins 0.000 description 6
- 206010039085 Rhinitis allergic Diseases 0.000 description 6
- 238000002105 Southern blotting Methods 0.000 description 6
- 201000010105 allergic rhinitis Diseases 0.000 description 6
- 150000001720 carbohydrates Chemical class 0.000 description 6
- 235000014633 carbohydrates Nutrition 0.000 description 6
- 230000002759 chromosomal effect Effects 0.000 description 6
- 230000000052 comparative effect Effects 0.000 description 6
- 230000002596 correlated effect Effects 0.000 description 6
- 238000010790 dilution Methods 0.000 description 6
- 239000012895 dilution Substances 0.000 description 6
- 238000002474 experimental method Methods 0.000 description 6
- 238000010195 expression analysis Methods 0.000 description 6
- 238000012268 genome sequencing Methods 0.000 description 6
- 230000003053 immunization Effects 0.000 description 6
- 238000002649 immunization Methods 0.000 description 6
- 238000003364 immunohistochemistry Methods 0.000 description 6
- 238000007901 in situ hybridization Methods 0.000 description 6
- 150000002632 lipids Chemical class 0.000 description 6
- 210000004185 liver Anatomy 0.000 description 6
- 238000005259 measurement Methods 0.000 description 6
- 230000007246 mechanism Effects 0.000 description 6
- 230000001404 mediated effect Effects 0.000 description 6
- 238000010208 microarray analysis Methods 0.000 description 6
- 230000035772 mutation Effects 0.000 description 6
- 238000005457 optimization Methods 0.000 description 6
- 230000001575 pathological effect Effects 0.000 description 6
- 238000004062 sedimentation Methods 0.000 description 6
- 210000003491 skin Anatomy 0.000 description 6
- 238000002415 sodium dodecyl sulfate polyacrylamide gel electrophoresis Methods 0.000 description 6
- 229960001940 sulfasalazine Drugs 0.000 description 6
- NCEXYHBECQHGNR-QZQOTICOSA-N sulfasalazine Chemical compound C1=C(O)C(C(=O)O)=CC(\N=N\C=2C=CC(=CC=2)S(=O)(=O)NC=2N=CC=CC=2)=C1 NCEXYHBECQHGNR-QZQOTICOSA-N 0.000 description 6
- NCEXYHBECQHGNR-UHFFFAOYSA-N sulfasalazine Natural products C1=C(O)C(C(=O)O)=CC(N=NC=2C=CC(=CC=2)S(=O)(=O)NC=2N=CC=CC=2)=C1 NCEXYHBECQHGNR-UHFFFAOYSA-N 0.000 description 6
- 230000001225 therapeutic effect Effects 0.000 description 6
- 238000010200 validation analysis Methods 0.000 description 6
- 238000001262 western blot Methods 0.000 description 6
- 206010002198 Anaphylactic reaction Diseases 0.000 description 5
- 101100263837 Bovine ephemeral fever virus (strain BB7721) beta gene Proteins 0.000 description 5
- CMSMOCZEIVJLDB-UHFFFAOYSA-N Cyclophosphamide Chemical compound ClCCN(CCCl)P1(=O)NCCCO1 CMSMOCZEIVJLDB-UHFFFAOYSA-N 0.000 description 5
- 229940123907 Disease modifying antirheumatic drug Drugs 0.000 description 5
- 101100316840 Enterobacteria phage P4 Beta gene Proteins 0.000 description 5
- 206010019233 Headaches Diseases 0.000 description 5
- 108020005187 Oligonucleotide Probes Proteins 0.000 description 5
- 206010052779 Transplant rejections Diseases 0.000 description 5
- 108060008682 Tumor Necrosis Factor Proteins 0.000 description 5
- 102000000852 Tumor Necrosis Factor-alpha Human genes 0.000 description 5
- 208000021017 Weight Gain Diseases 0.000 description 5
- 230000004721 adaptive immunity Effects 0.000 description 5
- 230000036783 anaphylactic response Effects 0.000 description 5
- 208000003455 anaphylaxis Diseases 0.000 description 5
- 208000006673 asthma Diseases 0.000 description 5
- 229960002170 azathioprine Drugs 0.000 description 5
- 238000004820 blood count Methods 0.000 description 5
- 239000010839 body fluid Substances 0.000 description 5
- 239000002458 cell surface marker Substances 0.000 description 5
- 230000034994 death Effects 0.000 description 5
- 231100000517 death Toxicity 0.000 description 5
- 208000037765 diseases and disorders Diseases 0.000 description 5
- 238000002651 drug therapy Methods 0.000 description 5
- 210000003743 erythrocyte Anatomy 0.000 description 5
- 210000001508 eye Anatomy 0.000 description 5
- -1 for example Substances 0.000 description 5
- 230000006870 function Effects 0.000 description 5
- 231100000869 headache Toxicity 0.000 description 5
- XXSMGPRMXLTPCZ-UHFFFAOYSA-N hydroxychloroquine Chemical compound ClC1=CC=C2C(NC(C)CCCN(CCO)CC)=CC=NC2=C1 XXSMGPRMXLTPCZ-UHFFFAOYSA-N 0.000 description 5
- 230000009610 hypersensitivity Effects 0.000 description 5
- 229960003444 immunosuppressant agent Drugs 0.000 description 5
- 230000006872 improvement Effects 0.000 description 5
- 206010022000 influenza Diseases 0.000 description 5
- 239000002751 oligonucleotide probe Substances 0.000 description 5
- 230000037452 priming Effects 0.000 description 5
- 238000007390 skin biopsy Methods 0.000 description 5
- 201000005671 spondyloarthropathy Diseases 0.000 description 5
- 229940079023 tysabri Drugs 0.000 description 5
- 239000013598 vector Substances 0.000 description 5
- 230000004584 weight gain Effects 0.000 description 5
- 235000019786 weight gain Nutrition 0.000 description 5
- VVNCNSJFMMFHPL-VKHMYHEASA-N D-penicillamine Chemical compound CC(C)(S)[C@@H](N)C(O)=O VVNCNSJFMMFHPL-VKHMYHEASA-N 0.000 description 4
- 108010014303 DNA-directed DNA polymerase Proteins 0.000 description 4
- 102000016928 DNA-directed DNA polymerase Human genes 0.000 description 4
- 206010012735 Diarrhoea Diseases 0.000 description 4
- 208000010201 Exanthema Diseases 0.000 description 4
- 206010016946 Food allergy Diseases 0.000 description 4
- 208000006045 Spondylarthropathies Diseases 0.000 description 4
- 230000032683 aging Effects 0.000 description 4
- 230000003466 anti-cipated effect Effects 0.000 description 4
- 239000000839 emulsion Substances 0.000 description 4
- 238000005516 engineering process Methods 0.000 description 4
- 201000005884 exanthem Diseases 0.000 description 4
- 239000012530 fluid Substances 0.000 description 4
- 230000004927 fusion Effects 0.000 description 4
- 230000012010 growth Effects 0.000 description 4
- 208000002672 hepatitis B Diseases 0.000 description 4
- 229960004171 hydroxychloroquine Drugs 0.000 description 4
- 230000000899 immune system response Effects 0.000 description 4
- 230000001506 immunosuppresive effect Effects 0.000 description 4
- 238000000338 in vitro Methods 0.000 description 4
- 210000002414 leg Anatomy 0.000 description 4
- 210000004072 lung Anatomy 0.000 description 4
- 239000000693 micelle Substances 0.000 description 4
- HPNSFSBZBAHARI-UHFFFAOYSA-N micophenolic acid Natural products OC1=C(CC=C(C)CCC(O)=O)C(OC)=C(C)C2=C1C(=O)OC2 HPNSFSBZBAHARI-UHFFFAOYSA-N 0.000 description 4
- RTGDFNSFWBGLEC-SYZQJQIISA-N mycophenolate mofetil Chemical compound COC1=C(C)C=2COC(=O)C=2C(O)=C1C\C=C(/C)CCC(=O)OCCN1CCOCC1 RTGDFNSFWBGLEC-SYZQJQIISA-N 0.000 description 4
- 229960005027 natalizumab Drugs 0.000 description 4
- 201000008383 nephritis Diseases 0.000 description 4
- 230000000926 neurological effect Effects 0.000 description 4
- 229940021182 non-steroidal anti-inflammatory drug Drugs 0.000 description 4
- 239000013610 patient sample Substances 0.000 description 4
- 229960001639 penicillamine Drugs 0.000 description 4
- 208000005987 polymyositis Diseases 0.000 description 4
- 102000004196 processed proteins & peptides Human genes 0.000 description 4
- 206010037844 rash Diseases 0.000 description 4
- 230000009257 reactivity Effects 0.000 description 4
- 229960004641 rituximab Drugs 0.000 description 4
- 239000000243 solution Substances 0.000 description 4
- 210000000278 spinal cord Anatomy 0.000 description 4
- 210000000952 spleen Anatomy 0.000 description 4
- 239000000126 substance Substances 0.000 description 4
- 210000001179 synovial fluid Anatomy 0.000 description 4
- 230000009897 systematic effect Effects 0.000 description 4
- 230000009258 tissue cross reactivity Effects 0.000 description 4
- 238000012176 true single molecule sequencing Methods 0.000 description 4
- 238000002562 urinalysis Methods 0.000 description 4
- RZVAJINKPMORJF-UHFFFAOYSA-N Acetaminophen Chemical compound CC(=O)NC1=CC=C(O)C=C1 RZVAJINKPMORJF-UHFFFAOYSA-N 0.000 description 3
- 208000008822 Ankylosis Diseases 0.000 description 3
- 208000006820 Arthralgia Diseases 0.000 description 3
- 208000008439 Biliary Liver Cirrhosis Diseases 0.000 description 3
- 208000033222 Biliary cirrhosis primary Diseases 0.000 description 3
- 210000001266 CD8-positive T-lymphocyte Anatomy 0.000 description 3
- 108010012236 Chemokines Proteins 0.000 description 3
- 102000019034 Chemokines Human genes 0.000 description 3
- 208000017667 Chronic Disease Diseases 0.000 description 3
- 208000015943 Coeliac disease Diseases 0.000 description 3
- 229930105110 Cyclosporin A Natural products 0.000 description 3
- 206010061818 Disease progression Diseases 0.000 description 3
- 108010008165 Etanercept Proteins 0.000 description 3
- 208000004262 Food Hypersensitivity Diseases 0.000 description 3
- 108010072051 Glatiramer Acetate Proteins 0.000 description 3
- 206010062016 Immunosuppression Diseases 0.000 description 3
- 102100034343 Integrase Human genes 0.000 description 3
- 108010005714 Interferon beta-1b Proteins 0.000 description 3
- 241000701460 JC polyomavirus Species 0.000 description 3
- 208000032420 Latent Infection Diseases 0.000 description 3
- FQISKWAFAHGMGT-SGJOWKDISA-M Methylprednisolone sodium succinate Chemical compound [Na+].C([C@@]12C)=CC(=O)C=C1[C@@H](C)C[C@@H]1[C@@H]2[C@@H](O)C[C@]2(C)[C@@](O)(C(=O)COC(=O)CCC([O-])=O)CC[C@H]21 FQISKWAFAHGMGT-SGJOWKDISA-M 0.000 description 3
- 208000007101 Muscle Cramp Diseases 0.000 description 3
- 206010028813 Nausea Diseases 0.000 description 3
- 208000012654 Primary biliary cholangitis Diseases 0.000 description 3
- 108010092799 RNA-directed DNA polymerase Proteins 0.000 description 3
- 206010039710 Scleroderma Diseases 0.000 description 3
- 208000021386 Sjogren Syndrome Diseases 0.000 description 3
- 108700042076 T-Cell Receptor alpha Genes Proteins 0.000 description 3
- 108010006785 Taq Polymerase Proteins 0.000 description 3
- 206010053613 Type IV hypersensitivity reaction Diseases 0.000 description 3
- 241000700605 Viruses Species 0.000 description 3
- 230000001133 acceleration Effects 0.000 description 3
- 230000004913 activation Effects 0.000 description 3
- 230000003044 adaptive effect Effects 0.000 description 3
- 229940035676 analgesics Drugs 0.000 description 3
- 239000000730 antalgic agent Substances 0.000 description 3
- 239000002260 anti-inflammatory agent Substances 0.000 description 3
- 229940124599 anti-inflammatory drug Drugs 0.000 description 3
- 230000003460 anti-nuclear Effects 0.000 description 3
- 230000005784 autoimmunity Effects 0.000 description 3
- 229940021459 betaseron Drugs 0.000 description 3
- 229960000074 biopharmaceutical Drugs 0.000 description 3
- 229940107810 cellcept Drugs 0.000 description 3
- 210000003169 central nervous system Anatomy 0.000 description 3
- 238000002512 chemotherapy Methods 0.000 description 3
- 229960001265 ciclosporin Drugs 0.000 description 3
- 239000003086 colorant Substances 0.000 description 3
- 238000002591 computed tomography Methods 0.000 description 3
- 239000003246 corticosteroid Substances 0.000 description 3
- 229960004397 cyclophosphamide Drugs 0.000 description 3
- 238000012217 deletion Methods 0.000 description 3
- 230000037430 deletion Effects 0.000 description 3
- 238000013461 design Methods 0.000 description 3
- XPPKVPWEQAFLFU-UHFFFAOYSA-J diphosphate(4-) Chemical compound [O-]P([O-])(=O)OP([O-])([O-])=O XPPKVPWEQAFLFU-UHFFFAOYSA-J 0.000 description 3
- 235000011180 diphosphates Nutrition 0.000 description 3
- 230000005750 disease progression Effects 0.000 description 3
- 239000000428 dust Substances 0.000 description 3
- 235000020932 food allergy Nutrition 0.000 description 3
- 210000003630 histaminocyte Anatomy 0.000 description 3
- 230000001900 immune effect Effects 0.000 description 3
- 238000010166 immunofluorescence Methods 0.000 description 3
- 230000002427 irreversible effect Effects 0.000 description 3
- 238000009533 lab test Methods 0.000 description 3
- 210000000265 leukocyte Anatomy 0.000 description 3
- 238000009593 lumbar puncture Methods 0.000 description 3
- 238000012423 maintenance Methods 0.000 description 3
- 206010061289 metastatic neoplasm Diseases 0.000 description 3
- 229960004866 mycophenolate mofetil Drugs 0.000 description 3
- 230000008693 nausea Effects 0.000 description 3
- 229910052757 nitrogen Inorganic materials 0.000 description 3
- 239000000041 non-steroidal anti-inflammatory agent Substances 0.000 description 3
- 230000008816 organ damage Effects 0.000 description 3
- 244000052769 pathogen Species 0.000 description 3
- 238000006116 polymerization reaction Methods 0.000 description 3
- 208000037821 progressive disease Diseases 0.000 description 3
- 238000012175 pyrosequencing Methods 0.000 description 3
- 230000000306 recurrent effect Effects 0.000 description 3
- 210000005084 renal tissue Anatomy 0.000 description 3
- 230000000153 supplemental effect Effects 0.000 description 3
- 230000009885 systemic effect Effects 0.000 description 3
- 230000008685 targeting Effects 0.000 description 3
- 208000027930 type IV hypersensitivity disease Diseases 0.000 description 3
- 238000002604 ultrasonography Methods 0.000 description 3
- 241001430294 unidentified retrovirus Species 0.000 description 3
- 229960005486 vaccine Drugs 0.000 description 3
- 230000004393 visual impairment Effects 0.000 description 3
- 230000008673 vomiting Effects 0.000 description 3
- 208000016261 weight loss Diseases 0.000 description 3
- 230000004580 weight loss Effects 0.000 description 3
- 208000030507 AIDS Diseases 0.000 description 2
- 102000006306 Antigen Receptors Human genes 0.000 description 2
- 108010083359 Antigen Receptors Proteins 0.000 description 2
- BSYNRYMUTXBXSQ-UHFFFAOYSA-N Aspirin Chemical compound CC(=O)OC1=CC=CC=C1C(O)=O BSYNRYMUTXBXSQ-UHFFFAOYSA-N 0.000 description 2
- 206010003827 Autoimmune hepatitis Diseases 0.000 description 2
- 208000031628 Autosomal dominant spastic paraplegia type 3 Diseases 0.000 description 2
- 230000003844 B-cell-activation Effects 0.000 description 2
- 208000008035 Back Pain Diseases 0.000 description 2
- KPYSYYIEGFHWSV-UHFFFAOYSA-N Baclofen Chemical compound OC(=O)CC(CN)C1=CC=C(Cl)C=C1 KPYSYYIEGFHWSV-UHFFFAOYSA-N 0.000 description 2
- 235000017166 Bambusa arundinacea Nutrition 0.000 description 2
- 235000017491 Bambusa tulda Nutrition 0.000 description 2
- 241001330002 Bambuseae Species 0.000 description 2
- 208000023328 Basedow disease Diseases 0.000 description 2
- 201000004569 Blindness Diseases 0.000 description 2
- 206010008342 Cervix carcinoma Diseases 0.000 description 2
- 208000000094 Chronic Pain Diseases 0.000 description 2
- 102000004127 Cytokines Human genes 0.000 description 2
- 108090000695 Cytokines Proteins 0.000 description 2
- XUIIKFGFIJCVMT-GFCCVEGCSA-N D-thyroxine Chemical compound IC1=CC(C[C@@H](N)C(O)=O)=CC(I)=C1OC1=CC(I)=C(O)C(I)=C1 XUIIKFGFIJCVMT-GFCCVEGCSA-N 0.000 description 2
- 230000004544 DNA amplification Effects 0.000 description 2
- 208000019505 Deglutition disease Diseases 0.000 description 2
- 206010012438 Dermatitis atopic Diseases 0.000 description 2
- 229910052688 Gadolinium Inorganic materials 0.000 description 2
- 208000034826 Genetic Predisposition to Disease Diseases 0.000 description 2
- 208000015023 Graves' disease Diseases 0.000 description 2
- HEFNNWSXXWATRW-UHFFFAOYSA-N Ibuprofen Chemical compound CC(C)CC1=CC=C(C(C)C(O)=O)C=C1 HEFNNWSXXWATRW-UHFFFAOYSA-N 0.000 description 2
- 108010005716 Interferon beta-1a Proteins 0.000 description 2
- 108010002352 Interleukin-1 Proteins 0.000 description 2
- 102000000589 Interleukin-1 Human genes 0.000 description 2
- 102000051628 Interleukin-1 receptor antagonist Human genes 0.000 description 2
- 108700021006 Interleukin-1 receptor antagonist Proteins 0.000 description 2
- 102000004889 Interleukin-6 Human genes 0.000 description 2
- 108090001005 Interleukin-6 Proteins 0.000 description 2
- 208000005777 Lupus Nephritis Diseases 0.000 description 2
- 241001465754 Metazoa Species 0.000 description 2
- 208000003250 Mixed connective tissue disease Diseases 0.000 description 2
- 208000010428 Muscle Weakness Diseases 0.000 description 2
- 206010028372 Muscular weakness Diseases 0.000 description 2
- 208000000112 Myalgia Diseases 0.000 description 2
- 208000028389 Nerve injury Diseases 0.000 description 2
- 102100030569 Nuclear receptor corepressor 2 Human genes 0.000 description 2
- 101710153660 Nuclear receptor corepressor 2 Proteins 0.000 description 2
- 238000012408 PCR amplification Methods 0.000 description 2
- 206010034277 Pemphigoid Diseases 0.000 description 2
- 208000031845 Pernicious anaemia Diseases 0.000 description 2
- 201000007100 Pharyngitis Diseases 0.000 description 2
- 235000015334 Phyllostachys viridis Nutrition 0.000 description 2
- 206010035664 Pneumonia Diseases 0.000 description 2
- 208000003251 Pruritus Diseases 0.000 description 2
- 206010068513 Pulmonary renal syndrome Diseases 0.000 description 2
- 206010037660 Pyrexia Diseases 0.000 description 2
- 108020004682 Single-Stranded DNA Proteins 0.000 description 2
- 208000005392 Spasm Diseases 0.000 description 2
- 102000011923 Thyrotropin Human genes 0.000 description 2
- 108010061174 Thyrotropin Proteins 0.000 description 2
- 206010044565 Tremor Diseases 0.000 description 2
- 208000006105 Uterine Cervical Neoplasms Diseases 0.000 description 2
- 206010047115 Vasculitis Diseases 0.000 description 2
- 206010047700 Vomiting Diseases 0.000 description 2
- JLCPHMBAVCMARE-UHFFFAOYSA-N [3-[[3-[[3-[[3-[[3-[[3-[[3-[[3-[[3-[[3-[[3-[[5-(2-amino-6-oxo-1H-purin-9-yl)-3-[[3-[[3-[[3-[[3-[[3-[[5-(2-amino-6-oxo-1H-purin-9-yl)-3-[[5-(2-amino-6-oxo-1H-purin-9-yl)-3-hydroxyoxolan-2-yl]methoxy-hydroxyphosphoryl]oxyoxolan-2-yl]methoxy-hydroxyphosphoryl]oxy-5-(5-methyl-2,4-dioxopyrimidin-1-yl)oxolan-2-yl]methoxy-hydroxyphosphoryl]oxy-5-(6-aminopurin-9-yl)oxolan-2-yl]methoxy-hydroxyphosphoryl]oxy-5-(6-aminopurin-9-yl)oxolan-2-yl]methoxy-hydroxyphosphoryl]oxy-5-(6-aminopurin-9-yl)oxolan-2-yl]methoxy-hydroxyphosphoryl]oxy-5-(6-aminopurin-9-yl)oxolan-2-yl]methoxy-hydroxyphosphoryl]oxyoxolan-2-yl]methoxy-hydroxyphosphoryl]oxy-5-(5-methyl-2,4-dioxopyrimidin-1-yl)oxolan-2-yl]methoxy-hydroxyphosphoryl]oxy-5-(4-amino-2-oxopyrimidin-1-yl)oxolan-2-yl]methoxy-hydroxyphosphoryl]oxy-5-(5-methyl-2,4-dioxopyrimidin-1-yl)oxolan-2-yl]methoxy-hydroxyphosphoryl]oxy-5-(5-methyl-2,4-dioxopyrimidin-1-yl)oxolan-2-yl]methoxy-hydroxyphosphoryl]oxy-5-(6-aminopurin-9-yl)oxolan-2-yl]methoxy-hydroxyphosphoryl]oxy-5-(6-aminopurin-9-yl)oxolan-2-yl]methoxy-hydroxyphosphoryl]oxy-5-(4-amino-2-oxopyrimidin-1-yl)oxolan-2-yl]methoxy-hydroxyphosphoryl]oxy-5-(4-amino-2-oxopyrimidin-1-yl)oxolan-2-yl]methoxy-hydroxyphosphoryl]oxy-5-(4-amino-2-oxopyrimidin-1-yl)oxolan-2-yl]methoxy-hydroxyphosphoryl]oxy-5-(6-aminopurin-9-yl)oxolan-2-yl]methoxy-hydroxyphosphoryl]oxy-5-(4-amino-2-oxopyrimidin-1-yl)oxolan-2-yl]methyl [5-(6-aminopurin-9-yl)-2-(hydroxymethyl)oxolan-3-yl] hydrogen phosphate Polymers Cc1cn(C2CC(OP(O)(=O)OCC3OC(CC3OP(O)(=O)OCC3OC(CC3O)n3cnc4c3nc(N)[nH]c4=O)n3cnc4c3nc(N)[nH]c4=O)C(COP(O)(=O)OC3CC(OC3COP(O)(=O)OC3CC(OC3COP(O)(=O)OC3CC(OC3COP(O)(=O)OC3CC(OC3COP(O)(=O)OC3CC(OC3COP(O)(=O)OC3CC(OC3COP(O)(=O)OC3CC(OC3COP(O)(=O)OC3CC(OC3COP(O)(=O)OC3CC(OC3COP(O)(=O)OC3CC(OC3COP(O)(=O)OC3CC(OC3COP(O)(=O)OC3CC(OC3COP(O)(=O)OC3CC(OC3COP(O)(=O)OC3CC(OC3COP(O)(=O)OC3CC(OC3COP(O)(=O)OC3CC(OC3COP(O)(=O)OC3CC(OC3CO)n3cnc4c(N)ncnc34)n3ccc(N)nc3=O)n3cnc4c(N)ncnc34)n3ccc(N)nc3=O)n3ccc(N)nc3=O)n3ccc(N)nc3=O)n3cnc4c(N)ncnc34)n3cnc4c(N)ncnc34)n3cc(C)c(=O)[nH]c3=O)n3cc(C)c(=O)[nH]c3=O)n3ccc(N)nc3=O)n3cc(C)c(=O)[nH]c3=O)n3cnc4c3nc(N)[nH]c4=O)n3cnc4c(N)ncnc34)n3cnc4c(N)ncnc34)n3cnc4c(N)ncnc34)n3cnc4c(N)ncnc34)O2)c(=O)[nH]c1=O JLCPHMBAVCMARE-UHFFFAOYSA-N 0.000 description 2
- PNNCWTXUWKENPE-UHFFFAOYSA-N [N].NC(N)=O Chemical compound [N].NC(N)=O PNNCWTXUWKENPE-UHFFFAOYSA-N 0.000 description 2
- 230000002159 abnormal effect Effects 0.000 description 2
- 229960001138 acetylsalicylic acid Drugs 0.000 description 2
- 229960002964 adalimumab Drugs 0.000 description 2
- 230000033289 adaptive immune response Effects 0.000 description 2
- 230000009824 affinity maturation Effects 0.000 description 2
- 208000030961 allergic reaction Diseases 0.000 description 2
- 239000002333 angiotensin II receptor antagonist Substances 0.000 description 2
- 229940125364 angiotensin receptor blocker Drugs 0.000 description 2
- 229940121363 anti-inflammatory agent Drugs 0.000 description 2
- 208000010216 atopic IgE responsiveness Diseases 0.000 description 2
- 201000008937 atopic dermatitis Diseases 0.000 description 2
- 239000011425 bamboo Substances 0.000 description 2
- 210000003651 basophil Anatomy 0.000 description 2
- 230000009286 beneficial effect Effects 0.000 description 2
- 208000002352 blister Diseases 0.000 description 2
- 230000036765 blood level Effects 0.000 description 2
- 230000036772 blood pressure Effects 0.000 description 2
- 210000000988 bone and bone Anatomy 0.000 description 2
- 230000006931 brain damage Effects 0.000 description 2
- 231100000874 brain damage Toxicity 0.000 description 2
- 208000029028 brain injury Diseases 0.000 description 2
- 238000004364 calculation method Methods 0.000 description 2
- 208000011235 central nervous system lupus Diseases 0.000 description 2
- 210000002939 cerumen Anatomy 0.000 description 2
- 201000010881 cervical cancer Diseases 0.000 description 2
- 210000000038 chest Anatomy 0.000 description 2
- HVYWMOMLDIMFJA-DPAQBDIFSA-N cholesterol Chemical compound C1C=C2C[C@@H](O)CC[C@]2(C)[C@@H]2[C@@H]1[C@@H]1CC[C@H]([C@H](C)CCCC(C)C)[C@@]1(C)CC2 HVYWMOMLDIMFJA-DPAQBDIFSA-N 0.000 description 2
- 201000009151 chronic rhinitis Diseases 0.000 description 2
- 210000001072 colon Anatomy 0.000 description 2
- 229940038717 copaxone Drugs 0.000 description 2
- 229960001334 corticosteroids Drugs 0.000 description 2
- 210000001151 cytotoxic T lymphocyte Anatomy 0.000 description 2
- 230000002498 deadly effect Effects 0.000 description 2
- 206010061428 decreased appetite Diseases 0.000 description 2
- 230000006735 deficit Effects 0.000 description 2
- 230000001419 dependent effect Effects 0.000 description 2
- 238000007847 digital PCR Methods 0.000 description 2
- 208000037771 disease arising from reactivation of latent virus Diseases 0.000 description 2
- 239000000975 dye Substances 0.000 description 2
- 230000008030 elimination Effects 0.000 description 2
- 238000003379 elimination reaction Methods 0.000 description 2
- 230000007613 environmental effect Effects 0.000 description 2
- 229960000403 etanercept Drugs 0.000 description 2
- 230000005669 field effect Effects 0.000 description 2
- 235000013305 food Nutrition 0.000 description 2
- 238000007672 fourth generation sequencing Methods 0.000 description 2
- UIWYJDYFSGRHKR-UHFFFAOYSA-N gadolinium atom Chemical compound [Gd] UIWYJDYFSGRHKR-UHFFFAOYSA-N 0.000 description 2
- 239000000499 gel Substances 0.000 description 2
- 239000011521 glass Substances 0.000 description 2
- 150000002344 gold compounds Chemical class 0.000 description 2
- 210000002443 helper t lymphocyte Anatomy 0.000 description 2
- 230000002489 hematologic effect Effects 0.000 description 2
- 201000007474 hereditary spastic paraplegia 3A Diseases 0.000 description 2
- 238000004128 high performance liquid chromatography Methods 0.000 description 2
- 230000036039 immunity Effects 0.000 description 2
- 230000002998 immunogenetic effect Effects 0.000 description 2
- 239000002955 immunomodulating agent Substances 0.000 description 2
- 229940121354 immunomodulator Drugs 0.000 description 2
- 229940125721 immunosuppressive agent Drugs 0.000 description 2
- 229940073062 imuran Drugs 0.000 description 2
- CGIGDMFJXJATDK-UHFFFAOYSA-N indomethacin Chemical compound CC1=C(CC(O)=O)C2=CC(OC)=CC=C2N1C(=O)C1=CC=C(Cl)C=C1 CGIGDMFJXJATDK-UHFFFAOYSA-N 0.000 description 2
- 230000001939 inductive effect Effects 0.000 description 2
- 230000006749 inflammatory damage Effects 0.000 description 2
- 229960000598 infliximab Drugs 0.000 description 2
- 230000015788 innate immune response Effects 0.000 description 2
- 210000005007 innate immune system Anatomy 0.000 description 2
- 230000010354 integration Effects 0.000 description 2
- 229940100601 interleukin-6 Drugs 0.000 description 2
- 238000007852 inverse PCR Methods 0.000 description 2
- 238000002955 isolation Methods 0.000 description 2
- 229960000681 leflunomide Drugs 0.000 description 2
- VHOGYURTWQBHIL-UHFFFAOYSA-N leflunomide Chemical compound O1N=CC(C(=O)NC=2C=CC(=CC=2)C(F)(F)F)=C1C VHOGYURTWQBHIL-UHFFFAOYSA-N 0.000 description 2
- 231100000518 lethal Toxicity 0.000 description 2
- 230000001665 lethal effect Effects 0.000 description 2
- 208000032839 leukemia Diseases 0.000 description 2
- 238000010234 longitudinal analysis Methods 0.000 description 2
- 235000019689 luncheon sausage Nutrition 0.000 description 2
- 210000002540 macrophage Anatomy 0.000 description 2
- 238000002826 magnetic-activated cell sorting Methods 0.000 description 2
- 230000036210 malignancy Effects 0.000 description 2
- 238000002844 melting Methods 0.000 description 2
- 230000008018 melting Effects 0.000 description 2
- 230000001394 metastastic effect Effects 0.000 description 2
- 229960004584 methylprednisolone Drugs 0.000 description 2
- 206010063344 microscopic polyangiitis Diseases 0.000 description 2
- 230000003278 mimic effect Effects 0.000 description 2
- DYKFCLLONBREIL-KVUCHLLUSA-N minocycline Chemical compound C([C@H]1C2)C3=C(N(C)C)C=CC(O)=C3C(=O)C1=C(O)[C@@]1(O)[C@@H]2[C@H](N(C)C)C(O)=C(C(N)=O)C1=O DYKFCLLONBREIL-KVUCHLLUSA-N 0.000 description 2
- 229960004023 minocycline Drugs 0.000 description 2
- KKZJGLLVHKMTCM-UHFFFAOYSA-N mitoxantrone Chemical compound O=C1C2=C(O)C=CC(O)=C2C(=O)C2=C1C(NCCNCCO)=CC=C2NCCNCCO KKZJGLLVHKMTCM-UHFFFAOYSA-N 0.000 description 2
- 239000000203 mixture Substances 0.000 description 2
- 238000010172 mouse model Methods 0.000 description 2
- 210000000822 natural killer cell Anatomy 0.000 description 2
- 230000008764 nerve damage Effects 0.000 description 2
- 210000000440 neutrophil Anatomy 0.000 description 2
- 230000005257 nucleotidylation Effects 0.000 description 2
- 231100000862 numbness Toxicity 0.000 description 2
- 229960005489 paracetamol Drugs 0.000 description 2
- 230000036961 partial effect Effects 0.000 description 2
- 230000007170 pathology Effects 0.000 description 2
- 210000004197 pelvis Anatomy 0.000 description 2
- 210000005259 peripheral blood Anatomy 0.000 description 2
- 239000011886 peripheral blood Substances 0.000 description 2
- 210000002381 plasma Anatomy 0.000 description 2
- 238000012123 point-of-care testing Methods 0.000 description 2
- 102000054765 polymorphisms of proteins Human genes 0.000 description 2
- 230000003389 potentiating effect Effects 0.000 description 2
- 210000004909 pre-ejaculatory fluid Anatomy 0.000 description 2
- 238000004321 preservation Methods 0.000 description 2
- 230000000750 progressive effect Effects 0.000 description 2
- 201000001474 proteinuria Diseases 0.000 description 2
- 230000005855 radiation Effects 0.000 description 2
- 108020003175 receptors Proteins 0.000 description 2
- 102000005962 receptors Human genes 0.000 description 2
- 238000002271 resection Methods 0.000 description 2
- 238000010839 reverse transcription Methods 0.000 description 2
- 206010039083 rhinitis Diseases 0.000 description 2
- 210000003131 sacroiliac joint Anatomy 0.000 description 2
- 238000005070 sampling Methods 0.000 description 2
- 230000028327 secretion Effects 0.000 description 2
- 238000011451 sequencing strategy Methods 0.000 description 2
- 231100000046 skin rash Toxicity 0.000 description 2
- 239000007790 solid phase Substances 0.000 description 2
- 238000010561 standard procedure Methods 0.000 description 2
- 238000001356 surgical procedure Methods 0.000 description 2
- 208000011580 syndromic disease Diseases 0.000 description 2
- 201000004595 synovitis Diseases 0.000 description 2
- XFYDIVBRZNQMJC-UHFFFAOYSA-N tizanidine Chemical compound ClC=1C=CC2=NSN=C2C=1NC1=NCCN1 XFYDIVBRZNQMJC-UHFFFAOYSA-N 0.000 description 2
- 230000001988 toxicity Effects 0.000 description 2
- 231100000419 toxicity Toxicity 0.000 description 2
- 230000003612 virological effect Effects 0.000 description 2
- XLYOFNOQVPJJNP-UHFFFAOYSA-N water Substances O XLYOFNOQVPJJNP-UHFFFAOYSA-N 0.000 description 2
- MZOFCQQQCNRIBI-VMXHOPILSA-N (3s)-4-[[(2s)-1-[[(2s)-1-[[(1s)-1-carboxy-2-hydroxyethyl]amino]-4-methyl-1-oxopentan-2-yl]amino]-5-(diaminomethylideneamino)-1-oxopentan-2-yl]amino]-3-[[2-[[(2s)-2,6-diaminohexanoyl]amino]acetyl]amino]-4-oxobutanoic acid Chemical compound OC[C@@H](C(O)=O)NC(=O)[C@H](CC(C)C)NC(=O)[C@H](CCCN=C(N)N)NC(=O)[C@H](CC(O)=O)NC(=O)CNC(=O)[C@@H](N)CCCCN MZOFCQQQCNRIBI-VMXHOPILSA-N 0.000 description 1
- PRPINYUDVPFIRX-UHFFFAOYSA-N 1-naphthaleneacetic acid Chemical compound C1=CC=C2C(CC(=O)O)=CC=CC2=C1 PRPINYUDVPFIRX-UHFFFAOYSA-N 0.000 description 1
- SVUOLADPCWQTTE-UHFFFAOYSA-N 1h-1,2-benzodiazepine Chemical compound N1N=CC=CC2=CC=CC=C12 SVUOLADPCWQTTE-UHFFFAOYSA-N 0.000 description 1
- 101710179738 6,7-dimethyl-8-ribityllumazine synthase 1 Proteins 0.000 description 1
- 239000005541 ACE inhibitor Substances 0.000 description 1
- 208000004998 Abdominal Pain Diseases 0.000 description 1
- 208000000187 Abnormal Reflex Diseases 0.000 description 1
- 206010000171 Abnormal reflexes Diseases 0.000 description 1
- 208000026872 Addison Disease Diseases 0.000 description 1
- 206010067484 Adverse reaction Diseases 0.000 description 1
- 208000035285 Allergic Seasonal Rhinitis Diseases 0.000 description 1
- 201000004384 Alopecia Diseases 0.000 description 1
- 208000024827 Alzheimer disease Diseases 0.000 description 1
- 206010001935 American trypanosomiasis Diseases 0.000 description 1
- 208000003343 Antiphospholipid Syndrome Diseases 0.000 description 1
- 206010002921 Aortitis Diseases 0.000 description 1
- 239000005552 B01AC04 - Clopidogrel Substances 0.000 description 1
- 208000035143 Bacterial infection Diseases 0.000 description 1
- 208000027496 Behcet disease Diseases 0.000 description 1
- 206010051779 Bone marrow toxicity Diseases 0.000 description 1
- 206010006187 Breast cancer Diseases 0.000 description 1
- 208000026310 Breast neoplasm Diseases 0.000 description 1
- 206010067982 Butterfly rash Diseases 0.000 description 1
- 206010051290 Central nervous system lesion Diseases 0.000 description 1
- 206010050337 Cerumen impaction Diseases 0.000 description 1
- 208000024699 Chagas disease Diseases 0.000 description 1
- 208000006545 Chronic Obstructive Pulmonary Disease Diseases 0.000 description 1
- 206010009192 Circulatory collapse Diseases 0.000 description 1
- 241000193163 Clostridioides difficile Species 0.000 description 1
- 108010028780 Complement C3 Proteins 0.000 description 1
- 102000016918 Complement C3 Human genes 0.000 description 1
- 206010010741 Conjunctivitis Diseases 0.000 description 1
- 206010010774 Constipation Diseases 0.000 description 1
- 206010010904 Convulsion Diseases 0.000 description 1
- 206010011655 Cushingoid Diseases 0.000 description 1
- IGXWBGJHJZYPQS-SSDOTTSWSA-N D-Luciferin Chemical compound OC(=O)[C@H]1CSC(C=2SC3=CC=C(O)C=C3N=2)=N1 IGXWBGJHJZYPQS-SSDOTTSWSA-N 0.000 description 1
- 206010011878 Deafness Diseases 0.000 description 1
- CYCGRDQQIOGCKX-UHFFFAOYSA-N Dehydro-luciferin Natural products OC(=O)C1=CSC(C=2SC3=CC(O)=CC=C3N=2)=N1 CYCGRDQQIOGCKX-UHFFFAOYSA-N 0.000 description 1
- 208000016192 Demyelinating disease Diseases 0.000 description 1
- 201000004624 Dermatitis Diseases 0.000 description 1
- 206010012434 Dermatitis allergic Diseases 0.000 description 1
- 206010012442 Dermatitis contact Diseases 0.000 description 1
- 208000003164 Diplopia Diseases 0.000 description 1
- 229940097420 Diuretic Drugs 0.000 description 1
- 208000000059 Dyspnea Diseases 0.000 description 1
- 206010013975 Dyspnoeas Diseases 0.000 description 1
- 102100025137 Early activation antigen CD69 Human genes 0.000 description 1
- 206010015150 Erythema Diseases 0.000 description 1
- 206010015958 Eye pain Diseases 0.000 description 1
- 206010016059 Facial pain Diseases 0.000 description 1
- 102000008857 Ferritin Human genes 0.000 description 1
- 108050000784 Ferritin Proteins 0.000 description 1
- 238000008416 Ferritin Methods 0.000 description 1
- BJGNCJDXODQBOB-UHFFFAOYSA-N Fivefly Luciferin Natural products OC(=O)C1CSC(C=2SC3=CC(O)=CC=C3N=2)=N1 BJGNCJDXODQBOB-UHFFFAOYSA-N 0.000 description 1
- 238000012413 Fluorescence activated cell sorting analysis Methods 0.000 description 1
- WSFSSNUMVMOOMR-UHFFFAOYSA-N Formaldehyde Chemical compound O=C WSFSSNUMVMOOMR-UHFFFAOYSA-N 0.000 description 1
- 206010017533 Fungal infection Diseases 0.000 description 1
- 206010017577 Gait disturbance Diseases 0.000 description 1
- 206010018378 Glomerulonephritis rapidly progressive Diseases 0.000 description 1
- 108010068370 Glutens Proteins 0.000 description 1
- 206010018498 Goitre Diseases 0.000 description 1
- 208000024869 Goodpasture syndrome Diseases 0.000 description 1
- 206010072579 Granulomatosis with polyangiitis Diseases 0.000 description 1
- 208000035895 Guillain-Barré syndrome Diseases 0.000 description 1
- 208000030836 Hashimoto thyroiditis Diseases 0.000 description 1
- 208000018565 Hemochromatosis Diseases 0.000 description 1
- 102000001554 Hemoglobins Human genes 0.000 description 1
- 108010054147 Hemoglobins Proteins 0.000 description 1
- 208000035186 Hemolytic Autoimmune Anemia Diseases 0.000 description 1
- 241000700721 Hepatitis B virus Species 0.000 description 1
- 208000005176 Hepatitis C Diseases 0.000 description 1
- 206010019842 Hepatomegaly Diseases 0.000 description 1
- 101000934374 Homo sapiens Early activation antigen CD69 Proteins 0.000 description 1
- 241000341655 Human papillomavirus type 16 Species 0.000 description 1
- 208000008454 Hyperhidrosis Diseases 0.000 description 1
- 208000004044 Hypesthesia Diseases 0.000 description 1
- 206010021245 Idiopathic thrombocytopenic purpura Diseases 0.000 description 1
- 208000001718 Immediate Hypersensitivity Diseases 0.000 description 1
- 102000006496 Immunoglobulin Heavy Chains Human genes 0.000 description 1
- 108010019476 Immunoglobulin Heavy Chains Proteins 0.000 description 1
- 102000013463 Immunoglobulin Light Chains Human genes 0.000 description 1
- 108010065825 Immunoglobulin Light Chains Proteins 0.000 description 1
- 238000012404 In vitro experiment Methods 0.000 description 1
- 206010021639 Incontinence Diseases 0.000 description 1
- 206010062717 Increased upper airway secretion Diseases 0.000 description 1
- 108010050904 Interferons Proteins 0.000 description 1
- 102000014150 Interferons Human genes 0.000 description 1
- 108010002350 Interleukin-2 Proteins 0.000 description 1
- 208000005615 Interstitial Cystitis Diseases 0.000 description 1
- 206010022941 Iridocyclitis Diseases 0.000 description 1
- 208000000209 Isaacs syndrome Diseases 0.000 description 1
- 206010023126 Jaundice Diseases 0.000 description 1
- 206010023198 Joint ankylosis Diseases 0.000 description 1
- 206010023230 Joint stiffness Diseases 0.000 description 1
- 206010059176 Juvenile idiopathic arthritis Diseases 0.000 description 1
- 238000008214 LDL Cholesterol Methods 0.000 description 1
- 108010063045 Lactoferrin Proteins 0.000 description 1
- 102100032241 Lactotransferrin Human genes 0.000 description 1
- 102000001109 Leukocyte L1 Antigen Complex Human genes 0.000 description 1
- 108010069316 Leukocyte L1 Antigen Complex Proteins 0.000 description 1
- NNJVILVZKWQKPM-UHFFFAOYSA-N Lidocaine Chemical compound CCN(CC)CC(=O)NC1=C(C)C=CC=C1C NNJVILVZKWQKPM-UHFFFAOYSA-N 0.000 description 1
- 102000003960 Ligases Human genes 0.000 description 1
- 108090000364 Ligases Proteins 0.000 description 1
- 101710186608 Lipoyl synthase 1 Proteins 0.000 description 1
- 101710137584 Lipoyl synthase 1, chloroplastic Proteins 0.000 description 1
- 101710090391 Lipoyl synthase 1, mitochondrial Proteins 0.000 description 1
- 108060001084 Luciferase Proteins 0.000 description 1
- 239000005089 Luciferase Substances 0.000 description 1
- DDWFXDSYGUXRAY-UHFFFAOYSA-N Luciferin Natural products CCc1c(C)c(CC2NC(=O)C(=C2C=C)C)[nH]c1Cc3[nH]c4C(=C5/NC(CC(=O)O)C(C)C5CC(=O)O)CC(=O)c4c3C DDWFXDSYGUXRAY-UHFFFAOYSA-N 0.000 description 1
- 206010025323 Lymphomas Diseases 0.000 description 1
- 208000030289 Lymphoproliferative disease Diseases 0.000 description 1
- 102000043131 MHC class II family Human genes 0.000 description 1
- 108091054438 MHC class II family Proteins 0.000 description 1
- 241000124008 Mammalia Species 0.000 description 1
- 102000018697 Membrane Proteins Human genes 0.000 description 1
- 108010052285 Membrane Proteins Proteins 0.000 description 1
- RJQXTJLFIWVMTO-TYNCELHUSA-N Methicillin Chemical compound COC1=CC=CC(OC)=C1C(=O)N[C@@H]1C(=O)N2[C@@H](C(O)=O)C(C)(C)S[C@@H]21 RJQXTJLFIWVMTO-TYNCELHUSA-N 0.000 description 1
- 108060004795 Methyltransferase Proteins 0.000 description 1
- 108700011259 MicroRNAs Proteins 0.000 description 1
- 206010049567 Miller Fisher syndrome Diseases 0.000 description 1
- 108020005196 Mitochondrial DNA Proteins 0.000 description 1
- 208000008238 Muscle Spasticity Diseases 0.000 description 1
- 208000031888 Mycoses Diseases 0.000 description 1
- 102000006386 Myelin Proteins Human genes 0.000 description 1
- 108010083674 Myelin Proteins Proteins 0.000 description 1
- CMWTZPSULFXXJA-UHFFFAOYSA-N Naproxen Natural products C1=C(C(C)C(O)=O)C=CC2=CC(OC)=CC=C21 CMWTZPSULFXXJA-UHFFFAOYSA-N 0.000 description 1
- 206010029164 Nephrotic syndrome Diseases 0.000 description 1
- 208000012902 Nervous system disease Diseases 0.000 description 1
- 206010029216 Nervousness Diseases 0.000 description 1
- 208000011644 Neurologic Gait disease Diseases 0.000 description 1
- 206010072359 Neuromyotonia Diseases 0.000 description 1
- 206010029803 Nosocomial infection Diseases 0.000 description 1
- 108020004711 Nucleic Acid Probes Proteins 0.000 description 1
- 206010061137 Ocular toxicity Diseases 0.000 description 1
- 208000006187 Onycholysis Diseases 0.000 description 1
- 206010031009 Oral pain Diseases 0.000 description 1
- 206010053159 Organ failure Diseases 0.000 description 1
- 206010068319 Oropharyngeal pain Diseases 0.000 description 1
- 208000001132 Osteoporosis Diseases 0.000 description 1
- 206010033546 Pallor Diseases 0.000 description 1
- 206010033661 Pancytopenia Diseases 0.000 description 1
- 208000031816 Pathologic Dilatation Diseases 0.000 description 1
- 208000037273 Pathologic Processes Diseases 0.000 description 1
- 201000011152 Pemphigus Diseases 0.000 description 1
- 241000721454 Pemphigus Species 0.000 description 1
- 206010057249 Phagocytosis Diseases 0.000 description 1
- 206010034960 Photophobia Diseases 0.000 description 1
- ZYFVNVRFVHJEIU-UHFFFAOYSA-N PicoGreen Chemical compound CN(C)CCCN(CCCN(C)C)C1=CC(=CC2=[N+](C3=CC=CC=C3S2)C)C2=CC=CC=C2N1C1=CC=CC=C1 ZYFVNVRFVHJEIU-UHFFFAOYSA-N 0.000 description 1
- 206010035742 Pneumonitis Diseases 0.000 description 1
- 238000011529 RT qPCR Methods 0.000 description 1
- 208000035415 Reinfection Diseases 0.000 description 1
- 241000219061 Rheum Species 0.000 description 1
- 206010039361 Sacroiliitis Diseases 0.000 description 1
- 208000019802 Sexually transmitted disease Diseases 0.000 description 1
- 208000032023 Signs and Symptoms Diseases 0.000 description 1
- 206010040943 Skin Ulcer Diseases 0.000 description 1
- 206010040867 Skin hypertrophy Diseases 0.000 description 1
- 206010041519 Spider naevus Diseases 0.000 description 1
- 208000007156 Spondylarthritis Diseases 0.000 description 1
- 241000191967 Staphylococcus aureus Species 0.000 description 1
- 108010090804 Streptavidin Proteins 0.000 description 1
- 102000004523 Sulfate Adenylyltransferase Human genes 0.000 description 1
- 108010022348 Sulfate adenylyltransferase Proteins 0.000 description 1
- 208000033809 Suppuration Diseases 0.000 description 1
- 201000009594 Systemic Scleroderma Diseases 0.000 description 1
- 206010042953 Systemic sclerosis Diseases 0.000 description 1
- 230000006044 T cell activation Effects 0.000 description 1
- 230000020385 T cell costimulation Effects 0.000 description 1
- 101150002618 TCRP gene Proteins 0.000 description 1
- 208000001871 Tachycardia Diseases 0.000 description 1
- QJJXYPPXXYFBGM-LFZNUXCKSA-N Tacrolimus Chemical compound C1C[C@@H](O)[C@H](OC)C[C@@H]1\C=C(/C)[C@@H]1[C@H](C)[C@@H](O)CC(=O)[C@H](CC=C)/C=C(C)/C[C@H](C)C[C@H](OC)[C@H]([C@H](C[C@H]2C)OC)O[C@@]2(O)C(=O)C(=O)N2CCCC[C@H]2C(=O)O1 QJJXYPPXXYFBGM-LFZNUXCKSA-N 0.000 description 1
- 208000031981 Thrombocytopenic Idiopathic Purpura Diseases 0.000 description 1
- AUYYCJSJGJYCDS-LBPRGKRZSA-N Thyrolar Chemical compound IC1=CC(C[C@H](N)C(O)=O)=CC(I)=C1OC1=CC=C(O)C(I)=C1 AUYYCJSJGJYCDS-LBPRGKRZSA-N 0.000 description 1
- 206010044245 Toxic optic neuropathy Diseases 0.000 description 1
- 241000159243 Toxicodendron radicans Species 0.000 description 1
- 241000209140 Triticum Species 0.000 description 1
- 235000021307 Triticum Nutrition 0.000 description 1
- 241000223109 Trypanosoma cruzi Species 0.000 description 1
- 102100040247 Tumor necrosis factor Human genes 0.000 description 1
- 206010045240 Type I hypersensitivity Diseases 0.000 description 1
- 208000025865 Ulcer Diseases 0.000 description 1
- 208000024780 Urticaria Diseases 0.000 description 1
- 206010046851 Uveitis Diseases 0.000 description 1
- 102000013127 Vimentin Human genes 0.000 description 1
- 108010065472 Vimentin Proteins 0.000 description 1
- 206010047571 Visual impairment Diseases 0.000 description 1
- 208000034699 Vitreous floaters Diseases 0.000 description 1
- 229960003697 abatacept Drugs 0.000 description 1
- 210000001015 abdomen Anatomy 0.000 description 1
- 206010000059 abdominal discomfort Diseases 0.000 description 1
- 238000010521 absorption reaction Methods 0.000 description 1
- FHEAIOHRHQGZPC-KIWGSFCNSA-N acetic acid;(2s)-2-amino-3-(4-hydroxyphenyl)propanoic acid;(2s)-2-aminopentanedioic acid;(2s)-2-aminopropanoic acid;(2s)-2,6-diaminohexanoic acid Chemical compound CC(O)=O.C[C@H](N)C(O)=O.NCCCC[C@H](N)C(O)=O.OC(=O)[C@@H](N)CCC(O)=O.OC(=O)[C@@H](N)CC1=CC=C(O)C=C1 FHEAIOHRHQGZPC-KIWGSFCNSA-N 0.000 description 1
- 239000002253 acid Substances 0.000 description 1
- 229940119059 actemra Drugs 0.000 description 1
- 208000024716 acute asthma Diseases 0.000 description 1
- 208000002552 acute disseminated encephalomyelitis Diseases 0.000 description 1
- 208000005652 acute fatty liver of pregnancy Diseases 0.000 description 1
- 238000011374 additional therapy Methods 0.000 description 1
- IRLPACMLTUPBCL-FCIPNVEPSA-N adenosine-5'-phosphosulfate Chemical compound C1=NC=2C(N)=NC=NC=2N1[C@@H]1O[C@@H](CO[P@](O)(=O)OS(O)(=O)=O)[C@H](O)[C@H]1O IRLPACMLTUPBCL-FCIPNVEPSA-N 0.000 description 1
- 150000003838 adenosines Chemical class 0.000 description 1
- 230000000145 adjuvantlike effect Effects 0.000 description 1
- 230000002411 adverse Effects 0.000 description 1
- 230000006838 adverse reaction Effects 0.000 description 1
- 239000011543 agarose gel Substances 0.000 description 1
- 238000000246 agarose gel electrophoresis Methods 0.000 description 1
- 238000011256 aggressive treatment Methods 0.000 description 1
- 238000007844 allele-specific PCR Methods 0.000 description 1
- 230000000961 alloantigen Effects 0.000 description 1
- 239000002160 alpha blocker Substances 0.000 description 1
- 229940124308 alpha-adrenoreceptor antagonist Drugs 0.000 description 1
- DKNWSYNQZKUICI-UHFFFAOYSA-N amantadine Chemical compound C1C(C2)CC3CC2CC1(N)C3 DKNWSYNQZKUICI-UHFFFAOYSA-N 0.000 description 1
- 229960003805 amantadine Drugs 0.000 description 1
- 210000004381 amniotic fluid Anatomy 0.000 description 1
- 229960004238 anakinra Drugs 0.000 description 1
- 230000036592 analgesia Effects 0.000 description 1
- 229940044094 angiotensin-converting-enzyme inhibitor Drugs 0.000 description 1
- 208000022531 anorexia Diseases 0.000 description 1
- 239000005557 antagonist Substances 0.000 description 1
- 201000004612 anterior uveitis Diseases 0.000 description 1
- 239000003242 anti bacterial agent Substances 0.000 description 1
- 230000001760 anti-analgesic effect Effects 0.000 description 1
- 230000003110 anti-inflammatory effect Effects 0.000 description 1
- 229940088710 antibiotic agent Drugs 0.000 description 1
- 239000000935 antidepressant agent Substances 0.000 description 1
- 229940005513 antidepressants Drugs 0.000 description 1
- 230000030741 antigen processing and presentation Effects 0.000 description 1
- 210000000612 antigen-presenting cell Anatomy 0.000 description 1
- 230000000890 antigenic effect Effects 0.000 description 1
- 229940125715 antihistaminic agent Drugs 0.000 description 1
- 239000000739 antihistaminic agent Substances 0.000 description 1
- 210000001742 aqueous humor Anatomy 0.000 description 1
- 238000000149 argon plasma sintering Methods 0.000 description 1
- 210000001188 articular cartilage Anatomy 0.000 description 1
- 238000007845 assembly PCR Methods 0.000 description 1
- 238000007846 asymmetric PCR Methods 0.000 description 1
- 208000010668 atopic eczema Diseases 0.000 description 1
- 230000001363 autoimmune Effects 0.000 description 1
- 201000000448 autoimmune hemolytic anemia Diseases 0.000 description 1
- 208000027625 autoimmune inner ear disease Diseases 0.000 description 1
- 201000003710 autoimmune thrombocytopenic purpura Diseases 0.000 description 1
- 229940003504 avonex Drugs 0.000 description 1
- 229960000794 baclofen Drugs 0.000 description 1
- 208000022362 bacterial infectious disease Diseases 0.000 description 1
- 230000004888 barrier function Effects 0.000 description 1
- 230000006399 behavior Effects 0.000 description 1
- 229940049706 benzodiazepine Drugs 0.000 description 1
- 230000002457 bidirectional effect Effects 0.000 description 1
- 230000002146 bilateral effect Effects 0.000 description 1
- 210000000941 bile Anatomy 0.000 description 1
- 239000003124 biologic agent Substances 0.000 description 1
- 239000012472 biological sample Substances 0.000 description 1
- 229960002685 biotin Drugs 0.000 description 1
- 239000011616 biotin Substances 0.000 description 1
- 210000004204 blood vessel Anatomy 0.000 description 1
- 231100000366 bone marrow toxicity Toxicity 0.000 description 1
- 210000005252 bulbus oculi Anatomy 0.000 description 1
- 208000000594 bullous pemphigoid Diseases 0.000 description 1
- 210000001217 buttock Anatomy 0.000 description 1
- 238000010804 cDNA synthesis Methods 0.000 description 1
- 210000000845 cartilage Anatomy 0.000 description 1
- 230000015556 catabolic process Effects 0.000 description 1
- 239000006285 cell suspension Substances 0.000 description 1
- 238000002659 cell therapy Methods 0.000 description 1
- 239000003795 chemical substances by application Substances 0.000 description 1
- 230000001713 cholinergic effect Effects 0.000 description 1
- 208000023819 chronic asthma Diseases 0.000 description 1
- 208000025302 chronic primary adrenal insufficiency Diseases 0.000 description 1
- 231100000749 chronicity Toxicity 0.000 description 1
- 210000001268 chyle Anatomy 0.000 description 1
- 210000004913 chyme Anatomy 0.000 description 1
- 238000003776 cleavage reaction Methods 0.000 description 1
- 238000010367 cloning Methods 0.000 description 1
- GKTWGGQPFAXNFI-HNNXBMFYSA-N clopidogrel Chemical compound C1([C@H](N2CC=3C=CSC=3CC2)C(=O)OC)=CC=CC=C1Cl GKTWGGQPFAXNFI-HNNXBMFYSA-N 0.000 description 1
- 230000024203 complement activation Effects 0.000 description 1
- 210000002808 connective tissue Anatomy 0.000 description 1
- 238000007596 consolidation process Methods 0.000 description 1
- 208000010247 contact dermatitis Diseases 0.000 description 1
- 238000011340 continuous therapy Methods 0.000 description 1
- 229940111134 coxibs Drugs 0.000 description 1
- 201000005637 crescentic glomerulonephritis Diseases 0.000 description 1
- 108010061103 cyclic citrullinated peptide Proteins 0.000 description 1
- 239000003255 cyclooxygenase 2 inhibitor Substances 0.000 description 1
- 229930182912 cyclosporin Natural products 0.000 description 1
- 238000004163 cytometry Methods 0.000 description 1
- 231100000433 cytotoxic Toxicity 0.000 description 1
- 230000001472 cytotoxic effect Effects 0.000 description 1
- 238000007405 data analysis Methods 0.000 description 1
- 239000000850 decongestant Substances 0.000 description 1
- 229940124581 decongestants Drugs 0.000 description 1
- 230000008260 defense mechanism Effects 0.000 description 1
- 238000004925 denaturation Methods 0.000 description 1
- 230000036425 denaturation Effects 0.000 description 1
- 238000000432 density-gradient centrifugation Methods 0.000 description 1
- 230000008021 deposition Effects 0.000 description 1
- 201000001981 dermatomyositis Diseases 0.000 description 1
- 230000001066 destructive effect Effects 0.000 description 1
- 230000006866 deterioration Effects 0.000 description 1
- 206010012601 diabetes mellitus Diseases 0.000 description 1
- 238000007435 diagnostic evaluation Methods 0.000 description 1
- JXSJBGJIGXNWCI-UHFFFAOYSA-N diethyl 2-[(dimethoxyphosphorothioyl)thio]succinate Chemical compound CCOC(=O)CC(SP(=S)(OC)OC)C(=O)OCC JXSJBGJIGXNWCI-UHFFFAOYSA-N 0.000 description 1
- 230000029087 digestion Effects 0.000 description 1
- 239000000539 dimer Substances 0.000 description 1
- NTGLQWGMESPVBV-UHFFFAOYSA-N diproqualone Chemical compound C1=CC=C2C(=O)N(CC(O)CO)C(C)=NC2=C1 NTGLQWGMESPVBV-UHFFFAOYSA-N 0.000 description 1
- 229950003185 diproqualone Drugs 0.000 description 1
- 238000002845 discoloration Methods 0.000 description 1
- 231100000676 disease causative agent Toxicity 0.000 description 1
- 208000035475 disorder Diseases 0.000 description 1
- 239000002934 diuretic Substances 0.000 description 1
- 230000001882 diuretic effect Effects 0.000 description 1
- 208000002173 dizziness Diseases 0.000 description 1
- 208000029444 double vision Diseases 0.000 description 1
- 230000008482 dysregulation Effects 0.000 description 1
- 235000013399 edible fruits Nutrition 0.000 description 1
- 239000012636 effector Substances 0.000 description 1
- 210000003162 effector t lymphocyte Anatomy 0.000 description 1
- 210000001513 elbow Anatomy 0.000 description 1
- 238000001962 electrophoresis Methods 0.000 description 1
- 229940073621 enbrel Drugs 0.000 description 1
- 230000002708 enhancing effect Effects 0.000 description 1
- 230000002255 enzymatic effect Effects 0.000 description 1
- 230000003628 erosive effect Effects 0.000 description 1
- 230000000763 evoking effect Effects 0.000 description 1
- 238000007387 excisional biopsy Methods 0.000 description 1
- 238000013401 experimental design Methods 0.000 description 1
- 210000003722 extracellular fluid Anatomy 0.000 description 1
- 238000000605 extraction Methods 0.000 description 1
- 208000027993 eye symptom Diseases 0.000 description 1
- 210000000887 face Anatomy 0.000 description 1
- 230000002349 favourable effect Effects 0.000 description 1
- 210000003608 fece Anatomy 0.000 description 1
- 210000003754 fetus Anatomy 0.000 description 1
- LIYGYAHYXQDGEP-UHFFFAOYSA-N firefly oxyluciferin Natural products Oc1csc(n1)-c1nc2ccc(O)cc2s1 LIYGYAHYXQDGEP-UHFFFAOYSA-N 0.000 description 1
- 238000000684 flow cytometry Methods 0.000 description 1
- 238000001943 fluorescence-activated cell sorting Methods 0.000 description 1
- 230000003325 follicular Effects 0.000 description 1
- 210000000285 follicular dendritic cell Anatomy 0.000 description 1
- 238000009472 formulation Methods 0.000 description 1
- 238000002695 general anesthesia Methods 0.000 description 1
- 230000009395 genetic defect Effects 0.000 description 1
- 238000010353 genetic engineering Methods 0.000 description 1
- 210000004907 gland Anatomy 0.000 description 1
- 229960003776 glatiramer acetate Drugs 0.000 description 1
- 239000003862 glucocorticoid Substances 0.000 description 1
- 235000021312 gluten Nutrition 0.000 description 1
- 150000004676 glycans Chemical class 0.000 description 1
- 201000003872 goiter Diseases 0.000 description 1
- 150000002343 gold Chemical class 0.000 description 1
- 208000024963 hair loss Diseases 0.000 description 1
- 230000003676 hair loss Effects 0.000 description 1
- 210000003128 head Anatomy 0.000 description 1
- 230000010370 hearing loss Effects 0.000 description 1
- 231100000888 hearing loss Toxicity 0.000 description 1
- 208000016354 hearing loss disease Diseases 0.000 description 1
- 208000019622 heart disease Diseases 0.000 description 1
- 238000005534 hematocrit Methods 0.000 description 1
- 231100000304 hepatotoxicity Toxicity 0.000 description 1
- 239000000833 heterodimer Substances 0.000 description 1
- 208000002557 hidradenitis Diseases 0.000 description 1
- 201000007162 hidradenitis suppurativa Diseases 0.000 description 1
- 238000007849 hot-start PCR Methods 0.000 description 1
- 235000020256 human milk Nutrition 0.000 description 1
- 210000004251 human milk Anatomy 0.000 description 1
- 229940048921 humira Drugs 0.000 description 1
- 201000001421 hyperglycemia Diseases 0.000 description 1
- 208000034783 hypoesthesia Diseases 0.000 description 1
- 229960001680 ibuprofen Drugs 0.000 description 1
- 238000007654 immersion Methods 0.000 description 1
- 230000003100 immobilizing effect Effects 0.000 description 1
- 230000006450 immune cell response Effects 0.000 description 1
- 230000008105 immune reaction Effects 0.000 description 1
- 230000002163 immunogen Effects 0.000 description 1
- 229940072221 immunoglobulins Drugs 0.000 description 1
- 230000001861 immunosuppressant effect Effects 0.000 description 1
- 238000002650 immunosuppressive therapy Methods 0.000 description 1
- 238000007850 in situ PCR Methods 0.000 description 1
- 238000007386 incisional biopsy Methods 0.000 description 1
- 206010021654 increased appetite Diseases 0.000 description 1
- 229960000905 indomethacin Drugs 0.000 description 1
- 208000000509 infertility Diseases 0.000 description 1
- 230000036512 infertility Effects 0.000 description 1
- 231100000535 infertility Toxicity 0.000 description 1
- 210000004969 inflammatory cell Anatomy 0.000 description 1
- 230000004968 inflammatory condition Effects 0.000 description 1
- 208000027866 inflammatory disease Diseases 0.000 description 1
- 239000003112 inhibitor Substances 0.000 description 1
- 230000000977 initiatory effect Effects 0.000 description 1
- 238000003780 insertion Methods 0.000 description 1
- 230000037431 insertion Effects 0.000 description 1
- 229940047124 interferons Drugs 0.000 description 1
- 230000003834 intracellular effect Effects 0.000 description 1
- 210000002977 intracellular fluid Anatomy 0.000 description 1
- 238000012977 invasive surgical procedure Methods 0.000 description 1
- 238000011835 investigation Methods 0.000 description 1
- 150000002500 ions Chemical class 0.000 description 1
- 238000005304 joining Methods 0.000 description 1
- 208000018937 joint inflammation Diseases 0.000 description 1
- 230000000366 juvenile effect Effects 0.000 description 1
- 201000002215 juvenile rheumatoid arthritis Diseases 0.000 description 1
- 208000017169 kidney disease Diseases 0.000 description 1
- 230000002147 killing effect Effects 0.000 description 1
- 229940054136 kineret Drugs 0.000 description 1
- 210000003127 knee Anatomy 0.000 description 1
- CSSYQJWUGATIHM-IKGCZBKSSA-N l-phenylalanyl-l-lysyl-l-cysteinyl-l-arginyl-l-arginyl-l-tryptophyl-l-glutaminyl-l-tryptophyl-l-arginyl-l-methionyl-l-lysyl-l-lysyl-l-leucylglycyl-l-alanyl-l-prolyl-l-seryl-l-isoleucyl-l-threonyl-l-cysteinyl-l-valyl-l-arginyl-l-arginyl-l-alanyl-l-phenylal Chemical compound C([C@H](N)C(=O)N[C@@H](CCCCN)C(=O)N[C@@H](CS)C(=O)N[C@@H](CCCNC(N)=N)C(=O)N[C@@H](CCCNC(N)=N)C(=O)N[C@@H](CC=1C2=CC=CC=C2NC=1)C(=O)N[C@@H](CCC(N)=O)C(=O)N[C@@H](CC=1C2=CC=CC=C2NC=1)C(=O)N[C@@H](CCCNC(N)=N)C(=O)N[C@@H](CCSC)C(=O)N[C@@H](CCCCN)C(=O)N[C@@H](CCCCN)C(=O)N[C@@H](CC(C)C)C(=O)NCC(=O)N[C@@H](C)C(=O)N1CCC[C@H]1C(=O)N[C@@H](CO)C(=O)N[C@@H]([C@@H](C)CC)C(=O)N[C@@H]([C@@H](C)O)C(=O)N[C@@H](CS)C(=O)N[C@@H](C(C)C)C(=O)N[C@@H](CCCNC(N)=N)C(=O)N[C@@H](CCCNC(N)=N)C(=O)N[C@@H](C)C(=O)N[C@@H](CC=1C=CC=CC=1)C(O)=O)C1=CC=CC=C1 CSSYQJWUGATIHM-IKGCZBKSSA-N 0.000 description 1
- 229940078795 lactoferrin Drugs 0.000 description 1
- 235000021242 lactoferrin Nutrition 0.000 description 1
- 238000000370 laser capture micro-dissection Methods 0.000 description 1
- 230000021633 leukocyte mediated immunity Effects 0.000 description 1
- 150000002617 leukotrienes Chemical class 0.000 description 1
- 229960004194 lidocaine Drugs 0.000 description 1
- 238000007834 ligase chain reaction Methods 0.000 description 1
- 229940063721 lioresal Drugs 0.000 description 1
- 239000007788 liquid Substances 0.000 description 1
- 208000019423 liver disease Diseases 0.000 description 1
- 238000007449 liver function test Methods 0.000 description 1
- 208000018883 loss of balance Diseases 0.000 description 1
- 208000030208 low-grade fever Diseases 0.000 description 1
- 238000005461 lubrication Methods 0.000 description 1
- 210000004705 lumbosacral region Anatomy 0.000 description 1
- 210000002751 lymph Anatomy 0.000 description 1
- 238000010801 machine learning Methods 0.000 description 1
- 238000007898 magnetic cell sorting Methods 0.000 description 1
- 239000006249 magnetic particle Substances 0.000 description 1
- 206010025482 malaise Diseases 0.000 description 1
- 210000003794 male germ cell Anatomy 0.000 description 1
- 238000004519 manufacturing process Methods 0.000 description 1
- 210000003826 marginal zone b cell Anatomy 0.000 description 1
- 210000001806 memory b lymphocyte Anatomy 0.000 description 1
- 210000003071 memory t lymphocyte Anatomy 0.000 description 1
- 210000004914 menses Anatomy 0.000 description 1
- 230000003340 mental effect Effects 0.000 description 1
- 108020004999 messenger RNA Proteins 0.000 description 1
- 229960003085 meticillin Drugs 0.000 description 1
- 239000002679 microRNA Substances 0.000 description 1
- 229960001156 mitoxantrone Drugs 0.000 description 1
- 238000002156 mixing Methods 0.000 description 1
- 230000037230 mobility Effects 0.000 description 1
- 230000004048 modification Effects 0.000 description 1
- 238000012986 modification Methods 0.000 description 1
- 239000003147 molecular marker Substances 0.000 description 1
- 210000001616 monocyte Anatomy 0.000 description 1
- 230000036651 mood Effects 0.000 description 1
- 229940072709 motrin Drugs 0.000 description 1
- 210000004400 mucous membrane Anatomy 0.000 description 1
- 210000003097 mucus Anatomy 0.000 description 1
- 229960003816 muromonab-cd3 Drugs 0.000 description 1
- 208000016334 muscle symptom Diseases 0.000 description 1
- 206010028417 myasthenia gravis Diseases 0.000 description 1
- 229940014456 mycophenolate Drugs 0.000 description 1
- HPNSFSBZBAHARI-RUDMXATFSA-N mycophenolic acid Chemical compound OC1=C(C\C=C(/C)CCC(O)=O)C(OC)=C(C)C2=C1C(=O)OC2 HPNSFSBZBAHARI-RUDMXATFSA-N 0.000 description 1
- 210000005012 myelin Anatomy 0.000 description 1
- 210000003007 myelin sheath Anatomy 0.000 description 1
- 229960002009 naproxen Drugs 0.000 description 1
- CMWTZPSULFXXJA-VIFPVBQESA-N naproxen Chemical compound C1=C([C@H](C)C(O)=O)C=CC2=CC(OC)=CC=C21 CMWTZPSULFXXJA-VIFPVBQESA-N 0.000 description 1
- 231100000417 nephrotoxicity Toxicity 0.000 description 1
- 210000000653 nervous system Anatomy 0.000 description 1
- 238000007857 nested PCR Methods 0.000 description 1
- 230000004770 neurodegeneration Effects 0.000 description 1
- 238000002610 neuroimaging Methods 0.000 description 1
- 210000002569 neuron Anatomy 0.000 description 1
- 230000007935 neutral effect Effects 0.000 description 1
- 238000011457 non-pharmacological treatment Methods 0.000 description 1
- 239000002853 nucleic acid probe Substances 0.000 description 1
- 201000010854 nut allergy Diseases 0.000 description 1
- 238000001584 occupational therapy Methods 0.000 description 1
- 231100000327 ocular toxicity Toxicity 0.000 description 1
- 210000004248 oligodendroglia Anatomy 0.000 description 1
- 229940127240 opiate Drugs 0.000 description 1
- 239000000014 opioid analgesic Substances 0.000 description 1
- 229940005483 opioid analgesics Drugs 0.000 description 1
- 229940035567 orencia Drugs 0.000 description 1
- 229940046781 other immunosuppressants in atc Drugs 0.000 description 1
- JJVOROULKOMTKG-UHFFFAOYSA-N oxidized Photinus luciferin Chemical compound S1C2=CC(O)=CC=C2N=C1C1=NC(=O)CS1 JJVOROULKOMTKG-UHFFFAOYSA-N 0.000 description 1
- 229940094443 oxytocics prostaglandins Drugs 0.000 description 1
- 230000000242 pagocytic effect Effects 0.000 description 1
- 210000000496 pancreas Anatomy 0.000 description 1
- 206010033675 panniculitis Diseases 0.000 description 1
- 208000035824 paresthesia Diseases 0.000 description 1
- 230000001717 pathogenic effect Effects 0.000 description 1
- 230000009054 pathological process Effects 0.000 description 1
- 201000001976 pemphigus vulgaris Diseases 0.000 description 1
- 210000003516 pericardium Anatomy 0.000 description 1
- 230000000737 periodic effect Effects 0.000 description 1
- 230000002085 persistent effect Effects 0.000 description 1
- 230000008782 phagocytosis Effects 0.000 description 1
- 229960002895 phenylbutazone Drugs 0.000 description 1
- VYMDGNCVAMGZFE-UHFFFAOYSA-N phenylbutazonum Chemical compound O=C1C(CCCC)C(=O)N(C=2C=CC=CC=2)N1C1=CC=CC=C1 VYMDGNCVAMGZFE-UHFFFAOYSA-N 0.000 description 1
- 208000026435 phlegm Diseases 0.000 description 1
- 238000000554 physical therapy Methods 0.000 description 1
- 239000000902 placebo Substances 0.000 description 1
- 229940068196 placebo Drugs 0.000 description 1
- 229940072689 plaquenil Drugs 0.000 description 1
- 238000002616 plasmapheresis Methods 0.000 description 1
- 229940020573 plavix Drugs 0.000 description 1
- 210000004224 pleura Anatomy 0.000 description 1
- 210000004910 pleural fluid Anatomy 0.000 description 1
- 229920001184 polypeptide Polymers 0.000 description 1
- 229920001282 polysaccharide Polymers 0.000 description 1
- 239000005017 polysaccharide Substances 0.000 description 1
- 238000009258 post-therapy Methods 0.000 description 1
- 230000004481 post-translational protein modification Effects 0.000 description 1
- ZRHANBBTXQZFSP-UHFFFAOYSA-M potassium;4-amino-3,5,6-trichloropyridine-2-carboxylate Chemical compound [K+].NC1=C(Cl)C(Cl)=NC(C([O-])=O)=C1Cl ZRHANBBTXQZFSP-UHFFFAOYSA-M 0.000 description 1
- 230000002265 prevention Effects 0.000 description 1
- 238000012545 processing Methods 0.000 description 1
- 150000003180 prostaglandins Chemical class 0.000 description 1
- 230000001681 protective effect Effects 0.000 description 1
- 230000001823 pruritic effect Effects 0.000 description 1
- 208000020016 psychiatric disease Diseases 0.000 description 1
- 208000005069 pulmonary fibrosis Diseases 0.000 description 1
- 238000000746 purification Methods 0.000 description 1
- 210000004915 pus Anatomy 0.000 description 1
- 238000001959 radiotherapy Methods 0.000 description 1
- ZAHRKKWIAAJSAO-UHFFFAOYSA-N rapamycin Natural products COCC(O)C(=C/C(C)C(=O)CC(OC(=O)C1CCCCN1C(=O)C(=O)C2(O)OC(CC(OC)C(=CC=CC=CC(C)CC(C)C(=O)C)C)CCC2C)C(C)CC3CCC(O)C(C3)OC)C ZAHRKKWIAAJSAO-UHFFFAOYSA-N 0.000 description 1
- 230000004461 rapid eye movement Effects 0.000 description 1
- 229940038850 rebif Drugs 0.000 description 1
- 230000007115 recruitment Effects 0.000 description 1
- 210000003289 regulatory T cell Anatomy 0.000 description 1
- 229940116176 remicade Drugs 0.000 description 1
- 238000009877 rendering Methods 0.000 description 1
- 238000011160 research Methods 0.000 description 1
- 230000004043 responsiveness Effects 0.000 description 1
- 108091008146 restriction endonucleases Proteins 0.000 description 1
- 238000003757 reverse transcription PCR Methods 0.000 description 1
- 210000003705 ribosome Anatomy 0.000 description 1
- 230000000630 rising effect Effects 0.000 description 1
- 210000004918 root sheath Anatomy 0.000 description 1
- 238000009666 routine test Methods 0.000 description 1
- 210000003296 saliva Anatomy 0.000 description 1
- 230000007017 scission Effects 0.000 description 1
- 210000003786 sclera Anatomy 0.000 description 1
- 238000012216 screening Methods 0.000 description 1
- 230000001932 seasonal effect Effects 0.000 description 1
- 210000002374 sebum Anatomy 0.000 description 1
- 230000003248 secreting effect Effects 0.000 description 1
- 210000000582 semen Anatomy 0.000 description 1
- 230000035807 sensation Effects 0.000 description 1
- 235000019615 sensations Nutrition 0.000 description 1
- 230000000405 serological effect Effects 0.000 description 1
- 238000009589 serological test Methods 0.000 description 1
- 206010040560 shock Diseases 0.000 description 1
- 208000013220 shortness of breath Diseases 0.000 description 1
- 238000007860 single-cell PCR Methods 0.000 description 1
- 229960002930 sirolimus Drugs 0.000 description 1
- QFJCIRLUMZQUOT-HPLJOQBZSA-N sirolimus Chemical compound C1C[C@@H](O)[C@H](OC)C[C@@H]1C[C@@H](C)[C@H]1OC(=O)[C@@H]2CCCCN2C(=O)C(=O)[C@](O)(O2)[C@H](C)CC[C@H]2C[C@H](OC)/C(C)=C/C=C/C=C/[C@@H](C)C[C@@H](C)C(=O)[C@H](OC)[C@H](O)/C(C)=C/[C@@H](C)C(=O)C1 QFJCIRLUMZQUOT-HPLJOQBZSA-N 0.000 description 1
- 206010040882 skin lesion Diseases 0.000 description 1
- 231100000444 skin lesion Toxicity 0.000 description 1
- 231100000019 skin ulcer Toxicity 0.000 description 1
- 210000000813 small intestine Anatomy 0.000 description 1
- 229940126586 small molecule drug Drugs 0.000 description 1
- 230000035943 smell Effects 0.000 description 1
- 229940087854 solu-medrol Drugs 0.000 description 1
- 238000001179 sorption measurement Methods 0.000 description 1
- 241000894007 species Species 0.000 description 1
- 230000002269 spontaneous effect Effects 0.000 description 1
- 230000007480 spreading Effects 0.000 description 1
- 238000003892 spreading Methods 0.000 description 1
- 238000010186 staining Methods 0.000 description 1
- 239000007858 starting material Substances 0.000 description 1
- 238000007619 statistical method Methods 0.000 description 1
- 230000002739 subcortical effect Effects 0.000 description 1
- 210000004304 subcutaneous tissue Anatomy 0.000 description 1
- 238000006467 substitution reaction Methods 0.000 description 1
- 239000000758 substrate Substances 0.000 description 1
- 230000009747 swallowing Effects 0.000 description 1
- 210000004243 sweat Anatomy 0.000 description 1
- 230000035900 sweating Effects 0.000 description 1
- 230000008961 swelling Effects 0.000 description 1
- 230000002194 synthesizing effect Effects 0.000 description 1
- 229940037128 systemic glucocorticoids Drugs 0.000 description 1
- 230000006794 tachycardia Effects 0.000 description 1
- QJJXYPPXXYFBGM-SHYZHZOCSA-N tacrolimus Natural products CO[C@H]1C[C@H](CC[C@@H]1O)C=C(C)[C@H]2OC(=O)[C@H]3CCCCN3C(=O)C(=O)[C@@]4(O)O[C@@H]([C@H](C[C@H]4C)OC)[C@@H](C[C@H](C)CC(=C[C@@H](CC=C)C(=O)C[C@H](O)[C@H]2C)C)OC QJJXYPPXXYFBGM-SHYZHZOCSA-N 0.000 description 1
- 229960001967 tacrolimus Drugs 0.000 description 1
- 235000019640 taste Nutrition 0.000 description 1
- 210000001138 tear Anatomy 0.000 description 1
- 230000035922 thirst Effects 0.000 description 1
- 229940034208 thyroxine Drugs 0.000 description 1
- XUIIKFGFIJCVMT-UHFFFAOYSA-N thyroxine-binding globulin Natural products IC1=CC(CC([NH3+])C([O-])=O)=CC(I)=C1OC1=CC(I)=C(O)C(I)=C1 XUIIKFGFIJCVMT-UHFFFAOYSA-N 0.000 description 1
- 229960000488 tizanidine Drugs 0.000 description 1
- 229960003989 tocilizumab Drugs 0.000 description 1
- 238000003325 tomography Methods 0.000 description 1
- 230000000699 topical effect Effects 0.000 description 1
- 238000007862 touchdown PCR Methods 0.000 description 1
- 238000013518 transcription Methods 0.000 description 1
- 230000035897 transcription Effects 0.000 description 1
- 230000001131 transforming effect Effects 0.000 description 1
- 230000007704 transition Effects 0.000 description 1
- 230000005945 translocation Effects 0.000 description 1
- 238000011277 treatment modality Methods 0.000 description 1
- 238000011269 treatment regimen Methods 0.000 description 1
- YNDXUCZADRHECN-JNQJZLCISA-N triamcinolone acetonide Chemical compound C1CC2=CC(=O)C=C[C@]2(C)[C@]2(F)[C@@H]1[C@@H]1C[C@H]3OC(C)(C)O[C@@]3(C(=O)CO)[C@@]1(C)C[C@@H]2O YNDXUCZADRHECN-JNQJZLCISA-N 0.000 description 1
- 238000009966 trimming Methods 0.000 description 1
- 235000011178 triphosphate Nutrition 0.000 description 1
- 239000001226 triphosphate Substances 0.000 description 1
- 125000002264 triphosphate group Chemical class [H]OP(=O)(O[H])OP(=O)(O[H])OP(=O)(O[H])O* 0.000 description 1
- 201000008827 tuberculosis Diseases 0.000 description 1
- 239000000107 tumor biomarker Substances 0.000 description 1
- 210000004881 tumor cell Anatomy 0.000 description 1
- 239000000439 tumor marker Substances 0.000 description 1
- 230000009959 type I hypersensitivity Effects 0.000 description 1
- 230000005951 type IV hypersensitivity Effects 0.000 description 1
- 231100000397 ulcer Toxicity 0.000 description 1
- 241001529453 unidentified herpesvirus Species 0.000 description 1
- 210000000689 upper leg Anatomy 0.000 description 1
- 230000002485 urinary effect Effects 0.000 description 1
- 210000005048 vimentin Anatomy 0.000 description 1
- 208000029257 vision disease Diseases 0.000 description 1
- 210000004916 vomit Anatomy 0.000 description 1
- 239000002569 water oil cream Substances 0.000 description 1
- 210000004885 white matter Anatomy 0.000 description 1
- 229940000119 zanaflex Drugs 0.000 description 1
Images
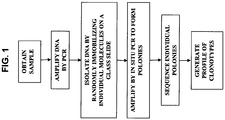

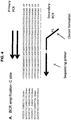


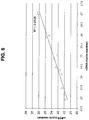

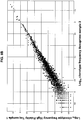

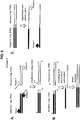
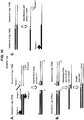

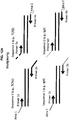

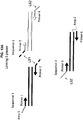
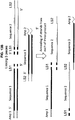
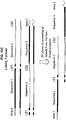


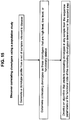
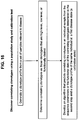
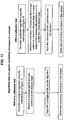
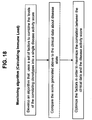

Classifications
-
- C—CHEMISTRY; METALLURGY
- C12—BIOCHEMISTRY; BEER; SPIRITS; WINE; VINEGAR; MICROBIOLOGY; ENZYMOLOGY; MUTATION OR GENETIC ENGINEERING
- C12Q—MEASURING OR TESTING PROCESSES INVOLVING ENZYMES, NUCLEIC ACIDS OR MICROORGANISMS; COMPOSITIONS OR TEST PAPERS THEREFOR; PROCESSES OF PREPARING SUCH COMPOSITIONS; CONDITION-RESPONSIVE CONTROL IN MICROBIOLOGICAL OR ENZYMOLOGICAL PROCESSES
- C12Q1/00—Measuring or testing processes involving enzymes, nucleic acids or microorganisms; Compositions therefor; Processes of preparing such compositions
- C12Q1/68—Measuring or testing processes involving enzymes, nucleic acids or microorganisms; Compositions therefor; Processes of preparing such compositions involving nucleic acids
- C12Q1/6876—Nucleic acid products used in the analysis of nucleic acids, e.g. primers or probes
- C12Q1/6883—Nucleic acid products used in the analysis of nucleic acids, e.g. primers or probes for diseases caused by alterations of genetic material
- C12Q1/6886—Nucleic acid products used in the analysis of nucleic acids, e.g. primers or probes for diseases caused by alterations of genetic material for cancer
-
- C—CHEMISTRY; METALLURGY
- C12—BIOCHEMISTRY; BEER; SPIRITS; WINE; VINEGAR; MICROBIOLOGY; ENZYMOLOGY; MUTATION OR GENETIC ENGINEERING
- C12N—MICROORGANISMS OR ENZYMES; COMPOSITIONS THEREOF; PROPAGATING, PRESERVING, OR MAINTAINING MICROORGANISMS; MUTATION OR GENETIC ENGINEERING; CULTURE MEDIA
- C12N15/00—Mutation or genetic engineering; DNA or RNA concerning genetic engineering, vectors, e.g. plasmids, or their isolation, preparation or purification; Use of hosts therefor
- C12N15/09—Recombinant DNA-technology
- C12N15/10—Processes for the isolation, preparation or purification of DNA or RNA
- C12N15/1034—Isolating an individual clone by screening libraries
- C12N15/1072—Differential gene expression library synthesis, e.g. subtracted libraries, differential screening
-
- C—CHEMISTRY; METALLURGY
- C12—BIOCHEMISTRY; BEER; SPIRITS; WINE; VINEGAR; MICROBIOLOGY; ENZYMOLOGY; MUTATION OR GENETIC ENGINEERING
- C12N—MICROORGANISMS OR ENZYMES; COMPOSITIONS THEREOF; PROPAGATING, PRESERVING, OR MAINTAINING MICROORGANISMS; MUTATION OR GENETIC ENGINEERING; CULTURE MEDIA
- C12N15/00—Mutation or genetic engineering; DNA or RNA concerning genetic engineering, vectors, e.g. plasmids, or their isolation, preparation or purification; Use of hosts therefor
- C12N15/09—Recombinant DNA-technology
- C12N15/11—DNA or RNA fragments; Modified forms thereof; Non-coding nucleic acids having a biological activity
-
- C—CHEMISTRY; METALLURGY
- C12—BIOCHEMISTRY; BEER; SPIRITS; WINE; VINEGAR; MICROBIOLOGY; ENZYMOLOGY; MUTATION OR GENETIC ENGINEERING
- C12Q—MEASURING OR TESTING PROCESSES INVOLVING ENZYMES, NUCLEIC ACIDS OR MICROORGANISMS; COMPOSITIONS OR TEST PAPERS THEREFOR; PROCESSES OF PREPARING SUCH COMPOSITIONS; CONDITION-RESPONSIVE CONTROL IN MICROBIOLOGICAL OR ENZYMOLOGICAL PROCESSES
- C12Q1/00—Measuring or testing processes involving enzymes, nucleic acids or microorganisms; Compositions therefor; Processes of preparing such compositions
- C12Q1/68—Measuring or testing processes involving enzymes, nucleic acids or microorganisms; Compositions therefor; Processes of preparing such compositions involving nucleic acids
- C12Q1/6809—Methods for determination or identification of nucleic acids involving differential detection
-
- C—CHEMISTRY; METALLURGY
- C12—BIOCHEMISTRY; BEER; SPIRITS; WINE; VINEGAR; MICROBIOLOGY; ENZYMOLOGY; MUTATION OR GENETIC ENGINEERING
- C12Q—MEASURING OR TESTING PROCESSES INVOLVING ENZYMES, NUCLEIC ACIDS OR MICROORGANISMS; COMPOSITIONS OR TEST PAPERS THEREFOR; PROCESSES OF PREPARING SUCH COMPOSITIONS; CONDITION-RESPONSIVE CONTROL IN MICROBIOLOGICAL OR ENZYMOLOGICAL PROCESSES
- C12Q1/00—Measuring or testing processes involving enzymes, nucleic acids or microorganisms; Compositions therefor; Processes of preparing such compositions
- C12Q1/68—Measuring or testing processes involving enzymes, nucleic acids or microorganisms; Compositions therefor; Processes of preparing such compositions involving nucleic acids
- C12Q1/6813—Hybridisation assays
- C12Q1/6827—Hybridisation assays for detection of mutation or polymorphism
-
- C—CHEMISTRY; METALLURGY
- C12—BIOCHEMISTRY; BEER; SPIRITS; WINE; VINEGAR; MICROBIOLOGY; ENZYMOLOGY; MUTATION OR GENETIC ENGINEERING
- C12Q—MEASURING OR TESTING PROCESSES INVOLVING ENZYMES, NUCLEIC ACIDS OR MICROORGANISMS; COMPOSITIONS OR TEST PAPERS THEREFOR; PROCESSES OF PREPARING SUCH COMPOSITIONS; CONDITION-RESPONSIVE CONTROL IN MICROBIOLOGICAL OR ENZYMOLOGICAL PROCESSES
- C12Q1/00—Measuring or testing processes involving enzymes, nucleic acids or microorganisms; Compositions therefor; Processes of preparing such compositions
- C12Q1/68—Measuring or testing processes involving enzymes, nucleic acids or microorganisms; Compositions therefor; Processes of preparing such compositions involving nucleic acids
- C12Q1/6869—Methods for sequencing
-
- C—CHEMISTRY; METALLURGY
- C12—BIOCHEMISTRY; BEER; SPIRITS; WINE; VINEGAR; MICROBIOLOGY; ENZYMOLOGY; MUTATION OR GENETIC ENGINEERING
- C12Q—MEASURING OR TESTING PROCESSES INVOLVING ENZYMES, NUCLEIC ACIDS OR MICROORGANISMS; COMPOSITIONS OR TEST PAPERS THEREFOR; PROCESSES OF PREPARING SUCH COMPOSITIONS; CONDITION-RESPONSIVE CONTROL IN MICROBIOLOGICAL OR ENZYMOLOGICAL PROCESSES
- C12Q1/00—Measuring or testing processes involving enzymes, nucleic acids or microorganisms; Compositions therefor; Processes of preparing such compositions
- C12Q1/68—Measuring or testing processes involving enzymes, nucleic acids or microorganisms; Compositions therefor; Processes of preparing such compositions involving nucleic acids
- C12Q1/6876—Nucleic acid products used in the analysis of nucleic acids, e.g. primers or probes
- C12Q1/6881—Nucleic acid products used in the analysis of nucleic acids, e.g. primers or probes for tissue or cell typing, e.g. human leukocyte antigen [HLA] probes
-
- C—CHEMISTRY; METALLURGY
- C12—BIOCHEMISTRY; BEER; SPIRITS; WINE; VINEGAR; MICROBIOLOGY; ENZYMOLOGY; MUTATION OR GENETIC ENGINEERING
- C12Q—MEASURING OR TESTING PROCESSES INVOLVING ENZYMES, NUCLEIC ACIDS OR MICROORGANISMS; COMPOSITIONS OR TEST PAPERS THEREFOR; PROCESSES OF PREPARING SUCH COMPOSITIONS; CONDITION-RESPONSIVE CONTROL IN MICROBIOLOGICAL OR ENZYMOLOGICAL PROCESSES
- C12Q1/00—Measuring or testing processes involving enzymes, nucleic acids or microorganisms; Compositions therefor; Processes of preparing such compositions
- C12Q1/68—Measuring or testing processes involving enzymes, nucleic acids or microorganisms; Compositions therefor; Processes of preparing such compositions involving nucleic acids
- C12Q1/6876—Nucleic acid products used in the analysis of nucleic acids, e.g. primers or probes
- C12Q1/6883—Nucleic acid products used in the analysis of nucleic acids, e.g. primers or probes for diseases caused by alterations of genetic material
-
- C—CHEMISTRY; METALLURGY
- C12—BIOCHEMISTRY; BEER; SPIRITS; WINE; VINEGAR; MICROBIOLOGY; ENZYMOLOGY; MUTATION OR GENETIC ENGINEERING
- C12Q—MEASURING OR TESTING PROCESSES INVOLVING ENZYMES, NUCLEIC ACIDS OR MICROORGANISMS; COMPOSITIONS OR TEST PAPERS THEREFOR; PROCESSES OF PREPARING SUCH COMPOSITIONS; CONDITION-RESPONSIVE CONTROL IN MICROBIOLOGICAL OR ENZYMOLOGICAL PROCESSES
- C12Q2600/00—Oligonucleotides characterized by their use
- C12Q2600/106—Pharmacogenomics, i.e. genetic variability in individual responses to drugs and drug metabolism
-
- C—CHEMISTRY; METALLURGY
- C12—BIOCHEMISTRY; BEER; SPIRITS; WINE; VINEGAR; MICROBIOLOGY; ENZYMOLOGY; MUTATION OR GENETIC ENGINEERING
- C12Q—MEASURING OR TESTING PROCESSES INVOLVING ENZYMES, NUCLEIC ACIDS OR MICROORGANISMS; COMPOSITIONS OR TEST PAPERS THEREFOR; PROCESSES OF PREPARING SUCH COMPOSITIONS; CONDITION-RESPONSIVE CONTROL IN MICROBIOLOGICAL OR ENZYMOLOGICAL PROCESSES
- C12Q2600/00—Oligonucleotides characterized by their use
- C12Q2600/118—Prognosis of disease development
-
- C—CHEMISTRY; METALLURGY
- C12—BIOCHEMISTRY; BEER; SPIRITS; WINE; VINEGAR; MICROBIOLOGY; ENZYMOLOGY; MUTATION OR GENETIC ENGINEERING
- C12Q—MEASURING OR TESTING PROCESSES INVOLVING ENZYMES, NUCLEIC ACIDS OR MICROORGANISMS; COMPOSITIONS OR TEST PAPERS THEREFOR; PROCESSES OF PREPARING SUCH COMPOSITIONS; CONDITION-RESPONSIVE CONTROL IN MICROBIOLOGICAL OR ENZYMOLOGICAL PROCESSES
- C12Q2600/00—Oligonucleotides characterized by their use
- C12Q2600/156—Polymorphic or mutational markers
-
- C—CHEMISTRY; METALLURGY
- C12—BIOCHEMISTRY; BEER; SPIRITS; WINE; VINEGAR; MICROBIOLOGY; ENZYMOLOGY; MUTATION OR GENETIC ENGINEERING
- C12Q—MEASURING OR TESTING PROCESSES INVOLVING ENZYMES, NUCLEIC ACIDS OR MICROORGANISMS; COMPOSITIONS OR TEST PAPERS THEREFOR; PROCESSES OF PREPARING SUCH COMPOSITIONS; CONDITION-RESPONSIVE CONTROL IN MICROBIOLOGICAL OR ENZYMOLOGICAL PROCESSES
- C12Q2600/00—Oligonucleotides characterized by their use
- C12Q2600/158—Expression markers
-
- C—CHEMISTRY; METALLURGY
- C12—BIOCHEMISTRY; BEER; SPIRITS; WINE; VINEGAR; MICROBIOLOGY; ENZYMOLOGY; MUTATION OR GENETIC ENGINEERING
- C12Q—MEASURING OR TESTING PROCESSES INVOLVING ENZYMES, NUCLEIC ACIDS OR MICROORGANISMS; COMPOSITIONS OR TEST PAPERS THEREFOR; PROCESSES OF PREPARING SUCH COMPOSITIONS; CONDITION-RESPONSIVE CONTROL IN MICROBIOLOGICAL OR ENZYMOLOGICAL PROCESSES
- C12Q2600/00—Oligonucleotides characterized by their use
- C12Q2600/16—Primer sets for multiplex assays
-
- Y—GENERAL TAGGING OF NEW TECHNOLOGICAL DEVELOPMENTS; GENERAL TAGGING OF CROSS-SECTIONAL TECHNOLOGIES SPANNING OVER SEVERAL SECTIONS OF THE IPC; TECHNICAL SUBJECTS COVERED BY FORMER USPC CROSS-REFERENCE ART COLLECTIONS [XRACs] AND DIGESTS
- Y02—TECHNOLOGIES OR APPLICATIONS FOR MITIGATION OR ADAPTATION AGAINST CLIMATE CHANGE
- Y02A—TECHNOLOGIES FOR ADAPTATION TO CLIMATE CHANGE
- Y02A90/00—Technologies having an indirect contribution to adaptation to climate change
- Y02A90/10—Information and communication technologies [ICT] supporting adaptation to climate change, e.g. for weather forecasting or climate simulation
Definitions
- the immune system comprises the innate and the adaptive immunity systems.
- the innate immune system comprises the cells and mechanisms utilizing generic methods to recognize foreign pathogens.
- Cells involved in innate immunity include neutrophils, natural killer cells, macrophages, monocytes, basophils, eosinphils, mast, and dentritic cells. These cells carry out the act of phagocytosis as well as the release of many chemicals that kill invading pathogens.
- these cells are involved in innate immunity defense mechanisms including the complement cascade and inflammation.
- some of these cells participate in the antigen presentation process that plays a role in the adaptive immunity system.
- the adaptive immunity system has evolved to attack specific features on their targets.
- the occurrence of one response to a specific target provides the host with "memory" of it, causing it to mount a stronger response if it were to appear another time.
- any protein or polysaccharide can serve as the target for some subset of the adaptive immune response cells or their products that recognize specific epitopes on the target.
- the adaptive immune response is divided into two types: the humoral and the cell-mediated immune response, and B-cells and T-cells play the specificity roles in these responses, respectively.
- autoimmune disease involves the recognition of some element of the adaptive immune system to self targets
- aspects of the adaptive immune system have been examined to aid in diagnosis and prognosis.
- the humoral immune system has been investigated by looking for circulating autoantibodies.
- Autoantibodies like antinuclear, anti-dsDNA, and rheumatoid factor, have been identified for several diseases. These antibodies may not themselves be pathological, nor is the target they recognize in the body necessarily the same as that tested for in vitro; however, measurement of their levels aids in the diagnosis and in some cases has some prognostic and treatment implications.
- Another methodology to study the adaptive immune system in autoimmune disease is based on the analysis of the diversity of the adaptive immune cells. Activation of the adaptive immune cells leads to their clonal expansion. Evidence of this clonal expansion is usually achieved by amplification from the blood RNA or DNA of part of the nucleic acid sequence coding for the antigen recognition region. For example, PCR primers to amplify sequences that have a specific V segment of the ⁇ chain in T-cell receptor (analogous to antibody heavy chain) are used to amplify the J segments or J and D segments connected to the specific V segment.
- each of the V segments is amplified with the J and D segments to assess whether any of these amplicons shows a clonal expansion.
- a method for determining a profile of recombined DNA sequences in T-cells and/or B-cells comprising: obtaining a sample from a subject comprising T-cells and/or B-cells, spatially isolating individual molecules of genomic DNA from said cells; sequencing said spatially isolated individual molecules of genomic DNA, and determining the levels of different sequences from said sample to generate said profile of recombined DNA sequences.
- a method for determining a profile of recombined DNA sequences in T-cells and/or B-cells comprising: obtaining a sample from a subject comprising T-cells and/or B-cells, spatially isolating individual molecules of genomic DNA from said cells, amplifying said individual molecules of genomic DNA, sequencing said amplified DNA, and determining the levels of different sequences from said sample to generate said profile of recombined DNA sequences.
- a method for determining a profile of recombined DNA sequences in T-cells and/or B-cells comprising: obtaining a sample from a subject comprising T-cells and/or B-cells, amplifying genomic DNA from said cells, spatially isolating individual molecules of said amplified DNA, sequencing said spatially isolated individual molecules of amplified DNA; and determining the levels of different sequences from said sample to generate said profile of recombined DNA sequences.
- a method for determining a profile of recombined DNA sequences in T-cells and/or B-cells comprising: obtaining a sample from a subject comprising T-cells and/or B-cells, amplifying genomic DNA from said cells, spatially isolating individual molecules of said amplified DNA, re-amplifying said amplified DNA molecules, sequencing said re-amplified DNA molecules, and determining the levels of different sequences from said sample to generate said profile of recombined DNA sequences.
- a method for determining a profile of sequences of recombined DNA in T-cells and/or B-cells comprising: obtaining a sample from a subject comprising T-cells and/or B-cells, reverse transcribing RNA from said cells to form cDNA, spatially isolating individual molecules of said cDNA, optionally re-amplifying said spatially isolated individual molecules of cDNA, sequencing said cDNA and/or re-amplified cDNA; and determining the levels of different sequences from said sample to generate said profile of recombined DNA sequences.
- a method for determining a profile of recombined DNA sequences in T-cells and/or B-cells comprising: obtaining a sample from a subject comprising T-cells and/or B-cells; spatially isolating individual cells in said sample, sequencing individual molecules of nucleic from said cells; and determining the levels of different sequences from said sample to generate said profile of recombined DNA sequences.
- said amplifying and/or re-amplifying comprises PCR, multiplex PCR, TMA, NASBA, or LAMP.
- said spatially isolating comprises subcloning said DNA or cDNA in vectors used to transform bacteria, separating said DNA or cDNA in two dimensions on a solid support, separating said DNA or cDNA in three dimensions in a solution with micelles, or separating molecules using micro-reaction chambers.
- said amplifying and/or re-amplifying is by growth of bacteria harboring subcloned DNA or cDNA, amplification of DNA or cDNA on a slide, or amplification of DNA or cDNA on a bead.
- said sequencing comprises dideoxy sequencing. In another embodiment, said sequencing comprises sequencing by synthesis using reversibly terminated labeled nucleotides. In another embodiment, said sequencing comprises detection of pyrophosphate release on nucleotide incorporation. In another embodiment, said sequencing comprises allele specific hybridization to a library of labeled oligonucleotide probes. In another embodiment, said sequencing comprises sequencing by synthesis using allele specific hybridization to a library of labeled oligonucleotide probes followed by ligation of said probes. In another embodiment, said sequencing comprises real time monitoring of the incorporation of labeled nucleotides during a polymerization step.
- said recombined DNA sequences comprise T-cell receptor genes and/or immunoglobulin genes.
- said sequencing comprises sequencing a subset of the full clonal sequences of immunoglobulin and/or T-cell receptor genes.
- said subset of the full clonal sequence comprises the V-D junction, D-J junction of an immunoglobulin or T-cell receptor gene, the full variable region of an immunoglobulin or T-cell receptor gene, the antigen recognition region, or the complementarity determining region 3 (CDR3).
- said T-cell receptor genes comprise T-cell receptor ⁇ genes.
- said immunoglobulin genes comprise immunoglobulin heavy genes.
- said amplifying or re-amplifying comprises a plurality of primers complementary to V segments and one primer complementary to a C segment.
- said amplifying or re-amplifying comprises a plurality of primers complementary to V segments and a plurality of primers complementary to C segments.
- said plurality of primers complementary to V segments comprises at least three different primers for each V segment and the plurality of primers complementary to C segments comprises at least 1, at least 2, at least 3, at least 4, at least 5, or at least 6 primers.
- said T- or B-cells are subsets of the total T and B cells.
- said subset of T-cells are CD4+, CD8+ cells, or CD27 high cells.
- said sample comprises at least 100,000, at least 500,000, at least 750,000, of at least 1,000,000 T-cells.
- said sequencing comprises at least 1000 reads per run, at least 10,000 reads per run, at least 100,000 reads per run, or at least 1,000,000 reads per run. In another embodiment, said sequencing comprises generating about 30 bp, about 40 bp, about 50 bp, about 60 bp, about 70 bp, about 80 bp, about 90 bp, about 100 bp, about 110, or about 120 bp per read.
- said sample is taken when the subject is at a flare state of an autoimmune disease. In another embodiment, said sample is taken from a subject having or suspected of having systemic lupus erythematosus.
- a method for determining one or more correlating clonotypes in a subject comprising: generating one or more clonotype profiles by nucleic acid sequencing individual, spatially isolated molecules from at least one sample from the subject, wherein the at least one sample is related to a first state of the disease, and determining one or more correlating clonotypes in the subject based on the one or more clonotype profiles.
- said at least one sample is from a tissue affected by the disease.
- said determination of one or more correlating clonotypes comprises comparing clonotype profiles from at least two samples.
- the first state of the disease is a peak state of the disease.
- said one or more correlating clonotypes are present in the peak state of the disease.
- said one or more correlating clonotypes are absent in the peak state of the disease.
- said one or more correlating clonotypes are high in the peak state of the disease.
- said one or more correlating clonotypes are low in the peak state of the disease.
- said sample comprises T-cells and/or B-cells.
- said T-cells and/or B-cells comprise a subset of T-cells and/or B-cells.
- said subset of T-cells and/or B-cells are enriched by interaction with a marker.
- said marker is a cell surface marker on the subset of T-cells and/or B-cells.
- said subset of T-cells and/or B-cells interact with an antigen specifically present in the disease.
- the disease is systemic lupus erythematosus or multiple sclerosis.
- a method for developing an algorithm that can predict one or more correlating clonotypes in any sample from a subject with a disease comprising: a) generating a plurality of clonotype profiles from a set of samples, wherein the samples are relevant to the disease, b) identifying one or more correlating clonotypes from the set of samples, c) using sequence parameters and/or functional data from one or more correlating clonotypes identified in b) to develop the algorithm that can predict correlating clonotypes in any sample from a subject with the disease.
- the set of samples are taken from one or more tissues affected by the disease.
- said identification of one or more correlating clonotypes comprises comparing clonotype profiles from at least two samples.
- said functional data include binding ability of markers on T-cell and/or B-cell surface or interaction with antigen by a T-cell or B-cell.
- said sequence parameters comprise nucleic acid sequence and predicted amino acid sequence.
- the samples are from one or more individuals at a peak stage of the disease.
- said one or more correlating clonotypes are present in the peak state of the disease.
- said one or more correlating clonotypes are at a high level in the peak state of the disease.
- said one or more correlating clonotypes are at a low level in the peak state of the disease.
- the one or more correlating clonotypes are absent at the peak state of the disease.
- the disease is systemic lupus erythematosus or multiple sclerosis.
- a method for discovering one or more correlating clonotypes for an individual comprising inputting a clonotype profile from a sample from the individual into an algorithm, and using the algorithm to determine one or more correlating clonotypes for the individual.
- the algorithm is an algorithm that can predict one or more correlating clonotypes in any sample from a subject with a disease
- said algorithm being developed by: a) generating a plurality of clonotype profiles from a set of samples, wherein the samples are relevant to the disease, b) identifying one or more correlating clonotypes from the set of samples, c) using sequence parameters and/or functional data from one or more correlating clonotypes identified in b) to develop an algorithm that can predict correlating clonotypes in any sample from a subject with the disease.
- said sample is at taken at a peak state of disease. In another embodiment, the sample is taken from disease affected tissue.
- a method for generating an algorithm that calculates a disease activity score comprising: developing an algorithm that uses a set of factors to combine levels of correlating clonotypes into a disease activity score, comparing the disease activity score to clinical data regarding the disease state, and optimizing the factors in order to maximize the correlation between clinical data and the disease activity score.
- method for monitoring the disease state of an individual comprising: a) determining a clonotype profile from a sample from the individual, b) inputting the clonotype profile information from a) into an algorithm that calculates a disease activity score, wherein is algorithm is generated by developing an algorithm that uses a set of factors to combine levels of correlating clonotypes into a disease activity score, comparing the disease activity score to clinical data regarding the disease state, and optimizing the factors in order to maximize the correlation between clinical data and the disease activity score, and c) using the algorithm that calculates a disease activity score to generate a score predictive of the disease state of the individual.
- the method for monitoring the disease state of an individual further comprises determining one or more correlating clonotypes in the individual, and inputting information the one or more correlating clonotypes into the algorithm.
- said determining one or more correlating clonotypes in the individual comprises a) generating one or more clonotype profiles by nucleic acid sequencing individual, spatially isolated molecules from at least one sample from the subject, wherein the at least one sample is related to a first state of the disease, and b) determining one or more correlating clonotypes in the subject based on the one or more clonotype profiles.
- said determining one or more correlating clonotypes in the individual comprises a) inputting a clonotype profile from a sample from the individual into an algorithm that can predict one or more correlating clonotypes, wherein said algorithm that can predict one or more correlating clonotypes is developed by i) generating a plurality of clonotype profiles from a set of samples, wherein the samples are relevant to the disease, ii) identifying one or more correlating clonotypes from the set of samples, iii) using sequence parameters and/or functional data from one or more correlating clonotypes identified in ii) to develop the algorithm that can predict correlating clonotypes in any sample from a subject with the disease, and c) using the algorithm that can predict one or more correlating clonotypes to determine one or more correlating clonotypes for the individual.
- the disease is systemic lupus erythematosus or multiple sclerosis.
- the provided invention includes methods for applying nucleic acid sequencing techniques to the task of monitoring the repertoire of adaptive immunity cells for profiling the immune system.
- the profiles of the immune system generated can be used for diagnosis of diseases and disorders, and for diagnosis of states of diseases and disorders.
- the methods of immune profiling of the provided invention can be used in monitoring diseases and disorders and assessing treatment of diseases and disorders. These diseases and disorders that the methods of the provided invention can be applied to include autoimmune disease, including systemic lupus erythematosus (SLE), multiple sclerosis (MS), rheumatoid arthritis (RA), and ankylosing spondylitis.
- the methods of the provided invention can be applied to the diagnosis, monitoring, and treatment of transplant rejection and immune aging.
- the methods of immune profiling of the provided invention can be used for diagnosing, monitoring, and treating other diseases related to the immune system, including cancer and infectious disease.
- a method for determining a profile of recombined DNA sequences in T-cells and/or B-cells is provided.
- the method can comprise steps including isolating samples from a subject, one or more rounds of nucleic acid amplification, spatially isolating individual nucleic acids, and sequencing nucleic acids.
- the nucleic acids can be DNA or RNA.
- the recombined DNA sequences in T-cells and/or B-cells can be termed clonotypes.
- a method for determining one or more correlating clonotypes in a subject or individual is provided.
- a method for developing an algorithm that can predict one or more correlating clonotypes in any sample from a subject with a disease is provided.
- a method for discovering one or more correlating clonotypes for an individual using an algorithm that can predict one or more correlating clonotypes in any sample from a subject is provided.
- a method for generating an algorithm that calculates a disease activity score is provided.
- a method for monitoring the disease state of an individual is provided.
- the methods of the provided invention can be used to generate profiles of recombined DNA sequences, or clonotypes, in sample from a subject.
- a method for determining a profile of recombined DNA sequences in T-cells and/or B-cells including obtaining a sample from a subject comprising T-cells and/or B-cells, isolating individual molecules of genomic DNA from said cells, sequencing the isolated individual molecules of genomic DNA, and determining the levels of different sequences from the sample to generate said profile of recombined DNA sequences.
- a method for determining a profile of recombined DNA sequences in T-cells and/or B-cells including obtaining a sample from a subject comprising T-cells and/or B-cells, isolating individual molecules of genomic DNA from the cells, amplifying the individual molecules of genomic DNA, sequencing the amplified DNA, and determining the levels of different sequences from the sample to generate said profile of recombined DNA sequences.
- a method for determining a profile of recombined DNA sequences in T-cells and/or B-cells including obtaining a sample from a subject comprising T-cells and/or B-cells, amplifying genomic DNA from the cells, isolating individual molecules of the amplified DNA, sequencing the isolated individual molecules of amplified DNA, and determining the levels of different sequences from the sample to generate the profile of recombined DNA sequences.
- a method for determining a profile of recombined DNA sequences in T-cells and/or B-cells including obtaining a sample from a subject including T-cells and/or B-cells, amplifying genomic DNA from the cells, isolating individual molecules of the amplified DNA, re-amplifying the amplified DNA molecules, sequencing the re-amplified DNA molecules, and determining the levels of different sequences from the sample to generate the profile of recombined DNA sequences.
- a method for determining a profile of sequences of recombined DNA in T-cells and/or B-cells including obtaining a sample from a subject comprising T-cells and/or B-cells, isolating RNA from said sample, reverse transcribing the RNA from said cells to form cDNA, isolating individual molecules of said cDNA, optionally re-amplifying said cDNA, sequencing said isolated individual molecules of said cDNA or re-amplified DNA, and determining the levels of different sequences from said sample to generate said profile of recombined DNA sequences.
- a method for determining a profile of sequences of recombined DNA in T-cells and/or B-cells including obtaining a sample from a subject including T-cells and/or B-cells, isolating individual molecules of RNA from said sample, sequencing the individual molecules of RNA, and determining the levels of different sequences from said sample to generate the profile of recombined DNA sequences.
- the methods of the provided invention can use samples from subjects or individuals (e.g., patients).
- the subject can be a patient, for example, a patient with an autoimmune disease.
- the subject can be a patient with an infectious disease or cancer.
- the subject can be a mammal, for example, a human.
- the subject can be male or female.
- the subject can be an infant, a child, or an adult.
- Samples used in the methods of the provided invention can include, for example, a bodily fluid from a subject, including amniotic fluid surrounding a fetus, aqueous humor, bile, blood and blood plasma, cerumen (earwax), Cowper's fluid or pre-ejaculatory fluid, chyle, chyme, female ejaculate, interstitial fluid, lymph, menses, breast milk, mucus (including snot and phlegm), pleural fluid, pus, saliva, sebum (skin oil), semen, serum, sweat, tears, urine, vaginal lubrication, vomit, water, feces, internal body fluids, including cerebrospinal fluid surrounding the brain and the spinal cord, synovial fluid surrounding bone joints, intracellular fluid is the fluid inside cells, and vitreous humour the fluids in the eyeball.
- a bodily fluid from a subject including amniotic fluid surrounding a fetus, aqueous humor, bil
- the sample is a blood sample.
- the blood sample can be about 0.1, 0.2, 0.3, 0.4, 0.5, 0.6, 0.7, 0.8, 0.9, 1.0, 1.5, 2.0, 2.5, 3.0, 3.5, 4.0, 4.5, or 5.0 mL.
- the sample can be Cerebral Spinal Fluid (CSF) when the subject has multiple sclerosis, synovial fluid when the subject has rheumatoid arthritis, and skin (or other organ) biopsy when the subject has systemic lupus.
- CSF Cerebral Spinal Fluid
- the clonotpe can be identified from the available body fluid/tissue most likely to reflect pathology followed by later monitoring the levels of the clonotypes form a different body fluid, for example, blood.
- Samples can be analyzed at a time when the disease is inactive.
- the sample can be obtained by a health care provider, for example, a physician, physician assistant, nurse, veterinarian, dermatologist, rheumatologist, dentist, paramedic, or surgeon.
- the sample can be obtained by a research technician. More than one sample from a subject can be obtained.
- the sample can be a biopsy, e.g., a skin biopsy.
- the biopsy can be from, for example, brain, liver, lung, heart, colon, kidney, or bone marrow. Any biopsy technique used by those skilled in the art can be used for isolating a sample from a subject.
- a biopsy can be an open biopsy, in which general anesthesia is used.
- the biopsy can be a closed biopsy, in which a smaller cut is made than in an open biopsy.
- the biopsy can be a core or incisional biopsy, in which part of the tissue is removed.
- the biopsy can be an excisional biopsy, in which attempts to remove an entire lesion are made.
- the biopsy can be a fine needle aspiration biopsy, in which a sample of tissue or fluid is removed with a needle.
- the sample can include immune cells.
- the immune cells can include T-cells and/or B-cells.
- T-cells T lymphocytes
- T-cells include, for example, cells that express T cell receptors.
- T-cells include Helper T cells (effector T cells or Th cells), cytotoxic T cells (CTLs), memory T cells, and regulatory T cells.
- the sample can include a single cell in some applications (e.g., a calibration test to define relevant T cells) or more generally at least 1,000, at least 10,000, at least 100,000, at least 250,000, at least 500,000, at least 750,000, or at least 1,000,000 T-cells.
- B-cells include, for example, plasma B cells, memory B cells, B1 cells, B2 cells, marginal-zone B cells, and follicular B cells.
- B-cells can express immunoglobulins (antibodies, B cell receptor).
- the sample can include a single cell in some applications (e.g., a calibration test to define relevant B cells) or more generally at least 1,000, at least 10,000, at least 100,000, at least 250,000, at least 500,000, at least 750,000, or at least 1,000,000 B-cells.
- the sample can include nucleic acid, for example, DNA (e.g., genomic DNA or mitochondrial DNA) or RNA (e.g., messenger RNA or microRNA).
- the nucleic acid can be cell-free DNA or RNA.
- the amount of RNA or DNA from a subject that can be analyzed includes, for example as low as a single cell in some applications (e.g., a calibration test) and as many as 10 millions of cells or more translating to a range of DNA of 6pg-60ug, and RNA of approximately 1pg-10ug.
- RNA or DNA can be sequenced in the methods of the provided invention.
- a recombined sequence from a T-cell or B-cell can also be referred to as a clonotype.
- the DNA or RNA can correspond to sequences from T-cell receptor (TCR) genes or immunoglobulin (Ig) genes that encode antibodies.
- TCR T-cell receptor
- Ig immunoglobulin
- the DNA and RNA can correspond to sequences encoding ⁇ , ⁇ , ⁇ , or ⁇ chains of a TCR.
- the TCR is a heterodimer consisting of an ⁇ -chain and ⁇ -chain.
- the TCR ⁇ chain is generated by VJ recombination, and the ⁇ chain receptor is generated by V(D)J recombination.
- VJ recombination For the TCRP chain, in humans there are 48 V segments, 2 D segments, and 13 J segments. Several bases may be deleted and others added (called N and P nucleotides) at each of the two junctions. In a minority of T-cells, the TCRs consist of ⁇ and ⁇ delta chains.
- the TCR ⁇ chain is generated by VJ recombination, and the TCR ⁇ chain is generated by V(D)J recombination ( Kenneth Murphy, Paul Travers, and Mark Walport, Janeway's Immunology 7th edition, Garland Science, 2007 , which is herein incorporated by reference in its entirety.
- the DNA and RNA analyzed in the methods of the provided invention can correspond to sequences encoding heavy chain immunoglobulins (IgH) with constant regions ( ⁇ , ⁇ , ⁇ , ⁇ , or ⁇ ) or light chain immunoglobulins (IgK or IgL) with constant regions ⁇ or ⁇ .
- Each antibody has two identical light chains and two identical heavy chains.
- Each chain is composed of a constant (C) and a variable region.
- the variable region is composed of a variable (V), diversity (D), and joining (J) segments.
- V variable
- D diversity
- J joining
- Diversity in the light chain is generated in a similar fashion except that there is no D region so there is only VJ recombination. Somatic mutation often occurs close to the site of the recombination, causing the addition or deletion of several nucleotides, further increasing the diversity of heavy and light chains generated by B-cells. The possible diversity of the antibodies generated by a B-cell is then the product of the different heavy and light chains. The variable regions of the heavy and light chains contribute to form the antigen recognition (or binding) region or site. Added to this diversity is a process of somatic hypermutation which can occur after a specific response is mounted against some epitope.
- Complementarity determining regions are sequences in the variable domains of antigen receptors (e.g., T cell receptor and immunoglobulin) that can complement an antigen.
- antigen receptors e.g., T cell receptor and immunoglobulin
- the chain of each antigen receptor contains three CDRs (CDR1, CDR2, and CDR3).
- CDR1, CDR2, and CDR3 The two polypeptides making T cells ( ⁇ and ⁇ ) and immunoglobulin (IgH and IgK or IgL) contribute to the formation of the three CDRs.
- CDR1 and CDR2 The part of CDR1 and CDR2 that is coded for by TCR ⁇ lies within one of 47 functional V segments. Most of the diversity of CDRs is found in CDR3, with the diversity being generated by somatic recombination events during the development of T lymphocytes.
- the BCR is composed of two genes IgH and IgK (or IgL) coding for antibody heavy and light chains.
- Three Complementarity Determining Region (CDR) sequences that bind antigens and MHC molecules have the most diversity in IgH and IgK (or IgL).
- the part of CDR1 and CDR2 coded for by IgH lies within one of 44 functional V segments.
- Most of the diversity in naive B cells emerges in the generation of CDR3 through somatic recombination events during the development of B lymphocytes. The recombination can generate a molecule with one of each of the V, D, and J segments.
- activated B cells undergo the process of isotype switching.
- Antibodies with the same variable segments can have different forms (isotypes) depending on the constant segment. Whereas all naive B cells express IgM (or IgD), activated B cells mostly express IgG but also IgM, IgA and IgE. This expression switching from IgM (and/or IgD) to IgG, IgA, or IgE occurs through a recombination event causing one cell to specialize in producing a specific isotype. There is one segment for each IgM, IgD, and IgE, two segments for IgA, and four segments for IgG.
- PCR Polymerase chain reaction
- TMA Transcription Mediated Amplification
- the nucleic acid from each cell can be analyzed separately, as each cell will carry its own unique signature.
- TCR ⁇ or immunoglobulin sequences can be amplified from nucleic acid in a multiplex reaction using at least one primer that anneals to the C region and one or more primers that can anneal to one or more V segments ( FIG. 2 and FIG. 4 ).
- the number of primers that anneal to V segments in a multiplex reaction can be, for example, at least 1, 2, 3, 4, 5, 6, 7, 8, 9, 10, 11, 12, 13, 14, 15, 16, 17, 18, 19, 20, 21, 22, 23, 24, 25, 26, 27, 28, 29, 30, 31, 32, 33, 34, 35, 36, 37, 38, 39, 40, 41, 42, 43, 44, 45, 46, 47, 48, 49, 50, 51, 52, 53, 54, 55, 56, 57, 58, 59, 60, 61, 62, 63, 64, 65, 66, 67, 68, 69, 70, 71, 72, 73, 74, 75, 76, 77, 78, 79, or 80.
- the number of primers that anneal to V segments in a multiplex reaction can be, for example, 10-60, 20-50, 30-50, 40-50, 20-40, 30-40, or 35-40.
- the primers can anneal to different V segments.
- multiple primers that anneal to each V segment can be used; for example, 1, 2, 3, 4, or 5 primers per V segment.
- the number of primers that anneal to C segments in a multiplex reaction can include, for example, at least 1, 2, 3, 4, 5, 6, 7, 8, 9, 10, 11, 12, 13, 14, or 15.
- the number of primers that anneal to C segments in a multiplex reaction can be 1-10, 2-9, 3-8,4-7,3-8, or 3-6.
- Amplification of TCR or immunoglobulin genes can occur as described in Example 3 and/or Example 4.
- the region to be amplified can include the full clonal sequence or a subset of the clonal sequence, including the V-D junction, D-J junction of an immunoglobulin or T-cell receptor gene, the full variable region of an immunoglobulin or T-cell receptor gene, the antigen recognition region, or a CDR, e.g., complementarity determining region 3 (CDR3).
- CDR3 complementarity determining region 3
- the TCR or immunoglobulin sequence can amplified using a primary and a secondary amplification step.
- Each of the different amplification steps can comprise different primers.
- the different primers can introduce sequence not original present in the immune gene sequence.
- the amplification procedure can add one or more tags to the 5' and/or 3' end of amplified TCR or immunoglobulin sequence ( FIG. 3 ).
- the tag can be sequence that facilitates subsequent sequencing of the amplified DNA.
- the tag can be sequence that facilitates binding the amplified sequence to a solid support.
- a specific primer can be used from the C segment and a generic primer can be put in the other side (5').
- the generic primer can be appended in the cDNA synthesis through different methods including the well described methods of strand switching.
- the generic primer can be appended after cDNA making through different methods including ligation.
- RNA sequence based amplification examples include, for example, reverse transcription-PCR, real-time PCR, quantitative real-time PCR, digital PCR (dPCR), digital emulsion PCR (dePCR), clonal PCR, amplified fragment length polymorphism PCR (AFLP PCR), allele specific PCR, assembly PCR, asymmetric PCR (in which a great excess of primers for a chosen strand is used), colony PCR, helicase-dependent amplification (HDA), Hot Start PCR, inverse PCR (IPCR), in situ PCR, long PCR (extension of DNA greater than about 5 kilobases), multiplex PCR, nested PCR (uses more than one pair of primers), single-cell PCR, touchdown PCR, loop-mediated isothermal PCR (LAMP), and nucleic acid sequence based amplification (NASBA).
- Other amplification schemes include: Ligase Chain Reaction, Branch DNA Amplification, Rolling Circle Amplification
- RNA in a sample can be converted to cDNA by using reverse transcription.
- PolyA primers, random primers, and/or gene specific primers can be used in reverse transcription reactions.
- the individual nucleic acid molecules can be isolated, optionally re-amplified, and then sequenced individually.
- Polymerases that can be used for amplification in the methods of the provided invention include, for example, Taq polymerase, AccuPrime polymerase, or Pfu.
- the choice of polymerase to use can be based on whether fidelity or efficiency is preferred.
- individual cells in a sample are isolated. Two or more sequences from each isolated cell can be linked together. For example, sequences from TCR ⁇ and TCR ⁇ genes or IgH and IgK genes from an individual cell can be linked, for example by an amplification scheme ( FIGs. 9-13 ) or a ligation scheme. The linked TCR ⁇ and TCR ⁇ or IgH and IgK sequences for isolated cells can optionally be reamplified. The linked amplification products can be optionally repooled after amplification.
- Methods for isolation of nucleic acids from a pool include subcloning nucleic acid into DNA vectors and transforming bacteria (bacterial cloning), spatial separation of the molecules in two dimensions on a solid substrate (e.g., glass slide), spatial separation of the molecules in three dimensions in a solution within micelles (such as can be achieved using oil emulsions with or without immobilizing the molecules on a solid surface such as beads), or using microreaction chambers in, for example, microfluidic or nano-fluidic chips. Dilution can be used to ensure that on average a single molecule is present in a given volume, spatial region, bead, or reaction chamber.
- Real time PCR, picogreen staining, nanofluidic electrophoresis (e.g. LabChip) or UV absorption measurements can be used in an initial step to judge the functional amount of amplifiable material.
- Methods for re-amplification of nucleic acids include bacterial growth of isolated colonies transformed with nucleic acid, amplification on a slide (e.g., PCR colonies (polonies)), and amplification on a bead.
- the same method can be use to amplify and re-amplify the nucleic acid or a different method can be used to amplify and reamplify the nucleic acid.
- the subcloning steps include a step in which a common primer is attached to the DNA or RNA through an amplification or ligation step. This primer is then used to amplify the clones and as a recognition sequence for hybridization of a primer for sequencing ( FIG. 2 ).
- nucleic acids are analyzed from a subset of cells.
- a method to separate cells can be employed.
- cells can be isolated by cell sorting flow-cytometry, flow-sorting, fluorescent activated cell sorting (FACS), bead based separation such as magnetic cell sorting (MACS; e.g., using antibody coated magnetic particles), size-based separation (e.g., a sieve, an array of obstacles, or a filter), sorting in a microfluidics device, antibody-based separation, sedimentation, affinity adsorption, affinity extraction, or density gradient centrifugation.
- FACS fluorescent activated cell sorting
- MCS magnetic cell sorting
- size-based separation e.g., a sieve, an array of obstacles, or a filter
- Sorting in a microfluidics device antibody-based separation, sedimentation, affinity adsorption, affinity extraction, or density gradient centrifugation.
- Cells can be purified by laser capture microdissection.
- Sorting can be based on cell size, morphology, or intracellular or extracellular markers. Methods for isolating or sorting tumor cells are described, for example, in Nagrath S. et al. (2007) Nature 450:1235-1239 ; US Patent Nos. 6008002 , 7232653 , and 7332288 ; PCT Publication No. WO2008157220A1 ; and US Patent Application Nos. US20080138805A1 and US20090186065 ; and Rosenberg R. et al. (2002) Cytometry 49:150-158 , each of which is herein incorporated by reference in their entireties.
- the subset of cells can be a subset of T-cells and/or B-cells.
- the subset of T cells can be CD4+, CD8+, or CD27 high cells.
- Fluorescence-activated cell sorting uses light scattering and fluorescent characteristics to sort cells.
- a fluorescent property can be imparted on a cell using, e.g., nucleic acid probes or antibodies conjugated to a fluorescent dye.
- a cell suspension can form a stream of flowing liquid. The stream of cells forms drops that contain approximately one cell per drop. Before the stream forms drops, a fluorescent characteristic of each cell is measured.
- a charge is placed on an electrical charging ring prior to fluorescence intensity measurement and the opposite charge is carried on the drop as it breaks from the stream.
- the charged drops pass through two high voltage deflection plates that divert drops into different containers based upon their charge. The charge can be directly applied to the stream and the drop breaking off retains the charge of the same sign as the stream. The stream is then returned to neutral after the drop breaks off.
- Direct or indirect immunofluorescence can be used in FACS.
- direct immunofluorescence an antibody is directly conjugated to a fluorescent dye.
- indirect immunofluorescence the primary antibody is not labeled, and a secondary antibody is conjugated to a fluorescent dye.
- individual cells from a sample can be isolated. Sequence information from two more genes in a cell can be linked together.
- a sample can be from a patient with an autoimmune disease, and sequence information from TCR ⁇ and TCR ⁇ genes from spatially isolated cells from the sample can be physically linked by, for example, an amplification scheme or a ligation scheme.
- the linked TCR ⁇ and TCR ⁇ sequences can optionally be amplified and/or pooled with linked sequences from other cells.
- the linked sequences can alternatively be for IgH and IgK or for IgH and IgL
- DNA sequencing techniques include classic dideoxy sequencing reactions (Sanger method) using labeled terminators or primers and gel separation in slab or capillary, sequencing by synthesis using reversibly terminated labeled nucleotides, pyrosequencing, 454 sequencing, allele specific hybridization to a library of labeled oligonucleotide probes, sequencing by synthesis using allele specific hybridization to a library of labeled clones that is followed by ligation, real time monitoring of the incorporation of labeled nucleotides during a polymerization step, polony sequencing, and SOLiD sequencing.
- the sequencing technique used in the methods of the provided invention can generate least 1000 reads per run, at least 10,000 reads per run, at least 100,000 reads per run, at least 500,000 reads per run, or at least 1,000,000 reads per run.
- the sequencing technique used in the methods of the provided invention can generate about 30 bp, about 40 bp, about 50 bp, about 60 bp, about 70 bp, about 80 bp, about 90 bp, about 100 bp, about 110, about 120 bp per read, about 150 bp, about 200 bp, about 250 bp, about 300 bp, about 350 bp, about 400 bp, about 450 bp, about 500 bp, about 550 bp, or about 600 bp per read.
- the sequencing technique used in the methods of the provided invention can generate at least 30, 40, 50, 60, 70, 80, 90, 100, 110, 120, 150, 200, 250, 300, 350,400, 450, 500, 550, or 600 bp per read.
- a sequencing technique that can be used in the methods of the provided invention includes, for example, Helicos True Single Molecule Sequencing (tSMS) ( Harris T.D. et al. (2008) Science 320:106-109 ).
- tSMS Helicos True Single Molecule Sequencing
- a DNA sample is cleaved into strands of approximately 100 to 200 nucleotides, and a polyA sequence is added to the 3' end of each DNA strand.
- Each strand is labeled by the addition of a fluorescently labeled adenosine nucleotide.
- the DNA strands are then hybridized to a flow cell, which contains millions of oligo-T capture sites that are immobilized to the flow cell surface.
- the templates can be at a density of about 100 million templates/cm 2 .
- the flow cell is then loaded into an instrument, e.g., HeliScopeTM sequencer, and a laser illuminates the surface of the flow cell, revealing the position of each template.
- a CCD camera can map the position of the templates on the flow cell surface.
- the template fluorescent label is then cleaved and washed away.
- the sequencing reaction begins by introducing a DNA polymerase and a fluorescently labeled nucleotide.
- the oligo-T nucleic acid serves as a primer.
- the polymerase incorporates the labeled nucleotides to the primer in a template directed manner. The polymerase and unincorporated nucleotides are removed.
- the templates that have directed incorporation of the fluorescently labeled nucleotide are detected by imaging the flow cell surface. After imaging, a cleavage step removes the fluorescent label, and the process is repeated with other fluorescently labeled nucleotides until the desired read length is achieved. Sequence information is collected with each nucleotide addition step.
- 454 sequencing involves two steps. In the first step, DNA is sheared into fragments of approximately 300-800 base pairs, and the fragments are blunt ended. Oligonucleotide adaptors are then ligated to the ends of the fragments. The adaptors serve as primers for amplification and sequencing of the fragments.
- the fragments can be attached to DNA capture beads, e.g., streptavidin-coated beads using, e.g., Adaptor B, which contains 5'-biotin tag.
- the fragments attached to the beads are PCR amplified within droplets of an oil-water emulsion. The result is multiple copies of clonally amplified DNA fragments on each bead.
- the beads are captured in wells (pico-liter sized). Pyrosequencing is performed on each DNA fragment in parallel. Addition of one or more nucleotides generates a light signal that is recorded by a CCD camera in a sequencing instrument. The signal strength is proportional to the number of nucleotides incorporated.
- Pyrosequencing makes use of pyrophosphate (PPi) which is released upon nucleotide addition.
- PPi is converted to ATP by ATP sulfurylase in the presence of adenosine 5' phosphosulfate.
- Luciferase uses ATP to convert luciferin to oxyluciferin, and this reaction generates light that is detected and analyzed.
- SOLiD sequencing genomic DNA is sheared into fragments, and adaptors are attached to the 5' and 3' ends of the fragments to generate a fragment library.
- internal adaptors can be introduced by ligating adaptors to the 5' and 3' ends of the fragments, circularizing the fragments, digesting the circularized fragment to generate an internal adaptor, and attaching adaptors to the 5' and 3' ends of the resulting fragments to generate a mate-paired library.
- clonal bead populations are prepared in microreactors containing beads, primers, template, and PCR components. Following PCR, the templates are denatured and beads are enriched to separate the beads with extended templates. Templates on the selected beads are subjected to a 3' modification that permits bonding to a glass slide.
- the sequence can be determined by sequential hybridization and ligation of partially random oligonucleotides with a central determined base (or pair of bases) that is identified by a specific fluorophore. After a color is recorded, the ligated oligonucleotide is cleaved and removed and the process is then repeated.
- SOLEXA sequencing is based on the amplification of DNA on a solid surface using fold-back PCR and anchored primers. Genomic DNA is fragmented, and adapters are added to the 5' and 3' ends of the fragments. DNA fragments that are attached to the surface of flow cell channels are extended and bridge amplified. The fragments become double stranded, and the double stranded molecules are denatured. Multiple cycles of the solid-phase amplification followed by denaturation can create several million clusters of approximately 1,000 copies of single-stranded DNA molecules of the same template in each channel of the flow cell.
- Primers DNA polymerase and four fluorophore-labeled, reversibly terminating nucleotides are used to perform sequential sequencing. After nucleotide incorporation, a laser is used to excite the fluorophores, and an image is captured and the identity of the first base is recorded. The 3' terminators and fluorophores from each incorporated base are removed and the incorporation, detection and identification steps are repeated.
- SMRT single molecule, real-time
- each of the four DNA bases is attached to one of four different fluorescent dyes. These dyes are phospholinked.
- a single DNA polymerase is immobilized with a single molecule of template single stranded DNA at the bottom of a zero-mode waveguide (ZMW).
- ZMW zero-mode waveguide
- a ZMW is a confinement structure which enables observation of incorporation of a single nucleotide by DNA polymerase against the background of fluorescent nucleotides that rapidly diffuse in an out of the ZMW (in microseconds). It takes several milliseconds to incorporate a nucleotide into a growing strand.
- the fluorescent label is excited and produces a fluorescent signal, and the fluorescent tag is cleaved off. Detection of the corresponding fluorescence of the dye indicates which base was incorporated. The process is repeated.
- a nanopore is a small hole, of the order of 1 nanometer in diameter. Immersion of a nanopore in a conducting fluid and application of a potential across it results in a slight electrical current due to conduction of ions through the nanopore. The amount of current which flows is sensitive to the size of the nanopore. As a DNA molecule passes through a nanopore, each nucleotide on the DNA molecule obstructs the nanopore to a different degree. Thus, the change in the current passing through the nanopore as the DNA molecule passes through the nanopore represents a reading of the DNA sequence.
- a sequencing technique that can be used in the methods of the provided invention involves using a chemical-sensitive field effect transistor (chemFET) array to sequence DNA (for example, as described in US Patent Application Publication No. 20090026082 ).
- chemFET chemical-sensitive field effect transistor
- DNA molecules can be placed into reaction chambers, and the template molecules can be hybridized to a sequencing primer bound to a polymerase.
- Incorporation of one or more triphosphates into a new nucleic acid strand at the 3' end of the sequencing primer can be detected by a change in current by a chemFET.
- An array can have multiple chemFET sensors.
- single nucleic acids can be attached to beads, and the nucleic acids can be amplified on the bead, and the individual beads can be transferred to individual reaction chambers on a chemFET array, with each chamber having a chemFET sensor, and the nucleic acids can be sequenced.
- Another example of a sequencing technique that can be used in the methods of the provided invention involves using a electron microscope ( Moudrianakis E.N. and Beer M. .Proc Natl Acad Sci U S A. 1965 Mar;53:564-71 ).
- individual DNA molecules are labeled using metallic labels that are distinguishable using an electron microscope. These molecules are then stretched on a flat surface and imaged using an electron microscope to measure sequences.
- Sequences can be read that originate from a single molecule or that originate from amplifications from a single molecule. Millions of independent amplifications of single molecules can be performed in parallel either on a solid surface or in tiny compartments in water/oil emulsion.
- the DNA sample to be sequenced can be diluted and/or dispersed sufficiently to obtain one molecule in each compartment. This dilution can be followed by DNA amplification to generate copies of the original DNA sequences and creating "clusters" of molecules all having the same sequence. These clusters can then be sequenced. Many millions of reads can be generated in one run.
- Sequence can be generated starting at the 5' end of a given strand of an amplified sequence and/or sequence can be generated from starting from the 5' end of the complementary sequence.
- sequence from strands is generated, i.e. paired end reads.
- the prevalence of a particular sequence in the original DNA sequence can then be measured by counting how many clusters carry that sequence. More prevalent sequences in the original sample lead to more compartments and more clusters containing the specific sequences.
- Methods can be used in the amplification schemes to ensure that the frequency of the DNA sequences measured matches the frequency of the DNA sequence in the original sample.
- the methods can include ensuring that PCR primer concentration are high enough to drive each hybridization reaction to saturation in each cycle, adjusting individual primer concentrations to minimize the differential amplification of different sequences, etc.
- Algorithms can be used to determine which sequences generated by the sequencer originate from the DNA sequence. Individually measured sequences (reads) may be offset relative to each other, contain errors introduced by amplification and/or by sequencing. An algorithm can be used to combine reads together to more accurately determine the frequency of a DNA sequence in the starting material.
- a million sequencing reads or more for IgH and/or TCR ⁇ originally amplified from a blood sample comprising DNA or RNA can be obtained.
- the number of reads for a specific IgH or TCR ⁇ sequence relate to the frequency of the specific clonotype in the blood sample. Therefore, the quantity of each of the clonotypes can be determined. If the pathogenic clonotypes for a particular patient are known, their level can be determined accurately through this sequencing approach.
- a collection of DNA molecules including a representation of the genomic DNA or reverse transcribed RNA from the TCR and BCR regions of immune cells from one or more subjects is extracted and optionally amplified in such a way that each molecule can be sequenced using one or more of the sequencing techniques described above in order to be able to detect the presence and frequency of sequences in a subject.
- Different regions of immunoglobulin or T cell receptor genes can be sequenced.
- the full sequence of the variable regions can be sequenced to identify and quantify a clonotype.
- a unique subset of the full clonal sequences can be sequenced.
- nucleotides comprising the VD and the DJ junctions are sequenced to uniquely identify and quantify a clonotype.
- the fragment that can be sequenced is the full variable region.
- the antigen recognition region or the complementarity determining region 3 (CDR3) is sequenced.
- a fragment containing the full CDR3 or the full variable region can be amplified to allow the sequencing of the CDR3 comprising parts of the V, D, and J segments.
- One or more tags on amplified products can be used for sequencing immunoglobulin or T cell receptor genes.
- One or more primers that anneal to the tags can be used in the sequencing reactions. Different sections of an amplified molecule can be sequenced in separate reactions, and the sequencing results can be pieced together to generate a partial or a full sequence of the molecule.
- only the CDR3 is amplified and sequenced.
- Amplification and sequencing of the CDR3 can be accomplished by using primers specific to one or more V segment sequences (as well as one or more primer(s) on the other side of the amplicon in the C segment).
- Primers for each of the V segments can be utilized in one or more amplification reactions leading to the amplification of the full repertoire of sequences. This repertoire of sequences can then be mixed and subjected to separation, with or without amplification, and sequenced using any of the sequencing techniques described.
- the amplification with the various V primers is done in separate tubes, the number of molecules carrying the different V segments can be "normalized" due to PCR saturation.
- V segment had one or several clonal expansions leading to its representation more than other segments this information may be erased or decreased since the PCR reaction for each segment can be driven to saturation or close to it.
- Real time PCR can be used to quantify how much of each V segment is present.
- the full CDR3 can be sequenced, or a subset of the sequence CDR3 can be sequenced.
- only a subset of clonotypes is analyzed. This can be accomplished by amplifying with a primer specific to the subset of clonotypes, for example, a primer that is specific to the V segment.
- Unique clonotypes can be identified by sequencing with long contiguous reads that provide full connectivity.
- a short read length across only one of the junctions can generate degenerate tags that are not unique to a specific clonotype but are shared among multiple clonotypes. For example sequencing across the V/J junction can lump all the sequences with the same V/J irrespective of the D segment as one clonotype.
- Information on the full connectivity of all segments allows sequences to be distinguished that may share the same V and J segments but are connected to different D segments, for example.
- TCR the light chain of an antibody or the ⁇ subunit in TCR.
- V and D the light chain of an antibody or the ⁇ subunit in TCR.
- BCR the full diversity of TCR and BCR incorporates both subunits.
- Errors generated by sequencing and/or by amplification can be taken into account when generating the clonotype profile. For example, see Example 5.
- the initial amplification can be done from DNA or RNA (e.g., after conversion to cDNA).
- the vast repertoire of T and B cell receptor sequences creates a challenge in finding individual cells that are correlated with specific human health outcomes.
- sequences of clonotypes that will be of interest will be unique to the individual being studied.
- the methods of the present invention provide means for distinguishing a) correlating clonotypes (which can be those clonotypes whose level correlate with disease) from b) non-correlating clonotypes (which can be those clonotypes whose levels do not correlate with disease).
- a correlating clonotype can display either positive or negative correlation with disease.
- a clonotype present at a peak state of a disease but not present at a non-peak state of a disease can be a correlating clonotype (positive correlation with disease).
- a clonotype that is more abundant (i.e. is present at a higher level of molecules) in a peak state (or stage) of a disease than at a non-peak state of the disease can be a correlating clonotype (positive correlation with the disease).
- a clonotype absent at a peak state of a disease but present during a non-peak state of the disease can be a correlating clonotype (negative correlation with disease).
- a clonotype that is less abundant at a peak state of a disease than at a non-peak state of a disease can be a correlating clonotype (negative correlation with disease).
- a correlating clonotype for an individual is determined by an algorithm.
- correlating clonotypes are identified by looking at the clonotypes present in some sample that has relevance to a disease state (e.g., see FIG. 14 ).
- This state could be blood from a sample at a peak state of disease (e.g. a blood sample from an MS or lupus patient during an acute flare), or affected tissue that is presumed to be enriched for T and B cells involved in the disease for that individual.
- a peak state of disease e.g. a blood sample from an MS or lupus patient during an acute flare
- affected tissue that is presumed to be enriched for T and B cells involved in the disease for that individual.
- these tissues could be kidney biopsies of lupus patients with kidney inflammations, CSF in MS patients during a flare, synovial fluid for rheumatoid arthritis patients, or tumor samples from cancer patients.
- the tissues will contain relevant T and B cells that are related to the disease (though not necessarily the causative agents). It is notable that if this method is used to identify the clonotypes that are relevant to disease, they will only be relevant to the individual in whose sample they were detected. As a result, a specific calibration test will be needed in order to use this method to identify correlating clonotypes in any given individual with a disease.
- a method for determining one or more correlating clonotypes in a subject can include steps for a) generating one or more clonotype profiles by nucleic acid sequencing individual, spatially isolated molecules from at least one sample from the subject, wherein the at least one sample is related to a first state of the disease, and b) determining one or more correlating clonotypes in the subject based on the one or more clonotype profiles.
- At least one sample is from a tissue affected by the disease.
- said determination of one or more correlating clonotypes comprises comparing clonotype profiles from at least two samples.
- the first state of the disease is a peak state of the disease.
- one or more correlating clonotypes are present in the peak state of the disease.
- the one or more correlating clonotypes are absent in the peak state of the disease.
- one or more correlating clonotypes are high in the peak state of the disease.
- one or more correlating clonotypes are low in the peak state of the disease.
- the sample comprises T-cells and/or B-cells.
- the T-cells and/or B-cells comprise a subset of T-cells and/or B-cells.
- the subset of T-cells and/or B-cells are enriched by interaction with a marker.
- the marker is a cell surface marker on the subset of T-cells and/or B-cells.
- the subset of T-cells and/or B-cells interacts with an antigen specifically present in the disease.
- the disease is an autoimmune disease.
- the autoimmune disease is systemic lupus erythematosus, multiple sclerosis, rheumatoid arthritis, or Ankylosing Spondylitis.
- a method for identifying correlating clonotypes using a population study (e.g., see FIG. 15 ).
- the utility of the population study is that it allows the specific information about correlating clonotypes that have been ascertained in individuals with known disease state outcomes to be generalized to allow such correlating clonotypes to be identified in all future subjects without the need for a calibration test.
- Knowledge of a specific set of correlating clonotypes can be used to extract rules about the likely attributes (parameters) of clonotypes that will correlate in future subjects.
- the provided invention encompasses methods that include identifying correlating and non correlating clonotypes by sequencing the immune cell repertoire in a study of samples from patients with disease(s) and optionally healthy controls at different times and, in the case of the patients with a disease, at different (and known) states of the disease course characterized by clinical data.
- the disease can be, for example, an autoimmune disease.
- the clonotypes whose level is correlated with measures of disease in these different states can be used to develop an algorithm that predicts the identity of a larger set of sequences that will correlate with disease as distinct from those that will not correlate with disease in all individuals. Unlike the case of the calibration test, correlating sequences need not have been present in the discovery study but can be predicted based on these sequences.
- a correlating sequence can be TCR gene DNA sequence that encodes the same amino acid sequence as the DNA sequence of a clonotype identified in the discovery study.
- the algorithm that can predict one or more correlating clonotypes can be used to identify clonotypes in a sample from any individual and is in no way unique to a given individual, thus allowing the correlating clonotypes to be predicted in a novel sample without prior knowledge of the clonotypes present in that individual.
- a method for developing an algorithm that predicts one or more correlating clonotypes in any sample from a subject with a disease comprising: a) generating a plurality of clonotype profiles from a set of samples, wherein the samples are relevant to the disease, b) identifying one or more correlating clonotypes from the set of samples, c) using sequence parameters and/or functional data from one or more correlating clonotypes identified in b) to develop an algorithm that can predict correlating clonotypes in any sample from a subject with the disease.
- the set of samples are taken from one or more tissues affected by the disease.
- the identifying one or more correlating clonotypes comprises comparing clonotype profiles from at least two samples.
- the functional data include binding ability of markers in T-cell and/or B-cells or interaction with antigen by a T-cell or B cell.
- said sequence parameters comprise nucleic acid sequence and predicted amino acid sequence.
- the samples are from one or more individuals at a peak stage of the disease.
- said one or more correlating clonotypes are present in the peak state of the disease.
- said one or more correlating clonotypes are at a high level in the peak state of the disease.
- one or more correlating clonotypes are at a low level in the peak state of the disease.
- one or more correlating clonotypes are absent at the peak state of the disease.
- the disease is an autoimmune disease.
- the autoimmune disease is systemic lupus erythematosus, multiple sclerosis, rheumatoid arthritis, or Ankylosing Spondylitis.
- a method for discovering one or more correlating clonotypes for an individual comprising a) inputting a clonotype profile from a sample from the individual into an algorithm, and b) using the algorithm to determine one or more correlating clonotypes for the individual.
- the algorithm can be an algorithm developed by: a) generating a plurality of clonotype profiles from a set of samples, wherein the samples are relevant to the disease, b) identifying one or more correlating clonotypes from the set of samples, and c) using sequence parameters and/or functional data from one or more correlating clonotypes identified in b) to develop the algorithm that can predict correlating clonotypes in any sample from a subject with the disease.
- the correlating clonotypes are identified by using a calibration test combined with a population study (e.g., see FIG. 17 ).
- the population study does not result in an algorithm that allows clonotypes to be predicted in any sample but rather it allows an algorithm to be developed to predict correlating clonotypes in any sample from a subject for whom a particular calibration clonotype profile has been generated (e.g., see FIG. 16 ).
- the provided invention encompasses methods for identifying correlating and non-correlating clonotypes by sequencing the immune cell repertoire in a study of samples from patients of disease(s) and optionally healthy controls at different times and, in the case of the patients with a disease, at different (and known) states of the disease course characterized by clinical data.
- the clonotypes that are found at different frequency (or level) in the first state than in the second state are then used to develop an algorithm that predicts which of the sequences found in the repertoires of each individual at the first disease state will correlate with disease at the later state in each individual as distinct from those that will not correlate with disease in that individual.
- correlating sequences may be a subset of all the sequences found to be different between disease states. It is also possible that correlating clonotypes are not found in the calibration sample but are predicted based on the algorithm to be correlating if they appear in a future sample. As an example, a clonotype that codes for the same amino acid sequence as a clonotype found in a calibration sample may be predicted to be a correlating clonotype based on the algorithm that results from the population study.
- the algorithm is developed to predict the correlating clonotypes based on a calibration clonotype profile which is a clonotype profile generated in the individual for whom the correlating clonotypes are to be predicted which at a specific state of disease.
- the algorithm cannot be used to generate correlating clonotypes in a particular individual until a specific calibration clonotype profile has been measured. After this calibration profile has been measured in a particular subject, all subsequent correlating clonotypes can be predicted based on the measurement of the clonotype profiles in that individual.
- a method for discovering one or more correlating clonotypes for an individual comprising a) inputting a clonotype profile from a sample from the individual into an algorithm, and b) using the algorithm to determine one or more correlating clonotypes for the individual.
- the algorithm can be an algorithm developed by: a) generating a plurality of clonotype profiles from a set of samples, wherein the samples are relevant to the disease, b) identifying one or more correlating clonotypes from the set of samples, and c) using sequence parameters and/or functional data from one or more correlating clonotypes identified in b) to develop an algorithm that can predict correlating clonotypes in any sample from a subject with the disease.
- the sample is at taken at a peak state of disease.
- the sample is taken from disease affected tissue.
- a training set can be used to understand the characteristics of correlating clonotypes by testing various parameters that can distinguish those correlating clonotypes from those that do not. These parameters include the sequence or the specific V, D, and J segments used. In one embodiment it is shown that specific V segments are more likely to correlate with some diseases as is the case if the clonotypes for a specific disease are likely to recognize related epitopes and hence may have sequence similarity. Other parameters included in further embodiments include the extent of hypersomatic mutation identified and the level of a clonotype at the peak of an episode and its level when the disease is relatively inactive.
- Other parameters that may predict correlating clonotypes include without limitation: 1) sequence motifs including V or J region, a combination VJ, short sequences in DJ region; 2) Sequence length of the clonotype; 3) Level of the clonotype including absolute level (number of clones per million molecules) or rank level; 4) Amino acid and nucleic acid sequence similarity to other clonotypes: the frequency of other highly related clonotypes, including those with silent changes (nucleotide differences that code for same amino acids) or those with conservative amino acid changes; 5) For the BCRs the level of somatic mutations in the clonotype and/or the number of distinct clonotypes that differ by somatic mutations from some germline clonotypes; 6) clonotypes whose associated proteins have similar 3 dimensional structures.
- T- cells and/or B-cells containing certain markers that are enriched in cells containing correlating clonotypes can be captured through standard methods like FACS or MACS.
- the marker is a cell-surface marker.
- T-cells and/or B-cells reactivity to an antigen relevant to the pathology or to affected tissue would be good evidence of the pathological relevance of a clonotype.
- sequence of the candidate clonotypes can be synthesized and put in the context of the full TCR or BCR and assessed for the relevant reactivity.
- the amplified fragments of the different sequences can be used as an input to phage, ribosome, or RNA display techniques. These techniques can select for the sequences with the relevant reactivity. The comparison of the sequencing results for those before and after the selection can identify those clones that have the reactivity and hence are likely to be pathological.
- the specific display techniques for example phage, ribosome, or RNA display
- the individual molecules (or amplifications of these individual molecules) carrying individual sequences from the TCR or BCR can be arrayed either as phages, ribosomes, or RNA. Specific antigens can then be studied to identify the sequence(s) that code for peptides that bind them. Peptides binding antigens relevant to the disease are likely to be pathological.
- An algorithm can be used to compute an Immune Load (e.g., see FIG. 18 ).
- the Immune Load can be used to make a clinical decision.
- data from an experiment e.g., an experiment comprising samples from subjects in a first state of a disease and samples from subjects in a second state of the disease
- an algorithm can be developed that combines the information about the levels of the correlating and non-correlating clonotypes into a single score (Immune Load).
- the parameters of this algorithm can then be adjusted to maximize the correlation between Immune Load and the clinical data.
- the clinical data can be a clinical measure of disease severity (e.g., the extent of lesions on an MRI for a multiple sclerosis patient).
- the correlating clonotypes used in generating a Immune Load algorithm can be generated using a calibration test, a population study, or a calibration test and a population study as described above.
- Some of the factors that can be considered in combining the correlating clonotypes are the number of correlating clonotypes, their level, their rate of change (velocity), and the rate of change in the velocity (acceleration). Other factors to be assessed include the level of the clonotypes at the episode peak and at the inactive disease state
- the Immune Load generated relates to an autoimmune disease.
- a Load can be referred to as an AutoImm Load.
- a method for generating an algorithm that calculates a disease activity score comprising: a) developing an algorithm that uses a set of factors to combine levels of correlating clonotypes into a disease activity score, b) comparing the disease activity score to clinical data regarding the disease state, and c) optimizing the factors in order to maximize the correlation between clinical data and the disease activity score.
- the clonotypes and the Immune Load algorithm are determined using a population study (e.g., see FIG. 19 ).
- Immune Load can be used directly without having to first calibrate the individual patient. This test can be done when the patient is in any disease state. This test can be used to generate specific correlating and non-correlating clonotypes based on the algorithm developed above. Immune Load can then be calculated using the second algorithm generated in a population study. This score can then be used clinically.
- a method for monitoring the disease state of a individual comprising: a) determining a clonotype profile from a sample from a subject, b) inputting the clonotype profile information from a) into an algorithm, and c) using the algorithm to generate a score predictive of the disease state of the individual.
- the algorithm can be an algorithm generated by a) developing an algorithm that uses a set of factors to combine levels of correlating clonotypes into a disease activity score, b) comparing the disease activity score to clinical data regarding the disease state, and c) optimizing the factors in order to maximize the correlation between clinical data and the disease activity score.
- the correlating clonotypes and the Immune Load algorithm are determined using a calibration test or calibration test and a population study (e.g., see FIG. 20 ).
- Immune Load can be used in the clinic by first conducting a calibration test. This test can be done when the patient is in a state which is similar to the first state used in the study that generated the correlating and non-correlating clonotypes that are used in the Immune Load algorithm. For example, this state can be a flare state of an autoimmune disease if this is how the Immune Load algorithm was derived.
- This calibration test can then be used to generate the specific correlating and non-correlating clonotypes to be used in the subsequent disease monitoring tests.
- a method for monitoring the disease state of a individual comprising: a) determining a clonotype profile from a sample from a subject, b) inputting the clonotype profile information from a) into an algorithm, and c) using the algorithm to generate a score predictive of the disease state of the individual.
- the algorithm can be an algorithm generated a) developing an algorithm that uses a set of factors to combine levels of correlating clonotypes into a disease activity score, b) comparing the disease activity score to clinical data regarding the disease state, and c) optimizing the factors in order to maximize the correlation between clinical data and the disease activity score.
- the method can further comprise determining one or more correlating clonotypes in the individual by any of the methods of the provided invention, and inputting information the one or more correlating clonotypes into the algorithm.
- the disease is an autoimmune disease.
- the autoimmune disease is systemic lupus erythematosus, multiple sclerosis, rheumatoid arthritis, or Ankylosing Spondylitis.
- the same Immune Load may mean different things for different patients. For one, the full clinical picture of a patient needs to be considered. From a testing perspective, one may consider the velocity (rate of change of Immune Load over time) and acceleration (rate of change of velocity over time) in addition to the level of Immune Load in making clinical decisions. For example if the AutoImm Load score is increasing (high velocity) it may be predictive of an incipient flare in an autoimmune disease.
- Additional tests that can be integrated in the Load score include, for example, erythrocyte sedimentation rate (ESR), C-reactive protein (CRP) levels, Anti-ds DNA, other autoantibody titers, complement levels, urine protein levels, Urine protein/creatinine ratio, creatinine levels, blood urea nitrogen (BUN) levels, platelet levels, WBC counts, hematorcrit (Hct), Hb, urinalysis results.
- ESR erythrocyte sedimentation rate
- CRP C-reactive protein
- Anti-ds DNA other autoantibody titers
- complement levels urine protein levels
- Urine protein/creatinine ratio creatinine levels
- BUN blood urea nitrogen
- BUN blood urea nitrogen
- WBC counts hematorcrit
- Hb hematorcrit
- urinalysis results include, for example, CD27 level, CD27++ cell level, INF-responsive genes ( Baechler, EC et al. (2003) Proc. Nat
- TSH thyroid-stimulating hormone
- T3 triiodothyronine
- T4 thyroxine
- LFTs liver function tests
- calprotectin test lactoferrin test
- synovial fluid analysis can include imaging test, including, for example, MRI, CT-scan, X-ray, and ultrasound.
- This invention teaches the ability to use the immune system to understand underlying disease state when it is mediated by the immune system. This allows a very powerful set of diagnostic and prognostic applications that use the immune profiles to inform the risks of wide variety of clinical outcomes and allow physicians to intervene more effectively.
- Autoimmune disease involves adaptive immune cells escaping the usual process conferring autoimmunity and attacking some target(s) on bodily tissue.
- Autoimmune diseases include, for example, acute disseminated encephalomyelitis, Addison's disease, ankylosing spondylitis, antiphospholipid antibody syndrome, autoimmune hemolytic anemia, autoimmune hepatitis, autoimmune inner ear disease, Behçet's disease, bullous pemphigoid, Celiac disease, Chagas disease, Chronic obstructive pulmonary disease, dermatomyositis, diabetes mellitus type 1, Goodpasture's syndrome, Graves' disease, Guillain-Barre syndrome, Hashimoto's thyroditis, Hidradenitis suppurativa, Idiopathic thrombocytopenic purpura, Interstitial cystitis, multiple sclerosis, myasthenia gravis
- Clinical information regarding a subject with an autoimmune disease, or suspected of having an autoimmune disease can be used to determine the disease state (or AutoImm load).
- Clinical information can be used to identify patterns of a clonotype profile that correlate with a disease state.
- Clinical information can include, for example, height, weight, eye color, age, gender, ethnic group, blood pressure, LDL cholesterol levels, HDL cholesterol levels, family medical history, and molecular marker information.
- Clinical information can include symptoms of one or more autoimmune diseases.
- autoimmune hepatitis symptoms can include fatigue, hepatomegaly, jaundice, pruritus, skin rash, arthralgia, abdominal discomfort, spider angiomas, nausea, vomiting, anorexia, dark urine, pale or gray stools.
- symptoms can include rash (patchy, bluish-purple discolorations on the face, neck, shoulders, upper chest, elbows, knees, knuckles and back) accompanying or preceding muscle weakness, dysphagia, myalgia, fatigue, weight loss and low-grade fever.
- symptoms can include weight loss due to increased energy expenditure, increased appetite, heart rate and blood pressure, and tremors, nervousness and sweating.
- symptoms can include mental and physical slowing, greater sensitivity to cold, weight gain, coarsening of the skin, goiter.
- MCTD mixed connective tissue disease
- symptoms can include features of systemic lupus erythematosus (SLE), scleroderma and polymyositis.
- SLE systemic lupus erythematosus
- scleroderma scleroderma and polymyositis.
- bullous (BP) symptoms can include mildly pruritic welts to severe blisters and infection, oral or esophageal bullae.
- symptoms can include blistering of skin and mucous membranes.
- symptoms can include shortness of breath, fatigue, pallor, tachycardia, inappetence, diarrhea, tingling and numbness of hands and feet, sore mouth and unsteady gait.
- PM polymyositis
- PM symptoms can include muscle weakness, dysphagia and myalgia.
- PBC primary biliary cirrhosis
- symptoms can include fatigue and pruritus.
- scleroderma systemic sclerosis
- symptoms can include swelling and puffiness of the fingers or hands, skin thickening, skin ulcers on the fingers, joint stiffness in the hands, pain, sore throat and diarrhea.
- symptoms can include dryness of the eyes and mouth, swollen neck glands, difficulty swallowing or talking, unusual tastes or smells, thirst and tongue ulcers.
- symptoms can include fever, weight loss, hair loss, mouth and nose sores, malaise, fatigue, seizures and symptoms of mental illness, joint inflammation similar to RA, butterfly rash on nose and cheeks, extreme sensitivity to cold in the hands and feet.
- vasculitis syndromes e.g., Wegener's granulomatosis, idiopathic crescentic glomerulonephritis (ICGN), microscopic polyarteritis (MPA), pulmonary renal syndrome (PRS), symptoms can include fatigue, weakness, fever, arthralgia, abdominal pain, renal problems and neurological problems.
- the clinical information can be from one or more subjects at one or more points of time.
- the clinical information can include information regarding responses of a subject with an autoimmune disease to one or more treatments the subject has received.
- Molecular identifiers can include nucleic acids, proteins, carbohydrates, and lipids, and expression profiles of nucleic acids or proteins.
- the molecular identifiers can be of human or non-human origin (e.g., bacterial).
- the identifiers or markers can be determined by techniques that include, for example, comparative genomic hybridization (CGH), chromosomal microarray analysis (CMA), expression profiling, DNA microarray, high-density oligonucleotide microarray, whole-genome RNA expression array, peptide microarray, enzyme-linked immunosorbent assay (ELISA), genome sequencing, copy number (CNV) analysis, small nucleotide polymorphism (SNP) analysis, immunohistochemistry, in-situ hybridization, fluorescent in-situ hybridization (FISH), PCR, Western blotting, Southern blotting, SDS-PAGE, gel electrophoresis, and Northern blotting.
- CGH comparative genomic hybridization
- CMA chromosomal microarray analysis
- expression profiling DNA microarray
- high-density oligonucleotide microarray whole-genome RNA expression array
- peptide microarray enzyme-linked immunosorbent assay (ELISA
- markers can include levels of erythrocyte sedimentation rate (ESR), C-reactive protein (CRP) levels, Anti-ds DNA, other autoantibody titers, complement levels, urine protein levels, Urine protein/creatinine ratio, creatinine levels, blood urea nitrogen (BUN) levels, platelet levels, WBC counts, hematocrit (Hct), Hb, and urinalysis results.
- ESR erythrocyte sedimentation rate
- CRP C-reactive protein
- Anti-ds DNA other autoantibody titers
- complement levels urine protein levels
- Urine protein/creatinine ratio creatinine levels
- BUN blood urea nitrogen
- BUN blood urea nitrogen
- WBC counts hematocrit
- Hb hematocrit
- SLE Systemic lupus erythematosus
- SLE systemic lupus erythematosus
- SLE is a serious autoimmune condition that often afflicts young adults (mostly females). It is characterized by inflammatory processes that can affect many organs including the skin, joints, kidneys, lungs, heart, and central nervous system leading to frequent disabilities and sometimes death. The disease follows a very unpredictable course marked by flare periods followed by quiescent periods of remission. Nevertheless, patients diagnosed with SLE are seen regularly by a rheumatologist and treated with a variety of serious medications. These medications include steroids such as Prednisone and other immunosuppressants such as Cellcept (mycophenolate mofetil).
- the status of the disease can be measured by observing the clinical symptoms of the disease. These methods include assessment of signs (e.g., skin rash) and symptoms (e.g., joint pain and fatigue) as well as lab results (e.g., urine protein/creatinine ratio, anti-ds DNA antibody, and blood counts). These clinical markers, however, can be lagging indicators of disease status and as such patients may respond only after weeks or months of therapy. Furthermore, in some cases symptoms can be difficult to assess with precision (e.g., pain and fatigue).
- markers of inflammation for example anti-ds DNA antibody, complement level (e.g., C3), C reactive protein (CRP), and erythrocyte sedimentation rate (ESR) usually lack specificity and/or sensitivity.
- Invasive methods such as kidney biopsy are impractical for routine use.
- clinicians perform quite a frequent testing of their patients without a perfect measure of the disease status.
- the clinical symptoms and laboratory assessment are integrated in measures such as Systemic Lupus Erythematosus Disease Activity Index (SLEDAI) and Physician Global Assessment (PGA). These measures are not done routinely in clinical practice and often fall short in several clinical situations.
- SLEDAI Systemic Lupus Erythematosus Disease Activity Index
- PGA Physician Global Assessment
- MS Multiple sclerosis
- MS Multiple Sclerosis
- Muscle symptoms include, for example, loss of balance, numbness or abnormal sensation in any area, pain because of muscle spasms, pain in the arms or legs, problems moving arms or legs, problems walking, problems with coordination and making small movements, slurred or difficult-to-understand speech, tremor in one or more arms or legs, uncontrollable spasm of muscle groups (muscle spasticity), and weakness in one or more arms or legs.
- Eye symptoms include, for example, double vision, eye discomfort, uncontrollable rapid eye movements, and vision loss (usually affects one eye at a time).
- brain and nerve symptoms include, for example, decreased attention span, decreased judgment, decreased memory, depression or feelings of sadness, dizziness and balance problems, facial pain, hearing loss, and fatigue.
- Bowel and bladder symptoms include, for example, constipation, difficulty beginning urinating, frequent need to urinate, stool leakage, strong urge to urinate, and urine leakage (incontinence).
- Medications used to slow the progression of multiple sclerosis can include, for example, immune modulators to help control the immune system, including interferons (Avonex, Betaseron, or Rebif), monoclonal antibodies (Tysabri), glatiramer acetate (Copaxone), mitoxantrone (Novantrone), methotrexate, azathioprine (Imuran), cyclophosphamide (Cytoxan), and natalizumab (Tysabri).
- interferons Avonex, Betaseron, or Rebif
- monoclonal antibodies Triclonal antibodies
- Tysabri glatiramer acetate
- Copaxone glatiramer acetate
- mitoxantrone Novantrone
- methotrexate methotrexate
- azathioprine Imuran
- cyclophosphamide Cytoxan
- natalizumab Tysabri
- Medications to control symptoms can include, for example, medicines to reduce muscle spasms such as Lioresal (Baclofen), tizanidine (Zanaflex), or a benzodiazepine, cholinergic medications to reduce urinary problems, antidepressants for mood or behavior symptoms, and amantadine for fatigue.
- medicines to reduce muscle spasms such as Lioresal (Baclofen), tizanidine (Zanaflex), or a benzodiazepine
- cholinergic medications to reduce urinary problems
- antidepressants for mood or behavior symptoms and amantadine for fatigue.
- MS affects women more than men. The disorder most commonly begins between ages 20 and 40, but can be seen at any age. MS is caused by damage to the myelin sheath, the protective covering that surrounds nerve cells. When this nerve covering is damaged, nerve impulses are slowed down or stopped. MS is a progressive disease, meaning the nerve damage (neurodegeneration) gets worse over time. How quickly MS gets worse varies from person to person. The nerve damage is caused by inflammation. Inflammation occurs when the body's own immune cells attack the nervous system. Repeated episodes of inflammation can occur along any area of the brain and spinal cord. researchers are not sure what triggers the inflammation. The most common theories point to a virus or genetic defect, or a combination of both.
- MS is more likely to occur in northern Europe, the northern United States, southern Australia, and New Zealand than in other areas. Geographic studies indicate there may be an environmental factor involved. People with a family history of MS and those who live in a geographical area with a higher incidence rate for MS have a higher risk of the disease.
- MS may mimic those of many other nervous system disorders.
- the disease is diagnosed by ruling out other conditions.
- People who have a form of MS called relapsing-remitting may have a history of at least two attacks, separated by a period of reduced or no symptoms.
- the health care provider may suspect MS if there are decreases in the function of two different parts of the central nervous system (such as abnormal reflexes) at two different times.
- a neurological exam may show reduced nerve function in one area of the body, or spread over many parts of the body.
- Tests to diagnose multiple sclerosis include, for example, cerebrospinal fluid tests, including CSF oligoclonal banding, head MRI scan, lumbar puncture (spinal tap), nerve function study (evoked potential test), and spine MRI.
- cerebrospinal fluid tests including CSF oligoclonal banding, head MRI scan, lumbar puncture (spinal tap), nerve function study (evoked potential test), and spine MRI.
- MS Like other autoimmune diseases, MS follows an unpredictable course with acute flares and periods of remission.
- therapies each with side effects that range from serious (weight gain and depression) to life threatening (pancytopenia and PML infections), variable effectiveness in different patients, and high costs.
- the lack of highly accurate and specific routine tests of MS disease activity make the challenge of effectively administering therapy complicated.
- Clinical episodes can be separated by long time periods (up to years in early stage disease) even without treatment.
- available medications reduce the likelihood of relapse but do not completely prevent them. Therefore disease activity is difficult to assess and thus, there is an inadequate short term measure of disease activity that could be used to measure whether a specific therapy is showing efficacy in a given patient by measuring the reduction in number or severity of relapses.
- Rheumatoid arthritis is a chronic, systemic inflammatory disorder that can affect many tissues and organs but principally attacks the joints, producing an inflammatory synovitis that often progresses to destruction of the articular cartilage and ankylosis of the joints.
- Rheumatoid arthritis can also produce diffuse inflammation in the lungs, pericardium, pleura, and sclera, and also nodular lesions, most common in subcutaneous tissue under the skin.
- autoimmunity plays a pivotal role in its chronicity and progression.
- RA rheumatoid arthritis
- women three times more often than men are afflicted by rheumatoid arthritis
- Onset is most frequent between the ages of 40 and 50, but people of any age can be affected. It can be a disabling and painful condition, which can lead to substantial loss of functioning and mobility.
- RA is diagnosed chiefly on symptoms and signs, but can also be diagnosed with blood tests (especially a test called rheumatoid factor) and X-rays. Diagnosis and long-term management are typically performed by a rheumatologist, an expert in the diseases of joints and connective tissues.
- Non-pharmacological treatment includes physical therapy, orthoses, and occupational therapy.
- Analgesia (painkillers) and anti-inflammatory drugs, including steroids, can be used to suppress the symptoms, while disease-modifying antirheumatic drugs (DMARDs) can be used to inhibit or halt the underlying immune process and prevent long-term damage.
- DMARDs disease-modifying antirheumatic drugs
- rheumatoid factor a specific antibody
- a negative RF does not rule out RA; rather, the arthritis is called seronegative. This is the case in about 15% of patients.
- rheumatoid factor is more likely to be negative with some individuals converting to seropositive status over time.
- RF is also seen in other illnesses, for example Sjögren's syndrome, and in approximately 10% of the healthy population, therefore the test is not very specific.
- ACPAs anti-citrullinated protein antibodies
- ACPA anti-CCP
- Anti-MCV antibodies against mutated citrullinated Vimentin
- POCT serological point-of-care test
- ESR erythrocyte sedimentation rate
- C-reactive protein full blood count
- renal function e.g., hematomase
- liver enzymes e.g., antinuclear antibody/ANA
- Elevated ferritin levels can reveal hemochromatosis, a mimic RA, or be a sign of Still's disease, a seronegative, usually juvenile, variant of rheumatoid.
- DMARD Disease modifying anti-rheumatic drug
- DMARDs have been found both to produce durable symptomatic remissions and to delay or halt progression. This is significant, as such damage is usually irreversible.
- Anti-inflammatories and analgesics improve pain and stiffness but do not prevent joint damage or slow the disease progression.
- DMARDs Traditional small molecular mass drugs used to treat arthritis include, for example, chemically synthesized DMARDs: azathioprine, ciclosporin (cyclosporine A), D-penicillamine, gold salts, hydroxychloroquine, leflunomide, methotrexate (MTX), minocycline, and sulfasalazine (SSZ). Cytotoxic drugs include Cyclophosphamide.
- liver and bone marrow toxicity MTX, SSZ, leflunomide, azathioprine, gold compounds, D-penicillamine), renal toxicity (cyclosporine A, parenteral gold salts, D-penicillamine), pneumonitis (MTX), allergic skin reactions (gold compounds, SSZ), autoimmunity (D-penicillamine, SSZ, minocycline) and infections (azathioprine, cyclosporine A).
- Hydroxychloroquine may cause ocular toxicity, although this is rare, and because hydroxychloroquine does not affect the bone marrow or liver it is often considered to be the DMARD with the least toxicity. Unfortunately hydroxychloroquine is not very potent, and is usually insufficient to control symptoms on its own.
- Biological agents can be produced through genetic engineering, and include, for example, tumor necrosis factor alpha (TNF ⁇ ) blockers - etanercept (Enbrel), infliximab (Remicade), adalimumab (Humira), Interleukin 1 (IL-1) blockers - anakinra (Kineret), monoclonal antibodies against B cells - rituximab (Rituxan), T cell costimulation blocker - abatacept (Orencia), Interleukin 6 (IL-6) blockers - tocilizumab (an anti-IL-6 receptor antibody) (RoActemra, Actemra)
- Anti-inflammatory agents include, for example, glucocorticoids, Non-steroidal anti-inflammatory drugs (NSAIDs, most also act as analgesics).
- Analgesics include, for example, paracetamol (acetaminophen in US and Canada), opiates, diproqualone, and lidocaine topical.
- the challenge of treating RA lies in the fact that the disease is a long term chronic illness with that can result in challenging disability for which a large range of treatments exist each of which has significant drawbacks.
- Many of the DMARDs subject the patients to significant side effects including increased risk for serious infections, cancer, or even autoimmune disease.
- the biologically derived drugs are very expensive, and the patient be subjected to frequent injections.
- a doctor initiating therapy for a patient faces many possible options. It would be desirable to get rapid feedback once a patient starts therapy to understand whether the patient is responding to the therapy that is chosen before the clinical manifestation presents itself. Imaging is not sensitive and is expensive and many blood markers such as CRP lack sufficient sensitivity. A test that would allow the physician to rapidly determine the state of the disease would allow him or her to adjust the therapy quickly to a more effective therapy, saving the patient from additional joint damage and more effectively using the expensive therapies available.
- Ankylosing spondylitis (AS, from Greek ankylos, bent; spondylos, vertebrae), previously known as Bechterew's disease, Bechterew syndrome, and Marie Strümpell disease, a form of Spondyloarthritis, is a chronic, inflammatory arthritis and autoimmune disease. It mainly affects joints in the spine and the sacroilium in the pelvis, causing eventual fusion of the spine. It is a member of the group of the spondyloarthropathies with a strong genetic predisposition. Complete fusion results in a complete rigidity of the spine, a condition known as bamboo spine.
- the typical patient is a young male, aged 18-30, when symptoms of the disease first appear, with chronic pain and stiffness in the lower part of the spine or sometimes the entire spine, often with pain referred to one or other buttock or the back of thigh from the sacroiliac joint.
- Men are affected more than women by a ratio about of 3:1, with the disease usually taking a more painful course in men than women.
- ankylosing spondylitis is associated with an inflammation of the eye (iridocyclitis and uveitis), causing redness, eye pain, vision loss, floaters and photophobia.
- Another common symptom is generalised fatigue and sometimes nausea.
- CRP C-reactive protein
- ESR erythrocyte sedimentation rate
- Ankylosing spondylitis (AS, from Greek ankylos, bent; spondylos, vertebrae), previously known as Bechterew's disease, Bechterew syndrome, and Marie Strümpell disease, a form of Spondyloarthritis, is a chronic, inflammatory arthritis and autoimmune disease. It mainly affects joints in the spine and the sacroilium in the pelvis, causing eventual fusion of the spine.
- Anti-inflammatory drugs which include NSAIDs such as ibuprofen, phenylbutazone, indomethacin, naproxen and COX-2 inhibitors, which reduce inflammation and pain
- Opioid analgesics have also been proven by clinical evidence to be very effective in alleviating the type of chronic pain commonly experienced by those suffering from AS, especially in time-release formulations.
- DMARDs such as ciclosporin, methotrexate, sulfasalazine, and corticosteroids, used to reduce the immune system response through immunosuppression
- TNF ⁇ blockers antagonists
- etanercept etanercept
- infliximab etanercept
- adalimumab also known as biologics
- TNF ⁇ blockers have been shown to be the most promising treatment, slowing the progress of AS in the majority of clinical cases, helping many patients receive a significant reduction, though not elimination, of their inflammation and pain. They have also been shown to be highly effective in treating not only the arthritis of the joints but also the spinal arthritis associated with AS.
- the protocol for any of the TNF- ⁇ blockers include a test for tuberculosis (like Mantoux or Heaf) before starting treatment. In case of recurrent infections, even recurrent sore throats, the therapy may be suspended because of the involved immunosuppression. Patients taking the TNF medications are advised to limit their exposure to others who are or may be carrying a virus (such as a cold or influenza) or who may have a bacterial or fungal infection.
- AS affects produces symptoms that are very common in the healthy populations. For example, a patient presenting complaining of severe back pain need not be experiencing an AS flare but rather might just have routine back pain. The physician is forced to make a decision about whether to treat these symptoms with expensive drugs with potentially severe side effects without a very precise view into the state of the disease. CRP and ESR do not provide a very precise view of the disease status. At the same time the course of the untreated disease can result in debilitating long term spinal damage. This state of affairs leads to a difficult clinical challenge and significant overtreatment is used. The availability of an objective measure that reflects disease activity can be of great help in the management of AS patients.
- Tumor surveillance is one of the functions of cells of the immune system.
- the first category is comprised of antigens that are novel generated by somatic mutation (point mutation or a translocation) in the tumor.
- Another category consists of antigens from proteins that are only expressed in male germ cells that do not express MHC molecules. The dysregulation of gene expression in many tumors may allow some of these antigens to be expressed.
- a third category includes antigens from proteins only expressed in particular tissues.
- the fourth category comprises antigens that are significantly overexpressed in the tumor tissue.
- the fifth category includes antigens that result from abnormal posttranslational modification.
- tumors One of the properties of tumors is their ability to escape effective elimination by the immune system. It is thought that new mutations acquired in the tumor allow it to go from the equilibrium phase (where the tumor is not completely eliminated but its growth is held in check) to the escape phase where the tumor grows without effective control by the immune system.
- One approach is the adoptive T cell therapy.
- T cells that are targeting tumor antigens through isolation of cells that are infiltrating the tumor and/or reacting to a specific tumor antigen.
- These T cells can be grown in vitro in conditions that enhance their effectiveness, like the use of IL-2 and/or antigen-presenting cells. The expanded cells are then infused back to the patient blood.
- Another approach is to use of retrovirus containing tumor-specific TCR. These retrovirus can be infused in the patient in special cells that later secrete the retrovirus allowing it to infect T cells that then start expressing the tumor-specific TCR.
- a common approach is the use of vaccination. The premise of this approach of therapy is that immunization of the patient with one or more of the tumor antigens will stimulate the immune system ability to fight the tumor.
- Immunization is often done with the use of an adjuvant like Bacille Calmette-Guerin (BCG).
- BCG Bacille Calmette-Guerin
- This invention teaches a novel mechanism for cancer detection using the immune cell response.
- cancer detection is not achieved by the detection of a marker produced by the tumor itself but by the immune system response to the tumor.
- the profile of TCR and/or BCR can provide an insight on whether the body is mounting a response to a tumor or not. This can ameliorate some of the issues with current biomarkers.
- First the immune response is an amplification signal that can be easier to detect.
- Second lymphocytes pass through the blood regularly and hence the relevant biomarker may readily present and detectable in peripheral blood than traditional tumor biomarker.
- the problem of "background" biomarker material generated by the normal tissue is greatly reduced.
- T and/or B cells provide a way to detect the relevant biomarker with high sensitivity and specificity, particularly with the recent availability of high throughput methods for DNA sequencing.
- the approach of using the immune system response to cancer to detect it leverages the foundations laid to this field by the promise of immunotherapy. However the risk for the two applications is probably quite different.
- To use the immune response to cancer for its detection does not require that the specific clonotype be effective in treating the tumor but rather that it is associated with the immune response to the tumor.
- Another embodiment of this invention contemplates the combination of the immune profiling tests with other markers that are already in use for the detection of cancer to allow tests with greater sensitivity and specificity.
- Other molecular identifiers or markers can be used in computing the Load algorithm or for determining the disease state.
- Molecular identifiers can include nucleic acids, proteins, carbohydrates, and lipids, and expression profiles of nucleic acids or proteins.
- the molecular identifiers can be of human or non-human origin (e.g., bacterial).
- the identifiers or markers can be determined by techniques that include, for example, comparative genomic hybridization (CGH), chromosomal microarray analysis (CMA), expression profiling, DNA microarray, high-density oligonucleotide microarray, whole-genome RNA expression array, peptide microarray, enzyme-linked immunosorbent assay (ELISA), genome sequencing, copy number (CNV) analysis, small nucleotide polymorphism (SNP) analysis, immunohistochemistry, in-situ hybridization, fluorescent in-situ hybridization (FISH), PCR, Western blotting, Southern blotting, SDS-PAGE, gel electrophoresis, and Northern blotting.
- CGH comparative genomic hybridization
- CMA chromosomal microarray analysis
- expression profiling DNA microarray
- high-density oligonucleotide microarray whole-genome RNA expression array
- peptide microarray enzyme-linked immunosorbent assay (ELISA
- Solid organ transplant rejection primarily occurs due to response of the adaptive immune system to the transplanted organ. This is due to the presence of alloantigens in the graft that are recognized by the host's immune system, The rejection can occur in three different phases. The first is the hyperacute phase within minutes of the transplant where preformed antibodies mount a response to the graft. The second is the acute rejection that occurs in first weeks or months after the transplant. The last is chronic rejection that can occur years after the transplantation. Given these risks care has been taken to minimize the immunogenic differences between the donor and recipient. For example the risk of the hyperacute reaction is greatly reduced when the donor and recipient are matched for their ABO subtypes as well as tested for cross matching (determining whether the recipient has antibodies that react with the leukocytes of the donor).
- MHC Major HistoCompatability
- drugs are utilized for this purpose including: Azathioprine, corticosteroids, Cyclosporine, Tacrolimus, Mycophenolate Acid, Sirolimus, Muromonab-CD3, Monoclonal Anti-CD25 Antibody, Monoclonal Anti-CD20 Antibody, and Calcineunn inhibitors.
- Bone marrow transplant is most frequently used for leukemia and lymphoma treatment. Typically the recipient undergoes an aggressive regimen of radiation and/or chemotherapy to decrease the load of the tumor before the transplantation. Mature T cells from the donor can attack some of the host tissues in the inverse rejection that is called Graft Vs Host Disease (GVHD). This is often manifested by rash, diarrhea, and liver disease. Careful matching of MHC can ameliorate but not eliminate this problem.
- GVHD Graft Vs Host Disease
- One solution is the depletion of the donor bone marrow in vitro of mature T cells that are ultimately responsible for GVHD.
- One problem with this is that the same phenomenon that causes GVHD may be responsible for some of the therapeutic effect of bone marrow transplant through the graft vs.
- Another embodiment of this invention contemplates the combination of the immune profiling tests with other markers that are already in use for the detection of transplant rejection to allow tests with greater sensitivity and specificity.
- Other molecular identifiers or markers can be used in computing the Load algorithm or for determining the disease state.
- Molecular identifiers can include nucleic acids, proteins, carbohydrates, and lipids, and expression profiles of nucleic acids or proteins.
- the molecular identifiers can be of human or non-human origin (e.g., bacterial).
- the identifiers or markers can be determined by techniques that include, for example, comparative genomic hybridization (CGH), chromosomal microarray analysis (CMA), expression profiling, DNA microarray, high-density oligonucleotide microarray, whole-genome RNA expression array, peptide microarray, enzyme-linked immunosorbent assay (ELISA), genome sequencing, copy number (CNV) analysis, small nucleotide polymorphism (SNP) analysis, immunohistochemistry, in-situ hybridization, fluorescent in-situ hybridization (FISH), PCR, Western blotting, Southern blotting, SDS-PAGE, gel electrophoresis, and Northern blotting.
- CGH comparative genomic hybridization
- CMA chromosomal microarray analysis
- expression profiling DNA microarray
- high-density oligonucleotide microarray whole-genome RNA expression array
- peptide microarray enzyme-linked immunosorbent assay (ELISA
- nucleic acid amplification Another set of application involve the assessment of the "load" of the infection in a patient with an already diagnosed infectious agent. An example of that is the assessment of HIV viral load in patients already diagnosed with AIDS. This test helps the physician in determining whether the state of the patient's disease and hence can provide guidance on the effectiveness of the treatment regimen being used.
- hepatitis B One aspect of hepatitis B testing relies on detecting the infectious agent through detection of hepatitis B antigens of by a nucleic acid amplification assay. In addition it is common in routine clinical practice to test for the presence of different antibodies that target the hepatitis B virus. The presence of anti-HBc IgM usually occurs in an acute infection setting, the appearance of anti-HBc IgG indicates the infection is chronic. Similarly the emergence of anti-HBs antibody signals clearing of the infection.
- the value of the assessing the immune response to an infection is harnessed along with the sensitivity and specificity of the molecular testing. This can be particularly useful for infectious diseases that are chronic where the infectious agent remains latent in the body.
- the profile of the TCR and/or BCR can be used to assess the immune response to an infection. Sequencing can be used to obtain a profile of the TCR and/or BCR allowing the detection of particular clonotypes with high sensitivity and specificity. To determine the specific clonotypes that correlate with disease several approaches are conceived.
- Another embodiment of this invention contemplates the combination of the immune profiling tests with other markers that are already in use for the detection of infectious agents to allow tests with greater sensitivity and specificity.
- Other molecular identifiers or markers can be used in computing the Load algorithm or for determining the disease state.
- Molecular identifiers can include nucleic acids, proteins, carbohydrates, and lipids, and expression profiles of nucleic acids or proteins.
- the molecular identifiers can be of human or non-human origin (e.g., bacterial).
- the identifiers or markers can be determined by techniques that include, for example, comparative genomic hybridization (CGH), chromosomal microarray analysis (CMA), expression profiling, DNA microarray, high-density oligonucleotide microarray, whole-genome RNA expression array, peptide microarray, enzyme-linked immunosorbent assay (ELISA), genome sequencing, copy number (CNV) analysis, small nucleotide polymorphism (SNP) analysis, immunohistochemistry, in-situ hybridization, fluorescent in-situ hybridization (FISH), PCR, Western blotting, Southern blotting, SDS-PAGE, gel electrophoresis, and Northern blotting.
- CGH comparative genomic hybridization
- CMA chromosomal microarray analysis
- expression profiling DNA microarray
- high-density oligonucleotide microarray whole-genome RNA expression array
- peptide microarray enzyme-linked immunosorbent assay (ELISA
- T cells lose responsiveness, macrophages have a decreased antigen-presenting capacity and altered cytokine secretion, natural killer cells have reduced toxicity, follicular dendritic cells cannot present antigen as efficiently, and neutrophils lose phagocytic ability .
- T cell repertoires that are associated with cytomegalovirus (CMV) are greatly increased and as much as 45% of the total T cell repertoire may be devoted to it. It has been noted that these expansions are less pronounced in centenarians.
- CMV cytomegalovirus
- RNA from the T and B cells found in peripheral blood can be collected from a longitudinal cohort of aging patients whose clinical histories are followed for several years.
- the TCR ⁇ and TCR ⁇ genes and the IgH, IgK and IgLgenes can be amplified in each of these cohorts at several time points in their clinical histories. Profiles of patients with long survival will be compared to patients with short survival.
- global measure of diversity can be obtained. This will include not only the number of different clonotypes identified but also their diversity. For example, is the V, D, J segment usage the same in the two groups or is one group more restricted in its usage?
- two samples may have the same number of independent clonotype but the clonotypes for one of the two samples do not cover many of the V segments. It is logical to expect that this sample would be less versatile in responding to a new antigen compared with the other sample whose clonotypes are distributed among all the V segments.
- Another embodiment of this invention contemplates the combination of the immune profiling tests with other markers that are already in use for the detection of health in the aging population to allow tests with greater sensitivity and specificity.
- Other molecular identifiers or markers can be used in computing the Load algorithm or for determining the disease state.
- Molecular identifiers can include nucleic acids, proteins, carbohydrates, and lipids, and expression profiles of nucleic acids or proteins.
- the molecular identifiers can be of human or non-human origin (e.g., bacterial).
- the identifiers or markers can be determined by techniques that include, for example, comparative genomic hybridization (CGH), chromosomal microarray analysis (CMA), expression profiling, DNA microarray, high-density oligonucleotide microarray, whole-genome RNA expression array, peptide microarray, enzyme-linked immunosorbent assay (ELISA), genome sequencing, copy number (CNV) analysis, small nucleotide polymorphism (SNP) analysis, immunohistochemistry, in-situ hybridization, fluorescent in-situ hybridization (FISH), PCR, Western blotting, Southern blotting, SDS-PAGE, gel electrophoresis, and Northern blotting.
- CGH comparative genomic hybridization
- CMA chromosomal microarray analysis
- expression profiling DNA microarray
- high-density oligonucleotide microarray whole-genome RNA expression array
- peptide microarray enzyme-linked immunosorbent assay (ELISA
- Influenza vaccination has to be done yearly as the strain mutates rapidly. Most of the severe sequelae of the disease occur in the elderly. Unfortunately the elderly often experience immunosenescence rendering them inadequately responsive to the vaccination.
- a discovery study needs to be performed.
- blood samples are available for a cohort of Influenza vaccinated patients with known Influenza outcome (i.e., were they later protected from the infection or not).
- TCR and/or BCR sequence can be obtained from these samples.
- Clonotypes that are enriched after vaccination in each patient are determined. Enriched clonotypes in patients who responded to the vaccination are then compared to a control set of clonotypes (e.g., the rest of the clonotypes in the same set of patients) to distinguish the correlating clonotypes from other clonotypes.
- the algorithm to predict these clonotypes is then used to predict correlating clonotypes among patients who did not respond to the vaccination. Patients who did not respond may generate the same type of clonotypes as those that responded but at lower levels. Alternatively it might be that non-responders generate a distinct class of clonotypes. The number of correlating clonotypes identified in the non-responder may distinguish these two possibilities.
- an algorithm is then built to generate a score for predicting likelihood of immunization. Data from the profiles of the vaccine-responders and those that do not respond are utilized to generate this algorithm. This algorithm can then be used to predict the likelihood of immunization in the next patient using the predicted correlating clonotypes from a sample obtained after immunization. The prediction is done through the application of another algorithm that has also been generated in the discovery study. It can optionally be aided (or substituted) by data from the pre-calibration to limit the search for correlating clonotypes to those that were enriched after immunization.
- Another embodiment of this invention contemplates the combination of the immune profiling tests with other markers that are already in use for the detection of response to vaccination to allow tests with greater sensitivity and specificity.
- Other molecular identifiers or markers can be used in computing the Load algorithm or for determining the disease state.
- Molecular identifiers can include nucleic acids, proteins, carbohydrates, and lipids, and expression profiles of nucleic acids or proteins.
- the molecular identifiers can be of human or non-human origin (e.g., bacterial).
- the identifiers or markers can be determined by techniques that include, for example, comparative genomic hybridization (CGH), chromosomal microarray analysis (CMA), expression profiling, DNA microarray, high-density oligonucleotide microarray, whole-genome RNA expression array, peptide microarray, enzyme-linked immunosorbent assay (ELISA), genome sequencing, copy number (CNV) analysis, small nucleotide polymorphism (SNP) analysis, immunohistochemistry, in-situ hybridization, fluorescent in-situ hybridization (FISH), PCR, Western blotting, Southern blotting, SDS-PAGE, gel electrophoresis, and Northern blotting.
- CGH comparative genomic hybridization
- CMA chromosomal microarray analysis
- expression profiling DNA microarray
- high-density oligonucleotide microarray whole-genome RNA expression array
- peptide microarray enzyme-linked immunosorbent assay (ELISA
- the adaptive immune system has evolved to respond to antigens that are associated with pathogens. As is in the case of autoimmune diseases, the immune system can sometimes have the wrong target. Whereas in autoimmune diseases the immune system targets self antigen, in hypersensitivity reactions it mounts a response to harmless stimuli like medications, dust, and food. Hypersensitivity is very common with as many as 50% of the US population having allergy to an environmental stimulus, and it is caused by mechanisms. Hypersensitivity is divided into 4 types. Type I hypersensitivity is the immediate type hypersensitivity and is mediated by IgE. Type II is often due to IgG antibody binding to cell surface-associated antigen. For example a harmless drug that binds to the surface of the cell can make the cell a target for anti-drug IgG in patients who happened to have these antibodies.
- Type III is caused by deposition of antigen-antibody complexes on tissues. This occurs for example when the amount of antigen is large resulting in small immune complexes that can't be cleared efficiently and are instead deposited on blood vessel walls.
- Type IV sensitivity is a delayed type hypersensitivity mediated by T cells. Type I and type IV have the highest impact on human health.
- Type I hypersensitivity reaction the patient becomes sensitized to a harmless antigen (allergen) by producing IgE antibody against it. Later exposure to the allergen induces the activation of IgE-binding cells, such as mast cells and basophils. Once activated these cells cause the allergic reaction through inducing an inflammatory process by secreting stored chemicals and synthesizing cytokines, leukotrienes, and prostaglandins.
- the dose and the route of entry of the allergen determines the magnitude of the allergic reaction that can range from symptoms of allergic rhinitis to the life-threatening circulatory collapse in anaphylaxis. Often the acute Type I reaction is later followed by another late phase that is plays a role in many of the resulting pathological processes.
- Type IV hypersensitivity reaction The late phase of recruitment of T helper cells and other inflammatory cells is essentially a Type IV hypersensitivity reaction.
- Type I allergic reactions include seasonal rhinoconjunctivitis (hayfever), food allergy, drug-induced anaphylaxis, atopic dermatitis (eczema), and asthma. These are very common conditions with rising prevalence causing significant costs as well as morbidity and mortality.
- Asthma is a chronic disease that inflicts ⁇ 7% of the US population causing ⁇ 4,000 deaths a year.
- Some of these diseases have some related aspects. For example, patients with atopic dermatitis are at significantly increased risk to have asthma.
- Food allergy can cause vomiting and diarrhea but can also result in anaphylaxis in a significant number of patients- 30,000 cases resulting in ⁇ 200 deaths per year in the US.
- Some of the same allergen that activates submucosal mast cells in the nose causing symptoms of allergic rhinitis can also activate mast cells in the lower airways causing bronchial constriction, a typical symptom of asthma.
- Some Type IV hypersensitivity reactions are contact dermatitis (e.g., poison ivy), chronic rhinitis, chronic asthma, and celiac disease.
- Celiac disease is a chronic disease caused by a non-IgE mediated food allergy. It is a disease of the small intestine caused by the allergic response against gluten, a component present in wheat and other foods. Over 95% of patients celiac patients have a specific MHC class II allele, the HLA-DQ2.
- Treatment of hypersensitivity reactions differs, but they often had two aspects: the acute treatment and chronic management or prevention. Some of these conditions can be life threatening (anaphylaxis, and acute asthma) and involve immediate medical attention.
- the chronic management in general it involves trying to avoid the specific allergen. This may be effective when the allergen can be clearly identified (e.g., allergy to nuts), but this can be difficult when the allergen is present widely in the environment, like pollen or dust. Therefore chronic treatment with medications is often utilized for some of these diseases (e.g., asthma and allergic rhinitis).
- the level of effectiveness of the treatment management is ultimately tested when the patient is re-exposed to the allergen(s). Therefore some patients may be subject to over- or under-treatment. Ideally a test that assesses the disease activity and the degree to which the patient is prone to mount a hypersensitivity response would be available. Such a test would allow the tailoring of treatment to the individual patient needs.
- a blood sample is taken from a patient with an autoimmune disease.
- CD4+ and CD8+ cells are isolated from the blood sample using antibody-coated magnetic beads.
- PCR is used to amplify the full variable region of the T cell receptor ⁇ gene.
- the amplified fragments are subcloned into vectors and transformed in bacteria to isolate the DNA fragments.
- the bacteria are grown to amplify the DNA, and dideoxy sequencing is used to sequence the variable regions of the T cell receptor ⁇ gene to identify the clonotypes.
- the sequencing information is used to generate a clonotype profile for the patient.
- a similar method is shown in FIG. 1 .
- CSF cerebral spinal fluid
- blood A sample of cerebral spinal fluid (CSF) and blood is taken from a patient with an episode peak of multiple sclerosis.
- CD4+ cells are isolated from the CSF and blood, and the CDR3 of the T cell receptor ⁇ gene is amplified by PCR.
- the amplified fragments are subcloned into vectors and transformed in bacteria to isolate the DNA fragments.
- the bacteria are grown to amplify the DNA, and dideoxy sequencing is used to sequence the variable regions of the T cell receptor ⁇ gene to identify the clonotypes.
- the sequencing information is used to generate a clonotype profile for the patient.
- Another blood sample is taken when the patient is at a relatively inactive state of multiple sclerosis. The same procedure as above is repeated to generate a clonotype profile. Pathological clonotypes are identified as those that are high at the peak episode and went down significantly at the inactive state. Another blood sample is taken from the patient at a later state. At this time only a fraction of the T cell receptor ⁇ gene CDR3 regions are amplified and then sequenced. This subset contains the pathological clonotypes. The level of the various clonotypes is determined to assess the disease state of the patient.
- TCR ⁇ repertoire analysis Amplification and sequencing strategy
- TCR ⁇ chains will be analyzed. The analysis will include amplification, sequencing, and analyzing the TCR ⁇ sequences.
- One primer AGCGACCTCGGGTGGGAACA is complementary to a common sequence in C ⁇ 1 and C ⁇ 2, and there are 34 V primers ( Table 1 ) capable of amplifying all 48 V segments.
- C ⁇ 1 or C ⁇ 2 differ from each other at position 10 and 14 from the J/C junction.
- the primer for C ⁇ 1 and C ⁇ 2 will end at position 16 bp and should have no preference for C ⁇ 1 or C ⁇ 2.
- the 34 V primers are modified from an original set of primers published by the BIOMED-2 group in order to amplify all 48 V segments and all their published alleles as defined by the international ImMunoGeneTics information system (http://imgt.cines.fr/).
- the BIOMED-2 primers have been used in multiplex in order to identify clonality in lymphoproliferative diseases.
- Table 1. Primer sequences complementary to the different V families.
- V segment family Primer sequence V20-1 AACTATGTTTTGGTATCGTCAGT V29-1 TTCTGGTACCGTCAGCAAC V9, 5-1, 5-6, 5-5, 5-8, 5-4A AGTGTATCCTGGTACCAACAG V9, 5-1, 5-6, 5-5, 5-8, 5-4B
- the use of the primers for amplification was tested with 34 synthetic sequences.
- the synthetic sequences contained on one side the sequence of one of the oligonucleotides and on the other side the complement of the C primer. In between the two primers was 6 bp corresponding to the restriction enzyme site Cla I. All the synthetic sequences were amplified with the appropriate primers, and it was demonstrated through Cla I digestion that the amplification products were the result of amplifying the synthetic sequences and not through formation of primer dimers.
- the Illumina Genome Analyzer is the sequencing platform of choice. In each lane, ⁇ 15 million reads can be done. Twelve human and 96 mouse samples per lane will be run, and sequence tags will be used to distinguish reads of one sample from those of another. A two-stage amplification screen can be performed, as illustrated in FIG. 2 . As shown in FIG. 2A , the primary PCR will use on one side a 20 bp primer whose 3' end is 16 bases from the J/C junction and is perfectly complementary to C ⁇ 1 and the two alleles of C ⁇ 2.
- a primer is used that has at its 3'end the sequence of the 10 bases closest to the J/C junction, followed by 17 bp with the sequence of positions 15-31 from the J/C junction, followed by the P5 sequence.
- This primer is referred to as C10-17-P5.
- P5 plays a role in cluster formation.
- a 4 bp loop position 11-14 is created in the template, as the primer hybridizes to the sequence of the 10 bases closest to the J/C junction and bases at positions 15-31 from the J/C junction.
- the looping of positions 11-14 eliminates differential amplification of templates carrying C ⁇ 1 or C ⁇ 2.
- C10-17-P5 primer can be HPLC purified in order to ensure that all the amplified material has intact ends that can be efficiently utilized in the cluster formation.
- the length of the overhang on the V primers is shown to be 14 bp.
- the first PCR may be helped with shorter overhang.
- a very inefficient priming in the second PCR may cause limitation in the representation in the final data.
- the primary PCR will use 34 different V primers that anneal to the other side of the template and contain a common 14 bp overhang on the 5' tail.
- the 14 bp is the partial sequence of one of the Illumina sequencing primers (termed the Read 2 primer).
- the second amplification primer on the same side includes P7 sequence, a tag, and Read 2 primer sequence (this primer is called Read2_tagX_P7).
- the P7 sequence is used for cluster formation.
- Read 2 and its complement are used for sequencing the V segment and the tag respectively.
- a set of 96 of these primers with tags numbered 1 through 96 were created (see below). These primers can be HPLC purified in order to ensure that all the amplified material has intact ends that can be efficiently utilized in the cluster formation.
- the second stage primer, C-10-17-P5 ( FIG. 2A ) has interrupted homology to the template generated in the first stage PCR.
- the efficiency of amplification using this primer has been validated.
- An alternative primer to C-10-17-P5, termed CsegP5 has perfect homology to the first stage C primer and a 5' tail carrying P5.
- the efficiency of using C-10-17-P5 and CsegP5 in amplifying first stage PCR templates was compared by performing real time PCR. In several replicates, it was found that PCR using the C-10-17-P5 primer had little or no difference in efficiency compared with PCR using the CsegP5 primer.
- the molecule resulting from the 2-stage amplification illustrated in FIG. 2 will have the structure typically used with the Illumina sequencer as shown in FIG. 3 .
- Two primers that anneal to the outmost part of the molecule, Illumina primers P5 (AATGATACGGCGACCACCGAG) and P7 (CAAGCAGAAGACGGCATACGAGAT) will be used for solid phase amplification of the molecule (cluster formation).
- Three sequence reads are done per molecule. The first read of 100 bp is done with the C' primer, which has a melting temperature that is appropriate for the Illumina sequencing process. The second read is 6 bp long only and will be solely for the purpose of identifying the sample tag.
- the final read is the Read 2 primer, an Illumina primer with the sequence GTGACTGGAGTTCAGACGTGTGCTCTTCCGATCT. Using this primer, a 100 bp read in the V segment will be generated starting with the 1st PCR V primer sequence.
- a set of 6 bp sequence tags to distinguish different samples run in the same sequencing lane was designed, where each tag is different from all the other tags in the set by at least 2 differences.
- the 2 differences prevent misassignment of a read to the wrong sample if there is a sequencing error.
- the alignment done to compare the tags allowed gaps and hence one deletion or insertion error by sequencing will also not assign the read to the wrong sample.
- Additional features in selecting the tags was to limit single base runs (4 A or T and 3 G or C) as well as no similarity to the Illumina primers. In total 143 tags were generated with the premise that 96 of them will be used.
- Real time PCR has been performed with all 34 different primers using cDNA obtained from a blood sample. Different Ct values were obtained for the different primers. Each of the PCR products were run by gel electrophoresis and demonstrated a single band. In addition all 34 primers were pooled and a PCR was performed and again a single PCR band was obtained.
- the multiplex amplification can use all the V segments.
- One issue in amplification of different sequences is the relative amplification efficiency of the different sequences and the preservation of the initial relative quantity of the different sequences in the final amplified material.
- the relative amplification efficiency can be subdivided into different efficiencies of the distinct primer sequences as well as the different efficiencies of amplification of different sequences using the same primer. Efficiency difference can be due to distinct primer sequences.
- the reaction will be optimized to attempt to get amplification that maintains the relative abundance of the sequences amplified by different V segment primers. Some of the primers are related, and hence many of the primers may "cross talk," amplifying templates that are not perfectly matched with it.
- each template can be amplified in a similar fashion irrespective of which primer amplified it.
- both templates can be amplified approximately 1,000 fold, and it does not matter that for one of the templates half of the amplified products carried a different primer because of the cross talk.
- the primer sequence will be eliminated from the analysis, and hence it does not matter what primer is used in the amplification as long as the templates are amplified equally.
- the primary PCR will have a small number of cycles to minimize the differential amplification by the different primers.
- the secondary amplification is done with one pair of primers and hence the issue of differential amplification is minimal.
- One percent of the primary PCR is taken directly to the secondary PCR. Thirty-five cycles (equivalent to ⁇ 28 cycles without the 100 fold dilution step) used between the two amplifications were sufficient to show a robust amplification irrespective of whether the breakdown of cycles were: one cycle primary and 34 secondary or 25 primary and 10 secondary. Even though ideally doing only 1 cycle in the primary PCR may decrease the amplification bias, there are other considerations.
- One aspect of this is representation. This plays a role when the starting input amount is not in excess to the number of reads ultimately obtained.
- Enzymes with higher fidelity can be used to minimize errors.
- the assay has been optimized using Taq polymerase.
- a cDNA with the pool of primers was amplified using Taq polymerase, Accuprime, or Taq high fidelity.
- Each of the amplified material was then used as a template for 34 real time PCR for with each of the 34 V primers and the 1 C primer.
- the relative amount of the templates was quantitated.
- a high correlation (r 2 >0.95) between the concentration of each template in the Accuprime, Taq high fidelity and Taq was found, validating the use of these high fidelity enzymes.
- the optimization was done using a pool of primers on the standard template not with the cDNA background. The goal was to obtain validation for these results in cDNA mixture. In order to show reproducibility, pool of oligos to amplify cDNA in duplicates were used. Each of the 34 products were quantitated in each of the two amplifications. As shown in FIG. 5 , the reproducibility was excellent.
- FIG. 5 two primary PCR reactions were performed using the pooled TCR ⁇ primers and the C primer and one cDNA sample as a template.
- the relative abundance in each of the amplified material of template that is amplifiable with each of the 34 V primers (and the one C primer) was assessed using real time PCR.
- thirty four different real time PCR reactions were performed using the C primer and one of the V primers in each reaction.
- the relative abundance determined by real time PCR was highly reproducible using all the V primers between for the two samples, indicating that the multiplexed amplification is highly reproducible.
- the cycle number (Ct value) for each of the real time PCR amplifications using the one multiplexed amplification product as a template is shown on the X axis and using the second multiplexed amplification product as a template is depicted on the Y axis.
- oligos can be used to amplify using cDNA as a template. Then the amount of template amplified by each of the 34 different primers (along with C segment primer) a can be quantitated using real time PCR and that amount can be compared with the amount amplified using the same primer from the cDNA. However, since there is cross talk even if the relative abundance among the internal sequences in the amplified product and the cDNA were the same, big differences using this readout may be detected. To alleviate this issue 12 oligos were designed that can when used with C segment primer amplify sequences internal to the V segment primers. If optimization was done appropriately, then the concentration of these internal sequences should change little between the cDNA and the amplified products. This is shown is FIG. 6 .
- a cDNA sample was used as a template for a multiplexed amplification using the pooled TCR ⁇ primers and the C primer.
- the C primer and primers were used that are downstream (to be named internal primers) of the V primers used for the initial amplification and the material from the multiplex amplification material as a template to assess the relative abundance of the different sequences.
- real time PCR was used to assess the relative abundance of these same sequences in the cDNA. If the multiplexed amplification had great bias, the relative abundance in the amplified material can be very different from that in the cDNA. As can be seen in FIG. 6 , high correlation was seen demonstrating minimal amplification bias in the multiplexed amplification.
- the cycle number (Ct value) for each of the real time PCR amplification using internal primers, and cDNA and the multiplexed amplification product as template is shown on X and Y axis, respectively.
- FIG. 8A shows the log 10 of the frequency of each clonotype in the two duplicate samples using Accuprime and cDNA corresponding to 500 ng of RNA as input template. The correlation (r 2 ) between these duplicates is 0.944.
- FIG. 8A shows the log 10 of the frequency of each clonotype in the two duplicate samples using Accuprime and cDNA corresponding to 500 ng of RNA as input template. The correlation (r 2 ) between these duplicates is 0.944.
- FIG. 8B depicts the log 10 of the frequency of each clonotype using cDNA corresponding to 500 ng of RNA as
- the first set of primers (A) have the 3' end at approximately -255
- the second (B) have the 3' end at approximately -160
- the third (C) have the 3' end at approximately -30.
- the primer sequence (AATGATACGGCGACCACCGAGATCTGGG AAG ACGAT GG GCC CTT GGT GGA) comprises the sequence of the C segment from positions 3-19 and 21-28 and it skips position 20 that has a different base in at least one of the different IgG alleles and the sequence for P5 that is can be used for formation of the clusters as shown in FIG. 4 .
- multiplexed PCR using 3 pools of primers corresponding to the 3 frames was done using cDNA as a template. After the primary and secondary PCR the products were run on an agarose gel. A denotes the PCR product from the pool of oligos of frame A. Similarly B and C denote the products of pools B and C. M is a marker lane. Single bands with the appropriate sizes were obtained using all 3 pools.
- the 3 different reactions from a single sample will then be mixed at equimolar ratio and subjected to sequencing. Sequencing will be done from both directions using the two Illumina primers. 100 bp will be sequenced from each side.
- the maximal germline sequences encompassing the D+J segments are ⁇ 30 bp longer for BCR than TCR. Therefore if the net result of nucleotide removal and addition at the joints (N and P nucleotides) generate a similar distribution for IgH and TCR ⁇ , it is expected that on average 90 bp and maximally 120 bp of sequence after the C segment will be sufficient to reach the 3' of the V segment. Therefore, in most cases, the sequence from the C primer will be sufficient to reach the V segment.
- Sequencing from one of the Illumina adapters should identify the V segment used as well as identify somatic hypermutations in the V segments. Different pieces of the V segments will be sequenced depending on which of the three amplification reactions the sequence originated from. The full sequence of the BCR can be aligned from different reads that originated from different amplification reactions. The sequencing reaction from the one end showing the full CDR3 sequence will greatly facilitate the accurate alignment of different reads.
- TCR ⁇ and IgH Data will be obtained for TCR ⁇ and IgH. Given the somatic hypermutation in IgH and the difference in the amplification strategy, the primary analysis of TCR ⁇ and IgH will be somewhat different.
- the C' segment primer for sequencing will be used.
- the length of the V segment that will be sequenced will depend on the length of N+P nucleotides added. Given the average number of added nucleotides, about 40 nucleotides of the V segment will be sequenced.
- the Illumina sequencing primer P7 will be used. The sequence of 20 bp of V primer sequence followed by 80 bp of V segment sequence will be obtained.
- Reads will be aligned to the germline V segments (including the different known alleles) to assign a V segment to each read. Reads that don't substantially match any V segments will be discarded from further analysis reads. A substantial match will be defined as one where there is no more than 5 errors. Given a random error rate of 1% it is expected that this scheme would discard ⁇ 1% of reads due to error. The rest of the sequences will be assigned to the V segment that has the highest match. Primers amplifying V segments of the same family will often be highly related with one or a few bases difference between them. These primers can "cross talk", amplifying other family members. Therefore the beginning of the sequencing read (the primer) can be for a V segment that is different from the V segment the rest of the read belongs to. Such cases will be allowed and do not count as errors.
- the sequences from the end of the V segment to the beginning of the C segment is evaluated. This sequence will be called the DJ region. This sequence is on average 60 bases with a very small fraction as large as 90 bases. It is likely to be able to assign the J segment in most cases as the end close to the C segment is likely to be preserved. On the other hand, the D segment may be difficult to assign given its small size (15-16 bp) and the trimming and addition that occurs on both of its ends. Of note is that when a J segment is assigned, it is possible to predict the D and C segment. After assigning the segment, the sequence of the DJ region will be defined. Error complicates this analysis more than it does for the C and V segment alignment for two reasons. First error in the DJ alignment can occur in either of the two reads being aligned effectively doubling the error rate of alignment of a single read to the database sequence.
- one base difference in the C or V alignment can be readily attributed to error (except for the rare case of a previously undescribed V germline allele), and sequences having one base difference to a V segment can be assigned to have the sequence of the V segment.
- sequences having one base difference to a V segment can be assigned to have the sequence of the V segment.
- a one base difference between two DJ region reads is due to an error or a genuine sequence difference between two clonotypes.
- the reads belong to the same clonotype but have errors, or there are two or more distinct clonotypes. Clonotypes will be designated as distinct when the chance of their emergence by sequencing error is low either because of their frequent observations or because they diverge in too many bases.
- PCR error will be concentrated in some bases that were mutated in the early cycles of PCR. Sequencing error is expected to be distributed in many bases even though it will be totally random as the error is likely to have some systematic biases. It will be assumed that some bases will have sequencing error at a higher rate, say 5% (5 fold the average). Given these assumptions, sequencing error becomes the dominant type of error. Distinguish PCR errors from the occurrence of highly related clonotypes will play a role in analysis. Given the biological significance to determining that there are two or more highly related clonotypes, a conservative approach to making such calls will be taken.
- the detection of enough of the minor clonotypes so as to be sure with high confidence (say 99.9%) that there are more than one clonotype will be considered.
- the minor variant will be detected 14 or more times for it to be designated as an independent clonotype.
- the minor variant can be detected 74 or more times to be designated as an independent clonotype. This algorithm can be enhanced by using the base quality score that will be obtained with each sequenced base.
- the quality score can be used to decide the number of reads that need to be present to call an independent clonotype.
- the median quality score of the specific base in all the reads can be used, or more rigorously, the likelihood of being an error can be computed given the quality score of the specific base in each read, and then the probabilities can be combined (assuming independence) to estimate the likely number of sequencing error for that base.
- clonotype 1 After designating clonotypes that occur too frequently to be due to error as distinct or independent, criteria will be considered that allow designation of clonotypes as independent due to their differences in too many bases. It is expected that less than 0.1% of time, two reads will have more than 4 errors in 60 bp between them. Therefore this will be used as a cut off to consider two clones as independent or distinct.
- the algorithm that will be employed will be as follows. The clonotype with the largest number of counts (clonotype 1) will be noted, and it will be determined whether there are any other clonotypes that have the same V segment and have 4 or less base differences from it in the DJ region.
- the largest of these clonotypes will be assessed first.
- the rule described above will be applied to decide whether to designate the clonotype as an independent clonotype or the same as the major clonotype. If it is not designated as an independent clonotype it will then be counted as if it has the sequence of clonotype 1. At the end of this exercise the sequence and counts for all clonotypes will be obtained. This approach ensures that clonotypes will not be designated as independent when they are not. However, some truly independent clonotypes may be misclassified (not frequent with low number of differences from the major clonotype) as being the same. This type of error will be much less damaging than considering two clonotypes as independent when they are not.
- the Illumina primer For sequencing of the C segment end, the Illumina primer will be used.
- the first bases to be sequenced will be the C segment primer followed by 0-2 bases of C segment and then the DJ region.
- the primer sequence will identify which isotype the specific read belongs to. All or most of the DJ sequence can be obtained through the read from the C segment side. It is expected that the DJ region will be on average 80 bp. Therefore, 100 bp read will encompass the C segment primer and the average DJ region.
- Some DJ regions may be as large as 120 bp, and their full reading can include sequencing data from the V region (not counting those cases where 2 D segments are found in the same IgH).
- the sequence of the DJ region obtained from the C segment will initially be considered. The number of each unique sequence will be counted. As discussed for TCR ⁇ , some of the related sequences originate probably from the same clonotype but have some sequencing and PCR error. To designate two clonotypes as distinct, it will be determined whether the difference is very unlikely to have arisen through PCR error. The same scheme as above of demanding a minimum number of independent observations of the minor clonotypes or a minimum number of differences between the two clonotypes will be used. The same rules described for TCR ⁇ to ensure that ⁇ 0.1% of clonotypes are misclassified as distinct will be employed.
- Sequencing from the V region will be done using an Illumina primer. There will be 3 different primers for each V segment. The primers will be placed at approximately -200, approximately -100, and approximately -30. The first sequenced bases will be the V primer sequence followed by more of V segment bases. The specific read to one of the three priming frames of a specific V segment will be assigned. The assignment will be first done through investigating the primer sequence since the primers have a known sequence that can't change. Primers of the same family can sometimes have some "cross talk" amplifying highly related sequence in the same family. The primers will be used to assign the family. The specific V segment among the segments in the family will be determined by identifying the V sequence of the family that is most similar to that of the sequencing read.
- V segments in IgH can have somatic mutations in the course of the antibody affinity maturation process and therefore a higher proportion of differences from the germline sequences will be allowed than for TCR ⁇ .
- Antibodies with more than 25 mutations ( ⁇ 10%) in the VDJ region have been observed.
- a read will be assigned to the framework of the V segment with the closest sequence as long as it has >85% homology to it.
- Related clonotypes will be assessed for being independent using the same scheme as described above. Specifically for clonotypes to be considered distinct and due to somatic mutations not error, they need to be either sufficiently frequent or have ample variation between them to ensure that less than 0.1% of clonotypes misclassified as distinct when they are not.
- the overlap sequence between the paired end reads will be determined. Bases not aligned with the V segment will be aligned to the complement of the first read to determine the overlap.
- the primers for the third framework will be ⁇ 30 bp away from the junction. Therefore, if the V is intact approximately 50 bp of sequence can be used to reach the VD junction (20 bp primer + 30 bp), and 100 bp reads will allow 50 bp to be read after the junction. This is the minimum expected number of bases that would be read after the VD junction as the deletion of some bases in V will allow for a longer read after the junction.
- the longest DJ region is expected that there will be 10 bp overlap between the sequences from the paired reads.
- the longest DJ region is expected to be 120 bp, and 80 bp of it are expected to be read from the C segment and 50 bp read from the other direction of the V region leading 10 bp overlap between the paired reads.
- Clonotypes that read the same sequence from the C primer but has different frameworks of the same V segment become candidates for consolidation in the same clonotypes. If there is overlap between the sequences obtained from the different frameworks of the V segment then the determination of whether the clonotypes are independent or not is done with the same rules as described above.
- Clonotypes that are from the same family differing from each other only by somatic mutations are identified. These somatic mutations can be restricted to sequences in the V segment read from only 1 framework, more than 1 framework, or in the DJ region.
- a Calibration test can be done to determine the identity of the correlating clonotypes for the specific patient. This can be done by sequencing IgH and TCR ⁇ RNA (or linked TCR ⁇ -TCR ⁇ sequence from a single cell) for each patient at a time of a peak of an episode, at which time the correlating clonotype level can reach their highest levels.
- a Monitoring test can be done to determine the level of the correlating clonotypes at a time point subsequent to the calibration test. This can be done by sequencing IgH and TCR ⁇ RNA and determining the level of the specific correlating clonotypes that had been identified in the calibration sample of the same patient. The level of the correlating clonotypes is used to compute the disease activity at these points.
- SLE systemic lupus erythematosus
- SLEDAI Systemic Lupus Erythematosus Disease Activity Index
- PGA Physician Global Assessment
- C3 Complement 3
- anti-ds DNA levels are available for all visits of all patients.
- Drugs being administered to the patients include prednisone, plaquenil, NSAID, NSAIDType, acetylsalicylic acid (ASA) dose, plavix, diuretic, ACE-Inhibitors or angiotensin receptor blockers (ARBs), Ca channel blocker, Triam and, solumedrol, Patients who had at least at one time during the follow up a significant change in disease activity as defined by a 3 points change on the SLEDAI or a 1 point change in PGA will be studied. Overall there are 181 patients (with a total of 815 blood samples) who fit these criteria.
- ASA acetylsalicylic acid
- RNA from all these blood samples will be subjected to multiplex PCR using primers described above to amplify the sequences that encompass CDR3 in IgH and TCR ⁇ . All the amplified materials will be sequenced (to a million reads) and the abundance of different clonotypes will be determined.
- clonotypes that are relevant to the disease will be increased at the time of high disease activity.
- not all enriched clonotypes at a point of high disease activity necessarily correlate with disease.
- enriched clonotypes at the point of high disease activity in order to identify these relevant clonotypes, a subset of clonotypes that are clearly correlating with disease and another set that clearly do not correlate with disease will be studied. Characteristics that distinguish those two classes of clonotypes will be investigated.
- the IgH and TCR clonotypes obtained at the peak of disease activity in each patient will be analyzed.
- Sets of correlating and not correlating clonotypes among those with the highest level clonotypes will be selected.
- the first step is to define clonotypes that are at a high level.
- the specific criteria to choose the clonotypes that will enter the analysis will include a combination of frequency rank of the clonotype and the level of clonotype (number of clonotype reads per million), as well as evidence the clonotype does not belong to the distribution of low frequency clonotypes.
- HPC High Prevalent Clonotypes
- These 2 sets of clonotypes can be further analyzed to identify characteristics that may distinguish them. These characteristics can then be looked for in new samples to identify the clonotypes likely to be correlating with disease activity in these samples. The blood levels of these clonotypes can then be followed to determine disease activity.
- MSLEDAI Modified SLEDAI
- a threshold of 0.05 (uncorrected for multiple testing) will be set to eliminate factors that are not likely to contribute to prediction of correlating clonotypes. Given the multiple parameters, many tests will be performed to generate multiple positive results by chance. However the main goal of this step is to filter the parameters to a smaller set.
- the set of positive parameters will then be used to create an algorithm to classify the two sets of clonotypes.
- a machine learning algorithm will be employed that uses the different parameters to classify the two sets of clonotypes. In order to minimize the risk of overfitting, the cross validation technique will be used.
- each clonotype will get a score that corresponds to the likelihood it is a correlating clonotype.
- a threshold will then be placed to classify clonotypes above it as correlating and those below it as non-correlating.
- the accuracy of the classification can be estimated by the cross validation technique; for example, the clonotypes are put in equal groups and the algorithm using all clonotypes except one group. Clonotypes in the last group (test group) are then classified using the algorithm that was obtained using the rest of the clonotypes. This is iterated as many times as the number of groups, and in each iteration all the groups except one are used for training and one group is classified.
- the accuracy of the algorithm can be estimated from the average accuracy of the different classifications in the different iterations. It is of note that in all these iterations the exact algorithm would be slightly different. The accuracy of classification is then an estimate as it is not on the final algorithm but rather on a set of related algorithms generated with training data from all clonotypes except one.
- two algorithms will be generated trained on two different correlating clonotypes sets: one correlating with SLEDAI and the other correlating with MSLEDAI. Even if the clonotypes in the training set are different the resulting algorithm may or may not be very different, depending on whether these clonotypes indeed come from two distinct populations.
- the algorithms will be compared. Additionally these algorithms will be used to identify correlating clonotypes that were not initially in the training set.
- the clonotypes identified in the two algorithms will be compared, and if the initial clonotypes in the two training sets were from the same population, the identified clonotypes are likely to be very similar. Unless the results of the algorithm were quite similar, both algorithms will be carried to identify correlating clonotypes in order to measure lupus disease activity.
- Correlating clonotypes may be enriched in cells with some surface or other markers.
- B cells with high levels of CD27 are known in active lupus patients, and hence it might be that correlating clonotypes might be enriched in the CD27 population of cells. If that is borne out to be true, prediction of correlating clonotypes can be improved by doing an enrichment for cells with high levels of CD27.
- a sequencing reaction can be performed on the IgH sequences from all B cells in the blood sample as well as from those B cells with high CD27. Correlating clonotypes are expected to be present at higher frequency in the high CD27 population than in the all blood sample.
- AI AutoImm
- the algorithm developed per the above section will be applied to identify correlating clonotypes among all the HPCs. The level of these correlating HPCs will be determined.
- the level of the correlating clonotypes can be normalized to the total number of TCR clonotypes as well as to HPCs predicted not to correlate with disease.
- the level of these correlating clonotypes at different time points will be used to compute AI score at these different points.
- the information regarding the level of these different clonotypes will be combined.
- data from IgH and TCR ⁇ clonotypes will be integrated.
- Different algorithms for making the combination will be attempted. For example, the average, median, sum, and highest correlating clonotype level will be studied.
- the clonotype level can be its simple linear read counts, the logarithm of that or some other conversion. It can potentially be the difference between correlating and non-correlating clonotypes.
- methods for weighted average can be utilized. The weighting can be based on the likelihood of a clonotype to be correlating.
- the correlation of SLEDAI and AI scores is done across all the data obtained from all the study points from all patients.
- the cross validation technique will be used.
- the level of correlation measured reflects the "cross sectional" relationship between the AI and SLEDAI scores.
- the correlation with other clinical measures like C3 and anti-ds DNA antibody levels as well as urine protein/serum creatinine for patients with kidney manifestation and blood counts for patients with hematological involvement will be studied.
- the correlation may be due to the classification of patients into high and low disease activity, and is not necessarily a reflection of AI correlating with SLEDAI score within a patient. To demonstrate that, "longitudinal" assessment will be done.
- AI and SLEDAI scores at the same study point will be assessed in two ways. First the correlation of the AI and SLEDAI in each patient will be calculated, and then the average and median patient correlation level will be computed. If the correlation seen in cross sectional analysis above is due to classification of high and low disease activity patients and not changing disease activity within individual patients, then the longitudinal correlation in individual patients is likely to be low. A high median patient correlation level suggests that AI does reflect the SLEDAI score at an individual patient level. In addition to the correlation of AI and SLEDAI scores, the correlation of AI with other relevant measures like C3 and anti-ds DNA antibody will be assessed as well as urine protein/serum creatinine for patients with kidney manifestation and blood counts for patients with hematological involvement.
- Another way to demonstrate the ability of AI score to measure disease activity changes in individual patients is by determining its accuracy in distinguishing states of high from low disease activity in the same patients.
- the two study points when the SLEDAI where at the highest (to be called HDAP for high disease activity point) and lowest levels (to be called LDAP for low disease activity point) will be selected.
- the distribution of the AI of all the HDAPs with that of the AI of all the LDAPs will be compared, and the p-value that they are different will be computed.
- the frequency that the AI at HDAP is higher than LDAP in each patient will be assessed. If AI does not change with disease activity in an individual patient then it is expected that AI at HDAP is higher than that at LDAP only 50% of times.
- Another analysis will be done where the fraction of times that AI at HDAP is higher than that at LDAP by a meaningful difference (i.e., above the likely AI variation) is determined.
- a meaningful difference i.e., above the likely AI variation
- all the study points from all the patients will be used, and the standard deviation (and relative standard deviation) of AI in the different bins of SLEDAI values can be computed. This will generate relative standard deviation across all patients (AI-RSDall) and this value may or may not be dependent on SLEDAI (i.e. the AI-RSDall may be different at different SLEDAI values).
- the proportion of patients where AI at HDAP is higher than AI at LDAP by a specific number (e.g., 2) of AI-RSDall can be computed.
- AI-RSDall is a combination of the intrinsic fluctuation of AI within a patient as well as the systematic difference of AI for patients with similar SLEDAI.
- the intrinsic fluctuation of AI can be computed within a patient by calculating the standard deviation (and relative standard deviation) of AI scores among study points with similar SLEDAI values ( ⁇ 2 points difference) within a patient.
- the median among all the patients of the relative standard deviation can be computed (AI-RSDpt-med).
- the proportion of patients where AI at HDAP is higher than AI at LDAP by a specific number (e.g., 2) of AI-RSDpt-med can then be evaluated.
- a patient state at a particular time will be classified into one of two classes: Poor Control (PC) and include patients who in 3 months will have high disease activity (SLEDAI >6 points) and/or a flare (SLEDAI increase by 3 points), and Good Control (GC) and include patients who in 3 months will have low or moderate with disease activity (SLEDAI ⁇ 6) and/or a significant reduction in disease activity (SLEDAI decrease by 3 points).
- PC Poor Control
- GC Good Control
- the classification sensitivity can then be evaluated and specificity obtained using different thresholds of AI.
- a ROC curve that describes the performance of AI in predicting the state of the patient (PC or GC) can be generated 3 months ahead of time. The performance obtained by this test will be compared with that of standard clinical measures including SLEDAI, anti-ds DNA and C3 levels.
- the relative AI change can be computed by dividing the difference of AImeas and Alexp by AImeas.
- the sensitivity and specificity of AI in predicting a significant change in SLEDAI 3 months later can be evaluated by using different thresholds of Rel-AI-diff.
- the thresholds can be bidirectional so if the Rel-AI-diff at a specific study point is higher than a specific threshold a flare is predicted, and similarly if it is lower than the negative of the specific threshold a significant reduction in SLEDAI is expected.
- the AI score at point -1 and at point 0 will be needed, and hence one data point per patient will not have an MAI associated with it.
- the specific formula to incorporate the velocity into AI calculation to obtain MAI will be optimized. This optimization may be done through maximization of the correlation of MAI and SLEDAI three months later.
- the cross validation design will be used to evaluate and control the degree of overfitting. Correlation can be done for data points of all samples, but also can be done at a patient level and the median correlation among all patients can be assessed. The latter approach ameliorates the issue of some patients having a systematic bias of too low or too high AI score.
- the same type of ROC analysis that was mentioned for AI can be performed to assess its ability to predict SLEDAI 3 months later.
- an analysis can be done to show the ability of MAI at point 0 to distinguish PC and GC states at point 1. Additionally, an analysis similar to what was described for AI to assess the ability of MAI at point 0 can be performed to predict significant disease activity change (3 points change on SLEDAI) between points 0 and 1. For this latter analysis different thresholds of Rel-AI-diff, AI-RSDall or AI-RSDpt-med can be used. The performance of MAI will be compared with that of AI to determine whether the addition of the velocity factor is useful.
- One complication of the described study is that treatment changes are done for different patient during the follow up period of the study. This is likely to complicate the prediction of disease activity. For example, consider two patients with the same AI score at point 0 and one of those patients had a reduction in medication at the same time. The likelihood of this patient to have a rise in disease activity at point 1 is then likely to be higher than for the patient who did not change medications at point 0. This is likely to lead to underestimation of the performance of AI.
- One way to alleviate that is to eliminate all the points with significant medication changes from the study. Another is to modify the AI score to include whether a patient has a medication change and create a medication-modified AI. So in the example above with the two patients, the one with the medication change will have a higher medication-modified AI.
- the predictive ability of the disease activity marker can be maximized. Therefore the predictive ability of the TCR/BCR repertoire information integrated with other markers will be tested. These markers include standard markers used in the clinic like anti-ds DNA and C3 levels. It will also include other markers that are published. For example a panel of chemokines has already been shown to have some predictive ability using the same set of patients as will be used. Whether this panel will increase the predictive ability of the TCR and BCR repertoire will be evaluated.
- the first step is to integrate the AI score with the additional measure to generate an Expanded AI (EAI) score. Different ways to do the integration can be assessed, and this can be optimized through maximization of the correlation of EAI and SLEDAI three months later.
- the cross validation design will be used to evaluate and control the degree of overfitting. Using EAI the ability to predict disease activity 3 months later will be assessed by its ability to distinguish GC from PC and to predict changes in disease activity. The performance in measuring disease activity and change in disease activity can be described through ROC analysis as described above.
- the number of variables being tested is high compared with the number of samples. This can lend itself to overfitting, with initially promising results not being able to be validated in later studies.
- a cross validation approach will be used in the training to get a measure of the extent of overfitting. However, a validation on an independent set of samples will be involved in later work. This is not part of this proposal, but this marker can be clinically applicable.
- AI, MAI, or EAI should be validated and the specific way to compute the measure of interest.
- One specific algorithm will be taken for validation.
- one or more specific endpoints will be specified.
- the sensitivity and specificity of AI can be assessed in the ability to distinguish GC from PC 3 months later to evaluate the ability of AI to predict disease activity. In another example the sensitivity and specificity of AI to predict significant disease activity change in 3 month using a specific Rel-AI-diff threshold can be assessed.
- the methods of the provided invention will be used to measure the response of an SLE patient to drug therapy. Determination of whether an SLE patient being given an expensive drug with serious side effects is responding to the drug plays a role in both patient care and also for making the administration of such care cost effective. Many clinical indicators of disease activity respond to treatment imprecisely and after a time lag of up to several months. During this time, disease may progress and side effects may add complications to therapy. A prompt understanding of the drug response would allow patients to be switched to more effective therapies more rapidly.
- a 35 year old African American female with a prior diagnosis of lupus presents to her regular rheumatologist.
- the patient's disease status is assessed on a quarterly basis through a comprehensive clinical assessment in addition to laboratory testing including measurement of C3, anti-ds DNA antibody levels, blood counts, and urinalysis.
- the rheumatologist refers the patient to a nephrologist for a kidney biopsy to assess inflammatory status of the kidney and orders serum creatinine and 24 hour urine protein to creatinine ratio to assess the degree of the impairment of the kidney function.
- a kidney biopsy shows evidence of diffuse lupus nephritis, while the urine protein to creatinine test reveals evidence of nephrotic syndrome (urine protein to creatinine ratio of 3.6).
- nephrotic syndrome urine protein to creatinine ratio of 3.6.
- Immunomodulators such as mycophenolate mofetil (Cellcept) are often used although sometimes in severe cases drugs such as Methotrexate, Azathiopurine (Imuran) Cyclophosphamide (cytoxan), are prescribed.
- Rituximab (Rituxan) is also sometime used as a second or third choice.
- One of these drugs is often used in combination with a systemic steroid such as Prednisone or methylprednisolone in order to suppress the acute symptoms.
- mycophenolate mofetil is prescribed at 150 mg per day alongside 60 mg of prednisone.
- the patient's prednisone dose is tapered over ⁇ 6 weeks if the clinical picture allows that.
- the first question that is determined is whether the patient is responding to therapy, and as a result, can the dose of steroid can be appropriately decreased. Therefore, during this period the patient's serum creatinine as well as urine protein and creatinine are followed to ensure the patient is responding to the medications. Frequent kidney biopsy can be done to detect whether the inflammatory damage is being reversed; however, routine use of kidney biopsy carries too great a risk and is too invasive to be practical. Current blood based markers that are being used to assess inflammatory status are of limited use in making this decision in that they are not sufficiently well correlated with underlying disease to be relied upon to risk the increased side effects that accompany high doses of steroids.
- Serum and urine function markers may have some delay in detecting improvement in inflammatory status and hence steroids may be tapered before these markers show a definitive change and hence extending the period of the renal flare. A slower taper, informed by more sensitive markers, in these cases could have shortened the flare period preventing further damage to kidney tissue.
- steroid After the reduction of steroid to a maintenance dose of approximately 10mg the patient may show persistently elevated levels of protein in the urine and the high urine protein to creatinine ratio of 2, and the physician must now decide whether to switch from Cellcept to another medication.
- AutoImm Load would be very helpful in this situation to assess the response to therapy by measuring disease activity either alone or in combination with other markers of disease activity.
- An algorithm for AutoImm Load will be developed using the study described above.
- the correlating clonotypes that will be used to calculate AutoImm Load will be measured using a calibration test. This calibration test will be done using blood from a patient at a time of peak disease activity, for example at the start of therapy. The calibration test will be performed using blood or alternatively using the tissue that is affected (e.g. kidney biopsy or skin biopsy). At a later time at which the response to therapy is to be assessed, a blood sample will be taken and used along with the calibration test to measure AutoImm Load. This will be used to make a treatment decision. If the correlating clonotypes are derived from a populations study, there is no need for the calibration test and a blood test at the time at which the response to therapy is to be assessed is sufficient to measure AutoImm Load in order to inform the
- the methods of the provided invention can be used to determine the appropriate time to taper or stop therapy for an SLE patient.
- a further difficulty lies in the lack of sensitivity of these measurements.
- Subclinical disease can nonetheless result in a re-flaring of the disease if therapy is tapered too early.
- courses of immunosuppressant therapy are typically administered for a time period that is much longer than is necessary for the average patient to ensure that the risk of re-flaring is low for the average patient yet may still be long enough for the tail end of distribution. Therefore significant over-treatment, causing side effects and costs are occurring in most patients, while under-treatment of some patients occurs causing potentially preventable reflares.
- a method that could measure subclinical activity that was predictive of the risk of re-flaring would allow therapy to be tapered based on such measures instead of relying on overtreatment by design.
- the patient from Example 7 is on prednisone and mycophenolate mofetil for a period of 6 months and urine protein to creatinine ratio returns to a level of 0.5.
- This level remains above the baseline level expected in healthy individuals but it is not clear that this level is not due to some kidney damage that is not reversible.
- Other clinical measures of inflammation are normal and the patient does not report any other symptoms.
- the patient is experiencing moderate levels of nausea and weight gain as possible side effects to the medications that additionally have serious long term side effects.
- the doctor is faced with a difficult decision: balancing the fear of tapering the Cellcept and/or steroid too quickly, which could result in renewed kidney inflammation and likely further long term irreversible kidney damage and the adverse reactions that can occur due to the medications.
- AutoImm Load would be very helpful in this situation to assess whether or not to taper therapy by measuring disease activity either alone or in combination with other markers of disease activity.
- An algorithm for AutoImm Load will be developed using the study described above.
- the correlating clonotypes that will be used to calculate AutoImm Load will be measured using a calibration test. This calibration test will be done using blood from a patient at a time of peak disease activity, for example at the start of therapy.
- the calibration test could be performed using blood or alternatively using the tissue that is affected (e.g. kidney biopsy or skin biopsy).
- a blood sample can be taken and used along with the calibration test to measure AutoImm Load.
- flares arise without warning, thus thwarting the physicians' efforts to treat the disease preventively. Waiting for flares to occur before beginning treatment subjects patients to potentially destructive clinical symptoms, can involve expensive and inconvenient hospitalization, and may cause long term organ damage to be done while also necessitating aggressive therapeutic interventions that are themselves fraught with side effects.
- a much more desirable paradigm would be a therapeutic paradigm in which flares are detected at a subclinical phase at which time therapy could be administered proactively saving significant suffering to the patient, resulting in less expensive hospitalizations and ultimately enabling better long term prognosis for the patients.
- Example 7 The patient from Example 7 is recovering from the acute flare described above, and the patient is tapered off of all therapies except Plaquinil and a low dose of 5 mg of Prednisone. Nevertheless this patient remains at a high risk of having another inflammatory episode. As a result, this patient will remain in the care of a rheumatologist who will continue following patient's clinical symptoms and laboratory tests. Unfortunately these symptoms and tests do not provide early warning for an imminent flare until patients actually have exhibited clinical symptoms of a flare and the sequence repeats itself. A highly specific marker of increasing subclinical activity could be included in the routine clinical assessment of the patient in order to detect unambiguous signs of a flare which may reach a clinically detectable stage within the subsequent 1-3 months. Beginning therapies earlier might make the flare less severe and may allow treatment to be accomplished with less long term organ damage or less steroids used than what is currently the case.
- AutoImm Load would be very helpful in this situation to assess the likelihood of an incipient flare by measuring disease activity either alone or in combination with other markers of disease activity. This score either by itself or the rate of increase (velocity) or acceleration of this score can be used to assess the likelihood of progression to a flare.
- An algorithm for AutoImm Load could be developed using the study described above.
- the correlating clonotypes that will be used to calculate AutoImm Load could be measured using a calibration test. This calibration test could be done using blood from a patient at a time of peak disease activity, for example at the start of therapy. The calibration test could be performed using blood or alternatively using the tissue that is affected (e.g. kidney biopsy or skin biopsy).
- a blood sample can be taken and used along with the calibration test to measure AutoImm Load. This can be used to make a treatment decision. If the correlating clonotypes are derived from a populations study, there is no need for the calibration test and a blood test at the time at which the flare risk is to be assessed is sufficient to measure AutoImm Load in order to inform the treatment decision.
- SLE affects many organs and produces many potential symptoms including ones that are very common in the healthy populations. For example, if an SLE patient complains of a headache, the headache may be a sign of CNS lupus or can be due to the common headache. Similarly, if SLE patients complain of worsening fatigue over a period of time, the worsening fatigue may be due to deterioration of their disease or can be due to depression or other causes. The availability of an objective measure that reflects disease activity can be of great help in the management of SLE patients.
- Example 7 presents to the rheumatologist with chief complaints of headache, fatigue, and difficulty with concentration. Patient's headache is recurrent and only transiently gets better with Motrin treatment. The patient's SLE is otherwise in good control. Relevant psychosocial stressors in the patient's life include that she is going through divorce. Physicians are in a dilemma when they face SLE patients with symptoms that are non-specific to SLE and are common in the general population. Is the patient suffering from CNS lupus? Or could she suffering from other common causes of her symptoms, like depression? Current laboratory tests currently lack the sensitivity and specificity to be relied on to distinguish these possibilities. A reliable test to measure SLE disease activity can be utilized routinely to help in distinguishing the two possibilities.
- AutoImm Load would be very helpful in this situation to objectively assess the disease activity either alone or in combination with other markers of disease activity.
- An algorithm for AutoImm Load will be developed using the study described above.
- the correlating clonotypes that will be used to calculate AutoImm Load willl be measured using a calibration test. This calibration test will be done using blood from a patient at a time of peak disease activity, for example at the start of therapy. The calibration test will be performed using blood or alternatively using the tissue that is affected (e.g. kidney biopsy or skin biopsy). At a later time at which the objective disease activity is to be assessed, a blood sample can be taken and used along with the calibration test to measure AutoImm Load. This will be used to make a treatment decision. If the correlating clonotypes are derived from a populations study, there is no need for the calibration test and a blood test at the time at which the objective disease activity is to be assessed is sufficient to measure AutoImm Load in order to inform the treatment decision
- MS therapy is measuring how well and whether a patient is responding to a drug therapy.
- clinical assessments such as the Expanded Disability Status Score (EDSS) which measure the degree of physical impairment that has resulted from the disease.
- EDSS Expanded Disability Status Score
- Clinical parameters around relapses can be used to assess disease progression, but these are coarse and lagging indicators, as patients can go several years between relapses, during which little evidence can be gleaned from clinical assessments.
- brain imaging such as gadolinium enhanced MRI can be used to examine brain lesions. MS patients are typically given such an MRI on a yearly basis. However, such images lack specificity.
- MRI Magnetic MRI
- Patient profile A 30 year old female comes to the hospital with monocular visual impairment with pain. She is given a neurological assessment and a lumbar puncture to obtain cerebral spinal fluid which is used to assess whether clonal T cells are present. She also is referred for a brain MRI. Based on these tests, a diagnosis of MS is made. She is prescribed Betaseron 250 mcg per injection to be self administered subcutaneously every other day. At a follow-up visit six months later, the patient is complaining of depression and weight gain. No further neurological events have been reported to the physician. The doctor is now faced with a clinical dilemma. Should the doctor maintain the therapy as it is been administered? Should a new therapy be used? Should the doctor order an MRI incurring cost and subjecting the patient to additional contrast exposure? Should the doctor wait until the next scheduled MRI shows new lesions? Should the doctor wait to see if flares recur? All of these decisions would benefit from an unambiguous measure of whether the disease is active or not.
- AutoImm Load would be very helpful in this situation to assess the response to therapy by measuring disease activity either alone or in combination with other markers of disease activity.
- An algorithm for AutoImm Load will be developed using the studies described herein.
- the correlating clonotypes that will be used to calculate AutoImm Load will be measured using a calibration test. This calibration test will be done using blood from a patient at a time of peak disease activity, for example at the start of therapy. The calibration test could be performed using blood or alternatively using the tissue that is affected (e.g. CSF).
- a blood sample can be taken and used along with the calibration test to measure AutoImm Load. This can be used to make a treatment decision. If the correlating clonotypes are derived from a population study, there is no need for the calibration test and a blood test at the time at which the response to therapy is to be assessed is sufficient to measure AutoImm Load in order to inform the treatment decision.
- flares As in all autoimmune diseases, the amelioration of flares is a principle goal of therapy. Not only are flares debilitating for the patient and expensive to treat, but it is increasingly believed that each flare contributes to longer term non reversible disease progression.
- Several therapies can be used to control incipient flares such as IV methylprednisolone or oral prednisone. Such medications have significant side effects and as such are not prescribed without evidence of an active flare.
- a measure of increasing subclincal activity that was correlated with subsequent clinical flares could be used to inform this sort of proactive flare treatment which could result in shorter and less damaging flares.
- therapies that demonstrate high clinical efficacy for reduction of flares that carry risks of very significant and lethal of side effects.
- Tysabri a drug that has been shown to result both in improved clinical outcomes and to increase the risk of deadly brain infections such as PML. These risks have reduced the value of such drugs to last line therapy when other drugs are proving to no longer control progression and limited the value of these drugs as chronic treatments.
- a test that could predict when the flare state is incipient could increase the utility of such drugs as they could be used in a manner similar to steroids to control acute flare periods while minimizing the risks of lethal side effects.
- the patient from Example 11 is on Betaseron for 3 years and reports a clinical flare that lasts a week.
- the patient's MRI at the end of the year shows significant new lesions (multiple discrete variable sized ovoid perpendicularly directed T2W and FLAIR hyperintense lesions (plaques), appearing iso-hypointense on T1W images and hyperintense on T2W images involving bilateral periventricular and subcortical white matter regions, including the calloso-septal interface).
- the doctor is concerned that the patient is at high risk of flares over the course of the next 12 months.
- a clinical dilemma presents itself. Does the doctor wait for further clinical symptoms to intervene with additional therapy? Should the doctor switch therapies?
- AutoImm Load would be very helpful in this situation to assess the risk of flare by measuring disease activity either alone or in combination with other markers of disease activity.
- An algorithm for AutoImm Load could be developed using the studies described in this invention.
- the correlating clonotypes that will be used to calculate AutoImm Load could be measured using a calibration test. This calibration test could be done using blood from a patient at a time of peak disease activity, for example at the start of therapy. The calibration test could be performed using blood or alternatively using the tissue that is affected (e.g. CSF). At a later time at which the risk of flare is to be assessed, a blood sample can be taken and used along with the calibration test to measure AutoImm Load. This can be used to make a treatment decision. If the correlating clonotypes are derived from a population study, there is no need for the calibration test and a blood test at the time at which the flare risk is to be assessed is sufficient to measure AutoImm Load in order to inform the treatment decision
- AutoImm Load would be very helpful in this situation to assess the compliance with therapy by measuring disease activity either alone or in combination with other markers of disease activity.
- An algorithm for AutoImm Load will be developed using the studies described herein.
- the correlating clonotypes that will be used to calculate AutoImm Load will be measured using a calibration test. This calibration test will be done using blood from a patient at a time of peak disease activity, for example at the start of therapy. The calibration test could be performed using blood or alternatively using the tissue that is affected (e.g. CSF). At a later time at which the compliance with therapy is to be assessed, a blood sample will be taken and used along with the calibration test to measure AutoImm Load.
- the analysis framework that will be used for analysis of mouse data is similar to that described above for the human data.
- the mouse samples will be sequenced to less depth than the human samples.
- the blood samples from the mouse will be 100 ⁇ 1.
- 100 ⁇ 1 of blood there are ⁇ 100K lymphocytes and hence sequencing to a depth much higher than 100K does not significantly improve the precision. Therefore, only 100K reads for each mouse sample will be obtained.
- the number of reads will be smaller for mouse than humans, a larger fraction of mouse total and blood lymphocytes will be sampled.
- the number of total mouse lymphocytes is expected to be more than 3 orders of magnitude smaller than that of humans.
- 100 ⁇ l of blood will provide a better sampling ( ⁇ 10%) of the lymphocytes in the mouse blood at the time when compared to sampling obtained using 10 ml of human blood (0.2%).
- a mouse model of SLE will be used to study the relationship between TCR/BCR repertoire and disease activity.
- the mouse model will be the B6 with the sle1 and sle3 loci from NZM2410. These B6.sle1.sle3 (BSS) mice develop SLE-like nephritis in a spontaneous fashion.
- BSS B6.sle1.sle3
- Three types of cohorts will be studied. For all study points, blood BUN, creatinine, and anti-nuclear autoantibodies, urine protein, and creatinine level will be obtained. It will be determined whether a score generated from blood TCR/BCR repertoire correlates well with these measured indices of kidney disease.
- the first cohort will be similar to the human cohort described where longitudinal blood samples will be collected along with kidney function assessment.
- mice 7 BSS mice will be followed on a monthly basis till month 8. At the end, these mice will be sacrificed and in addition to blood, spleen and kidney tissue are analyzed. As a control, 5 B6 mice will be assessed in a similar manner.
- the second cohorts will be cross sectional where different cohorts of animals will be sacrificed at specific times and spleen, kidney, and blood samples will be analyzed at that time. Specifically, 5 BSS mice will be sacrificed each month and blood, spleen, and kidney will be analyzed. As a control, two B6 control mice will be assessed in the same fashion. Finally a third cohort will be treated with steroids after disease onset and nephritis assessment and blood samples obtained on a regular basis after that.
- mice that have the disease will be treated with steroids and then on a biweekly basis for the next 4 months blood is taken for TCR/BCR repertoire analysis and kidney function assessment.
- BSS mice will be treated with placebo and followed in a similar fashion.
- TCR and BCR repertoire analysis will be performed from all the study points (i.e. different time points and different tissues for the same time point). The analysis will involve 2 stage PCR, sequencing processing, and primary data analysis as described above.
- a set of clonotypes that correlate with renal function will be identified.
- urine protein/creatinine ratio, serum creatinine, or BUN levels can be used.
- the correlation of the blood level of each HPC clonotype with each of the three measures can be assessed.
- the correlation threshold will be picked where only 10% of the clonotypes with a correlation level above that threshold are expected to have the observed correlation level by chance (10% false discovery).
- clonotypes might be identified relevant to disease by a "functional" method of enrichment of specific clonotypes in kidney tissue.
- a set of clonotypes may be identified in cohort 2 that may be relevant to disease, and these will be called functionally-identified correlating clonotypes.
- the extent of overlap between the "statistical" definition and the "functional" definition of correlating clonotypes can be assessed.
- Cohorts 1 and 3 have kidney samples collected at the last time point. It can be assessed whether clonotypes enriched in these kidney samples are present in the blood and are among the clonotypes with higher correlation with renal function.
- the dynamics of correlating clonotypes can then be evaluated. For example, using data from cohort 2, the time course of the rise and fall (if any) of their levels will be evaluated in the three compartments: kidney, blood, and spleen.
- correlating clonotypes In the statistically identified correlating clonotypes, a subset of the correlating clonotypes would be identified by virtue of their correlation with renal function.
- the correlating clonotypes can be identified without knowing the renal function data. In other words, the characteristics that distinguish the correlating clonotypes from those that are irrelevant to disease can be understood. In order to do that a set of clonotypes with low correlation to renal function will be identified as control non correlating clonotypes.
- One utility for the mouse experiment is the availability of cells allowing for assessment of whether correlating clonotypes are enriched in a specific subtype of cells. It will be studied whether correlating clonotypes are enriched in some cell subtypes; sequencing from the full set of lymphocytes and from the specific subtype where correlating clonotypes are enriched can be done, and this criteria of enrichment can be used as an extra characteristic to distinguish correlating clonotypes from other disease-irrelevant clonotypes.
- hypothesis driven and hypothesis free The first is to try a dozen candidate surface markers on T or B cells in a set of samples.
- one candidate is CD69 on T cells to select activated T cells.
- B cells studies have shown the increase of CD27 high cells in active SLE, and therefore that is a good candidate for a marker of cells that may have enrichment of the correlating clonotypes.
- the specific cell subtypes is purified through FACS.
- a sequencing reaction is done for cDNA from the full complement of the lymphocytes as well as for cDNA from the lymphocytes that were purified by FACS from a collection of different samples. It will be assessed whether the two sets of correlating and non correlating clonotypes are present in different proportions in the full complement of lymphocyte compared to the FACS purified subset. Markers that have a large difference can be useful in identifying correlating clonotypes. Enrichment of clonotypes in subtypes of cells with these markers will be used in addition to the sequence parameters to detect correlating clonotypes.
- markers will be searched for which are differentially expressed in cells with a correlating clonotype from other cells.
- a few cases will be chosen where a specific TCR clonotype is clearly correlating with disease, and cases will be picked where that clonotype is highly enriched that it represents the majority of the clonotypes with the same V segment.
- FACS will be done using antibody to the specific V segment (antibodies against all V segments are commercially available) to select a population that is highly enriched for cells carrying the correlating clonotype.
- the RNA can be prepared from these cells and the expression of all the genes can be studied by performing an array experiment.
- RNA from lymphocytes can be used and/or RNA from FACS purified cells carrying another irrelevant V segment. Markers that maximally distinguish the sample obtained from the FACS purified V segment with the correlating clonotype from the controls can be searched for. Markers, including surface markers (since it is much easier to do FACS with surface proteins) that distinguish the two populations can be found. If a consistent RNA marker from samples of several mice is observed it will be validated at the protein level. Using the same samples, antibodies against the marker protein will be used in a FACS assay to purify cells carrying the marker protein. More than one marker may be tested to increase the chance of validating one of them. The TCR and/or BCR from the purified cells will be sequenced.
- RNA results hold at the protein level then the correlating clonotypes should be enriched in the purified subset of cells. After validating that RNA results still hold at the protein level, the results will be validated in other samples. Samples that were not subject to the array analysis will be subjected to FACS analysis using the antibody to the marker protein(s). The TCR and/or BCR of the purified cells will be sequenced. It will be evaluated whether the correlating clonotypes are enriched in the cells purified using antibody to the specific marker(s). This will validate the utility of the marker(s) in the identification of correlating clonotypes.
- the algorithm for correlating clonotypes from above can be applied to identify in all samples of cohorts 1 and 3 correlating clonotypes by virtue of their sequence and/or markers.
- an AI score can be generated that correlates with a measure of renal function.
- the correlation of AI and renal function measures can be evaluated in a cross sectional manner (all study points of all mice).
- the question of whether the AI score changes in an individual mouse can also be evaluated when renal function changes. This can be evaluated by comparing the AI from high and low renal function in the same animal in a similar manner to what is described in humans.
- Two sequences can be amplified from the same cell, and during amplification they can be linked to form one amplicon. Information on the presence of these two sequences in the same cell can then be preserved even if the linked sequences are mixed with a pool of sequences from other samples.
- An example of the utility of this linking scheme is for assessment of the diversity of TCRs.
- the diversity of TCR is generated from the diversity of each of TCR ⁇ and TCR ⁇ .
- the combination of a TCR ⁇ . and TCR ⁇ in a cell adds significantly to the diversity.
- nucleic acids are extracted from a sample with a plurality of T-cells, the information of which TCR ⁇ is present in the same cell as TCR ⁇ is lost.
- a method that allows the preservation of this information is presented here. This method comprises separating the cells in distinct compartments, amplifying the desired sequence in a way that covalently links initially separate amplicons, and optionally mixing all the amplified sequences for later analysis.
- Several methods can be conceived to place each cell in a compartment.
- one method is to put cells in a microdroplet or a micelle emulsion that can be used in PCR. These droplets can be filled in a directed manner or randomly filled in such a way that most droplets contain at most a single cell. Also, cell sorting can be used to place a single cell in a PCR container. Amplification of nucleic acid can then be performed in each droplet.
- sequence 1 can be amplified using primer 1 and primer 2.
- Primer 2 carries a 5' overhang sequence that is not complementary to the genomic sequence ( FIG. 9A , thin line).
- sequence 2 can be amplified using primer 3 and primer 4 ( FIG. 9A ).
- Primer 3 carries a 5' overhang sequence that is complementary to the overhang sequence of primer 2 ( FIG. 9A , line dashed line).
- the two overhangs (or the two linking sequences) representing two complementary sequences are drawn in thin lines; one sequence is shown as a solid line and its complement is shown as a dashed line.
- Other complementary sequences are drawn to have the same solid colors: black, and grey for sequence 1 and 2, respectively.
- each of the two amplification products has a linking sequences on one end and the two products can anneal to each other and strands can be extended to form a full double stranded molecule ( FIG. 9B ).
- This molecule now has sequence 1 and 2 linked to each other and can then be amplified with primers 1 and 4 ( FIG. 9C ).
- All 4 primers can be put in the reaction at the same time to achieve sequence linking and amplification. It may be beneficial to add low concentration of primers 2 and 3. The low concentration of primer 2 and 3 will ensure that the two individual sequence amplicons will reach saturation early in the reaction allowing the linked amplicon to dominate the PCR reaction in the latter stages of the reaction. This will lead to the final reaction having a high concentration of the linked amplicon relative to the individual sequence amplicons.
- Scheme 1(a) is a variant of Scheme 1 in which the linking sequence is identical to the primer 2 sequence ( FIG. 10 ).
- Sequence 1 can be amplified using primer 1 and primer 2 with no overhanging sequences on the primers ( FIG. 10A ).
- Primer 3 carries a 5' overhang sequence that is complementary to primer 2 ( FIG.10A ).
- Sequence 2 can be amplified using primer 3 and primer 4 creating a linking sequence that is complementary to Sequence 1 ( FIG.10A ).
- Other complementary sequences are drawn to have the same colors: black, and grey for sequence 1 and 2, respectively.
- FIG.10B After amplification with primers 1-4, the two products can anneal to each other via the Primer 2 sequence and strands can be extended to form a full double stranded molecule ( FIG.10B ).
- This molecule now has sequence 1 and 2 linked to each other and can then be amplified with primer 1 and 4 ( FIG. 10C ).
- Scheme 2 shown in FIG. 11 is a similar scheme to scheme 1 except that the ultimate amplification is achieved with sequences that are not complementary to the genome.
- the priming sequences can be chosen to be ideal for amplification with no off target amplification. This can be helpful in cases where primers complementary to the genomic sequence to be amplified are not ideal.
- low concentration of primers 1-4 can be used, minimizing off target amplification.
- scheme 2 can be adapted to a multiplexing scheme in which more than a pair of primers is used without causing as many primer interactions. Each pair of sequences to be linked will have its own unique 4 primers that need not be at high concentration.
- One pair of amplification primers can amplify all the pairs of linked sequences ( FIG. 11C ).
- Sequence 1 can be amplified using primer 1 and primer 2 ( FIG. 11A ).
- Primer 1 and 2 carry on their 5' ends distinct overhang sequences that are not complementary to the genomic sequence ( FIG. 11A , dotted and thin lines, respectively).
- sequence 2 can be amplified using primer 3 and primer 4 ( FIG. 11A ).
- Primer 3 and 4 carry on their 5' ends distinct overhang sequences that are not complementary to the genomic sequence ( FIG. 11A ).
- the overhang on primers 1 and 4 are labeled as "Amp 1" (dotted) and "Amp 2" (wavy) and are sequences not complementary to the genome ultimately used for amplification ( FIG. 11A ).
- the overhangs of primer 2 (thin) and 3 are the linking sequences that are complementary to each other.
- Other complementary sequences are drawn to have the same colors: black and gray for sequence 1 and sequence 2, respectively.
- each of the two amplification products has a linking sequences on one end and the two products can anneal to each other and strands can be extended to form a full double stranded molecule ( FIG. 11B ).
- This molecule now has sequence 1 and 2 linked to each other and can then be amplified with primer 5 and 6 ( FIG. 11C ).
- primers 1-4 can initially be used, and after the linking of the two sequences, primer 5 and 6 can be added.
- a more preferred embodiment will have all the primers added in the first step.
- Yet a more preferred embodiment will have all the primers present initially with the concentration of primers 1-4 lower than that of 5 and 6. This allows the full linking and amplification to occur in one step.
- the low concentration of primers 2 and 3 will ensure that the two individual sequence amplicons will reach saturation early in the reaction allowing the linked amplicon to dominate the PCR in the latter stages of the reaction. This will lead to the final reaction having a high concentration of the linked amplicon relative to the individual sequence amplicons.
- the low concentration of primers 1-4 minimizes any off target amplification that can occur if these primers were lower quality than primers 5 and 6.
- primers 5 and 6 for amplification enables more efficient multiplexing ( FIG. 12 ).
- One pair of primers (primers 5 and 6) can be used to amplify all the linked sequences.
- the linking sequences can be designed in different ways for different applications. The example illustrated in FIG. 12 is for two pairs of sequences to be linked, but this scheme can be extended further to 10's, 100's, or 1000's of sequences. If there is a set of gene pairs to be linked (e.g., TCR ⁇ with TCR ⁇ and IgH with IgK) then the linking sequences for each pair can be different.
- linking sequencing for TCR ⁇ and ⁇ will be different from those of IgH and IgK as depicted by thick dashed lines (TCR ⁇ and TCR ⁇ ) or thin dashed lines (IgH with IgK) ( FIG. 12A ). All the amplified sequences in this example are shown in the same color.
- the amplification primers for the all the linked sequences will be the same primers: 5 and 6 as depicted in FIG. 11 . In other applications the same linking sequences can be used if there is no specific pairing.
- sequence 2 has two linking sequences.
- the linking sequence of primer 3 allows the linking to sequence 1 through the linking sequence of primer 2 (linking sequence complementary pair LS 1).
- the linking sequence of primer 4 allows the linking to sequence 3 through the linking sequence of primer 5 (linking sequence complementary pair 2, LS2) ( FIG. 13A ).
- the whole of sequence 2 becomes a linking sequence to link sequence 1 and sequence 3.
- the Amp1 and Amp 2 sequences complementary to primers 1 and 6 enable amplification after formation of a molecule with linked sequences 1-3.
- colon cancer represents one of the most common malignancies in the US. Approximately 150,000 patients per year are diagnosed with colon cancer at serious but treatable stages (Stage II and Stage III). These patients are treated by tumor resection followed by a course of chemotherapy. While these treatments are generally effective, there is nonetheless a significant chance that these patients will have metastatic recurrences of the primary tumor in the years following treatment.
- Stage III patients for instance will have a recurrence within 5 years of surgery.
- recurrences can be either isolated (e.g. in the colon or liver) or multifocal. In either case but particularly if they are isolated, detecting them at an early stage can play a role in maximizing the chances of successful therapy (surgery and/or chemotherapy).
- CT scan of the abdomen and chest is used to identify tumors visible on these images. Typically these scans are done at intervals of 6-12 months for the first 5 years post therapy. While these scans can reveal early stage malignancies, there clinical effectiveness is in debate. Drawbacks of these scans include the fact that they subject the patients to significant amounts of radiation which can itself cause further tumors and the significant expense.
- Another blood based test has been shown to have some value: CEA testing. This antibody test measures the level of a protein in serum that is specific to some colon tumors. The drawback to CEA testing is its lack of sensitivity ( ⁇ 60% of patients with positive CT scans have a positive CEA test).
- lymphocytes obtained from the resected primary tumor are used to develop an immune profile that can be used to add sensitivity to a blood based test for early cancer recurrence TCRs (and/or BCRs) of the lymphocytes found in the resected tumor can be amplified and sequenced.
- Clonotypes that are enriched in the tumor sample are likely relevant to the immune response to the tumor.
- Subsequent blood draws from the patient can be used to assess the level of these clonotypes.
- a rise in the level of these clonotypes can signal an immune response to a tumor recurrence. In this case the detection of the immune response may be more sensitive than the detection of the tumor marker itself.
- This Recurrence score can thus be calculated in a new patient by measuring the clonotypes in the resected tumor (calibration point) and the data from the clonotypes found in the same patient's blood at a later time during the surveillance for recurrence.
- the use of the tumor data allows great reduction in the number of clonotypes present in blood that are considered in this analysis.
- the discovery study can be done using the same samples but the study is used to identify parameters that distinguish "correlating" from “non correlating" clonotypes.
- Sequence motif The motif can be a specific V or J region, a combination VJ, or short sequences in DJ region that is associated with a clonotype being correlating; 2) Size of the clonotype; 3) Level: Absolute level (number of reads per million) or rank level; 4) Similarity to other clonotypes: the presence of other highly related clonotypes, like those with silent changes (nucleotide differences that code for same amino acids) or those with conservative amino acid changes; 5) For the BCRs the level of somatic mutations in the clonotype and/or the number of distinct clonotypes that differ by somatic mutations from some germline clonotype.
- the clonotypes measured in the resected tumor are used to generate a model that predicts correlating clonotypes in as yet unseen samples.
- This model can also be used to generate a Recurrence Risk score in a manner analogous to that described above. In this model there would be no need to measure the clonotypes in the resected cancer tissue in a new patient undergoing recurrence surveillance but rather the Recurrence Risk could be assessed by simply measuring the clonotypes in a given blood sample.
- parameters can be identified to predict the clonotypes that are correlated to the immune system response to the tumor.
- a model can then be used to generate a Cancer Risk score that predicts the progression risk to colon cancer.
- This algorithm can then be applied to new patient's blood sample to measure the risk of primary colon cancer.
- Heart transplants are a relatively uncommon procedure as the supply of organs is very limited. 3,500 heart transplants performed every year worldwide. Each procedure is very expensive and the organs that are used are priceless. As a result the patients that receive these organs are treated extremely proactively.
- patients are given periodic heart biopsies to measure inflammation of the organ. Based on these tests, aggressive courses of immunosuppressants may be given.
- These procedures have several limitations. As invasive surgical procedures they have risks to the patient. Furthermore they are expensive and can only be done at infrequent intervals.
- TCR (and/or BCR) profiles are used to assess the state of "rejection” and generate a Rejection Risk score that predicts the likelihood of rejection in a specific time frame. It is conceived that a discovery study can be performed to determine the likelihood of rejection given the profile of blood TCR (and/or BCR). This can be used in the clinic to inform the immunosuppressive therapies that are being used.
- a population of post transplant patients with blood samples with known clinical outcome can be used.
- TCR and/or BCR
- correlation of individual clonotypes with rejection outcome can be used to distinguish correlating from non-correlating clonotypes.
- parameters can be derived that distinguish those two classes of clonotypes.
- Sequence motif The motif can be a specific V or J region, a combination VJ, or short sequences in DJ region that is associated with a clonotype being correlating; 2) Size of the clonotype; 3) Level: Absolute level (number of reads per million) or rank level; 4) Similarity to other clonotypes: the presence of other highly related clonotypes, like those with silent changes (nucleotide differences that code for same amino acids) or those with conservative amino acid changes; 5) For the BCRs the level of somatic mutations in the clonotype and/or the number of distinct clonotypes that differ by somatic mutations from some germline clonotype.
- the profile data from the blood samples is then used to predict the likelihood of rejection.
- a model using the standard cross validation techniques that generates a Rejection Risk score given the level of the different clonotypes.
- a Rejection Risk score relating to the likelihood of rejection Given the profile in a new blood sample of TCR (and/or BCR) at a specific point a Rejection Risk score relating to the likelihood of rejection can be generated
- a method of identifying correlating clonotypes can be implemented using a calibration test for each patient.
- This method involves a first biopsy sample be taken post transplant.
- the presence of biopsy material of the graft post transplant offers the possibility of analyzing TCRs from the biopsy sample to identify the correlating clonotypes as defined by those that are prevalent in this sample.
- This set of clonotypes can then be followed in blood and a score is generated for the likelihood of rejection.
- the algorithm to generate the Rejection Risk score is derived through a discovery study that is similar to the one described above that utilizes the available clinical data and the levels of the correlating clonotypes to generate a Rejection Risk score that approximates the likelihood of rejection.
- a specific calibration test will be done using material from a first biopsy post transplant but further biopsies could be replaced by the use of blood samples whose clonotypes could be used along with this calibration test to measure a Rejection Risk score.
- Clonotypes that are prevalent in this sample are unlikely to be related to the rejection representing rather the history of prior antigens the patient has seen. Therefore when considering the blood samples after transplant one can subtract the clonotypes that were present before the transplant in determining the correlating clonotypes. These clonotypes can then be used to generate a model of Rejection Risk.
- two calibration tests would be can be used: one prior to transplant and one from a biopsy after transplant. These calibrations could then be used along with clonotypes derived from a blood test to measure Rejection Risk.
- the identification of the correlating clonotypes can be achieved through a combination of the above approaches. Specifically this can be achieved by using the population study to generate an algorithm to predict correlating clonotypes. In addition it can be achieved through calibration data from the same patient using graft biopsy and/or blood samples pre-transplant. A more preferred embodiment will employ both approaches: population-built algorithm and individual calibration to most accurately identify the correlating clonotypes. A Rejection Risk score is then generated using the level of these clonotypes to predict the likelihood of rejection through the use of the population study as a training set.
- two calibration tests can be used: one prior to transplant and one from a biopsy after transplant. These calibrations could then be used along with clonotypes derived from a blood test to measure Rejection Risk.
- the prediction of GVHD can be done in a very similar manner with the same concept of the population study to generate an algorithm to predict correlating clonotypes. Also the "negative" calibration can be generated from the donor sample pre-transplantation. An approach using both the algorithm and calibration is likely to be more predictive of the correlating clonotypes.
- An algorithm to compute a score of the likelihood of GVHD given the level of the correlating clonotypes can be generated using a population study in a manner as described above. This algorithm can then be used for the prediction of the likelihood of GVHD in the next set of patients.
- One embodiment of the invention uses TCR and/or BCR profile to detect subclinical Progressive Multifocal Leukoencephalopathy (PML) in MS patients.
- PML is a serious and often fatal disease that causes often rapidly progressive demyelinating disease through killing oligodendrocytes that synthesize myelin. It is caused by JC virus that is present in a latent phase in the majority of the population. In a fraction of the immunosuppressed population (e.g., AIDS) the virus is reactivated leading to the development of this serious disease.
- some patients who are being immunosuppressed through the use of medication like post transplant patients can also develop PML. Some specific medication has been linked to the risk of PML in specific patient populations.
- natalizumab (Tysabri) was associated with the development of more than 10 cases of PML among patients with multiple sclerosis (MS) leading to its withdrawal of the market for a period of time.
- Natalizumab is well accepted to be more effective than the other FDA approved medications for multiple sclerosis, but its use has been limited by the fear of PML development.
- plasmapheresis can be performed to reduce the concentration of the drug in the patient.
- the overlap between symptoms of MS and PML can sometimes delay the detection of PML. Early detection of subclinical PML is urgently needed.
- clonotypes may be discerned from blood samples from a population where some patients developed PML. This population can be used to identify clonotypes that correlate with the later development of PML. With the availability of these clonotypes an algorithm to identify parameters that distinguish these from other clonotypes can be generated.
- an algorithm is generated to predict the clonotypes that are relevant to the emergence of PML.
- the algorithm can be trained on a set of clonotypes deemed to be correlating with the disease.
- blood (or other body fluid) samples in a discovery study from a population of patients with a latent infection with JC virus some of whom go on to develop PML can be used.
- TCR (and/or BCR) from all these samples can be sequenced and correlation of individual clonotypes with infectious agent reactivation outcome can be used to distinguish correlating from non-correlating clonotypes. Parameters that distinguish those two classes of clonotypes can be identified.
- Sequence motif The motif can be a specific V or J region, a combination VJ, or short sequences in DJ region that is associated with a clonotype being correlating; 2) Size of the clonotype; 3) Level: Absolute level (number of reads per million) or rank level; 4) Similarity to other clonotypes: the presence of other highly related clonotypes, like those with silent changes (nucleotide differences that code for same amino acids) or those with conservative amino acid changes; 5) For the BCRs the level of somatic mutations in the clonotype and/or the number of distinct clonotypes that differ by somatic mutations from some germline clonotype.
- the correlating clonotypes can be identified from samples of patients with active PML or from in vitro studies to identify clonotypes that respond to JC virus antigen.
- the responding clonotypes may originate from one or a plurality of subjects that may be healthy or infected with the infectious agent. These clonotypes can be considered correlating and parameters that distinguish them from other clonotypes can be identified.
- the profile data from the samples in the discovery study is then used to predict the likelihood of reactivation.
- a model that generates a PML Risk score given the level of the different clonotypes. So given the profile in a blood sample of TCR (and/or BCR) at a specific point a score relating to the likelihood of reactivation can be generated.
- This algorithm can now be used with data from a novel patient to predict the patient's correlating clonotypes as well as to generate a PML Risk score for the likelihood of reactivation.
- TCR and BCR profiling can be used to monitor infections that have periods of acute infection followed by latency and reactivation.
- diseases include Hepatitis B and C as well as Herpes viruses. Predicting infections at early stage would be desirable.
- a method of identifying correlating clonotypes can be implemented using a calibration test for each patient.
- the presence of a biological sample from the same patient at a previous time point when the patient was mounting an immune response to the infectious agent can serve to identify the correlating clonotypes.
- This set of clonotypes can then be followed in blood and a Reactivation Risk score is generated for the likelihood of reactivation.
- the algorithm to generate the score is derived through a discovery study that is similar to the one described above that utilizes the available clinical data and the counts of the correlating clonotypes to generate a Reactivation Risk score that approximates the likelihood of reactivation. To use this score a sample taken from a new patient in clinical practice during a period of acute infection. This data would be used along with a subsequent sample taken during the latent period to measure the Reactivation Risk for clinical purposes.
- the identification of the correlating clonotypes can be achieved through a combination of the above approaches. Specifically this can be achieved by using the population study to generate an algorithm to predict correlating clonotypes.
- the correlating clonotypes can be obtained from a population study of patients with known outcome of the infection and/or a set of patients with active immune response to the infectious agent, and/or from in vitro experiments to identify clonotypes reactive with the infectious agent.
- it can be achieved through calibration data from the same patient using older data points at the time of an active immune response against the relevant infectious agent.
- a more preferred embodiment will employ both approaches: population-built algorithm and individual calibration to most accurately identify the correlating clonotypes.
- a Reactivation Risk score is then generated using the level of these clonotypes to predict the likelihood of reactivation through the use of the population study as a training set.
- a sample taken from a new patient in the clinic during a period of acute infection is profiled. This data would be used along with a subsequent sample taken during the latent period to measure the Reactivation Risk for clinical purposes.
- a similar structure can be employed to study infectious agent clearance and or immunity to it.
- Allergic rhinitis is a common condition afflicting ⁇ 11% of the US population. This is typically an allergy to pollen or dust. Eliminating the exposure is difficult and it involves vigilant effort.
- the most common treatments used in chronic rhinitis are decongestants, antihistamines, and nasal steroids.
- immunotherapy is done. The goal of the immunotherapy is to de-sensitize the patient. First a challenge with many potential allergens is done to identify the specific allergen the patient is reacting to. Then the patient is injected with increasing amount of allergen over a period of months to years until a maintenance dose is achieved, and the treatment is then continued for several years.
- the patient can feel an improvement in symptoms within 3-6 months, but that can also be as late as 12-18 months, but a large fraction of the patients do not benefit from the treatment or have relapses.
- One reason for the slow dose escalation is the risk of anaphylaxis if the patient is given a high dose of allergen before s/he sufficiently de-sensitized.
- TCR (and/or BCR) profiles are used to assess the state of disease in allergic rhinitis and generate an Allergy Score that predicts how prone the patient to mount an allergic response should s/he be exposed to the relevant allergen. It is conceived that a discovery study can be performed to determine the likelihood of allergy response given the profile of blood TCR (and/or BCR). This can be used in tailoring the immunotherapy treatment. Possible clinical decision can be to discontinue the treatment if it is deemed ineffective, continue the injection regimen, or accelerate the treatment to reach the maintenance dose faster.
- a population of allergic rhinitis patients on immunotherapy with blood samples with known clinical outcome can be used.
- TCR (and/or BCR) from all these samples can be sequenced and correlation of individual clonotypes with allergy outcome can be used to distinguish correlating from non-correlating clonotypes. Subsequently, parameters can be derived that distinguish those two classes of clonotypes.
- Sequence motif The motif can be a specific V or J region, a combination VJ, or short sequences in DJ region that is associated with a clonotype being correlating; 2) Size of the clonotype; 3) Level: Absolute level (number of reads per million) or rank level; 4) Similarity to other clonotypes: the presence of other highly related clonotypes, like those with silent changes (nucleotide differences that code for same amino acids) or those with conservative amino acid changes; 5) For the BCRs the level of somatic mutations in the clonotype and/or the number of distinct clonotypes that differ by somatic mutations from some germline clonotype.
- the profile data from the blood samples is then used to predict the allergy state.
- a model using the standard cross validation techniques that generates an Allergy Score given the level of the different clonotypes.
- an Allergy Score Given the profile in a new blood sample of TCR (and/or BCR) at a specific point, an Allergy Score can be generated to estimate the degree to which this patient is prone to mount an allergic response.
- a method of identifying correlating clonotypes can be implemented using a calibration test for each patient.
- This method involves a biopsy sample from a site with a positive allergen response be taken from the patient. This can be from the initial allergy test that was performed to determine the specific allergen the patient is responding to or sample from the site of any further treatment injections. This can be done more than once to ensure that the appropriate clonotypes are being followed in case there is some epitope spreading. TCR and/or BCR from these biopsy samples can be used to identify the correlating clonotypes as defined by those that are prevalent in this sample. This set of clonotypes can then be followed in blood and a score is generated for the likelihood of allergy response.
- the algorithm to generate the Allergy Score is derived through a discovery study that is similar to the one described above that utilizes the available clinical data and the levels of the correlating clonotypes to generate an Allergy Score that estimates the allergy state.
- the identification of the correlating clonotypes can be achieved through a combination of the above approaches. Specifically this can be achieved by using the population study to generate an algorithm to predict correlating clonotypes. In addition it can be achieved through calibration data from the same patient using biopsy from a site with a positive allergen response. A more preferred embodiment will employ both approaches: population-built algorithm and individual calibration to most accurately identify the correlating clonotypes. An Allergy Score is then generated using the level of these clonotypes to predict the state of allergy through the use of the population study as a training set.
Priority Applications (1)
| Application Number | Priority Date | Filing Date | Title |
|---|---|---|---|
| EP24152841.3A EP4335932A2 (de) | 2008-11-07 | 2009-11-09 | Verfahren zur überwachung von zuständen durch sequenzanalyse |
Applications Claiming Priority (4)
| Application Number | Priority Date | Filing Date | Title |
|---|---|---|---|
| US11269308P | 2008-11-07 | 2008-11-07 | |
| EP09764927.1A EP2364368B1 (de) | 2008-11-07 | 2009-11-09 | Verfahren zur überwachung von krankheitszuständen mittels sequenzanalyse |
| PCT/US2009/006053 WO2010053587A2 (en) | 2008-11-07 | 2009-11-09 | Methods of monitoring conditions by sequence analysis |
| EP13195379.6A EP2719774B8 (de) | 2008-11-07 | 2009-11-09 | Verfahren zur Überwachung von Zuständen durch Sequenzanalyse |
Related Parent Applications (3)
| Application Number | Title | Priority Date | Filing Date |
|---|---|---|---|
| EP13195379.6A Division-Into EP2719774B8 (de) | 2008-11-07 | 2009-11-09 | Verfahren zur Überwachung von Zuständen durch Sequenzanalyse |
| EP13195379.6A Division EP2719774B8 (de) | 2008-11-07 | 2009-11-09 | Verfahren zur Überwachung von Zuständen durch Sequenzanalyse |
| EP09764927.1A Division EP2364368B1 (de) | 2008-11-07 | 2009-11-09 | Verfahren zur überwachung von krankheitszuständen mittels sequenzanalyse |
Related Child Applications (1)
| Application Number | Title | Priority Date | Filing Date |
|---|---|---|---|
| EP24152841.3A Division EP4335932A2 (de) | 2008-11-07 | 2009-11-09 | Verfahren zur überwachung von zuständen durch sequenzanalyse |
Publications (1)
| Publication Number | Publication Date |
|---|---|
| EP3699296A1 true EP3699296A1 (de) | 2020-08-26 |
Family
ID=42153463
Family Applications (4)
| Application Number | Title | Priority Date | Filing Date |
|---|---|---|---|
| EP13195379.6A Active EP2719774B8 (de) | 2008-11-07 | 2009-11-09 | Verfahren zur Überwachung von Zuständen durch Sequenzanalyse |
| EP09764927.1A Revoked EP2364368B1 (de) | 2008-11-07 | 2009-11-09 | Verfahren zur überwachung von krankheitszuständen mittels sequenzanalyse |
| EP20157266.6A Pending EP3699296A1 (de) | 2008-11-07 | 2009-11-09 | Verfahren zur überwachung von zuständen durch sequenzanalyse |
| EP24152841.3A Pending EP4335932A2 (de) | 2008-11-07 | 2009-11-09 | Verfahren zur überwachung von zuständen durch sequenzanalyse |
Family Applications Before (2)
| Application Number | Title | Priority Date | Filing Date |
|---|---|---|---|
| EP13195379.6A Active EP2719774B8 (de) | 2008-11-07 | 2009-11-09 | Verfahren zur Überwachung von Zuständen durch Sequenzanalyse |
| EP09764927.1A Revoked EP2364368B1 (de) | 2008-11-07 | 2009-11-09 | Verfahren zur überwachung von krankheitszuständen mittels sequenzanalyse |
Family Applications After (1)
| Application Number | Title | Priority Date | Filing Date |
|---|---|---|---|
| EP24152841.3A Pending EP4335932A2 (de) | 2008-11-07 | 2009-11-09 | Verfahren zur überwachung von zuständen durch sequenzanalyse |
Country Status (10)
| Country | Link |
|---|---|
| US (16) | US8236503B2 (de) |
| EP (4) | EP2719774B8 (de) |
| JP (2) | JP5798926B2 (de) |
| CN (2) | CN102272327B (de) |
| AU (1) | AU2009311588B2 (de) |
| CA (1) | CA2742380C (de) |
| ES (2) | ES2453066T3 (de) |
| GB (5) | GB2483810B (de) |
| SG (1) | SG195652A1 (de) |
| WO (1) | WO2010053587A2 (de) |
Families Citing this family (217)
| Publication number | Priority date | Publication date | Assignee | Title |
|---|---|---|---|---|
| AU2002243231A1 (en) * | 2000-11-21 | 2002-07-24 | Wake Forest University | Method of treating autoimmune diseases |
| US9424392B2 (en) | 2005-11-26 | 2016-08-23 | Natera, Inc. | System and method for cleaning noisy genetic data from target individuals using genetic data from genetically related individuals |
| CA2934220C (en) | 2007-10-02 | 2019-11-05 | Theranos, Inc. | Modular point-of-care devices and uses thereof |
| SG10201704689XA (en) | 2008-01-18 | 2017-07-28 | Harvard College | Methods of detecting signatures of disease or conditions in bodily fluids |
| US9394567B2 (en) | 2008-11-07 | 2016-07-19 | Adaptive Biotechnologies Corporation | Detection and quantification of sample contamination in immune repertoire analysis |
| US8628927B2 (en) | 2008-11-07 | 2014-01-14 | Sequenta, Inc. | Monitoring health and disease status using clonotype profiles |
| EP2719774B8 (de) | 2008-11-07 | 2020-04-22 | Adaptive Biotechnologies Corporation | Verfahren zur Überwachung von Zuständen durch Sequenzanalyse |
| US9506119B2 (en) | 2008-11-07 | 2016-11-29 | Adaptive Biotechnologies Corp. | Method of sequence determination using sequence tags |
| US9528160B2 (en) | 2008-11-07 | 2016-12-27 | Adaptive Biotechnolgies Corp. | Rare clonotypes and uses thereof |
| US9365901B2 (en) | 2008-11-07 | 2016-06-14 | Adaptive Biotechnologies Corp. | Monitoring immunoglobulin heavy chain evolution in B-cell acute lymphoblastic leukemia |
| US8691510B2 (en) * | 2008-11-07 | 2014-04-08 | Sequenta, Inc. | Sequence analysis of complex amplicons |
| US8748103B2 (en) | 2008-11-07 | 2014-06-10 | Sequenta, Inc. | Monitoring health and disease status using clonotype profiles |
| DK3059337T3 (da) | 2009-01-15 | 2019-07-22 | Adaptive Biotechnologies Corp | Adaptive immunity profiling og metoder til frembringelse af monoklonale antibodier |
| US8383347B1 (en) * | 2009-05-01 | 2013-02-26 | University Of South Florida | Method of diagnosing or assessing risk for Parkinson's disease or Alzheimer's disease using TCR clonality |
| KR20120044941A (ko) | 2009-06-25 | 2012-05-08 | 프레드 헛친슨 켄서 리서치 센터 | 적응 면역의 측정방법 |
| PT2496720T (pt) | 2009-11-06 | 2020-10-12 | Univ Leland Stanford Junior | Diagnóstico não-invasivo de rejeição de enxertos em pacientes sujeitos a transplantes de órgãos |
| US9043160B1 (en) | 2009-11-09 | 2015-05-26 | Sequenta, Inc. | Method of determining clonotypes and clonotype profiles |
| WO2011101744A2 (en) * | 2010-02-22 | 2011-08-25 | Population Genetics Technologies Ltd. | Region of interest extraction and normalization methods |
| US10787701B2 (en) | 2010-04-05 | 2020-09-29 | Prognosys Biosciences, Inc. | Spatially encoded biological assays |
| US20190300945A1 (en) | 2010-04-05 | 2019-10-03 | Prognosys Biosciences, Inc. | Spatially Encoded Biological Assays |
| PT2556171E (pt) | 2010-04-05 | 2015-12-21 | Prognosys Biosciences Inc | Ensaios biológicos codificados espacialmente |
| SG10201503534RA (en) * | 2010-05-06 | 2015-06-29 | Sequenta Inc | Monitoring health and disease status using clonotype profiles |
| WO2011140433A2 (en) | 2010-05-07 | 2011-11-10 | The Board Of Trustees Of The Leland Stanford Junior University | Measurement and comparison of immune diversity by high-throughput sequencing |
| US11332785B2 (en) | 2010-05-18 | 2022-05-17 | Natera, Inc. | Methods for non-invasive prenatal ploidy calling |
| AU2011255641A1 (en) | 2010-05-18 | 2012-12-06 | Natera, Inc. | Methods for non-invasive prenatal ploidy calling |
| US11326208B2 (en) | 2010-05-18 | 2022-05-10 | Natera, Inc. | Methods for nested PCR amplification of cell-free DNA |
| US11339429B2 (en) | 2010-05-18 | 2022-05-24 | Natera, Inc. | Methods for non-invasive prenatal ploidy calling |
| US9677118B2 (en) | 2014-04-21 | 2017-06-13 | Natera, Inc. | Methods for simultaneous amplification of target loci |
| US11332793B2 (en) | 2010-05-18 | 2022-05-17 | Natera, Inc. | Methods for simultaneous amplification of target loci |
| US11408031B2 (en) | 2010-05-18 | 2022-08-09 | Natera, Inc. | Methods for non-invasive prenatal paternity testing |
| US10316362B2 (en) | 2010-05-18 | 2019-06-11 | Natera, Inc. | Methods for simultaneous amplification of target loci |
| US20190010543A1 (en) | 2010-05-18 | 2019-01-10 | Natera, Inc. | Methods for simultaneous amplification of target loci |
| US11322224B2 (en) | 2010-05-18 | 2022-05-03 | Natera, Inc. | Methods for non-invasive prenatal ploidy calling |
| US11939634B2 (en) | 2010-05-18 | 2024-03-26 | Natera, Inc. | Methods for simultaneous amplification of target loci |
| CN101921874B (zh) * | 2010-06-30 | 2013-09-11 | 深圳华大基因科技有限公司 | 基于Solexa测序法的检测人类乳头瘤病毒的方法 |
| JP2013541323A (ja) | 2010-07-23 | 2013-11-14 | プレジデント アンド フェロウズ オブ ハーバード カレッジ | 貪食細胞を用いて疾患または症状のシグネチャを検出する方法 |
| US20130203624A1 (en) | 2010-07-23 | 2013-08-08 | President And Fellows Of Harvard College | Methods of Detecting Prenatal or Pregnancy-Related Diseases or Conditions |
| AU2011280997A1 (en) | 2010-07-23 | 2013-02-28 | President And Fellows Of Harvard College | Methods of detecting autoimmune or immune-related diseases or conditions |
| MX361944B (es) | 2010-07-23 | 2018-12-19 | President And Fellows Of Harvard College Star | Metodos para detectar firmas de enfermedad o condiciones en fluidos corporales. |
| EP2601521B1 (de) * | 2010-08-06 | 2018-05-02 | Ludwig-Maximilians-Universität München | Identifizierung von t-zell-zielantigenen |
| WO2012027503A2 (en) * | 2010-08-24 | 2012-03-01 | Fred Hutchinson Cancer Research Center | Method of measuring adaptive immunity |
| CN102409044B (zh) * | 2010-09-21 | 2014-05-07 | 深圳华大基因科技服务有限公司 | 用于数字基因表达谱的标签及其使用方法 |
| CN102409045B (zh) * | 2010-09-21 | 2013-09-18 | 深圳华大基因科技服务有限公司 | 一种基于dna接头连接的标签文库构建方法及其所使用标签和标签接头 |
| CN102409043B (zh) * | 2010-09-21 | 2013-12-04 | 深圳华大基因科技服务有限公司 | 高通量低成本Fosmid文库构建的方法及其所使用标签和标签接头 |
| CN101967476B (zh) * | 2010-09-21 | 2012-11-14 | 深圳华大基因科技有限公司 | 一种基于接头连接的DNA PCR-Free标签文库构建方法 |
| CN102409408B (zh) * | 2010-09-21 | 2013-08-07 | 深圳华大基因科技服务有限公司 | 一种利用微量基因组dna进行全基因组甲基化位点精确检测的方法 |
| US10392726B2 (en) | 2010-10-08 | 2019-08-27 | President And Fellows Of Harvard College | High-throughput immune sequencing |
| WO2012083069A2 (en) | 2010-12-15 | 2012-06-21 | The Board Of Trustees Of The Leland Stanford Junior University | Measurement and monitoring of cell clonality |
| DK2652155T3 (en) | 2010-12-16 | 2017-02-13 | Gigagen Inc | Methods for Massive Parallel Analysis of Nucleic Acids in Single Cells |
| WO2012097374A1 (en) * | 2011-01-14 | 2012-07-19 | Cb Biotechnologies, Inc. | Immunodiversity assessment method and its use |
| AR085087A1 (es) | 2011-01-21 | 2013-09-11 | Theranos Inc | Sistemas y metodos para maximizar el uso de muestras |
| GB201106254D0 (en) | 2011-04-13 | 2011-05-25 | Frisen Jonas | Method and product |
| CN103635803A (zh) | 2011-05-31 | 2014-03-12 | 比奥根艾迪克Ma公司 | 评估进行性多灶性白质脑病风险的方法 |
| US20140235474A1 (en) | 2011-06-24 | 2014-08-21 | Sequenom, Inc. | Methods and processes for non invasive assessment of a genetic variation |
| WO2013016226A1 (en) * | 2011-07-22 | 2013-01-31 | Metamark Genetics, Inc. | Quality control method for digital pathology |
| US10385475B2 (en) | 2011-09-12 | 2019-08-20 | Adaptive Biotechnologies Corp. | Random array sequencing of low-complexity libraries |
| US8475739B2 (en) | 2011-09-25 | 2013-07-02 | Theranos, Inc. | Systems and methods for fluid handling |
| US9664702B2 (en) | 2011-09-25 | 2017-05-30 | Theranos, Inc. | Fluid handling apparatus and configurations |
| US9619627B2 (en) | 2011-09-25 | 2017-04-11 | Theranos, Inc. | Systems and methods for collecting and transmitting assay results |
| US20140170735A1 (en) | 2011-09-25 | 2014-06-19 | Elizabeth A. Holmes | Systems and methods for multi-analysis |
| US9632102B2 (en) | 2011-09-25 | 2017-04-25 | Theranos, Inc. | Systems and methods for multi-purpose analysis |
| US9268915B2 (en) | 2011-09-25 | 2016-02-23 | Theranos, Inc. | Systems and methods for diagnosis or treatment |
| CA2848516C (en) * | 2011-09-22 | 2021-06-15 | Maria U. Hutchins | Detection of isotype profiles as signatures for disease |
| US9810704B2 (en) | 2013-02-18 | 2017-11-07 | Theranos, Inc. | Systems and methods for multi-analysis |
| US9250229B2 (en) | 2011-09-25 | 2016-02-02 | Theranos, Inc. | Systems and methods for multi-analysis |
| US10012664B2 (en) | 2011-09-25 | 2018-07-03 | Theranos Ip Company, Llc | Systems and methods for fluid and component handling |
| US10424394B2 (en) | 2011-10-06 | 2019-09-24 | Sequenom, Inc. | Methods and processes for non-invasive assessment of genetic variations |
| US10196681B2 (en) | 2011-10-06 | 2019-02-05 | Sequenom, Inc. | Methods and processes for non-invasive assessment of genetic variations |
| US9367663B2 (en) | 2011-10-06 | 2016-06-14 | Sequenom, Inc. | Methods and processes for non-invasive assessment of genetic variations |
| US9984198B2 (en) | 2011-10-06 | 2018-05-29 | Sequenom, Inc. | Reducing sequence read count error in assessment of complex genetic variations |
| CA2850785C (en) | 2011-10-06 | 2022-12-13 | Sequenom, Inc. | Methods and processes for non-invasive assessment of genetic variations |
| US8688388B2 (en) | 2011-10-11 | 2014-04-01 | Sequenom, Inc. | Methods and processes for non-invasive assessment of genetic variations |
| US9279159B2 (en) | 2011-10-21 | 2016-03-08 | Adaptive Biotechnologies Corporation | Quantification of adaptive immune cell genomes in a complex mixture of cells |
| WO2013085855A1 (en) * | 2011-12-05 | 2013-06-13 | Sequenta, Inc. | Clonotypes as biometric specimen tags |
| EP2788507A4 (de) * | 2011-12-09 | 2015-07-08 | Sequenta Inc | Verfahren zur messung von immunaktivierung |
| EP3904536A1 (de) | 2011-12-09 | 2021-11-03 | Adaptive Biotechnologies Corporation | Diagnose von lymphoid-malignität und nachweis minimaler resterkrankungen |
| US9499865B2 (en) | 2011-12-13 | 2016-11-22 | Adaptive Biotechnologies Corp. | Detection and measurement of tissue-infiltrating lymphocytes |
| US20140349858A1 (en) * | 2011-12-22 | 2014-11-27 | Ibis Bioscience, Inc. | Amplification of a sequence from a ribonucleic acid |
| CN103184216B (zh) * | 2011-12-27 | 2015-03-18 | 深圳华大基因科技有限公司 | 用于扩增免疫球蛋白重链cdr3编码序列的引物组合物及其用途 |
| US9823246B2 (en) | 2011-12-28 | 2017-11-21 | The Board Of Trustees Of The Leland Stanford Junior University | Fluorescence enhancing plasmonic nanoscopic gold films and assays based thereon |
| ES2929923T3 (es) | 2012-01-20 | 2022-12-02 | Sequenom Inc | Procesos de diagnóstico que condicionan las condiciones experimentales |
| US20150038346A1 (en) * | 2012-03-05 | 2015-02-05 | Sequenta, Inc. | Monitoring immune responsiveness to cancer vaccination |
| EP2823060B1 (de) * | 2012-03-05 | 2018-02-14 | Adaptive Biotechnologies Corporation | Festlegung von gepaarten immunrezeptorketten aus frequenzabgestimmten untereinheiten |
| WO2013155119A1 (en) * | 2012-04-13 | 2013-10-17 | Sequenta, Inc. | Detection and quantitation of sample contamination in immune repertoire analysis |
| JP5756247B1 (ja) | 2012-05-08 | 2015-07-29 | アダプティブ バイオテクノロジーズ コーポレイション | マルチプレックスpcr反応における増幅バイアスを測定し校正する組成物及び方法 |
| US9920361B2 (en) | 2012-05-21 | 2018-03-20 | Sequenom, Inc. | Methods and compositions for analyzing nucleic acid |
| US10504613B2 (en) | 2012-12-20 | 2019-12-10 | Sequenom, Inc. | Methods and processes for non-invasive assessment of genetic variations |
| CA2875542A1 (en) * | 2012-06-11 | 2013-12-19 | Sequenta, Inc. | Method of sequence determination using sequence tags |
| WO2013188772A1 (en) * | 2012-06-14 | 2013-12-19 | Gigagen, Inc. | Methods for antibody and cell therapeutic discovery |
| WO2013188831A1 (en) * | 2012-06-15 | 2013-12-19 | Adaptive Biotechnologies Corporation | Uniquely tagged rearranged adaptive immune receptor genes in a complex gene set |
| EP2864918B1 (de) * | 2012-06-21 | 2023-03-29 | Philip Morris Products S.A. | Systeme und verfahren zur erzeugung von biomarkersignaturen |
| US10497461B2 (en) | 2012-06-22 | 2019-12-03 | Sequenom, Inc. | Methods and processes for non-invasive assessment of genetic variations |
| EP2870264A4 (de) * | 2012-07-03 | 2016-03-02 | Sloan Kettering Inst Cancer | Quantitative beurteilung der wiederherstellung eines menschlichen t-zellen-repertoires nach der transplantation allogener blutbildender stammzellen |
| EP2877604A1 (de) * | 2012-07-24 | 2015-06-03 | Sequenta, Inc. | Einzelzellenanalyse unter verwendung von sequenz-tags |
| JP6645737B2 (ja) * | 2012-09-05 | 2020-02-14 | 漂太 高松 | 自己免疫疾患のバイオマーカー |
| EP2904111B1 (de) * | 2012-10-01 | 2017-12-06 | Adaptive Biotechnologies Corporation | Immunkompetenzbeurteilung durch adaptive immunrezeptordiversität und klonalitätscharakterisierung |
| US10482994B2 (en) | 2012-10-04 | 2019-11-19 | Sequenom, Inc. | Methods and processes for non-invasive assessment of genetic variations |
| UA118441C2 (uk) | 2012-10-08 | 2019-01-25 | Протена Біосаєнсиз Лімітед | Антитіло, що розпізнає альфа-синуклеїн |
| US10150996B2 (en) | 2012-10-19 | 2018-12-11 | Adaptive Biotechnologies Corp. | Quantification of adaptive immune cell genomes in a complex mixture of cells |
| KR101525584B1 (ko) | 2012-12-03 | 2015-06-03 | 주식회사 케이티 | 바이오 데이터 검증 방법 및 이를 위한 장치 |
| US9265458B2 (en) | 2012-12-04 | 2016-02-23 | Sync-Think, Inc. | Application of smooth pursuit cognitive testing paradigms to clinical drug development |
| EP2931757B1 (de) | 2012-12-14 | 2020-04-01 | 3M Innovative Properties Company | Verfahren zur polymerisation ethylenisch ungesättigten materialien mittels ionisierender strahlung |
| WO2014093141A1 (en) | 2012-12-14 | 2014-06-19 | 3M Innovative Properties Company | Method of making packaged viscoelastic compositions by polymerizing ethylenically-unsaturated materials using ionizing radiation |
| EP2746405B1 (de) * | 2012-12-23 | 2015-11-04 | HS Diagnomics GmbH | Verfahren und Primersätze zur PCR-Hochdurchsatzsequenzierung |
| WO2014113204A1 (en) | 2013-01-17 | 2014-07-24 | Personalis, Inc. | Methods and systems for genetic analysis |
| US20130309666A1 (en) | 2013-01-25 | 2013-11-21 | Sequenom, Inc. | Methods and processes for non-invasive assessment of genetic variations |
| WO2014121272A2 (en) | 2013-02-04 | 2014-08-07 | Quake Stephen R | Measurement and comparison of immune diversity by high-throughput sequencing |
| JP6460343B2 (ja) * | 2013-02-11 | 2019-01-30 | アイレパートリー インコーポレイテッド | 免疫レパートリーを評価するための方法 |
| US10494675B2 (en) | 2013-03-09 | 2019-12-03 | Cell Mdx, Llc | Methods of detecting cancer |
| US11585814B2 (en) | 2013-03-09 | 2023-02-21 | Immunis.Ai, Inc. | Methods of detecting prostate cancer |
| US9380976B2 (en) | 2013-03-11 | 2016-07-05 | Sync-Think, Inc. | Optical neuroinformatics |
| WO2014145298A1 (en) | 2013-03-15 | 2014-09-18 | Theranos, Inc. | Nucleic acid amplification |
| MX365323B (es) * | 2013-03-15 | 2019-05-29 | Theranos Ip Co Llc | Amplificación de ácidos nucléicos. |
| AU2014233145A1 (en) | 2013-03-15 | 2015-09-17 | Theranos Ip Company, Llc | Nucleic acid amplification |
| US20160024493A1 (en) * | 2013-03-15 | 2016-01-28 | Adaptive Biotechnologies Corporation | Uniquely tagged rearranged adaptive immune receptor genes in a complex gene set |
| US10450595B2 (en) * | 2013-03-15 | 2019-10-22 | Theranos Ip Company, Llc | Nucleic acid amplification |
| WO2014144822A2 (en) | 2013-03-15 | 2014-09-18 | Immumetrix, Inc. | Methods and compositions for tagging and analyzing samples |
| US9816088B2 (en) | 2013-03-15 | 2017-11-14 | Abvitro Llc | Single cell bar-coding for antibody discovery |
| PL2981921T3 (pl) | 2013-04-03 | 2023-05-08 | Sequenom, Inc. | Metody i procesy nieinwazyjnej oceny zmienności genetycznych |
| EP2986738B1 (de) * | 2013-04-17 | 2019-07-24 | Pioneer Hi-Bred International, Inc. | Verfahren zur charakterisierung der dna-sequenzzusammensetzung in einem genom |
| EP3004383B1 (de) | 2013-05-24 | 2019-04-24 | Sequenom, Inc. | Auf fläche unter der kurve (auc) analyse basiertes verfahren zur nichtinvasiven beurteilung genetischer variationen |
| AU2014284180B2 (en) | 2013-06-21 | 2020-03-19 | Sequenom, Inc. | Methods and processes for non-invasive assessment of genetic variations |
| US9879313B2 (en) | 2013-06-25 | 2018-01-30 | Prognosys Biosciences, Inc. | Methods and systems for determining spatial patterns of biological targets in a sample |
| US9708657B2 (en) * | 2013-07-01 | 2017-07-18 | Adaptive Biotechnologies Corp. | Method for generating clonotype profiles using sequence tags |
| WO2015004632A1 (en) | 2013-07-12 | 2015-01-15 | Neotope Biosciences Limited | Antibodies that recognize iapp |
| WO2015004633A1 (en) | 2013-07-12 | 2015-01-15 | Neotope Biosciences Limited | Antibodies that recognize islet-amyloid polypeptide (iapp) |
| EP3965111A1 (de) | 2013-08-30 | 2022-03-09 | Personalis, Inc. | Verfahren und system zur genomanalyse |
| EP3042208A4 (de) | 2013-09-06 | 2017-04-19 | Theranos, Inc. | Systeme und verfahren zur erkennung von infektionskrankheiten |
| CN105683751B (zh) | 2013-09-06 | 2020-01-17 | 赛拉诺斯知识产权有限责任公司 | 用于接收拭子的装置、系统、方法和套件 |
| GB2535066A (en) | 2013-10-03 | 2016-08-10 | Personalis Inc | Methods for analyzing genotypes |
| WO2015051163A2 (en) | 2013-10-04 | 2015-04-09 | Sequenom, Inc. | Methods and processes for non-invasive assessment of genetic variations |
| CA2925111C (en) | 2013-10-07 | 2024-01-16 | Sequenom, Inc. | Methods and processes for non-invasive assessment of chromosome alterations |
| AU2014337063A1 (en) * | 2013-10-18 | 2016-05-19 | Adaptive Biotechnologies Corp. | Predicting patient responsiveness to immune checkpoint inhibitors |
| JP6220222B2 (ja) * | 2013-10-28 | 2017-10-25 | シスメックス株式会社 | 関節リウマチの診断を補助するための方法、システム及びコンピュータプログラム製品 |
| EP3572510B1 (de) * | 2013-11-21 | 2022-09-21 | Repertoire Genesis Incorporation | Analysesystem für t-zellrezeptor- und b-zellrezeptorrepertoir und seine verwendung zur behandlung und diagnose |
| WO2015134787A2 (en) | 2014-03-05 | 2015-09-11 | Adaptive Biotechnologies Corporation | Methods using randomer-containing synthetic molecules |
| WO2015138746A1 (en) * | 2014-03-12 | 2015-09-17 | The Board Of Trustees Of The Leland Stanford Junior University | Monitoring immunocompetance using immune repertoire sequencing |
| US10066265B2 (en) | 2014-04-01 | 2018-09-04 | Adaptive Biotechnologies Corp. | Determining antigen-specific t-cells |
| US11390921B2 (en) | 2014-04-01 | 2022-07-19 | Adaptive Biotechnologies Corporation | Determining WT-1 specific T cells and WT-1 specific T cell receptors (TCRs) |
| EP3129051A1 (de) | 2014-04-08 | 2017-02-15 | Prothena Biosciences Limited | Blut-hirn-schranken-shuttle mit antikörpern zur erkennung von alpha-synuklein |
| RU2717641C2 (ru) | 2014-04-21 | 2020-03-24 | Натера, Инк. | Обнаружение мутаций и плоидности в хромосомных сегментах |
| US10202640B2 (en) | 2014-05-07 | 2019-02-12 | The Board Of Trustees Of The Leland Stanford Junior University | Single cell analysis of T cells using high-throughput multiplex amplification and deep sequencing |
| EP3889325A1 (de) * | 2014-06-26 | 2021-10-06 | 10X Genomics, Inc. | Verfahren zur analyse von nukleinsäuren aus einzelzellen oder zellpopulationen |
| US11783911B2 (en) | 2014-07-30 | 2023-10-10 | Sequenom, Inc | Methods and processes for non-invasive assessment of genetic variations |
| WO2016040843A1 (en) | 2014-09-11 | 2016-03-17 | Harry Stylli | Methods of detecting prostate cancer |
| EP3194593B1 (de) | 2014-09-15 | 2019-02-06 | AbVitro LLC | Nukleotidbibliotheksequenzierung mit hohem durchsatz |
| WO2016069886A1 (en) | 2014-10-29 | 2016-05-06 | Adaptive Biotechnologies Corporation | Highly-multiplexed simultaneous detection of nucleic acids encoding paired adaptive immune receptor heterodimers from many samples |
| WO2016070131A1 (en) | 2014-10-30 | 2016-05-06 | Personalis, Inc. | Methods for using mosaicism in nucleic acids sampled distal to their origin |
| US20160146799A1 (en) | 2014-11-05 | 2016-05-26 | Nirmidas Biotech, Inc. | Metal composites for enhanced imaging |
| US10246701B2 (en) | 2014-11-14 | 2019-04-02 | Adaptive Biotechnologies Corp. | Multiplexed digital quantitation of rearranged lymphoid receptors in a complex mixture |
| EP3498866A1 (de) | 2014-11-25 | 2019-06-19 | Adaptive Biotechnologies Corp. | Charakterisierung von adaptiver immunreaktion auf impfungen oder infektionen unter verwendung von immunrepertoiresequenzierung |
| WO2016138122A1 (en) | 2015-02-24 | 2016-09-01 | Adaptive Biotechnologies Corp. | Methods for diagnosing infectious disease and determining hla status using immune repertoire sequencing |
| AU2016242967B2 (en) | 2015-04-01 | 2021-07-01 | Adaptive Biotechnologies Corp. | Method of identifying human compatible T cell receptors specific for an antigenic target |
| CN113186256A (zh) | 2015-04-10 | 2021-07-30 | 空间转录公司 | 生物样本的空间区别、多重核酸分析 |
| EP3289082A4 (de) * | 2015-04-27 | 2018-09-12 | AbVitro LLC | Verfahren zur sequenzierung, bestimmung, paarung und validierung von therapeutika und krankheitsspezifischen antigenen |
| WO2016183106A1 (en) | 2015-05-11 | 2016-11-17 | Natera, Inc. | Methods and compositions for determining ploidy |
| US9422547B1 (en) | 2015-06-09 | 2016-08-23 | Gigagen, Inc. | Recombinant fusion proteins and libraries from immune cell repertoires |
| JP6576129B2 (ja) * | 2015-07-06 | 2019-09-18 | キヤノン株式会社 | 通信装置、通信方法およびプログラム |
| EP3325646B1 (de) | 2015-07-22 | 2020-08-19 | F.Hoffmann-La Roche Ag | Identifizierung von antigen-epitopen und immunsequenzen zur erkennung der antigene |
| US10539564B2 (en) | 2015-07-22 | 2020-01-21 | Roche Sequencing Solutions, Inc. | Identification of antigen epitopes and immune sequences recognizing the antigens |
| WO2017044871A1 (en) * | 2015-09-09 | 2017-03-16 | uBiome, Inc. | Method and system for microbiome-derived diagnostics and therapeutics for eczema |
| EP3346912A4 (de) * | 2015-09-09 | 2019-08-21 | Ubiome Inc. | Verfahren und system für mikrobiom-derivierte diagnostika und therapeutika für erkrankungen im zusammenhang mit zerebro-kraniofazialer gesundheit |
| WO2017132438A1 (en) * | 2016-01-29 | 2017-08-03 | The Johns Hopkins University | Bottleneck sequencing |
| EP3432796A4 (de) * | 2016-03-23 | 2019-09-18 | The Methodist Hospital System | Beurteilung der tcr-klonalität vor einer transplantation zur vorhersage des überlebens nach einer lebertransplantation |
| US11299783B2 (en) | 2016-05-27 | 2022-04-12 | Personalis, Inc. | Methods and systems for genetic analysis |
| AU2017281040A1 (en) | 2016-06-20 | 2019-01-24 | Healthtell Inc. | Methods for diagnosis and treatment of autoimmune diseases |
| AU2017281039A1 (en) | 2016-06-20 | 2019-01-24 | Healthtell Inc. | Methods for differential diagnosis of autoimmune diseases |
| WO2018022890A1 (en) | 2016-07-27 | 2018-02-01 | Sequenom, Inc. | Genetic copy number alteration classifications |
| WO2018027048A1 (en) * | 2016-08-05 | 2018-02-08 | Bio-Rad Laboratories, Inc. | Second strand direct |
| US10428325B1 (en) | 2016-09-21 | 2019-10-01 | Adaptive Biotechnologies Corporation | Identification of antigen-specific B cell receptors |
| US11485996B2 (en) | 2016-10-04 | 2022-11-01 | Natera, Inc. | Methods for characterizing copy number variation using proximity-litigation sequencing |
| AU2017357818A1 (en) | 2016-11-11 | 2019-05-30 | HealthTell, Inc. | Methods for identifying candidate biomarkers |
| US10011870B2 (en) | 2016-12-07 | 2018-07-03 | Natera, Inc. | Compositions and methods for identifying nucleic acid molecules |
| CA3040924A1 (en) * | 2016-12-09 | 2018-06-14 | Regeneron Pharmaceuticals, Inc. | Systems and methods for sequencing t cell receptors and uses thereof |
| US10550429B2 (en) | 2016-12-22 | 2020-02-04 | 10X Genomics, Inc. | Methods and systems for processing polynucleotides |
| EP4050113A1 (de) | 2017-01-17 | 2022-08-31 | Life Technologies Corporation | Zusammensetzungen und verfahren zur sequenzierung des immunrepertoires |
| JP7237003B2 (ja) | 2017-01-24 | 2023-03-10 | セクエノム, インコーポレイテッド | 遺伝子片の評価のための方法およびプロセス |
| US11649288B2 (en) | 2017-02-07 | 2023-05-16 | Seattle Children's Hospital | Phospholipid ether (PLE) CAR T cell tumor targeting (CTCT) agents |
| WO2018160622A1 (en) | 2017-02-28 | 2018-09-07 | Endocyte, Inc. | Compositions and methods for car t cell therapy |
| US10822662B2 (en) | 2017-03-06 | 2020-11-03 | Karkinos Precision Oncology LLC | Diagnostic methods for identifying T-cell lymphoma and leukemia by high-throughput TCR-β sequencing |
| CN108728903A (zh) * | 2017-04-21 | 2018-11-02 | 深圳市乐土精准医疗科技有限公司 | 基于高通量测序用于地中海贫血大样本筛查的建库方法 |
| EP3616215A1 (de) * | 2017-04-27 | 2020-03-04 | Koninklijke Philips N.V. | Verwendung von klinischem wissen zur verbesserung der verwendung von sequenzierung der nächsten generation |
| US11754552B2 (en) * | 2017-06-09 | 2023-09-12 | The Regents Of The University Of California | Use of immune repertoire diversity for predicting transplant rejection |
| EP3642353A4 (de) | 2017-06-20 | 2021-02-24 | The Medical College of Wisconsin, Inc. | Bewertung des transplantationskomplikationsrisikos bei vollständig zellfreier dna |
| US10636512B2 (en) | 2017-07-14 | 2020-04-28 | Cofactor Genomics, Inc. | Immuno-oncology applications using next generation sequencing |
| EP3431610A1 (de) | 2017-07-19 | 2019-01-23 | Noscendo GmbH | Verfahren und vorrichtungen zur nukleinsäurebasierter echtzeitbestimmung von krankheitszuständen |
| CN111344416A (zh) | 2017-09-01 | 2020-06-26 | 生命技术公司 | 用于免疫组库测序的组合物和方法 |
| US11254980B1 (en) | 2017-11-29 | 2022-02-22 | Adaptive Biotechnologies Corporation | Methods of profiling targeted polynucleotides while mitigating sequencing depth requirements |
| US11311576B2 (en) | 2018-01-22 | 2022-04-26 | Seattle Children's Hospital | Methods of use for CAR T cells |
| WO2019157529A1 (en) | 2018-02-12 | 2019-08-15 | 10X Genomics, Inc. | Methods characterizing multiple analytes from individual cells or cell populations |
| WO2019178289A1 (en) * | 2018-03-13 | 2019-09-19 | Grail, Inc. | Method and system for selecting, managing, and analyzing data of high dimensionality |
| SG11202009696WA (en) * | 2018-04-13 | 2020-10-29 | Freenome Holdings Inc | Machine learning implementation for multi-analyte assay of biological samples |
| US20210214758A1 (en) * | 2018-05-07 | 2021-07-15 | Id Genomics, Inc. | Methods and tools for determining clonal relatedness and predicting clonal traits |
| US10801064B2 (en) | 2018-05-31 | 2020-10-13 | Personalis, Inc. | Compositions, methods and systems for processing or analyzing multi-species nucleic acid samples |
| US11814750B2 (en) | 2018-05-31 | 2023-11-14 | Personalis, Inc. | Compositions, methods and systems for processing or analyzing multi-species nucleic acid samples |
| US11211148B2 (en) | 2018-06-28 | 2021-12-28 | International Business Machines Corporation | Time-series phylogenetic tumor evolution trees |
| US11189361B2 (en) | 2018-06-28 | 2021-11-30 | International Business Machines Corporation | Functional analysis of time-series phylogenetic tumor evolution tree |
| US11525159B2 (en) | 2018-07-03 | 2022-12-13 | Natera, Inc. | Methods for detection of donor-derived cell-free DNA |
| CA3122494A1 (en) | 2018-12-13 | 2020-06-18 | Dna Script | Direct oligonucleotide synthesis on cells and biomolecules |
| CN109554440A (zh) * | 2018-12-26 | 2019-04-02 | 山东艾克韦生物技术有限公司 | 多重引物组及利用该引物组基于高通量测序构建人类t细胞免疫组库的方法 |
| CN109593758B (zh) * | 2018-12-26 | 2021-11-26 | 山东艾克韦生物技术有限公司 | 多重引物组及利用该引物组基于高通量测序构建人类b细胞免疫组库的方法 |
| WO2020191365A1 (en) | 2019-03-21 | 2020-09-24 | Gigamune, Inc. | Engineered cells expressing anti-viral t cell receptors and methods of use thereof |
| US11931674B2 (en) | 2019-04-04 | 2024-03-19 | Natera, Inc. | Materials and methods for processing blood samples |
| WO2020243579A1 (en) | 2019-05-30 | 2020-12-03 | 10X Genomics, Inc. | Methods of detecting spatial heterogeneity of a biological sample |
| EP4010902A4 (de) * | 2019-08-05 | 2023-08-23 | Tata Consultancy Services Limited | System und verfahren zur risikobewertung von multipler sklerose |
| CN111081334B (zh) * | 2019-12-18 | 2023-04-18 | 鲁东大学 | 一种基于风险因素概率组合分析的慢性疾病早期预警方法 |
| US11661625B2 (en) * | 2020-05-14 | 2023-05-30 | Becton, Dickinson And Company | Primers for immune repertoire profiling |
| CN116249785A (zh) | 2020-06-02 | 2023-06-09 | 10X基因组学有限公司 | 用于抗原-受体的空间转录组学 |
| EP4025692A2 (de) | 2020-06-02 | 2022-07-13 | 10X Genomics, Inc. | Nukleinsäure-bibliotheksverfahren |
| WO2021252499A1 (en) | 2020-06-08 | 2021-12-16 | 10X Genomics, Inc. | Methods of determining a surgical margin and methods of use thereof |
| AU2022245323A1 (en) | 2021-03-24 | 2023-09-28 | Genentech, Inc. | Efficient tcr gene editing in t lymphocytes |
| CA3224897A1 (en) * | 2021-06-25 | 2022-12-29 | Sunnybrook Research Institute | Systems and methods for characterizing intra-tumor regions on quantitative ultrasound parametric images to predict cancer response to chemotherapy at pre-treatment |
| CN113792099B (zh) * | 2021-08-12 | 2023-08-25 | 上海熙业信息科技有限公司 | 一种基于历史效用表剪枝的数据流高效用项集挖掘系统 |
| CN113822170B (zh) * | 2021-08-31 | 2024-02-06 | 西安理工大学 | 身体非静止状态的手部震颤识别方法 |
| WO2023086639A1 (en) * | 2021-11-11 | 2023-05-19 | The General Hospital Corporation | Methods for defining stages and progression of amyotrophic lateral sclerosis |
| WO2023183468A2 (en) * | 2022-03-25 | 2023-09-28 | Freenome Holdings, Inc. | Tcr/bcr profiling for cell-free nucleic acid detection of cancer |
| CN116469473B (zh) * | 2023-06-15 | 2023-09-22 | 北京智因东方转化医学研究中心有限公司 | T细胞亚型鉴定的模型训练方法、装置、设备及存储介质 |
Citations (7)
| Publication number | Priority date | Publication date | Assignee | Title |
|---|---|---|---|---|
| US6008002A (en) | 1997-09-29 | 1999-12-28 | Bodey; Bela | Immunomagnetic detection and isolation of cancer cells |
| US7232653B1 (en) | 1998-07-27 | 2007-06-19 | Michael Giesing | Cancer cells from body fluids containing cells, isolation thereof and agents containing the same |
| US7332288B2 (en) | 1998-02-12 | 2008-02-19 | Immunivest Corporation | Methods and reagents for the rapid and efficient isolation of circulating cancer cells |
| US20080138805A1 (en) | 2004-08-11 | 2008-06-12 | Condeelis John S | Isolation, Gene Expression, and Chemotherapeutic Resistance of Motile Cancer Cells |
| WO2008157220A1 (en) | 2007-06-20 | 2008-12-24 | University Of Washington | Methods and apparatus for the isolation and enrichment of circulating tumor cells |
| US20090026082A1 (en) | 2006-12-14 | 2009-01-29 | Ion Torrent Systems Incorporated | Methods and apparatus for measuring analytes using large scale FET arrays |
| US20090186065A1 (en) | 2008-01-18 | 2009-07-23 | Wake Forest University Health Sciences | Isolating and purifying cells for therapy |
Family Cites Families (333)
| Publication number | Priority date | Publication date | Assignee | Title |
|---|---|---|---|---|
| US3270960A (en) | 1964-09-11 | 1966-09-06 | Sperry Rand Corp | Fluid sensor |
| US3773919A (en) | 1969-10-23 | 1973-11-20 | Du Pont | Polylactide-drug mixtures |
| DE3211263A1 (de) | 1981-03-31 | 1983-01-27 | Otsuka Pharmaceutical Co. Ltd., Tokyo | Human-interferon verwandte peptide, antigene und antikoerper, sowie verfahren zu deren herstellung |
| DE3238353A1 (de) | 1982-10-15 | 1984-04-19 | Max Planck Gesellschaft zur Förderung der Wissenschaften e.V., 3400 Göttingen | Verfahren zur simultanen quantitativen bestimmung der blutzellen und reagenz hierfuer |
| US5189147A (en) | 1984-06-13 | 1993-02-23 | Massachusetts Institute Of Technology | Meterodimeric T lymphocyte receptor antibody |
| US4965188A (en) | 1986-08-22 | 1990-10-23 | Cetus Corporation | Process for amplifying, detecting, and/or cloning nucleic acid sequences using a thermostable enzyme |
| US4683195A (en) | 1986-01-30 | 1987-07-28 | Cetus Corporation | Process for amplifying, detecting, and/or-cloning nucleic acid sequences |
| US4683202A (en) | 1985-03-28 | 1987-07-28 | Cetus Corporation | Process for amplifying nucleic acid sequences |
| DE3541033A1 (de) | 1985-11-19 | 1987-05-21 | Boehringer Mannheim Gmbh | Verfahren zur quantifizierung von zellpopulationen bzw. subpopulationen sowie hierfuer geeignetes reagenz |
| US4800159A (en) | 1986-02-07 | 1989-01-24 | Cetus Corporation | Process for amplifying, detecting, and/or cloning nucleic acid sequences |
| US4942124A (en) | 1987-08-11 | 1990-07-17 | President And Fellows Of Harvard College | Multiplex sequencing |
| US5149625A (en) | 1987-08-11 | 1992-09-22 | President And Fellows Of Harvard College | Multiplex analysis of DNA |
| US5667967A (en) | 1990-05-01 | 1997-09-16 | The Board Of Trustees Of The Leland Stanford Junior University | T-cell receptor varible transcripts as disease related markers |
| US5506126A (en) | 1988-02-25 | 1996-04-09 | The General Hospital Corporation | Rapid immunoselection cloning method |
| US5168038A (en) | 1988-06-17 | 1992-12-01 | The Board Of Trustees Of The Leland Stanford Junior University | In situ transcription in cells and tissues |
| JP2781438B2 (ja) * | 1988-10-20 | 1998-07-30 | モーリィ,アリグザンダー,アラン | 白血病及びリンパ腫におけるモノクローナリテイーの診断法 |
| US5075217A (en) | 1989-04-21 | 1991-12-24 | Marshfield Clinic | Length polymorphisms in (dC-dA)n ·(dG-dT)n sequences |
| US5231012A (en) | 1989-06-28 | 1993-07-27 | Schering Corporation | Nucleic acids encoding cytokine synthesis inhibitory factor (interleukin-10) |
| CA2020958C (en) | 1989-07-11 | 2005-01-11 | Daniel L. Kacian | Nucleic acid sequence amplification methods |
| US5336598A (en) * | 1989-11-15 | 1994-08-09 | National Jewish Center For Immunology And Respiratory Medicine | Method for diagnosing a superantigen caused pathologial condition via assay of T-cells |
| US5298396A (en) * | 1989-11-15 | 1994-03-29 | National Jewish Center For Immunology And Respiratory Medicine | Method for identifying T cells disease involved in autoimmune disease |
| US6054034A (en) | 1990-02-28 | 2000-04-25 | Aclara Biosciences, Inc. | Acrylic microchannels and their use in electrophoretic applications |
| US5126022A (en) | 1990-02-28 | 1992-06-30 | Soane Tecnologies, Inc. | Method and device for moving molecules by the application of a plurality of electrical fields |
| GB9015198D0 (en) | 1990-07-10 | 1990-08-29 | Brien Caroline J O | Binding substance |
| US6916605B1 (en) | 1990-07-10 | 2005-07-12 | Medical Research Council | Methods for producing members of specific binding pairs |
| EP0542810A1 (de) | 1990-08-02 | 1993-05-26 | B.R. Centre Limited | Verfahren zur herstellung von proteinen mit einer gewünschten funktion |
| US5210015A (en) | 1990-08-06 | 1993-05-11 | Hoffman-La Roche Inc. | Homogeneous assay system using the nuclease activity of a nucleic acid polymerase |
| IE76732B1 (en) | 1990-08-07 | 1997-11-05 | Becton Dickinson Co | One step test for absolute counts |
| US5699798A (en) | 1990-08-10 | 1997-12-23 | University Of Washington | Method for optically imaging solid tumor tissue |
| US5635354A (en) * | 1991-01-09 | 1997-06-03 | Institut National De La Sante Et De La Recherche Medicale (Inserm) | Method for describing the repertoires of antibodies (Ab) and of T-cell receptors (TcR) of an individual's immune system |
| US5364759B2 (en) | 1991-01-31 | 1999-07-20 | Baylor College Medicine | Dna typing with short tandem repeat polymorphisms and identification of polymorphic short tandem repeats |
| KR100227303B1 (ko) | 1991-02-12 | 1999-12-01 | 장-끌로드 비에이으포스 | 인체 t 임파구 수용체의 베타 사슬의 가변성 영역을 코딩하는 뉴클레오티드 서열, 대응하는 펩티드 세그먼트 및 진단 및 치료 용도 |
| JP3080178B2 (ja) | 1991-02-18 | 2000-08-21 | 東洋紡績株式会社 | 核酸配列の増幅方法およびそのための試薬キット |
| US6091000A (en) * | 1991-03-15 | 2000-07-18 | Duke University | SCID mouse engrafted with human synovium tissue |
| JP3266311B2 (ja) | 1991-05-02 | 2002-03-18 | 生化学工業株式会社 | 新規ポリペプチドおよびこれを用いる抗hiv剤 |
| US5674679A (en) | 1991-09-27 | 1997-10-07 | Amersham Life Science, Inc. | DNA cycle sequencing |
| US5981179A (en) | 1991-11-14 | 1999-11-09 | Digene Diagnostics, Inc. | Continuous amplification reaction |
| US5256542A (en) | 1992-03-09 | 1993-10-26 | Tanox Biosystems, Inc. | Selecting low frequency antigen-specific single B lymphocytes with correction for background noise |
| US5213960A (en) | 1992-03-09 | 1993-05-25 | Tanox Biosystems, Inc. | Methods for selecting low frequency antigen-specific single B lymphocytes |
| US5837447A (en) * | 1992-04-15 | 1998-11-17 | Blood Center Research Foundation, Inc., The | Monitoring an immune response by analysis of amplified immunoglobulin or T-cell-receptor nucleic acid |
| US5498392A (en) | 1992-05-01 | 1996-03-12 | Trustees Of The University Of Pennsylvania | Mesoscale polynucleotide amplification device and method |
| US5587128A (en) | 1992-05-01 | 1996-12-24 | The Trustees Of The University Of Pennsylvania | Mesoscale polynucleotide amplification devices |
| US5981176A (en) | 1992-06-17 | 1999-11-09 | City Of Hope | Method of detecting and discriminating between nucleic acid sequences |
| US5925517A (en) | 1993-11-12 | 1999-07-20 | The Public Health Research Institute Of The City Of New York, Inc. | Detectably labeled dual conformation oligonucleotide probes, assays and kits |
| JPH10504181A (ja) * | 1994-04-18 | 1998-04-28 | ニューヨーク ソサエティ フォー ザ リリーフ オブ ザ ラプチャード アンド クリップルド メインティニング ザ ホスピタル フォー スペシャル サージェリー | 保存されたt細胞レセプター配列 |
| US6001229A (en) | 1994-08-01 | 1999-12-14 | Lockheed Martin Energy Systems, Inc. | Apparatus and method for performing microfluidic manipulations for chemical analysis |
| US6090592A (en) | 1994-08-03 | 2000-07-18 | Mosaic Technologies, Inc. | Method for performing amplification of nucleic acid on supports |
| FR2724182B1 (fr) * | 1994-09-02 | 1996-12-13 | Pasteur Institut | Obtention d'un anticorps monoclonal recombinant a partir d'un anticorps monoclonal humain anti-rhesus d, sa production en cellules d'insecte, et ses utilisations |
| US5846719A (en) | 1994-10-13 | 1998-12-08 | Lynx Therapeutics, Inc. | Oligonucleotide tags for sorting and identification |
| US5604097A (en) | 1994-10-13 | 1997-02-18 | Spectragen, Inc. | Methods for sorting polynucleotides using oligonucleotide tags |
| US5776737A (en) | 1994-12-22 | 1998-07-07 | Visible Genetics Inc. | Method and composition for internal identification of samples |
| US6919434B1 (en) | 1995-02-20 | 2005-07-19 | Sankyo Co., Ltd. | Monoclonal antibodies that bind OCIF |
| US5698396A (en) * | 1995-06-07 | 1997-12-16 | Ludwig Institute For Cancer Research | Method for identifying auto-immunoreactive substances from a subject |
| WO1997013868A1 (en) | 1995-10-11 | 1997-04-17 | Leonard Adleman | Large scale dna sequencing by position sensitive hybridization |
| WO1997013877A1 (en) | 1995-10-12 | 1997-04-17 | Lynx Therapeutics, Inc. | Measurement of gene expression profiles in toxicity determination |
| US6087096A (en) * | 1995-11-13 | 2000-07-11 | Dau; Peter C. | Method of intrafamily fragment analysis of the T cell receptor α and β chain CDR3 regions |
| US5854033A (en) | 1995-11-21 | 1998-12-29 | Yale University | Rolling circle replication reporter systems |
| US20020076725A1 (en) * | 1996-03-13 | 2002-06-20 | Tomoko Toyosaki-Maeda | Human t cell clone specific for rheumatoid arthritis |
| US6458530B1 (en) | 1996-04-04 | 2002-10-01 | Affymetrix Inc. | Selecting tag nucleic acids |
| CA2257152C (en) * | 1996-06-03 | 2009-01-27 | Linda M. Pilarski | Methods for detection of rearranged dna |
| PT912766E (pt) | 1996-06-04 | 2009-07-16 | Univ Utah Res Found | Monitorização da hibridização durante a pcr |
| AU3878697A (en) * | 1996-06-20 | 1998-02-02 | Cornell Research Foundation Inc. | Identification of abnormalities in the expression of t and cell antigen receptors as indicators of disease diagnosis, prognosis and therapeutic predictors |
| US6074827A (en) | 1996-07-30 | 2000-06-13 | Aclara Biosciences, Inc. | Microfluidic method for nucleic acid purification and processing |
| CA2264925C (en) * | 1996-09-06 | 2010-12-07 | Alain T. Luxembourg | Purification of antigen-specific t cells |
| WO1998015644A2 (en) | 1996-09-27 | 1998-04-16 | The Chinese University Of Hong Kong | Parallel polynucleotide sequencing method |
| GB9626815D0 (en) * | 1996-12-23 | 1997-02-12 | Cemu Bioteknik Ab | Method of sequencing DNA |
| GB9704444D0 (en) | 1997-03-04 | 1997-04-23 | Isis Innovation | Non-invasive prenatal diagnosis |
| DE69837913T2 (de) | 1997-04-01 | 2008-02-07 | Solexa Ltd., Saffron Walden | Verfahren zur vervielfältigung von nukleinsäure |
| US6143496A (en) | 1997-04-17 | 2000-11-07 | Cytonix Corporation | Method of sampling, amplifying and quantifying segment of nucleic acid, polymerase chain reaction assembly having nanoliter-sized sample chambers, and method of filling assembly |
| ATE487790T1 (de) | 1997-07-07 | 2010-11-15 | Medical Res Council | In-vitro-sortierverfahren |
| US7572582B2 (en) | 1997-09-12 | 2009-08-11 | Exiqon A/S | Oligonucleotide analogues |
| US6794499B2 (en) | 1997-09-12 | 2004-09-21 | Exiqon A/S | Oligonucleotide analogues |
| AU1517999A (en) | 1997-10-15 | 1999-05-03 | Aclara Biosciences, Inc. | Laminate microstructure device and method for making same |
| CA2307177C (en) | 1997-10-23 | 2004-06-29 | Exact Laboratories, Inc. | Methods for detecting contamination in molecular diagnostics using pcr |
| US7351578B2 (en) | 1999-12-10 | 2008-04-01 | Invitrogen Corp. | Use of multiple recombination sites with unique specificity in recombinational cloning |
| US6210910B1 (en) * | 1998-03-02 | 2001-04-03 | Trustees Of Tufts College | Optical fiber biosensor array comprising cell populations confined to microcavities |
| JP4262799B2 (ja) | 1998-04-16 | 2009-05-13 | 平田機工株式会社 | 生タイヤ供給方法 |
| US6787308B2 (en) | 1998-07-30 | 2004-09-07 | Solexa Ltd. | Arrayed biomolecules and their use in sequencing |
| AR021833A1 (es) | 1998-09-30 | 2002-08-07 | Applied Research Systems | Metodos de amplificacion y secuenciacion de acido nucleico |
| DE19844931C1 (de) | 1998-09-30 | 2000-06-15 | Stefan Seeger | Verfahren zur DNS- oder RNS-Sequenzierung |
| US6541608B1 (en) | 1999-02-23 | 2003-04-01 | Baylor College Of Medicine | T cell receptor Vβ-Dβ-Jβ sequence and methods for its detection |
| US6307024B1 (en) | 1999-03-09 | 2001-10-23 | Zymogenetics, Inc. | Cytokine zalpha11 Ligand |
| US6300070B1 (en) | 1999-06-04 | 2001-10-09 | Mosaic Technologies, Inc. | Solid phase methods for amplifying multiple nucleic acids |
| US6440706B1 (en) | 1999-08-02 | 2002-08-27 | Johns Hopkins University | Digital amplification |
| US20040209314A1 (en) | 1999-09-06 | 2004-10-21 | Institut National De La Sante Et De La Recherche Medicale France | Means for detection and purification of CD8+ T lymphocyte populations specific to peptides presented in the context of HLA |
| US6235483B1 (en) | 2000-01-31 | 2001-05-22 | Agilent Technologies, Inc. | Methods and kits for indirect labeling of nucleic acids |
| US20040170977A1 (en) | 2000-03-31 | 2004-09-02 | Peter Laird | Epigenetic sequences for esophageal adenocarcinoma |
| AUPQ687600A0 (en) * | 2000-04-13 | 2000-05-11 | Flinders Technologies Pty Ltd | A method of detection |
| US20030207300A1 (en) | 2000-04-28 | 2003-11-06 | Matray Tracy J. | Multiplex analytical platform using molecular tags |
| US6596492B2 (en) * | 2000-07-11 | 2003-07-22 | Colorado State University Research Foundation | PCR materials and methods useful to detect canine and feline lymphoid malignancies |
| US7567870B1 (en) * | 2000-07-31 | 2009-07-28 | Institute For Systems Biology | Multiparameter analysis for predictive medicine |
| US6939451B2 (en) | 2000-09-19 | 2005-09-06 | Aclara Biosciences, Inc. | Microfluidic chip having integrated electrodes |
| AU2002246612B2 (en) | 2000-10-24 | 2007-11-01 | The Board Of Trustees Of The Leland Stanford Junior University | Direct multiplex characterization of genomic DNA |
| US6778724B2 (en) | 2000-11-28 | 2004-08-17 | The Regents Of The University Of California | Optical switching and sorting of biological samples and microparticles transported in a micro-fluidic device, including integrated bio-chip devices |
| ATE488576T1 (de) | 2001-02-20 | 2010-12-15 | Univ Georgia | Schnellproduktion monoklonaler antikörper |
| US7265208B2 (en) | 2001-05-01 | 2007-09-04 | The Regents Of The University Of California | Fusion molecules and treatment of IgE-mediated allergic diseases |
| EP1395114A2 (de) | 2001-05-24 | 2004-03-10 | Guard Inc., | Verfahren zum selktieren und produzieren von tieren die ein vorausgesagtes niveau von immunantwort haben |
| US20050260570A1 (en) | 2001-05-29 | 2005-11-24 | Mao Jen-I | Sequencing by proxy |
| US6720144B1 (en) * | 2001-06-21 | 2004-04-13 | Quest Diagnostics | Detection of clonal T-cell receptor-γ gene rearrangement by PCR/temporal temperature gradient gel electrophoresis (TTGE) |
| WO2003008624A2 (en) | 2001-07-15 | 2003-01-30 | Keck Graduate Institute | Nucleic acid amplification using nicking agents |
| US20030096277A1 (en) | 2001-08-30 | 2003-05-22 | Xiangning Chen | Allele specific PCR for genotyping |
| PT1421115E (pt) | 2001-08-31 | 2005-07-29 | Avidex Ltd | Receptor de celulas t soluvel |
| US7432084B2 (en) | 2001-08-31 | 2008-10-07 | Rosetta Inpharmatics Llc | Methods for preparing nucleic acid samples |
| AU2002341752B2 (en) * | 2001-09-19 | 2008-04-03 | Alexion Pharmaceuticals, Inc. | Engineered templates and their use in single primer amplification |
| KR20040064275A (ko) * | 2001-11-09 | 2004-07-16 | 소스 프리시전 메디슨, 인코포레이티드 | 유전자 발현 프로파일을 이용한 질병의 동정, 모니터링,치료 및 생물학적 상태의 확인 |
| GB2382137A (en) | 2001-11-20 | 2003-05-21 | Mats Gullberg | Nucleic acid enrichment |
| GB0128153D0 (en) * | 2001-11-23 | 2002-01-16 | Bayer Ag | Profiling of the immune gene repertoire |
| WO2003052101A1 (en) | 2001-12-14 | 2003-06-26 | Rosetta Inpharmatics, Inc. | Sample tracking using molecular barcodes |
| GB0130267D0 (en) | 2001-12-19 | 2002-02-06 | Neutec Pharma Plc | Focussed antibody technology |
| CN1688708A (zh) | 2002-01-09 | 2005-10-26 | 曼盛基因技术有限公司 | 检测t细胞增殖的基因序列方法 |
| AUPS028002A0 (en) | 2002-02-01 | 2002-02-28 | Ausman Engineering And Associates Pty Ltd | A bearing assembly |
| US7157274B2 (en) | 2002-06-24 | 2007-01-02 | Cytonome, Inc. | Method and apparatus for sorting particles |
| AU2003299503A1 (en) | 2002-05-16 | 2004-06-15 | Vanderbilt University | Method for predicting autoimmune diseases |
| US20060259248A1 (en) * | 2002-07-01 | 2006-11-16 | Institut Pasteur | System, method, device, and computer program product for extraction, gathering, manipulation, and analysis of peak data from an automated sequencer |
| US7691994B2 (en) * | 2002-07-03 | 2010-04-06 | Brewer Jamie L | Compositions and methods for the detection of human T cell receptor variable family gene expression |
| JP5068931B2 (ja) | 2002-07-12 | 2012-11-07 | ザ ジョンズ ホプキンス ユニバーシティー | 独自のクローン形質のリンパ球受容体に結合する試薬および方法 |
| DE60332948D1 (de) | 2002-07-19 | 2010-07-22 | Althea Technologies Inc | Strategien zur genexpressionsanalyse |
| US7157228B2 (en) | 2002-09-09 | 2007-01-02 | Bioarray Solutions Ltd. | Genetic analysis and authentication |
| US7459273B2 (en) | 2002-10-04 | 2008-12-02 | Affymetrix, Inc. | Methods for genotyping selected polymorphism |
| ATE483822T1 (de) | 2002-10-11 | 2010-10-15 | Univ Erasmus | Primer für nukleinsäureamplifikation in pcr- basierten klonalitätsstudien |
| EP1597557A4 (de) | 2002-10-11 | 2008-06-11 | Univ California | Verfahren zur diagnose und prognose von multipler sklerose |
| WO2004044209A1 (en) | 2002-11-13 | 2004-05-27 | Monoquant Pty Ltd | A method of detection |
| ATE536548T1 (de) * | 2002-11-14 | 2011-12-15 | Vivalis | Mikrowell-array-chip zum nachweis eines antigenspezifischen lymphozyten, verfahren zum nachweis eines antigenspezifischen lymphozyten und verfahren zur klonierung eines antigenrezeptorgens eines antigenspezifischen lymphozyten |
| WO2004053104A2 (en) | 2002-12-11 | 2004-06-24 | Coley Pharmaceutical Group, Inc. | 5’ cpg nucleic acids and methods of use |
| WO2004063706A2 (en) | 2003-01-08 | 2004-07-29 | Maxx Genetech Co., Ltd. | Method of detecting over-expression of t-cell receptor genes by real-time pcr |
| DE602004024034D1 (de) | 2003-01-29 | 2009-12-24 | 454 Corp | Nukleinsäureamplifikation auf basis von kügelchenemulsion |
| GB0304068D0 (en) | 2003-02-22 | 2003-03-26 | Avidex Ltd | Substances |
| WO2004096985A2 (en) | 2003-04-24 | 2004-11-11 | Mayo Foundation For Medical Education And Research | Methods for assessing biologic diversity |
| AU2003902299A0 (en) | 2003-05-13 | 2003-05-29 | Flinders Medical Centre | A method of analysing a marker nucleic acid molecule |
| WO2005020784A2 (en) * | 2003-05-23 | 2005-03-10 | Mount Sinai School Of Medicine Of New York University | Surrogate cell gene expression signatures for evaluating the physical state of a subject |
| US20050010030A1 (en) | 2003-07-02 | 2005-01-13 | Zang Jingwu Z. | T cell receptor CDR3 sequence and methods for detecting and treating rheumatoid arthritis |
| EP1641809B2 (de) | 2003-07-05 | 2018-10-03 | The Johns Hopkins University | Verfahren und zusammensetzungen zum nachweis und zur auflistung genetischer variationen |
| US20060228350A1 (en) | 2003-08-18 | 2006-10-12 | Medimmune, Inc. | Framework-shuffling of antibodies |
| US20050048498A1 (en) | 2003-08-29 | 2005-03-03 | Applera Corporation | Compositions, methods, and kits for assembling probes |
| WO2005026686A2 (en) | 2003-09-09 | 2005-03-24 | Compass Genetics, Llc | Multiplexed analytical platform |
| TWI333977B (en) | 2003-09-18 | 2010-12-01 | Symphogen As | Method for linking sequences of interest |
| FR2863274B1 (fr) | 2003-12-05 | 2012-11-16 | Commissariat Energie Atomique | Procede d'evaluation quantitative d'un rearrangement ou d'une recombinaison genetique ciblee d'un individu et ses applications. |
| WO2005053603A2 (en) | 2003-12-08 | 2005-06-16 | Yeda Research And Development Co. Ltd. | Antigen receptor variable region typing |
| EP1704251A1 (de) | 2003-12-15 | 2006-09-27 | Institut Pasteur | Repertoirbestimmung einer b-lymphozytenpopulation |
| DE60326052D1 (de) | 2003-12-15 | 2009-03-19 | Pasteur Institut | Ermittlung des Repertoires von B-Lymphozyten Populationen |
| US20080166718A1 (en) * | 2003-12-15 | 2008-07-10 | Institut Pasteur | Repertoire determination of a lymphocyte B population |
| US7709262B2 (en) | 2004-02-18 | 2010-05-04 | Trustees Of Boston University | Method for detecting and quantifying rare mutations/polymorphisms |
| US20060046258A1 (en) * | 2004-02-27 | 2006-03-02 | Lapidus Stanley N | Applications of single molecule sequencing |
| US20070161001A1 (en) * | 2004-03-04 | 2007-07-12 | Dena Leshkowitz | Quantifying and profiling antibody and t cell receptor gene expression |
| JP4480423B2 (ja) * | 2004-03-08 | 2010-06-16 | 独立行政法人科学技術振興機構 | 免疫細胞クローンの拡大の有無の判定方法 |
| DE102004016437A1 (de) * | 2004-04-04 | 2005-10-20 | Oligene Gmbh | Verfahren zur Erkennung von Signaturen in komplexen Genexpressionsprofilen |
| US20050250147A1 (en) | 2004-05-10 | 2005-11-10 | Macevicz Stephen C | Digital profiling of polynucleotide populations |
| WO2006076025A2 (en) | 2004-05-14 | 2006-07-20 | Amaox, Inc. | Immune cell biosensors and methods of using same |
| EP1598429A1 (de) | 2004-05-19 | 2005-11-23 | Amplion Ltd. | Detektion von Amplikon-Kontamination während einer PCR, die zwei verschiedene Annealing-Temperaturen aufweist |
| GB0412973D0 (en) | 2004-06-10 | 2004-07-14 | Celltech R&D Ltd | Identification of antibody producing cells |
| US20060020397A1 (en) | 2004-07-21 | 2006-01-26 | Kermani Bahram G | Methods for nucleic acid and polypeptide similarity search employing content addressable memories |
| CN101087890A (zh) | 2004-07-26 | 2007-12-12 | 帕拉列勒生物科学公司 | 多个基因组的同时分析 |
| US20060094018A1 (en) * | 2004-08-03 | 2006-05-04 | Bauer A R Jr | Discovery and a method for the early detection of pancreatic cancer and other disease conditions |
| US7820382B2 (en) * | 2004-08-03 | 2010-10-26 | Bauer A Robert | Method for the early detection of breast cancer, lung cancer, pancreatic cancer and colon polyps, growths and cancers as well as other gastrointestinal disease conditions and the preoperative and postoperative monitoring of transplanted organs from the donor and in the recipient and their associated conditions related and unrelated to the organ transplantation |
| AU2005267720B2 (en) | 2004-08-05 | 2012-02-23 | Genentech, Inc. | Humanized anti-cmet antagonists |
| US7915036B2 (en) * | 2004-09-13 | 2011-03-29 | The United States Of America As Represented By The Secretary, Department Of Health And Human Services | Compositions comprising T cell receptors and methods of use thereof |
| US7170050B2 (en) | 2004-09-17 | 2007-01-30 | Pacific Biosciences Of California, Inc. | Apparatus and methods for optical analysis of molecules |
| US8053235B2 (en) | 2004-10-29 | 2011-11-08 | Benaroya Research Institute At Virginia Mason | Methods of generating antigen-specific CD4+CD25+regulatory T cells, compositions and methods of use |
| US7966988B2 (en) | 2005-01-11 | 2011-06-28 | Exxonmobil Research And Engineering Company | Method for controlling soot induced lubricant viscosity increase |
| US8029783B2 (en) | 2005-02-02 | 2011-10-04 | Genentech, Inc. | DR5 antibodies and articles of manufacture containing same |
| FR2881436B1 (fr) * | 2005-02-03 | 2007-04-27 | Commissariat Energie Atomique | Procede de determination de la diversite des lymphocytes t dans un echantillon biologique |
| US7393665B2 (en) | 2005-02-10 | 2008-07-01 | Population Genetics Technologies Ltd | Methods and compositions for tagging and identifying polynucleotides |
| BRPI0607753A2 (pt) * | 2005-02-16 | 2009-10-06 | Wyeth Corp | método para prever um efeito clìnico em resposta a um tratamento de uma leucemia; método para prever um efeito clìnico de uma leucemia; método para selecionar um tratamento para um paciente com leucemia; método para o diagnóstico ou monitoramento de ocorrência, desenvolvimento, progressão ou tratamento de uma leucemia; arranjo para uso num método para prever um efeito clìnico para um paciente aml; arranjo para uso num método de diagnóstico de aml; meio legìvel por computador; kit para o prognóstico de aml |
| US7537894B2 (en) | 2005-03-02 | 2009-05-26 | The University Of Chicago | Methods and kits for monitoring Barrett's metaplasia |
| WO2006099164A2 (en) | 2005-03-10 | 2006-09-21 | Applera Corporation | Methods for multiplex amplification |
| WO2006099604A2 (en) | 2005-03-16 | 2006-09-21 | Compass Genetics, Llc | Methods and compositions for assay readouts on multiple analytical platforms |
| ES2404311T3 (es) | 2005-04-12 | 2013-05-27 | 454 Life Sciences Corporation | Métodos para determinar variantes de secuencias usando secuenciación ultraprofunda |
| WO2006116155A2 (en) | 2005-04-21 | 2006-11-02 | The Regents Of The University Of California | A method for diagnosis and prognosis of multiple sclerosis subtypes |
| US20060263789A1 (en) | 2005-05-19 | 2006-11-23 | Robert Kincaid | Unique identifiers for indicating properties associated with entities to which they are attached, and methods for using |
| US7208795B2 (en) | 2005-05-24 | 2007-04-24 | Atmel Corporation | Low-cost, low-voltage single-layer polycrystalline EEPROM memory cell integration into BiCMOS technology |
| US8426146B2 (en) | 2005-06-03 | 2013-04-23 | University of Pittsburgh—of the Commonwealth System of Higher Education | Multiparameteric method for assessing immune system status |
| DK1907571T3 (en) | 2005-06-15 | 2017-08-21 | Complete Genomics Inc | NUCLEIC ACID ANALYSIS USING INCIDENTAL MIXTURES OF NON-OVERLAPPING FRAGMENTS |
| US20070020670A1 (en) | 2005-07-07 | 2007-01-25 | Hematologics, Inc. | Methods for detecting and confirming minimal disease |
| US20070020640A1 (en) | 2005-07-21 | 2007-01-25 | Mccloskey Megan L | Molecular encoding of nucleic acid templates for PCR and other forms of sequence analysis |
| GB0521521D0 (en) | 2005-10-21 | 2005-11-30 | Medical Res Council | Diagnostic methods and kits |
| GB0522310D0 (en) | 2005-11-01 | 2005-12-07 | Solexa Ltd | Methods of preparing libraries of template polynucleotides |
| US20070105165A1 (en) | 2005-11-04 | 2007-05-10 | Charles Goolsby | Composite profiles of cell antigens and target signal transduction proteins for analysis and clinical management of hematologic cancers |
| US7375211B2 (en) * | 2005-11-18 | 2008-05-20 | Kou Zhong C | Method for detection and quantification of T-cell receptor Vβ repertoire |
| US8137936B2 (en) | 2005-11-29 | 2012-03-20 | Macevicz Stephen C | Selected amplification of polynucleotides |
| US7544473B2 (en) | 2006-01-23 | 2009-06-09 | Population Genetics Technologies Ltd. | Nucleic acid analysis using sequence tokens |
| US7537897B2 (en) | 2006-01-23 | 2009-05-26 | Population Genetics Technologies, Ltd. | Molecular counting |
| SG10201405158QA (en) | 2006-02-24 | 2014-10-30 | Callida Genomics Inc | High throughput genome sequencing on dna arrays |
| WO2007101441A1 (en) * | 2006-03-06 | 2007-09-13 | Symphogen A/S | Recombinant polyclonal antibody for treatment of respiratory syncytial virus infections |
| ES2546848T3 (es) | 2006-03-10 | 2015-09-29 | Epigenomics Ag | Un método para identificar una muestra biológica para el análisis de la metilación |
| WO2007114693A2 (en) * | 2006-04-04 | 2007-10-11 | Keygene N.V. | High throughput detection of molecular markers based on aflp and high throughput sequencing |
| EP2021460A4 (de) | 2006-05-11 | 2010-11-17 | Univ Maryland Biotech Inst | Allgemeines verfahren zur erzeugung menschlicher antikörperreaktionen in vitro |
| WO2007136518A2 (en) * | 2006-05-17 | 2007-11-29 | Torrey Pines Institute For Molecular Studies | Treatment of autoimmune disorders |
| CA2653256C (en) | 2006-05-25 | 2018-08-28 | Institute For Advanced Study | Methods for identifying sequence motifs, and applications thereof |
| US7833716B2 (en) | 2006-06-06 | 2010-11-16 | Gen-Probe Incorporated | Tagged oligonucleotides and their use in nucleic acid amplification methods |
| US7486865B2 (en) | 2006-06-12 | 2009-02-03 | Pacific Biosciences Of California, Inc. | Substrates for performing analytical reactions |
| US20100027896A1 (en) | 2006-06-28 | 2010-02-04 | Amir Geva | Automated application interaction using a virtual operator |
| AU2007269408A1 (en) * | 2006-06-30 | 2008-01-10 | Applied Biosystems, Llc. | Reversible terminator nucleotides and methods of use |
| WO2008108803A2 (en) | 2006-07-13 | 2008-09-12 | Amaox, Ltd. | Immune cell biosensors and methods of using same |
| US8394590B2 (en) | 2006-08-02 | 2013-03-12 | California Institute Of Technology | Capture agents and related methods and systems for detecting and/or sorting targets |
| US20080274904A1 (en) * | 2006-08-10 | 2008-11-06 | Niall Anthony Gormley | Method of target enrichment |
| WO2008026927A2 (en) | 2006-08-30 | 2008-03-06 | Academisch Medisch Centrum | Process for displaying t- and b-cell receptor repertoires |
| WO2008039818A2 (en) | 2006-09-26 | 2008-04-03 | Government Of The United States Of America, Represented By The Secretary, Department Of Health And Human Services | Modified t cell receptors and related materials and methods |
| US20100035764A1 (en) * | 2006-09-26 | 2010-02-11 | St. Jude Children's Research Hospital | Methods and compositions for monitoring t cell receptor diversity |
| JP5026047B2 (ja) * | 2006-10-18 | 2012-09-12 | 株式会社膠原病研究所 | 自己免疫疾患の発症に関わる自己応答性t細胞またはt細胞受容体の同定方法、およびその利用 |
| WO2008140484A2 (en) * | 2006-11-09 | 2008-11-20 | Xdx, Inc. | Methods for diagnosing and monitoring the status of systemic lupus erythematosus |
| US7862999B2 (en) | 2007-01-17 | 2011-01-04 | Affymetrix, Inc. | Multiplex targeted amplification using flap nuclease |
| NZ578851A (en) * | 2007-03-01 | 2011-09-30 | Symphogen As | Method for cloning cognate antibodies |
| WO2008147879A1 (en) | 2007-05-22 | 2008-12-04 | Ryan Golhar | Automated method and device for dna isolation, sequence determination, and identification |
| CA2689356A1 (en) | 2007-06-01 | 2008-12-11 | 454 Life Sciences Corporation | System and meth0d for identification of individual samples from a multiplex mixture |
| WO2009015296A1 (en) | 2007-07-24 | 2009-01-29 | The Regents Of The University Of California | Microfabricated dropley generator |
| CN101802220B (zh) | 2007-07-26 | 2013-07-31 | 加利福尼亚太平洋生物科学股份有限公司 | 分子冗余测序法 |
| ITRM20070429A1 (it) | 2007-08-06 | 2009-02-07 | Uni Cattolica Del Sacro Cuor E | Mezzi per la diagnosi la prevenzione e la cura dell'artrite reumatoide. |
| CN101842159B (zh) | 2007-08-09 | 2014-09-24 | 赛路拉公司 | 关联的多参数单细胞测定及残余生物材料回收的方法和装置 |
| US8268564B2 (en) * | 2007-09-26 | 2012-09-18 | President And Fellows Of Harvard College | Methods and applications for stitched DNA barcodes |
| US7960116B2 (en) | 2007-09-28 | 2011-06-14 | Pacific Biosciences Of California, Inc. | Nucleic acid sequencing methods and systems |
| WO2009045898A2 (en) | 2007-09-28 | 2009-04-09 | Mayo Foundation For Medical Education And Research | Assessing t cell repertoires |
| CN101910414B (zh) | 2007-11-07 | 2016-01-13 | 健泰科生物技术公司 | 用于评估b细胞淋巴瘤对抗cd40抗体治疗的响应性的方法和组合物 |
| WO2009070767A2 (en) | 2007-11-28 | 2009-06-04 | Whitehead Institute For Biomedical Research | Systemic instigation systems to study tumor growth or metastasis |
| EP2062982A1 (de) | 2007-11-26 | 2009-05-27 | ImmunID | Verfahren zur Untersuchung der kombinatorischen Diversität von V(D)J. |
| CN101225441B (zh) | 2007-12-05 | 2010-12-01 | 浙江大学 | 一种检测克隆特异性t淋巴细胞tcr bv cdr3基因组成的方法 |
| US20100021894A1 (en) * | 2007-12-20 | 2010-01-28 | Northwestern University | Nanoparticle-Based Colorimetric Detection Of Cysteine |
| US8621502B2 (en) | 2007-12-21 | 2013-12-31 | Microsoft Corporation | Obtaining user reactions to video |
| US7767400B2 (en) * | 2008-02-03 | 2010-08-03 | Helicos Biosciences Corporation | Paired-end reads in sequencing by synthesis |
| EP2088432A1 (de) | 2008-02-11 | 2009-08-12 | MorphoSys AG | Verfahren zur Identifikation eines Antikörpers oder eines Targets |
| EP2088205A1 (de) | 2008-02-11 | 2009-08-12 | Institut National De La Sante Et De La Recherche Medicale (Inserm) | PSMB10: Diagnosemarker und therapeutisches Target für chronische Abstoßung |
| AU2009219203B2 (en) | 2008-02-28 | 2014-04-03 | The Ohio State University Research Foundation | MicroRNA signatures associated with cytogenetics and prognosis in acute myeloid leukemia (AML) and uses thereof |
| JP2011517283A (ja) | 2008-02-28 | 2011-06-02 | ジ・オハイオ・ステイト・ユニバーシティ・リサーチ・ファウンデイション | 前立腺関連障害の予後診断及び治療のためのマイクロrnaに基づく方法及び組成物 |
| US20090226975A1 (en) * | 2008-03-10 | 2009-09-10 | Illumina, Inc. | Constant cluster seeding |
| TW200938840A (en) | 2008-03-12 | 2009-09-16 | Emo Biomedicine Corp | A method for in vitro study of immune modulation using pig blood cell |
| US8143007B2 (en) * | 2008-03-13 | 2012-03-27 | National Institute Of Immunology | Nested primer sets for amplifying mouse immunoglobulin variable gene segments |
| JP2011515102A (ja) | 2008-03-28 | 2011-05-19 | パシフィック バイオサイエンシーズ オブ カリフォルニア, インコーポレイテッド | 核酸シーケンシング用組成物及び方法 |
| ATE530497T1 (de) | 2008-03-31 | 2011-11-15 | Sony Deutschland Gmbh | Verfahren zur herstellung einer membran mit konischer pore |
| ES2549184T3 (es) * | 2008-04-16 | 2015-10-23 | Cb Biotechnologies, Inc. | Método para evaluar y comparar inmunorepertorios |
| US8911948B2 (en) | 2008-04-30 | 2014-12-16 | Integrated Dna Technologies, Inc. | RNase H-based assays utilizing modified RNA monomers |
| US20120003225A1 (en) | 2008-05-09 | 2012-01-05 | Duke University | Autoantibodies in the detection and treatment of cancer |
| US9068181B2 (en) | 2008-05-23 | 2015-06-30 | The General Hospital Corporation | Microfluidic droplet encapsulation |
| DE102008025656B4 (de) | 2008-05-28 | 2016-07-28 | Genxpro Gmbh | Verfahren zur quantitativen Analyse von Nukleinsäuren, Marker dafür und deren Verwendung |
| DK2297333T3 (en) | 2008-05-30 | 2015-04-07 | Massachusetts Inst Technology | Method for spatial separation and for screening cells |
| WO2009151628A2 (en) | 2008-06-12 | 2009-12-17 | Gov't Of The Usa, As Represented By The Secretary, Department Of Health Human Services | Monitoring tcr-b to determine hiv therapy and disease progression |
| AP2011005546A0 (en) | 2008-06-25 | 2011-02-28 | Baylor Res Intitute | Blood transcriptional signature of mycobacterium tuberculosis infection. |
| CA2769002C (en) | 2008-07-24 | 2018-05-08 | The Board Of Regents Of The University Of Texas System | Vh4 codon signature for multiple sclerosis |
| JP5924937B2 (ja) * | 2008-07-25 | 2016-05-25 | エックス−ボディ インコーポレイテッド | タンパク質スクリーニング法 |
| US9156010B2 (en) * | 2008-09-23 | 2015-10-13 | Bio-Rad Laboratories, Inc. | Droplet-based assay system |
| EP3964821A1 (de) | 2008-09-23 | 2022-03-09 | Bio-Rad Laboratories, Inc. | Tröpfchenbasiertes testsystem |
| US8699361B2 (en) | 2008-09-30 | 2014-04-15 | Qualcomm Incorporated | Out-of-synchronization handling method and apparatus |
| US20100137143A1 (en) | 2008-10-22 | 2010-06-03 | Ion Torrent Systems Incorporated | Methods and apparatus for measuring analytes |
| US8546128B2 (en) | 2008-10-22 | 2013-10-01 | Life Technologies Corporation | Fluidics system for sequential delivery of reagents |
| TW201027105A (en) | 2008-10-31 | 2010-07-16 | Qualcomm Inc | Using magnetometer with a positioning system |
| EP2719774B8 (de) | 2008-11-07 | 2020-04-22 | Adaptive Biotechnologies Corporation | Verfahren zur Überwachung von Zuständen durch Sequenzanalyse |
| US8691510B2 (en) * | 2008-11-07 | 2014-04-08 | Sequenta, Inc. | Sequence analysis of complex amplicons |
| US9394567B2 (en) | 2008-11-07 | 2016-07-19 | Adaptive Biotechnologies Corporation | Detection and quantification of sample contamination in immune repertoire analysis |
| US9506119B2 (en) | 2008-11-07 | 2016-11-29 | Adaptive Biotechnologies Corp. | Method of sequence determination using sequence tags |
| US9528160B2 (en) | 2008-11-07 | 2016-12-27 | Adaptive Biotechnolgies Corp. | Rare clonotypes and uses thereof |
| US8748103B2 (en) | 2008-11-07 | 2014-06-10 | Sequenta, Inc. | Monitoring health and disease status using clonotype profiles |
| US20140234835A1 (en) | 2008-11-07 | 2014-08-21 | Sequenta, Inc. | Rare clonotypes and uses thereof |
| US8628927B2 (en) | 2008-11-07 | 2014-01-14 | Sequenta, Inc. | Monitoring health and disease status using clonotype profiles |
| US9365901B2 (en) | 2008-11-07 | 2016-06-14 | Adaptive Biotechnologies Corp. | Monitoring immunoglobulin heavy chain evolution in B-cell acute lymphoblastic leukemia |
| US20110105343A1 (en) | 2008-11-21 | 2011-05-05 | Emory University | Systems Biology Approach Predicts Immunogenicity of Vaccines |
| US8367330B2 (en) | 2008-12-22 | 2013-02-05 | Quest Diagnostics Investments Incorporated | Methods for detecting TCR-gamma gene rearrangement |
| AU2009333489A1 (en) | 2008-12-30 | 2010-07-08 | Centocor Ortho Biotech Inc. | Serum markers predicting clinical response to anti-TNF antibodies in patients with ankylosing spondylitis |
| DK3059337T3 (da) | 2009-01-15 | 2019-07-22 | Adaptive Biotechnologies Corp | Adaptive immunity profiling og metoder til frembringelse af monoklonale antibodier |
| US9329170B2 (en) * | 2009-01-20 | 2016-05-03 | The Board Of Trustees Of The Leland Stanford Junior University | Single cell gene expression for diagnosis, prognosis and identification of drug targets |
| US20100323348A1 (en) | 2009-01-31 | 2010-12-23 | The Regents Of The University Of Colorado, A Body Corporate | Methods and Compositions for Using Error-Detecting and/or Error-Correcting Barcodes in Nucleic Acid Amplification Process |
| US8673627B2 (en) | 2009-05-29 | 2014-03-18 | Life Technologies Corporation | Apparatus and methods for performing electrochemical reactions |
| US8574835B2 (en) | 2009-05-29 | 2013-11-05 | Life Technologies Corporation | Scaffolded nucleic acid polymer particles and methods of making and using |
| KR20120044941A (ko) | 2009-06-25 | 2012-05-08 | 프레드 헛친슨 켄서 리서치 센터 | 적응 면역의 측정방법 |
| EP2278513A1 (de) * | 2009-07-15 | 2011-01-26 | Nagravision SA | Verfahren zur Verhinderung der Verwendung eines geklonten Nutzergerätes welches mit einem Server kommuniziert |
| JP5829606B2 (ja) | 2009-06-29 | 2015-12-09 | カリフォルニア・インスティテュート・オブ・テクノロジーCalifornia Institute Oftechnology | 単一細胞からの未知の再配列されたt細胞受容体の単離 |
| JP5926183B2 (ja) | 2009-09-22 | 2016-05-25 | エフ.ホフマン−ラ ロシュ アーゲーF. Hoffmann−La Roche Aktiengesellschaft | 疾患関連kirハプロタイプの決定 |
| US9043160B1 (en) | 2009-11-09 | 2015-05-26 | Sequenta, Inc. | Method of determining clonotypes and clonotype profiles |
| US8835358B2 (en) | 2009-12-15 | 2014-09-16 | Cellular Research, Inc. | Digital counting of individual molecules by stochastic attachment of diverse labels |
| US9315857B2 (en) | 2009-12-15 | 2016-04-19 | Cellular Research, Inc. | Digital counting of individual molecules by stochastic attachment of diverse label-tags |
| US8545248B2 (en) | 2010-01-07 | 2013-10-01 | Life Technologies Corporation | System to control fluid flow based on a leak detected by a sensor |
| KR101323827B1 (ko) | 2010-01-08 | 2013-10-31 | 키스트 유럽 에프게엠베하 | 강직성척추염 진단용 프라이머 및 이를 이용한 강직성 척추염 진단 방법 |
| GB201000375D0 (en) | 2010-01-09 | 2010-02-24 | Univ Cardiff | T Cell clonotypes |
| WO2011106738A2 (en) | 2010-02-25 | 2011-09-01 | Fred Hutchinson Cancer Research Center | Use of tcr clonotypes as biomarkers for disease |
| EP2367000A1 (de) | 2010-03-04 | 2011-09-21 | Charité Universitätsmedizin Berlin | Analyse von T-Zellenrezeptorrepertoiren mit hohem Durchsatz |
| SG10201503534RA (en) | 2010-05-06 | 2015-06-29 | Sequenta Inc | Monitoring health and disease status using clonotype profiles |
| WO2011140433A2 (en) | 2010-05-07 | 2011-11-10 | The Board Of Trustees Of The Leland Stanford Junior University | Measurement and comparison of immune diversity by high-throughput sequencing |
| US20130123120A1 (en) | 2010-05-18 | 2013-05-16 | Natera, Inc. | Highly Multiplex PCR Methods and Compositions |
| WO2011156707A2 (en) | 2010-06-11 | 2011-12-15 | Life Technologies Corporation | Alternative nucleotide flows in sequencing-by-synthesis methods |
| WO2012027503A2 (en) | 2010-08-24 | 2012-03-01 | Fred Hutchinson Cancer Research Center | Method of measuring adaptive immunity |
| DK2623613T3 (en) | 2010-09-21 | 2016-10-03 | Population Genetics Tech Ltd | Increasing the reliability of the allele-indications by molecular counting |
| EP3447155A1 (de) | 2010-09-30 | 2019-02-27 | Raindance Technologies, Inc. | Sandwichassays in tröpfchen |
| US10392726B2 (en) | 2010-10-08 | 2019-08-27 | President And Fellows Of Harvard College | High-throughput immune sequencing |
| EP3561159B1 (de) | 2010-10-08 | 2023-09-20 | President and Fellows of Harvard College | Einzelzellen-barcoding mit hohem durchsatz |
| EP2633069B1 (de) | 2010-10-26 | 2015-07-01 | Illumina, Inc. | Sequenzierungsverfahren |
| WO2012061832A1 (en) | 2010-11-05 | 2012-05-10 | Illumina, Inc. | Linking sequence reads using paired code tags |
| WO2012083069A2 (en) | 2010-12-15 | 2012-06-21 | The Board Of Trustees Of The Leland Stanford Junior University | Measurement and monitoring of cell clonality |
| DK2652155T3 (en) | 2010-12-16 | 2017-02-13 | Gigagen Inc | Methods for Massive Parallel Analysis of Nucleic Acids in Single Cells |
| WO2012118555A1 (en) | 2010-12-29 | 2012-09-07 | Life Technologies Corporation | Time-warped background signal for sequencing-by-synthesis operations |
| EP3582224A1 (de) | 2010-12-30 | 2019-12-18 | Life Technologies Corporation | Modelle zur analyse von daten aus sequenzierung-mit-synthese-operationen |
| US8759036B2 (en) | 2011-03-21 | 2014-06-24 | Affymetrix, Inc. | Methods for synthesizing pools of probes |
| US9476095B2 (en) | 2011-04-15 | 2016-10-25 | The Johns Hopkins University | Safe sequencing system |
| PT2702146T (pt) | 2011-04-28 | 2019-04-22 | Univ Leland Stanford Junior | Identificação de polinucleótidos associados a uma amostra |
| FI3892295T3 (fi) | 2011-05-24 | 2023-05-10 | BioNTech SE | Yksilöityjä rokotteita syöpää varten |
| US9834766B2 (en) | 2011-09-02 | 2017-12-05 | Atreca, Inc. | DNA barcodes for multiplexed sequencing |
| WO2013036459A2 (en) | 2011-09-09 | 2013-03-14 | Sequenta, Inc. | Sequence-based measures of immune response |
| US10385475B2 (en) | 2011-09-12 | 2019-08-20 | Adaptive Biotechnologies Corp. | Random array sequencing of low-complexity libraries |
| WO2013055595A1 (en) | 2011-10-11 | 2013-04-18 | Sequenta, Inc. | Determining responsiveness of autoimmune patients to dmard treatment |
| US9279159B2 (en) | 2011-10-21 | 2016-03-08 | Adaptive Biotechnologies Corporation | Quantification of adaptive immune cell genomes in a complex mixture of cells |
| EP2773773B1 (de) | 2011-11-04 | 2017-01-11 | Adaptive Biotechnologies Corporation | Von mehreren spondylitis-ankylosans-patienten geteilte t-zell-rezeptor-klonotypen |
| WO2013085855A1 (en) | 2011-12-05 | 2013-06-13 | Sequenta, Inc. | Clonotypes as biometric specimen tags |
| EP2788507A4 (de) | 2011-12-09 | 2015-07-08 | Sequenta Inc | Verfahren zur messung von immunaktivierung |
| EP3904536A1 (de) | 2011-12-09 | 2021-11-03 | Adaptive Biotechnologies Corporation | Diagnose von lymphoid-malignität und nachweis minimaler resterkrankungen |
| WO2013090390A2 (en) | 2011-12-13 | 2013-06-20 | Sequenta, Inc. | Method of measuring immune activation |
| US9499865B2 (en) | 2011-12-13 | 2016-11-22 | Adaptive Biotechnologies Corp. | Detection and measurement of tissue-infiltrating lymphocytes |
| WO2013096480A2 (en) | 2011-12-20 | 2013-06-27 | Sequenta, Inc. | Monitoring transformation of follicular lymphoma to diffuse large b-cell lymphoma by immune repertoire analysis |
| US20150031555A1 (en) | 2012-01-24 | 2015-01-29 | Gigagen, Inc. | Method for correction of bias in multiplexed amplification |
| US11177020B2 (en) | 2012-02-27 | 2021-11-16 | The University Of North Carolina At Chapel Hill | Methods and uses for molecular tags |
| WO2013131074A1 (en) | 2012-03-02 | 2013-09-06 | Diogenix, Inc. | Methods and reagents for evaluating autoimmune disease and determining antibody repertoire |
| US20150038346A1 (en) | 2012-03-05 | 2015-02-05 | Sequenta, Inc. | Monitoring immune responsiveness to cancer vaccination |
| EP2823060B1 (de) | 2012-03-05 | 2018-02-14 | Adaptive Biotechnologies Corporation | Festlegung von gepaarten immunrezeptorketten aus frequenzabgestimmten untereinheiten |
| WO2013134302A1 (en) | 2012-03-05 | 2013-09-12 | Sequenta, Inc. | Monitoring immune responsiveness to cancer vaccination |
| WO2013155119A1 (en) | 2012-04-13 | 2013-10-17 | Sequenta, Inc. | Detection and quantitation of sample contamination in immune repertoire analysis |
| WO2013158936A1 (en) | 2012-04-20 | 2013-10-24 | Sequenta, Inc | Monitoring immunoglobulin heavy chain evolution in b-cell acute lymphoblastic leukemia |
| JP5756247B1 (ja) | 2012-05-08 | 2015-07-29 | アダプティブ バイオテクノロジーズ コーポレイション | マルチプレックスpcr反応における増幅バイアスを測定し校正する組成物及び方法 |
| WO2013181428A2 (en) | 2012-05-31 | 2013-12-05 | Sequenta, Inc. | Predicting relapse of chronic lymphocytic leukemia patients treated by allogeneic stem cell transplantation |
| US20130324422A1 (en) | 2012-06-04 | 2013-12-05 | Sequenta, Inc. | Detecting disease-correlated clonotypes from fixed samples |
| CA2875542A1 (en) | 2012-06-11 | 2013-12-19 | Sequenta, Inc. | Method of sequence determination using sequence tags |
| WO2013188831A1 (en) | 2012-06-15 | 2013-12-19 | Adaptive Biotechnologies Corporation | Uniquely tagged rearranged adaptive immune receptor genes in a complex gene set |
| EP2877604A1 (de) | 2012-07-24 | 2015-06-03 | Sequenta, Inc. | Einzelzellenanalyse unter verwendung von sequenz-tags |
| US20160115532A1 (en) | 2012-08-10 | 2016-04-28 | Sequenta, Inc. | High sensitivity mutation detection using sequence tags |
| US9938578B2 (en) | 2012-09-24 | 2018-04-10 | iRepertoire, Inc. | Multiplex pyrosequencing using non-interfering noise cancelling polynucleotide identification tags |
| US10150996B2 (en) | 2012-10-19 | 2018-12-11 | Adaptive Biotechnologies Corp. | Quantification of adaptive immune cell genomes in a complex mixture of cells |
| AU2013331212A1 (en) | 2012-10-19 | 2015-05-07 | Adaptive Biotechnologies Corp. | Monitoring clonotypes of plasma cell proliferative disorders in peripheral blood |
| JP2015534806A (ja) | 2012-10-19 | 2015-12-07 | シーケンタ・インコーポレイテッド | 末梢血試料によるびまん性大細胞型b細胞性リンパ腫のモニタリング関連出願の相互参照本出願は、2012年10月19日出願の米国特許仮出願第61/716,270号の利益を主張するものであり、当該出願は参照により本明細書にその全体が組み込まれる。 |
| AU2013335021A1 (en) | 2012-10-22 | 2015-05-07 | Adaptive Biotechnologies Corp. | Monitoring mantle cell lymphoma clonotypes in peripheral blood after immunotransplant |
| ES2748204T3 (es) | 2013-02-22 | 2020-03-13 | Adaptive Biotechnologies Corp | Procedimiento para seleccionar clonotipos raros |
| US20140255944A1 (en) | 2013-03-08 | 2014-09-11 | Sequenta, Inc. | Monitoring treatment-resistant clones in lymphoid and myeloid neoplasms by relative levels of evolved clonotypes |
| US20140255929A1 (en) | 2013-03-11 | 2014-09-11 | Sequenta, Inc. | Mosaic tags for labeling templates in large-scale amplifications |
| US9708657B2 (en) | 2013-07-01 | 2017-07-18 | Adaptive Biotechnologies Corp. | Method for generating clonotype profiles using sequence tags |
| WO2015013461A2 (en) | 2013-07-26 | 2015-01-29 | Sequenta, Inc. | Cancer vaccination with antigen evolution |
| AU2014337063A1 (en) | 2013-10-18 | 2016-05-19 | Adaptive Biotechnologies Corp. | Predicting patient responsiveness to immune checkpoint inhibitors |
| US20150218656A1 (en) | 2014-02-03 | 2015-08-06 | Adaptive Biotechnologies Corp. | Methods for detection and diagnosis of a lymphoid malignancy using high throughput sequencing |
| US11390921B2 (en) | 2014-04-01 | 2022-07-19 | Adaptive Biotechnologies Corporation | Determining WT-1 specific T cells and WT-1 specific T cell receptors (TCRs) |
| US10066265B2 (en) | 2014-04-01 | 2018-09-04 | Adaptive Biotechnologies Corp. | Determining antigen-specific t-cells |
| WO2016069886A1 (en) | 2014-10-29 | 2016-05-06 | Adaptive Biotechnologies Corporation | Highly-multiplexed simultaneous detection of nucleic acids encoding paired adaptive immune receptor heterodimers from many samples |
-
2009
- 2009-11-09 EP EP13195379.6A patent/EP2719774B8/de active Active
- 2009-11-09 ES ES09764927.1T patent/ES2453066T3/es active Active
- 2009-11-09 WO PCT/US2009/006053 patent/WO2010053587A2/en active Application Filing
- 2009-11-09 EP EP09764927.1A patent/EP2364368B1/de not_active Revoked
- 2009-11-09 EP EP20157266.6A patent/EP3699296A1/de active Pending
- 2009-11-09 JP JP2011535569A patent/JP5798926B2/ja active Active
- 2009-11-09 SG SG2013082532A patent/SG195652A1/en unknown
- 2009-11-09 GB GB1120209.0A patent/GB2483810B/en active Active
- 2009-11-09 GB GB1209668.1A patent/GB2488700B/en active Active
- 2009-11-09 EP EP24152841.3A patent/EP4335932A2/de active Pending
- 2009-11-09 CA CA2742380A patent/CA2742380C/en active Active
- 2009-11-09 CN CN200980153756.7A patent/CN102272327B/zh active Active
- 2009-11-09 GB GB1105068.9A patent/GB2477439B/en active Active
- 2009-11-09 ES ES13195379T patent/ES2781754T3/es active Active
- 2009-11-09 AU AU2009311588A patent/AU2009311588B2/en active Active
- 2009-11-09 GB GB1300533.5A patent/GB2497007B/en active Active
- 2009-11-09 CN CN201410350386.9A patent/CN104195227B/zh active Active
- 2009-11-09 GB GB1009641A patent/GB2467704B/en active Active
- 2009-11-09 US US12/615,263 patent/US8236503B2/en active Active
-
2011
- 2011-05-04 US US13/100,395 patent/US8507205B2/en active Active
- 2011-08-19 US US13/214,111 patent/US20120135409A1/en active Granted
-
2012
- 2012-04-30 US US13/459,701 patent/US9217176B2/en active Active
- 2012-05-10 US US13/468,323 patent/US8795970B2/en active Active
-
2013
- 2013-05-30 US US13/905,406 patent/US20130344066A1/en not_active Abandoned
- 2013-06-03 US US13/908,813 patent/US9347099B2/en active Active
-
2014
- 2014-07-11 US US14/329,873 patent/US9228232B2/en active Active
-
2015
- 2015-08-24 JP JP2015164457A patent/JP6112577B2/ja active Active
-
2016
- 2016-01-04 US US14/987,165 patent/US10266901B2/en active Active
- 2016-04-20 US US15/133,932 patent/US20160230236A1/en not_active Abandoned
-
2017
- 2017-11-22 US US15/820,655 patent/US10246752B2/en active Active
- 2017-11-30 US US15/827,759 patent/US10760133B2/en active Active
-
2018
- 2018-09-05 US US16/121,995 patent/US10865453B2/en active Active
- 2018-12-13 US US16/218,535 patent/US11021757B2/en active Active
- 2018-12-17 US US16/222,052 patent/US11001895B2/en active Active
-
2021
- 2021-04-16 US US17/232,961 patent/US20210310076A1/en active Pending
Patent Citations (7)
| Publication number | Priority date | Publication date | Assignee | Title |
|---|---|---|---|---|
| US6008002A (en) | 1997-09-29 | 1999-12-28 | Bodey; Bela | Immunomagnetic detection and isolation of cancer cells |
| US7332288B2 (en) | 1998-02-12 | 2008-02-19 | Immunivest Corporation | Methods and reagents for the rapid and efficient isolation of circulating cancer cells |
| US7232653B1 (en) | 1998-07-27 | 2007-06-19 | Michael Giesing | Cancer cells from body fluids containing cells, isolation thereof and agents containing the same |
| US20080138805A1 (en) | 2004-08-11 | 2008-06-12 | Condeelis John S | Isolation, Gene Expression, and Chemotherapeutic Resistance of Motile Cancer Cells |
| US20090026082A1 (en) | 2006-12-14 | 2009-01-29 | Ion Torrent Systems Incorporated | Methods and apparatus for measuring analytes using large scale FET arrays |
| WO2008157220A1 (en) | 2007-06-20 | 2008-12-24 | University Of Washington | Methods and apparatus for the isolation and enrichment of circulating tumor cells |
| US20090186065A1 (en) | 2008-01-18 | 2009-07-23 | Wake Forest University Health Sciences | Isolating and purifying cells for therapy |
Non-Patent Citations (13)
| Title |
|---|
| BAECHLER, EC ET AL., PROC. NATL. ACAD. SCL, vol. 100, 2003, pages 2610 - 2615 |
| BAUER JW ET AL., ARTHRITIS RHEUM., vol. 60, 2009, pages 3098 - 3107 |
| BEERS T ET AL: "EX VIVO CLONOTYPE PRIMER-DIRECTED GENE AMPLIFICATION TO IDENTIFY MALIGNANT T CELL REPERTOIRES", JOURNAL OF LEUKOCYTE BIOLOGY, FEDERATION OF AMERICAN SOCIETIES FOR EXPERIMENTAL BIOLOGY, US, vol. 54, 1 October 1993 (1993-10-01), pages 343 - 350, XP008062308, ISSN: 0741-5400 * |
| DOUGLAS FREEMAN J ET AL: "Profiling the T-cell receptor beta-chain repertoire by massively parallel sequencing", GENOME RESEARCH, COLD SPRING HARBOR LABORATORY PRESS, US, vol. 19, no. 10, 1 October 2009 (2009-10-01), pages 1817 - 1824, XP002636496, ISSN: 1088-9051, [retrieved on 20090618], DOI: 10.1101/GR.092924.109 * |
| HARRIS T.D. ET AL., SCIENCE, vol. 320, 2008, pages 106 - 109 |
| HENDRIK P J BONARIUS ET AL: "Monitoring the T-Cell Receptor Repertoire at Single-Clone Resolution", PLOS ONE, PUBLIC LIBRARY OF SCIENCE, US, vol. 1, no. 1, 20 December 2006 (2006-12-20), pages E55 - 1, XP002636494, ISSN: 1932-6203, DOI: 10.1371/JOURNAL.PONE.0000055 * |
| M. W. WLODARSKI: "Pathologic clonal cytotoxic T-cell responses: nonrandom nature of the T-cell-receptor restriction in large granular lymphocyte leukemia", BLOOD, vol. 106, no. 8, 15 October 2005 (2005-10-15), pages 2769 - 2780, XP055184346, ISSN: 0006-4971, DOI: 10.1182/blood-2004-10-4045 * |
| MARGULIES, M ET AL., NATURE, vol. 437, 2005, pages 376 - 380 |
| MOUDRIANAKIS E.N.BEER M., PROC NATL ACAD SCI USA., vol. 53, March 1965 (1965-03-01), pages 564 - 71 |
| NAGRATH S. ET AL., NATURE, vol. 450, 2007, pages 1235 - 1239 |
| P. J. CAMPBELL ET AL: "Subclonal phylogenetic structures in cancer revealed by ultra-deep sequencing", PROCEEDINGS OF THE NATIONAL ACADEMY OF SCIENCES, vol. 105, no. 35, 2 September 2008 (2008-09-02), pages 13081 - 13086, XP055043001, ISSN: 0027-8424, DOI: 10.1073/pnas.0801523105 * |
| ROSENBERG R. ET AL., CYTOMETRY, vol. 49, 2002, pages 150 - 158 |
| SONI GVMELLER A., CLIN CHEM, vol. 53, 2007, pages 1996 - 2001 |
Also Published As
Similar Documents
| Publication | Publication Date | Title |
|---|---|---|
| US20210310076A1 (en) | Methods of monitoring conditions by sequence analysis | |
| US20220127675A1 (en) | Monitoring Health and Disease Status Using Clonotype Profiles | |
| US20170349954A1 (en) | Monitoring health and disease status using clonotype profiles | |
| EP3144673B1 (de) | Überwachung von lymphoiden neoplasma mithilfe von klonotyp-profilen | |
| US20150065352A1 (en) | Monitoring health and disease status using clonotype profiles | |
| AU2015200383A1 (en) | Monitoring health and disease status using clonotype profiles |
Legal Events
| Date | Code | Title | Description |
|---|---|---|---|
| PUAI | Public reference made under article 153(3) epc to a published international application that has entered the european phase |
Free format text: ORIGINAL CODE: 0009012 |
|
| STAA | Information on the status of an ep patent application or granted ep patent |
Free format text: STATUS: REQUEST FOR EXAMINATION WAS MADE |
|
| 17P | Request for examination filed |
Effective date: 20200213 |
|
| AC | Divisional application: reference to earlier application |
Ref document number: 2719774 Country of ref document: EP Kind code of ref document: P Ref document number: 2364368 Country of ref document: EP Kind code of ref document: P |
|
| AK | Designated contracting states |
Kind code of ref document: A1 Designated state(s): AT BE BG CH CY CZ DE DK EE ES FI FR GB GR HR HU IE IS IT LI LT LU LV MC MK MT NL NO PL PT RO SE SI SK SM TR |
|
| REG | Reference to a national code |
Ref country code: HK Ref legal event code: DE Ref document number: 40035877 Country of ref document: HK |
|
| STAA | Information on the status of an ep patent application or granted ep patent |
Free format text: STATUS: EXAMINATION IS IN PROGRESS |
|
| 17Q | First examination report despatched |
Effective date: 20231031 |