EP0706042A1 - Analyse de gaz par spectrochimie infrarouge et appareil utilise - Google Patents
Analyse de gaz par spectrochimie infrarouge et appareil utilise Download PDFInfo
- Publication number
- EP0706042A1 EP0706042A1 EP95913317A EP95913317A EP0706042A1 EP 0706042 A1 EP0706042 A1 EP 0706042A1 EP 95913317 A EP95913317 A EP 95913317A EP 95913317 A EP95913317 A EP 95913317A EP 0706042 A1 EP0706042 A1 EP 0706042A1
- Authority
- EP
- European Patent Office
- Prior art keywords
- gas
- measured
- light
- absorption
- impurity
- Prior art date
- Legal status (The legal status is an assumption and is not a legal conclusion. Google has not performed a legal analysis and makes no representation as to the accuracy of the status listed.)
- Withdrawn
Links
- 238000004868 gas analysis Methods 0.000 title 1
- 238000010521 absorption reaction Methods 0.000 claims abstract description 140
- 239000012535 impurity Substances 0.000 claims abstract description 98
- 238000000862 absorption spectrum Methods 0.000 claims abstract description 82
- 238000000034 method Methods 0.000 claims abstract description 59
- 238000012844 infrared spectroscopy analysis Methods 0.000 claims abstract description 43
- 238000004458 analytical method Methods 0.000 claims abstract description 32
- 239000004065 semiconductor Substances 0.000 claims abstract description 18
- 239000007789 gas Substances 0.000 claims description 226
- CURLTUGMZLYLDI-UHFFFAOYSA-N Carbon dioxide Chemical compound O=C=O CURLTUGMZLYLDI-UHFFFAOYSA-N 0.000 claims description 88
- 239000001569 carbon dioxide Substances 0.000 claims description 44
- 229910002092 carbon dioxide Inorganic materials 0.000 claims description 44
- 229910001868 water Inorganic materials 0.000 claims description 42
- XLYOFNOQVPJJNP-UHFFFAOYSA-N water Substances O XLYOFNOQVPJJNP-UHFFFAOYSA-N 0.000 claims description 41
- VEXZGXHMUGYJMC-UHFFFAOYSA-N Hydrochloric acid Chemical compound Cl VEXZGXHMUGYJMC-UHFFFAOYSA-N 0.000 claims description 26
- IXCSERBJSXMMFS-UHFFFAOYSA-N hydrogen chloride Substances Cl.Cl IXCSERBJSXMMFS-UHFFFAOYSA-N 0.000 claims description 22
- 229910000041 hydrogen chloride Inorganic materials 0.000 claims description 22
- VNWKTOKETHGBQD-UHFFFAOYSA-N methane Chemical compound C VNWKTOKETHGBQD-UHFFFAOYSA-N 0.000 claims description 20
- 230000008859 change Effects 0.000 claims description 16
- IJGRMHOSHXDMSA-UHFFFAOYSA-N Atomic nitrogen Chemical compound N#N IJGRMHOSHXDMSA-UHFFFAOYSA-N 0.000 claims description 15
- BLRPTPMANUNPDV-UHFFFAOYSA-N Silane Chemical compound [SiH4] BLRPTPMANUNPDV-UHFFFAOYSA-N 0.000 claims description 12
- 230000001678 irradiating effect Effects 0.000 claims description 12
- 230000008569 process Effects 0.000 claims description 9
- CPELXLSAUQHCOX-UHFFFAOYSA-N Hydrogen bromide Chemical compound Br CPELXLSAUQHCOX-UHFFFAOYSA-N 0.000 claims description 6
- 230000004907 flux Effects 0.000 claims description 6
- XKRFYHLGVUSROY-UHFFFAOYSA-N Argon Chemical compound [Ar] XKRFYHLGVUSROY-UHFFFAOYSA-N 0.000 claims description 4
- KRHYYFGTRYWZRS-UHFFFAOYSA-N Fluorane Chemical compound F KRHYYFGTRYWZRS-UHFFFAOYSA-N 0.000 claims description 4
- 229910052757 nitrogen Inorganic materials 0.000 claims description 4
- XYFCBTPGUUZFHI-UHFFFAOYSA-N Phosphine Chemical compound P XYFCBTPGUUZFHI-UHFFFAOYSA-N 0.000 claims description 3
- 229910000042 hydrogen bromide Inorganic materials 0.000 claims description 3
- 229910000040 hydrogen fluoride Inorganic materials 0.000 claims description 3
- UGFAIRIUMAVXCW-UHFFFAOYSA-N Carbon monoxide Chemical compound [O+]#[C-] UGFAIRIUMAVXCW-UHFFFAOYSA-N 0.000 claims description 2
- 238000004566 IR spectroscopy Methods 0.000 claims description 2
- 229910052786 argon Inorganic materials 0.000 claims description 2
- RBFQJDQYXXHULB-UHFFFAOYSA-N arsane Chemical compound [AsH3] RBFQJDQYXXHULB-UHFFFAOYSA-N 0.000 claims description 2
- QVGXLLKOCUKJST-UHFFFAOYSA-N atomic oxygen Chemical compound [O] QVGXLLKOCUKJST-UHFFFAOYSA-N 0.000 claims description 2
- 229910002091 carbon monoxide Inorganic materials 0.000 claims description 2
- 239000001307 helium Substances 0.000 claims description 2
- 229910052734 helium Inorganic materials 0.000 claims description 2
- SWQJXJOGLNCZEY-UHFFFAOYSA-N helium atom Chemical compound [He] SWQJXJOGLNCZEY-UHFFFAOYSA-N 0.000 claims description 2
- XMBWDFGMSWQBCA-UHFFFAOYSA-N hydrogen iodide Chemical compound I XMBWDFGMSWQBCA-UHFFFAOYSA-N 0.000 claims description 2
- 229910000043 hydrogen iodide Inorganic materials 0.000 claims description 2
- 150000002902 organometallic compounds Chemical class 0.000 claims description 2
- 239000001301 oxygen Substances 0.000 claims description 2
- 229910052760 oxygen Inorganic materials 0.000 claims description 2
- 229910000077 silane Inorganic materials 0.000 claims description 2
- ZDHXKXAHOVTTAH-UHFFFAOYSA-N trichlorosilane Chemical compound Cl[SiH](Cl)Cl ZDHXKXAHOVTTAH-UHFFFAOYSA-N 0.000 claims description 2
- 239000005052 trichlorosilane Substances 0.000 claims description 2
- 150000001875 compounds Chemical class 0.000 claims 2
- 206010034962 Photopsia Diseases 0.000 claims 1
- 229910000065 phosphene Inorganic materials 0.000 claims 1
- 238000001228 spectrum Methods 0.000 abstract description 58
- 239000000463 material Substances 0.000 abstract description 15
- 230000035945 sensitivity Effects 0.000 abstract description 14
- 239000000523 sample Substances 0.000 abstract 2
- 239000013074 reference sample Substances 0.000 abstract 1
- 238000005259 measurement Methods 0.000 description 54
- 230000010355 oscillation Effects 0.000 description 14
- 230000007423 decrease Effects 0.000 description 9
- 238000001514 detection method Methods 0.000 description 9
- 238000010183 spectrum analysis Methods 0.000 description 9
- 230000015572 biosynthetic process Effects 0.000 description 8
- 238000011088 calibration curve Methods 0.000 description 8
- 229910001873 dinitrogen Inorganic materials 0.000 description 6
- 238000010494 dissociation reaction Methods 0.000 description 6
- 230000005593 dissociations Effects 0.000 description 6
- 230000000694 effects Effects 0.000 description 6
- 238000004519 manufacturing process Methods 0.000 description 6
- 238000002347 injection Methods 0.000 description 5
- 239000007924 injection Substances 0.000 description 5
- QGZKDVFQNNGYKY-UHFFFAOYSA-N Ammonia Chemical compound N QGZKDVFQNNGYKY-UHFFFAOYSA-N 0.000 description 4
- 238000012625 in-situ measurement Methods 0.000 description 3
- 230000009467 reduction Effects 0.000 description 3
- 238000012360 testing method Methods 0.000 description 3
- 238000010586 diagram Methods 0.000 description 2
- 125000004435 hydrogen atom Chemical class [H]* 0.000 description 2
- 238000011835 investigation Methods 0.000 description 2
- 230000003287 optical effect Effects 0.000 description 2
- YWIBETYWGSNTAE-UHFFFAOYSA-N [Br].Br Chemical compound [Br].Br YWIBETYWGSNTAE-UHFFFAOYSA-N 0.000 description 1
- 238000002835 absorbance Methods 0.000 description 1
- 229910021529 ammonia Inorganic materials 0.000 description 1
- 230000003321 amplification Effects 0.000 description 1
- 230000003466 anti-cipated effect Effects 0.000 description 1
- 238000013459 approach Methods 0.000 description 1
- 125000004429 atom Chemical group 0.000 description 1
- 238000006243 chemical reaction Methods 0.000 description 1
- 125000001309 chloro group Chemical group Cl* 0.000 description 1
- 238000010276 construction Methods 0.000 description 1
- 230000003247 decreasing effect Effects 0.000 description 1
- 238000013461 design Methods 0.000 description 1
- 238000006073 displacement reaction Methods 0.000 description 1
- 239000001257 hydrogen Substances 0.000 description 1
- 229910052739 hydrogen Inorganic materials 0.000 description 1
- 125000002887 hydroxy group Chemical group [H]O* 0.000 description 1
- 150000002484 inorganic compounds Chemical class 0.000 description 1
- 229910010272 inorganic material Inorganic materials 0.000 description 1
- 230000002452 interceptive effect Effects 0.000 description 1
- 230000007246 mechanism Effects 0.000 description 1
- 239000000203 mixture Substances 0.000 description 1
- 238000012986 modification Methods 0.000 description 1
- 230000004048 modification Effects 0.000 description 1
- 229910000069 nitrogen hydride Inorganic materials 0.000 description 1
- 238000003199 nucleic acid amplification method Methods 0.000 description 1
- 150000002894 organic compounds Chemical class 0.000 description 1
- 229910000073 phosphorus hydride Inorganic materials 0.000 description 1
- 238000005086 pumping Methods 0.000 description 1
- 238000011160 research Methods 0.000 description 1
- 230000004044 response Effects 0.000 description 1
- 239000000126 substance Substances 0.000 description 1
- 239000013076 target substance Substances 0.000 description 1
Images


Classifications
-
- G—PHYSICS
- G01—MEASURING; TESTING
- G01N—INVESTIGATING OR ANALYSING MATERIALS BY DETERMINING THEIR CHEMICAL OR PHYSICAL PROPERTIES
- G01N21/00—Investigating or analysing materials by the use of optical means, i.e. using sub-millimetre waves, infrared, visible or ultraviolet light
- G01N21/17—Systems in which incident light is modified in accordance with the properties of the material investigated
- G01N21/25—Colour; Spectral properties, i.e. comparison of effect of material on the light at two or more different wavelengths or wavelength bands
- G01N21/31—Investigating relative effect of material at wavelengths characteristic of specific elements or molecules, e.g. atomic absorption spectrometry
- G01N21/39—Investigating relative effect of material at wavelengths characteristic of specific elements or molecules, e.g. atomic absorption spectrometry using tunable lasers
-
- G—PHYSICS
- G01—MEASURING; TESTING
- G01J—MEASUREMENT OF INTENSITY, VELOCITY, SPECTRAL CONTENT, POLARISATION, PHASE OR PULSE CHARACTERISTICS OF INFRARED, VISIBLE OR ULTRAVIOLET LIGHT; COLORIMETRY; RADIATION PYROMETRY
- G01J3/00—Spectrometry; Spectrophotometry; Monochromators; Measuring colours
- G01J3/28—Investigating the spectrum
- G01J3/42—Absorption spectrometry; Double beam spectrometry; Flicker spectrometry; Reflection spectrometry
- G01J3/433—Modulation spectrometry; Derivative spectrometry
-
- G—PHYSICS
- G01—MEASURING; TESTING
- G01N—INVESTIGATING OR ANALYSING MATERIALS BY DETERMINING THEIR CHEMICAL OR PHYSICAL PROPERTIES
- G01N21/00—Investigating or analysing materials by the use of optical means, i.e. using sub-millimetre waves, infrared, visible or ultraviolet light
- G01N21/17—Systems in which incident light is modified in accordance with the properties of the material investigated
- G01N21/25—Colour; Spectral properties, i.e. comparison of effect of material on the light at two or more different wavelengths or wavelength bands
- G01N21/31—Investigating relative effect of material at wavelengths characteristic of specific elements or molecules, e.g. atomic absorption spectrometry
- G01N21/35—Investigating relative effect of material at wavelengths characteristic of specific elements or molecules, e.g. atomic absorption spectrometry using infrared light
- G01N21/3504—Investigating relative effect of material at wavelengths characteristic of specific elements or molecules, e.g. atomic absorption spectrometry using infrared light for analysing gases, e.g. multi-gas analysis
-
- G—PHYSICS
- G01—MEASURING; TESTING
- G01N—INVESTIGATING OR ANALYSING MATERIALS BY DETERMINING THEIR CHEMICAL OR PHYSICAL PROPERTIES
- G01N21/00—Investigating or analysing materials by the use of optical means, i.e. using sub-millimetre waves, infrared, visible or ultraviolet light
- G01N21/17—Systems in which incident light is modified in accordance with the properties of the material investigated
- G01N21/25—Colour; Spectral properties, i.e. comparison of effect of material on the light at two or more different wavelengths or wavelength bands
- G01N21/31—Investigating relative effect of material at wavelengths characteristic of specific elements or molecules, e.g. atomic absorption spectrometry
- G01N21/39—Investigating relative effect of material at wavelengths characteristic of specific elements or molecules, e.g. atomic absorption spectrometry using tunable lasers
- G01N2021/396—Type of laser source
- G01N2021/399—Diode laser
-
- G—PHYSICS
- G01—MEASURING; TESTING
- G01N—INVESTIGATING OR ANALYSING MATERIALS BY DETERMINING THEIR CHEMICAL OR PHYSICAL PROPERTIES
- G01N21/00—Investigating or analysing materials by the use of optical means, i.e. using sub-millimetre waves, infrared, visible or ultraviolet light
- G01N21/17—Systems in which incident light is modified in accordance with the properties of the material investigated
- G01N21/25—Colour; Spectral properties, i.e. comparison of effect of material on the light at two or more different wavelengths or wavelength bands
- G01N21/31—Investigating relative effect of material at wavelengths characteristic of specific elements or molecules, e.g. atomic absorption spectrometry
- G01N21/35—Investigating relative effect of material at wavelengths characteristic of specific elements or molecules, e.g. atomic absorption spectrometry using infrared light
- G01N21/3554—Investigating relative effect of material at wavelengths characteristic of specific elements or molecules, e.g. atomic absorption spectrometry using infrared light for determining moisture content
Definitions
- the present invention relates to a method for analyzing trace amounts of a component which is included in a gas to be measured by means of infrared spectroscopic analysis employing a diode laser as the light source, and to a device which employs the method therein.
- Infrared spectroscopic analysis is frequently used as a method for analyzing a gaseous test material.
- a simple explanation will now be made of the principle of infrared spectroscopic analysis.
- each molecule has its own vibration energy level corresponding to the bonds between the atoms which make up the molecules. For this reason, when the molecules are exposed to electromagnetic waves of a wavelength which has a photon energy equivalent to the value of their vibration energy level, the molecules absorb the electromagnetic waves as their own vibration energy. The amount of absorption, moreover, is proportionate to the abundance of the molecules present. When this vibration energy level value is converted to photon energy, ordinarily, it will correspond to wavelengths in the infrared region.
- infrared spectroscopic analysis light in the infrared region is passed through the gas to be measured and the absorption spectrum is measured. Analysis is carried out by analyzing the absorption spectrum. Identification within the gas to be measured of gaseous molecules (impurity) targeted for measurement here can be made from the wavelength of the light absorbed. A quantitative determination of those molecules can then be made from the absorbance.
- the device for analysis of the moisture recorded in this publication is provided with a diode laser which oscillates in the region of wavelength from 1.3 to 1.55 ⁇ m at room temperature; an measurement line which causes the laser light oscillated at room temperature from the diode laser to branch, guides it into a gas cell used for measurement, and then sends it on to a light detector for measurement use; a reference line which causes the aforementioned laser light to branch, guides it into a gas cell used for reference, and then sends it on to a light detector for reference use; and a power monitor line which causes the aforementioned laser light to branch and sends it on to a light detector which is used as a power monitor.
- the device is designed to employ as the aforementioned detectors, light detectors which are sensitive to light in the region of wavelength from 1.3 to 1.55 ⁇ m at room temperature.
- the laser oscillating wavelength is scanned by means of varying the injection current to the diode laser, and the absorption spectrum is measured.
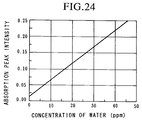
- the absorption peak for H20 which is in the region of wavelength of 1.38 ⁇ m is selected, and the water vapor concentration in the gas is measured using the absorption intensity and a calibration curve made in advance.
- Figure 22 is an absorption spectrum for the case where the gas component is H2O only
- Figure 23 is the absorption spectrum for a test material containing H20 in nitrogen gas.
- the absorption intensity (peak height) obtained here is measured and the concentration of the moisture is obtained from the calibration curve (shown in Figure 24) which was made in advance.
- absorption peaks originating from the semiconductor material gas may be present near the absorption peaks originating from impurities such as moisture or the like. In this case, as a result of the overlapping of nearby peaks, the accuracy of measurement becomes poor. For this reason, the above method is unsatisfactory for the analysis of a trace amounts of an impurity in a semiconductor material gas where a high degree of accuracy is demanded.
- the present invention was conceived to resolve the aforementioned problems, and has as its objective the provision of a device and method wherein a trace impurity concentration in a gas to be measured can be analyzed with high sensitivity and accuracy in an infrared spectroscopic analysis which employs a diode laser.
- the present invention 's infrared spectroscopic analysis method for gas attempts to resolve the aforementioned problems by carrying analysis of the gas to be measured under low pressure state in a method for analyzing the impurity in the gas to be measured by passing light from the infrared region through the gas to be measured and measuring the intensity of absorption. By lowering the pressure of the gas to be measured, it is possible to improve the resolution of the peaks of the absorption spectrum.
- the desirable pressure range for the gas to be measured may be varied according to the resolution demanded or the type of impurity which is the target of measurement. However, if the pressure is set in the range of 10 to 500 Torr, good sensitivity and accuracy can be obtained.
- the wavelength range of the light to be swept is preferably selected within the range for which it is possible to obtain a strong absorption peak for the impurity.
- the wavelength may be preferably selected to be in the range of 1.19 to 2.00 ⁇ m.
- a method using an absorption spectrum to identify and determine the impurity in a gas to be measured it is desirable to compare the absorption spectrum for the gas to be measured and an absorption spectrum measured separately and obtained for the impurity alone in order to identify the impurity by confirming the presence of a plurality of absorption peaks originating from the impurity, and to then select from this plurality of peaks the strongest peak not experiencing interference from nearby peaks and to determine the impurity from the absorption intensity of this strongest peak.
- the absorption spectrum can be measured by passing light through the gas to be measured, while an absorption spectrum may simultaneously be measured by passing light of the same wavelength through the impurity alone.
- Detection sensitivity can be improved if the derivative absorption peak obtained by detecting the derivative of change in the absorption intensity is used as the aforementioned absorption peak.
- identification can be carried out with accuracy if the impurity is identified from the relative intensities of the plurality of absorption peaks.
- Clusters can be dissociated by irradiating the gas to be measured with light having a photon energy of 0.5 eV or greater and then carrying out analysis.
- the infrared spectroscopic analysis device of the present invention is provided with a wavelength tunable diode laser that oscillates in the infrared region, a means for passing light oscillated from the laser through the gas to be measured, and a means for measuring the intensity of the laser light which has passed through the gas to be measured, the device using infrared spectroscopy to analyze the impurity in the gas to be measured, and being characterized by the provision of a means for lowering the pressure of the gas to be measured.
- the absorption spectrum of the gas to be measured and the absorption spectrum for the impurity alone can be obtained simultaneously provided that the device is one equipped with a means for branching the light oscillated from the diode laser and passing one portion of the branched light through the gas to be measured while passing the other portion of the branched light through the impurity alone, a means for measuring the absorption spectrum of the light passed through the gas to be measured, and a means for measuring the absorption spectrum of the light which passed through the impurity alone. For this reason, an accurate comparison of these absorption spectrums can be made.
- the device is one provided with a means for measuring a derivative absorption spectrum by detecting the derivative change in absorption intensity
- the derivative value absorption peak can be used in the measurement of the impurity, making it possible to improve detection sensitivity.
- analysis of an impurity can be carried out quickly if the device is provided with a means wherein the absorption spectrum of light passed through the gas to be measured and the absorption spectrum of light passed through the impurity alone are compared, an absorption peak having an absorption wavelength that coincides with the absorption peak of the absorption spectrum of the light passed through the gaseous impurity alone is recognized from among the absorption peaks of the absorption spectrum of the light passed through the gas to be measured; and the absorption intensity of this absorption peaks is detected.
- clusters can be dissociated and analysis then carried out, even in the case where the clusters formed by the impurity in the gas to be measured cannot be disassociated using the light source.
- Figure 1 is a structural diagram showing an embodiment of the infrared spectroscopic analysis device of the present invention.
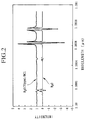
- Figure 2 is an example of a derivative absorption spectrum originating from H2O which was measured using the method of the present invention.
- Figure 3 is a graph for explaining the displacement of the absorption peak wavelength as a result of the formation of clusters.
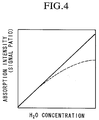
- Figure 4 is a graph for explaining the non-linearity between the absorption peak intensity and the water concentration as a result of formation of clusters.
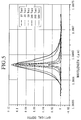
- Figure 5 is a graph showing the dependence on pressure of the absorption spectrum associated with H2O measured in an embodiment of the present invention.
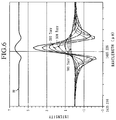
- Figure 6 is a graph showing the dependence on pressure of the derivative absorption spectrum associated with CO2 measured in an embodiment of the present invention.
- Figure 7 shows an enlarged portion of the graph in Figure 6.
- Figure 8 shows an enlarged portion of the graph in Figure 6.
- Figure 9 shows an enlarged portion of the graph in Figure 6.
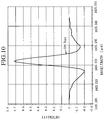
- Figure 10 shows an enlarged portion of the graph in Figure 6.
- Figure 11 shows an enlarged portion of the graph in Figure 6.
- Figure 12 shows an enlarged portion of the graph in Figure 6.
- Figure 13 is a graph showing the dependence on pressure of the derivative absorption spectrum originating from CH4 measured in an embodiment of the present invention.
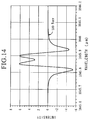
- Figure 14 shows an enlarged portion of the graph in Figure 13.
- Figure 15 shows an enlarged portion of the graph in Figure 13.
- Figure 16 is a derivative absorption spectrum for H2O/HCl measured in embodiment of the present invention.
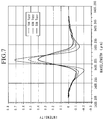
- Figure 17 is a derivative absorption spectrum for CO2/HCl measured in an embodiment of the present invention.
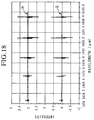
- Figure 18 is a derivative absorption spectrum for CO2/N2 measured in an embodiment of the present invention.
- Figure 19 is a derivative absorption spectrum for SiH4 measured in an embodiment of the present invention.
- Figure 20 is a graph showing the results from an embodiment of the present invention depicting the change in the amount of shift of the absorption peak wavelength when the pressure of the sample gas and the irradiated power of the diode laser are varied.
- Figure 21 is a graph showing the results from an embodiment of the present invention depicting the relationship between photon flux density of the irradiating light, the density of the molecules in the sample gas, and shift in the absorption peak.
- Figure 22 is an example of the absorption spectrum of moisture measured using a moisture content analysis method of the conventional art.
- Figure 23 is an example of the absorption spectrum of nitrogen gas containing moisture measured using a moisture content analysis method of the conventional art.
- Figure 24 is an example of the calibration curve showing the relationship between absorption peak intensity and concentration of the moisture content in a moisture content analysis method of the conventional art.
- the present inventors investigated various means for improving the resolution of absorption peaks in infrared spectroscopic analysis.
- the present invention improves the accuracy of measurement by reducing pressure. Accordingly, the low pressure state referred to in the present invention indicates a state wherein the total pressure of the gas to be measured is less than one atmospheric pressure.
- the width of the absorption peak becomes broad. Accordingly, the height of the absorption peak becomes small.
- the pressure of the gas to be measured is less than 100 Torr, the width of the absorption peaks becomes narrow accompanying the decrease in pressure (the absorption peak becomes higher).
- This decrease in the width of the absorption peaks is not without limits. In other words, the width approaches a fixed value unrelated to the pressure, that is to say, the Doppler limit, based on the Doppler effect. Accordingly, if pressure is reduced too low, the decrease in the width of the absorption peak becomes dulled, and its height becomes low. As a result, the sensitivity of detection decreases.
- the amount of light absorbed by the impurity is small with respect to the amount of light incidented on the gas to be measured, so that the signal-to-noise ratio becomes very small.
- the rate of change in the amount of absorption that is by detecting the derivative value for the change in absorption intensity and using the derivative absorption peak, the sensitivity of measurement can be improved.
- the preferred level of pressure reduction can similarly be set to 10 to 500 Torr.
- the accuracy of analysis can be improved by selecting a wavelength range wherein absorption peaks from the impurity (target gas of measurement) can be obtained and where a strong peak can be obtained.
- H2O molecules have the largest effect. For this reason, the following examples will begin by illustrating the case where H2O molecules are the impurity targeted for measurement. H2O molecules display very many absorption peaks over a wide wavelength region. In particular, it is preferable to select the wavelength region to be in the range of 1.35 to 1.42 ⁇ m where the absorption cross section from H2O molecules is at least one order of magnitude larger than that of other near-infrared regions.
- Effective wavelength regions for detecting other gaseous impurities which are the target of measurement are as follows: carbon dioxide (CO2) 1.43 to 1.46 ⁇ m hydrogen fluoride (HF) 1.25 to 1.35 ⁇ m methane (CH4) 1.29 to 1.50 ⁇ m mono-silane (SiH4) 1.19 to 2.00 ⁇ m hydrogen bromine (HBr) 1.34 to 1.37 ⁇ m hydroxyl group (-OH) 1.40 to 1.45 ⁇ m
- the identification of the impurity in the gas to be measured from the obtained absorption spectrum may be carried out by measuring the absorption spectrum for the impurity alone in a separate process and confirming the plurality of absorption peaks originating from the impurity. As a result, it is possible to carry out an accurate identification.
- the determination of the identified impurity may be carried out by selecting the strongest peak not experiencing interference from nearby peaks from among the plurality of absorption peaks used in the identification, and carrying out determination of the impurity from the intensity of absorption of this strongest peak. In this manner, it is possible to carry out an accurate measurement.
- the measurement of the absorption intensity may be carried out by using not only the spectrum for the amount of absorption, but also the rate of change in the amount of absorption; that is, the derivative absorption spectrum of the change in absorption intensity, it is possible to improve measurement sensitivity.
- the aforementioned frequency modulation method can be employed.
- Figure 2 is a graph showing an example of the results of infrared spectroscopic analysis of a gas under low pressure (100 Torr), the hydrogen chloride (HCl) gas including moisture in the amount of 70 ppm.
- the graph is a derivative absorption spectrum of the change in absorption intensity. Additionally, infrared spectroscopic analysis of H2O under a pressure of 20 Torr was simultaneously carried out in the same way.
- A indicates the case where H2O in nitrogen (N2) is measured at a laser light power of 0.7 mW; B indicates the case where H2O in hydrogen chloride (HCl) is measured at a laser light power of 2.05 mW; and C indicates the case where H2O in hydrogen chloride (HCl) is measured at a laser light power of 0.7 mW. Additionally, the pressure of the gas to be measured in all cases was 100 Torr.
- the broken line indicates the standard position of the H2O peak obtained using a reference cell.
- the absorption peak wavelength coincided with the standard position.
- Figure 4 shows the relationship between the concentration of H2O in HCl and absorption intensity.
- the solid line indicates measurement at a laser light power of 2.05 mW, while the broken line indicates measurement at a laser light power of 0.7 mW.
- the laser light power is 2.05 mW
- a good linear relationship is displayed between H2O concentration and absorption intensity, and the graph obtained can be used as a calibration curve.
- the laser light power is set to the small value of 0.7 mW
- the deviation from a straight line becomes larger as the concentration of H2O increases. Accordingly, the graph obtained cannot be used as a calibration curve.
- the absorption peak wavelength experiences a shift away from the standard position. Accordingly, when absorption peaks from other components lie near the shifted absorption peak wavelength, it becomes difficult to make a qualitative identification. Further, because the absorption peak wavelength shifts while at the same time quantity of absorption changes, an accurate calibration curve cannot be obtained, making it impossible to make an accurate determination.
- the HCl which is the gas to be measured and the H2O which is the impurity are both strongly polar molecules.
- the HCl and H2O molecules are believed to form clusters by bonding together.
- the nitrogen which is the gas to be measured is a non-polar molecule.
- the impurity is the strongly polar molecule H2O, because it is present in a trace amount, the H2O molecules are not believed to form clusters with N2 in the N2 gas.
- the present invention was designed to enable the carrying out of an accurate analysis by dissociating clusters formed by the molecules of an impurity in the gas to be measured, and then carrying out spectral analysis.
- a method of dissociating clusters there is the method of irradiating with a light energy which is greater than the energy for cluster formation. More concretely, the energy for cluster formation is less than 0.5 eV. Accordingly, by irradiating the gas to be measured with a photon energy that is 0.5 eV or greater, a state wherein the clusters are dissociated can be obtained.
- the wavelength of light having a photon energy of 0.5 eV is 2.48 ⁇ m. Accordingly, when light of wavelength 2.48 ⁇ m or less is used in spectral analysis, it is possible for the irradiation light for spectral analysis to also serve as the irradiation light for cluster dissociation. However, when the wavelength of the irradiation light used for spectral analysis is longer than 2.48 ⁇ m, light of wavelength of 2.48 ⁇ m or less may be used additionally to accomplish cluster dissociation.
- the efficiency of cluster dissociation using irradiation by light having a photon energy of 0.5 eV or greater varies accordingly to the pressure of the gas to be measured and power of the irradiation light. For example, when the pressure of the gas to be measured is large, the efficiency becomes poor and it is necessary to increase the power of the irradiation light. If the power of the irradiation light is made high, the degree of cluster dissociation becomes large. In the present invention, however, dissociation of clusters may be carried out to the extent that there is no hindrance presented to the process of spectral analysis.
- D p photon number/sec ⁇ cm2
- N molecules
- Irradiating photon energy in this way is an effective method to use when molecules of the impurity in the gas to be measured form clusters. While it is not necessary to use this type of light energy irradiation when it is clear that the molecules of the impurity do not form clusters because of the composition of the gas to be measured, etc., use of this technique in any case will not present a problem.
- the type of gas to be measured is not particularly limited, but rather appropriately used are various gases such as general gases like nitrogen, oxygen, argon, helium, carbon dioxide and the like, or semiconductor material gases such as silane, phosphine, arsine, trichlorosilane, hydrogen chloride or organometallic compounds.
- gases such as general gases like nitrogen, oxygen, argon, helium, carbon dioxide and the like, or semiconductor material gases such as silane, phosphine, arsine, trichlorosilane, hydrogen chloride or organometallic compounds.
- the impurity that is the target gas to be measured in the present invention is a substance on which infrared spectroscopic analysis can be performed
- the present invention can be appropriately applied to the analysis of inorganic compounds such as water, carbon dioxide, carbon monoxide, hydrogen fluoride, hydrogen chloride, hydrogen bromide, hydrogen iodide, mono-silane (SiH4), and many such organic compounds as methane.
- Figure 1 is a schematic structural diagram showing an embodiment of the infrared spectroscopic analysis device of the present invention.
- One set of light rays passes through sample cell 5, is focused by focusing lens 6 and enters into photo-detection device 7.
- the other set of light rays passes through reference cell 8, is focused by lens 9 and enters into photo-detection device 10.
- the target substance to be measured is inside reference cell 8 under reduced pressure.
- the light which is in detection devices 7 and 10 is converted to an electric signal and sent to phase-sensitive amplifiers 11 and 12, respectively.
- phase-sensitive amplifiers 11 and 12 a signal in synchronization with the modulation signal sent from chopper 3 is amplified, enters calculator 13, and is processed as measurement data.
- the current of diode laser 1 at time of measurement is supplied by current driver 14.
- the temperature of the Peltier device in diode laser 1 is controlled by temperature controller 15.
- a flow control unit 18 is provided to the entrance of cell 5 and a pressure control unit 17 and an exhaust pump 16 are provided to the exit of cell 5.
- exhaust pump 16 When measurement is carried out, exhaust pump 16 operates at a fixed pumping speed. The necessary pressure is pre-set at pressure control unit 17. The difference between the measured pressure signal and the set pressure signal is fed back to flow control unit 18, and the flow of the gas entering cell 5 is controlled. Because of this design, the pressure in cell 5 can be maintained at a constant value as the gas which is to be measured flows into the cell.
- the oscillation wavelength of diode laser 1 can be varied by changing the temperature of the Peltier device or the injection current.
- a method may also be applied wherein the amount of exhaust is controlled by setting flow at the sample cell entrance to a fixed value.
- a light irradiation device 20 may be provided.
- Light irradiation device 20 is provided to the outside of sample cell 5 and, as a result, light having a photon energy of 0.5 eV or more irradiates the entire sample cell 5.
- the type of device employed as light irradiation device 20 is optional provided that it can irradiate light having a photon energy of 0.5 eV or more, namely light of wavelength 2.48 ⁇ m or less.
- a fluorescent lamp which irradiates visible light rays may be used.
- the absorption spectrum of the gas to be measured and the absorption spectrum of the impurity alone can be simultaneously obtained by scanning the wavelength of the light oscillated from diode laser 1.
- Chopper 3 is used for DC amplification.
- modulation of the laser light is carried out at chopper 3 in order to reduce noise.
- chopper 3 is not used.
- the process of measuring data at calculator 13 may be carried out by first comparing the absorption spectrum which has passed through the gas to be measured and the absorption spectrum which has passed through the gaseous impurity alone.
- the absorption peak whose absorption wavelength coincides with the absorption peak in the absorption spectrum obtained from the gaseous impurity only can be recognized from among the absorption peaks in the absorption spectrum from the gas to be measured.
- Programming may be done in advance so that the absorption intensity of this absorption peak is detected and a numerical value is displayed. If this is done, then, it becomes possible to speed up measurement.
- An infrared spectroscopic analysis device such as this can be used by directly connecting the sample cell to a pipe arrangement in the production process for semiconductors or the like, and is ideally suited for carrying out the in-situ measurements conveniently during the process.
- the dependence on pressure of the absorption spectrum associated with H2O was investigated.
- the device shown in Figure 1 was employed to measure the absorption spectrum for the sample gas N2 which included a trace moisture content. Further, because the goal was to investigate the effects of pressure on the absorption spectrum, the oscillation wavelength of the diode laser was scanned at around 1.380 ⁇ m, at which it is possible to obtain peaks associated with H2O having a comparatively large absorption intensity. Moreover, the oscillation wavelength of the diode laser was varied by varying the injection current.
- Figure 5 shows absorption spectrums obtained by measurements conducted with the sample gas of 100 ppm H2O/N2 flowing when the pressure inside the sample cell was 10, 30, 50, 100, 300, and 500 Torr respectively. Wavelength is noted along the horizontal axis, while optical depth, which is equivalent to the absorption intensity, is noted along the vertical axis in this graph. As shown in Figure 5, when the pressure in the sample cell is increased to 300 Torr or higher, the shape of the spectrum is distorted, becoming non-symmetrical, due to the influence of neighboring absorption lines. Further, while the intensity of absorption is expected to be greater at a pressure of 500 Torr than at 300 Torr, in fact, conversely, it is smaller.
- the dependence on pressure of the absorption spectrum associated with CO2 was investigated.
- the device shown in Figure 1 was employed to measure the absorption spectrum for the gas to be measured, HCl which included CO2. Further, because the goal was to investigate the effects of pressure on the absorption spectrum, the oscillation wavelength of the diode laser was scanned at around 1.435 ⁇ m (1435 nm), at which it is possible to obtain peaks originating from CO2 having a comparatively large absorption intensity. Moreover, the oscillation wavelength of the diode laser was varied by varying the injection current.
- Figure 6 shows derivative absorption spectrums obtained by measurements conducted with the sample gas of 7.4% by weight CO2/HCl flowing when the pressure inside the sample cell was 10, 30, 50, 100, 200, 300, 400, 500, 600, and 700 Torr respectively.
- the oscillation wavelength is noted along the horizontal axis while the derivative value (arbitrary units) of the change in absorption intensity is noted along the vertical axis in this graph.
- the reference cell was filled with CO2 alone at 20 Torr and measurements were carried out.
- spectrum R for CO2 alone was aligned along the horizontal axis for comparison with the aforementioned derivative value absorption spectrums.
- Identification was made by recognizing the coincidence of the position (wavelength) of the peak obtained by measuring CO2 alone and the position of the peak obtained by measuring the gas to be measured. Additionally, it is noted here that spectrum R which was obtained by measuring CO2 alone is displayed by compressing the variation in absorption intensity and raising the base line.
- Figure 7 shows the spectrum at the sample gas pressures from 500 to 700 Torr.
- Figure 8 shows the spectrum at the sample gas pressure of 700 Torr.
- Figure 9 shows the spectrum at the sample gas pressure of 600 Torr.
- Figure 10 shows the spectrum at the sample gas pressure of 500 Torr.
- Figure 11 shows the spectrum at the sample gas pressures from 10 to 50 Torr.
- Figure 12 shows the spectrum at the sample gas pressure of 10 Torr.
- the distance from the tip of the peak to the lowest point at the bottom where the peak begins to rise (indicated by D in Figure 8) can be used in the determination as the peak height (absorption intensity).
- the dependence on pressure of the absorption spectrum associated with CH4 was investigated.
- the device shown in Figure 1 was employed to measure the absorption spectrum for the sample gas N2 gas containing CH4. Further, because the goal was to investigate the effects of pressure on the absorption spectrum, the oscillation wavelength of the diode laser was scanned at around 1.645 ⁇ m to 1.646 ⁇ m (1645 nm to 1646 nm), at which it is possible to obtain peaks associated with CH4 having a comparatively large absorption intensity. Moreover, the oscillation wavelength of the diode laser was varied by varying the injection current.
- Figure 13 shows derivative absorption spectrums obtained by measurements conducted with the sample gas of 7.9% by weight CH4/N2 flowing when the pressure inside the sample cell was 10, 30, 50, 100, 200, 300, 400, 500, 600, and 700 Torr respectively.
- the oscillation wavelength is noted along the horizontal axis while the derivative value of the change in absorption intensity is noted along the vertical axis (arbitrary units) in this graph.
- the reference cell was filled with CH4 alone at 20 Torr and measurements were carried out.
- spectrum R for CH4 alone was aligned along the horizontal axis for comparison to the aforementioned derivative absorption spectrums.
- Identification was carried out by confirming the coincidence of the position (wavelength) of the peak obtained by measuring the CH4 alone and the position of the peak obtained by measuring the gas to be measured. Additionally, it is noted here that spectrum R which was obtained by measuring CH4 alone is displayed by compressing variation in absorption intensity and raising the base line.
- Figure 14 shows the spectrum at a sample gas pressure of 500 Torr
- Figure 15 shows spectrum R at a pressure of 10 Torr.
- the analysis of the moisture in hydrogen chloride gas a representative example of the gases which are used as material in semiconductor manufacturing, was carried out.
- the sample cell was filled at 30 Torr with hydrogen chloride gas having an unknown moisture concentration, while the reference cell was filled with a moisture alone at a pressure of 20 Torr. Additionally, the optical path length was 50 cm.
- oscillation wavelength is shown on the horizontal axis, while the derivative value of the change in absorption intensity is noted along the vertical axis (arbitrary units) in this graph. Further, in order to avoid overlap between the spectrum for the moisture only (indicated by R in the figure) and the spectrum for the sample gas (indicated by S in the figure), the base line for spectrum S for the sample gas was lowered one scale unit.
- the spectrum for the sample gas could be obtained with the same resolution as that of the spectrum for the moisture only. Accordingly, by comparing the spectrum for the gas to be measured and the spectrum for the moisture alone, and confirming the plurality of absorption peaks originating from water based on the position and intensity ratio of the peaks, the water can be identified with surety. Then, the strongest peak which does not experience any interference from nearby peaks is selected from among the plurality of absorption peaks originating from water, and the determination of the water is then carried out from the absorption intensity of this strongest peak.
- Determination of the moisture content is carried out by selecting from among the above four identified peaks, the strongest peak P with no nearby interfering peaks. It can be recognized here that the intensity ratio between strong peak P and the other peaks coincide well between the spectrum for the moisture alone and the spectrum for the sample gas. Accordingly, peak P is a peak arising from the moisture content alone and is judged not to be experiencing interference from unknown peaks. Peak P, then, can be used to carry out determination of the moisture content with surety.
- a calibration curve (not noted) is formed in advance showing the relationship between the concentration of the moisture content and the peak intensity based on this strongest peak P. Using this calibration curve, the moisture content in the sample gas is obtained from the strongest peak P in the spectrum of the sample gas.
- the sample cell was filled at 100 Torr with hydrogen chloride gas containing CO2 in the amount of 7.4 wt %, while the reference cell was filled with CO2 alone at a pressure of 20 Torr.
- the spectrum S for the sample gas could be obtained with the same resolution as that of the spectrum R for the CO2 alone. Accordingly, by comparing the spectrum of the sample gas and the spectrum of the CO2 alone, and confirming the plurality of absorption peaks associated with CO2 based on peak position and relative intensity values, the CO2 can be identified with certainty.
- the strongest peak which does not experience any interference from nearby peaks is selected from among the plurality of absorption peaks associated with CO2, and the determination of the CO2 is then carried out in the same manner as in the above Embodiment 4.
- the peak obtained at a wavelength of 1.3457 ⁇ m is desirably used in the determination process since it shows strong absorption intensity.
- the sample cell was filled at 100 Torr with nitrogen gas containing CO2 in the amount of 7.4% by weight, while the reference cell was filled with CO2 alone at a pressure of 20 Torr.
- the spectrum S for the sample gas could be obtained with the same resolution as that of the spectrum R for the CO2 alone. Accordingly, by comparing the spectrum for the sample gas and the spectrum for the CO2 alone, and confirming the plurality of absorption peaks associated with CO2 based on peak position and relative intensity values, the CO2 can be identified with certainty.
- the strongest peak which does not experience any interference from nearby peaks is selected from among the plurality of absorption peaks associated with CO2, and the determination of CO2 is then carried out in the same manner as in the above Embodiment 4.
- the peak obtained at a wavelength of 1.3453 ⁇ m is desirably used in the determination process since it shows strong absorption intensity.
- the sample cell was filled at 30 Torr with SiH4, and measurement was carried out in the same way as in the above embodiment 4.
- the derivative absorption spectrum obtained is shown in Figure 19.
- a plurality of sharp peaks originating from SiH4 in the wavelength range of 1.3804 to 1.3814 ⁇ m can be observed. It was determined that these could be used to carry out the identification and determination of SiH4 in the same manner as performed above for the cases of H2O and CO2.
- Hydrogen chloride gas containing moisture in the amount of 70 ppm was used as the sample gas. From among the absorption peaks by irradiating the sample gas with laser light, the absorption peak arising from the moisture component and having a standard position at wavelength of 1.38075 ⁇ m was investigated. Because the photon energy of the light of wavelength of 1.38075 ⁇ m was, at approximately 0.9 eV, larger than 0.5 eV, it was not necessary to provide irradiation light for cluster dissociation in addition to the irradiation light for spectral analysis.
- the oscillation wavelength was scanned by fixing the output of the diode laser and varying the temperature of the diode laser. Measurements were then conducted to determine where the peak having a standard position at a wavelength of 1.38075 ⁇ m from among the four peaks associated with H2O shown in Figure 2 was obtained under the above-described conditions. That is to say, measurements were made to determine how far the peak had shifted from 1.38075 ⁇ m. Measurements were carried out with the sample gas under pressures of 50 Torr, 100 Torr and 200 Torr, respectively.
- the power (output) of the diode laser was set to three levels of 0.7 mW, 1.3 mW and 2.05 mW.
- Methods which may be used here for lowering the pressure of the sample gas include a method for controlling the quantity of gas flow at the sample cell 3 entrance through which the sample gas is introduced, or a method for controlling the exhaust amount at the cell exit by fixing the gas flow at the sample cell 3 entrance.
- the pressure in the cell is controlled and maintained as the sample gas flows into sample cell 3. It is noted here that measurement is carried out at room temperature.
- FIG. 20 The results are shown in Figure 20.
- the power of the diode laser is displayed on the horizontal axis, while the amount of wavelength shift of the peaks for which 1.38075 ⁇ m is the standard are respectively shown on the vertical axis.
- a indicates a sample gas pressure of 50 Torr
- b indicates a sample gas pressure of 100 Torr
- c indicates a sample gas pressure of 200 Torr.
- the photon flux density D P of the laser light irradiating the sample gas is calculated from the laser light intensity introduced to the sample cell and the laser beam diameter (2 mm).
- a determinative analysis of trace amounts of an impurity in a gas to be measured can be carried out with high sensitivity and high accuracy using infrared spectroscopic analysis.
- the present invention can be optimally used in the analysis of a variety of impurities in a gas.
- the present invention is particularly applicable to the rapid and convenient analysis by the in-situ measurement of trace amounts of an impurity present in gases used as materials for semiconductor manufacturing for which an accurate analysis has conventionally been very difficult, and to the obtaining of highly reliable data.
Applications Claiming Priority (7)
| Application Number | Priority Date | Filing Date | Title |
|---|---|---|---|
| JP5633594 | 1994-03-25 | ||
| JP56335/94 | 1994-03-25 | ||
| JP56334/94 | 1994-03-25 | ||
| JP5633494 | 1994-03-25 | ||
| JP532995 | 1995-01-17 | ||
| JP5329/95 | 1995-01-17 | ||
| PCT/JP1995/000523 WO1995026497A1 (fr) | 1994-03-25 | 1995-03-22 | Analyse de gaz par spectrochimie infrarouge et appareil utilise |
Publications (2)
| Publication Number | Publication Date |
|---|---|
| EP0706042A1 true EP0706042A1 (fr) | 1996-04-10 |
| EP0706042A4 EP0706042A4 (fr) | 1998-11-04 |
Family
ID=27276704
Family Applications (1)
| Application Number | Title | Priority Date | Filing Date |
|---|---|---|---|
| EP95913317A Withdrawn EP0706042A4 (fr) | 1994-03-25 | 1995-03-22 | Analyse de gaz par spectrochimie infrarouge et appareil utilise |
Country Status (5)
| Country | Link |
|---|---|
| US (2) | US5703365A (fr) |
| EP (1) | EP0706042A4 (fr) |
| KR (1) | KR100186272B1 (fr) |
| TW (1) | TW315410B (fr) |
| WO (1) | WO1995026497A1 (fr) |
Cited By (17)
| Publication number | Priority date | Publication date | Assignee | Title |
|---|---|---|---|---|
| US5742399A (en) * | 1996-04-18 | 1998-04-21 | American Air Liquide, Inc. | Method for stabilizing the wavelength in a laser spectrometer system |
| US5818578A (en) * | 1995-10-10 | 1998-10-06 | American Air Liquide Inc. | Polygonal planar multipass cell, system and apparatus including same, and method of use |
| US5835230A (en) * | 1997-07-10 | 1998-11-10 | American Air Liquide Inc. | Method for calibration of a spectroscopic sensor |
| US5880850A (en) * | 1996-04-18 | 1999-03-09 | American Air Liquide Inc | Method and system for sensitive detection of molecular species in a vacuum by harmonic detection spectroscopy |
| US5949537A (en) * | 1996-04-18 | 1999-09-07 | American Air Liquide Inc. | In-line cell for absorption spectroscopy |
| US5963336A (en) * | 1995-10-10 | 1999-10-05 | American Air Liquide Inc. | Chamber effluent monitoring system and semiconductor processing system comprising absorption spectroscopy measurement system, and methods of use |
| EP0977028A1 (fr) * | 1998-01-28 | 2000-02-02 | Nippon Sanso Corporation | Procede d'analyse spectrale d'impuretes dans un gaz |
| EP0984267A1 (fr) * | 1998-08-31 | 2000-03-08 | John Tulip | Détecteur de gaz avec cellule de référence |
| US6084668A (en) * | 1997-07-10 | 2000-07-04 | American Air Liquide Inc. | In-line cell for absorption spectroscopy |
| EP1111369A1 (fr) * | 1998-07-02 | 2001-06-27 | Nippon Sanso Corporation | Procédé spectroscopique pour la mesure des impuretés a l'etat de traces dans un gaz avec radiation laser |
| US6442736B1 (en) | 2000-10-03 | 2002-08-27 | L'air Liquide Societe Anonyme A Directoire Et Conseil De Surveillance Pour L'etude Et L'expolitation Des Procedes Georges Claude | Semiconductor processing system and method for controlling moisture level therein |
| US6519039B1 (en) | 1998-03-11 | 2003-02-11 | Nippon Sanso Corporation | Gas spectrochemical analyzer, and spectrochemical analyzing method |
| WO2005064412A2 (fr) * | 2003-12-31 | 2005-07-14 | Asml Netherlands B.V. | Appareil lithographique, procede de fabrication de dispositif et dispositif fabrique par ce procede |
| CN102967572A (zh) * | 2011-08-30 | 2013-03-13 | 国立大学法人鹿儿岛大学 | 苦味酸还原生成物浓度的测定方法、以及使用该测定方法的焦炉煤气的脱硫方法 |
| US20150136961A1 (en) * | 2013-11-21 | 2015-05-21 | TOTAL Gas Detection Ltd. | Methods and Devices for Analyzing Gases in Well-Related Fluids Using Fourier Transform Infrared (FTIR) Spectroscopy |
| EP3598106A1 (fr) * | 2018-07-17 | 2020-01-22 | Schütz GmbH Messtechnik | Dispositif mobile et portable de détection de gaz, procédé de détection de gaz et utilisation du dispositif de détection de gaz |
| EP2388570B2 (fr) † | 2010-05-18 | 2022-10-12 | Horiba, Ltd. | Analyseur de gaz adsorbant |
Families Citing this family (48)
| Publication number | Priority date | Publication date | Assignee | Title |
|---|---|---|---|---|
| JP3274605B2 (ja) * | 1996-05-01 | 2002-04-15 | 日本無線株式会社 | 炭素同位体分析装置 |
| JPH10281988A (ja) * | 1997-04-09 | 1998-10-23 | Nippon Sanso Kk | ガス分析方法及びガス分析装置 |
| FR2784747B1 (fr) | 1998-10-16 | 2000-12-08 | Air Liquide | Procede et dispositif de mesure de la quantite d'impuretes dans un echantillon de gaz a analyser |
| JP3837626B2 (ja) * | 1998-10-29 | 2006-10-25 | ミヤチテクノス株式会社 | レーザ加工装置 |
| JP3343680B2 (ja) * | 1999-07-12 | 2002-11-11 | 日本酸素株式会社 | レーザー分光分析装置 |
| US7179653B2 (en) * | 2000-03-31 | 2007-02-20 | Showa Denko K.K. | Measuring method for concentration of halogen and fluorine compound, measuring equipment thereof and manufacturing method of halogen compound |
| US20020092340A1 (en) * | 2000-10-30 | 2002-07-18 | Veeco Instruments Inc. | Cantilever array sensor system |
| KR100427870B1 (ko) * | 2000-12-19 | 2004-04-30 | 기아자동차주식회사 | 적외선 분광분석기를 이용한 엔진오일 점검장치 |
| US6465775B2 (en) * | 2000-12-19 | 2002-10-15 | Schlumberger Technology Corporation | Method of detecting carbon dioxide in a downhole environment |
| US7019746B2 (en) * | 2001-10-26 | 2006-03-28 | Agilent Technologies, Inc. | Graphical presentation of spectral information for aid in compliance measurements |
| US6841778B1 (en) | 2001-11-09 | 2005-01-11 | Environmental Systems Products Holdings Inc. | Method and apparatus for measuring particulates in vehicle emissions |
| SE0200782D0 (sv) * | 2002-03-14 | 2002-03-14 | Astrazeneca Ab | Method of analysing a pharmaceutical sample |
| US7342229B1 (en) * | 2002-06-27 | 2008-03-11 | Smart Transitions, Llc | Spectroscopic signal processing methodology |
| US7514269B1 (en) | 2002-06-27 | 2009-04-07 | Smart Transitions, Llc | Precision adaptable chemical spectrometer |
| JP3705270B2 (ja) * | 2003-01-20 | 2005-10-12 | セイコーエプソン株式会社 | 赤外吸収測定方法および赤外吸収測定装置、ならびに半導体装置の製造方法 |
| JP3744903B2 (ja) * | 2003-01-20 | 2006-02-15 | セイコーエプソン株式会社 | 赤外吸収測定方法および赤外吸収測定装置、ならびに半導体装置の製造方法 |
| US7067323B2 (en) * | 2003-10-15 | 2006-06-27 | Lighthouse Instruments, Llc | System and method for automated headspace analysis |
| JP2006250878A (ja) * | 2005-03-14 | 2006-09-21 | Hideichiro Hirai | 光学測定方法及び光学測定装置 |
| US9771264B2 (en) * | 2005-10-25 | 2017-09-26 | Massachusetts Institute Of Technology | Controlled-orientation films and nanocomposites including nanotubes or other nanostructures |
| WO2008054378A2 (fr) * | 2005-10-25 | 2008-05-08 | Massachusetts Institute Of Technology | Appareil et procédés de contrôle de la croissance et de l'assemblage de nanostructures |
| KR100793867B1 (ko) * | 2006-04-28 | 2008-01-15 | 현대자동차주식회사 | 차량의 연소 및 배기가스의 광계측용 파장가변 레이저장치 |
| CN101495849B (zh) | 2006-07-31 | 2013-01-30 | 应用材料公司 | 原位分析电子器件制造系统中的气体的方法及系统 |
| US20080093555A1 (en) * | 2006-09-29 | 2008-04-24 | N.V. Organon | Method to determine water content in a sample |
| JP4870636B2 (ja) * | 2007-09-18 | 2012-02-08 | 日本電信電話株式会社 | 無機塩の定性定量分析方法およびその分析装置 |
| JP2009115654A (ja) * | 2007-11-07 | 2009-05-28 | Toyota Motor Corp | 炭化水素濃度測定装置および炭化水素濃度測定方法 |
| US9116116B2 (en) * | 2008-03-28 | 2015-08-25 | Horiba, Ltd. | Optical analyzer and wavelength stabilized laser device for analyzer |
| GB2466181A (en) * | 2008-12-09 | 2010-06-16 | Rolls Royce Plc | Monitoring of components of a gas mixture in a reduced pressure environment |
| JP5690070B2 (ja) * | 2010-01-06 | 2015-03-25 | 大陽日酸株式会社 | シラン系ガス中の水分濃度の測定方法および測定装置 |
| TW201126199A (en) | 2010-01-20 | 2011-08-01 | Young Optics Inc | Lens module |
| JP5501797B2 (ja) * | 2010-02-24 | 2014-05-28 | 三井造船株式会社 | スペクトラム分析装置及びスペクトラム分析方法 |
| US8547554B2 (en) * | 2011-08-17 | 2013-10-01 | General Electric Company | Method and system for detecting moisture in natural gas |
| FR2993659B1 (fr) * | 2012-07-23 | 2014-08-08 | Adixen Vacuum Products | Procede et installation de detection pour le controle d'etancheite d'emballages de produits scelles |
| JP2016035385A (ja) * | 2013-01-16 | 2016-03-17 | 横河電機株式会社 | レーザガス分析装置 |
| US9194797B2 (en) | 2013-12-20 | 2015-11-24 | General Electric Company | Method and system for detecting moisture in a process gas involving cross interference |
| FI20145030L (fi) * | 2014-01-15 | 2015-07-16 | Sparklike Ab Oy | Menetelmä ja laite kaasukomponentin havainnoimiseksi läpinäkyvän tilavuuden sisällä |
| US10024787B2 (en) | 2014-05-15 | 2018-07-17 | General Electric Company | System and method for measuring concentration of a trace gas in a gas mixture |
| KR101713212B1 (ko) | 2014-11-27 | 2017-03-09 | 한국건설기술연구원 | 분리형 원거리 가스 측정 장치 및 방법, 그리고 이를 실행하기 위한 프로그램을 기록한 컴퓨터로 읽을 수 있는 기록매체 |
| JP6413759B2 (ja) * | 2014-12-25 | 2018-10-31 | 株式会社島津製作所 | 光学分析装置 |
| US10724945B2 (en) | 2016-04-19 | 2020-07-28 | Cascade Technologies Holdings Limited | Laser detection system and method |
| US10180393B2 (en) | 2016-04-20 | 2019-01-15 | Cascade Technologies Holdings Limited | Sample cell |
| GB201700905D0 (en) | 2017-01-19 | 2017-03-08 | Cascade Tech Holdings Ltd | Close-Coupled Analyser |
| JP2019027963A (ja) * | 2017-07-31 | 2019-02-21 | 富士電機株式会社 | ガス分析装置およびガス分析方法 |
| WO2021053804A1 (fr) * | 2019-09-19 | 2021-03-25 | 株式会社島津製作所 | Dispositif de spectroscopie d'absorption de gaz et procédé de spectroscopie d'absorption de gaz |
| CN110806395A (zh) * | 2019-11-19 | 2020-02-18 | 国网重庆市电力公司电力科学研究院 | 一种气体浓度测量方法、装置、设备及系统 |
| CN110927093A (zh) * | 2019-11-22 | 2020-03-27 | 光钙(上海)高科技有限公司 | 一种基于迈克尔逊型红外光谱技术的气体探测系统 |
| WO2023095864A1 (fr) * | 2021-11-25 | 2023-06-01 | 株式会社堀場製作所 | Dispositif d'analyse, programme destiné à un dispositif d'analyse et procédé d'analyse |
| WO2023095876A1 (fr) * | 2021-11-25 | 2023-06-01 | 株式会社堀場製作所 | Dispositif d'analyse et procédé d'analyse |
| CN114324191A (zh) * | 2022-01-07 | 2022-04-12 | 柳州职业技术学院 | 一种基于智能控制的气味测定系统 |
Citations (1)
| Publication number | Priority date | Publication date | Assignee | Title |
|---|---|---|---|---|
| EP0418799A2 (fr) * | 1989-09-20 | 1991-03-27 | Kurashiki Boseki Kabushiki Kaisha | Méthode pour la détermination quantitative de substances chimiques pour le traitement de semi-conducteurs et appareil à cette fin |
Family Cites Families (19)
| Publication number | Priority date | Publication date | Assignee | Title |
|---|---|---|---|---|
| CH546989A (de) * | 1972-12-06 | 1974-03-15 | Cerberus Ag | Verfahren und vorrichtung zur brandmeldung. |
| US3793525A (en) * | 1973-01-02 | 1974-02-19 | Philco Ford Corp | Dual cell non-dispersive gas analyzer |
| JPS58225345A (ja) * | 1982-06-24 | 1983-12-27 | Fujitsu Ltd | ガス分析方法 |
| JPH0638058B2 (ja) * | 1984-08-16 | 1994-05-18 | 新日本製鐵株式会社 | 気体の濃度および分圧測定装置 |
| JPS6195229A (ja) * | 1984-10-16 | 1986-05-14 | Osaka Gas Co Ltd | 超高純度ガス中の不純物測定方法 |
| JPH0652236B2 (ja) * | 1986-02-26 | 1994-07-06 | 三井東圧化学株式会社 | シランガス濃度計測方法および装置 |
| JPS62218843A (ja) * | 1986-03-20 | 1987-09-26 | Fujitsu Ltd | ガスセンサの信号処理方式 |
| JPS6342865A (ja) * | 1986-08-08 | 1988-02-24 | Nec Corp | 半導体装置の捺印方法 |
| JPS6395343A (ja) * | 1986-10-09 | 1988-04-26 | Fujitsu Ltd | ガスセンサ |
| JPS6423142A (en) * | 1987-07-17 | 1989-01-25 | Fujitsu Ltd | Detector for sulfurous acid gas |
| JPH01109244A (ja) * | 1987-10-21 | 1989-04-26 | Ishikawajima Harima Heavy Ind Co Ltd | 自動ガス測定装置 |
| JPH01109243A (ja) * | 1987-10-21 | 1989-04-26 | Ishikawajima Harima Heavy Ind Co Ltd | ガス分析測定装置 |
| JPH0269639A (ja) * | 1988-09-05 | 1990-03-08 | Fujitsu Ltd | レーザ方式ガスセンサ |
| JPH03221843A (ja) * | 1990-01-26 | 1991-09-30 | Hamamatsu Photonics Kk | 光による分析計 |
| JPH0830680B2 (ja) * | 1990-10-15 | 1996-03-27 | アンリツ株式会社 | ガス検出装置 |
| JP3059262B2 (ja) * | 1991-10-08 | 2000-07-04 | 日本酸素株式会社 | ガス中の微量水分分析装置 |
| US5317156A (en) * | 1992-01-29 | 1994-05-31 | Sri International | Diagnostic tests using near-infrared laser absorption spectroscopy |
| US5448070A (en) * | 1993-05-17 | 1995-09-05 | The Foxboro Company | Identification of unknown gases using infrared absorption spectroscopy |
| US5445964A (en) * | 1994-05-11 | 1995-08-29 | Lee; Peter S. | Dynamic engine oil and fuel consumption measurements using tunable diode laser spectroscopy |
-
1995
- 1995-03-22 US US08/545,580 patent/US5703365A/en not_active Expired - Lifetime
- 1995-03-22 WO PCT/JP1995/000523 patent/WO1995026497A1/fr not_active Application Discontinuation
- 1995-03-22 KR KR1019950705235A patent/KR100186272B1/ko not_active IP Right Cessation
- 1995-03-22 EP EP95913317A patent/EP0706042A4/fr not_active Withdrawn
- 1995-03-27 TW TW084102960A patent/TW315410B/zh not_active IP Right Cessation
-
1997
- 1997-07-02 US US08/887,262 patent/US5821537A/en not_active Expired - Lifetime
Patent Citations (1)
| Publication number | Priority date | Publication date | Assignee | Title |
|---|---|---|---|---|
| EP0418799A2 (fr) * | 1989-09-20 | 1991-03-27 | Kurashiki Boseki Kabushiki Kaisha | Méthode pour la détermination quantitative de substances chimiques pour le traitement de semi-conducteurs et appareil à cette fin |
Non-Patent Citations (1)
| Title |
|---|
| See also references of WO9526497A1 * |
Cited By (26)
| Publication number | Priority date | Publication date | Assignee | Title |
|---|---|---|---|---|
| US5963336A (en) * | 1995-10-10 | 1999-10-05 | American Air Liquide Inc. | Chamber effluent monitoring system and semiconductor processing system comprising absorption spectroscopy measurement system, and methods of use |
| US5818578A (en) * | 1995-10-10 | 1998-10-06 | American Air Liquide Inc. | Polygonal planar multipass cell, system and apparatus including same, and method of use |
| US6154284A (en) * | 1995-10-10 | 2000-11-28 | American Air Liquide Inc. | Chamber effluent monitoring system and semiconductor processing system comprising absorption spectroscopy measurement system, and methods of use |
| US6493086B1 (en) | 1995-10-10 | 2002-12-10 | American Air Liquide, Inc. | Chamber effluent monitoring system and semiconductor processing system comprising absorption spectroscopy measurement system, and methods of use |
| US5880850A (en) * | 1996-04-18 | 1999-03-09 | American Air Liquide Inc | Method and system for sensitive detection of molecular species in a vacuum by harmonic detection spectroscopy |
| US5949537A (en) * | 1996-04-18 | 1999-09-07 | American Air Liquide Inc. | In-line cell for absorption spectroscopy |
| US6188475B1 (en) | 1996-04-18 | 2001-02-13 | American Air Liquide, Inc. | In-line cell for absorption spectroscopy |
| US5742399A (en) * | 1996-04-18 | 1998-04-21 | American Air Liquide, Inc. | Method for stabilizing the wavelength in a laser spectrometer system |
| US6084668A (en) * | 1997-07-10 | 2000-07-04 | American Air Liquide Inc. | In-line cell for absorption spectroscopy |
| US5835230A (en) * | 1997-07-10 | 1998-11-10 | American Air Liquide Inc. | Method for calibration of a spectroscopic sensor |
| EP0977028A1 (fr) * | 1998-01-28 | 2000-02-02 | Nippon Sanso Corporation | Procede d'analyse spectrale d'impuretes dans un gaz |
| EP0977028A4 (fr) * | 1998-01-28 | 2001-05-23 | Nippon Oxygen Co Ltd | Procede d'analyse spectrale d'impuretes dans un gaz |
| US6519039B1 (en) | 1998-03-11 | 2003-02-11 | Nippon Sanso Corporation | Gas spectrochemical analyzer, and spectrochemical analyzing method |
| EP1111369A1 (fr) * | 1998-07-02 | 2001-06-27 | Nippon Sanso Corporation | Procédé spectroscopique pour la mesure des impuretés a l'etat de traces dans un gaz avec radiation laser |
| EP0984267A1 (fr) * | 1998-08-31 | 2000-03-08 | John Tulip | Détecteur de gaz avec cellule de référence |
| US6442736B1 (en) | 2000-10-03 | 2002-08-27 | L'air Liquide Societe Anonyme A Directoire Et Conseil De Surveillance Pour L'etude Et L'expolitation Des Procedes Georges Claude | Semiconductor processing system and method for controlling moisture level therein |
| WO2005064412A2 (fr) * | 2003-12-31 | 2005-07-14 | Asml Netherlands B.V. | Appareil lithographique, procede de fabrication de dispositif et dispositif fabrique par ce procede |
| WO2005064412A3 (fr) * | 2003-12-31 | 2006-02-16 | Asml Netherlands Bv | Appareil lithographique, procede de fabrication de dispositif et dispositif fabrique par ce procede |
| US7142287B2 (en) | 2003-12-31 | 2006-11-28 | Asml Netherlands B.V. | Lithographic apparatus, device manufacturing method, and device manufactured thereby |
| US7145641B2 (en) | 2003-12-31 | 2006-12-05 | Asml Netherlands, B.V. | Lithographic apparatus, device manufacturing method, and device manufactured thereby |
| US7230674B2 (en) | 2003-12-31 | 2007-06-12 | Asml Netherlands B.V. | Lithographic apparatus and device manufacturing method |
| EP2388570B2 (fr) † | 2010-05-18 | 2022-10-12 | Horiba, Ltd. | Analyseur de gaz adsorbant |
| CN102967572A (zh) * | 2011-08-30 | 2013-03-13 | 国立大学法人鹿儿岛大学 | 苦味酸还原生成物浓度的测定方法、以及使用该测定方法的焦炉煤气的脱硫方法 |
| US20150136961A1 (en) * | 2013-11-21 | 2015-05-21 | TOTAL Gas Detection Ltd. | Methods and Devices for Analyzing Gases in Well-Related Fluids Using Fourier Transform Infrared (FTIR) Spectroscopy |
| US9638630B2 (en) * | 2013-11-21 | 2017-05-02 | TOTAL Gas Detection Ltd. | Methods and devices for analyzing gases in well-related fluids using fourier transform infrared (FTIR) spectroscopy |
| EP3598106A1 (fr) * | 2018-07-17 | 2020-01-22 | Schütz GmbH Messtechnik | Dispositif mobile et portable de détection de gaz, procédé de détection de gaz et utilisation du dispositif de détection de gaz |
Also Published As
| Publication number | Publication date |
|---|---|
| US5703365A (en) | 1997-12-30 |
| TW315410B (fr) | 1997-09-11 |
| EP0706042A4 (fr) | 1998-11-04 |
| KR100186272B1 (ko) | 1999-05-15 |
| WO1995026497A1 (fr) | 1995-10-05 |
| KR960702607A (ko) | 1996-04-27 |
| US5821537A (en) | 1998-10-13 |
Similar Documents
| Publication | Publication Date | Title |
|---|---|---|
| US5703365A (en) | Infrared spectroscopic analysis method for gases and device employing the method therein | |
| US5705816A (en) | Process and device for analyzing traces of impurities in a gas sample by means of a diode laser | |
| CA1179861A (fr) | Methode et appareil pour mesurer la concentration d'acide fluorhydrique gazeux | |
| JP3059262B2 (ja) | ガス中の微量水分分析装置 | |
| KR20000016360A (ko) | 기체 분석 방법 및 장치 | |
| Werle et al. | Fast chemical sensor for eddy-correlation measurements of methane emissions from rice paddy fields | |
| CN1258352A (zh) | 气体的光谱分析装置和光谱分析方法 | |
| EP0940670A1 (fr) | Cellule d'échantillon amélioré pour spectroscopie d'émission gazeux | |
| CN111521581B (zh) | 一氧化碳和甲烷组分判断及浓度检测方法、装置及应用 | |
| CN112748087A (zh) | 基于温度调谐吸收光谱技术的多组分检测装置及方法 | |
| EP0768523A2 (fr) | Procédé et système pour la détection sensible sous vide d'espèces moléculaires par spectroscopie harmonique | |
| US6294389B1 (en) | Furnace for an engine exhaust measurement system | |
| JP2001509596A (ja) | 分光センサーのキャリブレーションのための方法 | |
| Hörner et al. | Isotope selective analysis of CO 2 with tunable diode laser (TDL) spectroscopy in the NIR | |
| Anderson et al. | Ozone absorption cross section measurements in the Wulf bands | |
| Deckert et al. | Dimer and Trimer in Pyridine–Ethanol Mixture Reinvestigated Applying the Scanning Multi‐Channel Raman Difference Technique and AM1 Molecular Orbital Calculations | |
| US5742399A (en) | Method for stabilizing the wavelength in a laser spectrometer system | |
| KR100316487B1 (ko) | 가스중의 불순물의 분광분석방법 | |
| EP0768524A2 (fr) | Procédé pour la stabilisation de longueur d'onde dans un système de spectromètre laser | |
| JP2587214B2 (ja) | ガスの赤外分光分析方法およびこれに用いられる装置 | |
| Berezin et al. | Detection of moisture content in high-purity ammonia by means of diode-laser spectroscopy | |
| Gianfrani et al. | High-sensitivity detection of NO2 using a 740 nm semiconductor diode laser | |
| JP2587214C (fr) | ||
| Sun et al. | Using wavelength modulation spectroscopy technique to detect trace ammonia gas in near-infrared spectral region | |
| RU2453826C2 (ru) | Способ сравнения относительного содержания изотопомеров 12co2 и 13co2 в образцах газовых смесей и устройство для сравнения относительного содержания изотопомеров 12co2 и 13co2 в образцах газовых смесей |
Legal Events
| Date | Code | Title | Description |
|---|---|---|---|
| PUAI | Public reference made under article 153(3) epc to a published international application that has entered the european phase |
Free format text: ORIGINAL CODE: 0009012 |
|
| 17P | Request for examination filed |
Effective date: 19951025 |
|
| AK | Designated contracting states |
Kind code of ref document: A1 Designated state(s): DE FR GB IT NL SE |
|
| A4 | Supplementary search report drawn up and despatched | ||
| AK | Designated contracting states |
Kind code of ref document: A4 Designated state(s): DE FR GB IT NL SE |
|
| 17Q | First examination report despatched |
Effective date: 20040122 |
|
| STAA | Information on the status of an ep patent application or granted ep patent |
Free format text: STATUS: THE APPLICATION IS DEEMED TO BE WITHDRAWN |
|
| 18D | Application deemed to be withdrawn |
Effective date: 20040602 |