EP4256937A1 - Predictive nutrient map and control - Google Patents
Predictive nutrient map and control Download PDFInfo
- Publication number
- EP4256937A1 EP4256937A1 EP23154795.1A EP23154795A EP4256937A1 EP 4256937 A1 EP4256937 A1 EP 4256937A1 EP 23154795 A EP23154795 A EP 23154795A EP 4256937 A1 EP4256937 A1 EP 4256937A1
- Authority
- EP
- European Patent Office
- Prior art keywords
- map
- predictive
- nutrient
- values
- maps
- Prior art date
- Legal status (The legal status is an assumption and is not a legal conclusion. Google has not performed a legal analysis and makes no representation as to the accuracy of the status listed.)
- Pending
Links
- 235000015097 nutrients Nutrition 0.000 title claims abstract description 309
- 239000000463 material Substances 0.000 claims abstract description 585
- 238000011065 in-situ storage Methods 0.000 claims abstract description 217
- 239000002689 soil Substances 0.000 claims description 129
- 239000012773 agricultural material Substances 0.000 claims description 60
- 238000004891 communication Methods 0.000 claims description 39
- 239000000470 constituent Substances 0.000 claims description 39
- 238000010899 nucleation Methods 0.000 claims description 39
- 238000000034 method Methods 0.000 claims description 23
- 238000013507 mapping Methods 0.000 claims description 2
- 241000196324 Embryophyta Species 0.000 description 238
- 230000000875 corresponding effect Effects 0.000 description 80
- 230000007246 mechanism Effects 0.000 description 47
- 230000003287 optical effect Effects 0.000 description 47
- 238000012545 processing Methods 0.000 description 37
- 238000011109 contamination Methods 0.000 description 34
- 238000010586 diagram Methods 0.000 description 25
- 238000003860 storage Methods 0.000 description 18
- 230000001276 controlling effect Effects 0.000 description 16
- 239000007921 spray Substances 0.000 description 14
- 239000003337 fertilizer Substances 0.000 description 13
- 230000008859 change Effects 0.000 description 11
- 230000005670 electromagnetic radiation Effects 0.000 description 11
- 239000012530 fluid Substances 0.000 description 11
- 230000002363 herbicidal effect Effects 0.000 description 11
- 239000004009 herbicide Substances 0.000 description 11
- 230000006870 function Effects 0.000 description 10
- 230000008569 process Effects 0.000 description 10
- 238000004422 calculation algorithm Methods 0.000 description 9
- 238000005507 spraying Methods 0.000 description 9
- IJGRMHOSHXDMSA-UHFFFAOYSA-N Atomic nitrogen Chemical compound N#N IJGRMHOSHXDMSA-UHFFFAOYSA-N 0.000 description 8
- 238000010801 machine learning Methods 0.000 description 8
- 239000000446 fuel Substances 0.000 description 7
- 230000003993 interaction Effects 0.000 description 7
- 239000000575 pesticide Substances 0.000 description 7
- 238000013459 approach Methods 0.000 description 6
- 238000012546 transfer Methods 0.000 description 6
- 230000005484 gravity Effects 0.000 description 5
- 238000003384 imaging method Methods 0.000 description 5
- 230000008878 coupling Effects 0.000 description 4
- 238000010168 coupling process Methods 0.000 description 4
- 238000005859 coupling reaction Methods 0.000 description 4
- 230000001934 delay Effects 0.000 description 4
- -1 for instance Substances 0.000 description 4
- 230000010354 integration Effects 0.000 description 4
- 229910052757 nitrogen Inorganic materials 0.000 description 4
- 238000001228 spectrum Methods 0.000 description 4
- 230000007723 transport mechanism Effects 0.000 description 4
- 230000001960 triggered effect Effects 0.000 description 4
- ZLMJMSJWJFRBEC-UHFFFAOYSA-N Potassium Chemical compound [K] ZLMJMSJWJFRBEC-UHFFFAOYSA-N 0.000 description 3
- 241000607479 Yersinia pestis Species 0.000 description 3
- 230000001133 acceleration Effects 0.000 description 3
- 238000013528 artificial neural network Methods 0.000 description 3
- 238000013475 authorization Methods 0.000 description 3
- 230000001413 cellular effect Effects 0.000 description 3
- 238000013481 data capture Methods 0.000 description 3
- 201000010099 disease Diseases 0.000 description 3
- 208000037265 diseases, disorders, signs and symptoms Diseases 0.000 description 3
- 239000007788 liquid Substances 0.000 description 3
- 239000011344 liquid material Substances 0.000 description 3
- 230000002093 peripheral effect Effects 0.000 description 3
- 229910052700 potassium Inorganic materials 0.000 description 3
- 239000011591 potassium Substances 0.000 description 3
- 230000004044 response Effects 0.000 description 3
- 239000011343 solid material Substances 0.000 description 3
- XLYOFNOQVPJJNP-UHFFFAOYSA-N water Substances O XLYOFNOQVPJJNP-UHFFFAOYSA-N 0.000 description 3
- XEEYBQQBJWHFJM-UHFFFAOYSA-N Iron Chemical compound [Fe] XEEYBQQBJWHFJM-UHFFFAOYSA-N 0.000 description 2
- OAICVXFJPJFONN-UHFFFAOYSA-N Phosphorus Chemical compound [P] OAICVXFJPJFONN-UHFFFAOYSA-N 0.000 description 2
- 108010016634 Seed Storage Proteins Proteins 0.000 description 2
- 229920002472 Starch Polymers 0.000 description 2
- 238000010521 absorption reaction Methods 0.000 description 2
- 230000002776 aggregation Effects 0.000 description 2
- 238000004220 aggregation Methods 0.000 description 2
- 230000004075 alteration Effects 0.000 description 2
- 230000008901 benefit Effects 0.000 description 2
- 230000015572 biosynthetic process Effects 0.000 description 2
- 239000000969 carrier Substances 0.000 description 2
- 239000004927 clay Substances 0.000 description 2
- 238000002485 combustion reaction Methods 0.000 description 2
- 239000000356 contaminant Substances 0.000 description 2
- 238000013527 convolutional neural network Methods 0.000 description 2
- 230000002596 correlated effect Effects 0.000 description 2
- 238000001514 detection method Methods 0.000 description 2
- 238000005516 engineering process Methods 0.000 description 2
- 238000001914 filtration Methods 0.000 description 2
- 238000003306 harvesting Methods 0.000 description 2
- 230000036541 health Effects 0.000 description 2
- 230000004048 modification Effects 0.000 description 2
- 238000012986 modification Methods 0.000 description 2
- 230000006855 networking Effects 0.000 description 2
- 239000005416 organic matter Substances 0.000 description 2
- 239000002245 particle Substances 0.000 description 2
- 239000011574 phosphorus Substances 0.000 description 2
- 229910052698 phosphorus Inorganic materials 0.000 description 2
- 230000005855 radiation Effects 0.000 description 2
- 230000004043 responsiveness Effects 0.000 description 2
- 239000000523 sample Substances 0.000 description 2
- 239000007787 solid Substances 0.000 description 2
- 239000008107 starch Substances 0.000 description 2
- 235000019698 starch Nutrition 0.000 description 2
- 235000000346 sugar Nutrition 0.000 description 2
- 238000003786 synthesis reaction Methods 0.000 description 2
- 210000003813 thumb Anatomy 0.000 description 2
- 238000012876 topography Methods 0.000 description 2
- 238000011144 upstream manufacturing Methods 0.000 description 2
- 230000000007 visual effect Effects 0.000 description 2
- ZOXJGFHDIHLPTG-UHFFFAOYSA-N Boron Chemical compound [B] ZOXJGFHDIHLPTG-UHFFFAOYSA-N 0.000 description 1
- OYPRJOBELJOOCE-UHFFFAOYSA-N Calcium Chemical compound [Ca] OYPRJOBELJOOCE-UHFFFAOYSA-N 0.000 description 1
- 101000822695 Clostridium perfringens (strain 13 / Type A) Small, acid-soluble spore protein C1 Proteins 0.000 description 1
- 101000655262 Clostridium perfringens (strain 13 / Type A) Small, acid-soluble spore protein C2 Proteins 0.000 description 1
- RYGMFSIKBFXOCR-UHFFFAOYSA-N Copper Chemical compound [Cu] RYGMFSIKBFXOCR-UHFFFAOYSA-N 0.000 description 1
- FYYHWMGAXLPEAU-UHFFFAOYSA-N Magnesium Chemical compound [Mg] FYYHWMGAXLPEAU-UHFFFAOYSA-N 0.000 description 1
- ZOKXTWBITQBERF-UHFFFAOYSA-N Molybdenum Chemical compound [Mo] ZOKXTWBITQBERF-UHFFFAOYSA-N 0.000 description 1
- 229910019142 PO4 Inorganic materials 0.000 description 1
- 101000655256 Paraclostridium bifermentans Small, acid-soluble spore protein alpha Proteins 0.000 description 1
- 101000655264 Paraclostridium bifermentans Small, acid-soluble spore protein beta Proteins 0.000 description 1
- NINIDFKCEFEMDL-UHFFFAOYSA-N Sulfur Chemical compound [S] NINIDFKCEFEMDL-UHFFFAOYSA-N 0.000 description 1
- 239000005864 Sulphur Substances 0.000 description 1
- HCHKCACWOHOZIP-UHFFFAOYSA-N Zinc Chemical compound [Zn] HCHKCACWOHOZIP-UHFFFAOYSA-N 0.000 description 1
- 238000004458 analytical method Methods 0.000 description 1
- 238000003491 array Methods 0.000 description 1
- 230000005540 biological transmission Effects 0.000 description 1
- 229910052796 boron Inorganic materials 0.000 description 1
- 239000011575 calcium Substances 0.000 description 1
- 229910052791 calcium Inorganic materials 0.000 description 1
- 238000004364 calculation method Methods 0.000 description 1
- 230000010267 cellular communication Effects 0.000 description 1
- 238000007621 cluster analysis Methods 0.000 description 1
- 238000005056 compaction Methods 0.000 description 1
- 229910052802 copper Inorganic materials 0.000 description 1
- 239000010949 copper Substances 0.000 description 1
- 244000038559 crop plants Species 0.000 description 1
- 238000013075 data extraction Methods 0.000 description 1
- 238000013501 data transformation Methods 0.000 description 1
- 230000002950 deficient Effects 0.000 description 1
- 230000001419 dependent effect Effects 0.000 description 1
- 230000006866 deterioration Effects 0.000 description 1
- 230000009977 dual effect Effects 0.000 description 1
- 238000003708 edge detection Methods 0.000 description 1
- 230000007613 environmental effect Effects 0.000 description 1
- 239000000835 fiber Substances 0.000 description 1
- 230000002068 genetic effect Effects 0.000 description 1
- 229910052742 iron Inorganic materials 0.000 description 1
- 229930013686 lignan Natural products 0.000 description 1
- 150000005692 lignans Chemical class 0.000 description 1
- 235000009408 lignans Nutrition 0.000 description 1
- 238000012417 linear regression Methods 0.000 description 1
- 238000007477 logistic regression Methods 0.000 description 1
- 239000011777 magnesium Substances 0.000 description 1
- 229910052749 magnesium Inorganic materials 0.000 description 1
- WPBNNNQJVZRUHP-UHFFFAOYSA-L manganese(2+);methyl n-[[2-(methoxycarbonylcarbamothioylamino)phenyl]carbamothioyl]carbamate;n-[2-(sulfidocarbothioylamino)ethyl]carbamodithioate Chemical compound [Mn+2].[S-]C(=S)NCCNC([S-])=S.COC(=O)NC(=S)NC1=CC=CC=C1NC(=S)NC(=O)OC WPBNNNQJVZRUHP-UHFFFAOYSA-L 0.000 description 1
- 230000005055 memory storage Effects 0.000 description 1
- 239000011785 micronutrient Substances 0.000 description 1
- 235000013369 micronutrients Nutrition 0.000 description 1
- 229910052750 molybdenum Inorganic materials 0.000 description 1
- 239000011733 molybdenum Substances 0.000 description 1
- 238000010606 normalization Methods 0.000 description 1
- 235000021048 nutrient requirements Nutrition 0.000 description 1
- 239000003415 peat Substances 0.000 description 1
- 230000008447 perception Effects 0.000 description 1
- NBIIXXVUZAFLBC-UHFFFAOYSA-K phosphate Chemical compound [O-]P([O-])([O-])=O NBIIXXVUZAFLBC-UHFFFAOYSA-K 0.000 description 1
- 239000010452 phosphate Substances 0.000 description 1
- 239000010908 plant waste Substances 0.000 description 1
- 239000011148 porous material Substances 0.000 description 1
- 230000001737 promoting effect Effects 0.000 description 1
- 235000018102 proteins Nutrition 0.000 description 1
- 108090000623 proteins and genes Proteins 0.000 description 1
- 102000004169 proteins and genes Human genes 0.000 description 1
- 238000007637 random forest analysis Methods 0.000 description 1
- 230000000306 recurrent effect Effects 0.000 description 1
- 230000002787 reinforcement Effects 0.000 description 1
- 150000003839 salts Chemical class 0.000 description 1
- 239000004576 sand Substances 0.000 description 1
- 239000004016 soil organic matter Substances 0.000 description 1
- 238000005527 soil sampling Methods 0.000 description 1
- 239000000126 substance Substances 0.000 description 1
- 238000012706 support-vector machine Methods 0.000 description 1
- 238000012360 testing method Methods 0.000 description 1
- 239000013598 vector Substances 0.000 description 1
- 230000009105 vegetative growth Effects 0.000 description 1
- 239000011701 zinc Substances 0.000 description 1
- 229910052725 zinc Inorganic materials 0.000 description 1
Images


Classifications
-
- A—HUMAN NECESSITIES
- A01—AGRICULTURE; FORESTRY; ANIMAL HUSBANDRY; HUNTING; TRAPPING; FISHING
- A01C—PLANTING; SOWING; FERTILISING
- A01C21/00—Methods of fertilising, sowing or planting
- A01C21/005—Following a specific plan, e.g. pattern
-
- A—HUMAN NECESSITIES
- A01—AGRICULTURE; FORESTRY; ANIMAL HUSBANDRY; HUNTING; TRAPPING; FISHING
- A01C—PLANTING; SOWING; FERTILISING
- A01C21/00—Methods of fertilising, sowing or planting
- A01C21/007—Determining fertilization requirements
-
- A—HUMAN NECESSITIES
- A01—AGRICULTURE; FORESTRY; ANIMAL HUSBANDRY; HUNTING; TRAPPING; FISHING
- A01M—CATCHING, TRAPPING OR SCARING OF ANIMALS; APPARATUS FOR THE DESTRUCTION OF NOXIOUS ANIMALS OR NOXIOUS PLANTS
- A01M7/00—Special adaptations or arrangements of liquid-spraying apparatus for purposes covered by this subclass
- A01M7/0089—Regulating or controlling systems
-
- A—HUMAN NECESSITIES
- A01—AGRICULTURE; FORESTRY; ANIMAL HUSBANDRY; HUNTING; TRAPPING; FISHING
- A01C—PLANTING; SOWING; FERTILISING
- A01C7/00—Sowing
- A01C7/06—Seeders combined with fertilising apparatus
Definitions
- the present description relates to agriculture. More specifically, the present description relates to agricultural machines and operations which deliver material to a worksite.
- Some agricultural machines apply material, such as fluid or solid material, to a field.
- some machines such as sprayers or dry spreaders, can deliver fluid or solid material, such as fertilizer, herbicide, pesticide, as well as variety of other materials to a field.
- Some machines such as agricultural planting machines, can deliver material such as seeds, as well as other material, such as liquid or solid material, for instance, fertilizer.
- An information map is obtained by an agricultural system.
- the information map maps values of a characteristic at different geographic locations in a worksite.
- An in-situ sensor detects nutrient values as a mobile material application machine operates at the worksite.
- a predictive map generator generates a predictive map that maps predictive nutrient values at different geographic locations in the worksite based on a relationship between values of the characteristic in the information map and nutrient values detected by the in-situ sensor.
- the predictive map can be output and used in automated machine control.
- Example 1 is an agricultural material application system comprising:
- Example 2 is the agricultural material application system of any or all previous claims, wherein the predictive map generator configures the functional predictive nutrient map for consumption by a control system that generates control signals to control a controllable subsystem of the mobile material application machine based on the functional predictive nutrient map.
- Example 3 is the agricultural material application system any or all previous claims, wherein the in-situ sensor detects, in detecting the value of the nutrient, a value of a soil nutrient.
- Example 4 is the agricultural material application system any or all previous claims, wherein the in-situ sensor detects, in detecting the value of the nutrient, a value of a plant nutrient.
- Example 5 is the agricultural material application system any or all previous claims, wherein the information map is one of:
- Example 6 is the agricultural material application system any or all previous claims, wherein the information map comprises two or more information maps, each of the two or more information maps mapping values of a respective characteristic to the different geographic locations in the field,
- Example 7 is the agricultural material application system any or all previous claims and further comprising: a control system that generates a control signal to control a controllable subsystem of the material application machine based on the functional predictive nutrient map.
- Example 8 is the agricultural material application system any or all previous claims, wherein the controllable subsystem comprises a material application actuator and wherein the control signal controls the material application actuator to increase an amount of material applied by the material application machine based on the functional predictive nutrient map.
- Example 9 is the agricultural material application system any or all previous claims, wherein the controllable subsystem comprises a material application actuator and wherein the control signal controls the material application actuator to decrease an amount of material applied by the material application machine based on the functional predictive nutrient map.
- Example 10 is the agricultural material application system any or all previous claims, wherein the controllable subsystem comprises a material application actuator and wherein the control signal controls the material application actuator to activate or deactivate a component of the material application machine based on the functional predictive nutrient map.
- Example 11 is a computer implemented method comprising:
- Example 12 is the computer implemented method any or all previous claims and further comprising: configuring the functional predictive nutrient map for a control system that generates control signals to control a controllable subsystem on a mobile machine based on the functional predictive nutrient map.
- Example 13 is the computer implemented method any or all previous claims and further comprising: controlling a controllable subsystem of a mobile machine based on the functional predictive nutrient map.
- Example 14 is the computer implemented method any or all previous claims, wherein controlling the controllable subsystem comprises controlling a material application actuator to adjust a flow rate of material based on the functional predictive nutrient map.
- Example 15 is the computer implemented method any or all previous claims, wherein controlling the controllable subsystem comprises subsystem comprises controlling a material application actuator to adjust an amount of material applied to the field based on the functional predictive nutrient map.
- Example 16 is a mobile agricultural material application machine, comprising:
- Example 17 is the mobile agricultural material application machine any or all previous claims and further comprising: a control system that generates a control signal based on the functional predictive nutrient map.
- Example 18 is the mobile agricultural machine any or all previous claims, wherein the control system generates the control signal to control an actuator that is controllably actuatable to adjust a rate at which material is applied to the field.
- Example 19 is the mobile agricultural machine any or all previous claims, wherein the control system generates the control signal to control an interface mechanism to generate an indication indicative of the functional predictive nutrient map.
- Example 20 is the mobile agricultural machine any or all previous claims, wherein the control system generates the control signal to control a controllable subsystem of the mobile agricultural material application machine.
- the present description relates to using in-situ data taken concurrently with an operation, such as an agricultural material application operation, in combination with prior or predicted data, such as prior or predicted data represented in a map, to generate a predictive model and a predictive map.
- the predictive map can be used to control a mobile machine, such as a mobile agricultural material application machine or a material delivery machine, or both.
- an agricultural material application operation material, such as seed, fertilizer, herbicide, pesticide, etc.
- the application of material can be controlled, such as by an operator or user, or by an automated control system, or both. It may be desirable to controllably (e.g., variably) apply material, based on the characteristics of the field. For example, it may be desirable to vary the amount of material applied at a given locations, based on the nutrient levels at those locations. For instance, some locations of the field may have adequate or near adequate nutrient levels, such that no fertilizer or relatively less fertilizer need be applied. In other examples, some locations of the field may have nutrient levels that require the application of more material than expected.
- Applying material as needed based on the field conditions at the time of the operation, as opposed to a blanket application or a prescribed application determined ahead of the operation in the field, may save cost, may reduce environmental impact, as well as result in more effective material use, which may result in higher yields.
- Some current systems may include sensors that detect characteristics indicative of nutrient levels of the field which can be used in the control of material application.
- sensors that detect characteristics indicative of nutrient levels of the field which can be used in the control of material application.
- latency such as due to the sensor feedback delay or due to the machine control delay, which may result in suboptimal material application.
- the present description thus relates to a system that can predict characteristic values, such as nutrient values or weed values, or both, at different locations across the worksite, such that a mobile agricultural material application machine can be proactively controlled.
- Knowing when and where the machine will run out of material can be useful in planning logistics of the material application operation, such as scheduling or meeting a material delivery vehicle. Efficient scheduling can reduce downtime, as well as provide various other benefits.
- the present description thus relates to a system that can predict material consumption values at different locations across the worksite, such that the material application operation can be proactively controlled.
- the present description relates to obtaining an information map, such as a soil property map.
- a soil property map illustratively maps soil property values (which may be indicative of soil type, soil moisture, soil structure, soil salinity, soil pH, soil organic matter, soil contaminant concentration, soil nutrient levels, as well as various other soil properties) across different geographic locations in a field of interest.
- the soil property maps thus provide geo-referenced soil properties across a field of interest.
- Soil type can refer to taxonomic units in soil science, wherein each soil type includes defined sets of shared properties. Soil types can include, for example, sandy soil, clay soil, silt soil, peat soil, chalk soil, loam soil, and various other soil types.
- Soil moisture can refer to the amount of water that is held or otherwise contained in the soil. Soil moisture can also be referred to as soil wetness.
- Soil structure can refer to the arrangement of solid parts of the soil and the pore space located between the solid parts of the soil. Soil structure can include the way in which individual particles, such as individual particles of sand, silt, and clay, are assembled. Soil structure can be described in terms of grade (degree of aggregation), class (average size of aggregates), and form (types of aggregates), as well as a variety of other descriptions. Soil salinity refers to the amount (e.g., concentration) of salt in the soil.
- Soil nutrient levels refers to the amounts (e.g., concentrations) of various nutrients of the soil, such as nitrogen. These are merely examples.
- Various other characteristics and properties of the soil can be mapped as soil property values on a soil property map.
- the soil property map can be derived in a variety of ways, such as from sensor readings during previous operations at the field of interest, from surveys of the field, such as soil sampling surveys, as well as surveys by aerial machines (e.g., satellites, drones, etc.) that includes sensors that capture sensor information of the field.
- the soil property map can be generated based on data from remote sources, such as third-party service providers or government agencies, for instance, the USDA Natural Resources Conservation Service (NRCS), the United States Geological Survey (USGS), as well as from various other remote sources. These are merely some examples.
- the soil property map can be generated in a variety of other ways.
- the present description relates to obtaining an information map, such as a yield map.
- a yield map illustratively maps yield values across different geographic locations in a field of interest.
- the yield map may be based on sensor readings taken during an aerial survey of the field of interest or during a previous operation on the field of interest, or derived from other values, such as vegetative index values.
- the yield map may be a historical yield map that includes historical yield values from a previous harvesting operation, such as the harvesting operation from a prior year or a prior season. These are merely some examples.
- the yield map can be generated in a variety of other ways.
- a residue map illustratively maps residue values (which may be indicative of residue amount and residue distribution) across different geographic locations in a field of interest.
- Residue illustratively refers to vegetation residue, such as remaining vegetation material at the field of interest, such as remaining crop material, as well as material of other plants, such as weeds.
- the residue map may be derived from sensor readings during a previous operation at the field. For example, the machine performing the previous operation may be outfitted with sensors that detect residue values at different geographic locations in the field.
- the residue map may be derived from sensor readings from sensors on aerial machine (e.g., satellites, drones, etc.) that survey the field of interest. The sensors may read one or more bands of electromagnetic radiation reflected from the residue material at the field. These are merely some examples.
- the residue map can be generated in a variety of other ways.
- the present description relates to obtaining an information map, such as a constituents map.
- a constituents map illustratively maps constituent values (which may be indicative of constituent levels (e.g., concentrations) of constituents, such as, sugar, starch, fiber, water/moisture, etc., of crop plants) across different geographic locations in a field of interest.
- the constituent map may be derived from sensor readings during a previous operation at the field.
- the constituent map may be derived from sensor readings from sensors on aerial machine (e.g., satellites, drones, etc.) that survey the field of interest.
- the sensors may read one or more bands of electromagnetic radiation reflected from the residue material at the field. These are merely some examples.
- the constituent map can be generated in a variety of other ways.
- the present description relates to obtaining an information map, such as a topographic map.
- a topographic map illustratively maps topographic characteristic values across different geographic locations in a field of interest, such as elevations of the ground across different geographic locations in a field of interest. Since ground slope is indicative of a change in elevation, having two or more elevation values allows for calculation of slope across the areas having known elevation values. Greater granularity of slope can be accomplished by having more areas with known elevation values. As an agricultural machine travels across the terrain in known directions, the pitch and roll of the agricultural machine can be determined based on the slope of the ground (i.e., areas of changing elevation).
- Topographic characteristics when referred to below, can include, but are not limited to, the elevation, slope (e.g., including the machine orientation relative to the slope), and ground profile (e.g., roughness).
- the topographic map can be derived from sensor readings taken during a previous operation on the field of interest or from an aerial survey of the field (such as a plane, drone, or satellite equipped with lidar or other distance measuring devices). In some examples, the topographic map can be obtained from third parties. These are merely some examples.
- the topographic map can be generated in a variety of other ways.
- the present description relates to obtaining an information map, such as a seeding map.
- a seeding map illustratively maps values of seeding characteristics (e.g., seed location, seed spacing, seed population, seed genotype, etc.) across different geographic locations in a field of interest.
- the seeding map may be derived from control signals used by a planting machine when planting seeds or from sensors on the planting machine that confirm that a seed was metered or planted.
- the seeding map can be generated based on a prescriptive seeding map that was used in the control of a planting operation. These are merely some examples.
- the seeding map can be generated in a variety of other ways.
- the present description relates to obtaining an information map such as a vegetative index map.
- a vegetative index map illustratively maps georeferenced vegetative index values (which may be indicative of vegetative growth or plant health) across different geographic locations in a field of interest.
- a vegetive index includes a normalized difference vegetation index (NDVI).
- NDVI normalized difference vegetation index
- a vegetive index map be derived from sensor readings of one or more bands of electromagnetic radiation reflected by the plants. Without limitations, these bands may be in the microwave, infrared, visible or ultraviolet portions of the electromagnetic spectrum.
- a vegetative index map can be used to identify the presence and location of vegetation.
- these maps enable vegetation to be identified and georeferenced in the presence of bare soil, crop residue, or other plants, including crop or other weeds.
- the sensor readings can be taken at various times, such as during satellite observation of the field of interest, a fly over operation (e.g., manned or unmanned aerial vehicles), sensor readings during a prior operation) at the field of interest, as well as during a human scouting operation. These are merely some examples.
- the vegetative index map can be generated in a variety of other ways.
- an optical map illustratively maps electromagnetic radiation values (or optical characteristic values) across different geographic locations in a field of interest.
- Electromagnetic radiation values can be from across the electromagnetic spectrum. This disclosure uses electromagnetic radiation values from infrared, visible light and ultraviolet portions of the electromagnetic spectrum as examples only and other portions of the spectrum are also envisioned.
- An optical map may map datapoints by wavelength (e.g., a vegetative index).
- an optical map identifies textures, patterns, color, shape, or other relations of data points. Textures, patterns, or other relations of data points can be indicative of presence or identification of vegetation on the field (e.g., crops, weeds, plant matter, such as residue, etc.).
- an optical map may identify the presence of standing water or wet spots on the field.
- the optical map can be derived using satellite images, optical sensors on flying vehicles such as UAVS, or optical sensors on a ground-based system, such as another machine operating in the field prior to the current operation.
- optical maps may map three-dimensional values as well such as vegetation height when a stereo camera or lidar system is used to generate the map. These are merely some examples.
- the optical map can be generated in a variety of other ways.
- the present description relates to obtaining an information map, such as a weed map.
- a weed map illustratively maps weed values (which may be indicative of weed location, weed presence, weed type, and weed intensity (e.g., density)) across different geographic locations in a field of interest.
- the weed map may be derived from sensor readings during a previous operation at the field.
- the weed map may be derived from sensor readings from sensors on aerial machine (e.g., satellites, drones, etc.) that survey the field of interest.
- the sensors may read one or more bands of electromagnetic radiation reflected from the weed material at the field.
- the weed map may be derived from various other data, such as optical characteristic data or vegetative index data of the field of interest. These are merely some examples.
- the weed map can be generated in a variety of other ways.
- the present description relates to obtaining an information map, such as a contamination map.
- a contamination map illustratively maps contamination values (which may be indicative of pest presence, pest type, pest intensity (e.g., population), disease presence, disease type, and disease intensity (e.g., prevalence)) across different geographic locations in a field of interest.
- the contamination map may be derived from sensor readings during a previous operation at the field.
- the contamination map may be derived from sensor readings from sensors on aerial machine (e.g., satellites, drones, etc.) that survey the field of interest.
- the sensors may read one or more bands of electromagnetic radiation reflected from the vegetation material (or from the contaminants) at the field.
- the contamination map may be derived from various other data, such as optical characteristic data or vegetative index data of the field of interest. These are merely some examples.
- the contamination map can be generated in a variety of other ways.
- one or more other types of information maps can be obtained.
- the various other types of information maps illustratively map values of various other characteristics across different geographic locations in a field of interest.
- the present discussion proceeds, in some examples, with respect to systems that obtain one or more information maps of a worksite (e.g., field) and also use an in-situ sensor to detect a characteristic.
- the systems generate a model that models a relationship between the values on the one or more obtained maps and the output values from the in-situ sensor.
- the model is used to generate a predictive map that predicts, for example, values of the characteristic detected by the in-situ sensor to different geographic locations in the worksite.
- the predictive map, generated during an operation can be presented to an operator or other user or can be used in automatically controlling a mobile machine, such as a mobile agricultural material application machine or a material delivery machine, or both, during a material application operation.
- FIG. 1 shows one example of a mobile agricultural material application machine 100 as a mobile agricultural planting machine 100-1 that includes a towing vehicle 10 and a planting implement 101.
- FIG. 1 also illustrates that mobile agricultural planting machine 100-1 can include one or more in-situ sensors 308, some of which are shown in FIG. 1 as well as below.
- planting machine 100-1 can include one or more fill level sensors 107 that detect a fill level of material in tanks 107.
- Fill level sensors can include float gauges, weight sensors that detect a weight of material in tanks 107, emitter sensors that detect a level to which the material is filled, as well as various other types of sensors.
- FIG. 1 also illustrates that towing vehicle can include, among other things, operator interface mechanisms 318 which can be used by an operator to manipulate and control agricultural planting machine 100-1.
- planting implement 101 is a row crop planter. In other examples, other types of planting machines can be used, such as air seeders.
- Planting implement 101 illustratively includes a toolbar 102 that is part of a frame 104.
- FIG. 1 also shows that a plurality of planting row units 106 are mounted to the toolbar 102.
- Planting implement 101 can be towed behind towing vehicle 10, such as a tractor.
- FIG. 1 shows that material, such as seed, fertilizer, etc. can be stored in a tank 107 and pumped, using one or more pumps 115, through supply lines to the row units 106.
- the seed, fertilizer, etc. can also be stored on the row units 106 themselves.
- each row unit can include a respective controller(s) 135 which can be used to control operating parameters of each row unit 106.
- centralized controllers can control the row units 106.
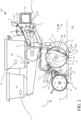
- FIG. 2 is a side view showing one example of a row unit 106.
- row unit 106 illustratively includes a chemical tank 110 and a seed storage tank 112. It also illustratively includes a furrow opener 114 (e.g., opening disks) that opens a furrow in field 107, a set of gauge wheels 116, and a furrow closer 118 (e.g., closing wheels) that close furrow 162.
- Seeds from tank 112 are fed by gravity into a seed meter 124.
- the seed meter 124 controls the rate which seeds are dropped into a seed tube 120 or other seed delivery system, such as a brush belt or flighted brush belt (both shown below) from seed storage tank 112.
- the seeds can be sensed by a seed sensor 122.
- An actuator such as motor, can be used to control the speed of seed meter 124 to control the rate at which seeds are delivered to the furrow 162.
- each row unit 106 need not have its own seed meter. Instead, metering or other singulation or seed dividing techniques can be performed at a central location, for groups of row units 106.
- the metering systems can include rotatable disks, rotatable concave or bowl-shaped devices, among others.
- the seed delivery system can be a gravity drop system (such as seed tube 120 shown in FIG.
- FIG. 2 also shows an actuator 109 in a plurality of possible locations (109A, 109B, 109C, 109D, and 109E).
- Actuator 109 e.g., pump
- material such as fertilizer
- a controller can generate a control signal to control the actuation of pump 109.
- actuators 109 are controllable valves and one or more pumps 115 pump the material from tank(s) 107 to actuators 109 through supply line 111.
- actuators control the delivery of material from other tanks, such as tank 110.
- a controller controls the actuator by generating valve or actuator control signals.
- the control signal for each valve or actuator 109 can, in one example, be a pulse width modulated control signal.
- the flow rate through the corresponding actuator 109 can be based on the duty cycle of the control signal (which controls the amount of time the valve is open and closed). It can be based on multiple duty cycles of multiple valves or based on other criteria.
- the material can be applied in varying rates on a per-seed or per-plant basis. For example, material may be applied at one rate when it is being applied at a location spaced from a seed location and at a second, higher, rate when it is being applied closer to the seed location. In other examples, the material may be applied based on various characteristics of the field, such as the nutrient levels, weed characteristics, as well as various other characteristics. These are examples only.
- FIG. 2 shows a flow rate sensor 199 in a plurality of possible locations (199A, 199B, 199C, 199D, and 199E).
- Flow rate sensor 199 can detect a volumetric flow rate of material flowing through supply line 111.
- FIG. 2 shows that row unit 106 can include one or more fill level sensors, such as a fill level sensor 177 and a fill level sensor 178.
- Fill level sensor 177 illustratively detects a fill level of tank 110.
- Fill level sensor 178 illustratively detects a fill level of tank 112.
- Fill level sensors 177 and 178 can include float gauges, weight sensors that detect a weight of material in tanks 110 and 112, emitter sensors that detect a level to which the material is filled, as well as various other types of sensors.
- material is passed, e.g., pumped or otherwise forced, through supply line 111 to an inlet end of actuator 109.
- Actuator 109 is controlled by a controller (e.g., 135) to allow the liquid to pass from the inlet end of actuator 109 to an outlet end.
- actuator 109 As material passes through actuator 109, it travels through an application assembly 169 from a proximal end (which is attached to an outlet end of actuator 109) to a distal tip (or application tip) 119, where the liquid is discharged into a trench, or proximate a trench or furrow 162 (e.g., on the surface of field 107 next to trench or furrow 162 but not in trench or furrow 162), opened by disc opener 114.
- a downforce generator or actuator 126 is mounted on a coupling assembly 128 that couples row unit 106 to toolbar 102.
- Downforce actuator 126 can be a hydraulic actuator, a pneumatic actuator, a spring-based mechanical actuator or a wide variety of other actuators.
- a rod 130 is coupled to a parallel linkage 132 and is used to exert an additional downforce (in the direction indicated by arrow 134) on row unit 106.
- the total downforce (which includes the force indicated by arrow 134 exerted by actuator 126, plus the force due to gravity acting on the row unit 106, and indicated by arrow 136) is offset by upwardly directed forces acting on closing wheels 118 (from ground 138 and indicated by arrow 140) and double disk opener 114 (again from ground 138 and indicated by arrow 142).
- the remaining force (the sum of the force vectors indicated by arrows 134 and 136, minus the force indicated by arrows 140 and 142) and the force on any other ground engaging component on the row unit (not shown), is the differential force indicated by arrow 146.
- the differential force may also be referred to herein as downforce margin.
- the force indicated by arrow 146 acts on the gauge wheels 116.
- This load can be sensed by a gauge wheel load sensor 159 which may located anywhere on row unit 106 where it can sense that load. It can also be placed where may not sense the load directly, but a characteristic indicative of that load. For example, it can be disposed near a set of gauge wheel control arms (or gauge wheel arm) 148 that movably mount gauge wheels to shank 152 and control an offset between gauge wheels 116 and the disks in double disk opener 114 to control planting depth.
- Percent ground contact is a measure of a percentage of time that the load (downforce margin) on the gauge wheels 116 is zero (indicating that the gauge wheels are out of contact with the ground). The percent ground contact is calculated on the basis of sensor data provided by the gauge wheel load sensor 159.
- closing wheel downforce actuator 153 there may be other separate and controllable downforce actuators, such as one or more of a closing wheel downforce actuator 153 that controls the downforce exerted on closing wheels 118.
- Closing wheel downforce actuator 153 can be a hydraulic actuator, a pneumatic actuator, a spring-based mechanical actuator or a wide variety of other actuators.
- the downforce exerted by closing wheel downforce actuator 153 is represented by arrow 137. It will be understood that each row unit 106 can include the various components described with reference to FIGS. 2-6 .
- arms (or gauge wheel arms) 148 illustratively abut a mechanical stop (or arm contact member or wedge) 150.
- the position of mechanical stop 150 relative to shank 152 can be set by a planting depth actuator assembly 154.
- Control arms 148 illustratively pivot around pivot point 156 so that, as planting depth actuator assembly 154 actuates to change the position of mechanical stop 150, the relative position of gauge wheels 116, relative to the double disk opener 114, changes, to change the depth at which seeds are planted.
- row unit 106 travels generally in the direction indicated by arrow 160.
- the double disk opener 114 opens the furrow 162 in the soil 138, and the depth of the furrow 162 is set by planting depth actuator assembly 154, which, itself, controls the offset between the lowest parts of gauge wheels 116 and disk opener 114. Seeds are dropped through seed tube 120 into the furrow 162 and closing wheels 118 close the soil.
- seed sensor 122 As the seeds are dropped through seed tube 120, they can be sensed by seed sensor 122.
- seed sensor 122 Some examples of seed sensor 122 are an optical sensor or a reflective sensor, and can include a radiation transmitter and a receiver. The transmitter emits electromagnetic radiation and the receiver the detects the radiation and generates a signal indicative of the presences or absences of a seed adjacent to the sensor. These are just some examples of seed sensors.
- Row unit controller 335 may control the actuators 109 and/or pumps 115 based on the seed sensor signal to controllably apply material relative to the seed locations in the furrow 162.
- row unit 106 can include, as in-situ sensors 308, one or more observation sensor systems 151.
- Observation sensor systems 151 may include one or more sensors that detect one or more characteristics such as soil nutrient levels, weed characteristics, as well as various other characteristics.
- an observation sensor system 151 such as the observation sensor system 151 disposed between opener 114 and closer 118 can detect characteristic of the furrow as well as of the field proximate the furrow.
- Observation sensor systems 151 may include one or more of an imaging system (e.g., stereo or mono camera), optical sensors, radar, lidar, ultrasonic sensors, infrared or thermal sensors, as well as a variety of other sensors.
- an imaging system e.g., stereo or mono camera
- optical sensors e.g., radar, lidar, ultrasonic sensors, infrared or thermal sensors, as well as a variety of other sensors.
- an observation sensor system 151 may detects seeds in furrow 162.
- Planting implement 101 can also include an observation sensor system 151 disposed to observe in front of opener 114, such as the observation sensor system 151 shown mounted to toolbar 102.
- observation sensor systems 151 can be mounted to various other locations of agricultural planting machine 100-1, such as various other locations on planting implement 101 or towing vehicle 10, or both.
- FIG. 3 is similar to FIG. 2 , and similar items are similarly numbered.
- the seed delivery system shown in FIG. 4 is an assistive seed delivery system 166.
- Assistive seed delivery system 166 also illustratively has a seed sensor 122 disposed therein. Assistive seed delivery system 166 captures the seeds as they leave seed meter 124 and moves them in a direction indicated by arrow 168 toward furrow 162. System 166 has an outlet end 170 where the seeds exit system 166 into furrow 162 where they again reach their final seed position.
- System 166 may driven at variable speeds by an actuator, such as a variable motor, which can be controlled by a controller (e.g., 135).
- the controller may control the speed of system 166 based on various characteristics, such as nutrient levels, weed characteristics, etc.
- the controller may control the actuator 109 to dispense material based on the seed sensor signal from seed sensor 122 as well as the speed at which system 166 is driven.
- the controller may control the actuator 109 based on various other characteristics, such as nutrient levels, weed characteristics, etc.
- FIG. 3 also shows that row unit 106 can include a sensor 170that interacts with the soil to detect various characteristics, such as nutrient levels of the soil.
- sensor 172 can be in the form of a probe that detects nutrient levels of the soil (such as the amount, or concentration, of various nutrients such as nitrogen, phosphorus, potassium, organic matter, etc.).
- sensor 172 can be in the form of a electromagnetic sensor that detects the capability of the soil to conduct or accumulate electrical charge, such as a capacitive sensor.
- FIG. 4 shows one example of a rotatable mechanism that can be used as part of the seed metering system (or seed meter) 124.
- the rotatable mechanism includes a rotatable disc, or concave element, 179.
- Concave element 179 has a cover (not shown) and is rotatably mounted relative to the frame of row unit 106.
- Rotatable concave element 179 is driven by an actuator, such as a motor (not shown in FIG. 4 ), and has a plurality of projections or tabs 182 that are closely proximate corresponding apertures 184.
- a seed pool 186 is disposed generally in a lower portions of an enclosure formed by rotating concave element 179 and its corresponding cover.
- Rotatable concave element 179 is rotatably driven by its motor (such as an electric motor, a pneumatic motor, a hydraulic motor, etc.) for rotation generally in the direction indicated by arrow 188, about a hub.
- a pressure differential is introduced into the interior of the metering mechanism so that the pressure differential influences seeds from seed pool 186 to be drawn to apertures 184.
- a vacuum can be applied to draw the seeds from seed pool 186 so that they come to rest in apertures 184, where the vacuum holds them in place.
- a positive pressure can be introduced into the interior of the metering mechanism to create a pressure differential across apertures 184 to perform the same function.
- the vacuum or positive pressure differential acts to hold the seed within the aperture 184 such that the seed is carried upwardly generally in the direction indicated by arrow 188, from seed pool 186, to a seed discharge area 190. It may happen that multiple seeds are residing in an individual seed cell. In that case, a set of brushes or other members 194 that are located closely adjacent the rotating seed cells tend to remove the multiple seeds so that only a single seed is carried by each individual cell. Additionally, a seed sensor 193 can also illustratively be mounted adjacent to rotating element 181. Seed sensor 193 detects and generates a signal indicative of seed presence.
- a positive seed removal wheel or knock-out wheel 191 can act to remove the seed from the seed cell.
- Wheel 191 illustratively has a set of projections 195 that protrude at least partially into apertures 184 to actively dislodge the seed from those apertures.
- seed delivery system 166 (some examples of which are shown above and below) to the furrow 162 in the ground.
- FIG. 5 shows an example where the rotating element 181 is positioned so that its seed discharge area 190 is above, and closely proximate, assistive seed delivery system 166.
- assistive seed delivery system 166 includes a transport mechanism such as a belt 200 with a brush that is formed of distally extending bristles 202 attached to belt 200 that act as a receiver for the seeds.
- Belt 200 is mounted about pulleys 204 and 206.
- One of pulleys 204 and 206 is illustratively a drive pulley while the other is illustratively an idler pulley.
- the drive pulley is illustratively rotatably driven by an actuator, such a conveyance motor (not shown in FIG. 5 ), which can be an electric motor, a pneumatic motor, a hydraulic motor, etc.
- Belt 200 is driven generally in the direction indicated by arrow 208
- Assistive seed delivery system 166 illustratively includes walls that form an enclosure around the bristles, so that, as the bristles move in the direction indicated by arrow 208, the seeds are carried along with them from the seed discharge area 190 of the metering mechanism, to a discharge area 210 either at ground level, or below ground level within a trench or furrow 162 that is generated by the furrow opener 114 on the row unit 106.
- a seed sensor 203 is also illustratively coupled to assistive seed delivery system 166. As the seeds are moved in bristles 202 past sensor 203, sensor 203 can detect the presence or absence of a seed. Some examples of seed sensor 203 includes an optical sensor or reflective sensor.
- FIG. 6 is similar to FIG. 5 , except that seed delivery system 166 is not formed by a belt with distally extending bristles. Instead, it is formed by a flighted belt (transport mechanism) in which a set of paddles 214 form individual chambers (or receivers), into which the seeds are dropped, from the seed discharge area 190 of the metering mechanism. The flighted belt moves the seeds from the seed discharge area 190 to the exit end 210 of the flighted belt, within the trench or furrow 162.
- a flighted belt transport mechanism in which a set of paddles 214 form individual chambers (or receivers), into which the seeds are dropped, from the seed discharge area 190 of the metering mechanism.
- the flighted belt moves the seeds from the seed discharge area 190 to the exit end 210 of the flighted belt, within the trench or furrow 162.
- seed delivery systems include a transport mechanism and a receiver that receives a seed.
- they include dual belt delivery systems in which opposing belts receive, hold and move seeds to the furrow, a rotatable wheel that has sprockets which catch seeds from the metering system and move them to the furrow, multiple transport wheels that operate to transport the seed to the furrow, an auger, among others.
- FIG. 7 shows one example of a mobile agricultural material application machine 100 as a mobile agricultural sprayer 100-2 that includes a towing vehicle 240 and a towed spraying implement 224.
- sprayer 100-2 can be self-propelled. Additionally, other types of material application machines are contemplated, such as dry material spreaders.
- FIG. 7 also shows that mobile agricultural sprayer 100-2 can include one or more in-situ sensors 308, some of which are shown in FIG. 7 as well as below.
- sprayer 100-2 can include one or more fill level sensors 271 that detect a fill level of material in tanks 234. Fill level sensors can include float gauges, weight sensors that detect a weight of material in tanks 234, emitter sensors that detect a level to which the material is filled, as well as various other types of sensors.
- Sprayer 100-2 includes a spraying system having one or more tanks 234 containing one or more materials, such as a liquid materials (e.g., fertilizer, herbicide, pesticide, etc.), that is to be applied to field 207.
- Tanks 234 are fluidically coupled to spray nozzles 230 by a delivery system comprising a set of conduits.
- One or more pumps are configured to pump the product from the tanks 234 through the conduits and through nozzles 230 to apply the product to the field 207.
- the fluid pumps are actuated by operation of one or more motors, such as electric motors, pneumatic motors, or hydraulic motors, that drive the pumps.
- Spray nozzles 230 are coupled to, and spaced apart along, boom 220.
- Boom 220 includes arms 221 and 222 which can articulate or pivot relative to a center frame 226.
- arms 221 and 222 are movable between a storage or transport position and an extended or deployed position (shown in FIG. 7 ).
- the boom 220, including each arm 221 and 222, can include multiple discrete and controllable sections which are supplied product from tanks 234 by the fluid pumps through a respective conduit of each section.
- Each section can include a respective set of one or more spray nozzles 230.
- Each section can be activated or deactivated through the actuation of a corresponding controllable actuator, such as a valve, for instance, a section can be deactivated, that is the section or the nozzles of the section, or both, are prevented from receiving fluid, by actuation of a controllable actuator that is upstream of the section or the nozzles, or both.
- the nozzles of the section may each have an associated controllable actuator which can be actuated to activate or deactivate the nozzles.
- the application rate of product is the rate (volumetric rate) at which product is applied to the field over which sprayer 100-2 travels.
- the application rate corresponds to a volumetric flow rate of the product from the tanks 234 through the spray nozzles 230.
- the volumetric flow rate is controlled by operation of actuators (such as fluid pumps or valves), such as by varying the speed of actuation of the pump with an associated motor or by controllably opening and closing a vale.
- actuators such as fluid pumps or valves
- a controllable valve that corresponds to each section or to each nozzle can be operable to reciprocate (e.g., pulse) between a closed state and an open state at variable frequency (e.g., pulse width modulation control) to control the rate at which the product is discharged from the set of spray nozzles 230 of the respective section or from the respective individual spray nozzle 230.
- agricultural sprayer 100-2 comprises a towed implement 224 that carries the spraying system, and a towing or support machine 240 (illustratively a tractor, which may be similar to towing vehicle 10) that tows the towed spraying implement 224.
- Towed implement 224 includes a set of ground engaging elements 243, such as wheels or tracks.
- Towing machine 240 includes a set of ground engaging elements 244, such as wheels or tracks.
- towing machine 240 includes an operator compartment or cab 228, which can include a variety of different operator interface mechanisms (e.g., 318 shown in FIG. 10 ) for controlling sprayer 110-2.
- an agricultural sprayer can be self-propelled. That is, rather than being towed by a towing machine, the machine that carries the spraying system also includes propulsion and steering systems.
- FIG. 7 also illustrates that agricultural sprayer 100-2 can include one or more observation sensor systems 251.
- Observation sensors systems 251 can be located at various locations on sprayer 100-2, such as on towing vehicle 240 or implement 224, or both.
- sprayer 100-2 includes an observation sensor system 251 on towing vehicle 240 as well as a plurality of observation sensor systems disposed on each of arm 221 and arm 222 of boom 220.
- Observation sensor systems 251 can detect a variety of characteristic at the field, for example, soil nutrients, weed characteristics, as well as a variety of other characteristics.
- Observation sensor systems 251 may include one or more of an imaging system (e.g., stereo or mono camera), optical sensors, radar, lidar, ultrasonic sensors, infrared or thermal sensors, as well as a variety of other sensors.
- an imaging system e.g., stereo or mono camera
- optical sensors e.g., radar, lidar, ultrasonic sensors, infrared or thermal sensors, as well as a
- FIG. 8 illustrates one example of an agricultural sprayer 100-3 that is self-propelled as an example mobile material application machine 100.
- sprayer 100-3 has an on-board spraying system, including, among other things, one or more tanks 255 containing one or more materials (e.g., fertilizer, herbicide, pesticide, etc.) a boom 254, that is carried on a machine frame 256 having an operator compartment 259, and a set of ground engaging elements 260, such as wheels or tracks.
- Operator compartment 259 can include a variety of different operator interface mechanisms (e.g., 318 shown in FIG. 10 ) for controlling agricultural sprayer 100-3.
- Tank(s) 255 are fluidically coupled to spray nozzles 258 by a delivery system comprising a set of conduits.
- One or more fluid pumps are configured to pump the material from tank(s) 255 through the conduits and through nozzles 258 to apply the material to the field over which agricultural sprayer 100-3 travels.
- the fluid pumps are actuated by operation of one or more motors, such as electric motors, pneumatic motors, or hydraulic motors, that drive the pumps.
- Spray nozzles 258 are coupled to, and spaced apart along, boom 254.
- Boom 254 includes arms 262 and 267 which can articulate or pivot relative to a center frame 266. Thus, arms 262 and 264 are movable between a storage or transport position and an extended or deployed position (shown in FIG. 8 ).
- the boom 254, including each arm 262 and 267, can include multiple discrete and controllable sections which are supplied product from tank(s) 255 by the fluid pump(s) through a respective conduit of each section.
- Each section can include a respective set of one or more spray nozzles 258.
- Each section can be activated or deactivated through the actuation of a corresponding controllable actuator, such as a valve, for instance, a section can be deactivated, that is the section or the nozzles of the section, or both, are prevented from receiving fluid, by actuation of a controllable actuator that is upstream of the section or the nozzles, or both.
- the nozzles of the section may each have an associated controllable actuator which can be actuated to activate or deactivate the nozzles.
- the application rate of product is the rate (volumetric rate) at which product is applied to the field over which sprayer 100-3 travels.
- the application rate corresponds to a volumetric flow rate of the product from the tanks 255 through the spray nozzles 258.
- the volumetric flow rate is controlled by operation of actuators (such as fluid pumps or valves), such as by varying the speed of actuation of the pump with an associated motor or by controllably opening and closing a valve.
- actuators such as fluid pumps or valves
- a controllable valve that corresponds to each section or to each nozzle can be operable to reciprocate (e.g., pulse) between a closed state and an open state at variable frequency (e.g., pulse width modulation control) to control the rate at which the product is discharged from the set of spray nozzles 258 of the respective section or from the respective individual spray nozzle 258.
- FIG. 8 also shows that agricultural sprayer 100-3 can include one or more in-situ sensors 308, some of which are shown in FIG. 8 as well as below.
- sprayer 100-3 can include one or more fill level sensors 271 that detect a fill level of material in tanks 255.
- Fill level sensors can include float gauges, weight sensors that detect a weight of material in tanks 255, emitter sensors that detect a level to which the material is filled, as well as various other types of sensors.
- sprayer 100-3 can include one or more observation sensor systems 251.
- Observation sensors systems 251 can be located at various locations on sprayer 100-3.
- sprayer 100-3 includes an observation sensor system 251 coupled to the roof (or frame) of operator compartment 259 as well as a plurality of observation sensor systems 251 disposed on each of arm 262 and arm 267 of boom 254.
- Observation sensor systems 251 can detect a variety of characteristic at the field, for example, soil nutrients, weed characteristics, as well as a variety of other characteristics.
- Observation sensor systems 251 may include one or more of an imaging system (e.g., stereo or mono camera), optical sensors, radar, lidar, ultrasonic sensors, infrared or thermal sensors, as well as a variety of other sensors.
- an imaging system e.g., stereo or mono camera
- optical sensors e.g., radar, lidar, ultrasonic sensors, infrared or thermal sensors, as well as a variety of other sensors.
- a mobile agricultural material application machine 100 e.g., 100-1, 100-2, 100-3 can include various other types of sensors, some of which will be discussed in FIG. 10 .
- FIG. 9 shows one example of a material delivery machine 379.
- a material delivery machine 379 can include a towing vehicle and towed implement, such as a truck (e.g., semi-truck) 280 and trailer (e.g., semi-trailer) 282.
- trucks e.g., semi-truck
- trailer e.g., semi-trailer
- Various other forms of material delivery machines are contemplated herein.
- the material delivery machine 379 may not include a towed implement, instead, the material container may be integrated on the frame (e.g., chassis) of the vehicle.
- Truck 280 includes a power plant 283 (e.g., internal combustion engine, battery and electric motors, etc.), ground engaging elements 285 (e.g., wheels or tracks), and an operator compartment 287.
- the operator compartment can include a variety of operator interface mechanisms, which can be similar to operator interface mechanisms 318 shown in FIG. 10 .
- truck 280 may be autonomous or semi-autonomous.
- Trailer 282 is coupled to track by way of a connection assembly (e.g., one or more of a hitch, electrical coupling, hydraulic coupling, pneumatic coupling, etc.) and, as illustrated, includes ground engaging elements 290, such as wheels or tracks, and a material container 292 which includes a volume to store or hold one or more materials (dry or liquid), such as seed, fertilizer, herbicide, pesticide, etc.
- a connection assembly e.g., one or more of a hitch, electrical coupling, hydraulic coupling, pneumatic coupling, etc.
- a material container 292 which includes a volume to store or hold one or more materials (dry or liquid), such as seed, fertilizer, herbicide, pesticide, etc.
- material delivery machine 379 can also include a material transfer subsystem (not shown) which can include a conduit (e.g., a chute, a hose, a line, a pipe, etc.) through which material can be conveyed by an actuator such as an auger, a pump, a motor, etc.
- the material transfer subsystem may comprise an actuatable door disposed on the bottom side of the material container 292 that is actuatable between an open position and a closed position. These are merely some examples.
- FIG. 10 is a block diagram showing some portions of an agricultural material application system architecture 300.
- FIG. 3 shows that agricultural material application system architecture 300 includes mobile agricultural material application machine 100 (e.g., 100-1, 100-2, 100-3, etc.).
- Agricultural material application system 300 also includes one or more remote computing systems 368, one or more remote user interfaces 364, network 359, delivery vehicle(s) 379, delivery service system(s) 377, and one or more information maps 358.
- Mobile agricultural material application machine 100 itself, illustratively includes one or more processors or servers 301, data store 302, communication system 306, one or more in-situ sensors 308 that sense one or more characteristics at a field concurrent with an operation, and a processing system 338 that processes the sensor data (e.g., sensor signals, images, etc.) generated by in-situ sensors 308 to generate processed sensor data.
- the in-situ sensors 308 generate values corresponding to the sensed characteristics.
- Mobile machine 100 also includes a predictive model or relationship generator (collectively referred to hereinafter as “predictive model generator 310"), predictive model or relationship (collectively referred to hereinafter as “predictive model 311 "), predictive map generator 312, control zone generator 313, control system 314, one or more controllable subsystems 316, and an operator interface mechanism 318.
- predictive model generator 310 predictive model or relationship generator
- predictive model 311 predictive model or relationship
- predictive map generator 312 control zone generator 313, control system 314, one or more controllable subsystems 316
- operator interface mechanism 318 The mobile machine can also include a wide variety of other machine functionality 320.
- the in-situ sensors 308 can be on-board mobile machine 100, remote from mobile machine 100, such as deployed at fixed locations on the worksite or on another machine operating in concert with mobile machine 100, such as an aerial vehicle, and other types of sensors, or a combination thereof.
- In-situ sensors 308 sense characteristics at the worksite during the course of an operation.
- In-situ sensors 308 illustratively include one or more weed sensors 372, one or more nutrient sensors 374, one or more material consumption sensors 376, geographic position sensors 304, heading/speed sensors 325, and can include various other sensors 328, such as the various other sensors described above.
- Weed sensors 372 illustratively detect values of weed characteristics which can be indicative of weed presence, weed location, weed type, weed intensity, as well as various other weed characteristics.
- Weed sensors 372 can be located at various locations on material application machine 100 and can be configured to detect weed characteristics at the field ahead of material application machine 100 or ahead of a given component of material application machine 100, or both.
- Weed sensors 372 may include one or more of an imaging system (e.g., stereo or mono camera), optical sensors, radar, lidar, ultrasonic sensors, infrared or thermal sensors, as well as a variety of other sensors.
- weed sensors 372 can be similar to observation sensors systems 151 or 251. These are merely some examples.
- Weed sensors 372 can be any of a variety of different types of sensors.
- Nutrient sensors 374 illustratively detect nutrient values.
- Nutrient values can be indicative of an amount (e.g., concentration) of one or more nutrients in the soil of the field, such as the amount of nitrogen, the amount of potassium, the amount of phosphate, the amount of organic matter, the amount of one or more micronutrients, etc.
- nutrient values are or include soil nutrient values.
- nutrient values can be indicative of an amount (e.g., concentration) of one or more nutrients in the plants at the field.
- Nutrients of the plant can include various types of nutrients, such as boron, sulphur, manganese, zinc, magnesium, phosphorus, calcium, iron, copper, molybdenum, potassium, nitrogen, etc.
- nutrient values are or include plant nutrient values.
- nutrient values may be soil nutrient values or plant nutrient values, or both.
- the nutrient values may be binary in that they indicate sufficient or deficient levels (e.g., relative to a threshold) rather than a valued amount.
- Nutrient sensors 374 can be located at various locations on material application machine 100 and can be configured to detect nutrient characteristics (e.g., soil nutrient characteristics or plant nutrient characteristics, or both) at the field ahead of material application machine 100 or ahead of a given component of material application machine 100, or both.
- nutrient sensors 374 detect the soil or a characteristic of the soil to detect nutrient values.
- nutrient sensors 374 may detect the color of the soil, the thermal characteristics of the soil, the emissivity or absorption of electromagnetic radiation, the capability of the soil to conduct or accumulate electrical charge, as well as various other characteristics.
- nutrient sensors 374 detect the vegetation (e.g., plants) or a characteristic of the vegetation (e.g., plants) at the field to detect nutrient values. For instance, nutrient sensors 374 may detect the plant size, the plant health, the plant coloration, constituents of the plant (e.g., protein, starch, sugar, lignan, etc.), the emissivity or absorption of electromagnetic radiation, characteristics of the components of the plant (e.g., characteristics of the leaves, characteristics of the leaf buds, characteristics of the stalk, etc.), as well as various other characteristics.
- the vegetation e.g., plants
- a characteristic of the vegetation e.g., plants
- nutrient sensors 374 may detect the plant size, the plant health, the plant coloration, constituents of the plant (e.g., protein, starch, sugar, lignan, etc.), the emissivity or absorption of electromagnetic radiation, characteristics of the components of the plant (e.g., characteristics of the leaves, characteristics of the leaf buds,
- Nutrient sensors 374 may include one or more of an imaging system (e.g., stereo or mono camera), optical sensors, radar, lidar, ultrasonic sensors, infrared or thermal sensors, soil probes, electromagnetic sensors that detect the capability of the soil to conduct or accumulate electrical charge, as well as a variety of other sensors.
- an imaging system e.g., stereo or mono camera
- optical sensors e.g., radar, lidar
- ultrasonic sensors e.g., ultrasonic sensors
- infrared or thermal sensors e.g., infrared or thermal sensors
- soil probes e.g., electromagnetic sensors that detect the capability of the soil to conduct or accumulate electrical charge
- electromagnetic sensors that detect the capability of the soil to conduct or accumulate electrical charge
- nutrient sensors 374 can be similar to observation sensors systems 151 or 251.
- nutrient sensors 374 can be similar to sensor 170. These are merely some examples.
- Nutrient sensors 374 can be any of a variety of different types of sensors.
- Material consumption sensors 376 illustratively detect material consumption values which can be indicative of the amount of material (e.g., seed, dry or liquid material, fertilizer, herbicide, pesticide, etc.) consumed (e.g., used) by material application machine 100 at the field.
- Material consumption sensors 374 can be located at various locations on material application machine. Material consumption sensors 374 can include fill level sensors (e.g., 117, 177, 178, 271, etc.) that detect a fill level of a material container, such as tanks 107, tanks 110, tanks 112, tanks 234, and tanks 255.
- material consumption sensors 374 can detect a flow rate of material, such as flow sensors (e.g., flow meters) that detect a volumetric flow of material through a delivery line (e.g., 111, or conduits of boom 220, or conduits of boom 254, etc.). In some examples, material consumption sensors 374 can provide a count of the material consumed, for example, seed sensors, such as seed sensors 122, 193, or 203. In some examples, observation sensor systems 151 may detect the material consumed, such as an observation sensor system disposed to observe the trench or furrow 162. In some examples, material consumption sensors 376 can include sensors that detect the operating parameters of one or more actuators, such as the speed (or rate) at which the actuators actuate to control the rate of material. These are merely some examples. Material consumption sensors 376 can be any of a variety of different types of sensors.
- Geographic position sensors 304 illustratively sense or detect the geographic position or location of mobile machine 100.
- Geographic position sensors 304 can include, but are not limited to, a global navigation satellite system (GNSS) receiver that receives signals from a GNSS satellite transmitter.
- Geographic position sensors 304 can also include a real-time kinematic (RTK) component that is configured to enhance the precision of position data derived from the GNSS signal.
- Geographic position sensors 304 can include a dead reckoning system, a cellular triangulation system, or any of a variety of other geographic position sensors.
- Heading/speed sensors 325 detect a heading and speed at which mobile machine 100 is traversing the worksite during the operation. This can include sensors that sense the movement of ground-engaging elements (e.g., wheels or tracks), or can utilize signals received from other sources, such as geographic position sensor 304, thus, while heading/speed sensors 325 as described herein are shown as separate from geographic position sensor 304, in some examples, machine heading/speed is derived from signals received from geographic positions sensor 304 and subsequent processing. In other examples, heading/speed sensors 325 are separate sensors and do not utilize signals received from other sources.
- This can include sensors that sense the movement of ground-engaging elements (e.g., wheels or tracks), or can utilize signals received from other sources, such as geographic position sensor 304, thus, while heading/speed sensors 325 as described herein are shown as separate from geographic position sensor 304, in some examples, machine heading/speed is derived from signals received from geographic positions sensor 304 and subsequent processing. In other examples, heading/speed sensors 325 are separate sensors and do not utilize signals received from other sources.
- in-situ sensors 328 may be any of a wide variety of other sensors, including the other sensors described above with respect to FIGS. 1-8 .
- Other in-situ sensors 328 can be on-board mobile machine 100 or can be remote from mobile machine 100, such as other in-situ sensors 328 on-board another mobile machine that capture in-situ data of characteristics at the field or sensors at fixed locations throughout the field.
- the remote data from remote sensors can be obtained by mobile machine 100 via communication system 306 over network 359.
- In-situ data includes data taken from a sensor on-board the mobile machine 100 or taken by any sensor where the data are detected during the operation of mobile machine 100 at a field.
- Processing system 338 processes the sensor data (e.g., signals, images, etc.) generated by in-situ sensors 308 to generate processed sensor data indicative of one or more characteristics. For example, processing system generates processed sensor data indicative of characteristic values based on the sensor data generated by in-situ sensors 308, such as weed values based on sensor data generated by weed sensors 372, nutrient values based on sensor data generated by nutrient sensors 374, and material consumption values based on sensor data generated by material consumption sensors 376.
- sensor data e.g., signals, images, etc.
- processing system generates processed sensor data indicative of characteristic values based on the sensor data generated by in-situ sensors 308, such as weed values based on sensor data generated by weed sensors 372, nutrient values based on sensor data generated by nutrient sensors 374, and material consumption values based on sensor data generated by material consumption sensors 376.
- Processing system 338 also processes sensor data generated by other in-situ sensors 308 to generate processed sensor data indicative of other characteristic values, such as machine speed characteristic (travel speed, acceleration, deceleration, etc.) values based on sensor data generated by heading/speed sensors 325, machine heading values based on sensor data generated by heading/speed sensors 325, geographic position (or location) values based on sensor data generated by geographic position sensors 304, as well as various other values based on sensors signals generated by various other in-situ sensors 328.
- machine speed characteristic travel speed, acceleration, deceleration, etc.
- processing system 338 can be implemented by one or more processors or servers, such as processors or servers 301. Additionally, processing system 338 can utilize various sensor signal filtering functionalities, noise filtering functionalities, sensor signal categorization, aggregation, normalization, as well as various other processing functionalities. Similarly, processing system 338 can utilize various image processing functionalities such as, sequential image comparison, RGB, edge detection, black/white analysis, machine learning, neural networks, pixel testing, pixel clustering, shape detection, as well any number of other suitable processing and data extraction functionalities.
- FIG. 10 also shows that an operator 360 may operate mobile machine 100.
- the operator 360 interacts with operator interface mechanisms 318.
- operator interface mechanisms 318 may include joysticks, levers, a steering wheel, linkages, pedals, buttons, dials, keypads, user actuatable elements (such as icons, buttons, etc.) on a user interface display device, a microphone and speaker (where speech recognition and speech synthesis are provided), among a wide variety of other types of control devices.
- operator 360 may interact with operator interface mechanisms 318 using touch gestures.
- at least some operator interface mechanisms 318 may be disposed in an operator compartment of mobile machine 100.
- At least some operator interface mechanisms 318 may be remote (or separable) from mobile machine 100 but are in communication therewith.
- the operator 360 may be local or remote.
- FIG. 10 also shows remote users 366 interacting with mobile machine 100 or remote computing systems 368, or both, through user interfaces mechanisms 364 over network 359.
- user interface mechanisms 364 may include joysticks, levers, a steering wheel, linkages, pedals, buttons, dials, keypads, user actuatable elements (such as icons, buttons, etc.) on a user interface display device, a microphone and speaker (where speech recognition and speech synthesis are provided), among a wide variety of other types of control devices.
- user 366 may interact with user interface mechanisms 364 using touch gestures.
- Remote computing systems 368 can be a wide variety of different types of systems, or combinations thereof.
- remote computing systems 368 can be in a remote server environment.
- remote computing systems 368 can be remote computing systems, such as mobile devices, a remote network, a farm manager system, a vendor system, or a wide variety of other remote systems.
- mobile machine 100 can be controlled remotely by remote computing systems 368 or by remote users 366, or both.
- one or more of the components shown being disposed on mobile machine 100 in FIG. 10 can be located elsewhere, such as at remote computing systems 368.
- FIG. 10 also shows that one or more delivery vehicles 379 can interact with other items in agricultural material application system 300 over network 359.
- communication system 306 of mobile agricultural material application machine 100 may communicate with one or more delivery vehicles 379 to provide information such as material delivery locations and material delivery times to schedule material delivery.
- material one or more delivery vehicles 379 may be controlled, such as by control system 314, to travel to a material delivery location.
- FIG. 10 also shows that one or more delivery service systems 380 can interact with other items in agricultural material application system 300 over network 359.
- communication system 306 of mobile agricultural material application machine 100 may communicate with material delivery service systems 380 to provide information such as material delivery locations and material delivery times to schedule material delivery.
- Material delivery service systems 380 can be a wide variety of different types of systems, or combinations thereof.
- material delivery service systems 380 can be in a remote server environment.
- material delivery service systems 380 can be remote computing systems, such as mobile devices, a remote network, a vendor system, or a wide variety of other remote systems.
- FIG. 10 also shows that mobile machine 100 can obtain one or more information maps 358.
- the information maps 358 include, for example, a soil property map, a yield map, a residue map, a constituents map, a seeding map, a topographic map, a vegetative index (VI) map, an optical map, a weed map, a contamination map, as well as various other maps.
- information maps 358 may also encompass other types of data, such as other types of data that were obtained prior to a current operation or a map from a prior operation.
- information maps 358 can be generated during a current operation, such a map generated by predictive map generator 312 based on a predictive model 311 generated by predictive model generator 310.
- Information maps 358 may be downloaded onto mobile material application machine 100 over network 359 and stored in data store 302, using communication system 306 or in other ways.
- communication system 306 may be a cellular communication system, a system for communicating over a wide area network or a local area network, a system for communicating over a near field communication network, or a communication system configured to communicate over any of a variety of other networks or combinations of networks.
- Network 359 illustratively represents any or a combination of any of the variety of networks.
- Communication system 306 may also include a system that facilitates downloads or transfers of information to and from a secure digital (SD) card or a universal serial bus (USB) card or both.
- SD secure digital
- USB universal serial bus
- the present description relates to the use of models to predict one or more characteristics at the field at which mobile material application machine 100 is operating.
- the models 311 can be generated by predictive model generator 310, during the current operation.
- predictive model generator 310 generates a predictive model 311 that is indicative of a relationship between the values sensed by the in-situ sensors 308 and values mapped to the field by the information maps 358. For example, if the information map 358 maps values of a characteristic to different locations in the worksite, and the in-situ sensor 308 are sensing values indicative of a characteristic (e.g., weed values, nutrient values, material consumption values, or speed characteristic values), then model generator 310 generates a predictive model that models the relationship between the values of the mapped characteristic and the values of the sensed characteristic.
- a characteristic e.g., weed values, nutrient values, material consumption values, or speed characteristic values
- the predictive map generator 312 uses the predictive models generated by predictive model generator 310 to generate functional predictive maps that predict the value of a characteristic, sensed by the in-situ sensors 308, at different locations in the field based upon one or more of the information maps 358.
- predictive model 311 is a predictive nutrient model that models a relationship between nutrient values sensed by in-situ sensors 308 and one or more of soil property values from a soil property map, yield values from a yield map, residue values from a residue map, constituent values from a constituents map, seeding characteristic values from a seeding map, topographic characteristic values from a topographic map, vegetative index values from a vegetative index map, and other characteristic values from another information map 358
- predictive map generator 312 generates a functional predictive nutrient map that predicts nutrient values at different locations at the worksite based on one or more of the mapped values at those locations and the predictive nutrient model.
- predictive model 311 is a predictive weed model that models a relationship between weed values sensed by in-situ sensors 308 and one or more of vegetative index values from a vegetative index map, optical characteristic values from an optical map, weed values from a weed map, and other characteristic values from another information map 358
- predictive map generator 312 generates a functional predictive weed map that predicts weed values at different locations at the worksite based on one or more of the mapped values at those locations and the predictive weed model.
- predictive model 311 is a predictive material consumption model that models a relationship between material consumption values sensed by in-situ sensors 308 and one or more of soil property values from a soil property map, weed values from a weed map, contamination values from a contamination map, vegetative index values from a vegetative index map, topographic characteristic values from a topographic map, and other characteristic values from another information map 358
- predictive map generator 312 generates a functional predictive material consumption map that predicts material consumption values at different locations at the worksite based on one or more of the mapped values at those locations and the predictive material consumption model.
- predictive map generator 312 generates a functional predictive speed map that maps predictive speed characteristic values at different locations at the worksite based on or more of the mapped values at those locations and the predictive speed model.
- the type of values in the functional predictive map 263 may be the same as the in-situ data type sensed by the in-situ sensors 308. In some instances, the type of values in the functional predictive map 263 may have different units from the data sensed by the in-situ sensors 308. In some examples, the type of values in the functional predictive map 263 may be different from the data type sensed by the in-situ sensors 308 but have a relationship to the type of data type sensed by the in-situ sensors 308. For example, in some examples, the data type sensed by the in-situ sensors 308 may be indicative of the type of values in the functional predictive map 363.
- the type of data in the functional predictive map 363 may be different than the data type in the information maps 358. In some instances, the type of data in the functional predictive map 263 may have different units from the data in the information maps 358. In some examples, the type of data in the functional predictive map 263 may be different from the data type in the information map 358 but has a relationship to the data type in the information map 358. For example, in some examples, the data type in the information maps 358 may be indicative of the type of data in the functional predictive map 263. In some examples, the type of data in the functional predictive map 263 is different than one of, or both of, the in-situ data type sensed by the in-situ sensors 308 and the data type in the information maps 358.
- the type of data in the functional predictive map 263 is the same as one of, or both of, of the in-situ data type sensed by the in-situ sensors 308 and the data type in information maps 358. In some examples, the type of data in the functional predictive map 263 is the same as one of the in-situ data type sensed by the in-situ sensors 308 or the data type in the information maps 358, and different than the other.
- predictive map 264 predicts the value of a sensed characteristic (sensed by in-situ sensors 308), or a characteristic related to the sensed characteristic, at various locations across the worksite based upon one or more information values in one or more information maps 358 at those locations and using a predictive model 311. For example, if predictive model generator 310 has generated a predictive model indicative of a relationship between soil property values and values of a characteristic sensed by in-situ sensors 308 then, given the soil property value at different locations across the worksite, predictive map generator 312 generates a predictive map 264 that predicts values of the sensed characteristic at different locations across the worksite.
- the soil property value, obtained from the soil property map, at those locations and the relationship between soil property values and the values of the sensed characteristic, obtained from a predictive model 311, are used to generate the predictive map 264. This is merely one example.
- the data type in one or more information maps 358 is different from the data type sensed by in-situ sensors 308, yet the data type in the predictive map 264 is the same as the data type sensed by the in-situ sensors 308.
- the information map 358 may be a seeding map, and the variable sensed by the in-situ sensors 308 may be a nutrient value.
- the predictive map 264 may then be a predictive nutrient map that maps predictive nutrient values to different geographic locations in the in the worksite.
- the information map 358 may be a vegetative index map, and the variable sensed by the in-situ sensors 308 may be a weed value.
- the predictive map 264 may then be a predictive weed map that maps predictive weed values to different geographic locations in the in the worksite.
- the information map 358 may be a contamination map, and the variable sensed by the in-situ sensors 308 may be a material consumption value.
- the predictive map 264 may then be a predictive material consumption map that maps predictive material consumption values to different geographic locations in the in the worksite.
- the information map 358 may be a soil property map, and the variable sensed by the in-situ sensors 308 may be a speed characteristic value.
- the predictive map 264 may then be a predictive speed map that maps predictive speed characteristic values to different geographic locations in the in the worksite.
- the data type in the information map 358 is different from the data type sensed by in-situ sensors 308, and the data type in the predictive map 264 is different from both the data type in the information map 358 and the data type sensed by the in-situ sensors 308.
- the information map may be a residue map, and the variable sensed by the in-situ sensors 308 may be a color of the plants.
- the predictive map may then be a predictive nutrient map that maps predictive nutrient values to the different geographic locations in the worksite.
- the information map 358 is from a prior pass through the field during a prior operation and the data type is different from the data type sensed by in-situ sensors 308, yet the data type in the predictive map 264 is the same as the data type sensed by the in-situ sensors 308.
- the information map 358 may be a seeding map generated during a previous planting operation on the field, and the variable sensed by the in-situ sensors 308 may be a nutrient value.
- the predictive map 264 may then be a predictive nutrient map that maps predictive nutrient values to different geographic locations in the field.
- the information map 358 may be a vegetative index map generated during a previous operation on the field, and the variable sensed by the in-situ sensors 308 may be a weed value.
- the predictive map 264 may then be a predictive weed map that maps predictive weed values to different geographic locations in the field.
- the information map 358 may be a topographic map generated during a previous operation on the field, and the variable sensed by the in-situ sensors 308 may be a material consumption value.
- the predictive map 264 may then be a predictive material consumption map that maps predictive material consumption values to different geographic locations in the field.
- the information map 358 may be a soil property map generated during a previous operation on the field, and the variable sensed by the in-situ sensors 308 may be a speed characteristic value.
- the predictive map 264 may then be a predictive speed map that maps predictive speed characteristic values to different geographic locations in the field.
- the information map 358 is from a prior pass through the field during a prior operation and the data type is the same as the data type sensed by in-situ sensors 308, and the data type in the predictive map 264 is also the same as the data type sensed by the in-situ sensors 308.
- the information map 358 may be a weed map generated during a previous year or earlier in the same season, and the variable sensed by the in-situ sensors 308 may be a weed value.
- the predictive map 264 may then be a predictive weed map that maps predictive weed values to different geographic locations in the field.
- the relative weed value differences in the georeferenced information map 358 from the prior year or earlier in the same season can be used by predictive model generator 310 to generate a predictive model that models a relationship between the relative weed value differences on the information map 358 and the weed values sensed by in-situ sensors 308 during the current operation.
- the predictive model is then used by predictive map generator 310 to generate a predictive weed map.
- the information map 358 may be a nutrient map generated during a previous year or earlier in the same season, and the variable sensed by the in-situ sensors 308 may be a nutrient value.
- the predictive map 264 may then be a predictive nutrient map that maps predictive nutrient values to different geographic locations in the field.
- the relative nutrient value differences in the georeferenced information map 358 from the prior year or earlier in the same season can be used by predictive model generator 310 to generate a predictive model that models a relationship between the relative nutrient value differences on the information map 358 and the nutrient values sensed by in-situ sensors 308 during the current operation.
- the predictive model is then used by predictive map generator 310 to generate a predictive nutrient map.
- the information map 358 may be a material consumption map generated during a previous year or earlier in the same season, and the variable sensed by the in-situ sensors 308 may be a material consumption value.
- the predictive map 264 may then be a predictive material consumption map that maps predictive material consumption values to different geographic locations in the field.
- the relative material consumption value differences in the georeferenced information map 358 from the prior year or earlier in the same season can be used by predictive model generator 310 to generate a predictive model that models a relationship between the relative material consumption value differences on the information map 358 and the material consumption values sensed by in-situ sensors 308 during the current operation.
- the predictive model is then used by predictive map generator 310 to generate a predictive material consumption map.
- the information map 358 may be a speed map generated during a previous year or earlier in the same season, and the variable sensed by the in-situ sensors 308 may be a speed characteristic value.
- the predictive map 264 may then be a predictive speed map that maps predictive speed characteristic values to different geographic locations in the field.
- the relative speed characteristic value differences in the georeferenced information map 358 from the prior year or earlier in the same season can be used by predictive model generator 310 to generate a predictive model that models a relationship between the relative speed characteristic value differences on the information map 358 and the speed characteristic values sensed by in-situ sensors 308 during the current operation.
- the predictive model is then used by predictive map generator 310 to generate a predictive speed map.
- the information map 358 may be a topographic map generated during a prior operation in the same year and may map topographic characteristic values to different geographic locations in the field.
- the variable sensed by the in-situ sensors 308 during the current operation may be a nutrient value, a weed value, a material consumption value, or a speed characteristic value.
- the predictive map 264 may then map predictive characteristic values (e.g., nutrient values, weed values, material consumption values, or speed characteristic values) to different geographic locations in the field.
- the topographic characteristic values at time of the prior operation are geo-referenced, recorded, and provided to mobile machine 100 as an information map 358 of topographic characteristic values.
- In-situ sensors 308 during a current operation can detect characteristic values (e.g., nutrient values, weed values, material consumption values, or speed characteristic values) at geographic locations in the field and predictive model generator 310 may then build a predictive model that models a relationship between characteristic values (e.g., nutrient values, weed values, material consumption values, or speed characteristic values) at the time of the current operation and topographic characteristic values at the time of the prior operation. This is because the topographic characteristic values at the time of the prior operation are likely to be the same as at the time of the current operation or may be more accurate or otherwise may be more reliable (or fresher) than topographic characteristic values obtained in other ways.
- characteristic values e.g., nutrient values, weed values, material consumption values, or speed characteristic values
- a machine that operated on the field previously may provide topographic characteristic values that are fresher (closer in time) or more accurate than topographic characteristic values detected in other ways, such as satellite or other aerial-based sensing.
- topographic characteristic values may be more preferable. This is merely one example.
- predictive map 264 can be provided to the control zone generator 313.
- Control zone generator 313 groups adjacent portions of an area into one or more control zones based on data values of predictive map 264 that are associated with those adjacent portions.
- a control zone may include two or more contiguous portions of a worksite, such as a field, for which a control parameter corresponding to the control zone for controlling a controllable subsystem is constant.
- a response time to alter a setting of controllable subsystems 316 may be inadequate to satisfactorily respond to changes in values contained in a map, such as predictive map 264.
- control zone generator 313 parses the map and identifies control zones that are of a defined size to accommodate the response time of the controllable subsystems 316.
- control zones may be sized to reduce wear from excessive actuator movement resulting from continuous adjustment.
- the control zones may be added to the predictive map 264 to obtain predictive control zone map 265.
- Predictive control zone map 265 can thus be similar to predictive map 264 except that predictive control zone map 265 includes control zone information defining the control zones.
- a functional predictive map 263, as described herein may or may not include control zones.
- Both predictive map 264 and predictive control zone map 265 are functional predictive maps 263.
- a functional predictive map 263 does not include control zones, such as predictive map 264.
- a functional predictive map 263 does include control zones, such as predictive control zone map 265.
- control zone generator 313 can cluster values to generate control zones and the control zones can be added to predictive control zone map 265, or a separate map, showing only the control zones that are generated.
- the control zones may be used for controlling or calibrating mobile machine 100 or both.
- the control zones may be presented to the operator 360 and used to control or calibrate mobile machine 100, and, in other examples, the control zones may be presented to the operator 360 or another user, such as a remote user 366, or stored for later use.
- Predictive map 264 or predictive control zone map 265 or both are provided to control system 314, which generates control signals based upon the predictive map 264 or predictive control zone map 265 or both.
- communication system controller 329 controls communication system 306 to communicate the predictive map 264 or predictive control zone map 265 or control signals based on the predictive map 264 or predictive control zone map 265 to other mobile machines (e.g., delivery vehicles 379, other mobile material application machines) that are operating at the same worksite or in the same operation.
- communication system controller 329 controls the communication system 306 to send the predictive map 264, predictive control zone map 265, or both to other remote systems, such as remote computing systems 368 or delivery service systems 377, or both.
- Control system 314 includes communication system controller 329, interface controller 330, one or more material application controllers 331, a propulsion controller 334, a path planning controller 335, one or more zone controllers 336, logistics module 315, and control system 314 can include other items 339.
- Controllable subsystems 316 include material application actuators 340, propulsion subsystem 350, steering subsystem 352, and can include a wide variety of other controllable subsystems 356.
- Control system 314 can control various items of agricultural system 300 based on sensor data detected by sensors 308, models 311, predictive map 264 or predictive map with control zones 265, operator or user inputs, as well as various other bases.
- Interface controllers 330 are operable to generate control signals to control interface mechanisms, such as operator interface mechanisms 318 or user interface mechanisms 364, or both. While operator interface mechanisms 318 are shown as separate from controllable subsystems 316, it will be understood that operator interface mechanisms 318 are controllable subsystems.
- the interface controllers 330 are also operable to present the predictive map 264 or predictive control zone map 265 or other information derived from or based on the predictive map 264, predictive control zone map 265, or both, to operator 360 or a remote user 366, or both. Operator 360 may be a local operator or a remote operator.
- interface controller 330 generates control signals to control a display mechanism to display one or both of predictive map 264 and predictive control zone map 265 for the operator 360 or a remote user 366, or both.
- Interface controller 330 may generate operator or user actuatable mechanisms that are displayed and can be actuated by the operator or user to interact with the displayed map. The operator or user can edit the map by, for example, correcting a value displayed on the map, based on the operator's or the user's observation.
- Propulsion controller 334 illustratively generates control signals to control propulsion subsystem 350 to control a speed setting, such as one or more of a travel speed, acceleration, deceleration, and direction (e.g., forward and reverse), such as based on one or more of the predictive map 264 and the predictive control zone map 265 as well as based on outputs from logistics module 315.
- Propulsion subsystem 350 includes one or more powertrain components, such as a powerplant (e.g., internal combustion engine, electric motors and batteries, etc.), a transmission or gear box, as well as various other items.
- Path planning controller 335 illustratively generates control signals to control steering subsystem 352 to steer mobile machine 100 according to a desired path or according to desired parameters, such as desired steering angles, based on one or more of the predictive map 264 and the predictive control zone map 265 or logistics outputs from logistics module 315.
- Path planning controller 333 can control a path planning system to generate a route for mobile machine 100 and can control propulsion subsystem 350 and steering subsystem 352 to steer agricultural mobile machine 100 along that route.
- Steering subsystem 352 can include various items, such as one or more actuators to control an angle (steering angle) of one or more ground engaging elements (e.g., wheels or tracks) of mobile machine 100.
- Material application controllers 331 illustratively generate control signals, to control one or material application actuators 340 of mobile material application machine 100 to control the application of material to the field, that is the amount of material applied, the rate at which material is applied, whether or not material is applied, etc.
- Material application controllers 331 can generate control signals based on a predictive map 264 or predictive control zone map 265, or both.
- Material application controllers 331 can generate control signals based on logistics outputs from logistics module 315.
- Material application actuators 340 can include a variety of different types of actuators such as hydraulic, pneumatic, electromechanical actuators, motors, pumps, valves, as well as various other types of actuators. Some examples of actuators 340 are discussed above in FIGS. 1-8 .
- actuators 340 can include actuators that drive the speed of rotation of a seed meter, such as seed meter 124 or the speed of rotation of an assistive seed delivery, such as assistive seed delivery system 166, or both.
- Actuators 340 can include actuators that control a flow of material from one or more material containers through a delivery line and to an outlet.
- actuators 340 can include one or more actuators, such as pumps or valves, or both, (e.g., 109 or 115) that control the flow of material from a material container (e.g., 107, 110, or 112) through a delivery line (e.g., 111) and out of an outlet (e.g., 119).
- a material container e.g., 107, 110, or 112
- a delivery line e.g., 111
- an outlet e.g., 119
- actuators can include one or more pumps or one or more valves, or both, that control the flow of material from a material container (e.g., 234 or 255) through a conduit and out of an outlet (e.g., 230 or 258).
- actuators 340 may be controlled to activate or deactivate one or more components of material application machine 100.
- actuators 340 may be controlled to activate or deactivate one or more nozzles or one or more sections of a spraying machine.
- the mobile agricultural material application machine 100 may have multiple material containers. Each container may contain a different variety of the material to be applied, for example, a different seed variety (e.g., genotype), a different fertilizer material variety, a different herbicide variety, a different pesticide variety, etc.
- material application controllers 331 may control material application actuators 340 to control which variety is applied to the field, based on a predictive map 264 or a predictive control zone map 265, or both, as well as other inputs. For instance, it may be desirable to plant weed resistant seed varieties in areas of the field where the map (264 or 265, or both) indicate high levels of weeds.
- Zone controller 336 illustratively generates control signals to control one or more controllable subsystems 316 to control operation of the one or more controllable subsystems 316 based on the predictive control zone map 265.
- Logistics module 315 illustratively generates logistics control outputs. Logistics module 315 will be discussed in more detail in FIG. 16 .
- controllers 339 included on the mobile machine 100, or at other locations in agricultural system 300, can control other subsystems 356.
- FIG. 10 shows that various components of agricultural system architecture 300 are located on mobile material application machine 100
- one or more of the components illustrated on mobile material application machine 100 in FIG. 10 can be located at other locations, such as one or more remote computing systems 368.
- one or more of data stores 302, map selector 309, predictive model generator 310, predictive model 311, predictive map generator 312, functional predictive maps 263 (e.g., 264 and 265), control zone generator 313, and control system 314 (or components thereof) can be located remotely from mobile machine 100 but can communicate with (or be communicated to) mobile machine 100 via communication system 306 and network 359.
- predictive models 311 and functional predictive maps 263 may be generated and/or located at remote locations away from mobile machine 100 and can be communicated to mobile machine 100 over network 359, for instance, communication system 306 can download the predictive models 311 and functional predictive maps 263 from the remote locations and store them in data store 302.
- mobile machine 100 may access the predictive models 311 and functional predictive maps 263 at the remote locations without downloading the predictive models 311 and functional predictive maps 263.
- the information used in the generation of the predictive models 311 and functional predictive maps 263 may be provided to the predictive model generator 310 and the predictive map generator 312 at those remote locations over network 359, for example in-situ sensor data generated by in-situ sensors 308 can be provided over network 359 to the remote locations.
- information maps 358 can be provided to the remote locations.
- control system 314 may remain local to mobile machine 100, and a remote system (e.g., 368 or 364) may be provided with functionality (e.g., such as a control signal generator) that communicates control commands to mobile machine 100 that are used by control system 314 for the control of mobile machine 100.
- a remote system e.g., 368 or 364
- functionality e.g., such as a control signal generator
- components can receive data from components of mobile machine 100 over network 359.
- predictive model generator 310 and predictive map generator 312 are located remotely from mobile machine 100, such as at remote computing systems 368, data generated by in-situ sensors 308 and geographic position sensors 304, for instance, can be communicated to the remote computing systems 368 over network 359.
- information maps 358 can be obtained by remote computing systems 368 over network 359 or over another network.
- FIG. 11 is a block diagram of a portion of the agricultural material application system architecture 300 shown in FIG. 10 . Particularly, FIG. 11 shows, among other things, examples of the predictive model generator 310 and the predictive map generator 312 in more detail. FIG. 11 also illustrates information flow among the various components shown.
- the predictive model generator 310 receives one or more information map(s) 358.
- information maps 358 include one or more of a soil property map 410, a yield map 411, a residue map 412, a constituents map 413, a seeding map 414, a topographic map 415, a vegetative index map 416, or any of a wide variety of other information maps 429.
- Predictive model generator 310 also receives geographic location data 434, such as an indication of a geographic location, from geographic position sensor 304.
- Geographic location data 434 illustratively represents the geographic locations to which values detected by in-situ sensors 308 correspond.
- the geographic position of the mobile machine 100, as detected by geographic position sensors 304 will not be the same as the geographic position on the field to which a value detected by in-situ sensors 308 corresponds.
- geographic position sensor 304 can be used to derive a geographic location at the field to which a value a detected by an in-situ sensor 308 corresponds.
- In-situ sensors 308 illustratively include nutrient sensors 374, as well as processing system 338.
- processing system 338 is separate from in-situ sensors 308 (such as the example shown in FIG. 10 ).
- nutrient sensors 374 may be located on-board mobile material application machine 100.
- the processing system 338 processes sensor data generated from nutrient sensors 374 to generate processed sensor data 430 indicative of nutrient values (e.g., soil nutrient values or plant nutrient values, or both).
- the example predictive model generator 310 includes a nutrient-to-soil property model generator 440, a nutrient-to-yield model generator 441, a nutrient-to-residue model generator 442, a nutrient-to-constituents model generator 443, a nutrient-to-seeding characteristic model generator 444, a nutrient-to-topographic characteristic model generator 445, a nutrient-to-vegetative index model generator 446, and a nutrient-to-other characteristic model generator 448.
- the predictive model generator 310 may include additional, fewer, or different components than those shown in the example of FIG. 11 . Consequently, in some examples, the predictive model generator 310 may include other items 449 as well, which may include other types of predictive model generators to generate other types of nutrient models.
- Nutrient-to-soil property model generator 440 identifies a relationship between nutrient value(s) detected in in-situ sensor data 430, at geographic location(s) to which the nutrient value(s), detected in the in-situ sensor data 430, correspond, and soil property value(s) from the soil property map 410 corresponding to the same geographic location(s) to which the detected nutrient value(s) correspond. Based on this relationship established by nutrient-to-soil property model generator 440, nutrient-to-soil property model generator 440 generates a predictive nutrient model.
- the predictive nutrient model is used by predictive nutrient map generator 452 to predict a nutrient value at different locations in the field based upon the georeferenced soil property values contained in the soil property map 410 corresponding to the same locations in the field.
- a nutrient value can be predicted at the given location based on the predictive nutrient model and the soil property value, from the soil property map 415, corresponding to that given location.
- Nutrient-to-yield model generator 441 identifies a relationship between nutrient value(s) detected in in-situ sensor data 430, at geographic location(s) to which the nutrient value(s), detected in the in-situ sensor data 430, correspond, and yield value(s) from the yield map 411 corresponding to the same geographic location(s) to which the detected nutrient value(s) correspond. Based on this relationship established by nutrient-to-yield model generator 441, nutrient-to-yield model generator 441 generates a predictive nutrient model.
- the predictive nutrient model is used by predictive nutrient map generator 452 to predict a nutrient value at different locations in the field based upon the georeferenced yield values contained in the yield map 411 corresponding to the same locations in the field.
- a nutrient value can be predicted at the given location based on the predictive nutrient model and the yield value, from the yield map 411, corresponding to that given location.
- Nutrient-to-residue model generator 442 identifies a relationship between nutrient value(s) detected in in-situ sensor data 430, at geographic location(s) to which the nutrient value(s), detected in the in-situ sensor data 430, correspond, and residue value(s) from the residue map 412 corresponding to the same geographic location(s) to which the detected nutrient value(s) correspond. Based on this relationship established by nutrient-to-residue model generator 442, nutrient-to-residue model generator 442 generates a predictive nutrient model.
- the predictive nutrient model is used by predictive nutrient map generator 452 to predict a nutrient value at different locations in the field based upon the georeferenced residue values contained in the residue map 412 corresponding to the same locations in the field.
- a nutrient value can be predicted at the given location based on the predictive nutrient model and the residue value, from the residue map 412, corresponding to that given location.
- Nutrient-to-constituents model generator 443 identifies a relationship between nutrient value(s) detected in in-situ sensor data 430, at geographic location(s) to which the nutrient value(s), detected in the in-situ sensor data 430, correspond, and constituent value(s) from the constituents map 413 corresponding to the same geographic location(s) to which the detected nutrient value(s) correspond. Based on this relationship established by nutrient-to-constituents model generator 443, nutrient-to-constituents model generator 443 generates a predictive nutrient model.
- the predictive nutrient model is used by predictive nutrient map generator 452 to predict a nutrient value at different locations in the field based upon the georeferenced constituent values contained in the constituents map 413 corresponding to the same locations in the field.
- a nutrient value can be predicted at the given location based on the predictive nutrient model and the constituent value, from the constituents map 413, corresponding to that given location.
- Nutrient-to-seeding characteristic model generator 444 identifies a relationship between nutrient value(s) detected in in-situ sensor data 430, at geographic location(s) to which the nutrient value(s), detected in the in-situ sensor data 430, correspond, and seeding characteristic value(s) from the seeding map 414 corresponding to the same geographic location(s) to which the detected nutrient value(s) correspond. Based on this relationship established by nutrient-to-seeding characteristic model generator 444, nutrient-to-seeding characteristic model generator 444 generates a predictive nutrient model.
- the predictive nutrient model is used by predictive nutrient map generator 452 to predict a nutrient value at different locations in the field based upon the georeferenced seeding characteristic values contained in the seeding map 414 corresponding to the same locations in the field.
- a nutrient value can be predicted at the given location based on the predictive nutrient model and the seeding characteristic value, from the seeding map 414, corresponding to that given location.
- Nutrient-to-topographic characteristic model generator 445 identifies a relationship between nutrient value(s) detected in in-situ sensor data 430, at geographic location(s) to which the nutrient value(s), detected in the in-situ sensor data 430, correspond, and topographic characteristic value(s) from the topographic map 415 corresponding to the same geographic location(s) to which the detected nutrient value(s) correspond. Based on this relationship established by nutrient-to-topographic characteristic model generator 445, nutrient-to-topographic characteristic model generator 445 generates a predictive nutrient model.
- the predictive nutrient model is used by predictive nutrient map generator 452 to predict a nutrient value at different locations in the field based upon the georeferenced topographic characteristic values contained in the topographic map 415 corresponding to the same locations in the field.
- a nutrient value can be predicted at the given location based on the predictive nutrient model and the topographic characteristic value, from the topographic map 415, corresponding to that given location.
- Nutrient-to-vegetative index model generator 446 identifies a relationship between nutrient value(s) detected in in-situ sensor data 430, at geographic location(s) to which the nutrient value(s), detected in the in-situ sensor data 430, correspond, and vegetative index value(s) from the vegetative index map 416 corresponding to the same geographic location(s) to which the detected nutrient value(s) correspond. Based on this relationship established by nutrient-to-vegetative index model generator 446, nutrient-to-vegetative index model generator 446 generates a predictive nutrient model.
- the predictive nutrient model is used by predictive nutrient map generator 452 to predict a nutrient value at different locations in the field based upon the georeferenced vegetative index values contained in the vegetative index map 416 corresponding to the same locations in the field.
- a nutrient value can be predicted at the given location based on the predictive nutrient model and the vegetative index value, from the vegetative index map 416, corresponding to that given location.
- Nutrient-to-other characteristic model generator 448 identifies a relationship between nutrient value(s) detected in in-situ sensor data 430, at geographic location(s) to which the nutrient value(s), detected in the in-situ sensor data 430, correspond, and other characteristic value(s) from an other map 429 corresponding to the same geographic location(s) to which the detected nutrient value(s) correspond. Based on this relationship established by nutrient-to-other characteristic model generator 448, nutrient-to-other characteristic model generator 448 generates a predictive nutrient model.
- the predictive nutrient model is used by predictive nutrient map generator 452 to predict a nutrient value at different locations in the field based upon the georeferenced other characteristic values contained in the other map 429 corresponding to the same locations in the field.
- a nutrient value can be predicted at the given location based on the predictive nutrient model and the other characteristic value, from the other map 415, corresponding to that given location.
- the predictive model generator 310 is operable to produce a plurality of predictive nutrient models, such as one or more of the predictive nutrient models generated by model generators 440, 441, 442, 443, 444, 445, 446, 448, and 449.
- two or more of the predictive models described above may be combined into a single predictive nutrient model, such as a predictive nutrient model that predicts a nutrient value based upon two or more of the soil property values, the yield values, the residue values, the constituent values, the seeding characteristic values, the topographic characteristic values, the vegetative index values, and the other characteristic values at different locations in the field. Any of these nutrient models, or combinations thereof, are represented collectively by predictive nutrient model 450 in FIG. 11 .
- predictive map generator 312 includes a predictive nutrient map generator 452.
- predictive map generator 312 may include additional or different map generators.
- predictive map generator 312 may include other items 456 which may include other types of map generators to generate other types of maps.
- Predictive nutrient map generator 452 receives one or more of the soil property map 410, the yield map 411, the residue map 412, the constituents map 413, the seeding map 414, the topographic map 415, and an other map 429, along with the predictive nutrient model 450 which predicts a nutrient value based upon one or more of a soil property value, a yield value, a residue value, a constituent value, a seeding characteristic value, a topographic characteristic value, a vegetative index value, and an other characteristic value, and generates a predictive map that predicts a nutrient value at different locations in the field, such as functional predictive nutrient map 460.
- Predictive map generator 312 thus outputs a functional predictive nutrient map 460 that is predictive of a nutrient value.
- the functional predictive nutrient map 460 is a predictive map 264.
- the functional predictive nutrient map 460 predicts a nutrient value at different locations in a field.
- the functional predictive nutrient map 460 may be provided to control zone generator 313, control system 314, or both.
- Control zone generator 313 generates control zones and incorporates those control zones into the functional predictive nutrient map 460 to produce a predictive control zone map 265, that is a functional predictive nutrient control zone map 461.
- One or both of functional predictive nutrient map 460 and functional predictive nutrient control zone map 461 may be provided to control system 314, which generates control signals to control one or more of the controllable subsystems 316 based upon the functional predictive nutrient map 460, the functional predictive nutrient control zone map 461, or both.
- FIG. 12 is a block diagram of a portion of the agricultural material application system architecture 300 shown in FIG. 10 . Particularly, FIG. 12 shows, among other things, examples of the predictive model generator 310 and the predictive map generator 312 in more detail. FIG. 12 also illustrates information flow among the various components shown.
- the predictive model generator 310 receives one or more information map(s) 358.
- information maps 358 include one or more of a vegetative index map 416, an optical map 417, a weed map 418, or any of a wide variety of other information maps 429.
- Predictive model generator 310 also receives geographic location data 1434, such as an indication of a geographic location, from geographic position sensor 304.
- Geographic location data 1434 illustratively represents the geographic locations to which values detected by in-situ sensors 308 correspond.
- the geographic position of the mobile machine 100, as detected by geographic position sensors 304 will not be the same as the geographic position on the field to which a value detected by in-situ sensors 308 corresponds.
- geographic position sensor 304 can be used to derive a geographic location at the field to which a value a detected by an in-situ sensor 308 corresponds.
- In-situ sensors 308 illustratively include weed sensors 372, as well as processing system 338.
- processing system 338 is separate from in-situ sensors 308 (such as the example shown in FIG. 10 ).
- weed sensors 372 may be located on-board mobile material application machine 100.
- the processing system 338 processes sensor data generated from weed sensors 372 to generate processed sensor data 1430 indicative of weed values.
- Weed sensors 372 and processing system 338 may sense one or more visual properties of weeds including color, size, and shape.
- Weed sensors 372 and processing system 338 may sense plant locations relative to known crop seed or plant locations or to known weed seed or plant locations.
- the example predictive model generator 310 includes a weed-to-vegetative index model generator 1440, a weed-to-optical characteristic model generator 1441, a weed-to-weed model generator 1442, and a weed-to-other characteristic model generator 1445.
- the predictive model generator 310 may include additional, fewer, or different components than those shown in the example of FIG. 12 . Consequently, in some examples, the predictive model generator 310 may include other items 1449 as well, which may include other types of predictive model generators to generate other types of weed models.
- Weed-to-vegetative index model generator 1440 identifies a relationship between weed value(s) detected in in-situ sensor data 1430, at geographic location(s) to which the weed value(s), detected in the in-situ sensor data 1430, correspond, and vegetative index value(s) from the vegetative index map 416 corresponding to the same geographic location(s) to which the detected weed value(s) correspond. Based on this relationship established by weed-to-vegetative index model generator 1440, weed-to-vegetative index model generator 1440 generates a predictive weed model.
- the predictive weed model is used by predictive weed map generator 1452 to predict a weed value at different locations in the field based upon the georeferenced vegetative index values contained in the vegetative index map 416 corresponding to the same locations in the field.
- a weed value can be predicted at the given location based on the predictive weed model and the vegetative index value, from the vegetative index map 416, corresponding to that given location.
- Weed-to-optical characteristic model generator 1441 identifies a relationship between weed value(s) detected in in-situ sensor data 1430, at geographic location(s) to which the weed value(s), detected in the in-situ sensor data 1430, correspond, and optical characteristic value(s) from the optical map 417 corresponding to the same geographic location(s) to which the detected weed value(s) correspond. Based on this relationship established by weed-to-optical characteristic model generator 1441, weed-to-optical characteristic model generator 1441 generates a predictive weed model.
- the predictive weed model is used by predictive weed map generator 1452 to predict a weed value at different locations in the field based upon the georeferenced optical characteristic values contained in the optical map 417 corresponding to the same locations in the field.
- a weed value can be predicted at the given location based on the predictive weed model and the optical characteristic value, from the optical map 417, corresponding to that given location.
- Weed-to-weed model generator 1442 identifies a relationship between weed value(s) detected in in-situ sensor data 1430, at geographic location(s) to which the weed value(s), detected in the in-situ sensor data 1430, correspond, and weed value(s) from the weed map 418 corresponding to the same geographic location(s) to which the detected weed value(s) correspond. Based on this relationship established by weed-to-weed model generator 1442, weed-to-weed model generator 1442 generates a predictive weed model.
- the predictive weed model is used by predictive weed map generator 1452 to predict a weed value at different locations in the field based upon the georeferenced weed values contained in the weed map 418 corresponding to the same locations in the field.
- a weed value can be predicted at the given location based on the predictive weed model and the weed value, from the weed map 418, corresponding to that given location.
- Weed-to-other characteristic model generator 1445 identifies a relationship between weed value(s) detected in in-situ sensor data 1430, at geographic location(s) to which the weed value(s), detected in the in-situ sensor data 1430, correspond, and other characteristic value(s) from an other map 429 corresponding to the same geographic location(s) to which the detected weed value(s) correspond. Based on this relationship established by weed-to-other characteristic model generator 1445, weed-to-other characteristic model generator 1445 generates a predictive weed model.
- the predictive weed model is used by predictive weed map generator 1452 to predict a weed value at different locations in the field based upon the georeferenced other characteristic values contained in the other map 429 corresponding to the same locations in the field.
- a weed value can be predicted at the given location based on the predictive weed model and the other characteristic value, from the other map 429, corresponding to that given location.
- the predictive model generator 310 is operable to produce a plurality of predictive weed models, such as one or more of the predictive weed models generated by model generators 1440, 1441, 1442, 1445, and 1449.
- two or more of the predictive models described above may be combined into a single predictive weed model, such as a predictive weed model that predicts a weed value based upon two or more of the vegetative index values, the optical characteristic values, the weed values, and the other characteristic values at different locations in the field. Any of these weed models, or combinations thereof, are represented collectively by predictive weed model 1450 in FIG. 12 .
- predictive map generator 312 includes a predictive weed map generator 1452.
- predictive map generator 312 may include additional or different map generators.
- predictive map generator 312 may include other items 1456 which may include other types of map generators to generate other types of maps.
- Predictive weed map generator 1452 receives one or more of the vegetative index map 416, the optical map 417, the weed map 418, and an other map 429, along with the predictive weed model 1450 which predicts a weed value based upon one or more of a vegetative index value, an optical characteristic value, a weed value, and an other characteristic value, and generates a predictive map that predicts a weed value at different locations in the field, such as functional predictive weed map 1460.
- Predictive map generator 312 thus outputs a functional predictive weed map 1460 that is predictive of a weed value.
- the functional predictive weed map 1460 is a predictive map 264.
- the functional predictive weed map 1460 predicts a weed value at different locations in a field.
- the functional predictive weed map 1460 may be provided to control zone generator 313, control system 314, or both.
- Control zone generator 313 generates control zones and incorporates those control zones into the functional predictive weed map 1460 to produce a predictive control zone map 265, that is a functional predictive weed control zone map 1461.
- One or both of functional predictive weed map 1460 and functional predictive weed control zone map 1461 may be provided to control system 314, which generates control signals to control one or more of the controllable subsystems 316 based upon the functional predictive weed map 1460, the functional predictive weed control zone map 1461, or both.
- FIG. 13 is a block diagram of a portion of the agricultural material application system architecture 300 shown in FIG. 10 . Particularly, FIG. 13 shows, among other things, examples of the predictive model generator 310 and the predictive map generator 312 in more detail. FIG. 13 also illustrates information flow among the various components shown.
- the predictive model generator 310 receives one or more information map(s) 358.
- information maps 358 include one or more of a soil property map 410, a topographic map 415, vegetative index map 416, a weed map 418, a contamination map 419, or any of a wide variety of other information maps 429.
- Predictive model generator 310 also receives geographic location data 2434, such as an indication of a geographic location, from geographic position sensor 304.
- Geographic location data 2434 illustratively represents the geographic locations to which values detected by in-situ sensors 308 correspond.
- the geographic position of the mobile machine 100, as detected by geographic position sensors 304 will not be the same as the geographic position on the field to which a value detected by in-situ sensors 308 corresponds.
- geographic position sensor 304 can be used to derive a geographic location at the field to which a value a detected by an in-situ sensor 308 corresponds.
- In-situ sensors 308 illustratively include material consumption sensors 376, as well as processing system 338.
- processing system 338 is separate from in-situ sensors 308 (such as the example shown in FIG. 10 ).
- material consumption sensors 376 may be located on-board mobile material application machine 100.
- the processing system 338 processes sensor data generated from material consumption sensors 376 to generate processed sensor data 2430 indicative of material consumption values.
- the example predictive model generator 310 includes a material consumption-to-soil property model generator 2440, a material consumption-to-topographic characteristic model generator 2441, a material consumption-to-vegetative index model generator 2442, a material consumption-to-weed model generator 2443, a material consumption-to-contamination model generator 2444, and a material consumption-to-other characteristic model generator 2445.
- the predictive model generator 310 may include additional, fewer, or different components than those shown in the example of FIG. 13 . Consequently, in some examples, the predictive model generator 310 may include other items 2449 as well, which may include other types of predictive model generators to generate other types of material consumption models.
- Material consumption-to-soil property model generator 2440 identifies a relationship between material consumption value(s) detected in in-situ sensor data 2430, at geographic location(s) to which the material consumption value(s), detected in the in-situ sensor data 2430, correspond, and soil property value(s) from the soil property map 410 corresponding to the same geographic location(s) to which the detected material consumption value(s) correspond. Based on this relationship established by material consumption-to-soil property model generator 2440, material consumption-to-soil property model generator 2440 generates a predictive material consumption model.
- the predictive material consumption model is used by predictive material consumption map generator 2452 to predict a material consumption value at different locations in the field based upon the georeferenced soil property values contained in the soil property map 410 corresponding to the same locations in the field.
- a material consumption value can be predicted at the given location based on the predictive material consumption model and the soil property value, from the soil property map 410, corresponding to that given location.
- Material consumption-to-topographic characteristic model generator 2441 identifies a relationship between material consumption value(s) detected in in-situ sensor data 2430, at geographic location(s) to which the material consumption value(s), detected in the in-situ sensor data 2430, correspond, and topographic characteristic value(s) from the topographic map 415 corresponding to the same geographic location(s) to which the detected material consumption value(s) correspond. Based on this relationship established by material consumption-to-topographic characteristic model generator 2441, material consumption-to-topographic characteristic model generator 2441 generates a predictive material consumption model.
- the predictive material consumption model is used by predictive material consumption map generator 2452 to predict a material consumption value at different locations in the field based upon the georeferenced topographic characteristic values contained in the topographic map 415 corresponding to the same locations in the field.
- a material consumption value can be predicted at the given location based on the predictive material consumption model and the topographic characteristic value, from the topographic map 415, corresponding to that given location.
- Material consumption-to-vegetative index model generator 2442 identifies a relationship between material consumption value(s) detected in in-situ sensor data 2430, at geographic location(s) to which the material consumption value(s), detected in the in-situ sensor data 2430, correspond, and vegetative index value(s) from the vegetative index map 416 corresponding to the same geographic location(s) to which the detected material consumption value(s) correspond. Based on this relationship established by material consumption-to-vegetative index model generator 2442, material consumption-to-vegetative index model generator 2442 generates a predictive material consumption model.
- the predictive material consumption model is used by predictive material consumption map generator 2452 to predict a material consumption value at different locations in the field based upon the georeferenced vegetative index values contained in the vegetative index map 416 corresponding to the same locations in the field.
- a material consumption value can be predicted at the given location based on the predictive material consumption model and the vegetative index value, from the vegetative index map 416, corresponding to that given location.
- Material consumption-to-weed model generator 2443 identifies a relationship between material consumption value(s) detected in in-situ sensor data 2430, at geographic location(s) to which the material consumption value(s), detected in the in-situ sensor data 2430, correspond, and weed value(s) from the weed map 418 corresponding to the same geographic location(s) to which the detected material consumption value(s) correspond. Based on this relationship established by material consumption-to-weed model generator 2443, material consumption-to-weed model generator 2442 generates a predictive material consumption model.
- the predictive material consumption model is used by predictive material consumption map generator 2452 to predict a material consumption value at different locations in the field based upon the georeferenced weed values contained in the weed map 418 corresponding to the same locations in the field.
- a material consumption value can be predicted at the given location based on the predictive material consumption model and the weed value, from the weed map 418, corresponding to that given location.
- Material consumption-to-contamination model generator 2444 identifies a relationship between material consumption value(s) detected in in-situ sensor data 2430, at geographic location(s) to which the material consumption value(s), detected in the in-situ sensor data 2430, correspond, and contamination value(s) from the contamination map 419 corresponding to the same geographic location(s) to which the detected material consumption value(s) correspond. Based on this relationship established by material consumption-to-contamination model generator 2444, material consumption-to-contamination model generator 2444 generates a predictive material consumption model.
- the predictive material consumption model is used by predictive material consumption map generator 2452 to predict a material consumption value at different locations in the field based upon the georeferenced contamination values contained in the contamination map 419 corresponding to the same locations in the field.
- a material consumption value can be predicted at the given location based on the predictive material consumption model and the contamination value, from the contamination map 419, corresponding to that given location.
- Material consumption-to-other characteristic model generator 2445 identifies a relationship between material consumption value(s) detected in in-situ sensor data 2430, at geographic location(s) to which the material consumption value(s), detected in the in-situ sensor data 2430, correspond, and other characteristic value(s) from an other map 429 corresponding to the same geographic location(s) to which the detected material consumption value(s) correspond. Based on this relationship established by material consumption-to-other characteristic model generator 2445, material consumption-to-other characteristic model generator 2445 generates a predictive material consumption model.
- the predictive material consumption model is used by predictive material consumption map generator 2452 to predict a material consumption value at different locations in the field based upon the georeferenced other characteristic values contained in the other map 429 corresponding to the same locations in the field.
- a material consumption value can be predicted at the given location based on the predictive material consumption model and the other characteristic value, from the other map 429, corresponding to that given location.
- the predictive model generator 310 is operable to produce a plurality of predictive material consumption models, such as one or more of the predictive material consumption models generated by model generators 2440, 2441, 2442, 2443, 2444, 2445, and 2449.
- two or more of the predictive models described above may be combined into a single predictive material consumption model, such as a predictive material consumption model that predicts a material consumption value based upon two or more of the soil property values, the topographic characteristic values, the vegetative index values, the weed values, the contamination values, and the other characteristic values at different locations in the field. Any of these material consumption models, or combinations thereof, are represented collectively by predictive material consumption model 2450 in FIG. 13 .
- predictive map generator 312 includes a predictive material consumption map generator 2452.
- predictive map generator 312 may include additional or different map generators.
- predictive map generator 312 may include other items 2456 which may include other types of map generators to generate other types of maps.
- Predictive material consumption map generator 2452 receives one or more of the soil property map 410, the topographic map 415, the vegetative index map 416, the weed map 418, the contamination map 419, and an other map 429, along with the predictive material consumption model 2450 which predicts a material consumption value based upon one or more of a soil property value, a topographic characteristic value, a vegetative index value, a weed value, a contamination value, and an other characteristic value, and generates a predictive map that predicts a material consumption value at different locations in the field, such as functional predictive material consumption map 2460.
- Predictive map generator 312 thus outputs a functional predictive material consumption map 2460 that is predictive of a material consumption value.
- the functional predictive material consumption map 2460 is a predictive map 264.
- the functional predictive material consumption map 2460 predicts a material consumption value at different locations in a field.
- the functional predictive material consumption map 2460 may be provided to control zone generator 313, control system 314, or both.
- Control zone generator 313 generates control zones and incorporates those control zones into the functional predictive material consumption map 2460 to produce a predictive control zone map 265, that is a functional predictive material consumption control zone map 2461.
- One or both of functional predictive material consumption map 2460 and functional predictive material consumption control zone map 2461 may be provided to control system 314, which generates control signals to control one or more of the controllable subsystems 316 based upon the functional predictive material consumption map 2460, the functional predictive material consumption control zone map 2461, or both.
- FIG. 14 is a block diagram of a portion of the agricultural material application system architecture 300 shown in FIG. 10 .
- FIG. 14 shows, among other things, examples of the predictive model generator 310 and the predictive map generator 312 in more detail.
- FIG. 14 also illustrates information flow among the various components shown.
- the predictive model generator 310 receives one or more information map(s) 358.
- information maps 358 can include one or more of the information maps 358 discussed herein, as well as various other types of information maps.
- Predictive model generator 310 also receives geographic location data 3434, such as an indication of a geographic location, from geographic position sensor 304.
- Geographic location data 3434 illustratively represents the geographic locations to which values detected by in-situ sensors 308 correspond.
- the geographic position of the mobile machine 100 will not be the same as the geographic position on the field to which a value detected by in-situ sensors 308 corresponds. It will be appreciated, that the geographic position indicated by geographic position sensor 304, along with timing, machine speed and heading, machine dimensions, machine processing delays, sensor position (e.g., relative to geographic position sensor), sensor parameters (e.g., sensor field of view), as well as various other data, can be used to derive a geographic location at the field to which a value a detected by an in-situ sensor 308 corresponds.
- In-situ sensors 308 illustratively include heading/speed sensors 325, as well as processing system 338.
- processing system 338 is separate from in-situ sensors 308 (such as the example shown in FIG. 10 ).
- heading/speed sensors 325 may be located on-board mobile material application machine 100.
- the processing system 338 processes sensor data generated from heading/speed sensors 325 to generate processed sensor data 3430 indicative of speed characteristic values.
- the example predictive model generator 310 includes a speed characteristic-to-mapped characteristic(s) model generator 2440.
- the predictive model generator 310 may include additional, fewer, or different components than those shown in the example of FIG. 14 . Consequently, in some examples, the predictive model generator 310 may include other items 3449 as well, which may include other types of predictive model generators to generate other types of speed models.
- Speed characteristic-to-mapped characteristic(s) model generator 3440 identifies a relationship between speed characteristic value(s) detected in in-situ sensor data 3430, at geographic location(s) to which the speed characteristic value(s), detected in the in-situ sensor data 3430, correspond, and value(s) of one or more characteristics from the one or more information maps 358 corresponding to the same geographic location(s) to which the detected speed characteristic value(s) correspond. Based on this relationship established by speed characteristic-to-mapped characteristic(s) model generator 3440, speed characteristic-to-mapped characteristic(s) model generator 3440 generates a predictive speed model.
- the predictive speed model is used by predictive speed map generator 3452 to predict a speed characteristic value at different locations in the field based upon the georeferenced values of the one or more characteristics contained in the one or more information maps 358 corresponding to the same locations in the field.
- a speed characteristic value can be predicted at the given location based on the predictive speed model and the value of one or more characteristics, from the one or more information maps 358, corresponding to that given location.
- the predictive model generator 310 is operable to produce a plurality of predictive speed models, such as one or more of the predictive speed models generated by model generators 3440 and 3449.
- two or more of the predictive models described above may be combined into a single predictive speed model, such as a predictive speed model that predicts a speed characteristic value based upon values of two or more characteristics at different locations in the field. Any of these speed models, or combinations thereof, are represented collectively by predictive speed model 3450 in FIG. 14 .
- predictive map generator 312 includes a predictive speed map generator 3452.
- predictive map generator 312 may include additional or different map generators.
- predictive map generator 312 may include other items 3456 which may include other types of map generators to generate other types of maps.
- Predictive speed map generator 3452 receives one or more of the information maps 358, along with the predictive speed model 3450 which predicts a speed characteristic value based upon a value of one or more characteristics, and generates a predictive map that predicts a speed characteristic value at different locations in the field, such as functional predictive speed map 3460.
- Predictive map generator 312 thus outputs a functional predictive speed map 3460 that is predictive of a speed characteristic value.
- the functional predictive speed map 3460 is a predictive map 264.
- the functional predictive speed map 3460 predicts a speed characteristic value at different locations in a field.
- the functional predictive speed map 3460 may be provided to control zone generator 313, control system 314, or both.
- Control zone generator 313 generates control zones and incorporates those control zones into the functional predictive speed map 3460 to produce a predictive control zone map 265, that is a functional predictive speed control zone map 3461.
- One or both of functional predictive speed map 3460 and functional predictive speed control zone map 3461 may be provided to control system 314, which generates control signals to control one or more of the controllable subsystems 316 based upon the functional predictive speed map 3460, the functional predictive speed control zone map 3461, or both.
- the mobile machine 100 is to be controlled based on a functional predictive map or a functional predictive control zone map, or both, multiple target settings for the same actuator may be possible at a given location.
- the target settings may have different values and may be competing.
- the target settings need to be resolved so that only a single target setting is used to control the actuators.
- the actuator is an actuator in propulsion subsystem 350 that is being controlled in order to control the speed of mobile machine 100
- control zone generator 313 may select one of the competing target settings to control the mobile machine.
- control zone generator 313 may first resolve competing target settings of competing control zones.
- Control zone generator 313 may select the competing settings based on a number of criteria, for example, various performance metrics such as time to complete, job quality, fuel cost, labor cost, etc. may be used.
- time to complete may be input as the highest priority in the hierarchy, and thus the target setting corresponding to time to complete will be selected. This is merely one example.
- characteristics of the information maps 358 used in the generation of the functional predictive map and functional predictive control zone map may have a priority or hierarchy. For example, target settings based on yield values from a yield map may have a higher priority than target settings based on topographic values from a topographic map, and thus, the value corresponding to the yield value will be selected over the values corresponding to the topographic value.
- control zone generator 313 can resolve competing target settings such that the control zone map that is generated and provided for control does not contain competing target settings.
- FIGS. 15A-15B (collectively referred to herein as FIG. 15 ) show a flow diagram illustrating one example of the operation of agricultural material application architecture 300 in generating a predictive model and a predictive map.
- agricultural material application system 300 receives one or more information maps 358. Examples of information maps 358 or receiving information maps 358 are discussed with respect to blocks 504, 505, 507, and 508. As discussed above, information maps 358 map values of a variable, corresponding to a characteristic, to different locations in the worksite, as indicated at block 505. As indicated at block 504, receiving the information maps 358 may involve selecting one or more of a plurality of possible information maps 358 that are available. For instance, one information map 358 may be a soil property map, such as soil property map 410. Another information map 358 may be a yield map, such as yield map 411. Another information map 358 may be a residue map, such as residue map 412.
- Another information map 358 may be a constituents map, such as constituents map 413.
- Another information map 358 may be a seeding map, such as seeding map 414.
- Another information map 358 may be a topographic map, such as topographic map 415.
- Another information map 358 may be a vegetative index map, such as vegetative index map 416.
- Another information map 358 may be an optical map, such as optical map 417.
- Another information map 358 may be a weed map, such as weed map 418.
- Another information map 358 may be a contamination map, such as contamination map 419.
- Information maps 358 may include various other types of information maps that map various other characteristics, such as other maps 429.
- the process by which one or more information maps 358 are selected can be manual, semi-automated, or automated.
- the information maps 358 can be based on data collected prior to a current operation, as indicated by block 506.
- the data may be collected based on aerial images taken during a previous year, or earlier in the current season, or at other times.
- the data may be based on data detected in ways other than using aerial images.
- the data may be collected during a previous operation on the worksite, such an operation during a previous year, or a previous operation earlier in the current season, or at other times.
- the machines performing those previous operations may be outfitted with one or more sensors that generate sensor data indicative of one or more characteristics.
- the information maps 358 may be predictive maps having predictive values.
- the predictive information map 358 can be generated during a current operation by predictive map generator 312 based on a model generated by predictive model generator 310, as indicated by block 506.
- the predictive information map 358 can be predicted in other ways (before or during the current operation), such as based on other measured values.
- the data for the information maps 358 can be obtained by predictive model generator 310 and predictive map generator 312 using communication system 306 and stored in data store 302.
- the data for the information maps 358 can be obtained by material application system 300 using a communication system in other ways as well, and this is indicated by block 507 in the flow diagram of FIG. 15 .
- in-situ sensors 308 generate sensor data indicative of one or more in-situ data values indicative of one or more characteristics, as indicated by block 508.
- nutrient sensors 374 generate sensor data indicative of one or more in-situ nutrient values as indicated by block 509.
- Weed sensors 372 generate sensor data indicative of one or more in-situ weed values as indicated by block 510.
- Material consumption sensors 376 generate sensor data indicative of one or more in-situ material consumption values as indicated by block 511.
- Heading/speed sensors 325 generate sensor data indicative of one or more in-situ speed characteristic values as indicated by block 512.
- data from in-situ sensors 308 is georeferenced using position data from geographic position sensor 304 as well as, in some examples, one or more of heading data, travel speed data, machine latency data, sensor position and parameter data, as well as various other data.
- predictive model generator 310 controls one or more model generators to generate one or more models that model the relationship between mapped values and values sensed by in-situ sensors 308.
- predictive model generator 310 controls one or more of the model generators 441, 442, 443, 444, 445, 446, 448, and 449 to generate a predictive nutrient model that models the relationship between the mapped values, such as one or more of the soil property values, the yield values, the residue values, the constituent values, the seeding characteristic values, the topographic characteristic values, the vegetative index values, and the other characteristic values contained in the respective information map and the in-situ nutrient values sensed by in-situ sensors 308.
- Predictive model generator 310 thus generates a predictive nutrient model, such as predictive nutrient model 450, as indicated by block 514.
- predictive model generator controls one or more of the model generators 1440, 1441, 1442, 1445, and 1449 to generate a predictive weed model that models the relationship between the mapped values, such as one or more of the vegetative index values, the optical characteristic values, the weed values, and the other characteristic values contained in the respective information map and the in-situ weed values sensed by in-situ sensors 308.
- Predictive model generator 310 thus generates a predictive weed model, such as predictive weed model 1450, as indicated by block 515.
- predictive model generator controls one or more of the model generators 2440, 2441, 2442, 2443, 2444, 2445, and 2449 to generate a predictive material consumption model that models the relationship between the mapped values, such as one or more of the soil property values, the topographic characteristic values, the vegetative index values, the weed values, the contamination values, and the other characteristic values contained in the respective information map and the in-situ material consumption values sensed by the in-situ sensors 308.
- Predictive model generator 310 thus generates a predictive material consumption model, such as predictive material consumption model 2450, as indicated by block 516.
- predictive model generator controls one or more of the model generators 3440 and 3449 to generate a predictive speed model that models the relationship between mapped values, such as values of one or more characteristics in one or more information maps 358, and the in-situ speed characteristic values sensed by in-situ sensors 308.
- Predictive model generator 310 thus generates a predictive speed model, such as predictive speed model 3450, as indicated by block 517.
- predictive model generator 310 The relationship(s) or model(s) generated by predictive model generator 310 are provided to predictive map generator 312.
- Predictive map generator 312 controls one or more predictive map generators to generate one or more functional predictive maps based on the relationship(s) or model(s) generated by predictive model generator 310 and one or more of the information maps 358.
- predictive map generator 312 controls predictive nutrient map generator 452 to generate a predictive nutrient map, such as functional predictive nutrient map 460, that predicts nutrient values (or sensor value(s) indictive of nutrient values) at different geographic locations in a worksite at which material application machine 100 is operating using the predictive nutrient model 450 and one or more of the information maps 358, such as one or more of soil property map 410, yield map 411, residue map 412, constituents map 413, seeding map 414, topographic map 415, vegetative index map 416, and an other map 429.
- Generating a predictive nutrient map, such as functional predictive nutrient map 460 is indicated by block 519.
- the functional predictive nutrient map 460 may include two or more different map layers. Each map layer may represent a different data type, for instance, a functional predictive nutrient map 460 that provides two or more of a map layer that provides predictive nutrient values based on soil property values from soil property map 410, a map layer that provides predictive nutrient values based on yield values from yield map 411, a map layer that provides predictive nutrient values based on residue values from residue map 412, a map layer that provides predictive nutrient values based on constituent values from constituents map 413, a map layer that provides predictive nutrient values based on seeding characteristic value from seeding map 414, a map layer that provides predictive nutrient values based on topographic characteristic values from topographic map 415, a map layer that provides predictive nutrient values based on vegetative index values from vegetative index map, and a map layer that provides predictive nutrient values based on other characteristic values from an other map 429.
- a functional predictive nutrient map 460 that provides two or
- the functional predictive nutrient map 460 may include a map layer that provides predictive nutrient values based on two or more of soil property values from soil property map 410, yield values from yield map 411, residue values from residue map 412, constituent values from constituents map 413, seeding characteristic values from seeding map 414, topographic characteristic values from topographic map 415, vegetative index values from vegetative index map 416, and other characteristic values from an other map 429.
- predictive map generator 312 controls predictive weed map generator 1452 to generate a predictive weed map, such as functional predictive weed map 1460, that predicts weed values (or sensor value(s) indictive of weed values) at different geographic locations in a worksite at which material application machine 100 is operating using the predictive weed model 1450 and one or more of the information maps 358, such as one or more of vegetative index map 416, optical map 417, weed map 418, and an other map 429.
- Generating a predictive weed map, such as functional predictive weed map 1460 is indicated by block 520.
- the functional predictive weed map 1460 may include two or more different map layers. Each map layer may represent a different data type, for instance, a functional predictive weed map 1460 that provides two or more of a map layer that provides predictive weed values based on vegetative index values from vegetative index map 416, a map layer that provides predictive weed values based on optical characteristic values from optical map 417, a map layer that provides predictive weed values based on weed values from weed map 418, and a map layer that provides predictive weed values based on other characteristic values from an other map 429.
- a functional predictive weed map 1460 that provides two or more of a map layer that provides predictive weed values based on vegetative index values from vegetative index map 416, a map layer that provides predictive weed values based on optical characteristic values from optical map 417, a map layer that provides predictive weed values based on weed values from weed map 418, and a map layer that provides predictive weed values based on other characteristic values from an other map 429.
- the functional predictive weed map 1460 may include a map layer that provides predictive weed values based on two or more of vegetative index values from vegetative index map 416, optical characteristic values from optical map 417, weed values from weed map 418, and other characteristic values from an other map 429.
- predictive map generator 312 controls predictive material consumption map generator 2452 to generate a predictive material consumption map, such as functional predictive material consumption map 2460, that predicts material consumption values (or sensor value(s) indictive of material consumption values) at different geographic locations in a worksite at which material application machine 100 is operating using the predictive material consumption model 2450 and one or more of the information maps 358, such as one or more of soil property map 410, topographic map 415, vegetative index map 416, weed map 418, contamination map 419, and an other map 429.
- Generating a predictive material consumption map, such as functional predictive material consumption map 2460 is indicated by block 521.
- the functional predictive material consumption map 2460 may include two or more different map layers. Each map layer may represent a different data type, for instance, a functional predictive material consumption map 2460 that provides two or more of a map layer that provides predictive material consumption values based on soil property values from soil property map 410, a map layer that provides predictive material consumption values based on topographic characteristic values from topographic map 415, a map layer that provides predictive material consumption values based on vegetative index values from vegetative index map 416, a map layer that provides predictive material consumption values based on weed values from weed map 418, a map layer that provides predictive material consumption values based on contamination values from contamination map 419, and a map layer that provides predictive material consumption values based on other characteristic values from an other map 429.
- a functional predictive material consumption map 2460 that provides two or more of a map layer that provides predictive material consumption values based on soil property values from soil property map 410, a map layer that provides predictive material consumption values based on topographic characteristic values from topographic map 415, a map layer
- the functional predictive material consumption map 2460 may include a map layer that provides predictive material consumption values based on two or more of soil property values from soil property map 410, topographic characteristic values from a topographic map 415, vegetative index values from vegetative index map 416, weed values from weed map 418, contamination values from contamination map 419, and other characteristic values from an other map 429.
- predictive map generator 312 controls predictive speed map generator 3452 to generate a predictive speed map, such as functional predictive speed map 3460, that predicts speed characteristic values (or sensor value(s) indictive of speed characteristic values) at different geographic locations in a worksite at which material application machine 100 is operating using the predictive speed model 3450 and one or more of the information maps 358.
- Generating a predictive speed map, such as functional predictive speed map 3460 is indicated by block 522.
- the functional predictive speed map 2460 may include two or more different map layers.
- Each map layer may represent a different data type, for instance, a functional predictive material consumption map 2460 that provides two or more map layers, each map layer providing predictive speed characteristic values based on a respective characteristic, for instance a map layer that provides predictive speed characteristic values based on values of a first characteristic from a first information map 358 and a map layer that provides predictive speed characteristic values based on values of a second characteristic from a second information map 358.
- the functional predictive speed map 3460 may include a map layer that provides predictive speed characteristic values based on values of two or more characteristics, such as a map layer that provides predictive speed characteristic values based on values of a first characteristic from a first information map 358 and values of a second characteristic from a second information map 358.
- predictive map generator 312 configures the functional predictive map(s) (e.g., one or more of 460, 1460, 2460, and 3460) so that the functional predictive map(s) are actionable (or consumable) by control system 314.
- Predictive map generator 312 can provide the functional predictive map(s) to the control system 314 or to control zone generator 313, or both.
- predictive map generator 312 configures one or more of the functional predictive maps so that the one or more functional predictive maps include values that can be read by control system 314, and used as the basis for generating control signals for one or more of the different controllable subsystems 316, as indicated by block 523.
- control zone generator 313 can divide the functional predictive maps into control zones based on the values on the functional predictive maps to generated functional predictive maps with control zones.
- control zone generator 313 can divide the functional predictive nutrient map 460 into control zones based on the values on the functional predictive nutrient map 460 to generate functional predictive nutrient control zone map 461.
- control zone generator 313 can divide the functional predictive weed map 1460 into control zones based on the values on the functional predictive weed map 1460 to generate functional predictive weed control zone map 1461.
- control zone generator 313 can divide the functional predictive material consumption map 2460 into control zones based on the values on the functional predictive material consumption map 2460 to generate functional predictive material consumption control zone map 2461.
- control zone generator 313 can divide the functional predictive speed map 3460 into control zones based on the values on the functional predictive seed map 3460 to generate functional predictive speed control zone map 3461.
- Contiguously-geolocated values that are within a threshold value of one another can be grouped into a control zone.
- the threshold value can be a default threshold value, or the threshold value can be set based on an operator input, based on an input from an automated system, or based on other criteria.
- a size of the zones may be based on a responsiveness of the control system, the controllable subsystems, based on wear considerations, or on other criteria.
- predictive map generator 312 configures one or more of the functional predictive maps (e.g., one or more of 460, 1460, 2460, and 3460) or one or more of the functional predictive control zone maps (e.g., one or more of 461, 1461, 2461, and 3461), or both, for presentation to an operator or other user.
- the functional predictive maps e.g., one or more of 460, 1460, 2460, and 3460
- the functional predictive control zone maps e.g., one or more of 461, 1461, 2461, and 3461
- the presentation of the one or more functional predictive maps or of the one or more functional predictive control zone maps, or both may contain one or more of the predictive values on the one or more functional predictive maps correlated to geographic location, the control zones of the one or more functional predictive control zone maps correlated to geographic location, and settings values or control parameters that are used based on the predicted values on the one or more functional predictive maps or control zones on the one or more functional predictive control zone maps.
- the presentation can, in another example, include more abstracted information or more detailed information.
- the presentation can also include a confidence level that indicates an accuracy with which the predictive values on the one or more functional predictive maps or the control zones on the one or more predictive control zone maps, or both, conform to measured values that may be measured by sensors on material application machine 100 as material application machine 100 operates at the worksite.
- an authentication and authorization system can be provided to implement authentication and authorization processes. For instance, there may be a hierarchy of individuals that are authorized to view and change maps and other presented information.
- an on-board display device may show the maps in near real time locally on the machine, or the maps may also be generated at one or more remote locations, or both.
- each physical display device at each location may be associated with a person or a user permission level.
- the user permission level may be used to determine which display elements are visible on the physical display device and which values the corresponding person may change.
- a local operator of material application machine 100 may be unable to see the information corresponding to the one or more functional predictive maps or the one or more functional predictive control zone maps, or both, or make any changes to machine operation.
- a supervisor such as a supervisor at a remote location, however, may be able to see the one or more functional predictive maps or the one or more functional predictive control zone maps, or both, on the display but be prevented from making any changes.
- a manager who may be at a separate remote location, may be able to see all of the elements on the one or more functional predictive maps or the one or more functional predictive control zone maps, or both, and also be able to change the one or more functional predictive maps or the one or more functional predictive control zone maps, or both.
- the one or more functional predictive maps or the one or more functional predictive control zone maps, or both, accessible and changeable by a manager located remotely may be used in machine control. This is one example of an authorization hierarchy that may be implemented.
- the one or more functional predictive maps or the one or more functional predictive control zone maps, or both can be configured in other ways as well, as indicated by block 526.
- control system 314 detects an input from the geographic position sensor 304 identifying a geographic location of material application machine 100.
- Block 529 represents receipt by the control system 314 of sensor inputs indicative of trajectory or heading of material application machine 100
- block 530 represents receipt by the control system 314 of a speed of material application machine 100.
- Block 531 represents receipt by the control system 314 of other information from various in-situ sensors 308.
- control system 314 generates control signals to control the controllable subsystems 316 (or to other items) based on the one or more functional predictive maps (e.g., one or more of 460, 1460, 2460, and 3460) or the one or more functional predictive control zone maps (e.g., one or more of 461, 1461, 2461, and 3461), or both, and the input from the geographic position sensor 304 and any other in-situ sensors 308.
- control system 314 applies the control signals to the controllable subsystems 316 (or to other items). It will be appreciated that the particular control signals that are generated, and the particular controllable subsystems 316 (or other items) that are controlled, may vary based upon one or more different things.
- control signals that are generated and the controllable subsystems 316 (or other items) that are controlled may be based on the type(s) of the functional predictive map(s) or the functional predictive control zone map(s), or both, that is being used.
- control signals that are generated and the controllable subsystems 316 (or other items) that are controlled and the timing of the control signals can be based on various latencies of material application machine 100 and the responsiveness of the controllable subsystems 316 (or other items).
- communication system controller 329 can provide control signals to control communication system 306 based on the functional predictive map(s) or the functional predictive control zone map(s), or both.
- communication system controller can provide control signals to control communication system 306 to communicate the functional predictive map(s) or functional predictive control zone map(s), or both, or data based thereon to other items of material application system 300.
- interface controller 330 can generate control signals to control an interface mechanism, such as an operator interface mechanism 318 or a user interface mechanisms 364, or both, based on or indicative of the functional predictive map(s) or functional predictive control zone map(s), such as to display the functional predictive map(s) or the functional predictive control zone map(s), or both.
- an interface mechanism such as an operator interface mechanism 318 or a user interface mechanisms 364, or both.
- material application controller 331 can generate control signals to control one or more material application actuators 340 to control application of material (e.g., the amount of material that is applied, whether or not material is applied, etc.) based on the functional predictive map(s) or the functional predictive control zone map(s), or both.
- material e.g., the amount of material that is applied, whether or not material is applied, etc.
- propulsion controller 334 can generate control signals to control propulsion subsystem 350 to control a speed characteristic (e.g., a travel speed, an acceleration, a deceleration, etc.) of material application machine 100 based on the functional predictive map(s) or the functional predictive control zone map(s), or both.
- a speed characteristic e.g., a travel speed, an acceleration, a deceleration, etc.
- path planning controller 335 can generate control signals to control steering subsystem 352 to control a heading of material application machine 100 based on the functional predictive map(s) or the functional predictive control zone map(s), or both.
- logistics module 315 can generate logistics control signals to control one or more controllable subsystems 316 or various other items of material application system 300 based on the functional predictive map(s) or the functional predictive control zone map(s), or both. Logistics module 315 will be discussed in more detail in FIGS. 16-17 .
- Control system 314 can generate any of a number of control signals to control any of a number of items of material application system 300.
- material application system 300 can also detect learning trigger criteria to perform machine learning on one or more of the one or more functional predictive maps (e.g., one or more of 460, 1460, 2460, and 3460), the one or more functional predictive control zone maps (e.g., one or more of 461, 1461, 2461, and 3461), the one or more predictive models (e.g., one or more of 450, 1450, 2450, and 3450), the one or more zones generated by control zone generator 313, the one or more control algorithms implemented by the controllers in the control system 314, and other triggered learning.
- the one or more functional predictive maps e.g., one or more of 460, 1460, 2460, and 3460
- the one or more functional predictive control zone maps e.g., one or more of 461, 1461, 2461, and 3461
- the one or more predictive models e.g., one or more of 450, 1450, 2450, and 3450
- the one or more zones generated by control zone generator 313 the one or
- the learning trigger criteria can include any of a wide variety of different criteria. Some examples of detecting trigger criteria are discussed with respect to blocks 542, 544, 546, 548, and 549.
- triggered learning can involve recreation of a relationship used to generate a predictive model when a threshold amount of in-situ sensor data are obtained from in-situ sensors 308. In such examples, receipt of an amount of in-situ sensor data from the in-situ sensors 308 that exceeds a threshold trigger or causes the predictive model generator 310 to generate a new predictive model that is used by predictive map generator 312.
- Block 542 represents detecting a threshold amount of in-situ sensor data used to trigger creation of one or more new predictive models.
- the learning trigger criteria may be based on how much the in-situ sensor data from the in-situ sensors 308 are changing, such as over time or compared to previous values. For example, if variations within the in-situ sensor data (or the relationship between the in-situ sensor data and the information in the one or more information maps 358) are within a selected range or is less than a defined amount, or below a threshold value, then one or more new predictive models are not generated by the predictive model generator 310. As a result, the predictive map generator 312 does not generate one or more new functional predictive maps, one or more new functional predictive control zone maps, or both.
- the predictive model generator 310 generates one or more new predictive models using all or a portion of the newly received in-situ sensor data that the predictive map generator 312 uses to generate one or more new functional predictive maps which can be provided to control zone generator 313 for the creation of one or more new functional predictive control zone maps.
- variations in the in-situ sensor data can be used as a trigger to cause generation of one or more of one or more new predictive models, one or more new functional predictive maps, and one or more new functional predictive control zone maps.
- the threshold, the range, and the defined amount can be set to default values; set by an operator or user interaction through a user interface; set by an automated system; or set in other ways.
- learning trigger criteria can also be used. For instance, if predictive model generator 310 switches to a different information map (different from the originally selected information map), then switching to the different information map may trigger re-learning by predictive model generator 310, predictive map generator 312, control zone generator 313, control system 314, or other items. In another example, transitioning of material application machine 100 to a different topography, a different control zone, a different region of the worksite, a different area with different grouped characteristics (such as a different crop genotype area) may be used as learning trigger criteria as well.
- an operator 360 or user 366 can also edit the functional predictive map(s) or functional predictive control zone map(s), or both.
- the edits can change a value on the functional predictive map(s), change a size, shape, position, or existence of a control zone on functional predictive control zone map(s), or both.
- Block 546 shows that edited information can be used as learning trigger criteria.
- an operator 360 or user 366 observes that automated control of a controllable subsystem, is not what the operator or user desires. In such instances, the operator 360 or user 366 may provide a manual adjustment to the controllable subsystem reflecting that the operator 360 or user 366 desires the controllable subsystem to operate in a different way than is being commanded by control system 314.
- manual alteration of a setting by the operator or user can cause one or more of predictive model generator 310 to relearn one or more predictive models, predictive map generator 312 to generate one or more new functional predictive maps, control zone generator 313 to generate one or more new control zones on one or more functional predictive maps, and a control system to relearn a control algorithm or to perform machine learning on one or more of the controllers in the control system based upon the adjustment by the operator or user, as shown in block 548.
- Block 549 represents the use of other triggered learning criteria.
- relearning may be performed periodically or intermittently based, for example, upon a selected time interval such as a discrete time interval or a variable time interval, as indicated by block 550.
- one or more of the predictive model generator 310, predictive map generator 312, control zone generator 313, control system 314 performs machine learning to generate new predictive model(s), new functional predictive map(s), new control zone(s), and new control algorithm(s), respectively, based upon the learning trigger criteria.
- the new predictive model(s), the new functional predictive map(s), the new control zone(s), and the new control algorithm(s) are generated using any additional data that has been collected since the last learning operation was performed. Performing relearning is indicated by block 552.
- operation moves from block 552 to block 554 where one or more of the functional predictive map(s), the functional predictive control zone map(s), the predictive model(s), the control zone(s), and the control algorithm(s) are stored.
- the functional predictive map(s), the functional predictive control zone map(s), the predictive model(s), the control zone(s), and the control algorithm(s) may be stored locally on a data store of a machine or stored remotely for later use.
- operation returns to block 523 such that the new functional predictive map(s), the new functional predictive control zone map(s), the new control zone(s), and/or the new control algorithm(s) can be used to control the material application machine 100 or other items of material application system 300, or both.
- FIG. 16 is a block diagram of a portion of agricultural material application system 300 shown in FIG. 10 , in more detail. Particularly, FIG. 16 shows examples of the logistics module 315 in more detail. FIG. 16 also illustrates information flow among the various components shown.
- logistics module 315 receives one or more material consumption maps 602, one or more speed maps 604, one or more functional predictive maps 263, one or more information maps 358, sensor data 606, material application machine dimensional data 608, route data 610, material delivery vehicle data 612, threshold data 614, and various other data 616, such as, but not limited to, other operator or user inputs.
- Material consumption maps 602 can include functional predictive material consumption map 2460, functional predictive material consumption control zone map 2461, as well as other material consumption maps 603, such as other types of predictive material consumption maps or prescriptive material consumption maps.
- Speed maps 604 can include functional predictive speed map 3460, functional predictive speed control zone map 3461, as well as other speed maps 605, such as other types of predictive speed maps or prescriptive speed maps.
- Functional predictive maps 263, in the example illustrated in FIG. 16 can include predictive maps 264, such as functional predictive nutrient map 460 or functional predictive weed map 1460, and predictive maps with control zones 265, such as functional predictive nutrient control zone map 461 or functional predictive weed control zone map 1461.
- Information maps 358 can include any of the information maps 358 discussed herein as well as various other information maps that map values of various other characteristics.
- information maps 358 can also include prescriptive material application maps.
- a prescriptive material application map can be used in the control of machine 100 at the field.
- a prescriptive material application map various machine settings values, such as material application settings (e.g., material application rate settings) across different geographic locations in a field of interest.
- Sensor data 606 includes data generated by or derived from in-situ sensors 308.
- Material application machine dimensional data 608 can include data indicative of the volumetric capacity or weight capacity of the material containers of material application machine 100 (e.g., tanks 107, tanks 110, tanks 112, tanks 234, tanks 255, etc.). Material application machine dimensional data 608 may also include the width of a towed implement, width of a spray boom, a spray nozzle coverage pattern, a spreader throw zone, or any other width associated with material application perpendicular to the direction of travel of the material application machine 100.
- Route data 610 can include data indicative of a planned or prescribed route of material application machine 100 at the field, including data indicative of the route already travelled. Route data 610 can also include data indicative of a route from a location at which a material delivery vehicle 379 is located to the field or to a particular location on the field. In some examples, the route data 610 may be input or provided by an operator or user. In some examples, route data 610 may be output by control system 314, such as by path planning controller 335. In some examples, the route data 610 may be in the form of an information map 358, such as a route map that maps a planned or prescribed route of material application machine 100 at the field.
- Material delivery vehicle data 612 can include data indicative of a location of a material delivery vehicle 379. a heading or speed, or both of material delivery vehicle 363, as well as various other data. Material delivery vehicle 379 may have on-board sensors that provide such data which can be provided to logistics module 315 over network 359.
- Threshold data 614 includes data indicative of various thresholds, such as threshold material empty levels, as well as various other thresholds. Such threshold data can be provided by an operator or user or otherwise generated by control system 314.
- Preferred material delivery location data 615 includes data indicative of preferred or commanded material delivery location(s). That is, location(s) at the worksite where the material delivery vehicle 363 and the material application machine 100 are to be located to perform a material delivery operation. Such locations could include, for example, headlands, ends of rows, outside of the area of the field where material is to be applied, near a field entrance, as well as various other locations.
- Other data 616 can include any of a wide variety of other data, including, but not limited to, various other data provided by operator or user input.
- data store 302 can be stored in a data store, such as data store 302, or a data store at a different location.
- logistics module 315 includes data capture logic 622, material delivery location identifier logic 652, distance logic 653, arrival time logic 654, material empty logic 655, application rate logic 656, speed logic 657, route planning logic 658, display element integration component 659, map generator 660, and can include other items 630 as well.
- Data capture logic 622 itself, includes sensor accessing logic 662, data store accessing logic 664, and can include other items 666 as well.
- Data capture logic 622 captures or obtains data that can be used by other items of logistics module 315.
- Sensor accessing logic 662 can be used by logistics module 315 to obtain or otherwise access sensor data (or values indicative of the sensed variables/characteristics) provided from in-situ sensors 308.
- data store accessing logic 664 can be used by logistics module 315 to obtain or access data stored on data stores, such as data store 302 or other data stores. Upon obtaining the various data, logistics module 315 generates logistics outputs 668 which can be used in the control of material application machine 100 or other items of material application system 300.
- Material empty logic 655 illustratively identifies geographic locations at the field, along the route of material application machine 100, at which one or more material containers of material application machine 100 will be empty or will be empty to a threshold level. Material empty logic 655 can determine the location at which one or more material containers will be empty or empty to a threshold level based on a material consumption map 602, as well as various other data, such as route data 610 and sensor data 606.
- material empty logic 655 can identify a current fill level of one or more containers based on sensor data from in-situ sensors (e.g., fill level sensors 117, 177, 178, 271, etc.), a current location of material application machine 100 (e.g., as indicated by geographic position sensor 304), a current heading of material application machine 100 (e.g., as indicated by heading/speed sensor 325) and can aggregate the material consumption values (e.g., predictive material consumption values), as indicated by a material consumption map 602, along the route of material application machine 100 (as indicated by route data 610) to identify the location at which one or more material containers of material application machine 100 will be empty or empty to a threshold level. For instance, it may be that it is desirable to only allow the material application machine to become empty to a threshold level, rather than completely empty to reduce the risk of operating over ground without applying material.
- in-situ sensors e.g., fill level sensors 117, 177, 178, 271, etc.
- material empty logic 655 may utilize other types of maps.
- logistics module 315 may receive a functional predictive nutrient control zone map 461 or a functional predictive weed control zone map 1461.
- Map 461 or map 1461 may include various machine settings values, such as material application settings (e.g., material application rate settings), along the route of the material application machine 100 which can be used (aggregated) by material empty logic 655 to identify a material empty location.
- material empty logic 655 may utilize an information map 358 in the form of a prescriptive material application map which may include various machine settings values, such as material application settings (e.g., material application rate settings), along the route of the material application machine 100 which can be used (aggregated) by material empty logic 655 to identify a material empty location.
- material application settings e.g., material application rate settings
- Material delivery location identifier logic 652 identifies geographic locations at the field at which material is to be delivered to material application machine 100.
- the material delivery locations may be predetermined locations at the field (e.g., as indicated by preferred material delivery location data 615), such as in headlands or at an area of the field that is not used for agricultural, or an area of the field that is near a field entrance. For instance, it may be desirable to limit compaction (or other deterioration) at the field and thus it may be preferable to have the material application machine 100 travel to a location away from the operating portion of the field to receive material.
- a material delivery vehicle 373 may travel onto the operating portion of the field to deliver material and thus the material delivery location may be a geographic location on the field along the route of the material application machine 100. In some examples, the material delivery location is the same as the material empty location identified by material empty logic 655.
- Distance logic 653 illustratively determines a distance of machine(s) away from a material delivery location. For instance, distance logic 653 can determine the distance of material application machine 100 away from a material delivery location based on the current position of material application machine 100 (e.g., as indicated by geographic position sensor 304) as well as the route of material application machine 100 (e.g., as indicated by route data 610). Distance logic 653 can determine the distance of a material delivery vehicle 379 away from a material delivery location based on the current position of the material delivery vehicle 379 (e.g., as indicated by material delivery vehicle data 612) as well as the route of the material delivery vehicle 379 (e.g., as indicated by route data 610).
- Arrival time logic 654 illustratively identifies a time at which machine(s) will (or can) arrive at a material delivery location. For instance, arrival time logic 654 can determine the time at which the material application machine 100 will (or can) arrive at a material delivery location based on distance between the material application machine 100 and the material delivery location as identified by distance logic 653 as well as speed data of the material application machine 100, for instance speed characteristic values (e.g., predictive speed characteristic values) from a speed map 604, or based on current speed characteristic values of material application machine 100 (e.g., as indicated by heading/speed sensors 325).
- speed characteristic values e.g., predictive speed characteristic values
- Arrival time logic 654 can also identify a time at which a material delivery vehicle 379 will (or can) arrive at a material delivery location based on the distance between the material delivery vehicle 379 and the material delivery location as identified by distance logic 653 as well as speed data of the material delivery vehicle 379, such as speed limits along the route of material delivery machine 379 (e.g., as indicated by route data 610), historical speed of material delivery machine 379 (e.g., as indicated by material delivery vehicle data 612), duration of intermediate stops along the route of the material delivery machine 379 (e.g., stops due to on-road traffic control, stops due to replenishing at other locations, etc.), or current speed of material delivery machine 379 (e.g., as indicated by material delivery vehicle data 612).
- speed data of the material delivery vehicle 379 such as speed limits along the route of material delivery machine 379 (e.g., as indicated by route data 610), historical speed of material delivery machine 379 (e.g., as indicated by material delivery vehicle data 612), duration of intermediate stops along
- logistics module 315 may generate a logistics output 668 to control a material delivery machine 379 to begin traveling to the material delivery location to arrive at the same time or within a threshold amount of time as the time that the material application machine 100 will arrive.
- logistics module 315 may communicate with a material delivery service system 380 to schedule a material delivery based on the arrival time.
- application rate logic 656 will identify an application rate setting to adjust the application rate of material application machine 100 such that material application machine will become empty at the end of a pass. It will be important to note that it may be that application rate logic 656 adjusts the operation rate in a pass that is prior to the pass that material empty logic 655 identifies as the pass in which the material application machine 100 will become empty.
- application rate logic 656 may automatically identify an application rate setting to adjust the application rate of material application machine 100 such that material application machine 100 will become empty at the end of a pass or at the end of the field, regardless of the material empty location identified by material empty logic 655.
- speed logic 657 may identify a speed setting to adjust a speed of material application machine 100 or of material delivery vehicle 379, or both, such that the material application machine 100 and material delivery vehicle 379 arrive at the material delivery location at the same time or within a threshold amount of time of each other. Reducing the speed of a machine 100 may reduce wear, save on fuel costs, as well as provide various other benefits.
- route planning logic 658 may identify a new route for material application machine 100 or for material delivery vehicle 379, or both, such that the material application machine 100 and material delivery vehicle 379 arrive at the material delivery location at the same time or within a threshold amount of time of each other. In this way, downtime can be reduced.
- Map generator 660 illustratively generates one or more logistics maps 661.
- Logistics maps 661 illustratively map the field in which the material application operation is being performed and perhaps surrounding areas of the field.
- Logistics maps 661 may include a variety of display elements (discussed below) and can be used in the control of a material application machine 100 or a material delivery vehicle 379, or both.
- a logistics map 661 may be one of the other maps discussed herein, such as one of the functional predictive maps 263 with logistics display elements integrated into the map.
- Display element integration component 659 illustratively generates one or more display elements, such as material delivery location display elements, material empty location display elements, route display elements, material application machine display elements, material delivery machine display elements, distance display elements, arrival time display elements, as well as various other display elements.
- Display element integration component 659 can integrate the one or more display elements into one or more maps, such as one or more of functional predictive maps 263 or a separate logistics map 661 generated by map generator 661.
- the logistics outputs 668 generated by logistics module 315 can also be updated or otherwise made new according to the updated (or new) functional predictive maps 263.
- logistics module 315 may, based on the updated or new functional predictive maps 263, may generate updated (or new) material empty locations, material delivery locations, distances, arrival times, speed outputs, route outputs, display elements, logistics maps, etc.
- the logistic outputs 668 can be used to control material application machine 100 or material delivery vehicle 379, or both.
- the logistics outputs 668 can be displayed (or provided) on an interface mechanism, such as operator interface mechanism 318 or user interface mechanism 364.
- the logistics outputs 668 can be provided to other items of material application system 300, such as to remote computing systems 368, delivery vehicles 379, and/or delivery services systems 380.
- FIG. 17 is a flow diagram showing one example operation of agricultural material application system 300 in controlling a material application operation, such as by controlling a material application machine 100 or by controlling other items of material application system 300.
- logistics module 315 obtains one or more maps.
- Logistics module 315 can obtain one or more material consumption maps 602 as indicated by block 704.
- Logistics module 315 can obtain one or more speed maps 604, as indicated by block 706.
- Logistics module 315 can obtain one or more other maps, such as other functional predictive maps 263 or information map(s) 358, or both, as indicated by block 709.
- logistics module 315 can obtain one or more of the data items illustrated in FIG. 16 .
- logistics module 315 can obtain sensor data 606.
- logistics module 315 can obtain material application machine dimensional data 608.
- logistics module 315 can obtain receiving route data 610.
- logistics module 315 can obtain material delivery vehicle data 612.
- logistics module 315 can obtain threshold data 614.
- logistics module 315 can obtain preferred material delivery location data 615.
- logistics module 315 can obtain various other data 616.
- logistics module 315 generates one or more logistics outputs 668 based on the data obtained at blocks 702 and block 710.
- material empty logic 655 can generate, as a logistics output 668, a material empty location.
- material delivery location identifier logic 652 can generate, as a logistics output 668, a material delivery location.
- distance logic 653 can generate, as a logistics output 668, one or more distances, such as distance between the material application machine 100 and a material delivery location and a distance between a material delivery vehicle 379 and the material delivery location.
- arrival time logic 654 can generate, as a logistics output 668, one or more arrival times, such as time at which a material application machine 100 will (or can) arrive at material delivery location and a time at which a material delivery vehicle 379 will (or can) arrive at a material delivery location.
- application rate logic 656 can generate, as a logistics output 668, one or more application rate settings which can be used to control one or more material application actuators 340 to control an application rate of material.
- speed logic 657 can generate, as a logistics output 668, one or more speed outputs which can be used to control propulsion subsystem 350 or to control a propulsion subsystem of a material delivery vehicle 379, or both.
- route planning logic 658 can generate, as a logistics output 668, one or more routes which can be used to control steering subsystem 352 or a steering subsystem of a material delivery vehicle 379, or both.
- logistics module 315 can generate, as a logistics output 668, one or more maps with integrated display elements, the display elements generated and integrated into the maps by display element integration component 659.
- the one or more maps may include one or more functional predictive maps 263 with display elements integrated or one or more logistics maps 661 with display elements integrated, or both.
- Logistics module 315 can generate a variety of other logistics outputs, as indicated by block 740.
- control system 314 generate control signals based on the one or more logistics outputs 668.
- control system 314 can generate control signals to control one or more controllable subsystems 316 based on the one or more logistics outputs 668.
- control system 314 can generate control signals to control one or more interface mechanisms (e.g., 318 or 364) to generate displays, alerts, notifications, recommendations, as well as various other indications based on the one or more logistics outputs 668.
- control system 314 can generate various other control signals based on the logistics outputs 668, such as to communicate information to other items of material application system 300 or to control other items of material application system 300.
- the examples herein describe the generation of a predictive model and, in some examples, the generation of a functional predictive map based on the predictive model.
- the examples described herein are distinguished from other approaches by the use of a model which is at least one of multi-variate or site-specific (i.e., georeferenced, such as map-based).
- the model is revised as the work machine is performing an operation and while additional in-situ sensor data is collected.
- the model may also be applied in the future beyond the current worksite.
- the model may form a baseline (e.g., starting point) for a subsequent operation at a different worksite or the same worksite at a future time.
- the revision of the model in response to new data may employ machine learning methods.
- machine learning methods may include memory networks, Bayes systems, decisions trees, Eigenvectors, Eigenvalues and Machine Learning, Evolutionary and Genetic Algorithms, Cluster Analysis, Expert Systems/Rules, Support Vector Machines, Engines/Symbolic Reasoning, Generative Adversarial Networks (GANs), Graph Analytics and ML, Linear Regression, Logistic Regression, LSTMs and Recurrent Neural Networks (RNNSs), Convolutional Neural Networks (CNNs), MCMC, Random Forests, Reinforcement Learning or Reward-based machine learning. Learning may be supervised or unsupervised.
- Model implementations may be mathematical, making use of mathematical equations, empirical correlations, statistics, tables, matrices, and the like. Other model implementations may rely more on symbols, knowledge bases, and logic such as rule-based systems. Some implementations are hybrid, utilizing both mathematics and logic. Some models may incorporate random, non-deterministic, or unpredictable elements. Some model implementations may make uses of networks of data values such as neural networks. These are just some examples of models.
- the predictive paradigm examples described herein differ from non-predictive approaches where an actuator or other machine parameter is fixed at the time the machine, system, or component is designed, set once before the machine enters the worksite, is reactively adjusted manually based on operator perception, or is reactively adjusted based on a sensor value.
- the functional predictive map examples described herein also differ from other map-based approaches.
- an a priori control map is used without any modification based on in-situ sensor data or else a difference determined between data from an in-situ sensor and a predictive map are used to calibrate the in-situ sensor.
- sensor data may be mathematically combined with a priori data to generate control signals, but in a location-agnostic way; that is, an adjustment to an a priori, georeferenced predictive setting is applied independent of the location of the work machine at the worksite. The continued use or end of use of the adjustment, in the other approaches, is not dependent on the work machine being in a particular defined location or region within the worksite.
- the functional predictive maps and predictive actuator control rely on obtained maps and in-situ data that are used to generate predictive models.
- the predictive models are then revised during the operation to generate revised functional predictive maps and revised actuator control.
- the actuator control is provided based on functional predictive control zone maps which are also revised during the operation at the worksite.
- the revisions e.g., adjustments, calibrations, etc.
- the adjustments are applied to one or more areas of a worksite to which an adjustment is determined to be relevant (e.g., such as by satisfying one or more conditions which may result in application of an adjustment to one or more locations while not applying the adjustment to one or more other locations), as opposed to applying a change in a blanket way to every location in a non-selective way.
- the models determine and apply those adjustments to selective portions or zones of the worksite based on a set of a priori data, which, in some instances, is multivariate in nature.
- adjustments may, without limitation, be tied to defined portions of the worksite based on site-specific factors such as topography, soil type, crop variety, soil moisture, as well as various other factors, alone or in combination. Consequently, the adjustments are applied to the portions of the field in which the site-specific factors satisfy one or more criteria and not to other portions of the field where those site-specific factors do not satisfy the one or more criteria.
- the model generates a revised functional predictive map for at least the current location or zone, the unworked part of the worksite, or the whole worksite.
- the system may determine that a detected in-situ characteristic value varies from a predictive value of the characteristic, such as by a threshold amount. This deviation may only be detected in areas of the field where the elevation of the worksite is above a certain level. Thus, the revision to the predictive value is only applied to other areas of the worksite having elevation above the certain level.
- the predictive characteristic value and elevation at the point the deviation occurred and the detected characteristic value and elevation at the point the deviation cross the threshold are used to generate a linear equation.
- the linear equation is used to adjust the predictive characteristic value in areas of the worksite (which have not yet been operated on in the current operation, such as areas where material has not yet been applied in the current operation) in the functional predictive map as a function of elevation and the predicted characteristic value.
- the revised functional map is then used to generate a revised functional control zone map for controlling the machine.
- One or more maps of the field are obtained, such as one or more of a soil property map, a yield map, a residue map, a constituents map, a seeding map, a topographic map, a vegetative index map, and another type of map.
- In-situ sensors generate sensor data indicative of in-situ characteristic values, such as in-situ nutrient values
- a predictive model generator generates one or more predictive models based on the one or more obtained maps and the in-situ sensor data, such as a predictive nutrient model.
- a predictive map generator generates one or more functional predictive maps based on a model generated by the predictive model generator and the one or more obtained maps.
- the predictive map generator may generate a functional predictive nutrient map that maps predictive nutrient values to one or more locations on the worksite based on a predictive nutrient model and the one or more obtained maps.
- Control zones which include machine settings values, can be incorporated into the functional predictive nutrient map to generate a functional predictive nutrient map with control zones.
- One or more maps of the field are obtained, such as one or more of a vegetative index map, an optical map, a weed map, and another type of map.
- In-situ sensors generate sensor data indicative of in-situ characteristic values, such as in-situ weed values
- a predictive model generator generates one or more predictive models based on the one or more obtained maps and the in-situ sensor data, such as a predictive weed model.
- a predictive map generator generates one or more functional predictive maps based on a model generated by the predictive model generator and the one or more obtained maps.
- the predictive map generator may generate a functional predictive weed map that maps predictive weed values to one or more locations on the worksite based on a predictive weed model and the one or more obtained maps.
- Control zones which include machine settings values, can be incorporated into the functional predictive weed map to generate a functional predictive weed map with control zones.
- One or more maps of the field are obtained, such as one or more of a soil property map, a topographic map, a vegetative index map, a weed map, a contamination map, and another type of map.
- In-situ sensors generate sensor data indicative of in-situ characteristic values, such as in-situ material consumption values
- a predictive model generator generates one or more predictive models based on the one or more obtained maps and the in-situ sensor data, such as a predictive material consumption model.
- a predictive map generator generates one or more functional predictive maps based on a model generated by the predictive model generator and the one or more obtained maps.
- the predictive map generator may generate a functional predictive material consumption map that maps predictive material consumption values to one or more locations on the worksite based on a predictive material consumption model and the one or more obtained maps.
- Control zones which include machine settings values, can be incorporated into the functional predictive material consumption map to generate a functional predictive material consumption map with control zones.
- One or more maps of the field are obtained.
- In-situ sensors generate sensor data indicative of in-situ characteristic values, such as in-situ speed characteristic values
- a predictive model generator generates one or more predictive models based on the one or more obtained maps and the in-situ sensor data, such as a predictive speed model.
- a predictive map generator generates one or more functional predictive maps based on a model generated by the predictive model generator and the one or more obtained maps.
- the predictive map generator may generate a functional predictive speed map that maps predictive speed characteristic values to one or more locations on the worksite based on a predictive speed model and the one or more obtained maps.
- Control zones which include machine settings values, can be incorporated into the functional predictive speed map to generate a functional predictive speed map with control zones.
- a learning trigger criteria can be detected, such as threshold amount of additional in-situ sensor data being collected, a magnitude of change in a relationship (e.g., the in-situ characteristic values varies to a certain [e.g., threshold] degree from a predictive value of the characteristic), and operator or user makes edits to the predictive map(s) or to a control algorithm, or both, a certain (e.g., threshold) amount of time elapses, as well as various other learning trigger criteria.
- the predictive model(s) are then revised based on the additional in-situ sensor data and the values from the obtained maps.
- the functional predictive maps or the functional predictive control zone maps, or both, are then revised based on the revised model(s) and the values in the obtained maps.
- processors and servers include computer processors with associated memory and timing circuitry, not separately shown. They are functional parts of the systems or devices to which they belong and are activated by and facilitate the functionality of the other components or items in those systems.
- user interface displays have been discussed.
- the displays can take a wide variety of different forms and can have a wide variety of different user actuatable operator interface mechanisms disposed thereon.
- user actuatable operator interface mechanisms may include text boxes, check boxes, icons, links, drop-down menus, search boxes, etc.
- the user actuatable operator interface mechanisms can also be actuated in a wide variety of different ways. For instance, they can be actuated using operator interface mechanisms such as a point and click device, such as a track ball or mouse, hardware buttons, switches, a joystick or keyboard, thumb switches or thumb pads, etc., a virtual keyboard or other virtual actuators.
- the user actuatable operator interface mechanisms can be actuated using touch gestures.
- user actuatable operator interface mechanisms can be actuated using speech commands using speech recognition functionality. Speech recognition may be implemented using a speech detection device, such as a microphone, and software that functions to recognize detected speech and execute commands based on the received speech.
- data stores can each be broken into multiple data stores.
- one or more of the data stores may be local to the systems accessing the data stores, one or more of the data stores may all be located remote form a system utilizing the data store, or one or more data stores may be local while others are remote. All of these configurations are contemplated by the present disclosure.
- the figures show a number of blocks with functionality ascribed to each block. It will be noted that fewer blocks can be used to illustrate that the functionality ascribed to multiple different blocks is performed by fewer components. Also, more blocks can be used illustrating that the functionality may be distributed among more components. In different examples, some functionality may be added, and some may be removed.
- any or all of such systems, components, logic and interactions may be implemented by hardware items, such as processors, memory, or other processing components, some of which are described below, that perform the functions associated with those systems, components, or logic, or interactions.
- any or all of the systems, components, logic and interactions may be implemented by software that is loaded into a memory and is subsequently executed by a processor or server or other computing component, as described below.
- Any or all of the systems, components, logic and interactions may also be implemented by different combinations of hardware, software, firmware, etc., some examples of which are described below.
- FIG. 18 is a block diagram of a mobile agricultural material application machine 1000, which may be similar to mobile material application machine 100 shown in FIG. 10 .
- the mobile material application machine 1000 communicates with elements in a remote server architecture 900.
- remote server architecture 900 provides computation, software, data access, and storage services that do not require end-user knowledge of the physical location or configuration of the system that delivers the services.
- remote servers may deliver the services over a wide area network, such as the internet, using appropriate protocols. For instance, remote servers may deliver applications over a wide area network and may be accessible through a web browser or any other computing component.
- Software or components shown in FIG. 10 as well as data associated therewith, may be stored on servers at a remote location.
- the computing resources in a remote server environment may be consolidated at a remote data center location, or the computing resources may be dispersed to a plurality of remote data centers.
- Remote server infrastructures may deliver services through shared data centers, even though the services appear as a single point of access for the user.
- the components and functions described herein may be provided from a remote server at a remote location using a remote server architecture.
- the components and functions may be provided from a server, or the components and functions can be installed on client devices directly, or in other ways.
- FIG. 18 specifically shows that predictive model generator 310, predictive map generator 312, and logistics module 315 may be located at a server location 902 that is remote from the material application machine 1000. Therefore, in the example shown in FIG. 18 , material application machine 1000 accesses systems through remote server location 902. In other examples, various other items may also be located at server location 902, such as predictive model 311, functional predictive maps 263 (including predictive maps 264 and predictive control zone maps 265), control zone generator 313, and processing system 338.
- FIG. 18 also depicts another example of a remote server architecture.
- FIG. 18 shows that some elements of FIG. 10 may be disposed at a remote server location 902 while others may be located elsewhere.
- data store 302 may be disposed at a location separate from location 902 and accessed via the remote server at location 902.
- the elements can be accessed directly by material application machine 1000 through a network such as a wide area network or a local area network; the elements can be hosted at a remote site by a service; or the elements can be provided as a service or accessed by a connection service that resides in a remote location.
- data may be stored in any location, and the stored data may be accessed by, or forwarded to, operators, users or systems.
- wireless telecommunication service coverage is poor or nonexistent
- another machine such as a fuel truck or other mobile machine or vehicle
- the information collection system collects the information from the mobile machine 1000 using any type of ad-hoc wireless connection. The collected information may then be forwarded to another network when the machine containing the received information reaches a location where wireless telecommunication service coverage or other wireless coverage is available.
- a fuel truck may enter an area having wireless communication coverage when traveling to a location to fuel other machines or when at a main fuel storage location. All of these architectures are contemplated herein. Further, the information may be stored on the material application machine 1000 until the material application machine 1000 enters an area having wireless communication coverage. The material application machine 1000, itself, may send the information to another network.
- FIG. 10 may be disposed on a wide variety of different devices.
- One or more of those devices may include an on-board computer, an electronic control unit, a display unit, a server, a desktop computer, a laptop computer, a tablet computer, or other mobile device, such as a palm top computer, a cell phone, a smart phone, a multimedia player, a personal digital assistant, etc.
- remote server architecture 902 may include cybersecurity measures.
- these measures may include encryption of data on storage devices, encryption of data sent between network nodes, authentication of people or processes accessing data, as well as the use of ledgers for recording metadata, data, data transfers, data accesses, and data transformations.
- the ledgers may be distributed and immutable (e.g., implemented as blockchain).
- FIG. 19 is a simplified block diagram of one illustrative example of a handheld or mobile computing device that can be used as a user's or client's handheld device 16, in which the present system (or parts of it) can be deployed.
- a mobile device can be deployed in the operator compartment of material application machine 100, for use in generating, processing, or displaying the maps discussed above.
- FIGS. 20-21 are examples of handheld or mobile devices.
- FIG. 19 provides a general block diagram of the components of a client device 16 that can run some components shown in FIG. 10 , that interacts with them, or both.
- a communications link 13 is provided that allows the handheld device to communicate with other computing devices and under some examples provides a channel for receiving information automatically, such as by scanning. Examples of communications link 13 include allowing communication though one or more communication protocols, such as wireless services used to provide cellular access to a network, as well as protocols that provide local wireless connections to networks.
- SD Secure Digital
- Interface 15 and communication links 13 communicate with a processor 17 (which can also embody processors or servers from other FIGS.) along a bus 19 that is also connected to memory 21 and input/output (I/O) components 23, as well as clock 25 and location system 27.
- processor 17 which can also embody processors or servers from other FIGS.
- bus 19 that is also connected to memory 21 and input/output (I/O) components 23, as well as clock 25 and location system 27.
- I/O components 23 are provided to facilitate input and output operations.
- I/O components 23 for various examples of the device 16 can include input components such as buttons, touch sensors, optical sensors, microphones, touch screens, proximity sensors, accelerometers, orientation sensors and output components such as a display device, a speaker, and or a printer port.
- Other I/O components 23 can be used as well.
- Clock 25 illustratively comprises a real time clock component that outputs a time and date. It can also, illustratively, provide timing functions for processor 17.
- Location system 27 illustratively includes a component that outputs a current geographical location of device 16. This can include, for instance, a global positioning system (GPS) receiver, a LORAN system, a dead reckoning system, a cellular triangulation system, or other positioning system. Location system 27 can also include, for example, mapping software or navigation software that generates desired maps, navigation routes and other geographic functions.
- GPS global positioning system
- Memory 21 stores operating system 29, network settings 31, applications 33, application configuration settings 35, data store 37, communication drivers 39, and communication configuration settings 41.
- Memory 21 can include all types of tangible volatile and non-volatile computer-readable memory devices.
- Memory 21 may also include computer storage media (described below).
- Memory 21 stores computer readable instructions that, when executed by processor 17, cause the processor to perform computer-implemented steps or functions according to the instructions.
- Processor 17 may be activated by other components to facilitate their functionality as well.
- FIG. 20 shows one example in which device 16 is a tablet computer 1100.
- computer 1100 is shown with user interface display screen 1102.
- Screen 1102 can be a touch screen or a pen-enabled interface that receives inputs from a pen or stylus.
- Tablet computer 1100 may also use an on-screen virtual keyboard.
- computer 1100 might also be attached to a keyboard or other user input device through a suitable attachment mechanism, such as a wireless link or USB port, for instance.
- Computer 1100 may also illustratively receive voice inputs as well.
- FIG. 21 is similar to FIG. 20 except that the device is a smart phone 71.
- Smart phone 71 has a touch sensitive display 73 that displays icons or tiles or other user input mechanisms 75. Mechanisms 75 can be used by a user to run applications, make calls, perform data transfer operations, etc.
- smart phone 71 is built on a mobile operating system and offers more advanced computing capability and connectivity than a feature phone.
- FIG. 22 is one example of a computing environment in which elements of FIG. 10 can be deployed.
- an example system for implementing some embodiments includes a computing device in the form of a computer 1210 programmed to operate as discussed above.
- Components of computer 1210 may include, but are not limited to, a processing unit 1220 (which can comprise processors or servers from previous FIGS.), a system memory 1230, and a system bus 1221 that couples various system components including the system memory to the processing unit 1220.
- the system bus 1221 may be any of several types of bus structures including a memory bus or memory controller, a peripheral bus, and a local bus using any of a variety of bus architectures. Memory and programs described with respect to FIG. 10 can be deployed in corresponding portions of FIG. 22 .
- Computer 1210 typically includes a variety of computer readable media.
- Computer readable media may be any available media that can be accessed by computer 1210 and includes both volatile and nonvolatile media, removable and non-removable media.
- Computer readable media may comprise computer storage media and communication media.
- Computer storage media is different from, and does not include, a modulated data signal or carrier wave.
- Computer readable media includes hardware storage media including both volatile and nonvolatile, removable and non-removable media implemented in any method or technology for storage of information such as computer readable instructions, data structures, program modules or other data.
- Computer storage media includes, but is not limited to, RAM, ROM, EEPROM, flash memory or other memory technology, CD-ROM, digital versatile disks (DVD) or other optical disk storage, magnetic cassettes, magnetic tape, magnetic disk storage or other magnetic storage devices, or any other medium which can be used to store the desired information and which can be accessed by computer 1210.
- Communication media may embody computer readable instructions, data structures, program modules or other data in a transport mechanism and includes any information delivery media.
- modulated data signal means a signal that has one or more of its characteristics set or changed in such a manner as to encode information in the signal.
- the system memory 1230 includes computer storage media in the form of volatile and/or nonvolatile memory or both such as read only memory (ROM) 1231 and random access memory (RAM) 1232.
- ROM read only memory
- RAM random access memory
- BIOS basic input/output system
- RAM 1232 typically contains data or program modules or both that are immediately accessible to and/or presently being operated on by processing unit 1220.
- FIG. 22 illustrates operating system 1234, application programs 1235, other program modules 1236, and program data 1237.
- the computer 1210 may also include other removable/non-removable volatile/nonvolatile computer storage media.
- FIG. 22 illustrates a hard disk drive 1241 that reads from or writes to non-removable, nonvolatile magnetic media, an optical disk drive 1255, and nonvolatile optical disk 1256.
- the hard disk drive 1241 is typically connected to the system bus 1221 through a non-removable memory interface such as interface 1240, and optical disk drive 1255 are typically connected to the system bus 1221 by a removable memory interface, such as interface 1250.
- the functionality described herein can be performed, at least in part, by one or more hardware logic components.
- illustrative types of hardware logic components include Field-programmable Gate Arrays (FPGAs), Application-specific Integrated Circuits (e.g., ASICs), Application-specific Standard Products (e.g., ASSPs), System-on-a-chip systems (SOCs), Complex Programmable Logic Devices (CPLDs), etc.
- hard disk drive 1241 is illustrated as storing operating system 1244, application programs 1245, other program modules 1246, and program data 1247. Note that these components can either be the same as or different from operating system 1234, application programs 1235, other program modules 1236, and program data 1237.
- a user may enter commands and information into the computer 1210 through input devices such as a keyboard 1262, a microphone 1263, and a pointing device 1261, such as a mouse, trackball or touch pad.
- Other input devices may include a j oystick, game pad, satellite dish, scanner, or the like.
- These and other input devices are often connected to the processing unit 1220 through a user input interface 1260 that is coupled to the system bus, but may be connected by other interface and bus structures.
- a visual display 1291 or other type of display device is also connected to the system bus 1221 via an interface, such as a video interface 1290.
- computers may also include other peripheral output devices such as speakers 1297 and printer 1296, which may be connected through an output peripheral interface 1295.
- the computer 1210 is operated in a networked environment using logical connections (such as a controller area network - CAN, local area network - LAN, or wide area network WAN) to one or more remote computers, such as a remote computer 1280.
- logical connections such as a controller area network - CAN, local area network - LAN, or wide area network WAN
- remote computers such as a remote computer 1280.
- the computer 1210 When used in a LAN networking environment, the computer 1210 is connected to the LAN 1271 through a network interface or adapter 1270. When used in a WAN networking environment, the computer 1210 typically includes a modem 1272 or other means for establishing communications over the WAN 1273, such as the Internet. In a networked environment, program modules may be stored in a remote memory storage device. FIG. 22 illustrates, for example, that remote application programs 1285 can reside on remote computer 1280.
Landscapes
- Life Sciences & Earth Sciences (AREA)
- Soil Sciences (AREA)
- Environmental Sciences (AREA)
- Engineering & Computer Science (AREA)
- Insects & Arthropods (AREA)
- Pest Control & Pesticides (AREA)
- Wood Science & Technology (AREA)
- Zoology (AREA)
- Catching Or Destruction (AREA)
Abstract
Description
- The present description relates to agriculture. More specifically, the present description relates to agricultural machines and operations which deliver material to a worksite.
- There are a wide variety of different types of agricultural machines. Some agricultural machines apply material, such as fluid or solid material, to a field. For instance, some machines, such as sprayers or dry spreaders, can deliver fluid or solid material, such as fertilizer, herbicide, pesticide, as well as variety of other materials to a field. Some machines, such as agricultural planting machines, can deliver material such as seeds, as well as other material, such as liquid or solid material, for instance, fertilizer.
- The discussion above is merely provided for general background information and is not intended to be used as an aid in determining the scope of the claimed subject matter.
- An information map is obtained by an agricultural system. The information map maps values of a characteristic at different geographic locations in a worksite. An in-situ sensor detects nutrient values as a mobile material application machine operates at the worksite. A predictive map generator generates a predictive map that maps predictive nutrient values at different geographic locations in the worksite based on a relationship between values of the characteristic in the information map and nutrient values detected by the in-situ sensor. The predictive map can be output and used in automated machine control.
- Example 1 is an agricultural material application system comprising:
- a communication system that receives an information map that maps values of a characteristic to different geographic locations in the field;
- a geographic position sensor that detects a geographic location of a mobile material application machine;
- an in-situ sensor that detects a value of a nutrient corresponding to the geographic location;
- a predictive model generator that generates a predictive nutrient model indicative of a relationship between the characteristic and the nutrient based on the value of the nutrient detected by the in-situ sensor corresponding to the geographic location and a value of the characteristic in the information map corresponding to the geographic location; and
- a predictive map generator that generates a functional predictive nutrient map of the field that maps predictive values of the nutrient to the different geographic locations in the field based on the values of the characteristic in the information map and based on the predictive nutrient model.
- Example 2 is the agricultural material application system of any or all previous claims, wherein the predictive map generator configures the functional predictive nutrient map for consumption by a control system that generates control signals to control a controllable subsystem of the mobile material application machine based on the functional predictive nutrient map.
- Example 3 is the agricultural material application system any or all previous claims, wherein the in-situ sensor detects, in detecting the value of the nutrient, a value of a soil nutrient.
- Example 4 is the agricultural material application system any or all previous claims, wherein the in-situ sensor detects, in detecting the value of the nutrient, a value of a plant nutrient.
- Example 5 is the agricultural material application system any or all previous claims, wherein the information map is one of:
- a soil property map that maps, as the values of the characteristic, soil property values to the different geographic locations in the field;
- a yield map that maps, as the values of the characteristic, yield values to the different geographic locations in the field;
- a residue map that maps, as the values of the characteristic, residue values to the different geographic locations in the field;
- a constituents map that maps, as the values of the characteristic, constituent values to the different geographic locations in the field;
- a seeding map that maps, as the values of the characteristic, seeding characteristic values to the different geographic locations in the field;
- a topographic map that maps, as the values of the characteristic, topographic characteristic values to the different geographic locations in the field; or
- a vegetative index map that maps, as the values of the characteristic, vegetative index values to the different geographic locations in the field.
- Example 6 is the agricultural material application system any or all previous claims, wherein the information map comprises two or more information maps, each of the two or more information maps mapping values of a respective characteristic to the different geographic locations in the field,
- wherein the predictive model generator generates, as the predictive nutrient model, a predictive nutrient model indicative of a relationship between the two or more respective characteristics and the nutrient based on the value of the nutrient detected by the in-situ sensor corresponding to the geographic location and the values of the two or more respective characteristics in the two or more information maps corresponding to the geographic location, and
- wherein the predictive map generator generates, as the functional predictive nutrient map, a functional predictive nutrient map that maps predictive values of the nutrient to the different geographic locations in the field based on the values of the two more characteristics in the two or more information maps corresponding to the different geographic locations and the predictive nutrient model.
- Example 7 is the agricultural material application system any or all previous claims and further comprising:
a control system that generates a control signal to control a controllable subsystem of the material application machine based on the functional predictive nutrient map. - Example 8 is the agricultural material application system any or all previous claims, wherein the controllable subsystem comprises a material application actuator and wherein the control signal controls the material application actuator to increase an amount of material applied by the material application machine based on the functional predictive nutrient map.
- Example 9 is the agricultural material application system any or all previous claims, wherein the controllable subsystem comprises a material application actuator and wherein the control signal controls the material application actuator to decrease an amount of material applied by the material application machine based on the functional predictive nutrient map.
- Example 10 is the agricultural material application system any or all previous claims, wherein the controllable subsystem comprises a material application actuator and wherein the control signal controls the material application actuator to activate or deactivate a component of the material application machine based on the functional predictive nutrient map.
- Example 11 is a computer implemented method comprising:
- receiving an information map that maps values of a characteristic to different geographic locations in a field;
- obtaining in-situ sensor data indicative of a value of a nutrient corresponding to a geographic location at the field;
- generating a predictive nutrient model indicative of a relationship between the characteristic and the nutrient; and
- controlling a predictive map generator to generate a functional predictive nutrient map of the field, that maps predictive values of the nutrient to the different locations in the field based on the values of the characteristic in the information map and the predictive nutrient model.
- Example 12 is the computer implemented method any or all previous claims and further comprising:
configuring the functional predictive nutrient map for a control system that generates control signals to control a controllable subsystem on a mobile machine based on the functional predictive nutrient map. - Example 13 is the computer implemented method any or all previous claims and further comprising:
controlling a controllable subsystem of a mobile machine based on the functional predictive nutrient map. - Example 14 is the computer implemented method any or all previous claims, wherein controlling the controllable subsystem comprises controlling a material application actuator to adjust a flow rate of material based on the functional predictive nutrient map.
- Example 15 is the computer implemented method any or all previous claims, wherein controlling the controllable subsystem comprises subsystem comprises controlling a material application actuator to adjust an amount of material applied to the field based on the functional predictive nutrient map.
- Example 16 is a mobile agricultural material application machine, comprising:
- a communication system that receives an information map that maps values of a characteristic to different geographic locations in a field;
- a geographic position sensor that detects a geographic location of the mobile agricultural material application machine;
- an in-situ sensor that detects a nutrient value corresponding to the geographic location;
- a predictive model generator that generates a predictive nutrient model indicative of a relationship between values of the characteristic and nutrient values based on the nutrient value detected by the in-situ sensor corresponding to the geographic location and a value of the characteristic in the information map at the geographic location; and
- a predictive map generator that generates a functional predictive nutrient map of the field, that maps predictive nutrient values to the different locations in the field, based on the values of the characteristic in the information map at those different locations and based on the predictive nutrient model.
- Example 17 is the mobile agricultural material application machine any or all previous claims and further comprising:
a control system that generates a control signal based on the functional predictive nutrient map. - Example 18 is the mobile agricultural machine any or all previous claims, wherein the control system generates the control signal to control an actuator that is controllably actuatable to adjust a rate at which material is applied to the field.
- Example 19 is the mobile agricultural machine any or all previous claims, wherein the control system generates the control signal to control an interface mechanism to generate an indication indicative of the functional predictive nutrient map.
- Example 20 is the mobile agricultural machine any or all previous claims, wherein the control system generates the control signal to control a controllable subsystem of the mobile agricultural material application machine.
- This Summary is provided to introduce a selection of concepts in a simplified form that are further described below in the Detailed Description. This Summary is not intended to identify key features or essential features of the claimed subject matter, nor is it intended to be used as an aid in determining the scope of the claimed subject matter. The claimed subject matter is not limited to implementations that solve any or all disadvantages noted in the background.
-
-
FIG. 1 is a partial pictorial, partial block diagram showing one example of a mobile agricultural material application machine as a mobile agricultural planting machine. -
FIG. 2 is a side view showing one example of a row unit of the mobile agricultural planting machine shown inFIG. 1 -
FIG. 3 is a side view showing another example of a row unit of the mobile agricultural planting machine shown inFIG. 1 . -
FIG. 4 shows an example of a seed metering system. -
FIG. 5 shows an example of a seed delivery system that can be used with a seed metering system. -
FIG. 6 shows another example of a seed delivery system that can be used with a seed metering system. -
FIG. 7 is a partial pictorial, partial block diagram showing one example of a mobile agricultural material application machine as a mobile agricultural sprayer. -
FIG. 8 is a partial pictorial, partial block diagram showing one example of a mobile agricultural material application machine as a mobile agricultural sprayer. -
FIG. 9 shows an example of a material delivery machine. -
FIG. 10 is a block diagram showing some portions of an agricultural material application system, including a mobile agricultural material application machine, in more detail, according to some examples of the present disclosure. -
FIG. 11 is a block diagram showing one example of a predictive model generator and predictive map generator. -
FIG. 12 is a block diagram showing one example of a predictive model generator and predictive map generator. -
FIG. 13 is a block diagram showing one example of a predictive model generator and a predictive map generator. -
FIG. 14 is a block diagram showing one example of a predictive model generator and a predictive map generator. -
FIGS. 15A-15B (collectively referred to herein asFIG. 15 ) show a flow diagram illustrating one example of operation of an agricultural material application system in generating a map. -
FIG. 16 is a block diagram showing one example of a logistics system in more detail. -
FIG. 17 is a flow diagram illustrating one example of operation of an agricultural material application system in controlling a material application operation. -
FIG. 18 is a block diagram showing one example of a mobile material application machine in communication with a remote server environment. -
FIGS. 19-21 show examples of mobile devices that can be used in an agricultural material application system. -
FIG. 22 is a block diagram showing one example of a computing environment that can be used in an agricultural material application system. - For the purposes of promoting an understanding of the principles of the present disclosure, reference will now be made to the examples illustrated in the drawings, and specific language will be used to describe the same. It will nevertheless be understood that no limitation of the scope of the disclosure is intended. Any alterations and further modifications to the described devices, systems, methods, and any further application of the principles of the present disclosure are fully contemplated as would normally occur to one skilled in the art to which the disclosure relates. In particular, it is fully contemplated that the features, components, and/or steps described with respect to one example may be combined with the features, components, and/or steps described with respect to other examples of the present disclosure.
- In some examples, the present description relates to using in-situ data taken concurrently with an operation, such as an agricultural material application operation, in combination with prior or predicted data, such as prior or predicted data represented in a map, to generate a predictive model and a predictive map. In some examples, the predictive map can be used to control a mobile machine, such as a mobile agricultural material application machine or a material delivery machine, or both.
- During an agricultural material application operation material, such as seed, fertilizer, herbicide, pesticide, etc., is delivered to the field. The application of material can be controlled, such as by an operator or user, or by an automated control system, or both. It may be desirable to controllably (e.g., variably) apply material, based on the characteristics of the field. For example, it may be desirable to vary the amount of material applied at a given locations, based on the nutrient levels at those locations. For instance, some locations of the field may have adequate or near adequate nutrient levels, such that no fertilizer or relatively less fertilizer need be applied. In other examples, some locations of the field may have nutrient levels that require the application of more material than expected. In other examples, it may be desirable to vary the amount of material applied at given locations, based on the weed characteristics at those locations. For instance, herbicide may not be required at given location due to lack of weeds at those location, or additional herbicide may be needed where the weeds are particularly intense.
- Applying material as needed based on the field conditions at the time of the operation, as opposed to a blanket application or a prescribed application determined ahead of the operation in the field, may save cost, may reduce environmental impact, as well as result in more effective material use, which may result in higher yields.
- Some current systems may include sensors that detect characteristics indicative of nutrient levels of the field which can be used in the control of material application. However, such systems often include latency, such as due to the sensor feedback delay or due to the machine control delay, which may result in suboptimal material application.
- The present description thus relates to a system that can predict characteristic values, such as nutrient values or weed values, or both, at different locations across the worksite, such that a mobile agricultural material application machine can be proactively controlled.
- In some examples, it may be desirable to know when a material application machine will run out of material. As the operator or user or control system may vary the application throughout the operation it can be difficult to know, a priori, where the machine will run out of material.
- Knowing when and where the machine will run out of material can be useful in planning logistics of the material application operation, such as scheduling or meeting a material delivery vehicle. Efficient scheduling can reduce downtime, as well as provide various other benefits.
- The present description thus relates to a system that can predict material consumption values at different locations across the worksite, such that the material application operation can be proactively controlled.
- In one example, the present description relates to obtaining an information map, such as a soil property map. A soil property map illustratively maps soil property values (which may be indicative of soil type, soil moisture, soil structure, soil salinity, soil pH, soil organic matter, soil contaminant concentration, soil nutrient levels, as well as various other soil properties) across different geographic locations in a field of interest. The soil property maps thus provide geo-referenced soil properties across a field of interest. Soil type can refer to taxonomic units in soil science, wherein each soil type includes defined sets of shared properties. Soil types can include, for example, sandy soil, clay soil, silt soil, peat soil, chalk soil, loam soil, and various other soil types. Soil moisture can refer to the amount of water that is held or otherwise contained in the soil. Soil moisture can also be referred to as soil wetness. Soil structure can refer to the arrangement of solid parts of the soil and the pore space located between the solid parts of the soil. Soil structure can include the way in which individual particles, such as individual particles of sand, silt, and clay, are assembled. Soil structure can be described in terms of grade (degree of aggregation), class (average size of aggregates), and form (types of aggregates), as well as a variety of other descriptions. Soil salinity refers to the amount (e.g., concentration) of salt in the soil. Soil nutrient levels refers to the amounts (e.g., concentrations) of various nutrients of the soil, such as nitrogen. These are merely examples. Various other characteristics and properties of the soil can be mapped as soil property values on a soil property map. The soil property map can be derived in a variety of ways, such as from sensor readings during previous operations at the field of interest, from surveys of the field, such as soil sampling surveys, as well as surveys by aerial machines (e.g., satellites, drones, etc.) that includes sensors that capture sensor information of the field. The soil property map can be generated based on data from remote sources, such as third-party service providers or government agencies, for instance, the USDA Natural Resources Conservation Service (NRCS), the United States Geological Survey (USGS), as well as from various other remote sources. These are merely some examples. The soil property map can be generated in a variety of other ways.
- In one example, the present description relates to obtaining an information map, such as a yield map. A yield map illustratively maps yield values across different geographic locations in a field of interest. The yield map may be based on sensor readings taken during an aerial survey of the field of interest or during a previous operation on the field of interest, or derived from other values, such as vegetative index values. In some examples, the yield map may be a historical yield map that includes historical yield values from a previous harvesting operation, such as the harvesting operation from a prior year or a prior season. These are merely some examples. The yield map can be generated in a variety of other ways.
- In one example, the present description relates to obtaining an information map, such as a residue map. A residue map illustratively maps residue values (which may be indicative of residue amount and residue distribution) across different geographic locations in a field of interest. Residue illustratively refers to vegetation residue, such as remaining vegetation material at the field of interest, such as remaining crop material, as well as material of other plants, such as weeds. The residue map may be derived from sensor readings during a previous operation at the field. For example, the machine performing the previous operation may be outfitted with sensors that detect residue values at different geographic locations in the field. The residue map may be derived from sensor readings from sensors on aerial machine (e.g., satellites, drones, etc.) that survey the field of interest. The sensors may read one or more bands of electromagnetic radiation reflected from the residue material at the field. These are merely some examples. The residue map can be generated in a variety of other ways.
- In one example, the present description relates to obtaining an information map, such as a constituents map. A constituents map illustratively maps constituent values (which may be indicative of constituent levels (e.g., concentrations) of constituents, such as, sugar, starch, fiber, water/moisture, etc., of crop plants) across different geographic locations in a field of interest. The constituent map may be derived from sensor readings during a previous operation at the field. The constituent map may be derived from sensor readings from sensors on aerial machine (e.g., satellites, drones, etc.) that survey the field of interest. The sensors may read one or more bands of electromagnetic radiation reflected from the residue material at the field. These are merely some examples. The constituent map can be generated in a variety of other ways.
- In one example, the present description relates to obtaining an information map, such as a topographic map. A topographic map illustratively maps topographic characteristic values across different geographic locations in a field of interest, such as elevations of the ground across different geographic locations in a field of interest. Since ground slope is indicative of a change in elevation, having two or more elevation values allows for calculation of slope across the areas having known elevation values. Greater granularity of slope can be accomplished by having more areas with known elevation values. As an agricultural machine travels across the terrain in known directions, the pitch and roll of the agricultural machine can be determined based on the slope of the ground (i.e., areas of changing elevation). Topographic characteristics, when referred to below, can include, but are not limited to, the elevation, slope (e.g., including the machine orientation relative to the slope), and ground profile (e.g., roughness). The topographic map can be derived from sensor readings taken during a previous operation on the field of interest or from an aerial survey of the field (such as a plane, drone, or satellite equipped with lidar or other distance measuring devices). In some examples, the topographic map can be obtained from third parties. These are merely some examples. The topographic map can be generated in a variety of other ways.
- In one example, the present description relates to obtaining an information map, such as a seeding map. A seeding map illustratively maps values of seeding characteristics (e.g., seed location, seed spacing, seed population, seed genotype, etc.) across different geographic locations in a field of interest. The seeding map may be derived from control signals used by a planting machine when planting seeds or from sensors on the planting machine that confirm that a seed was metered or planted. The seeding map can be generated based on a prescriptive seeding map that was used in the control of a planting operation. These are merely some examples. The seeding map can be generated in a variety of other ways.
- In one example, the present description relates to obtaining an information map such as a vegetative index map. A vegetative index map illustratively maps georeferenced vegetative index values (which may be indicative of vegetative growth or plant health) across different geographic locations in a field of interest. One example of a vegetive index includes a normalized difference vegetation index (NDVI). There are many other vegetative indices that are within the scope of the present disclosure. In some examples, a vegetive index map be derived from sensor readings of one or more bands of electromagnetic radiation reflected by the plants. Without limitations, these bands may be in the microwave, infrared, visible or ultraviolet portions of the electromagnetic spectrum. A vegetative index map can be used to identify the presence and location of vegetation. In some examples, these maps enable vegetation to be identified and georeferenced in the presence of bare soil, crop residue, or other plants, including crop or other weeds. The sensor readings can be taken at various times, such as during satellite observation of the field of interest, a fly over operation (e.g., manned or unmanned aerial vehicles), sensor readings during a prior operation) at the field of interest, as well as during a human scouting operation. These are merely some examples. The vegetative index map can be generated in a variety of other ways.
- In one example, the present description relates to obtaining a map, such as an optical map. An optical map illustratively maps electromagnetic radiation values (or optical characteristic values) across different geographic locations in a field of interest. Electromagnetic radiation values can be from across the electromagnetic spectrum. This disclosure uses electromagnetic radiation values from infrared, visible light and ultraviolet portions of the electromagnetic spectrum as examples only and other portions of the spectrum are also envisioned. An optical map may map datapoints by wavelength (e.g., a vegetative index). In other examples, an optical map identifies textures, patterns, color, shape, or other relations of data points. Textures, patterns, or other relations of data points can be indicative of presence or identification of vegetation on the field (e.g., crops, weeds, plant matter, such as residue, etc.). Additionally, or alternatively, an optical map may identify the presence of standing water or wet spots on the field. The optical map can be derived using satellite images, optical sensors on flying vehicles such as UAVS, or optical sensors on a ground-based system, such as another machine operating in the field prior to the current operation. In some examples, optical maps may map three-dimensional values as well such as vegetation height when a stereo camera or lidar system is used to generate the map. These are merely some examples. The optical map can be generated in a variety of other ways.
- In one example, the present description relates to obtaining an information map, such as a weed map. A weed map illustratively maps weed values (which may be indicative of weed location, weed presence, weed type, and weed intensity (e.g., density)) across different geographic locations in a field of interest. The weed map may be derived from sensor readings during a previous operation at the field. The weed map may be derived from sensor readings from sensors on aerial machine (e.g., satellites, drones, etc.) that survey the field of interest. The sensors may read one or more bands of electromagnetic radiation reflected from the weed material at the field. The weed map may be derived from various other data, such as optical characteristic data or vegetative index data of the field of interest. These are merely some examples. The weed map can be generated in a variety of other ways.
- In one example, the present description relates to obtaining an information map, such as a contamination map. A contamination map illustratively maps contamination values (which may be indicative of pest presence, pest type, pest intensity (e.g., population), disease presence, disease type, and disease intensity (e.g., prevalence)) across different geographic locations in a field of interest. The contamination map may be derived from sensor readings during a previous operation at the field. The contamination map may be derived from sensor readings from sensors on aerial machine (e.g., satellites, drones, etc.) that survey the field of interest. The sensors may read one or more bands of electromagnetic radiation reflected from the vegetation material (or from the contaminants) at the field. The contamination map may be derived from various other data, such as optical characteristic data or vegetative index data of the field of interest. These are merely some examples. The contamination map can be generated in a variety of other ways.
- In other examples, one or more other types of information maps can be obtained. The various other types of information maps illustratively map values of various other characteristics across different geographic locations in a field of interest.
- The present discussion proceeds, in some examples, with respect to systems that obtain one or more information maps of a worksite (e.g., field) and also use an in-situ sensor to detect a characteristic. The systems generate a model that models a relationship between the values on the one or more obtained maps and the output values from the in-situ sensor. The model is used to generate a predictive map that predicts, for example, values of the characteristic detected by the in-situ sensor to different geographic locations in the worksite. The predictive map, generated during an operation, can be presented to an operator or other user or can be used in automatically controlling a mobile machine, such as a mobile agricultural material application machine or a material delivery machine, or both, during a material application operation.
-
FIG. 1 shows one example of a mobile agriculturalmaterial application machine 100 as a mobile agricultural planting machine 100-1 that includes a towingvehicle 10 and a planting implement 101.FIG. 1 also illustrates that mobile agricultural planting machine 100-1 can include one or more in-situ sensors 308, some of which are shown inFIG. 1 as well as below. For example,FIG. 1 shows that planting machine 100-1 can include one or morefill level sensors 107 that detect a fill level of material intanks 107. Fill level sensors can include float gauges, weight sensors that detect a weight of material intanks 107, emitter sensors that detect a level to which the material is filled, as well as various other types of sensors. Various components of agricultural planting machine 100-1 can be on individual parts of planting implement 101, towingvehicle 10, or can be distributed in various ways across both the planting implement 101 and towingvehicle 10.FIG. 1 , also illustrates that towing vehicle can include, among other things,operator interface mechanisms 318 which can be used by an operator to manipulate and control agricultural planting machine 100-1. - As shown, planting implement 101 is a row crop planter. In other examples, other types of planting machines can be used, such as air seeders. Planting implement 101 illustratively includes a
toolbar 102 that is part of aframe 104.FIG. 1 also shows that a plurality ofplanting row units 106 are mounted to thetoolbar 102. Planting implement 101 can be towed behind towingvehicle 10, such as a tractor.FIG. 1 shows that material, such as seed, fertilizer, etc. can be stored in atank 107 and pumped, using one ormore pumps 115, through supply lines to therow units 106. The seed, fertilizer, etc., can also be stored on therow units 106 themselves. As shown in the illustrated example ofFIG. 1 , each row unit can include a respective controller(s) 135 which can be used to control operating parameters of eachrow unit 106. In other examples, centralized controllers can control therow units 106. -
FIG. 2 is a side view showing one example of arow unit 106. In the example shown inFIG. 2 ,row unit 106 illustratively includes achemical tank 110 and aseed storage tank 112. It also illustratively includes a furrow opener 114 (e.g., opening disks) that opens a furrow infield 107, a set ofgauge wheels 116, and a furrow closer 118 (e.g., closing wheels) thatclose furrow 162. Seeds fromtank 112 are fed by gravity into aseed meter 124. Theseed meter 124 controls the rate which seeds are dropped into aseed tube 120 or other seed delivery system, such as a brush belt or flighted brush belt (both shown below) fromseed storage tank 112. The seeds can be sensed by aseed sensor 122. An actuator, such as motor, can be used to control the speed ofseed meter 124 to control the rate at which seeds are delivered to thefurrow 162. - Some parts of the
row unit 106 will now be discussed in more detail. First, it will be noted that there are different types ofseed meters 124, and the one that is shown is shown for the sake of example only and is described in greater detail below. For instance, in one example, eachrow unit 106 need not have its own seed meter. Instead, metering or other singulation or seed dividing techniques can be performed at a central location, for groups ofrow units 106. The metering systems can include rotatable disks, rotatable concave or bowl-shaped devices, among others. The seed delivery system can be a gravity drop system (such asseed tube 120 shown inFIG. 2 ) in which seeds are dropped through theseed tube 120 and fall (via gravitational force) through the seed tube and out theoutlet end 121 into the furrow (or seed trench) 162. Other types of seed delivery systems are assistive systems, in that they do not simply rely on gravity to move the seed from the metering system into the ground. Instead, such systems actively capture the seeds from the seed meter and physically move the seeds from the meter to a lower opening where the exit into the ground or trench. Some examples of these assistive systems are described in greater detail below. -
FIG. 2 also shows an actuator 109 in a plurality of possible locations (109A, 109B, 109C, 109D, and 109E). Actuator 109 (e.g., pump) pumps material (such as fertilizer) fromtank 107 throughsupply line 111 so the material can be dispensed in or near the furrows. In such an example, a controller can generate a control signal to control the actuation of pump 109. In other examples, actuators 109 are controllable valves and one ormore pumps 115 pump the material from tank(s) 107 to actuators 109 throughsupply line 111. In other examples, actuators control the delivery of material from other tanks, such astank 110. In such an example, a controller controls the actuator by generating valve or actuator control signals. The control signal for each valve or actuator 109 can, in one example, be a pulse width modulated control signal. The flow rate through the corresponding actuator 109 can be based on the duty cycle of the control signal (which controls the amount of time the valve is open and closed). It can be based on multiple duty cycles of multiple valves or based on other criteria. Further, the material can be applied in varying rates on a per-seed or per-plant basis. For example, material may be applied at one rate when it is being applied at a location spaced from a seed location and at a second, higher, rate when it is being applied closer to the seed location. In other examples, the material may be applied based on various characteristics of the field, such as the nutrient levels, weed characteristics, as well as various other characteristics. These are examples only. - Additionally,
FIG. 2 shows a flow rate sensor 199 in a plurality of possible locations (199A, 199B, 199C, 199D, and 199E). Flow rate sensor 199 can detect a volumetric flow rate of material flowing throughsupply line 111. - Additionally,
FIG. 2 shows that rowunit 106 can include one or more fill level sensors, such as afill level sensor 177 and afill level sensor 178.Fill level sensor 177 illustratively detects a fill level oftank 110.Fill level sensor 178 illustratively detects a fill level oftank 112.Fill level sensors tanks - In the example of shown in
FIG. 2 , material is passed, e.g., pumped or otherwise forced, throughsupply line 111 to an inlet end of actuator 109. Actuator 109 is controlled by a controller (e.g., 135) to allow the liquid to pass from the inlet end of actuator 109 to an outlet end. As material passes through actuator 109, it travels through anapplication assembly 169 from a proximal end (which is attached to an outlet end of actuator 109) to a distal tip (or application tip) 119, where the liquid is discharged into a trench, or proximate a trench or furrow 162 (e.g., on the surface offield 107 next to trench or furrow 162 but not in trench or furrow 162), opened bydisc opener 114. - A downforce generator or
actuator 126 is mounted on acoupling assembly 128 that couplesrow unit 106 totoolbar 102.Downforce actuator 126 can be a hydraulic actuator, a pneumatic actuator, a spring-based mechanical actuator or a wide variety of other actuators. In the example shown inFIG. 2 , arod 130 is coupled to aparallel linkage 132 and is used to exert an additional downforce (in the direction indicated by arrow 134) onrow unit 106. The total downforce (which includes the force indicated byarrow 134 exerted byactuator 126, plus the force due to gravity acting on therow unit 106, and indicated by arrow 136) is offset by upwardly directed forces acting on closing wheels 118 (fromground 138 and indicated by arrow 140) and double disk opener 114 (again fromground 138 and indicated by arrow 142). The remaining force (the sum of the force vectors indicated byarrows arrows 140 and 142) and the force on any other ground engaging component on the row unit (not shown), is the differential force indicated byarrow 146. The differential force may also be referred to herein as downforce margin. The force indicated byarrow 146 acts on thegauge wheels 116. This load can be sensed by a gaugewheel load sensor 159 which may located anywhere onrow unit 106 where it can sense that load. It can also be placed where may not sense the load directly, but a characteristic indicative of that load. For example, it can be disposed near a set of gauge wheel control arms (or gauge wheel arm) 148 that movably mount gauge wheels toshank 152 and control an offset betweengauge wheels 116 and the disks indouble disk opener 114 to control planting depth. Percent ground contact is a measure of a percentage of time that the load (downforce margin) on thegauge wheels 116 is zero (indicating that the gauge wheels are out of contact with the ground). The percent ground contact is calculated on the basis of sensor data provided by the gaugewheel load sensor 159. - In addition, there may be other separate and controllable downforce actuators, such as one or more of a closing wheel downforce actuator 153 that controls the downforce exerted on closing
wheels 118. Closing wheel downforce actuator 153 can be a hydraulic actuator, a pneumatic actuator, a spring-based mechanical actuator or a wide variety of other actuators. The downforce exerted by closing wheel downforce actuator 153 is represented byarrow 137. It will be understood that eachrow unit 106 can include the various components described with reference toFIGS. 2-6 . - In the illustrated example, arms (or gauge wheel arms) 148 illustratively abut a mechanical stop (or arm contact member or wedge) 150. The position of
mechanical stop 150 relative toshank 152 can be set by a plantingdepth actuator assembly 154.Control arms 148 illustratively pivot aroundpivot point 156 so that, as plantingdepth actuator assembly 154 actuates to change the position ofmechanical stop 150, the relative position ofgauge wheels 116, relative to thedouble disk opener 114, changes, to change the depth at which seeds are planted. - In operation,
row unit 106 travels generally in the direction indicated byarrow 160. Thedouble disk opener 114 opens thefurrow 162 in thesoil 138, and the depth of thefurrow 162 is set by plantingdepth actuator assembly 154, which, itself, controls the offset between the lowest parts ofgauge wheels 116 anddisk opener 114. Seeds are dropped throughseed tube 120 into thefurrow 162 and closingwheels 118 close the soil. - As the seeds are dropped through
seed tube 120, they can be sensed byseed sensor 122. Some examples ofseed sensor 122 are an optical sensor or a reflective sensor, and can include a radiation transmitter and a receiver. The transmitter emits electromagnetic radiation and the receiver the detects the radiation and generates a signal indicative of the presences or absences of a seed adjacent to the sensor. These are just some examples of seed sensors.Row unit controller 335 may control the actuators 109 and/or pumps 115 based on the seed sensor signal to controllably apply material relative to the seed locations in thefurrow 162. - Also, as shown in
FIG. 2 ,row unit 106 can include, as in-situ sensors 308, one or moreobservation sensor systems 151.Observation sensor systems 151 may include one or more sensors that detect one or more characteristics such as soil nutrient levels, weed characteristics, as well as various other characteristics. In one example, anobservation sensor system 151, such as theobservation sensor system 151 disposed betweenopener 114 and closer 118 can detect characteristic of the furrow as well as of the field proximate the furrow.Observation sensor systems 151 may include one or more of an imaging system (e.g., stereo or mono camera), optical sensors, radar, lidar, ultrasonic sensors, infrared or thermal sensors, as well as a variety of other sensors. In some examples, anobservation sensor system 151 may detects seeds infurrow 162. Planting implement 101 can also include anobservation sensor system 151 disposed to observe in front ofopener 114, such as theobservation sensor system 151 shown mounted totoolbar 102. In other examples,observation sensor systems 151 can be mounted to various other locations of agricultural planting machine 100-1, such as various other locations on planting implement 101 or towingvehicle 10, or both. -
FIG. 3 is similar toFIG. 2 , and similar items are similarly numbered. However, instead of the seed delivery system being aseed tube 120 which relies on gravity to move the seed to thefurrow 162, the seed delivery system shown inFIG. 4 is an assistiveseed delivery system 166. Assistiveseed delivery system 166 also illustratively has aseed sensor 122 disposed therein. Assistiveseed delivery system 166 captures the seeds as they leaveseed meter 124 and moves them in a direction indicated byarrow 168 towardfurrow 162.System 166 has anoutlet end 170 where theseeds exit system 166 intofurrow 162 where they again reach their final seed position.System 166 may driven at variable speeds by an actuator, such as a variable motor, which can be controlled by a controller (e.g., 135). The controller may control the speed ofsystem 166 based on various characteristics, such as nutrient levels, weed characteristics, etc. The controller may control the actuator 109 to dispense material based on the seed sensor signal fromseed sensor 122 as well as the speed at whichsystem 166 is driven. The controller may control the actuator 109 based on various other characteristics, such as nutrient levels, weed characteristics, etc. -
FIG. 3 also shows thatrow unit 106 can include a sensor 170that interacts with the soil to detect various characteristics, such as nutrient levels of the soil. For instance, sensor 172 can be in the form of a probe that detects nutrient levels of the soil (such as the amount, or concentration, of various nutrients such as nitrogen, phosphorus, potassium, organic matter, etc.). In another example, sensor 172 can be in the form of a electromagnetic sensor that detects the capability of the soil to conduct or accumulate electrical charge, such as a capacitive sensor. -
FIG. 4 shows one example of a rotatable mechanism that can be used as part of the seed metering system (or seed meter) 124. The rotatable mechanism includes a rotatable disc, or concave element, 179.Concave element 179 has a cover (not shown) and is rotatably mounted relative to the frame ofrow unit 106. Rotatableconcave element 179 is driven by an actuator, such as a motor (not shown inFIG. 4 ), and has a plurality of projections ortabs 182 that are closely proximatecorresponding apertures 184. Aseed pool 186 is disposed generally in a lower portions of an enclosure formed by rotatingconcave element 179 and its corresponding cover. Rotatableconcave element 179 is rotatably driven by its motor (such as an electric motor, a pneumatic motor, a hydraulic motor, etc.) for rotation generally in the direction indicated byarrow 188, about a hub. A pressure differential is introduced into the interior of the metering mechanism so that the pressure differential influences seeds fromseed pool 186 to be drawn to apertures 184. For instance, a vacuum can be applied to draw the seeds fromseed pool 186 so that they come to rest inapertures 184, where the vacuum holds them in place. Alternatively, a positive pressure can be introduced into the interior of the metering mechanism to create a pressure differential acrossapertures 184 to perform the same function. - Once a seed comes to rest in (or proximate) an
aperture 184, the vacuum or positive pressure differential acts to hold the seed within theaperture 184 such that the seed is carried upwardly generally in the direction indicated byarrow 188, fromseed pool 186, to aseed discharge area 190. It may happen that multiple seeds are residing in an individual seed cell. In that case, a set of brushes orother members 194 that are located closely adjacent the rotating seed cells tend to remove the multiple seeds so that only a single seed is carried by each individual cell. Additionally, aseed sensor 193 can also illustratively be mounted adjacent torotating element 181.Seed sensor 193 detects and generates a signal indicative of seed presence. - Once the seeds reach the
seed discharge area 190, the vacuum or other pressure differential is illustratively removed, and a positive seed removal wheel or knock-out wheel 191, can act to remove the seed from the seed cell.Wheel 191 illustratively has a set ofprojections 195 that protrude at least partially intoapertures 184 to actively dislodge the seed from those apertures. When the seed is dislodged (such as seed 171), it is illustratively moved by theseed tube 120, seed delivery system 166 (some examples of which are shown above and below) to thefurrow 162 in the ground. -
FIG. 5 shows an example where therotating element 181 is positioned so that itsseed discharge area 190 is above, and closely proximate, assistiveseed delivery system 166. In the example shown inFIG. 5 , assistiveseed delivery system 166 includes a transport mechanism such as abelt 200 with a brush that is formed of distally extendingbristles 202 attached to belt 200 that act as a receiver for the seeds.Belt 200 is mounted aboutpulleys pulleys FIG. 5 ), which can be an electric motor, a pneumatic motor, a hydraulic motor, etc.Belt 200 is driven generally in the direction indicated byarrow 208 - Therefore, when seeds are moved by rotating
element 181 to theseed discharge area 190, where they are discharged from the seed cells in rotatingelement 181, they are illustratively positioned within thebristles 202 by theprojections 182 that push the seed into the bristles. Assistiveseed delivery system 166 illustratively includes walls that form an enclosure around the bristles, so that, as the bristles move in the direction indicated byarrow 208, the seeds are carried along with them from theseed discharge area 190 of the metering mechanism, to adischarge area 210 either at ground level, or below ground level within a trench or furrow 162 that is generated by thefurrow opener 114 on therow unit 106. - Additionally, a
seed sensor 203 is also illustratively coupled to assistiveseed delivery system 166. As the seeds are moved inbristles 202past sensor 203,sensor 203 can detect the presence or absence of a seed. Some examples ofseed sensor 203 includes an optical sensor or reflective sensor. -
FIG. 6 is similar toFIG. 5 , except thatseed delivery system 166 is not formed by a belt with distally extending bristles. Instead, it is formed by a flighted belt (transport mechanism) in which a set ofpaddles 214 form individual chambers (or receivers), into which the seeds are dropped, from theseed discharge area 190 of the metering mechanism. The flighted belt moves the seeds from theseed discharge area 190 to theexit end 210 of the flighted belt, within the trench orfurrow 162. - There are a wide variety of other types of seed delivery systems as well, that include a transport mechanism and a receiver that receives a seed. For instance, they include dual belt delivery systems in which opposing belts receive, hold and move seeds to the furrow, a rotatable wheel that has sprockets which catch seeds from the metering system and move them to the furrow, multiple transport wheels that operate to transport the seed to the furrow, an auger, among others.
-
FIG. 7 shows one example of a mobile agriculturalmaterial application machine 100 as a mobile agricultural sprayer 100-2 that includes a towingvehicle 240 and a towed spraying implement 224. Though, in other examples, such as the example shown inFIG. 8 , sprayer 100-2 can be self-propelled. Additionally, other types of material application machines are contemplated, such as dry material spreaders.FIG. 7 also shows that mobile agricultural sprayer 100-2 can include one or more in-situ sensors 308, some of which are shown inFIG. 7 as well as below. For example,FIG. 7 shows that sprayer 100-2 can include one or morefill level sensors 271 that detect a fill level of material intanks 234. Fill level sensors can include float gauges, weight sensors that detect a weight of material intanks 234, emitter sensors that detect a level to which the material is filled, as well as various other types of sensors. - Sprayer 100-2 includes a spraying system having one or
more tanks 234 containing one or more materials, such as a liquid materials (e.g., fertilizer, herbicide, pesticide, etc.), that is to be applied tofield 207.Tanks 234 are fluidically coupled tospray nozzles 230 by a delivery system comprising a set of conduits. One or more pumps are configured to pump the product from thetanks 234 through the conduits and throughnozzles 230 to apply the product to thefield 207. In some examples, the fluid pumps are actuated by operation of one or more motors, such as electric motors, pneumatic motors, or hydraulic motors, that drive the pumps. - Spray
nozzles 230 are coupled to, and spaced apart along,boom 220.Boom 220 includesarms center frame 226. Thus,arms FIG. 7 ). Theboom 220, including eacharm tanks 234 by the fluid pumps through a respective conduit of each section. - Each section can include a respective set of one or
more spray nozzles 230. Each section can be activated or deactivated through the actuation of a corresponding controllable actuator, such as a valve, for instance, a section can be deactivated, that is the section or the nozzles of the section, or both, are prevented from receiving fluid, by actuation of a controllable actuator that is upstream of the section or the nozzles, or both. In some examples, the nozzles of the section may each have an associated controllable actuator which can be actuated to activate or deactivate the nozzles. The application rate of product is the rate (volumetric rate) at which product is applied to the field over which sprayer 100-2 travels. The application rate corresponds to a volumetric flow rate of the product from thetanks 234 through thespray nozzles 230. The volumetric flow rate is controlled by operation of actuators (such as fluid pumps or valves), such as by varying the speed of actuation of the pump with an associated motor or by controllably opening and closing a vale. In some examples, a controllable valve that corresponds to each section or to each nozzle, can be operable to reciprocate (e.g., pulse) between a closed state and an open state at variable frequency (e.g., pulse width modulation control) to control the rate at which the product is discharged from the set ofspray nozzles 230 of the respective section or from the respectiveindividual spray nozzle 230. - In the example illustrated in
FIG. 7 , agricultural sprayer 100-2 comprises a towed implement 224 that carries the spraying system, and a towing or support machine 240 (illustratively a tractor, which may be similar to towing vehicle 10) that tows the towed spraying implement 224. Towed implement 224 includes a set ofground engaging elements 243, such as wheels or tracks. Towingmachine 240 includes a set ofground engaging elements 244, such as wheels or tracks. In the example illustrated, towingmachine 240 includes an operator compartment orcab 228, which can include a variety of different operator interface mechanisms (e.g., 318 shown inFIG. 10 ) for controlling sprayer 110-2. - As will be shown in
FIG. 8 , an agricultural sprayer can be self-propelled. That is, rather than being towed by a towing machine, the machine that carries the spraying system also includes propulsion and steering systems. -
FIG. 7 also illustrates that agricultural sprayer 100-2 can include one or moreobservation sensor systems 251.Observation sensors systems 251 can be located at various locations on sprayer 100-2, such as on towingvehicle 240 or implement 224, or both. As illustrated, sprayer 100-2 includes anobservation sensor system 251 on towingvehicle 240 as well as a plurality of observation sensor systems disposed on each ofarm 221 andarm 222 ofboom 220.Observation sensor systems 251 can detect a variety of characteristic at the field, for example, soil nutrients, weed characteristics, as well as a variety of other characteristics.Observation sensor systems 251 may include one or more of an imaging system (e.g., stereo or mono camera), optical sensors, radar, lidar, ultrasonic sensors, infrared or thermal sensors, as well as a variety of other sensors. -
FIG. 8 illustrates one example of an agricultural sprayer 100-3 that is self-propelled as an example mobilematerial application machine 100. InFIG. 8 , sprayer 100-3 has an on-board spraying system, including, among other things, one ormore tanks 255 containing one or more materials (e.g., fertilizer, herbicide, pesticide, etc.) aboom 254, that is carried on amachine frame 256 having anoperator compartment 259, and a set ofground engaging elements 260, such as wheels or tracks.Operator compartment 259 can include a variety of different operator interface mechanisms (e.g., 318 shown inFIG. 10 ) for controlling agricultural sprayer 100-3. Tank(s) 255 are fluidically coupled tospray nozzles 258 by a delivery system comprising a set of conduits. One or more fluid pumps are configured to pump the material from tank(s) 255 through the conduits and throughnozzles 258 to apply the material to the field over which agricultural sprayer 100-3 travels. In some examples, the fluid pumps are actuated by operation of one or more motors, such as electric motors, pneumatic motors, or hydraulic motors, that drive the pumps. - Spray
nozzles 258 are coupled to, and spaced apart along,boom 254.Boom 254 includesarms center frame 266. Thus,arms FIG. 8 ). Theboom 254, including eacharm - Each section can include a respective set of one or
more spray nozzles 258. Each section can be activated or deactivated through the actuation of a corresponding controllable actuator, such as a valve, for instance, a section can be deactivated, that is the section or the nozzles of the section, or both, are prevented from receiving fluid, by actuation of a controllable actuator that is upstream of the section or the nozzles, or both. In some examples, the nozzles of the section may each have an associated controllable actuator which can be actuated to activate or deactivate the nozzles. The application rate of product is the rate (volumetric rate) at which product is applied to the field over which sprayer 100-3 travels. The application rate corresponds to a volumetric flow rate of the product from thetanks 255 through thespray nozzles 258. The volumetric flow rate is controlled by operation of actuators (such as fluid pumps or valves), such as by varying the speed of actuation of the pump with an associated motor or by controllably opening and closing a valve. In some examples, a controllable valve that corresponds to each section or to each nozzle, can be operable to reciprocate (e.g., pulse) between a closed state and an open state at variable frequency (e.g., pulse width modulation control) to control the rate at which the product is discharged from the set ofspray nozzles 258 of the respective section or from the respectiveindividual spray nozzle 258. -
FIG. 8 also shows that agricultural sprayer 100-3 can include one or more in-situ sensors 308, some of which are shown inFIG. 8 as well as below. For example,FIG. 8 shows that sprayer 100-3 can include one or morefill level sensors 271 that detect a fill level of material intanks 255. Fill level sensors can include float gauges, weight sensors that detect a weight of material intanks 255, emitter sensors that detect a level to which the material is filled, as well as various other types of sensors. - Additionally,
FIG. 8 shows that sprayer 100-3 can include one or moreobservation sensor systems 251.Observation sensors systems 251 can be located at various locations on sprayer 100-3. As illustrated, sprayer 100-3 includes anobservation sensor system 251 coupled to the roof (or frame) ofoperator compartment 259 as well as a plurality ofobservation sensor systems 251 disposed on each ofarm 262 andarm 267 ofboom 254.Observation sensor systems 251 can detect a variety of characteristic at the field, for example, soil nutrients, weed characteristics, as well as a variety of other characteristics.Observation sensor systems 251 may include one or more of an imaging system (e.g., stereo or mono camera), optical sensors, radar, lidar, ultrasonic sensors, infrared or thermal sensors, as well as a variety of other sensors. - It will be noted that while various examples of in-
situ sensors 308 are shown inFIGS. 1-8 , a mobile agricultural material application machine 100 (e.g., 100-1, 100-2, 100-3) can include various other types of sensors, some of which will be discussed inFIG. 10 . -
FIG. 9 shows one example of amaterial delivery machine 379.FIG. 9 shows that amaterial delivery machine 379 can include a towing vehicle and towed implement, such as a truck (e.g., semi-truck) 280 and trailer (e.g., semi-trailer) 282. Various other forms of material delivery machines are contemplated herein. For instance, in other examples, thematerial delivery machine 379 may not include a towed implement, instead, the material container may be integrated on the frame (e.g., chassis) of the vehicle. -
Truck 280, as illustrated, includes a power plant 283 (e.g., internal combustion engine, battery and electric motors, etc.), ground engaging elements 285 (e.g., wheels or tracks), and anoperator compartment 287. The operator compartment can include a variety of operator interface mechanisms, which can be similar tooperator interface mechanisms 318 shown inFIG. 10 . In some examples,truck 280 may be autonomous or semi-autonomous.Trailer 282 is coupled to track by way of a connection assembly (e.g., one or more of a hitch, electrical coupling, hydraulic coupling, pneumatic coupling, etc.) and, as illustrated, includesground engaging elements 290, such as wheels or tracks, and amaterial container 292 which includes a volume to store or hold one or more materials (dry or liquid), such as seed, fertilizer, herbicide, pesticide, etc. - In some examples,
material delivery machine 379 can also include a material transfer subsystem (not shown) which can include a conduit (e.g., a chute, a hose, a line, a pipe, etc.) through which material can be conveyed by an actuator such as an auger, a pump, a motor, etc. In other examples, the material transfer subsystem may comprise an actuatable door disposed on the bottom side of thematerial container 292 that is actuatable between an open position and a closed position. These are merely some examples. -
FIG. 10 is a block diagram showing some portions of an agricultural materialapplication system architecture 300.FIG. 3 shows that agricultural materialapplication system architecture 300 includes mobile agricultural material application machine 100 (e.g., 100-1, 100-2, 100-3, etc.). Agriculturalmaterial application system 300 also includes one or moreremote computing systems 368, one or more remote user interfaces 364,network 359, delivery vehicle(s) 379, delivery service system(s) 377, and one or more information maps 358. Mobile agriculturalmaterial application machine 100, itself, illustratively includes one or more processors orservers 301,data store 302,communication system 306, one or more in-situ sensors 308 that sense one or more characteristics at a field concurrent with an operation, and aprocessing system 338 that processes the sensor data (e.g., sensor signals, images, etc.) generated by in-situ sensors 308 to generate processed sensor data. The in-situ sensors 308 generate values corresponding to the sensed characteristics.Mobile machine 100 also includes a predictive model or relationship generator (collectively referred to hereinafter as "predictive model generator 310"), predictive model or relationship (collectively referred to hereinafter as "predictive model 311 "),predictive map generator 312,control zone generator 313,control system 314, one or morecontrollable subsystems 316, and anoperator interface mechanism 318. The mobile machine can also include a wide variety ofother machine functionality 320. - The in-
situ sensors 308 can be on-boardmobile machine 100, remote frommobile machine 100, such as deployed at fixed locations on the worksite or on another machine operating in concert withmobile machine 100, such as an aerial vehicle, and other types of sensors, or a combination thereof. In-situ sensors 308 sense characteristics at the worksite during the course of an operation. In-situ sensors 308 illustratively include one ormore weed sensors 372, one ormore nutrient sensors 374, one or morematerial consumption sensors 376,geographic position sensors 304, heading/speed sensors 325, and can include variousother sensors 328, such as the various other sensors described above. -
Weed sensors 372 illustratively detect values of weed characteristics which can be indicative of weed presence, weed location, weed type, weed intensity, as well as various other weed characteristics.Weed sensors 372 can be located at various locations onmaterial application machine 100 and can be configured to detect weed characteristics at the field ahead ofmaterial application machine 100 or ahead of a given component ofmaterial application machine 100, or both.Weed sensors 372 may include one or more of an imaging system (e.g., stereo or mono camera), optical sensors, radar, lidar, ultrasonic sensors, infrared or thermal sensors, as well as a variety of other sensors. In some examples, weedsensors 372 can be similar toobservation sensors systems Weed sensors 372 can be any of a variety of different types of sensors. -
Nutrient sensors 374 illustratively detect nutrient values. Nutrient values can be indicative of an amount (e.g., concentration) of one or more nutrients in the soil of the field, such as the amount of nitrogen, the amount of potassium, the amount of phosphate, the amount of organic matter, the amount of one or more micronutrients, etc. Thus, in some examples, nutrient values are or include soil nutrient values. Alternatively, or additionally, nutrient values can be indicative of an amount (e.g., concentration) of one or more nutrients in the plants at the field. Nutrients of the plant can include various types of nutrients, such as boron, sulphur, manganese, zinc, magnesium, phosphorus, calcium, iron, copper, molybdenum, potassium, nitrogen, etc. Thus, in some examples, nutrient values are or include plant nutrient values. As can be seen, nutrient values may be soil nutrient values or plant nutrient values, or both. In some examples, the nutrient values may be binary in that they indicate sufficient or deficient levels (e.g., relative to a threshold) rather than a valued amount.Nutrient sensors 374 can be located at various locations onmaterial application machine 100 and can be configured to detect nutrient characteristics (e.g., soil nutrient characteristics or plant nutrient characteristics, or both) at the field ahead ofmaterial application machine 100 or ahead of a given component ofmaterial application machine 100, or both. In some examples,nutrient sensors 374 detect the soil or a characteristic of the soil to detect nutrient values. For instance,nutrient sensors 374 may detect the color of the soil, the thermal characteristics of the soil, the emissivity or absorption of electromagnetic radiation, the capability of the soil to conduct or accumulate electrical charge, as well as various other characteristics. In some examples,nutrient sensors 374 detect the vegetation (e.g., plants) or a characteristic of the vegetation (e.g., plants) at the field to detect nutrient values. For instance,nutrient sensors 374 may detect the plant size, the plant health, the plant coloration, constituents of the plant (e.g., protein, starch, sugar, lignan, etc.), the emissivity or absorption of electromagnetic radiation, characteristics of the components of the plant (e.g., characteristics of the leaves, characteristics of the leaf buds, characteristics of the stalk, etc.), as well as various other characteristics.Nutrient sensors 374 may include one or more of an imaging system (e.g., stereo or mono camera), optical sensors, radar, lidar, ultrasonic sensors, infrared or thermal sensors, soil probes, electromagnetic sensors that detect the capability of the soil to conduct or accumulate electrical charge, as well as a variety of other sensors. In some examples,nutrient sensors 374 can be similar toobservation sensors systems nutrient sensors 374 can be similar tosensor 170. These are merely some examples.Nutrient sensors 374 can be any of a variety of different types of sensors. -
Material consumption sensors 376 illustratively detect material consumption values which can be indicative of the amount of material (e.g., seed, dry or liquid material, fertilizer, herbicide, pesticide, etc.) consumed (e.g., used) bymaterial application machine 100 at the field.Material consumption sensors 374 can be located at various locations on material application machine.Material consumption sensors 374 can include fill level sensors (e.g., 117, 177, 178, 271, etc.) that detect a fill level of a material container, such astanks 107,tanks 110,tanks 112,tanks 234, andtanks 255. In some examples,material consumption sensors 374 can detect a flow rate of material, such as flow sensors (e.g., flow meters) that detect a volumetric flow of material through a delivery line (e.g., 111, or conduits ofboom 220, or conduits ofboom 254, etc.). In some examples,material consumption sensors 374 can provide a count of the material consumed, for example, seed sensors, such asseed sensors observation sensor systems 151 may detect the material consumed, such as an observation sensor system disposed to observe the trench orfurrow 162. In some examples,material consumption sensors 376 can include sensors that detect the operating parameters of one or more actuators, such as the speed (or rate) at which the actuators actuate to control the rate of material. These are merely some examples.Material consumption sensors 376 can be any of a variety of different types of sensors. -
Geographic position sensors 304 illustratively sense or detect the geographic position or location ofmobile machine 100.Geographic position sensors 304 can include, but are not limited to, a global navigation satellite system (GNSS) receiver that receives signals from a GNSS satellite transmitter.Geographic position sensors 304 can also include a real-time kinematic (RTK) component that is configured to enhance the precision of position data derived from the GNSS signal.Geographic position sensors 304 can include a dead reckoning system, a cellular triangulation system, or any of a variety of other geographic position sensors. - Heading/
speed sensors 325 detect a heading and speed at whichmobile machine 100 is traversing the worksite during the operation. This can include sensors that sense the movement of ground-engaging elements (e.g., wheels or tracks), or can utilize signals received from other sources, such asgeographic position sensor 304, thus, while heading/speed sensors 325 as described herein are shown as separate fromgeographic position sensor 304, in some examples, machine heading/speed is derived from signals received fromgeographic positions sensor 304 and subsequent processing. In other examples, heading/speed sensors 325 are separate sensors and do not utilize signals received from other sources. - Other in-
situ sensors 328 may be any of a wide variety of other sensors, including the other sensors described above with respect toFIGS. 1-8 . Other in-situ sensors 328 can be on-boardmobile machine 100 or can be remote frommobile machine 100, such as other in-situ sensors 328 on-board another mobile machine that capture in-situ data of characteristics at the field or sensors at fixed locations throughout the field. The remote data from remote sensors can be obtained bymobile machine 100 viacommunication system 306 overnetwork 359. - In-situ data includes data taken from a sensor on-board the
mobile machine 100 or taken by any sensor where the data are detected during the operation ofmobile machine 100 at a field. -
Processing system 338 processes the sensor data (e.g., signals, images, etc.) generated by in-situ sensors 308 to generate processed sensor data indicative of one or more characteristics. For example, processing system generates processed sensor data indicative of characteristic values based on the sensor data generated by in-situ sensors 308, such as weed values based on sensor data generated byweed sensors 372, nutrient values based on sensor data generated bynutrient sensors 374, and material consumption values based on sensor data generated bymaterial consumption sensors 376.Processing system 338 also processes sensor data generated by other in-situ sensors 308 to generate processed sensor data indicative of other characteristic values, such as machine speed characteristic (travel speed, acceleration, deceleration, etc.) values based on sensor data generated by heading/speed sensors 325, machine heading values based on sensor data generated by heading/speed sensors 325, geographic position (or location) values based on sensor data generated bygeographic position sensors 304, as well as various other values based on sensors signals generated by various other in-situ sensors 328. - It will be understood that
processing system 338 can be implemented by one or more processors or servers, such as processors orservers 301. Additionally,processing system 338 can utilize various sensor signal filtering functionalities, noise filtering functionalities, sensor signal categorization, aggregation, normalization, as well as various other processing functionalities. Similarly,processing system 338 can utilize various image processing functionalities such as, sequential image comparison, RGB, edge detection, black/white analysis, machine learning, neural networks, pixel testing, pixel clustering, shape detection, as well any number of other suitable processing and data extraction functionalities. -
FIG. 10 also shows that anoperator 360 may operatemobile machine 100. Theoperator 360 interacts withoperator interface mechanisms 318. In some examples,operator interface mechanisms 318 may include joysticks, levers, a steering wheel, linkages, pedals, buttons, dials, keypads, user actuatable elements (such as icons, buttons, etc.) on a user interface display device, a microphone and speaker (where speech recognition and speech synthesis are provided), among a wide variety of other types of control devices. Where a touch sensitive display system is provided,operator 360 may interact withoperator interface mechanisms 318 using touch gestures. In some examples, at least someoperator interface mechanisms 318 may be disposed in an operator compartment ofmobile machine 100. In some examples, at least someoperator interface mechanisms 318 may be remote (or separable) frommobile machine 100 but are in communication therewith. Thus, theoperator 360 may be local or remote. These examples described above are provided as illustrative examples and are not intended to limit the scope of the present disclosure. Consequently, other types ofoperator interface mechanisms 318 may be used and are within the scope of the present disclosure. -
FIG. 10 also shows remote users 366 interacting withmobile machine 100 orremote computing systems 368, or both, through user interfaces mechanisms 364 overnetwork 359. In some examples, user interface mechanisms 364 may include joysticks, levers, a steering wheel, linkages, pedals, buttons, dials, keypads, user actuatable elements (such as icons, buttons, etc.) on a user interface display device, a microphone and speaker (where speech recognition and speech synthesis are provided), among a wide variety of other types of control devices. Where a touch sensitive display system is provided, user 366 may interact with user interface mechanisms 364 using touch gestures. These examples described above are provided as illustrative examples and are not intended to limit the scope of the present disclosure. Consequently, other types of user interface mechanisms 364 may be used and are within the scope of the present disclosure. -
Remote computing systems 368 can be a wide variety of different types of systems, or combinations thereof. For example,remote computing systems 368 can be in a remote server environment. Further,remote computing systems 368 can be remote computing systems, such as mobile devices, a remote network, a farm manager system, a vendor system, or a wide variety of other remote systems. In one example,mobile machine 100 can be controlled remotely byremote computing systems 368 or by remote users 366, or both. As will be described below, in some examples, one or more of the components shown being disposed onmobile machine 100 inFIG. 10 can be located elsewhere, such as atremote computing systems 368. -
FIG. 10 also shows that one ormore delivery vehicles 379 can interact with other items in agriculturalmaterial application system 300 overnetwork 359. For instance,communication system 306 of mobile agriculturalmaterial application machine 100 may communicate with one ormore delivery vehicles 379 to provide information such as material delivery locations and material delivery times to schedule material delivery. In another example, material one or more delivery vehicles 379may be controlled, such as bycontrol system 314, to travel to a material delivery location. -
FIG. 10 also shows that one or more delivery service systems 380 can interact with other items in agriculturalmaterial application system 300 overnetwork 359. For instance,communication system 306 of mobile agriculturalmaterial application machine 100 may communicate with material delivery service systems 380 to provide information such as material delivery locations and material delivery times to schedule material delivery. Material delivery service systems 380 can be a wide variety of different types of systems, or combinations thereof. For example, material delivery service systems 380 can be in a remote server environment. Further, material delivery service systems 380 can be remote computing systems, such as mobile devices, a remote network, a vendor system, or a wide variety of other remote systems. -
FIG. 10 also shows thatmobile machine 100 can obtain one or more information maps 358. As described herein, the information maps 358 include, for example, a soil property map, a yield map, a residue map, a constituents map, a seeding map, a topographic map, a vegetative index (VI) map, an optical map, a weed map, a contamination map, as well as various other maps. However, information maps 358 may also encompass other types of data, such as other types of data that were obtained prior to a current operation or a map from a prior operation. In other examples, information maps 358 can be generated during a current operation, such a map generated bypredictive map generator 312 based on apredictive model 311 generated bypredictive model generator 310. - Information maps 358 may be downloaded onto mobile
material application machine 100 overnetwork 359 and stored indata store 302, usingcommunication system 306 or in other ways. In some examples,communication system 306 may be a cellular communication system, a system for communicating over a wide area network or a local area network, a system for communicating over a near field communication network, or a communication system configured to communicate over any of a variety of other networks or combinations of networks.Network 359 illustratively represents any or a combination of any of the variety of networks.Communication system 306 may also include a system that facilitates downloads or transfers of information to and from a secure digital (SD) card or a universal serial bus (USB) card or both. - As described above, the present description relates to the use of models to predict one or more characteristics at the field at which mobile
material application machine 100 is operating. Themodels 311 can be generated bypredictive model generator 310, during the current operation. - In one example,
predictive model generator 310 generates apredictive model 311 that is indicative of a relationship between the values sensed by the in-situ sensors 308 and values mapped to the field by the information maps 358. For example, if theinformation map 358 maps values of a characteristic to different locations in the worksite, and the in-situ sensor 308 are sensing values indicative of a characteristic (e.g., weed values, nutrient values, material consumption values, or speed characteristic values), thenmodel generator 310 generates a predictive model that models the relationship between the values of the mapped characteristic and the values of the sensed characteristic. - In some examples, the
predictive map generator 312 uses the predictive models generated bypredictive model generator 310 to generate functional predictive maps that predict the value of a characteristic, sensed by the in-situ sensors 308, at different locations in the field based upon one or more of the information maps 358. - For example, where the
predictive model 311 is a predictive nutrient model that models a relationship between nutrient values sensed by in-situ sensors 308 and one or more of soil property values from a soil property map, yield values from a yield map, residue values from a residue map, constituent values from a constituents map, seeding characteristic values from a seeding map, topographic characteristic values from a topographic map, vegetative index values from a vegetative index map, and other characteristic values from anotherinformation map 358, thenpredictive map generator 312 generates a functional predictive nutrient map that predicts nutrient values at different locations at the worksite based on one or more of the mapped values at those locations and the predictive nutrient model. - In another example, where the
predictive model 311 is a predictive weed model that models a relationship between weed values sensed by in-situ sensors 308 and one or more of vegetative index values from a vegetative index map, optical characteristic values from an optical map, weed values from a weed map, and other characteristic values from anotherinformation map 358, thenpredictive map generator 312 generates a functional predictive weed map that predicts weed values at different locations at the worksite based on one or more of the mapped values at those locations and the predictive weed model. - In another example, where the
predictive model 311 is a predictive material consumption model that models a relationship between material consumption values sensed by in-situ sensors 308 and one or more of soil property values from a soil property map, weed values from a weed map, contamination values from a contamination map, vegetative index values from a vegetative index map, topographic characteristic values from a topographic map, and other characteristic values from anotherinformation map 358, thenpredictive map generator 312 generates a functional predictive material consumption map that predicts material consumption values at different locations at the worksite based on one or more of the mapped values at those locations and the predictive material consumption model. - In another example, where the
predictive model 311 is a predictive speed model that models a relationship between speed characteristic values sensed by in-situ sensors 308 and values of one or more characteristics from one or more information maps 358, thenpredictive map generator 312 generates a functional predictive speed map that maps predictive speed characteristic values at different locations at the worksite based on or more of the mapped values at those locations and the predictive speed model. - In some examples, the type of values in the functional
predictive map 263 may be the same as the in-situ data type sensed by the in-situ sensors 308. In some instances, the type of values in the functionalpredictive map 263 may have different units from the data sensed by the in-situ sensors 308. In some examples, the type of values in the functionalpredictive map 263 may be different from the data type sensed by the in-situ sensors 308 but have a relationship to the type of data type sensed by the in-situ sensors 308. For example, in some examples, the data type sensed by the in-situ sensors 308 may be indicative of the type of values in the functional predictive map 363. In some examples, the type of data in the functional predictive map 363 may be different than the data type in the information maps 358. In some instances, the type of data in the functionalpredictive map 263 may have different units from the data in the information maps 358. In some examples, the type of data in the functionalpredictive map 263 may be different from the data type in theinformation map 358 but has a relationship to the data type in theinformation map 358. For example, in some examples, the data type in the information maps 358 may be indicative of the type of data in the functionalpredictive map 263. In some examples, the type of data in the functionalpredictive map 263 is different than one of, or both of, the in-situ data type sensed by the in-situ sensors 308 and the data type in the information maps 358. In some examples, the type of data in the functionalpredictive map 263 is the same as one of, or both of, of the in-situ data type sensed by the in-situ sensors 308 and the data type in information maps 358. In some examples, the type of data in the functionalpredictive map 263 is the same as one of the in-situ data type sensed by the in-situ sensors 308 or the data type in the information maps 358, and different than the other. - As shown in
FIG. 10 ,predictive map 264 predicts the value of a sensed characteristic (sensed by in-situ sensors 308), or a characteristic related to the sensed characteristic, at various locations across the worksite based upon one or more information values in one or more information maps 358 at those locations and using apredictive model 311. For example, ifpredictive model generator 310 has generated a predictive model indicative of a relationship between soil property values and values of a characteristic sensed by in-situ sensors 308 then, given the soil property value at different locations across the worksite,predictive map generator 312 generates apredictive map 264 that predicts values of the sensed characteristic at different locations across the worksite. The soil property value, obtained from the soil property map, at those locations and the relationship between soil property values and the values of the sensed characteristic, obtained from apredictive model 311, are used to generate thepredictive map 264. This is merely one example. - Some variations in the data types that are mapped in the information maps 358, the data types sensed by in-
situ sensors 308, and the data types predicted on thepredictive map 264 will now be described. - In some examples, the data type in one or more information maps 358 is different from the data type sensed by in-
situ sensors 308, yet the data type in thepredictive map 264 is the same as the data type sensed by the in-situ sensors 308. For instance, theinformation map 358 may be a seeding map, and the variable sensed by the in-situ sensors 308 may be a nutrient value. Thepredictive map 264 may then be a predictive nutrient map that maps predictive nutrient values to different geographic locations in the in the worksite. In another example, theinformation map 358 may be a vegetative index map, and the variable sensed by the in-situ sensors 308 may be a weed value. Thepredictive map 264 may then be a predictive weed map that maps predictive weed values to different geographic locations in the in the worksite. In another example, theinformation map 358 may be a contamination map, and the variable sensed by the in-situ sensors 308 may be a material consumption value. Thepredictive map 264 may then be a predictive material consumption map that maps predictive material consumption values to different geographic locations in the in the worksite. In another example, theinformation map 358 may be a soil property map, and the variable sensed by the in-situ sensors 308 may be a speed characteristic value. Thepredictive map 264 may then be a predictive speed map that maps predictive speed characteristic values to different geographic locations in the in the worksite. - Also, in some examples, the data type in the
information map 358 is different from the data type sensed by in-situ sensors 308, and the data type in thepredictive map 264 is different from both the data type in theinformation map 358 and the data type sensed by the in-situ sensors 308. For example, the information map may be a residue map, and the variable sensed by the in-situ sensors 308 may be a color of the plants. The predictive map may then be a predictive nutrient map that maps predictive nutrient values to the different geographic locations in the worksite. - In some examples, the
information map 358 is from a prior pass through the field during a prior operation and the data type is different from the data type sensed by in-situ sensors 308, yet the data type in thepredictive map 264 is the same as the data type sensed by the in-situ sensors 308. For instance, theinformation map 358 may be a seeding map generated during a previous planting operation on the field, and the variable sensed by the in-situ sensors 308 may be a nutrient value. Thepredictive map 264 may then be a predictive nutrient map that maps predictive nutrient values to different geographic locations in the field. In another example, theinformation map 358 may be a vegetative index map generated during a previous operation on the field, and the variable sensed by the in-situ sensors 308 may be a weed value. Thepredictive map 264 may then be a predictive weed map that maps predictive weed values to different geographic locations in the field. In another example, theinformation map 358 may be a topographic map generated during a previous operation on the field, and the variable sensed by the in-situ sensors 308 may be a material consumption value. Thepredictive map 264 may then be a predictive material consumption map that maps predictive material consumption values to different geographic locations in the field. In another example, theinformation map 358 may be a soil property map generated during a previous operation on the field, and the variable sensed by the in-situ sensors 308 may be a speed characteristic value. Thepredictive map 264 may then be a predictive speed map that maps predictive speed characteristic values to different geographic locations in the field. - In some examples, the
information map 358 is from a prior pass through the field during a prior operation and the data type is the same as the data type sensed by in-situ sensors 308, and the data type in thepredictive map 264 is also the same as the data type sensed by the in-situ sensors 308. For instance, theinformation map 358 may be a weed map generated during a previous year or earlier in the same season, and the variable sensed by the in-situ sensors 308 may be a weed value. Thepredictive map 264 may then be a predictive weed map that maps predictive weed values to different geographic locations in the field. In such an example, the relative weed value differences in thegeoreferenced information map 358 from the prior year or earlier in the same season can be used bypredictive model generator 310 to generate a predictive model that models a relationship between the relative weed value differences on theinformation map 358 and the weed values sensed by in-situ sensors 308 during the current operation. The predictive model is then used bypredictive map generator 310 to generate a predictive weed map. In another example, theinformation map 358 may be a nutrient map generated during a previous year or earlier in the same season, and the variable sensed by the in-situ sensors 308 may be a nutrient value. Thepredictive map 264 may then be a predictive nutrient map that maps predictive nutrient values to different geographic locations in the field. In such an example, the relative nutrient value differences in thegeoreferenced information map 358 from the prior year or earlier in the same season can be used bypredictive model generator 310 to generate a predictive model that models a relationship between the relative nutrient value differences on theinformation map 358 and the nutrient values sensed by in-situ sensors 308 during the current operation. The predictive model is then used bypredictive map generator 310 to generate a predictive nutrient map. In another example, theinformation map 358 may be a material consumption map generated during a previous year or earlier in the same season, and the variable sensed by the in-situ sensors 308 may be a material consumption value. Thepredictive map 264 may then be a predictive material consumption map that maps predictive material consumption values to different geographic locations in the field. In such an example, the relative material consumption value differences in thegeoreferenced information map 358 from the prior year or earlier in the same season can be used bypredictive model generator 310 to generate a predictive model that models a relationship between the relative material consumption value differences on theinformation map 358 and the material consumption values sensed by in-situ sensors 308 during the current operation. The predictive model is then used bypredictive map generator 310 to generate a predictive material consumption map. In another example, theinformation map 358 may be a speed map generated during a previous year or earlier in the same season, and the variable sensed by the in-situ sensors 308 may be a speed characteristic value. Thepredictive map 264 may then be a predictive speed map that maps predictive speed characteristic values to different geographic locations in the field. In such an example, the relative speed characteristic value differences in thegeoreferenced information map 358 from the prior year or earlier in the same season can be used bypredictive model generator 310 to generate a predictive model that models a relationship between the relative speed characteristic value differences on theinformation map 358 and the speed characteristic values sensed by in-situ sensors 308 during the current operation. The predictive model is then used bypredictive map generator 310 to generate a predictive speed map. - In another example, the
information map 358 may be a topographic map generated during a prior operation in the same year and may map topographic characteristic values to different geographic locations in the field. The variable sensed by the in-situ sensors 308 during the current operation may be a nutrient value, a weed value, a material consumption value, or a speed characteristic value. Thepredictive map 264 may then map predictive characteristic values (e.g., nutrient values, weed values, material consumption values, or speed characteristic values) to different geographic locations in the field. In such an example, the topographic characteristic values at time of the prior operation are geo-referenced, recorded, and provided tomobile machine 100 as aninformation map 358 of topographic characteristic values. In-situ sensors 308 during a current operation can detect characteristic values (e.g., nutrient values, weed values, material consumption values, or speed characteristic values) at geographic locations in the field andpredictive model generator 310 may then build a predictive model that models a relationship between characteristic values (e.g., nutrient values, weed values, material consumption values, or speed characteristic values) at the time of the current operation and topographic characteristic values at the time of the prior operation. This is because the topographic characteristic values at the time of the prior operation are likely to be the same as at the time of the current operation or may be more accurate or otherwise may be more reliable (or fresher) than topographic characteristic values obtained in other ways. For instance, a machine that operated on the field previously may provide topographic characteristic values that are fresher (closer in time) or more accurate than topographic characteristic values detected in other ways, such as satellite or other aerial-based sensing. For instance, vegetation on the field, meteorological conditions, as well as other obscurants, may obstruct or otherwise create noise that makes topographic characteristic values unavailable or unreliable. Thus, the topographic map generated during the prior operation may be more preferable. This is merely one example. - In some examples,
predictive map 264 can be provided to thecontrol zone generator 313.Control zone generator 313 groups adjacent portions of an area into one or more control zones based on data values ofpredictive map 264 that are associated with those adjacent portions. A control zone may include two or more contiguous portions of a worksite, such as a field, for which a control parameter corresponding to the control zone for controlling a controllable subsystem is constant. For example, a response time to alter a setting ofcontrollable subsystems 316 may be inadequate to satisfactorily respond to changes in values contained in a map, such aspredictive map 264. In that case,control zone generator 313 parses the map and identifies control zones that are of a defined size to accommodate the response time of thecontrollable subsystems 316. In another example, control zones may be sized to reduce wear from excessive actuator movement resulting from continuous adjustment. In some examples, there may be a different set of control zones for eachcontrollable subsystem 316 or for groups ofcontrollable subsystems 316. The control zones may be added to thepredictive map 264 to obtain predictivecontrol zone map 265. Predictivecontrol zone map 265 can thus be similar topredictive map 264 except that predictivecontrol zone map 265 includes control zone information defining the control zones. Thus, a functionalpredictive map 263, as described herein, may or may not include control zones. Bothpredictive map 264 and predictivecontrol zone map 265 are functionalpredictive maps 263. In one example, a functionalpredictive map 263 does not include control zones, such aspredictive map 264. In another example, a functionalpredictive map 263 does include control zones, such as predictivecontrol zone map 265. - It will also be appreciated that
control zone generator 313 can cluster values to generate control zones and the control zones can be added to predictivecontrol zone map 265, or a separate map, showing only the control zones that are generated. In some examples, the control zones may be used for controlling or calibratingmobile machine 100 or both. In other examples, the control zones may be presented to theoperator 360 and used to control or calibratemobile machine 100, and, in other examples, the control zones may be presented to theoperator 360 or another user, such as a remote user 366, or stored for later use. -
Predictive map 264 or predictivecontrol zone map 265 or both are provided to controlsystem 314, which generates control signals based upon thepredictive map 264 or predictivecontrol zone map 265 or both. In some examples, communication system controller 329 controlscommunication system 306 to communicate thepredictive map 264 or predictivecontrol zone map 265 or control signals based on thepredictive map 264 or predictivecontrol zone map 265 to other mobile machines (e.g.,delivery vehicles 379, other mobile material application machines) that are operating at the same worksite or in the same operation. In some examples, communication system controller 329 controls thecommunication system 306 to send thepredictive map 264, predictivecontrol zone map 265, or both to other remote systems, such asremote computing systems 368 or delivery service systems 377, or both. -
Control system 314 includes communication system controller 329,interface controller 330, one or morematerial application controllers 331, apropulsion controller 334, apath planning controller 335, one ormore zone controllers 336,logistics module 315, andcontrol system 314 can includeother items 339.Controllable subsystems 316 includematerial application actuators 340,propulsion subsystem 350, steering subsystem 352, and can include a wide variety of othercontrollable subsystems 356. -
Control system 314 can control various items ofagricultural system 300 based on sensor data detected bysensors 308,models 311,predictive map 264 or predictive map withcontrol zones 265, operator or user inputs, as well as various other bases. -
Interface controllers 330 are operable to generate control signals to control interface mechanisms, such asoperator interface mechanisms 318 or user interface mechanisms 364, or both. Whileoperator interface mechanisms 318 are shown as separate fromcontrollable subsystems 316, it will be understood thatoperator interface mechanisms 318 are controllable subsystems. Theinterface controllers 330 are also operable to present thepredictive map 264 or predictivecontrol zone map 265 or other information derived from or based on thepredictive map 264, predictivecontrol zone map 265, or both, tooperator 360 or a remote user 366, or both.Operator 360 may be a local operator or a remote operator. As an example,interface controller 330 generates control signals to control a display mechanism to display one or both ofpredictive map 264 and predictivecontrol zone map 265 for theoperator 360 or a remote user 366, or both.Interface controller 330 may generate operator or user actuatable mechanisms that are displayed and can be actuated by the operator or user to interact with the displayed map. The operator or user can edit the map by, for example, correcting a value displayed on the map, based on the operator's or the user's observation. -
Propulsion controller 334 illustratively generates control signals to controlpropulsion subsystem 350 to control a speed setting, such as one or more of a travel speed, acceleration, deceleration, and direction (e.g., forward and reverse), such as based on one or more of thepredictive map 264 and the predictivecontrol zone map 265 as well as based on outputs fromlogistics module 315.Propulsion subsystem 350 includes one or more powertrain components, such as a powerplant (e.g., internal combustion engine, electric motors and batteries, etc.), a transmission or gear box, as well as various other items. -
Path planning controller 335 illustratively generates control signals to control steering subsystem 352 to steermobile machine 100 according to a desired path or according to desired parameters, such as desired steering angles, based on one or more of thepredictive map 264 and the predictivecontrol zone map 265 or logistics outputs fromlogistics module 315. Path planning controller 333 can control a path planning system to generate a route formobile machine 100 and can controlpropulsion subsystem 350 and steering subsystem 352 to steer agriculturalmobile machine 100 along that route. Steering subsystem 352 can include various items, such as one or more actuators to control an angle (steering angle) of one or more ground engaging elements (e.g., wheels or tracks) ofmobile machine 100. -
Material application controllers 331 illustratively generate control signals, to control one ormaterial application actuators 340 of mobilematerial application machine 100 to control the application of material to the field, that is the amount of material applied, the rate at which material is applied, whether or not material is applied, etc.Material application controllers 331 can generate control signals based on apredictive map 264 or predictivecontrol zone map 265, or both.Material application controllers 331 can generate control signals based on logistics outputs fromlogistics module 315. -
Material application actuators 340 can include a variety of different types of actuators such as hydraulic, pneumatic, electromechanical actuators, motors, pumps, valves, as well as various other types of actuators. Some examples ofactuators 340 are discussed above inFIGS. 1-8 . For example,actuators 340 can include actuators that drive the speed of rotation of a seed meter, such asseed meter 124 or the speed of rotation of an assistive seed delivery, such as assistiveseed delivery system 166, or both.Actuators 340 can include actuators that control a flow of material from one or more material containers through a delivery line and to an outlet. For example, whenmaterial application machine 100 is in the form of a planting machine, such as planting machine 100-1,actuators 340 can include one or more actuators, such as pumps or valves, or both, (e.g., 109 or 115) that control the flow of material from a material container (e.g., 107, 110, or 112) through a delivery line (e.g., 111) and out of an outlet (e.g., 119). In another example, whenmaterial application machine 100 is a spraying machine, such as spraying machine 100-2 or 100-3, actuators can include one or more pumps or one or more valves, or both, that control the flow of material from a material container (e.g., 234 or 255) through a conduit and out of an outlet (e.g., 230 or 258). In some examples,actuators 340 may be controlled to activate or deactivate one or more components ofmaterial application machine 100. For example,actuators 340 may be controlled to activate or deactivate one or more nozzles or one or more sections of a spraying machine. - In some examples, the mobile agricultural
material application machine 100 may have multiple material containers. Each container may contain a different variety of the material to be applied, for example, a different seed variety (e.g., genotype), a different fertilizer material variety, a different herbicide variety, a different pesticide variety, etc. In some examples,material application controllers 331 may controlmaterial application actuators 340 to control which variety is applied to the field, based on apredictive map 264 or a predictivecontrol zone map 265, or both, as well as other inputs. For instance, it may be desirable to plant weed resistant seed varieties in areas of the field where the map (264 or 265, or both) indicate high levels of weeds. In another example, it may be desirable to plant low nutrient requirement seed varieties in areas of the field where the map (264 or 265, or both) indicate low levels of nutrient(s). These are merely some examples. In another example, it may be desirable to apply a different variety of herbicide in areas of the field where the map (264 or 265, or both) indicate weed of a given type, which may be resistant to the currently activated herbicide. This is merely one example -
Zone controller 336 illustratively generates control signals to control one or morecontrollable subsystems 316 to control operation of the one or morecontrollable subsystems 316 based on the predictivecontrol zone map 265. -
Logistics module 315 illustratively generates logistics control outputs.Logistics module 315 will be discussed in more detail inFIG. 16 . -
Other controllers 339 included on themobile machine 100, or at other locations inagricultural system 300, can controlother subsystems 356. - While the illustrated example of
FIG. 10 shows that various components ofagricultural system architecture 300 are located on mobilematerial application machine 100, it will be understood that in other examples one or more of the components illustrated on mobilematerial application machine 100 inFIG. 10 can be located at other locations, such as one or moreremote computing systems 368. For instance, one or more ofdata stores 302,map selector 309,predictive model generator 310,predictive model 311,predictive map generator 312, functional predictive maps 263 (e.g., 264 and 265),control zone generator 313, and control system 314 (or components thereof) can be located remotely frommobile machine 100 but can communicate with (or be communicated to)mobile machine 100 viacommunication system 306 andnetwork 359. Thus,predictive models 311 and functionalpredictive maps 263 may be generated and/or located at remote locations away frommobile machine 100 and can be communicated tomobile machine 100 overnetwork 359, for instance,communication system 306 can download thepredictive models 311 and functionalpredictive maps 263 from the remote locations and store them indata store 302. In other examples,mobile machine 100 may access thepredictive models 311 and functionalpredictive maps 263 at the remote locations without downloading thepredictive models 311 and functionalpredictive maps 263. The information used in the generation of thepredictive models 311 and functionalpredictive maps 263 may be provided to thepredictive model generator 310 and thepredictive map generator 312 at those remote locations overnetwork 359, for example in-situ sensor data generated by in-situ sensors 308 can be provided overnetwork 359 to the remote locations. Similarly, information maps 358 can be provided to the remote locations. - In some examples,
control system 314 may remain local tomobile machine 100, and a remote system (e.g., 368 or 364) may be provided with functionality (e.g., such as a control signal generator) that communicates control commands tomobile machine 100 that are used bycontrol system 314 for the control ofmobile machine 100. - Similarly, where various components are located remotely from
mobile machine 100, those components can receive data from components ofmobile machine 100 overnetwork 359. For example, wherepredictive model generator 310 andpredictive map generator 312 are located remotely frommobile machine 100, such as atremote computing systems 368, data generated by in-situ sensors 308 andgeographic position sensors 304, for instance, can be communicated to theremote computing systems 368 overnetwork 359. Additionally, information maps 358 can be obtained byremote computing systems 368 overnetwork 359 or over another network. -
FIG. 11 is a block diagram of a portion of the agricultural materialapplication system architecture 300 shown inFIG. 10 . Particularly,FIG. 11 shows, among other things, examples of thepredictive model generator 310 and thepredictive map generator 312 in more detail.FIG. 11 also illustrates information flow among the various components shown. Thepredictive model generator 310 receives one or more information map(s) 358. In the example illustrated inFIG. 11 , information maps 358 include one or more of asoil property map 410, ayield map 411, aresidue map 412, aconstituents map 413, a seedingmap 414, atopographic map 415, avegetative index map 416, or any of a wide variety of other information maps 429.Predictive model generator 310 also receivesgeographic location data 434, such as an indication of a geographic location, from geographic position sensor 304.Geographic location data 434 illustratively represents the geographic locations to which values detected by in-situ sensors 308 correspond. In some examples, the geographic position of themobile machine 100, as detected bygeographic position sensors 304, will not be the same as the geographic position on the field to which a value detected by in-situ sensors 308 corresponds. It will be appreciated, that the geographic position indicated bygeographic position sensor 304, along with timing, machine speed and heading, machine dimensions, machine processing delays, sensor position (e.g., relative to geographic position sensor), sensor parameters (e.g., sensor field of view), as well as various other data, can be used to derive a geographic location at the field to which a value a detected by an in-situ sensor 308 corresponds. - In-
situ sensors 308 illustratively includenutrient sensors 374, as well asprocessing system 338. In some examples,processing system 338 is separate from in-situ sensors 308 (such as the example shown inFIG. 10 ). In some instances,nutrient sensors 374 may be located on-board mobilematerial application machine 100. Theprocessing system 338 processes sensor data generated fromnutrient sensors 374 to generate processedsensor data 430 indicative of nutrient values (e.g., soil nutrient values or plant nutrient values, or both). - As shown in
FIG. 11 , the examplepredictive model generator 310 includes a nutrient-to-soilproperty model generator 440, a nutrient-to-yield model generator 441, a nutrient-to-residue model generator 442, a nutrient-to-constituents model generator 443, a nutrient-to-seedingcharacteristic model generator 444, a nutrient-to-topographiccharacteristic model generator 445, a nutrient-to-vegetative index model generator 446, and a nutrient-to-othercharacteristic model generator 448. In other examples, thepredictive model generator 310 may include additional, fewer, or different components than those shown in the example ofFIG. 11 . Consequently, in some examples, thepredictive model generator 310 may includeother items 449 as well, which may include other types of predictive model generators to generate other types of nutrient models. - Nutrient-to-soil
property model generator 440 identifies a relationship between nutrient value(s) detected in in-situ sensor data 430, at geographic location(s) to which the nutrient value(s), detected in the in-situ sensor data 430, correspond, and soil property value(s) from thesoil property map 410 corresponding to the same geographic location(s) to which the detected nutrient value(s) correspond. Based on this relationship established by nutrient-to-soilproperty model generator 440, nutrient-to-soilproperty model generator 440 generates a predictive nutrient model. The predictive nutrient model is used by predictivenutrient map generator 452 to predict a nutrient value at different locations in the field based upon the georeferenced soil property values contained in thesoil property map 410 corresponding to the same locations in the field. Thus, for a given location in the field, a nutrient value can be predicted at the given location based on the predictive nutrient model and the soil property value, from thesoil property map 415, corresponding to that given location. - Nutrient-to-
yield model generator 441 identifies a relationship between nutrient value(s) detected in in-situ sensor data 430, at geographic location(s) to which the nutrient value(s), detected in the in-situ sensor data 430, correspond, and yield value(s) from theyield map 411 corresponding to the same geographic location(s) to which the detected nutrient value(s) correspond. Based on this relationship established by nutrient-to-yield model generator 441, nutrient-to-yield model generator 441 generates a predictive nutrient model. The predictive nutrient model is used by predictivenutrient map generator 452 to predict a nutrient value at different locations in the field based upon the georeferenced yield values contained in theyield map 411 corresponding to the same locations in the field. Thus, for a given location in the field, a nutrient value can be predicted at the given location based on the predictive nutrient model and the yield value, from theyield map 411, corresponding to that given location. - Nutrient-to-
residue model generator 442 identifies a relationship between nutrient value(s) detected in in-situ sensor data 430, at geographic location(s) to which the nutrient value(s), detected in the in-situ sensor data 430, correspond, and residue value(s) from theresidue map 412 corresponding to the same geographic location(s) to which the detected nutrient value(s) correspond. Based on this relationship established by nutrient-to-residue model generator 442, nutrient-to-residue model generator 442 generates a predictive nutrient model. The predictive nutrient model is used by predictivenutrient map generator 452 to predict a nutrient value at different locations in the field based upon the georeferenced residue values contained in theresidue map 412 corresponding to the same locations in the field. Thus, for a given location in the field, a nutrient value can be predicted at the given location based on the predictive nutrient model and the residue value, from theresidue map 412, corresponding to that given location. - Nutrient-to-
constituents model generator 443 identifies a relationship between nutrient value(s) detected in in-situ sensor data 430, at geographic location(s) to which the nutrient value(s), detected in the in-situ sensor data 430, correspond, and constituent value(s) from the constituents map 413 corresponding to the same geographic location(s) to which the detected nutrient value(s) correspond. Based on this relationship established by nutrient-to-constituents model generator 443, nutrient-to-constituents model generator 443 generates a predictive nutrient model. The predictive nutrient model is used by predictivenutrient map generator 452 to predict a nutrient value at different locations in the field based upon the georeferenced constituent values contained in the constituents map 413 corresponding to the same locations in the field. Thus, for a given location in the field, a nutrient value can be predicted at the given location based on the predictive nutrient model and the constituent value, from the constituents map 413, corresponding to that given location. - Nutrient-to-seeding
characteristic model generator 444 identifies a relationship between nutrient value(s) detected in in-situ sensor data 430, at geographic location(s) to which the nutrient value(s), detected in the in-situ sensor data 430, correspond, and seeding characteristic value(s) from the seedingmap 414 corresponding to the same geographic location(s) to which the detected nutrient value(s) correspond. Based on this relationship established by nutrient-to-seedingcharacteristic model generator 444, nutrient-to-seedingcharacteristic model generator 444 generates a predictive nutrient model. The predictive nutrient model is used by predictivenutrient map generator 452 to predict a nutrient value at different locations in the field based upon the georeferenced seeding characteristic values contained in the seedingmap 414 corresponding to the same locations in the field. Thus, for a given location in the field, a nutrient value can be predicted at the given location based on the predictive nutrient model and the seeding characteristic value, from the seedingmap 414, corresponding to that given location. - Nutrient-to-topographic
characteristic model generator 445 identifies a relationship between nutrient value(s) detected in in-situ sensor data 430, at geographic location(s) to which the nutrient value(s), detected in the in-situ sensor data 430, correspond, and topographic characteristic value(s) from thetopographic map 415 corresponding to the same geographic location(s) to which the detected nutrient value(s) correspond. Based on this relationship established by nutrient-to-topographiccharacteristic model generator 445, nutrient-to-topographiccharacteristic model generator 445 generates a predictive nutrient model. The predictive nutrient model is used by predictivenutrient map generator 452 to predict a nutrient value at different locations in the field based upon the georeferenced topographic characteristic values contained in thetopographic map 415 corresponding to the same locations in the field. Thus, for a given location in the field, a nutrient value can be predicted at the given location based on the predictive nutrient model and the topographic characteristic value, from thetopographic map 415, corresponding to that given location. - Nutrient-to-vegetative index model generator 446 identifies a relationship between nutrient value(s) detected in in-
situ sensor data 430, at geographic location(s) to which the nutrient value(s), detected in the in-situ sensor data 430, correspond, and vegetative index value(s) from thevegetative index map 416 corresponding to the same geographic location(s) to which the detected nutrient value(s) correspond. Based on this relationship established by nutrient-to-vegetative index model generator 446, nutrient-to-vegetative index model generator 446 generates a predictive nutrient model. The predictive nutrient model is used by predictivenutrient map generator 452 to predict a nutrient value at different locations in the field based upon the georeferenced vegetative index values contained in thevegetative index map 416 corresponding to the same locations in the field. Thus, for a given location in the field, a nutrient value can be predicted at the given location based on the predictive nutrient model and the vegetative index value, from thevegetative index map 416, corresponding to that given location. - Nutrient-to-other
characteristic model generator 448 identifies a relationship between nutrient value(s) detected in in-situ sensor data 430, at geographic location(s) to which the nutrient value(s), detected in the in-situ sensor data 430, correspond, and other characteristic value(s) from another map 429 corresponding to the same geographic location(s) to which the detected nutrient value(s) correspond. Based on this relationship established by nutrient-to-othercharacteristic model generator 448, nutrient-to-othercharacteristic model generator 448 generates a predictive nutrient model. The predictive nutrient model is used by predictivenutrient map generator 452 to predict a nutrient value at different locations in the field based upon the georeferenced other characteristic values contained in theother map 429 corresponding to the same locations in the field. Thus, for a given location in the field, a nutrient value can be predicted at the given location based on the predictive nutrient model and the other characteristic value, from theother map 415, corresponding to that given location. - In light of the above, the
predictive model generator 310 is operable to produce a plurality of predictive nutrient models, such as one or more of the predictive nutrient models generated bymodel generators predictive nutrient model 450 inFIG. 11 . - The
predictive nutrient model 450 is provided topredictive map generator 312. In the example ofFIG. 11 ,predictive map generator 312 includes a predictivenutrient map generator 452. In other examples,predictive map generator 312 may include additional or different map generators. Thus, in some examples,predictive map generator 312 may includeother items 456 which may include other types of map generators to generate other types of maps. - Predictive
nutrient map generator 452 receives one or more of thesoil property map 410, theyield map 411, theresidue map 412, the constituents map 413, the seedingmap 414, thetopographic map 415, and another map 429, along with thepredictive nutrient model 450 which predicts a nutrient value based upon one or more of a soil property value, a yield value, a residue value, a constituent value, a seeding characteristic value, a topographic characteristic value, a vegetative index value, and an other characteristic value, and generates a predictive map that predicts a nutrient value at different locations in the field, such as functional predictive nutrient map 460. -
Predictive map generator 312 thus outputs a functional predictive nutrient map 460 that is predictive of a nutrient value. The functional predictive nutrient map 460 is apredictive map 264. The functional predictive nutrient map 460 predicts a nutrient value at different locations in a field. The functional predictive nutrient map 460 may be provided to controlzone generator 313,control system 314, or both.Control zone generator 313 generates control zones and incorporates those control zones into the functional predictive nutrient map 460 to produce a predictivecontrol zone map 265, that is a functional predictive nutrientcontrol zone map 461. One or both of functional predictive nutrient map 460 and functional predictive nutrientcontrol zone map 461 may be provided to controlsystem 314, which generates control signals to control one or more of thecontrollable subsystems 316 based upon the functional predictive nutrient map 460, the functional predictive nutrientcontrol zone map 461, or both. -
FIG. 12 is a block diagram of a portion of the agricultural materialapplication system architecture 300 shown inFIG. 10 . Particularly,FIG. 12 shows, among other things, examples of thepredictive model generator 310 and thepredictive map generator 312 in more detail.FIG. 12 also illustrates information flow among the various components shown. Thepredictive model generator 310 receives one or more information map(s) 358. In the example illustrated inFIG. 12 , information maps 358 include one or more of avegetative index map 416, anoptical map 417, aweed map 418, or any of a wide variety of other information maps 429.Predictive model generator 310 also receivesgeographic location data 1434, such as an indication of a geographic location, from geographic position sensor 304.Geographic location data 1434 illustratively represents the geographic locations to which values detected by in-situ sensors 308 correspond. In some examples, the geographic position of themobile machine 100, as detected bygeographic position sensors 304, will not be the same as the geographic position on the field to which a value detected by in-situ sensors 308 corresponds. It will be appreciated, that the geographic position indicated bygeographic position sensor 304, along with timing, machine speed and heading, machine dimensions, machine processing delays, sensor position (e.g., relative to geographic position sensor), sensor parameters (e.g., sensor field of view), as well as various other data, can be used to derive a geographic location at the field to which a value a detected by an in-situ sensor 308 corresponds. - In-
situ sensors 308 illustratively includeweed sensors 372, as well asprocessing system 338. In some examples,processing system 338 is separate from in-situ sensors 308 (such as the example shown inFIG. 10 ). In some instances, weedsensors 372 may be located on-board mobilematerial application machine 100. Theprocessing system 338 processes sensor data generated fromweed sensors 372 to generate processedsensor data 1430 indicative of weed values.Weed sensors 372 andprocessing system 338 may sense one or more visual properties of weeds including color, size, and shape.Weed sensors 372 andprocessing system 338 may sense plant locations relative to known crop seed or plant locations or to known weed seed or plant locations. - As shown in
FIG. 12 , the examplepredictive model generator 310 includes a weed-to-vegetativeindex model generator 1440, a weed-to-opticalcharacteristic model generator 1441, a weed-to-weed model generator 1442, and a weed-to-othercharacteristic model generator 1445. In other examples, thepredictive model generator 310 may include additional, fewer, or different components than those shown in the example ofFIG. 12 . Consequently, in some examples, thepredictive model generator 310 may includeother items 1449 as well, which may include other types of predictive model generators to generate other types of weed models. - Weed-to-vegetative
index model generator 1440 identifies a relationship between weed value(s) detected in in-situ sensor data 1430, at geographic location(s) to which the weed value(s), detected in the in-situ sensor data 1430, correspond, and vegetative index value(s) from thevegetative index map 416 corresponding to the same geographic location(s) to which the detected weed value(s) correspond. Based on this relationship established by weed-to-vegetativeindex model generator 1440, weed-to-vegetativeindex model generator 1440 generates a predictive weed model. The predictive weed model is used by predictiveweed map generator 1452 to predict a weed value at different locations in the field based upon the georeferenced vegetative index values contained in thevegetative index map 416 corresponding to the same locations in the field. Thus, for a given location in the field, a weed value can be predicted at the given location based on the predictive weed model and the vegetative index value, from thevegetative index map 416, corresponding to that given location. - Weed-to-optical
characteristic model generator 1441 identifies a relationship between weed value(s) detected in in-situ sensor data 1430, at geographic location(s) to which the weed value(s), detected in the in-situ sensor data 1430, correspond, and optical characteristic value(s) from theoptical map 417 corresponding to the same geographic location(s) to which the detected weed value(s) correspond. Based on this relationship established by weed-to-opticalcharacteristic model generator 1441, weed-to-opticalcharacteristic model generator 1441 generates a predictive weed model. The predictive weed model is used by predictiveweed map generator 1452 to predict a weed value at different locations in the field based upon the georeferenced optical characteristic values contained in theoptical map 417 corresponding to the same locations in the field. Thus, for a given location in the field, a weed value can be predicted at the given location based on the predictive weed model and the optical characteristic value, from theoptical map 417, corresponding to that given location. - Weed-to-
weed model generator 1442 identifies a relationship between weed value(s) detected in in-situ sensor data 1430, at geographic location(s) to which the weed value(s), detected in the in-situ sensor data 1430, correspond, and weed value(s) from theweed map 418 corresponding to the same geographic location(s) to which the detected weed value(s) correspond. Based on this relationship established by weed-to-weed model generator 1442, weed-to-weed model generator 1442 generates a predictive weed model. The predictive weed model is used by predictiveweed map generator 1452 to predict a weed value at different locations in the field based upon the georeferenced weed values contained in theweed map 418 corresponding to the same locations in the field. Thus, for a given location in the field, a weed value can be predicted at the given location based on the predictive weed model and the weed value, from theweed map 418, corresponding to that given location. - Weed-to-other
characteristic model generator 1445 identifies a relationship between weed value(s) detected in in-situ sensor data 1430, at geographic location(s) to which the weed value(s), detected in the in-situ sensor data 1430, correspond, and other characteristic value(s) from another map 429 corresponding to the same geographic location(s) to which the detected weed value(s) correspond. Based on this relationship established by weed-to-othercharacteristic model generator 1445, weed-to-othercharacteristic model generator 1445 generates a predictive weed model. The predictive weed model is used by predictiveweed map generator 1452 to predict a weed value at different locations in the field based upon the georeferenced other characteristic values contained in theother map 429 corresponding to the same locations in the field. Thus, for a given location in the field, a weed value can be predicted at the given location based on the predictive weed model and the other characteristic value, from theother map 429, corresponding to that given location. - In light of the above, the
predictive model generator 310 is operable to produce a plurality of predictive weed models, such as one or more of the predictive weed models generated bymodel generators predictive weed model 1450 inFIG. 12 . - The
predictive weed model 1450 is provided topredictive map generator 312. In the example ofFIG. 12 ,predictive map generator 312 includes a predictiveweed map generator 1452. In other examples,predictive map generator 312 may include additional or different map generators. Thus, in some examples,predictive map generator 312 may includeother items 1456 which may include other types of map generators to generate other types of maps. - Predictive
weed map generator 1452 receives one or more of thevegetative index map 416, theoptical map 417, theweed map 418, and another map 429, along with thepredictive weed model 1450 which predicts a weed value based upon one or more of a vegetative index value, an optical characteristic value, a weed value, and an other characteristic value, and generates a predictive map that predicts a weed value at different locations in the field, such as functionalpredictive weed map 1460. -
Predictive map generator 312 thus outputs a functionalpredictive weed map 1460 that is predictive of a weed value. The functionalpredictive weed map 1460 is apredictive map 264. The functionalpredictive weed map 1460 predicts a weed value at different locations in a field. The functionalpredictive weed map 1460 may be provided to controlzone generator 313,control system 314, or both.Control zone generator 313 generates control zones and incorporates those control zones into the functionalpredictive weed map 1460 to produce a predictivecontrol zone map 265, that is a functional predictive weedcontrol zone map 1461. One or both of functionalpredictive weed map 1460 and functional predictive weedcontrol zone map 1461 may be provided to controlsystem 314, which generates control signals to control one or more of thecontrollable subsystems 316 based upon the functionalpredictive weed map 1460, the functional predictive weedcontrol zone map 1461, or both. -
FIG. 13 is a block diagram of a portion of the agricultural materialapplication system architecture 300 shown inFIG. 10 . Particularly,FIG. 13 shows, among other things, examples of thepredictive model generator 310 and thepredictive map generator 312 in more detail.FIG. 13 also illustrates information flow among the various components shown. Thepredictive model generator 310 receives one or more information map(s) 358. In the example illustrated inFIG. 13 , information maps 358 include one or more of asoil property map 410, atopographic map 415,vegetative index map 416, aweed map 418, acontamination map 419, or any of a wide variety of other information maps 429.Predictive model generator 310 also receivesgeographic location data 2434, such as an indication of a geographic location, fromgeographic position sensor 304.Geographic location data 2434 illustratively represents the geographic locations to which values detected by in-situ sensors 308 correspond. In some examples, the geographic position of themobile machine 100, as detected bygeographic position sensors 304, will not be the same as the geographic position on the field to which a value detected by in-situ sensors 308 corresponds. It will be appreciated, that the geographic position indicated bygeographic position sensor 304, along with timing, machine speed and heading, machine dimensions, machine processing delays, sensor position (e.g., relative to geographic position sensor), sensor parameters (e.g., sensor field of view), as well as various other data, can be used to derive a geographic location at the field to which a value a detected by an in-situ sensor 308 corresponds. - In-
situ sensors 308 illustratively includematerial consumption sensors 376, as well asprocessing system 338. In some examples,processing system 338 is separate from in-situ sensors 308 (such as the example shown inFIG. 10 ). In some instances,material consumption sensors 376 may be located on-board mobilematerial application machine 100. Theprocessing system 338 processes sensor data generated frommaterial consumption sensors 376 to generate processedsensor data 2430 indicative of material consumption values. - As shown in
FIG. 13 , the examplepredictive model generator 310 includes a material consumption-to-soilproperty model generator 2440, a material consumption-to-topographic characteristic model generator 2441, a material consumption-to-vegetativeindex model generator 2442, a material consumption-to-weed model generator 2443, a material consumption-to-contamination model generator 2444, and a material consumption-to-othercharacteristic model generator 2445. In other examples, thepredictive model generator 310 may include additional, fewer, or different components than those shown in the example ofFIG. 13 . Consequently, in some examples, thepredictive model generator 310 may includeother items 2449 as well, which may include other types of predictive model generators to generate other types of material consumption models. - Material consumption-to-soil
property model generator 2440 identifies a relationship between material consumption value(s) detected in in-situ sensor data 2430, at geographic location(s) to which the material consumption value(s), detected in the in-situ sensor data 2430, correspond, and soil property value(s) from thesoil property map 410 corresponding to the same geographic location(s) to which the detected material consumption value(s) correspond. Based on this relationship established by material consumption-to-soilproperty model generator 2440, material consumption-to-soilproperty model generator 2440 generates a predictive material consumption model. The predictive material consumption model is used by predictive materialconsumption map generator 2452 to predict a material consumption value at different locations in the field based upon the georeferenced soil property values contained in thesoil property map 410 corresponding to the same locations in the field. Thus, for a given location in the field, a material consumption value can be predicted at the given location based on the predictive material consumption model and the soil property value, from thesoil property map 410, corresponding to that given location. - Material consumption-to-topographic characteristic model generator 2441 identifies a relationship between material consumption value(s) detected in in-
situ sensor data 2430, at geographic location(s) to which the material consumption value(s), detected in the in-situ sensor data 2430, correspond, and topographic characteristic value(s) from thetopographic map 415 corresponding to the same geographic location(s) to which the detected material consumption value(s) correspond. Based on this relationship established by material consumption-to-topographic characteristic model generator 2441, material consumption-to-topographic characteristic model generator 2441 generates a predictive material consumption model. The predictive material consumption model is used by predictive materialconsumption map generator 2452 to predict a material consumption value at different locations in the field based upon the georeferenced topographic characteristic values contained in thetopographic map 415 corresponding to the same locations in the field. Thus, for a given location in the field, a material consumption value can be predicted at the given location based on the predictive material consumption model and the topographic characteristic value, from thetopographic map 415, corresponding to that given location. - Material consumption-to-vegetative
index model generator 2442 identifies a relationship between material consumption value(s) detected in in-situ sensor data 2430, at geographic location(s) to which the material consumption value(s), detected in the in-situ sensor data 2430, correspond, and vegetative index value(s) from thevegetative index map 416 corresponding to the same geographic location(s) to which the detected material consumption value(s) correspond. Based on this relationship established by material consumption-to-vegetativeindex model generator 2442, material consumption-to-vegetativeindex model generator 2442 generates a predictive material consumption model. The predictive material consumption model is used by predictive materialconsumption map generator 2452 to predict a material consumption value at different locations in the field based upon the georeferenced vegetative index values contained in thevegetative index map 416 corresponding to the same locations in the field. Thus, for a given location in the field, a material consumption value can be predicted at the given location based on the predictive material consumption model and the vegetative index value, from thevegetative index map 416, corresponding to that given location. - Material consumption-to-
weed model generator 2443 identifies a relationship between material consumption value(s) detected in in-situ sensor data 2430, at geographic location(s) to which the material consumption value(s), detected in the in-situ sensor data 2430, correspond, and weed value(s) from theweed map 418 corresponding to the same geographic location(s) to which the detected material consumption value(s) correspond. Based on this relationship established by material consumption-to-weed model generator 2443, material consumption-to-weed model generator 2442 generates a predictive material consumption model. The predictive material consumption model is used by predictive materialconsumption map generator 2452 to predict a material consumption value at different locations in the field based upon the georeferenced weed values contained in theweed map 418 corresponding to the same locations in the field. Thus, for a given location in the field, a material consumption value can be predicted at the given location based on the predictive material consumption model and the weed value, from theweed map 418, corresponding to that given location. - Material consumption-to-contamination model generator 2444 identifies a relationship between material consumption value(s) detected in in-
situ sensor data 2430, at geographic location(s) to which the material consumption value(s), detected in the in-situ sensor data 2430, correspond, and contamination value(s) from thecontamination map 419 corresponding to the same geographic location(s) to which the detected material consumption value(s) correspond. Based on this relationship established by material consumption-to-contamination model generator 2444, material consumption-to-contamination model generator 2444 generates a predictive material consumption model. The predictive material consumption model is used by predictive materialconsumption map generator 2452 to predict a material consumption value at different locations in the field based upon the georeferenced contamination values contained in thecontamination map 419 corresponding to the same locations in the field. Thus, for a given location in the field, a material consumption value can be predicted at the given location based on the predictive material consumption model and the contamination value, from thecontamination map 419, corresponding to that given location. - Material consumption-to-other
characteristic model generator 2445 identifies a relationship between material consumption value(s) detected in in-situ sensor data 2430, at geographic location(s) to which the material consumption value(s), detected in the in-situ sensor data 2430, correspond, and other characteristic value(s) from another map 429 corresponding to the same geographic location(s) to which the detected material consumption value(s) correspond. Based on this relationship established by material consumption-to-othercharacteristic model generator 2445, material consumption-to-othercharacteristic model generator 2445 generates a predictive material consumption model. The predictive material consumption model is used by predictive materialconsumption map generator 2452 to predict a material consumption value at different locations in the field based upon the georeferenced other characteristic values contained in theother map 429 corresponding to the same locations in the field. Thus, for a given location in the field, a material consumption value can be predicted at the given location based on the predictive material consumption model and the other characteristic value, from theother map 429, corresponding to that given location. - In light of the above, the
predictive model generator 310 is operable to produce a plurality of predictive material consumption models, such as one or more of the predictive material consumption models generated bymodel generators FIG. 13 . - The predictive material consumption model 2450 is provided to
predictive map generator 312. In the example ofFIG. 13 ,predictive map generator 312 includes a predictive materialconsumption map generator 2452. In other examples,predictive map generator 312 may include additional or different map generators. Thus, in some examples,predictive map generator 312 may includeother items 2456 which may include other types of map generators to generate other types of maps. - Predictive material
consumption map generator 2452 receives one or more of thesoil property map 410, thetopographic map 415, thevegetative index map 416, theweed map 418, thecontamination map 419, and another map 429, along with the predictive material consumption model 2450 which predicts a material consumption value based upon one or more of a soil property value, a topographic characteristic value, a vegetative index value, a weed value, a contamination value, and an other characteristic value, and generates a predictive map that predicts a material consumption value at different locations in the field, such as functional predictivematerial consumption map 2460. -
Predictive map generator 312 thus outputs a functional predictivematerial consumption map 2460 that is predictive of a material consumption value. The functional predictivematerial consumption map 2460 is apredictive map 264. The functional predictivematerial consumption map 2460 predicts a material consumption value at different locations in a field. The functional predictivematerial consumption map 2460 may be provided to controlzone generator 313,control system 314, or both.Control zone generator 313 generates control zones and incorporates those control zones into the functional predictivematerial consumption map 2460 to produce a predictivecontrol zone map 265, that is a functional predictive material consumptioncontrol zone map 2461. One or both of functional predictivematerial consumption map 2460 and functional predictive material consumptioncontrol zone map 2461 may be provided to controlsystem 314, which generates control signals to control one or more of thecontrollable subsystems 316 based upon the functional predictivematerial consumption map 2460, the functional predictive material consumptioncontrol zone map 2461, or both. -
FIG. 14 is a block diagram of a portion of the agricultural materialapplication system architecture 300 shown inFIG. 10 . Particularly,FIG. 14 shows, among other things, examples of thepredictive model generator 310 and thepredictive map generator 312 in more detail.FIG. 14 also illustrates information flow among the various components shown. Thepredictive model generator 310 receives one or more information map(s) 358. In the example illustrated inFIG. 14 , information maps 358 can include one or more of the information maps 358 discussed herein, as well as various other types of information maps.Predictive model generator 310 also receivesgeographic location data 3434, such as an indication of a geographic location, fromgeographic position sensor 304.Geographic location data 3434 illustratively represents the geographic locations to which values detected by in-situ sensors 308 correspond. In some examples, the geographic position of themobile machine 100, as detected bygeographic position sensors 304, will not be the same as the geographic position on the field to which a value detected by in-situ sensors 308 corresponds. It will be appreciated, that the geographic position indicated bygeographic position sensor 304, along with timing, machine speed and heading, machine dimensions, machine processing delays, sensor position (e.g., relative to geographic position sensor), sensor parameters (e.g., sensor field of view), as well as various other data, can be used to derive a geographic location at the field to which a value a detected by an in-situ sensor 308 corresponds. - In-
situ sensors 308 illustratively include heading/speed sensors 325, as well asprocessing system 338. In some examples,processing system 338 is separate from in-situ sensors 308 (such as the example shown inFIG. 10 ). In some instances, heading/speed sensors 325 may be located on-board mobilematerial application machine 100. Theprocessing system 338 processes sensor data generated from heading/speed sensors 325 to generate processedsensor data 3430 indicative of speed characteristic values. - As shown in
FIG. 14 , the examplepredictive model generator 310 includes a speed characteristic-to-mapped characteristic(s)model generator 2440. In other examples, thepredictive model generator 310 may include additional, fewer, or different components than those shown in the example ofFIG. 14 . Consequently, in some examples, thepredictive model generator 310 may includeother items 3449 as well, which may include other types of predictive model generators to generate other types of speed models. - Speed characteristic-to-mapped characteristic(s)
model generator 3440 identifies a relationship between speed characteristic value(s) detected in in-situ sensor data 3430, at geographic location(s) to which the speed characteristic value(s), detected in the in-situ sensor data 3430, correspond, and value(s) of one or more characteristics from the one or more information maps 358 corresponding to the same geographic location(s) to which the detected speed characteristic value(s) correspond. Based on this relationship established by speed characteristic-to-mapped characteristic(s)model generator 3440, speed characteristic-to-mapped characteristic(s)model generator 3440 generates a predictive speed model. The predictive speed model is used by predictivespeed map generator 3452 to predict a speed characteristic value at different locations in the field based upon the georeferenced values of the one or more characteristics contained in the one or more information maps 358 corresponding to the same locations in the field. Thus, for a given location in the field, a speed characteristic value can be predicted at the given location based on the predictive speed model and the value of one or more characteristics, from the one or more information maps 358, corresponding to that given location. - In light of the above, the
predictive model generator 310 is operable to produce a plurality of predictive speed models, such as one or more of the predictive speed models generated bymodel generators predictive speed model 3450 inFIG. 14 . - The
predictive speed model 3450 is provided topredictive map generator 312. In the example ofFIG. 14 ,predictive map generator 312 includes a predictivespeed map generator 3452. In other examples,predictive map generator 312 may include additional or different map generators. Thus, in some examples,predictive map generator 312 may includeother items 3456 which may include other types of map generators to generate other types of maps. - Predictive
speed map generator 3452 receives one or more of the information maps 358, along with thepredictive speed model 3450 which predicts a speed characteristic value based upon a value of one or more characteristics, and generates a predictive map that predicts a speed characteristic value at different locations in the field, such as functionalpredictive speed map 3460. -
Predictive map generator 312 thus outputs a functionalpredictive speed map 3460 that is predictive of a speed characteristic value. The functionalpredictive speed map 3460 is apredictive map 264. The functionalpredictive speed map 3460 predicts a speed characteristic value at different locations in a field. The functionalpredictive speed map 3460 may be provided to controlzone generator 313,control system 314, or both.Control zone generator 313 generates control zones and incorporates those control zones into the functionalpredictive speed map 3460 to produce a predictivecontrol zone map 265, that is a functional predictive speedcontrol zone map 3461. One or both of functionalpredictive speed map 3460 and functional predictive speedcontrol zone map 3461 may be provided to controlsystem 314, which generates control signals to control one or more of thecontrollable subsystems 316 based upon the functionalpredictive speed map 3460, the functional predictive speedcontrol zone map 3461, or both. - In some cases, where the
mobile machine 100 is to be controlled based on a functional predictive map or a functional predictive control zone map, or both, multiple target settings for the same actuator may be possible at a given location. In that case, the target settings may have different values and may be competing. Thus, the target settings need to be resolved so that only a single target setting is used to control the actuators. For example, where the actuator is an actuator inpropulsion subsystem 350 that is being controlled in order to control the speed ofmobile machine 100, there may be multiple target speed settings. In such a case,control zone generator 313 may select one of the competing target settings to control the mobile machine. Thus, in generating the functional predictive control zone map that is eventually provided to the control system, operator, or user, for control of the mobile machine,control zone generator 313 may first resolve competing target settings of competing control zones.Control zone generator 313 may select the competing settings based on a number of criteria, for example, various performance metrics such as time to complete, job quality, fuel cost, labor cost, etc. may be used. There may be a hierarchy of these criteria which can be selectively adjusted, such as based on operator or user input, or based on default rankings. As an example, time to complete may be input as the highest priority in the hierarchy, and thus the target setting corresponding to time to complete will be selected. This is merely one example. In other examples, characteristics of the information maps 358 used in the generation of the functional predictive map and functional predictive control zone map may have a priority or hierarchy. For example, target settings based on yield values from a yield map may have a higher priority than target settings based on topographic values from a topographic map, and thus, the value corresponding to the yield value will be selected over the values corresponding to the topographic value. This is merely one example. In either case, it will be understood thatcontrol zone generator 313 can resolve competing target settings such that the control zone map that is generated and provided for control does not contain competing target settings. -
FIGS. 15A-15B (collectively referred to herein asFIG. 15 ) show a flow diagram illustrating one example of the operation of agriculturalmaterial application architecture 300 in generating a predictive model and a predictive map. - At
block 502, agriculturalmaterial application system 300 receives one or more information maps 358. Examples of information maps 358 or receivinginformation maps 358 are discussed with respect toblocks block 504, receiving the information maps 358 may involve selecting one or more of a plurality of possible information maps 358 that are available. For instance, oneinformation map 358 may be a soil property map, such assoil property map 410. Anotherinformation map 358 may be a yield map, such asyield map 411. Anotherinformation map 358 may be a residue map, such asresidue map 412. Anotherinformation map 358 may be a constituents map, such as constituents map 413. Anotherinformation map 358 may be a seeding map, such as seedingmap 414. Anotherinformation map 358 may be a topographic map, such astopographic map 415. Anotherinformation map 358 may be a vegetative index map, such asvegetative index map 416. Anotherinformation map 358 may be an optical map, such asoptical map 417. Anotherinformation map 358 may be a weed map, such asweed map 418. Anotherinformation map 358 may be a contamination map, such ascontamination map 419. Information maps 358 may include various other types of information maps that map various other characteristics, such asother maps 429. - The process by which one or more information maps 358 are selected can be manual, semi-automated, or automated. The information maps 358 can be based on data collected prior to a current operation, as indicated by
block 506. For instance, the data may be collected based on aerial images taken during a previous year, or earlier in the current season, or at other times. The data may be based on data detected in ways other than using aerial images. For instance, the data may be collected during a previous operation on the worksite, such an operation during a previous year, or a previous operation earlier in the current season, or at other times. The machines performing those previous operations may be outfitted with one or more sensors that generate sensor data indicative of one or more characteristics. In other examples, and as described above, the information maps 358 may be predictive maps having predictive values. Thepredictive information map 358 can be generated during a current operation bypredictive map generator 312 based on a model generated bypredictive model generator 310, as indicated byblock 506. Thepredictive information map 358 can be predicted in other ways (before or during the current operation), such as based on other measured values. The data for the information maps 358 can be obtained bypredictive model generator 310 andpredictive map generator 312 usingcommunication system 306 and stored indata store 302. The data for the information maps 358 can be obtained bymaterial application system 300 using a communication system in other ways as well, and this is indicated byblock 507 in the flow diagram ofFIG. 15 . - As
material application machine 100 is operating, in-situ sensors 308 generate sensor data indicative of one or more in-situ data values indicative of one or more characteristics, as indicated by block 508. For example,nutrient sensors 374 generate sensor data indicative of one or more in-situ nutrient values as indicated byblock 509.Weed sensors 372 generate sensor data indicative of one or more in-situ weed values as indicated byblock 510.Material consumption sensors 376 generate sensor data indicative of one or more in-situ material consumption values as indicated by block 511. Heading/speed sensors 325 generate sensor data indicative of one or more in-situ speed characteristic values as indicated byblock 512. In some examples, data from in-situ sensors 308 is georeferenced using position data fromgeographic position sensor 304 as well as, in some examples, one or more of heading data, travel speed data, machine latency data, sensor position and parameter data, as well as various other data. - At block 513,
predictive model generator 310 controls one or more model generators to generate one or more models that model the relationship between mapped values and values sensed by in-situ sensors 308. - For instance, in one example,
predictive model generator 310 controls one or more of themodel generators situ sensors 308.Predictive model generator 310 thus generates a predictive nutrient model, such aspredictive nutrient model 450, as indicated byblock 514. - In another example, predictive model generator controls one or more of the
model generators situ sensors 308.Predictive model generator 310 thus generates a predictive weed model, such aspredictive weed model 1450, as indicated byblock 515. - In another example, predictive model generator controls one or more of the
model generators situ sensors 308.Predictive model generator 310 thus generates a predictive material consumption model, such as predictive material consumption model 2450, as indicated byblock 516. - In another example, predictive model generator controls one or more of the
model generators situ sensors 308.Predictive model generator 310 thus generates a predictive speed model, such aspredictive speed model 3450, as indicated byblock 517. - The relationship(s) or model(s) generated by
predictive model generator 310 are provided topredictive map generator 312. -
Predictive map generator 312, at block 518, controls one or more predictive map generators to generate one or more functional predictive maps based on the relationship(s) or model(s) generated bypredictive model generator 310 and one or more of the information maps 358. - For instance, in one example,
predictive map generator 312 controls predictivenutrient map generator 452 to generate a predictive nutrient map, such as functional predictive nutrient map 460, that predicts nutrient values (or sensor value(s) indictive of nutrient values) at different geographic locations in a worksite at whichmaterial application machine 100 is operating using thepredictive nutrient model 450 and one or more of the information maps 358, such as one or more ofsoil property map 410,yield map 411,residue map 412, constituents map 413, seedingmap 414,topographic map 415,vegetative index map 416, and another map 429. Generating a predictive nutrient map, such as functional predictive nutrient map 460 is indicated byblock 519. - It should be noted that, in some examples, the functional predictive nutrient map 460 may include two or more different map layers. Each map layer may represent a different data type, for instance, a functional predictive nutrient map 460 that provides two or more of a map layer that provides predictive nutrient values based on soil property values from
soil property map 410, a map layer that provides predictive nutrient values based on yield values fromyield map 411, a map layer that provides predictive nutrient values based on residue values fromresidue map 412, a map layer that provides predictive nutrient values based on constituent values from constituents map 413, a map layer that provides predictive nutrient values based on seeding characteristic value from seedingmap 414, a map layer that provides predictive nutrient values based on topographic characteristic values fromtopographic map 415, a map layer that provides predictive nutrient values based on vegetative index values from vegetative index map, and a map layer that provides predictive nutrient values based on other characteristic values from another map 429. In some examples, the functional predictive nutrient map 460 may include a map layer that provides predictive nutrient values based on two or more of soil property values fromsoil property map 410, yield values fromyield map 411, residue values fromresidue map 412, constituent values from constituents map 413, seeding characteristic values from seedingmap 414, topographic characteristic values fromtopographic map 415, vegetative index values fromvegetative index map 416, and other characteristic values from another map 429. - In one example,
predictive map generator 312 controls predictiveweed map generator 1452 to generate a predictive weed map, such as functionalpredictive weed map 1460, that predicts weed values (or sensor value(s) indictive of weed values) at different geographic locations in a worksite at whichmaterial application machine 100 is operating using thepredictive weed model 1450 and one or more of the information maps 358, such as one or more ofvegetative index map 416,optical map 417,weed map 418, and another map 429. Generating a predictive weed map, such as functionalpredictive weed map 1460 is indicated byblock 520. - It should be noted that, in some examples, the functional
predictive weed map 1460 may include two or more different map layers. Each map layer may represent a different data type, for instance, a functionalpredictive weed map 1460 that provides two or more of a map layer that provides predictive weed values based on vegetative index values fromvegetative index map 416, a map layer that provides predictive weed values based on optical characteristic values fromoptical map 417, a map layer that provides predictive weed values based on weed values fromweed map 418, and a map layer that provides predictive weed values based on other characteristic values from another map 429. In some examples, the functionalpredictive weed map 1460 may include a map layer that provides predictive weed values based on two or more of vegetative index values fromvegetative index map 416, optical characteristic values fromoptical map 417, weed values fromweed map 418, and other characteristic values from another map 429. - In one example,
predictive map generator 312 controls predictive materialconsumption map generator 2452 to generate a predictive material consumption map, such as functional predictivematerial consumption map 2460, that predicts material consumption values (or sensor value(s) indictive of material consumption values) at different geographic locations in a worksite at whichmaterial application machine 100 is operating using the predictive material consumption model 2450 and one or more of the information maps 358, such as one or more ofsoil property map 410,topographic map 415,vegetative index map 416,weed map 418,contamination map 419, and another map 429. Generating a predictive material consumption map, such as functional predictivematerial consumption map 2460 is indicated by block 521. - It should be noted that, in some examples, the functional predictive
material consumption map 2460 may include two or more different map layers. Each map layer may represent a different data type, for instance, a functional predictivematerial consumption map 2460 that provides two or more of a map layer that provides predictive material consumption values based on soil property values fromsoil property map 410, a map layer that provides predictive material consumption values based on topographic characteristic values fromtopographic map 415, a map layer that provides predictive material consumption values based on vegetative index values fromvegetative index map 416, a map layer that provides predictive material consumption values based on weed values fromweed map 418, a map layer that provides predictive material consumption values based on contamination values fromcontamination map 419, and a map layer that provides predictive material consumption values based on other characteristic values from another map 429. In some examples, the functional predictivematerial consumption map 2460 may include a map layer that provides predictive material consumption values based on two or more of soil property values fromsoil property map 410, topographic characteristic values from atopographic map 415, vegetative index values fromvegetative index map 416, weed values fromweed map 418, contamination values fromcontamination map 419, and other characteristic values from another map 429. - In one example,
predictive map generator 312 controls predictivespeed map generator 3452 to generate a predictive speed map, such as functionalpredictive speed map 3460, that predicts speed characteristic values (or sensor value(s) indictive of speed characteristic values) at different geographic locations in a worksite at whichmaterial application machine 100 is operating using thepredictive speed model 3450 and one or more of the information maps 358. Generating a predictive speed map, such as functionalpredictive speed map 3460 is indicated byblock 522. - It should be noted that, in some examples, the functional
predictive speed map 2460 may include two or more different map layers. Each map layer may represent a different data type, for instance, a functional predictivematerial consumption map 2460 that provides two or more map layers, each map layer providing predictive speed characteristic values based on a respective characteristic, for instance a map layer that provides predictive speed characteristic values based on values of a first characteristic from afirst information map 358 and a map layer that provides predictive speed characteristic values based on values of a second characteristic from asecond information map 358. In some examples, the functionalpredictive speed map 3460 may include a map layer that provides predictive speed characteristic values based on values of two or more characteristics, such as a map layer that provides predictive speed characteristic values based on values of a first characteristic from afirst information map 358 and values of a second characteristic from asecond information map 358. - At block 523,
predictive map generator 312 configures the functional predictive map(s) (e.g., one or more of 460, 1460, 2460, and 3460) so that the functional predictive map(s) are actionable (or consumable) bycontrol system 314.Predictive map generator 312 can provide the functional predictive map(s) to thecontrol system 314 or to controlzone generator 313, or both. Some examples of the different ways in which the functional predictive map(s) (e.g., one or more of 460, 1460, 2460, and 3460) can be configured or output are described with respect toblocks predictive map generator 312 configures one or more of the functional predictive maps so that the one or more functional predictive maps include values that can be read bycontrol system 314, and used as the basis for generating control signals for one or more of the differentcontrollable subsystems 316, as indicated by block 523. - At
block 524,control zone generator 313 can divide the functional predictive maps into control zones based on the values on the functional predictive maps to generated functional predictive maps with control zones. In one example,control zone generator 313 can divide the functional predictive nutrient map 460 into control zones based on the values on the functional predictive nutrient map 460 to generate functional predictive nutrientcontrol zone map 461. In another example,control zone generator 313 can divide the functionalpredictive weed map 1460 into control zones based on the values on the functionalpredictive weed map 1460 to generate functional predictive weedcontrol zone map 1461. In another example,control zone generator 313 can divide the functional predictivematerial consumption map 2460 into control zones based on the values on the functional predictivematerial consumption map 2460 to generate functional predictive material consumptioncontrol zone map 2461. In another example,control zone generator 313 can divide the functionalpredictive speed map 3460 into control zones based on the values on the functionalpredictive seed map 3460 to generate functional predictive speedcontrol zone map 3461. - Contiguously-geolocated values that are within a threshold value of one another can be grouped into a control zone. The threshold value can be a default threshold value, or the threshold value can be set based on an operator input, based on an input from an automated system, or based on other criteria. A size of the zones may be based on a responsiveness of the control system, the controllable subsystems, based on wear considerations, or on other criteria.
- At block 525,
predictive map generator 312 configures one or more of the functional predictive maps (e.g., one or more of 460, 1460, 2460, and 3460) or one or more of the functional predictive control zone maps (e.g., one or more of 461, 1461, 2461, and 3461), or both, for presentation to an operator or other user. When presented to an operator or other user, the presentation of the one or more functional predictive maps or of the one or more functional predictive control zone maps, or both, may contain one or more of the predictive values on the one or more functional predictive maps correlated to geographic location, the control zones of the one or more functional predictive control zone maps correlated to geographic location, and settings values or control parameters that are used based on the predicted values on the one or more functional predictive maps or control zones on the one or more functional predictive control zone maps. The presentation can, in another example, include more abstracted information or more detailed information. The presentation can also include a confidence level that indicates an accuracy with which the predictive values on the one or more functional predictive maps or the control zones on the one or more predictive control zone maps, or both, conform to measured values that may be measured by sensors onmaterial application machine 100 asmaterial application machine 100 operates at the worksite. Further where information is presented to more than one location, an authentication and authorization system can be provided to implement authentication and authorization processes. For instance, there may be a hierarchy of individuals that are authorized to view and change maps and other presented information. By way of example, an on-board display device may show the maps in near real time locally on the machine, or the maps may also be generated at one or more remote locations, or both. In some examples, each physical display device at each location may be associated with a person or a user permission level. The user permission level may be used to determine which display elements are visible on the physical display device and which values the corresponding person may change. As an example, a local operator ofmaterial application machine 100 may be unable to see the information corresponding to the one or more functional predictive maps or the one or more functional predictive control zone maps, or both, or make any changes to machine operation. A supervisor, such as a supervisor at a remote location, however, may be able to see the one or more functional predictive maps or the one or more functional predictive control zone maps, or both, on the display but be prevented from making any changes. A manager, who may be at a separate remote location, may be able to see all of the elements on the one or more functional predictive maps or the one or more functional predictive control zone maps, or both, and also be able to change the one or more functional predictive maps or the one or more functional predictive control zone maps, or both. In some instances, the one or more functional predictive maps or the one or more functional predictive control zone maps, or both, accessible and changeable by a manager located remotely may be used in machine control. This is one example of an authorization hierarchy that may be implemented. The one or more functional predictive maps or the one or more functional predictive control zone maps, or both, can be configured in other ways as well, as indicated byblock 526. - At
block 527, input fromgeographic position sensor 304 and other in-situ sensors 308 are received by thecontrol system 314. Particularly, atblock 528,control system 314 detects an input from thegeographic position sensor 304 identifying a geographic location ofmaterial application machine 100.Block 529 represents receipt by thecontrol system 314 of sensor inputs indicative of trajectory or heading ofmaterial application machine 100, and block 530 represents receipt by thecontrol system 314 of a speed ofmaterial application machine 100.Block 531 represents receipt by thecontrol system 314 of other information from various in-situ sensors 308. - At
block 532,control system 314 generates control signals to control the controllable subsystems 316 (or to other items) based on the one or more functional predictive maps (e.g., one or more of 460, 1460, 2460, and 3460) or the one or more functional predictive control zone maps (e.g., one or more of 461, 1461, 2461, and 3461), or both, and the input from thegeographic position sensor 304 and any other in-situ sensors 308. Atblock 534,control system 314 applies the control signals to the controllable subsystems 316 (or to other items). It will be appreciated that the particular control signals that are generated, and the particular controllable subsystems 316 (or other items) that are controlled, may vary based upon one or more different things. For example, the control signals that are generated and the controllable subsystems 316 (or other items) that are controlled may be based on the type(s) of the functional predictive map(s) or the functional predictive control zone map(s), or both, that is being used. Similarly, the control signals that are generated and the controllable subsystems 316 (or other items) that are controlled and the timing of the control signals can be based on various latencies ofmaterial application machine 100 and the responsiveness of the controllable subsystems 316 (or other items). - As an example, communication system controller 329 can provide control signals to control
communication system 306 based on the functional predictive map(s) or the functional predictive control zone map(s), or both. For instance, communication system controller can provide control signals to controlcommunication system 306 to communicate the functional predictive map(s) or functional predictive control zone map(s), or both, or data based thereon to other items ofmaterial application system 300. - As another example,
interface controller 330 can generate control signals to control an interface mechanism, such as anoperator interface mechanism 318 or a user interface mechanisms 364, or both, based on or indicative of the functional predictive map(s) or functional predictive control zone map(s), such as to display the functional predictive map(s) or the functional predictive control zone map(s), or both. - As another example,
material application controller 331 can generate control signals to control one or morematerial application actuators 340 to control application of material (e.g., the amount of material that is applied, whether or not material is applied, etc.) based on the functional predictive map(s) or the functional predictive control zone map(s), or both. - As another example,
propulsion controller 334 can generate control signals to controlpropulsion subsystem 350 to control a speed characteristic (e.g., a travel speed, an acceleration, a deceleration, etc.) ofmaterial application machine 100 based on the functional predictive map(s) or the functional predictive control zone map(s), or both. - As another example,
path planning controller 335 can generate control signals to control steering subsystem 352 to control a heading ofmaterial application machine 100 based on the functional predictive map(s) or the functional predictive control zone map(s), or both. - As another example,
logistics module 315 can generate logistics control signals to control one or morecontrollable subsystems 316 or various other items ofmaterial application system 300 based on the functional predictive map(s) or the functional predictive control zone map(s), or both.Logistics module 315 will be discussed in more detail inFIGS. 16-17 . - These are merely some examples.
Control system 314 can generate any of a number of control signals to control any of a number of items ofmaterial application system 300. - At
block 536, a determination is made as to whether the operation has been completed. If the operation is not completed, the processing advances to block 538 where in-situ sensor data fromgeographic position sensor 304 and in-situ sensors 308 (and perhaps other sensors) continue to be read and further generation and application of control signals can be performed based on the inputs at block 538 and functional predictive map(s) or the functional predictive control zone map(s), or both. - In some examples, at
block 540,material application system 300 can also detect learning trigger criteria to perform machine learning on one or more of the one or more functional predictive maps (e.g., one or more of 460, 1460, 2460, and 3460), the one or more functional predictive control zone maps (e.g., one or more of 461, 1461, 2461, and 3461), the one or more predictive models (e.g., one or more of 450, 1450, 2450, and 3450), the one or more zones generated bycontrol zone generator 313, the one or more control algorithms implemented by the controllers in thecontrol system 314, and other triggered learning. - The learning trigger criteria can include any of a wide variety of different criteria. Some examples of detecting trigger criteria are discussed with respect to
blocks situ sensors 308. In such examples, receipt of an amount of in-situ sensor data from the in-situ sensors 308 that exceeds a threshold trigger or causes thepredictive model generator 310 to generate a new predictive model that is used bypredictive map generator 312. Thus, asmaterial application machine 100 continues an operation, receipt of the threshold amount of in-situ sensor data from the in-situ sensors 308 triggers the creation of a new relationship represented by one or more new predictive models generated bypredictive model generator 310. Further, one or more new functional predictive maps, one or more new functional predictive control zone maps, or both, can be generated using the respective one or more new predictive models.Block 542 represents detecting a threshold amount of in-situ sensor data used to trigger creation of one or more new predictive models. - In other examples, the learning trigger criteria may be based on how much the in-situ sensor data from the in-
situ sensors 308 are changing, such as over time or compared to previous values. For example, if variations within the in-situ sensor data (or the relationship between the in-situ sensor data and the information in the one or more information maps 358) are within a selected range or is less than a defined amount, or below a threshold value, then one or more new predictive models are not generated by thepredictive model generator 310. As a result, thepredictive map generator 312 does not generate one or more new functional predictive maps, one or more new functional predictive control zone maps, or both. However, if variations within the in-situ sensor data are outside of the selected range, are greater than the defined amount, or are above the threshold value, for example, then thepredictive model generator 310 generates one or more new predictive models using all or a portion of the newly received in-situ sensor data that thepredictive map generator 312 uses to generate one or more new functional predictive maps which can be provided to controlzone generator 313 for the creation of one or more new functional predictive control zone maps. Atblock 544, variations in the in-situ sensor data, such as a magnitude of an amount by which the data exceeds the selected range or a magnitude of the variation of the relationship between the in-situ sensor data and the information in the one or more information maps, can be used as a trigger to cause generation of one or more of one or more new predictive models, one or more new functional predictive maps, and one or more new functional predictive control zone maps. Keeping with the examples described above, the threshold, the range, and the defined amount can be set to default values; set by an operator or user interaction through a user interface; set by an automated system; or set in other ways. - Other learning trigger criteria can also be used. For instance, if
predictive model generator 310 switches to a different information map (different from the originally selected information map), then switching to the different information map may trigger re-learning bypredictive model generator 310,predictive map generator 312,control zone generator 313,control system 314, or other items. In another example, transitioning ofmaterial application machine 100 to a different topography, a different control zone, a different region of the worksite, a different area with different grouped characteristics (such as a different crop genotype area) may be used as learning trigger criteria as well. - In some instances, an
operator 360 or user 366 can also edit the functional predictive map(s) or functional predictive control zone map(s), or both. The edits can change a value on the functional predictive map(s), change a size, shape, position, or existence of a control zone on functional predictive control zone map(s), or both. Block 546 shows that edited information can be used as learning trigger criteria. - In some instances, it may also be that an
operator 360 or user 366 observes that automated control of a controllable subsystem, is not what the operator or user desires. In such instances, theoperator 360 or user 366 may provide a manual adjustment to the controllable subsystem reflecting that theoperator 360 or user 366 desires the controllable subsystem to operate in a different way than is being commanded bycontrol system 314. Thus, manual alteration of a setting by the operator or user can cause one or more ofpredictive model generator 310 to relearn one or more predictive models,predictive map generator 312 to generate one or more new functional predictive maps,control zone generator 313 to generate one or more new control zones on one or more functional predictive maps, and a control system to relearn a control algorithm or to perform machine learning on one or more of the controllers in the control system based upon the adjustment by the operator or user, as shown in block 548.Block 549 represents the use of other triggered learning criteria. - In other examples, relearning may be performed periodically or intermittently based, for example, upon a selected time interval such as a discrete time interval or a variable time interval, as indicated by
block 550. - If relearning is triggered, whether based upon learning trigger criteria or based upon passage of a time interval, as indicated by
block 550, then one or more of thepredictive model generator 310,predictive map generator 312,control zone generator 313,control system 314 performs machine learning to generate new predictive model(s), new functional predictive map(s), new control zone(s), and new control algorithm(s), respectively, based upon the learning trigger criteria. The new predictive model(s), the new functional predictive map(s), the new control zone(s), and the new control algorithm(s) are generated using any additional data that has been collected since the last learning operation was performed. Performing relearning is indicated by block 552. - If the operation has been completed, operation moves from block 552 to block 554 where one or more of the functional predictive map(s), the functional predictive control zone map(s), the predictive model(s), the control zone(s), and the control algorithm(s) are stored. The functional predictive map(s), the functional predictive control zone map(s), the predictive model(s), the control zone(s), and the control algorithm(s) may be stored locally on a data store of a machine or stored remotely for later use.
- If the operation has not been completed, operation returns to block 523 such that the new functional predictive map(s), the new functional predictive control zone map(s), the new control zone(s), and/or the new control algorithm(s) can be used to control the
material application machine 100 or other items ofmaterial application system 300, or both. -
FIG. 16 is a block diagram of a portion of agriculturalmaterial application system 300 shown inFIG. 10 , in more detail. Particularly,FIG. 16 shows examples of thelogistics module 315 in more detail.FIG. 16 also illustrates information flow among the various components shown. - As illustrated in
FIG. 16 ,logistics module 315 receives one or more material consumption maps 602, one or more speed maps 604, one or more functionalpredictive maps 263, one or more information maps 358,sensor data 606, material application machine dimensional data 608,route data 610, material delivery vehicle data 612,threshold data 614, and variousother data 616, such as, but not limited to, other operator or user inputs. - Material consumption maps 602 can include functional predictive
material consumption map 2460, functional predictive material consumptioncontrol zone map 2461, as well as other material consumption maps 603, such as other types of predictive material consumption maps or prescriptive material consumption maps. - Speed maps 604 can include functional
predictive speed map 3460, functional predictive speedcontrol zone map 3461, as well as other speed maps 605, such as other types of predictive speed maps or prescriptive speed maps. - Functional
predictive maps 263, in the example illustrated inFIG. 16 , can includepredictive maps 264, such as functional predictive nutrient map 460 or functionalpredictive weed map 1460, and predictive maps withcontrol zones 265, such as functional predictive nutrientcontrol zone map 461 or functional predictive weedcontrol zone map 1461. - Information maps 358 can include any of the information maps 358 discussed herein as well as various other information maps that map values of various other characteristics. For example, information maps 358 can also include prescriptive material application maps. A prescriptive material application map can be used in the control of
machine 100 at the field. A prescriptive material application map various machine settings values, such as material application settings (e.g., material application rate settings) across different geographic locations in a field of interest. -
Sensor data 606 includes data generated by or derived from in-situ sensors 308. - Material application machine dimensional data 608 can include data indicative of the volumetric capacity or weight capacity of the material containers of material application machine 100 (e.g.,
tanks 107,tanks 110,tanks 112,tanks 234,tanks 255, etc.). Material application machine dimensional data 608 may also include the width of a towed implement, width of a spray boom, a spray nozzle coverage pattern, a spreader throw zone, or any other width associated with material application perpendicular to the direction of travel of thematerial application machine 100. -
Route data 610 can include data indicative of a planned or prescribed route ofmaterial application machine 100 at the field, including data indicative of the route already travelled.Route data 610 can also include data indicative of a route from a location at which amaterial delivery vehicle 379 is located to the field or to a particular location on the field. In some examples, theroute data 610 may be input or provided by an operator or user. In some examples,route data 610 may be output bycontrol system 314, such as bypath planning controller 335. In some examples, theroute data 610 may be in the form of aninformation map 358, such as a route map that maps a planned or prescribed route ofmaterial application machine 100 at the field. - Material delivery vehicle data 612 can include data indicative of a location of a
material delivery vehicle 379. a heading or speed, or both of material delivery vehicle 363, as well as various other data.Material delivery vehicle 379 may have on-board sensors that provide such data which can be provided tologistics module 315 overnetwork 359. -
Threshold data 614 includes data indicative of various thresholds, such as threshold material empty levels, as well as various other thresholds. Such threshold data can be provided by an operator or user or otherwise generated bycontrol system 314. - Preferred material delivery location data 615 includes data indicative of preferred or commanded material delivery location(s). That is, location(s) at the worksite where the material delivery vehicle 363 and the
material application machine 100 are to be located to perform a material delivery operation. Such locations could include, for example, headlands, ends of rows, outside of the area of the field where material is to be applied, near a field entrance, as well as various other locations. -
Other data 616 can include any of a wide variety of other data, including, but not limited to, various other data provided by operator or user input. - It will be noted that the various data can be stored in a data store, such as
data store 302, or a data store at a different location. - As illustrated in
FIG. 16 ,logistics module 315 includesdata capture logic 622, material deliverylocation identifier logic 652,distance logic 653,arrival time logic 654, materialempty logic 655,application rate logic 656,speed logic 657,route planning logic 658, displayelement integration component 659,map generator 660, and can includeother items 630 as well.Data capture logic 622, itself, includessensor accessing logic 662, datastore accessing logic 664, and can includeother items 666 as well.Data capture logic 622 captures or obtains data that can be used by other items oflogistics module 315.Sensor accessing logic 662 can be used bylogistics module 315 to obtain or otherwise access sensor data (or values indicative of the sensed variables/characteristics) provided from in-situ sensors 308. Additionally, datastore accessing logic 664 can be used bylogistics module 315 to obtain or access data stored on data stores, such asdata store 302 or other data stores. Upon obtaining the various data,logistics module 315 generateslogistics outputs 668 which can be used in the control ofmaterial application machine 100 or other items ofmaterial application system 300. - Material
empty logic 655 illustratively identifies geographic locations at the field, along the route ofmaterial application machine 100, at which one or more material containers ofmaterial application machine 100 will be empty or will be empty to a threshold level. Materialempty logic 655 can determine the location at which one or more material containers will be empty or empty to a threshold level based on amaterial consumption map 602, as well as various other data, such asroute data 610 andsensor data 606. For instance, materialempty logic 655 can identify a current fill level of one or more containers based on sensor data from in-situ sensors (e.g., filllevel sensors material consumption map 602, along the route of material application machine 100 (as indicated by route data 610) to identify the location at which one or more material containers ofmaterial application machine 100 will be empty or empty to a threshold level. For instance, it may be that it is desirable to only allow the material application machine to become empty to a threshold level, rather than completely empty to reduce the risk of operating over ground without applying material. - In other examples, instead of using a
material consumption map 602, materialempty logic 655 may utilize other types of maps. For instance,logistics module 315 may receive a functional predictive nutrientcontrol zone map 461 or a functional predictive weedcontrol zone map 1461.Map 461 ormap 1461 may include various machine settings values, such as material application settings (e.g., material application rate settings), along the route of thematerial application machine 100 which can be used (aggregated) by materialempty logic 655 to identify a material empty location. In another example, materialempty logic 655 may utilize aninformation map 358 in the form of a prescriptive material application map which may include various machine settings values, such as material application settings (e.g., material application rate settings), along the route of thematerial application machine 100 which can be used (aggregated) by materialempty logic 655 to identify a material empty location. - Material delivery
location identifier logic 652 identifies geographic locations at the field at which material is to be delivered tomaterial application machine 100. In some examples, the material delivery locations may be predetermined locations at the field (e.g., as indicated by preferred material delivery location data 615), such as in headlands or at an area of the field that is not used for agricultural, or an area of the field that is near a field entrance. For instance, it may be desirable to limit compaction (or other deterioration) at the field and thus it may be preferable to have thematerial application machine 100 travel to a location away from the operating portion of the field to receive material. In other examples, a material delivery vehicle 373 may travel onto the operating portion of the field to deliver material and thus the material delivery location may be a geographic location on the field along the route of thematerial application machine 100. In some examples, the material delivery location is the same as the material empty location identified by materialempty logic 655. -
Distance logic 653 illustratively determines a distance of machine(s) away from a material delivery location. For instance,distance logic 653 can determine the distance ofmaterial application machine 100 away from a material delivery location based on the current position of material application machine 100 (e.g., as indicated by geographic position sensor 304) as well as the route of material application machine 100 (e.g., as indicated by route data 610).Distance logic 653 can determine the distance of amaterial delivery vehicle 379 away from a material delivery location based on the current position of the material delivery vehicle 379 (e.g., as indicated by material delivery vehicle data 612) as well as the route of the material delivery vehicle 379 (e.g., as indicated by route data 610). -
Arrival time logic 654 illustratively identifies a time at which machine(s) will (or can) arrive at a material delivery location. For instance,arrival time logic 654 can determine the time at which thematerial application machine 100 will (or can) arrive at a material delivery location based on distance between thematerial application machine 100 and the material delivery location as identified bydistance logic 653 as well as speed data of thematerial application machine 100, for instance speed characteristic values (e.g., predictive speed characteristic values) from aspeed map 604, or based on current speed characteristic values of material application machine 100 (e.g., as indicated by heading/speed sensors 325).Arrival time logic 654 can also identify a time at which amaterial delivery vehicle 379 will (or can) arrive at a material delivery location based on the distance between thematerial delivery vehicle 379 and the material delivery location as identified bydistance logic 653 as well as speed data of thematerial delivery vehicle 379, such as speed limits along the route of material delivery machine 379 (e.g., as indicated by route data 610), historical speed of material delivery machine 379 (e.g., as indicated by material delivery vehicle data 612), duration of intermediate stops along the route of the material delivery machine 379 (e.g., stops due to on-road traffic control, stops due to replenishing at other locations, etc.), or current speed of material delivery machine 379 (e.g., as indicated by material delivery vehicle data 612). - Based on the arrival times,
logistics module 315 may generate alogistics output 668 to control amaterial delivery machine 379 to begin traveling to the material delivery location to arrive at the same time or within a threshold amount of time as the time that thematerial application machine 100 will arrive. In other examples,logistics module 315 may communicate with a material delivery service system 380 to schedule a material delivery based on the arrival time. - In some instances, it may be preferable to change the application rate of
material application machine 100 such that material application machine will become empty (at least to a threshold level) at the end of a pass, rather than, somewhere else along the route (e.g., in the middle of the field or in the middle of a pass). In this way,material application machine 100 will still apply material over the pass and will not have to travel back over it. For instance, where materialempty logic 655 identifies a material empty location that is not at the end of a pass,application rate logic 656 will identify an application rate setting to adjust the application rate ofmaterial application machine 100 such that material application machine will become empty at the end of a pass. It will be important to note that it may be thatapplication rate logic 656 adjusts the operation rate in a pass that is prior to the pass that materialempty logic 655 identifies as the pass in which thematerial application machine 100 will become empty. - In some examples, if the
material application machine 100 is proj ected to be within a threshold level of empty at the end of a pass or of the field, such as 5% (which may be indicated by threshold data 614),application rate logic 656 may automatically identify an application rate setting to adjust the application rate ofmaterial application machine 100 such thatmaterial application machine 100 will become empty at the end of a pass or at the end of the field, regardless of the material empty location identified by materialempty logic 655. - Where the
material delivery vehicle 379 andmaterial application machine 100 will not (or cannot) arrive at a material delivery location at the same time, or within a threshold amount of time of each other, based on current conditions (e.g., machine settings),speed logic 657 may identify a speed setting to adjust a speed ofmaterial application machine 100 or ofmaterial delivery vehicle 379, or both, such that thematerial application machine 100 andmaterial delivery vehicle 379 arrive at the material delivery location at the same time or within a threshold amount of time of each other. Reducing the speed of amachine 100 may reduce wear, save on fuel costs, as well as provide various other benefits. - Where the
material delivery vehicle 379 andmaterial application machine 100 will not (or cannot) arrive at a material delivery location at the same time, or within a threshold amount of time of each other, based on current conditions (e.g., machine settings),route planning logic 658 may identify a new route formaterial application machine 100 or formaterial delivery vehicle 379, or both, such that thematerial application machine 100 andmaterial delivery vehicle 379 arrive at the material delivery location at the same time or within a threshold amount of time of each other. In this way, downtime can be reduced. -
Map generator 660 illustratively generates one or more logistics maps 661. Logistics maps 661 illustratively map the field in which the material application operation is being performed and perhaps surrounding areas of the field. Logistics maps 661 may include a variety of display elements (discussed below) and can be used in the control of amaterial application machine 100 or amaterial delivery vehicle 379, or both. In some examples, alogistics map 661 may be one of the other maps discussed herein, such as one of the functionalpredictive maps 263 with logistics display elements integrated into the map. - Display
element integration component 659 illustratively generates one or more display elements, such as material delivery location display elements, material empty location display elements, route display elements, material application machine display elements, material delivery machine display elements, distance display elements, arrival time display elements, as well as various other display elements. Displayelement integration component 659 can integrate the one or more display elements into one or more maps, such as one or more of functionalpredictive maps 263 or aseparate logistics map 661 generated bymap generator 661. - It will be noted that as the one or more functional
predictive maps 263 are updated or otherwise made new (as described above inFIG. 15 ), the logistics outputs 668 generated bylogistics module 315 can also be updated or otherwise made new according to the updated (or new) functionalpredictive maps 263. For example,logistics module 315 may, based on the updated or new functionalpredictive maps 263, may generate updated (or new) material empty locations, material delivery locations, distances, arrival times, speed outputs, route outputs, display elements, logistics maps, etc. - The
logistic outputs 668 can be used to controlmaterial application machine 100 ormaterial delivery vehicle 379, or both. The logistics outputs 668 can be displayed (or provided) on an interface mechanism, such asoperator interface mechanism 318 or user interface mechanism 364. The logistics outputs 668 can be provided to other items ofmaterial application system 300, such as toremote computing systems 368,delivery vehicles 379, and/or delivery services systems 380. -
FIG. 17 is a flow diagram showing one example operation of agriculturalmaterial application system 300 in controlling a material application operation, such as by controlling amaterial application machine 100 or by controlling other items ofmaterial application system 300. - At
block 702logistics module 315 obtains one or more maps.Logistics module 315 can obtain one or morematerial consumption maps 602 as indicated byblock 704.Logistics module 315 can obtain one or more speed maps 604, as indicated byblock 706.Logistics module 315 can obtain one or more other maps, such as other functionalpredictive maps 263 or information map(s) 358, or both, as indicated byblock 709. - At
block 710 various other data are obtained bylogistics module 315. For example,logistics module 315 can obtain one or more of the data items illustrated inFIG. 16 . As indicated byblock 712,logistics module 315 can obtainsensor data 606. As indicated byblock 713,logistics module 315 can obtain material application machine dimensional data 608. As indicated byblock 715,logistics module 315 can obtain receivingroute data 610. As indicated byblock 716,logistics module 315 can obtain material delivery vehicle data 612. As indicated byblock 717,logistics module 315 can obtainthreshold data 614. As indicated by block 718,logistics module 315 can obtain preferred material delivery location data 615. As indicated byblock 719,logistics module 315 can obtain variousother data 616. - At
block 720logistics module 315 generates one ormore logistics outputs 668 based on the data obtained atblocks 702 and block 710. As indicated byblock 722, materialempty logic 655 can generate, as alogistics output 668, a material empty location. As indicated byblock 724, material deliverylocation identifier logic 652 can generate, as alogistics output 668, a material delivery location. As indicated byblock 726,distance logic 653 can generate, as alogistics output 668, one or more distances, such as distance between thematerial application machine 100 and a material delivery location and a distance between amaterial delivery vehicle 379 and the material delivery location. As indicated byblock 728,arrival time logic 654 can generate, as alogistics output 668, one or more arrival times, such as time at which amaterial application machine 100 will (or can) arrive at material delivery location and a time at which amaterial delivery vehicle 379 will (or can) arrive at a material delivery location. As indicated byblock 730,application rate logic 656 can generate, as alogistics output 668, one or more application rate settings which can be used to control one or morematerial application actuators 340 to control an application rate of material. As indicated byblock 732,speed logic 657 can generate, as alogistics output 668, one or more speed outputs which can be used to controlpropulsion subsystem 350 or to control a propulsion subsystem of amaterial delivery vehicle 379, or both. As indicated byblock 734,route planning logic 658 can generate, as alogistics output 668, one or more routes which can be used to control steering subsystem 352 or a steering subsystem of amaterial delivery vehicle 379, or both. As indicated byblock 736,logistics module 315 can generate, as alogistics output 668, one or more maps with integrated display elements, the display elements generated and integrated into the maps by displayelement integration component 659. For example, at block 738, the one or more maps may include one or more functionalpredictive maps 263 with display elements integrated or one or more logistics maps 661 with display elements integrated, or both.Logistics module 315 can generate a variety of other logistics outputs, as indicated byblock 740. - At
block 742,control system 314 generate control signals based on the one or more logistics outputs 668. For example, as indicated byblock 744,control system 314 can generate control signals to control one or morecontrollable subsystems 316 based on the one or more logistics outputs 668. As indicated byblock 746,control system 314 can generate control signals to control one or more interface mechanisms (e.g., 318 or 364) to generate displays, alerts, notifications, recommendations, as well as various other indications based on the one or more logistics outputs 668. As indicated byblock 748,control system 314 can generate various other control signals based on the logistics outputs 668, such as to communicate information to other items ofmaterial application system 300 or to control other items ofmaterial application system 300. - At
block 750 it is determined if the material application operation is complete. If the material application operation has not been completed, operation returns to block 702. If the material application operation has been completed, then the operation ends. - The examples herein describe the generation of a predictive model and, in some examples, the generation of a functional predictive map based on the predictive model. The examples described herein are distinguished from other approaches by the use of a model which is at least one of multi-variate or site-specific (i.e., georeferenced, such as map-based). Furthermore, the model is revised as the work machine is performing an operation and while additional in-situ sensor data is collected. The model may also be applied in the future beyond the current worksite. For example, the model may form a baseline (e.g., starting point) for a subsequent operation at a different worksite or the same worksite at a future time.
- The revision of the model in response to new data may employ machine learning methods. Without limitation, machine learning methods may include memory networks, Bayes systems, decisions trees, Eigenvectors, Eigenvalues and Machine Learning, Evolutionary and Genetic Algorithms, Cluster Analysis, Expert Systems/Rules, Support Vector Machines, Engines/Symbolic Reasoning, Generative Adversarial Networks (GANs), Graph Analytics and ML, Linear Regression, Logistic Regression, LSTMs and Recurrent Neural Networks (RNNSs), Convolutional Neural Networks (CNNs), MCMC, Random Forests, Reinforcement Learning or Reward-based machine learning. Learning may be supervised or unsupervised.
- Model implementations may be mathematical, making use of mathematical equations, empirical correlations, statistics, tables, matrices, and the like. Other model implementations may rely more on symbols, knowledge bases, and logic such as rule-based systems. Some implementations are hybrid, utilizing both mathematics and logic. Some models may incorporate random, non-deterministic, or unpredictable elements. Some model implementations may make uses of networks of data values such as neural networks. These are just some examples of models.
- The predictive paradigm examples described herein differ from non-predictive approaches where an actuator or other machine parameter is fixed at the time the machine, system, or component is designed, set once before the machine enters the worksite, is reactively adjusted manually based on operator perception, or is reactively adjusted based on a sensor value.
- The functional predictive map examples described herein also differ from other map-based approaches. In some examples of these other approaches, an a priori control map is used without any modification based on in-situ sensor data or else a difference determined between data from an in-situ sensor and a predictive map are used to calibrate the in-situ sensor. In some examples of the other approaches, sensor data may be mathematically combined with a priori data to generate control signals, but in a location-agnostic way; that is, an adjustment to an a priori, georeferenced predictive setting is applied independent of the location of the work machine at the worksite. The continued use or end of use of the adjustment, in the other approaches, is not dependent on the work machine being in a particular defined location or region within the worksite.
- In examples described herein, the functional predictive maps and predictive actuator control rely on obtained maps and in-situ data that are used to generate predictive models. The predictive models are then revised during the operation to generate revised functional predictive maps and revised actuator control. In some examples, the actuator control is provided based on functional predictive control zone maps which are also revised during the operation at the worksite. In some examples, the revisions (e.g., adjustments, calibrations, etc.) are tied to regions or zones of the worksite rather than to the whole worksite or some non-georeferenced condition. For example, the adjustments are applied to one or more areas of a worksite to which an adjustment is determined to be relevant (e.g., such as by satisfying one or more conditions which may result in application of an adjustment to one or more locations while not applying the adjustment to one or more other locations), as opposed to applying a change in a blanket way to every location in a non-selective way.
- In some examples described herein, the models determine and apply those adjustments to selective portions or zones of the worksite based on a set of a priori data, which, in some instances, is multivariate in nature. For example, adjustments may, without limitation, be tied to defined portions of the worksite based on site-specific factors such as topography, soil type, crop variety, soil moisture, as well as various other factors, alone or in combination. Consequently, the adjustments are applied to the portions of the field in which the site-specific factors satisfy one or more criteria and not to other portions of the field where those site-specific factors do not satisfy the one or more criteria. Thus, in some examples described herein, the model generates a revised functional predictive map for at least the current location or zone, the unworked part of the worksite, or the whole worksite.
- As an example, in which the adjustment is applied only to certain areas of the field, consider the following. The system may determine that a detected in-situ characteristic value varies from a predictive value of the characteristic, such as by a threshold amount. This deviation may only be detected in areas of the field where the elevation of the worksite is above a certain level. Thus, the revision to the predictive value is only applied to other areas of the worksite having elevation above the certain level. In this simpler example, the predictive characteristic value and elevation at the point the deviation occurred and the detected characteristic value and elevation at the point the deviation cross the threshold are used to generate a linear equation. The linear equation is used to adjust the predictive characteristic value in areas of the worksite (which have not yet been operated on in the current operation, such as areas where material has not yet been applied in the current operation) in the functional predictive map as a function of elevation and the predicted characteristic value. This results in a revised functional predictive map in which some values are adjusted while others remain unchanged based on selected criteria, e.g., elevation as well as threshold deviation. The revised functional map is then used to generate a revised functional control zone map for controlling the machine.
- As an example, without limitation, consider an instance of the paradigm described herein which is parameterized as follows.
- One or more maps of the field are obtained, such as one or more of a soil property map, a yield map, a residue map, a constituents map, a seeding map, a topographic map, a vegetative index map, and another type of map.
- In-situ sensors generate sensor data indicative of in-situ characteristic values, such as in-situ nutrient values
- A predictive model generator generates one or more predictive models based on the one or more obtained maps and the in-situ sensor data, such as a predictive nutrient model.
- A predictive map generator generates one or more functional predictive maps based on a model generated by the predictive model generator and the one or more obtained maps. For example, the predictive map generator may generate a functional predictive nutrient map that maps predictive nutrient values to one or more locations on the worksite based on a predictive nutrient model and the one or more obtained maps.
- Control zones, which include machine settings values, can be incorporated into the functional predictive nutrient map to generate a functional predictive nutrient map with control zones.
- As another example, without limitation, consider an instance of the paradigm described herein which is parameterized as follows.
- One or more maps of the field are obtained, such as one or more of a vegetative index map, an optical map, a weed map, and another type of map.
- In-situ sensors generate sensor data indicative of in-situ characteristic values, such as in-situ weed values
- A predictive model generator generates one or more predictive models based on the one or more obtained maps and the in-situ sensor data, such as a predictive weed model.
- A predictive map generator generates one or more functional predictive maps based on a model generated by the predictive model generator and the one or more obtained maps. For example, the predictive map generator may generate a functional predictive weed map that maps predictive weed values to one or more locations on the worksite based on a predictive weed model and the one or more obtained maps.
- Control zones, which include machine settings values, can be incorporated into the functional predictive weed map to generate a functional predictive weed map with control zones.
- As another example, without limitation, consider an instance of the paradigm described herein which is parameterized as follows.
- One or more maps of the field are obtained, such as one or more of a soil property map, a topographic map, a vegetative index map, a weed map, a contamination map, and another type of map.
- In-situ sensors generate sensor data indicative of in-situ characteristic values, such as in-situ material consumption values
- A predictive model generator generates one or more predictive models based on the one or more obtained maps and the in-situ sensor data, such as a predictive material consumption model.
- A predictive map generator generates one or more functional predictive maps based on a model generated by the predictive model generator and the one or more obtained maps. For example, the predictive map generator may generate a functional predictive material consumption map that maps predictive material consumption values to one or more locations on the worksite based on a predictive material consumption model and the one or more obtained maps.
- Control zones, which include machine settings values, can be incorporated into the functional predictive material consumption map to generate a functional predictive material consumption map with control zones.
- As another example, without limitation, consider an instance of the paradigm described herein which is parameterized as follows.
- One or more maps of the field are obtained.
- In-situ sensors generate sensor data indicative of in-situ characteristic values, such as in-situ speed characteristic values
- A predictive model generator generates one or more predictive models based on the one or more obtained maps and the in-situ sensor data, such as a predictive speed model.
- A predictive map generator generates one or more functional predictive maps based on a model generated by the predictive model generator and the one or more obtained maps. For example, the predictive map generator may generate a functional predictive speed map that maps predictive speed characteristic values to one or more locations on the worksite based on a predictive speed model and the one or more obtained maps.
- Control zones, which include machine settings values, can be incorporated into the functional predictive speed map to generate a functional predictive speed map with control zones.
- As the mobile machine continues to operate at the worksite, additional in-situ sensor data is collected. A learning trigger criteria can be detected, such as threshold amount of additional in-situ sensor data being collected, a magnitude of change in a relationship (e.g., the in-situ characteristic values varies to a certain [e.g., threshold] degree from a predictive value of the characteristic), and operator or user makes edits to the predictive map(s) or to a control algorithm, or both, a certain (e.g., threshold) amount of time elapses, as well as various other learning trigger criteria. The predictive model(s) are then revised based on the additional in-situ sensor data and the values from the obtained maps. The functional predictive maps or the functional predictive control zone maps, or both, are then revised based on the revised model(s) and the values in the obtained maps.
- The present discussion has mentioned processors and servers. In some examples, the processors and servers include computer processors with associated memory and timing circuitry, not separately shown. They are functional parts of the systems or devices to which they belong and are activated by and facilitate the functionality of the other components or items in those systems.
- Also, a number of user interface displays have been discussed. The displays can take a wide variety of different forms and can have a wide variety of different user actuatable operator interface mechanisms disposed thereon. For instance, user actuatable operator interface mechanisms may include text boxes, check boxes, icons, links, drop-down menus, search boxes, etc. The user actuatable operator interface mechanisms can also be actuated in a wide variety of different ways. For instance, they can be actuated using operator interface mechanisms such as a point and click device, such as a track ball or mouse, hardware buttons, switches, a joystick or keyboard, thumb switches or thumb pads, etc., a virtual keyboard or other virtual actuators. In addition, where the screen on which the user actuatable operator interface mechanisms are displayed is a touch sensitive screen, the user actuatable operator interface mechanisms can be actuated using touch gestures. Also, user actuatable operator interface mechanisms can be actuated using speech commands using speech recognition functionality. Speech recognition may be implemented using a speech detection device, such as a microphone, and software that functions to recognize detected speech and execute commands based on the received speech.
- A number of data stores have also been discussed. It will be noted the data stores can each be broken into multiple data stores. In some examples, one or more of the data stores may be local to the systems accessing the data stores, one or more of the data stores may all be located remote form a system utilizing the data store, or one or more data stores may be local while others are remote. All of these configurations are contemplated by the present disclosure.
- Also, the figures show a number of blocks with functionality ascribed to each block. It will be noted that fewer blocks can be used to illustrate that the functionality ascribed to multiple different blocks is performed by fewer components. Also, more blocks can be used illustrating that the functionality may be distributed among more components. In different examples, some functionality may be added, and some may be removed.
- It will be noted that the above discussion has described a variety of different systems, components, logic and interactions. It will be appreciated that any or all of such systems, components, logic and interactions may be implemented by hardware items, such as processors, memory, or other processing components, some of which are described below, that perform the functions associated with those systems, components, or logic, or interactions. In addition, any or all of the systems, components, logic and interactions may be implemented by software that is loaded into a memory and is subsequently executed by a processor or server or other computing component, as described below. Any or all of the systems, components, logic and interactions may also be implemented by different combinations of hardware, software, firmware, etc., some examples of which are described below. These are some examples of different structures that may be used to implement any or all of the systems, components, logic and interactions described above. Other structures may be used as well.
-
FIG. 18 is a block diagram of a mobile agricultural material application machine 1000, which may be similar to mobilematerial application machine 100 shown inFIG. 10 . The mobile material application machine 1000 communicates with elements in aremote server architecture 900. In some examples,remote server architecture 900 provides computation, software, data access, and storage services that do not require end-user knowledge of the physical location or configuration of the system that delivers the services. In various examples, remote servers may deliver the services over a wide area network, such as the internet, using appropriate protocols. For instance, remote servers may deliver applications over a wide area network and may be accessible through a web browser or any other computing component. Software or components shown inFIG. 10 as well as data associated therewith, may be stored on servers at a remote location. The computing resources in a remote server environment may be consolidated at a remote data center location, or the computing resources may be dispersed to a plurality of remote data centers. Remote server infrastructures may deliver services through shared data centers, even though the services appear as a single point of access for the user. Thus, the components and functions described herein may be provided from a remote server at a remote location using a remote server architecture. Alternatively, the components and functions may be provided from a server, or the components and functions can be installed on client devices directly, or in other ways. - In the example shown in
FIG. 18 , some items are similar to those shown inFIG. 10 and those items are similarly numbered.FIG. 18 specifically shows thatpredictive model generator 310,predictive map generator 312, andlogistics module 315 may be located at aserver location 902 that is remote from the material application machine 1000. Therefore, in the example shown inFIG. 18 , material application machine 1000 accesses systems throughremote server location 902. In other examples, various other items may also be located atserver location 902, such aspredictive model 311, functional predictive maps 263 (includingpredictive maps 264 and predictive control zone maps 265),control zone generator 313, andprocessing system 338. -
FIG. 18 also depicts another example of a remote server architecture.FIG. 18 shows that some elements ofFIG. 10 may be disposed at aremote server location 902 while others may be located elsewhere. By way of example,data store 302 may be disposed at a location separate fromlocation 902 and accessed via the remote server atlocation 902. Regardless of where the elements are located, the elements can be accessed directly by material application machine 1000 through a network such as a wide area network or a local area network; the elements can be hosted at a remote site by a service; or the elements can be provided as a service or accessed by a connection service that resides in a remote location. Also, data may be stored in any location, and the stored data may be accessed by, or forwarded to, operators, users or systems. For instance, physical carriers may be used instead of, or in addition to, electromagnetic wave carriers. In some examples, where wireless telecommunication service coverage is poor or nonexistent, another machine, such as a fuel truck or other mobile machine or vehicle, may have an automated, semi-automated or manual information collection system. As the mobile machine 1000 comes close to the machine containing the information collection system, such as a fuel truck prior to fueling, the information collection system collects the information from the mobile machine 1000 using any type of ad-hoc wireless connection. The collected information may then be forwarded to another network when the machine containing the received information reaches a location where wireless telecommunication service coverage or other wireless coverage is available. For instance, a fuel truck may enter an area having wireless communication coverage when traveling to a location to fuel other machines or when at a main fuel storage location. All of these architectures are contemplated herein. Further, the information may be stored on the material application machine 1000 until the material application machine 1000 enters an area having wireless communication coverage. The material application machine 1000, itself, may send the information to another network. - It will also be noted that the elements of
FIG. 10 , or portions thereof, may be disposed on a wide variety of different devices. One or more of those devices may include an on-board computer, an electronic control unit, a display unit, a server, a desktop computer, a laptop computer, a tablet computer, or other mobile device, such as a palm top computer, a cell phone, a smart phone, a multimedia player, a personal digital assistant, etc. - In some examples,
remote server architecture 902 may include cybersecurity measures. Without limitation, these measures may include encryption of data on storage devices, encryption of data sent between network nodes, authentication of people or processes accessing data, as well as the use of ledgers for recording metadata, data, data transfers, data accesses, and data transformations. In some examples, the ledgers may be distributed and immutable (e.g., implemented as blockchain). -
FIG. 19 is a simplified block diagram of one illustrative example of a handheld or mobile computing device that can be used as a user's or client'shandheld device 16, in which the present system (or parts of it) can be deployed. For instance, a mobile device can be deployed in the operator compartment ofmaterial application machine 100, for use in generating, processing, or displaying the maps discussed above.FIGS. 20-21 are examples of handheld or mobile devices. -
FIG. 19 provides a general block diagram of the components of aclient device 16 that can run some components shown inFIG. 10 , that interacts with them, or both. In thedevice 16, acommunications link 13 is provided that allows the handheld device to communicate with other computing devices and under some examples provides a channel for receiving information automatically, such as by scanning. Examples of communications link 13 include allowing communication though one or more communication protocols, such as wireless services used to provide cellular access to a network, as well as protocols that provide local wireless connections to networks. - In other examples, applications can be received on a removable Secure Digital (SD) card that is connected to an
interface 15.Interface 15 andcommunication links 13 communicate with a processor 17 (which can also embody processors or servers from other FIGS.) along abus 19 that is also connected tomemory 21 and input/output (I/O)components 23, as well asclock 25 andlocation system 27. - I/
O components 23, in one example, are provided to facilitate input and output operations. I/O components 23 for various examples of thedevice 16 can include input components such as buttons, touch sensors, optical sensors, microphones, touch screens, proximity sensors, accelerometers, orientation sensors and output components such as a display device, a speaker, and or a printer port. Other I/O components 23 can be used as well. -
Clock 25 illustratively comprises a real time clock component that outputs a time and date. It can also, illustratively, provide timing functions forprocessor 17. -
Location system 27 illustratively includes a component that outputs a current geographical location ofdevice 16. This can include, for instance, a global positioning system (GPS) receiver, a LORAN system, a dead reckoning system, a cellular triangulation system, or other positioning system.Location system 27 can also include, for example, mapping software or navigation software that generates desired maps, navigation routes and other geographic functions. -
Memory 21stores operating system 29,network settings 31,applications 33, application configuration settings 35,data store 37,communication drivers 39, and communication configuration settings 41.Memory 21 can include all types of tangible volatile and non-volatile computer-readable memory devices.Memory 21 may also include computer storage media (described below).Memory 21 stores computer readable instructions that, when executed byprocessor 17, cause the processor to perform computer-implemented steps or functions according to the instructions.Processor 17 may be activated by other components to facilitate their functionality as well. -
FIG. 20 shows one example in whichdevice 16 is atablet computer 1100. InFIG. 20 ,computer 1100 is shown with userinterface display screen 1102.Screen 1102 can be a touch screen or a pen-enabled interface that receives inputs from a pen or stylus.Tablet computer 1100 may also use an on-screen virtual keyboard. Of course,computer 1100 might also be attached to a keyboard or other user input device through a suitable attachment mechanism, such as a wireless link or USB port, for instance.Computer 1100 may also illustratively receive voice inputs as well. -
FIG. 21 is similar toFIG. 20 except that the device is asmart phone 71.Smart phone 71 has a touchsensitive display 73 that displays icons or tiles or otheruser input mechanisms 75.Mechanisms 75 can be used by a user to run applications, make calls, perform data transfer operations, etc. In general,smart phone 71 is built on a mobile operating system and offers more advanced computing capability and connectivity than a feature phone. - Note that other forms of the
devices 16 are possible. -
FIG. 22 is one example of a computing environment in which elements ofFIG. 10 can be deployed. With reference toFIG. 22 , an example system for implementing some embodiments includes a computing device in the form of acomputer 1210 programmed to operate as discussed above. Components ofcomputer 1210 may include, but are not limited to, a processing unit 1220 (which can comprise processors or servers from previous FIGS.), asystem memory 1230, and asystem bus 1221 that couples various system components including the system memory to theprocessing unit 1220. Thesystem bus 1221 may be any of several types of bus structures including a memory bus or memory controller, a peripheral bus, and a local bus using any of a variety of bus architectures. Memory and programs described with respect toFIG. 10 can be deployed in corresponding portions ofFIG. 22 . -
Computer 1210 typically includes a variety of computer readable media. Computer readable media may be any available media that can be accessed bycomputer 1210 and includes both volatile and nonvolatile media, removable and non-removable media. By way of example, and not limitation, computer readable media may comprise computer storage media and communication media. Computer storage media is different from, and does not include, a modulated data signal or carrier wave. Computer readable media includes hardware storage media including both volatile and nonvolatile, removable and non-removable media implemented in any method or technology for storage of information such as computer readable instructions, data structures, program modules or other data. Computer storage media includes, but is not limited to, RAM, ROM, EEPROM, flash memory or other memory technology, CD-ROM, digital versatile disks (DVD) or other optical disk storage, magnetic cassettes, magnetic tape, magnetic disk storage or other magnetic storage devices, or any other medium which can be used to store the desired information and which can be accessed bycomputer 1210. Communication media may embody computer readable instructions, data structures, program modules or other data in a transport mechanism and includes any information delivery media. The term "modulated data signal" means a signal that has one or more of its characteristics set or changed in such a manner as to encode information in the signal. - The
system memory 1230 includes computer storage media in the form of volatile and/or nonvolatile memory or both such as read only memory (ROM) 1231 and random access memory (RAM) 1232. A basic input/output system 1233 (BIOS), containing the basic routines that help to transfer information between elements withincomputer 1210, such as during start-up, is typically stored in ROM 1231.RAM 1232 typically contains data or program modules or both that are immediately accessible to and/or presently being operated on byprocessing unit 1220. By way of example, and not limitation,FIG. 22 illustrates operating system 1234, application programs 1235,other program modules 1236, andprogram data 1237. - The
computer 1210 may also include other removable/non-removable volatile/nonvolatile computer storage media. By way of example only,FIG. 22 illustrates ahard disk drive 1241 that reads from or writes to non-removable, nonvolatile magnetic media, anoptical disk drive 1255, and nonvolatileoptical disk 1256. Thehard disk drive 1241 is typically connected to thesystem bus 1221 through a non-removable memory interface such asinterface 1240, andoptical disk drive 1255 are typically connected to thesystem bus 1221 by a removable memory interface, such asinterface 1250. - Alternatively, or in addition, the functionality described herein can be performed, at least in part, by one or more hardware logic components. For example, and without limitation, illustrative types of hardware logic components that can be used include Field-programmable Gate Arrays (FPGAs), Application-specific Integrated Circuits (e.g., ASICs), Application-specific Standard Products (e.g., ASSPs), System-on-a-chip systems (SOCs), Complex Programmable Logic Devices (CPLDs), etc.
- The drives and their associated computer storage media discussed above and illustrated in
FIG. 22 , provide storage of computer readable instructions, data structures, program modules and other data for thecomputer 1210. InFIG. 22 , for example,hard disk drive 1241 is illustrated as storingoperating system 1244,application programs 1245,other program modules 1246, andprogram data 1247. Note that these components can either be the same as or different from operating system 1234, application programs 1235,other program modules 1236, andprogram data 1237. - A user may enter commands and information into the
computer 1210 through input devices such as akeyboard 1262, amicrophone 1263, and apointing device 1261, such as a mouse, trackball or touch pad. Other input devices (not shown) may include a j oystick, game pad, satellite dish, scanner, or the like. These and other input devices are often connected to theprocessing unit 1220 through auser input interface 1260 that is coupled to the system bus, but may be connected by other interface and bus structures. Avisual display 1291 or other type of display device is also connected to thesystem bus 1221 via an interface, such as a video interface 1290. In addition to the monitor, computers may also include other peripheral output devices such asspeakers 1297 andprinter 1296, which may be connected through anoutput peripheral interface 1295. - The
computer 1210 is operated in a networked environment using logical connections (such as a controller area network - CAN, local area network - LAN, or wide area network WAN) to one or more remote computers, such as aremote computer 1280. - When used in a LAN networking environment, the
computer 1210 is connected to theLAN 1271 through a network interface oradapter 1270. When used in a WAN networking environment, thecomputer 1210 typically includes amodem 1272 or other means for establishing communications over theWAN 1273, such as the Internet. In a networked environment, program modules may be stored in a remote memory storage device.FIG. 22 illustrates, for example, thatremote application programs 1285 can reside onremote computer 1280. - It should also be noted that the different examples described herein can be combined in different ways. That is, parts of one or more examples can be combined with parts of one or more other examples. All of this is contemplated herein.
- Although the subject matter has been described in language specific to structural features and/or methodological acts, it is to be understood that the subject matter defined in the appended claims is not necessarily limited to the specific features or acts described above. Rather, the specific features and acts described above are disclosed as example forms of the claims.
Claims (15)
- An agricultural material application system (300) comprising:a communication system (306) that receives an information map (358) that maps values of a characteristic to different geographic locations in the field;a geographic position sensor (304) that detects a geographic location of a mobile material application machine (100);an in-situ sensor (308/374) that detects a value of a nutrient corresponding to the geographic location;a predictive model generator (310) that generates a predictive nutrient model (450) indicative of a relationship between the characteristic and the nutrient based on the value of the nutrient detected by the in-situ sensor corresponding to the geographic location and a value of the characteristic in the information map corresponding to the geographic location; anda predictive map generator (312) that generates a functional predictive nutrient map (460) of the field that maps predictive values of the nutrient to the different geographic locations in the field based on the values of the characteristic in the information map and based on the predictive nutrient model.
- The agricultural material application system of claim 1, wherein the predictive map generator configures the functional predictive nutrient map for consumption by a control system (314) that generates control signals to control a controllable subsystem (316) of the mobile material application machine based on the functional predictive nutrient map.
- The agricultural material application system of claim 1 or 2, wherein the in-situ sensor (374) detects, in detecting the value of the nutrient, a value of a soil nutrient.
- The agricultural material application system of claim 1 or 2, wherein the in-situ sensor (374) detects, in detecting the value of the nutrient, a value of a plant nutrient.
- The agricultural material application system of any preceding claim, wherein the information map is one of:a soil property map (410) that maps, as the values of the characteristic, soil property values to the different geographic locations in the field;a yield map (411) that maps, as the values of the characteristic, yield values to the different geographic locations in the field;a residue map (412) that maps, as the values of the characteristic, residue values to the different geographic locations in the field;a constituents map (413) that maps, as the values of the characteristic, constituent values to the different geographic locations in the field;a seeding map (414) that maps, as the values of the characteristic, seeding characteristic values to the different geographic locations in the field;a topographic map (415) that maps, as the values of the characteristic, topographic characteristic values to the different geographic locations in the field; ora vegetative index map (416) that maps, as the values of the characteristic, vegetative index values to the different geographic locations in the field.
- The agricultural material application system of any preceding claim, wherein the information map comprises two or more information maps (358, 410/411/412/413/414/415/416/429), each of the two or more information maps mapping values of a respective characteristic to the different geographic locations in the field,wherein the predictive model generator generates, as the predictive nutrient model, a predictive nutrient model (450) indicative of a relationship between the two or more respective characteristics and the nutrient based on the value of the nutrient detected by the in-situ sensor corresponding to the geographic location and the values of the two or more respective characteristics in the two or more information maps corresponding to the geographic location, andwherein the predictive map generator generates, as the functional predictive nutrient map, a functional predictive nutrient map (460) that maps predictive values of the nutrient to the different geographic locations in the field based on the values of the two more characteristics in the two or more information maps corresponding to the different geographic locations and the predictive nutrient model.
- The agricultural material application system of claim 1 and further comprising:
a control system (314) that generates a control signal to control a controllable subsystem (316) of the material application machine based on the functional predictive nutrient map. - The agricultural material application system of claim 7, wherein the controllable subsystem comprises a material application actuator (340) and wherein the control signal controls the material application actuator to increase an amount of material applied by the material application machine based on the functional predictive nutrient map.
- The agricultural material application system of claim 7, wherein the controllable subsystem comprises a material application actuator (340) and wherein the control signal controls the material application actuator to decrease an amount of material applied by the material application machine based on the functional predictive nutrient map.
- The agricultural material application system of claim 7, wherein the controllable subsystem comprises a material application actuator (340) and wherein the control signal controls the material application actuator to activate or deactivate a component of the material application machine based on the functional predictive nutrient map.
- A computer implemented method comprising:receiving an information map (358) that maps values of a characteristic to different geographic locations in a field;obtaining in-situ sensor data (430) indicative of a value of a nutrient corresponding to a geographic location at the field;generating a predictive nutrient model (450) indicative of a relationship between the characteristic and the nutrient; andcontrolling a predictive map generator (312) to generate a functional predictive nutrient map of the field (460), that maps predictive values of the nutrient to the different locations in the field based on the values of the characteristic in the information map and the predictive nutrient model.
- The computer implemented method of claim 11 and further comprising:
configuring the functional predictive nutrient map for a control system (314) that generates control signals to control a controllable subsystem (316) on a mobile machine (100) based on the functional predictive nutrient map. - The computer implemented method of claim 11 and further comprising:
controlling a controllable subsystem (316) of a mobile machine (100) based on the functional predictive nutrient map. - The computer implemented method of claim 13, wherein controlling the controllable subsystem comprises controlling a material application actuator (340) to adjust a flow rate of material based on the functional predictive nutrient map.
- The computer implemented method of claim 13, wherein controlling the controllable subsystem comprises subsystem comprises controlling a material application actuator (340) to adjust an amount of material applied to the field based on the functional predictive nutrient map.
Applications Claiming Priority (1)
| Application Number | Priority Date | Filing Date | Title |
|---|---|---|---|
| US17/716,383 US12058951B2 (en) | 2022-04-08 | 2022-04-08 | Predictive nutrient map and control |
Publications (1)
| Publication Number | Publication Date |
|---|---|
| EP4256937A1 true EP4256937A1 (en) | 2023-10-11 |
Family
ID=85222594
Family Applications (1)
| Application Number | Title | Priority Date | Filing Date |
|---|---|---|---|
| EP23154795.1A Pending EP4256937A1 (en) | 2022-04-08 | 2023-02-02 | Predictive nutrient map and control |
Country Status (2)
| Country | Link |
|---|---|
| US (1) | US12058951B2 (en) |
| EP (1) | EP4256937A1 (en) |
Families Citing this family (1)
| Publication number | Priority date | Publication date | Assignee | Title |
|---|---|---|---|---|
| US20230324910A1 (en) * | 2022-04-08 | 2023-10-12 | Deere & Company | Predictive material consumption map and control |
Citations (2)
| Publication number | Priority date | Publication date | Assignee | Title |
|---|---|---|---|---|
| US7171912B2 (en) * | 2001-02-28 | 2007-02-06 | The Mosaic Company | Method for prescribing site-specific fertilizer application in agricultural fields |
| US10482539B2 (en) * | 2014-12-05 | 2019-11-19 | Board Of Trustees Of Michigan State University | Methods and systems for precision crop management |
Family Cites Families (964)
| Publication number | Priority date | Publication date | Assignee | Title |
|---|---|---|---|---|
| DE504035C (en) | 1930-07-31 | Hermann Lindstaedt | Potato harvester with conveyor connected to the coulter and a grate arranged behind it | |
| FI5533A (en) | 1913-11-06 | Williamstown Glass Company | Anordningar vid glasbearbetningsmaskiner och sätt att tillverka buteljer med sådana | |
| DE441597C (en) | 1927-03-05 | Paul Frenzel | Device for grass mowing machines to make them suitable for mowing potatoes | |
| DE152380C (en) | 1897-07-11 | 1904-06-09 | Bauer & Co | Process for the preparation of casein and other protein preparations |
| GB901081A (en) | 1958-07-31 | 1962-07-11 | Dunn Engineering Associates In | Improvements in apparatus for punching jacquard cards |
| US3568157A (en) | 1963-12-31 | 1971-03-02 | Bell Telephone Labor Inc | Program controlled data processing system |
| US3599543A (en) | 1964-12-02 | 1971-08-17 | Stothert & Pitt Ltd | Vibratory machines |
| FR1451480A (en) | 1965-07-20 | 1966-01-07 | France Etat | Method and apparatus for measuring soil settlement under embankments and engineering structures |
| US3580257A (en) | 1969-12-24 | 1971-05-25 | Earl E Teague | Weed seed collector for a thresher combine |
| DE2018219C3 (en) | 1970-04-16 | 1979-02-22 | Losenhausen Maschinenbau Ag, 4000 Duesseldorf | Device for generating a display or control signal for the drive of a dynamic soil compactor |
| CH569747A5 (en) | 1972-08-25 | 1975-11-28 | Ciba Geigy Ag | |
| DE2354828A1 (en) | 1973-11-02 | 1975-05-15 | Held & Francke Bau Ag | Ground compacting machine for granular strata - has combined compacting hammer and ground vibrating equipment |
| CH618682A5 (en) | 1975-11-07 | 1980-08-15 | Ciba Geigy Ag | |
| DE2646143A1 (en) | 1976-10-13 | 1978-04-20 | Bayer Ag | 4,5-DICHLOR-IMIDAZOLE-1-CARBONIC ACID ARYLESTER, METHOD FOR THE PRODUCTION THEREOF AND THEIR USE AS A PLANT PROTECTANT |
| US4166735A (en) | 1977-01-21 | 1979-09-04 | Shell Oil Company | Cycloalkanecarboxanilide derivative herbicides |
| EP0000351A1 (en) | 1977-07-07 | 1979-01-24 | Ciba-Geigy Ag | Phenoxy-phenyl-thio-alkanecarboxylic acid derivatives method for their preparation and their use as herbicides and plant growth regulators |
| SU834514A1 (en) | 1978-11-04 | 1981-05-30 | Smolyanitskij Leonid A | Method of earth packing quality control |
| SU887717A1 (en) | 1979-09-18 | 1981-12-07 | Новосибирский филиал Всесоюзного научно-исследовательского института транспортного строительства | Device for checking soil consolidation quality |
| US4360677A (en) | 1979-09-20 | 1982-11-23 | Uniroyal, Inc. | Herbicidal 2-(alpha-chloromethylsulfonyl) pyridine-1-oxides |
| US4268679A (en) | 1980-02-19 | 1981-05-19 | Ppg Industries, Inc. | 3-[5- or 3-Substituted-5- or 3-isoxazolyl]-1-allyl or alkyl-4-substituted-5-substituted or unsubstituted-2-imidazolidinones |
| EP0042245B1 (en) | 1980-06-14 | 1984-11-28 | Claydon Yield-O-Meter Limited | Crop metering device for combine harvesters |
| SU1052940A1 (en) | 1980-09-02 | 1983-11-07 | Войсковая часть 70170 | Method of measuring filtration characteristic of non-compact ground |
| AU544099B2 (en) | 1980-12-15 | 1985-05-16 | Sumitomo Chemical Company, Limited | Triazolylpentenols |
| DOP1981004033A (en) | 1980-12-23 | 1990-12-29 | Ciba Geigy Ag | PROCEDURE TO PROTECT CROP PLANTS FROM PHYTOTOXIC ACTION OF HERBICIDES. |
| FR2509135A1 (en) | 1981-07-10 | 1983-01-14 | Ugine Kuhlmann | HERBICIDAL COMPOSITIONS BASED ON 4-AMINO-CHLORO-6-ALKYLTHIO-PYRIMIDINE DERIVATIVES AND 2,6-DINILORILINE DERIVATIVES AND METHOD FOR TREATING CULTURES USING THE SAME |
| US4566901A (en) | 1982-05-06 | 1986-01-28 | Ciba-Geigy Corporation | Novel oxime ethers, the preparation thereof, compositions containing them and the use thereof |
| US4527241A (en) | 1982-08-30 | 1985-07-02 | Sperry Corporation | Automatic combine harvester adjustment system |
| EP0126713B1 (en) | 1983-05-18 | 1989-01-18 | Ciba-Geigy Ag | Cyclohexanedione-carboxylic-acid derivatives having a herbicidal and plant growth regulating activity |
| SU1134669A1 (en) | 1983-09-30 | 1985-01-15 | Всесоюзный научно-исследовательский институт транспортного строительства | Apparatus for continuous monitoring of soil compacting degree |
| US4687505A (en) | 1983-11-02 | 1987-08-18 | Sylling Truman V | Method for desalination and rehabilitation of irrigated soil |
| ATE62104T1 (en) | 1984-04-11 | 1991-04-15 | Ciba Geigy Ag | METHODS OF SELECTIVE WEED CONTROL IN CROP PLANTS. |
| JPH0243845B2 (en) | 1984-05-30 | 1990-10-01 | Shimizu Construction Co Ltd | TSUCHINOGENBAMITSUDOSOKUTEIHOHOOYOBISONOSOCHI |
| CS247426B1 (en) | 1984-12-21 | 1986-12-18 | Josef Hula | Ground compactness measuring device |
| CS248318B1 (en) | 1984-12-21 | 1987-02-12 | Josef Hula | Device for soil compactness measuring |
| GB2178934A (en) | 1985-03-22 | 1987-02-25 | Massey Ferguson Mfg | Agricultural husbandry |
| US5250690A (en) | 1985-05-02 | 1993-10-05 | Dowelanco | Haloalkoxy anilide derivatives of 2-4(-heterocyclic oxyphenoxy)alkanoic or alkenoic acids and their use as herbicides |
| US4857101A (en) | 1985-12-06 | 1989-08-15 | Rohm And Haas Company | Method of selectively controlling weeds in crops of cereals |
| US5246915A (en) | 1986-06-20 | 1993-09-21 | Janssen Pharmaceutica N.V. | Method for controlling weeds |
| SU1526588A1 (en) | 1987-05-29 | 1989-12-07 | Всесоюзный научно-исследовательский институт по применению полимерных материалов в мелиорации и водном хозяйстве | Device for measuring the degree of soil compaction |
| JP2523324B2 (en) | 1987-06-09 | 1996-08-07 | 建設省土木研究所長 | How to measure the degree of compaction of the ground |
| SU1540053A1 (en) | 1987-06-16 | 1991-01-15 | Головное специализированное конструкторское бюро по комплексам зерноуборочных машин Производственного объединения "Ростсельмаш" | Method of controlling operation of harvesting machine |
| DE3728669A1 (en) | 1987-08-27 | 1989-03-16 | Arcus Elektrotech | Measuring probe for measuring the soil compaction |
| BR6800140U (en) | 1988-01-22 | 1989-09-12 | Adalberto Wilke | HERBICIDE APPLICATOR WITH PROTECTORS FOR CROPS IN INITIAL DEVELOPMENT PHASE |
| GB8916722D0 (en) | 1988-08-18 | 1989-09-06 | Ici Plc | Heterocyclic compounds |
| JP2671143B2 (en) | 1989-01-25 | 1997-10-29 | 株式会社光電製作所 | Soil compaction measuring device |
| JP2767266B2 (en) | 1989-02-15 | 1998-06-18 | ヤンマー農機株式会社 | Harvester |
| JP2927532B2 (en) | 1989-11-09 | 1999-07-28 | 塩野義製薬株式会社 | Nitrogen-containing heterocyclic oxy-phenoxyacetic acid derivatives and their use as herbicides |
| SU1761864A1 (en) | 1990-03-27 | 1992-09-15 | Московский Автомобильно-Дорожный Институт | Method of controlling soil thickening |
| RU1791767C (en) | 1990-06-12 | 1993-01-30 | Усть-Каменогорский Строительно-Дорожный Институт | Device for determination of physical and mechanical properties of soils under compaction |
| US5059154A (en) | 1990-10-19 | 1991-10-22 | The Board Of Trustees Of The University Of Arkansas | Grain cleaner and destructor of foreign matter in harvesting crops |
| GB9108199D0 (en) | 1991-04-17 | 1991-06-05 | Rhone Poulenc Agriculture | New compositions of matter |
| EP0532146B1 (en) | 1991-09-11 | 1998-08-19 | E.I. Du Pont De Nemours And Company | Herbicidal substituted bicyclic triazoles |
| US5246164A (en) | 1991-12-16 | 1993-09-21 | Mccann Ian R | Method and apparatus for variable application of irrigation water and chemicals |
| US5477459A (en) | 1992-03-06 | 1995-12-19 | Clegg; Philip M. | Real time three-dimensional machine locating system |
| ATE198252T1 (en) | 1992-05-06 | 2001-01-15 | Novartis Erfind Verwalt Gmbh | SYNERGISTIC COMPOSITIONS AND METHODS FOR SELECTIVE WEED CONTROL |
| US5300477A (en) | 1992-07-17 | 1994-04-05 | Rohm And Haas Company | 2-arylpyrimidines and herbicidal use thereof |
| US5585626A (en) | 1992-07-28 | 1996-12-17 | Patchen, Inc. | Apparatus and method for determining a distance to an object in a field for the controlled release of chemicals on plants, weeds, trees or soil and/or guidance of farm vehicles |
| US5296702A (en) | 1992-07-28 | 1994-03-22 | Patchen California | Structure and method for differentiating one object from another object |
| AU658066B2 (en) | 1992-09-10 | 1995-03-30 | Deere & Company | Neural network based control system |
| EP0631906B2 (en) | 1993-06-28 | 2002-03-20 | New Holland Belgium N.V. | Process for the control of self-propelled agricultural harvesting machines |
| JP3359702B2 (en) | 1993-06-28 | 2002-12-24 | 株式会社前川製作所 | Heterogeneous plant detection method and weed control method using the detection method |
| US5592606A (en) | 1993-07-30 | 1997-01-07 | Myers; Allen | Method and apparatus for storage and display of hierarchally organized data |
| AU691540B2 (en) | 1993-12-22 | 1998-05-21 | Syngenta Limited | Herbicidal diphenyl ether and nitrogen solution compositions and method |
| US5995859A (en) | 1994-02-14 | 1999-11-30 | Nihon Kohden Corporation | Method and apparatus for accurately measuring the saturated oxygen in arterial blood by substantially eliminating noise from the measurement signal |
| US5767373A (en) | 1994-06-16 | 1998-06-16 | Novartis Finance Corporation | Manipulation of protoporphyrinogen oxidase enzyme activity in eukaryotic organisms |
| US5606821A (en) | 1994-07-25 | 1997-03-04 | Loral Corporation | Smart weed recognition/classification system |
| DE4431824C1 (en) | 1994-09-07 | 1996-05-02 | Claas Ohg | Combine operation with operational data register |
| EP0723740B1 (en) | 1995-01-25 | 2000-07-19 | Agco Limited | Crop harvester |
| GB9504345D0 (en) | 1995-03-03 | 1995-04-19 | Compaction Tech Soil Ltd | Method and apparatus for monitoring soil compaction |
| DE19509496C2 (en) | 1995-03-16 | 1998-07-09 | Claas Ohg | Self-propelled combine |
| DE19514223B4 (en) | 1995-04-15 | 2005-06-23 | Claas Kgaa Mbh | Method for optimizing the use of agricultural machinery |
| DE19528663A1 (en) | 1995-08-04 | 1997-02-06 | Univ Hohenheim | Mobile agricultural or construction machine setting - using measured position for setting machine in dependence on calculated process parameter and/or surface characteristic data for each position |
| EP0852544B2 (en) | 1995-09-29 | 2004-01-07 | Ingersoll-Rand Company | A soil compactor and traction control system thereon |
| US5991694A (en) | 1995-11-13 | 1999-11-23 | Caterpillar Inc. | Method and apparatus for determining the location of seedlings during agricultural production |
| US5721679A (en) | 1995-12-18 | 1998-02-24 | Ag-Chem Equipment Co., Inc. | Heads-up display apparatus for computer-controlled agricultural product application equipment |
| US6604432B1 (en) | 1996-02-01 | 2003-08-12 | Bbn Corporation | Soil compaction measurement |
| PL178299B1 (en) | 1996-02-13 | 2000-04-28 | Jan Liszkowski | Method of renovating earthen flood banks by means of a heavy vibrating roller using a light-weight soil compacting degree dynamic measuring probe |
| ES2116215B1 (en) | 1996-02-22 | 1999-02-16 | Zuniga Escobar Orlando | ELECTRONOUND TO MEASURE THE SOIL MOISTURE CONTENT AND THE COMPACTION OF THE SAME, METHOD OF CORRESPONDING MEASURE AND USE OF SUCH ELECTRONOUND. |
| US7032689B2 (en) | 1996-03-25 | 2006-04-25 | Halliburton Energy Services, Inc. | Method and system for predicting performance of a drilling system of a given formation |
| DE29607846U1 (en) | 1996-04-30 | 1996-07-25 | Neuhaus Neotec Maschinen- und Anlagenbau GmbH, 21465 Reinbek | Device for dosing ground coffee in coffee packaging |
| DE19629618A1 (en) | 1996-07-23 | 1998-01-29 | Claas Ohg | Route planning system for agricultural work vehicles |
| US5771169A (en) | 1996-08-29 | 1998-06-23 | Case Corporation | Site-specific harvest statistics analyzer |
| WO1998017865A1 (en) | 1996-10-21 | 1998-04-30 | Ammann Verdichtung Ag | Method of measuring mechanical data of a soil, and of compacting the soil, and measuring or soil-compaction device |
| US5789741A (en) | 1996-10-31 | 1998-08-04 | Patchen, Inc. | Detecting plants in a field by detecting a change in slope in a reflectance characteristic |
| DE19647523A1 (en) | 1996-11-16 | 1998-05-20 | Claas Ohg | Agricultural utility vehicle with a processing device that is adjustable in its position and / or orientation relative to the vehicle |
| US5902343A (en) | 1996-11-22 | 1999-05-11 | Case Corporation | Automatic scaling of GPS field maps |
| US5978723A (en) | 1996-11-22 | 1999-11-02 | Case Corporation | Automatic identification of field boundaries in a site-specific farming system |
| US6029106A (en) | 1996-11-22 | 2000-02-22 | Case Corporation | Global position correction for the electronic display of field maps |
| US5974348A (en) | 1996-12-13 | 1999-10-26 | Rocks; James K. | System and method for performing mobile robotic work operations |
| JPH10191762A (en) | 1997-01-13 | 1998-07-28 | Yanmar Agricult Equip Co Ltd | Driving power controller for combine harvester |
| US5841282A (en) | 1997-02-10 | 1998-11-24 | Christy; Colin | Device for measuring soil conductivity |
| DE19705842A1 (en) | 1997-02-15 | 1998-08-20 | Same Deutz Fahr Spa | Field crop harvesting method |
| DE19706614A1 (en) | 1997-02-20 | 1998-08-27 | Claas Ohg | Situation-related program-controlled electronic map image display in a motor vehicle |
| US5809440A (en) | 1997-02-27 | 1998-09-15 | Patchen, Inc. | Agricultural implement having multiple agents for mapping fields |
| US5995894A (en) | 1997-05-27 | 1999-11-30 | Case Corporation | System for analyzing spatially-variable harvest data by pass |
| JP3013036B2 (en) | 1997-06-04 | 2000-02-28 | ヤンマー農機株式会社 | Combine |
| US5991687A (en) | 1997-07-02 | 1999-11-23 | Case Corporation | System and method for communicating information related to a geographical area |
| US5899950A (en) | 1997-07-07 | 1999-05-04 | Case Corporation | Sequential command repeater system for off-road vehicles |
| US5878821A (en) | 1997-07-08 | 1999-03-09 | Flenker; Kevin P. | Tillage implement with on-the-go angle and depth controlled discs |
| US5995895A (en) | 1997-07-15 | 1999-11-30 | Case Corporation | Control of vehicular systems in response to anticipated conditions predicted using predetermined geo-referenced maps |
| GB9716251D0 (en) | 1997-08-01 | 1997-10-08 | Philips Electronics Nv | Attribute interpolation in 3d graphics |
| PT1431463E (en) | 1997-08-20 | 2007-04-30 | Roxbury Ltd | Ground treatment |
| DE19740346A1 (en) | 1997-09-13 | 1999-03-18 | Claas Selbstfahr Erntemasch | Self-propelled work machine |
| US6178253B1 (en) | 1997-10-10 | 2001-01-23 | Case Corporation | Method of determining and treating the health of a crop |
| DE19800238C1 (en) | 1998-01-07 | 1999-08-26 | Claas Selbstfahr Erntemasch | System for setting a self-propelled harvester |
| US6041582A (en) | 1998-02-20 | 2000-03-28 | Case Corporation | System for recording soil conditions |
| GB9811177D0 (en) | 1998-05-26 | 1998-07-22 | Ford New Holland Nv | Methods for generating field maps |
| DE19828355C2 (en) | 1998-06-25 | 2000-09-07 | Lausitzer Und Mitteldeutsche B | Pneumatic-dynamic probe and method for the exploration and assessment of collable, non-cohesive soils |
| US6199000B1 (en) | 1998-07-15 | 2001-03-06 | Trimble Navigation Limited | Methods and apparatus for precision agriculture operations utilizing real time kinematic global positioning system systems |
| US6141614A (en) | 1998-07-16 | 2000-10-31 | Caterpillar Inc. | Computer-aided farming system and method |
| US6016713A (en) | 1998-07-29 | 2000-01-25 | Case Corporation | Soil sampling "on the fly" |
| DE19836659A1 (en) | 1998-08-13 | 2000-02-17 | Hoechst Schering Agrevo Gmbh | Use of synergistic herbicide combination including glufosinate- or glyphosate-type, imidazolinone, protoporphyrinogen oxidase inhibitory azole or hydroxybenzonitrile herbicide, to control weeds in cotton |
| US6327569B1 (en) | 1998-10-15 | 2001-12-04 | Milestone Technology, Inc. | System and methods for real time linkage between harvest environment and marketplace |
| US6272819B1 (en) | 1998-11-17 | 2001-08-14 | Case Corporation | Sugar cane yield monitor |
| US6216071B1 (en) | 1998-12-16 | 2001-04-10 | Caterpillar Inc. | Apparatus and method for monitoring and coordinating the harvesting and transporting operations of an agricultural crop by multiple agricultural machines on a field |
| US6380745B1 (en) | 1999-03-17 | 2002-04-30 | Dennis M. Anderson | Electrical geophysical apparatus for determining the density of porous materials and establishing geo-electric constants of porous material |
| US6205381B1 (en) | 1999-03-26 | 2001-03-20 | Caterpillar Inc. | Method and apparatus for providing autoguidance for multiple agricultural machines |
| US6119442A (en) | 1999-05-14 | 2000-09-19 | Case Corporation | Combine setting autoadjust with machine vision |
| GB2350275B (en) | 1999-05-25 | 2003-12-24 | Agco Ltd | Improvements in yield mapping |
| US6374173B1 (en) | 1999-05-28 | 2002-04-16 | Freightliner Llc | Terrain adaptive cruise control |
| US6188942B1 (en) | 1999-06-04 | 2001-02-13 | Caterpillar Inc. | Method and apparatus for determining the performance of a compaction machine based on energy transfer |
| JP3460224B2 (en) | 1999-06-09 | 2003-10-27 | 株式会社大林組 | Embankment compaction management system |
| US6236924B1 (en) | 1999-06-21 | 2001-05-22 | Caterpillar Inc. | System and method for planning the operations of an agricultural machine in a field |
| US6119531A (en) | 1999-08-03 | 2000-09-19 | Case Corporation | Crop sampling system |
| JP2001057809A (en) | 1999-08-20 | 2001-03-06 | Yanmar Agricult Equip Co Ltd | Memory controller for error signal in farm working machine |
| US6505146B1 (en) | 1999-09-24 | 2003-01-07 | Monsanto Company | Method and system for spatial evaluation of field and crop performance |
| CA2283767C (en) | 1999-09-27 | 2007-06-19 | Monsanto Company | Method and system for spatial evaluation of field crop perfomance |
| PL204341B1 (en) | 1999-10-14 | 2010-01-29 | Basf Ag | Synergisitc herbicide and method for synergistic weed destruction |
| AU2001227586A1 (en) | 2000-01-14 | 2001-07-24 | Ag-Chem Equipment Company, Inc. | Application report and method for creating the same |
| CA2330979A1 (en) | 2000-02-10 | 2001-08-10 | L. Gregory Alster | Method and apparatus for controlling harvesting of trees |
| FI114171B (en) | 2000-05-12 | 2004-08-31 | Antti Paakkinen | Method for measuring the compaction properties of soil masses and other similar masses |
| DE10023443A1 (en) | 2000-05-12 | 2001-11-15 | Deere & Co | Conveyor |
| GT200100103A (en) | 2000-06-09 | 2002-02-21 | NEW HERBICIDES | |
| US6460008B1 (en) | 2000-07-19 | 2002-10-01 | Ivan E. Hardt | Yield monitoring system for grain harvesting combine |
| US6735568B1 (en) | 2000-08-10 | 2004-05-11 | Eharmony.Com | Method and system for identifying people who are likely to have a successful relationship |
| US6522948B1 (en) | 2000-08-14 | 2003-02-18 | Flexi-Coil Ltd. | Agricultural product application tracking and control |
| SE520299C2 (en) | 2000-08-23 | 2003-06-24 | Bengt Soervik | Process and system for handling pieces of wood |
| US6539102B1 (en) | 2000-09-01 | 2003-03-25 | Large Scale Proteomics | Reference database |
| US6591145B1 (en) | 2000-09-21 | 2003-07-08 | Bechtel Bwxt Idaho, Llc | Systems and methods for autonomously controlling agricultural machinery |
| DE10050224A1 (en) | 2000-10-11 | 2002-04-25 | Volkswagen Ag | Moving object monitoring and control method involves transmitting position data of object to remote control unit using mobile unit, which is controlled by control unit |
| DE10053446B4 (en) | 2000-10-27 | 2006-03-02 | Wacker Construction Equipment Ag | Steerable vibration plate and mobile vibrating plate system |
| CN2451633Y (en) | 2000-11-23 | 2001-10-03 | 鹤壁市公路管理总段第二工程处 | Road soil base compactness survey sampler |
| FR2817344B1 (en) | 2000-11-28 | 2003-05-09 | Sol Solution | DYNAMIC PENETROMETER WITH VARIABLE ENERGY |
| JP2002186348A (en) | 2000-12-20 | 2002-07-02 | Yanmar Agricult Equip Co Ltd | System for transporting grains to grain storage facility |
| US6682416B2 (en) | 2000-12-23 | 2004-01-27 | Claas Selbstfahrende Erntemaschinen Gmbh | Automatic adjustment of a transfer device on an agricultural harvesting machine |
| DE10064861A1 (en) | 2000-12-23 | 2002-06-27 | Claas Selbstfahr Erntemasch | Automatic control of a top transfer device of a combine harvester so that it correctly directs harvested grain into a collection trailer by use of satellite or GPS positioning devices |
| DE10064862A1 (en) | 2000-12-23 | 2002-07-11 | Claas Selbstfahr Erntemasch | Device and method for coordinating and adjusting agricultural vehicles |
| GB2372105B (en) | 2001-02-13 | 2004-10-27 | Agco Ltd | Improvements in Mapping Techniques |
| ATE322151T1 (en) | 2001-03-08 | 2006-04-15 | Deere & Co | MEANS FOR MEASURING THE CUTTING WIDTH OF CROP |
| DE10120173B4 (en) | 2001-04-24 | 2006-02-23 | Gebr. Pöttinger GmbH | Method and device for operating agricultural machines |
| DE10129135B4 (en) | 2001-06-16 | 2013-10-24 | Deere & Company | Device for determining the position of an agricultural work vehicle and an agricultural work vehicle with this |
| DE10129133A1 (en) | 2001-06-16 | 2002-12-19 | Deere & Co | Device for the automatic steering of an agricultural work vehicle |
| US6549849B2 (en) | 2001-06-25 | 2003-04-15 | Trimble Navigation Ltd. | Guidance pattern allowing for access paths |
| DE10130665A1 (en) | 2001-06-28 | 2003-01-23 | Deere & Co | Device for measuring the amount of plants in a field |
| DE10133191A1 (en) | 2001-07-07 | 2003-01-16 | Deere & Co | Agricultural order combination |
| DE10134141A1 (en) | 2001-07-13 | 2003-02-06 | Deere & Co | Distribution device for chopped material emerging from a harvester |
| US6553300B2 (en) | 2001-07-16 | 2003-04-22 | Deere & Company | Harvester with intelligent hybrid control system |
| US6591591B2 (en) | 2001-07-30 | 2003-07-15 | Deere & Company | Harvester speed control with header position input |
| US6834550B2 (en) | 2001-09-10 | 2004-12-28 | The Regents Of The University Of California | Soil profile force measurement using an instrumented tine |
| US6592453B2 (en) | 2001-09-27 | 2003-07-15 | Deere & Company | Harvester feedrate control with tilt compensation |
| US6741921B2 (en) | 2001-10-05 | 2004-05-25 | Caterpillar Inc | Multi-stage truck assignment system and method |
| US6655351B2 (en) | 2001-10-24 | 2003-12-02 | Deere & Company | Vehicle engine control |
| US7034666B2 (en) | 2002-02-20 | 2006-04-25 | Scott William Knutson | Device used to aid in the loading and unloading of vehicles and implements |
| US6943824B2 (en) | 2002-03-13 | 2005-09-13 | Deere & Company | Image processing spout control system |
| US7761334B2 (en) | 2002-03-20 | 2010-07-20 | Deere & Company | Method and system for automated tracing of an agricultural product |
| US6726559B2 (en) | 2002-05-14 | 2004-04-27 | Deere & Company | Harvester with control system considering operator feedback |
| NL1020792C2 (en) | 2002-06-06 | 2003-12-09 | Lely Entpr Ag | Agricultural machine for performing an agricultural operation. |
| NL1020804C2 (en) | 2002-06-06 | 2003-12-09 | Lely Entpr Ag | Method and system for performing at least two agricultural operations on an agricultural plot. |
| US7062368B2 (en) | 2002-06-11 | 2006-06-13 | Cnh America Llc | Combine having a system estimator to automatically estimate and dynamically change a target control parameter in a control algorithm |
| DE10230474A1 (en) | 2002-07-06 | 2004-01-15 | Deere & Company, Moline | Device for documenting the operation of an additional device for a work machine |
| US6681551B1 (en) | 2002-07-11 | 2004-01-27 | Deere & Co. | Programmable function control for combine |
| GB0217297D0 (en) | 2002-07-26 | 2002-09-04 | Cnh Belgium Nv | Methods of optimising stochastic processing parameters in crop harvesting machines |
| US7103451B2 (en) | 2002-08-19 | 2006-09-05 | Intime, Inc. | Method and system for spatially variable rate application of agricultural chemicals based on remotely sensed vegetation data |
| DE10240219A1 (en) | 2002-08-28 | 2004-03-11 | Claas Selbstfahrende Erntemaschinen Gmbh | Device for controlling a transfer device |
| US6687616B1 (en) | 2002-09-09 | 2004-02-03 | Pioneer Hi-Bred International, Inc. | Post-harvest non-containerized reporting system |
| US20040073468A1 (en) | 2002-10-10 | 2004-04-15 | Caterpillar Inc. | System and method of managing a fleet of machines |
| EP1410715A1 (en) | 2002-10-19 | 2004-04-21 | Bayer CropScience GmbH | Combinations of aryloxyphenoxypropionates and safeners and their use for increasing weed control |
| DE10303516A1 (en) | 2003-01-30 | 2004-08-12 | Amazonen-Werke H. Dreyer Gmbh & Co. Kg | Device for working and / or cultivating agricultural land |
| US7047133B1 (en) | 2003-01-31 | 2006-05-16 | Deere & Company | Method and system of evaluating performance of a crop |
| US6999877B1 (en) | 2003-01-31 | 2006-02-14 | Deere & Company | Method and system of evaluating performance of a crop |
| WO2004083531A2 (en) | 2003-03-13 | 2004-09-30 | Burton James D | Soil sampler apparatus and method |
| DE10314573A1 (en) | 2003-03-31 | 2004-10-28 | Henkel Kgaa | Process for computer-aided regulation of a plurality of machines coupled in series with one another, control device and machine arrangement |
| US6907336B2 (en) | 2003-03-31 | 2005-06-14 | Deere & Company | Method and system for efficiently traversing an area with a work vehicle |
| IL156478A0 (en) | 2003-06-17 | 2004-07-25 | Odf Optronics Ltd | Compact rotating observation assembly with a separate receiving and display unit |
| US7073374B2 (en) | 2003-07-30 | 2006-07-11 | Bbnt Solutions Llc | Soil compaction measurement on moving platform |
| DE10342922A1 (en) | 2003-09-15 | 2005-05-19 | Claas Selbstfahrende Erntemaschinen Gmbh | Chopping and distribution device |
| EP1516961B1 (en) | 2003-09-19 | 2013-12-25 | Ammann Aufbereitung AG | Method for determining soil rigidity and soil compaction device |
| US7408145B2 (en) | 2003-09-23 | 2008-08-05 | Kyle Holland | Light sensing instrument with modulated polychromatic source |
| KR20060123344A (en) | 2003-12-19 | 2006-12-01 | 바스프 악티엔게젤샤프트 | Benzoyl-substituted phenylalanine amides |
| US8407157B2 (en) | 2003-12-22 | 2013-03-26 | Deere & Company | Locating harvested material within a work area |
| US7191062B2 (en) | 2003-12-22 | 2007-03-13 | Caterpillar Inc | Method and system of forecasting compaction performance |
| US20050150202A1 (en) | 2004-01-08 | 2005-07-14 | Iowa State University Research Foundation, Inc. | Apparatus and method for monitoring and controlling an agricultural harvesting machine to enhance the economic harvesting performance thereof |
| JP2005227233A (en) | 2004-02-16 | 2005-08-25 | Taisei Corp | Measuring system of ground density |
| DE102004011789A1 (en) | 2004-03-09 | 2005-09-29 | Claas Selbstfahrende Erntemaschinen Gmbh | Device for detecting a loading wagon |
| KR20070004607A (en) | 2004-03-27 | 2007-01-09 | 바이엘 크롭사이언스 게엠베하 | Use of sulfonylurears |
| DE102004025135B4 (en) | 2004-05-17 | 2006-04-20 | Pt-Poly-Tec Gmbh Vertrieb Und Herstellung Von Dichtsystemen | Method and arrangement for leakage warning and component positioning display in socket joints |
| US20070199903A1 (en) | 2004-05-18 | 2007-08-30 | Denney Larry W | System For Removing Solids From Aqueous Solutions |
| US20050283314A1 (en) | 2004-06-10 | 2005-12-22 | Pioneer Hi-Bred International, Inc. | Apparatus, method and system of information gathering and use |
| US7261632B2 (en) | 2004-06-21 | 2007-08-28 | Deere & Company | Self-propelled harvesting machine |
| DE102004031211A1 (en) | 2004-06-28 | 2006-02-09 | Claas Selbstfahrende Erntemaschinen Gmbh | Method and device for controlling an agricultural machine |
| DE102004034799A1 (en) | 2004-07-19 | 2006-03-16 | Claas Selbstfahrende Erntemaschinen Gmbh | Communication system for mobile and stationary facilities |
| DE102004039460B3 (en) | 2004-08-14 | 2006-04-20 | Deere & Company, Moline | A system for determining the relative position of a second agricultural vehicle with respect to a first agricultural vehicle |
| US7703036B2 (en) | 2004-08-16 | 2010-04-20 | Microsoft Corporation | User interface for displaying selectable software functionality controls that are relevant to a selected object |
| US7398137B2 (en) | 2004-08-25 | 2008-07-08 | Caterpillar Inc. | System and method for remotely controlling machine operations using mapping information |
| DE102004043169A1 (en) | 2004-09-03 | 2006-03-09 | Claas Selbstfahrende Erntemaschinen Gmbh | Electronic data exchange system |
| DE202004015141U1 (en) | 2004-09-27 | 2004-12-09 | Weber Maschinentechnik Gmbh | Ground compactor for compacting foundations and building materials, has acceleration sensor on baseplate, and indicator for showing degree of compaction |
| DE102004052298A1 (en) | 2004-10-06 | 2006-06-08 | Claas Selbstfahrende Erntemaschinen Gmbh | Overcharge assistance system |
| US7211994B1 (en) | 2004-10-12 | 2007-05-01 | Federal Network Systems Inc. | Lightning and electro-magnetic pulse location and detection for the discovery of land line location |
| US7248968B2 (en) | 2004-10-29 | 2007-07-24 | Deere & Company | Obstacle detection using stereo vision |
| DE102004061439A1 (en) | 2004-12-17 | 2006-07-13 | Claas Selbstfahrende Erntemaschinen Gmbh | Data generation and transmission system in agricultural machines |
| JP2006166871A (en) | 2004-12-20 | 2006-06-29 | Iseki & Co Ltd | Combine-regulating device for regulating harvesting implement |
| DE102004063104A1 (en) | 2004-12-22 | 2006-07-13 | Claas Selbstfahrende Erntemaschinen Gmbh | Agricultural working machine |
| DE102005000770B3 (en) | 2005-01-05 | 2006-07-20 | Langlott, Jürgen | Combine harvester`s working parts and speed controlling method, involves acquiring yield data and providing reference map by utilizing software based on acquired yield data, where map is inserted into onboard system of harvester |
| DE102005000771A1 (en) | 2005-01-05 | 2006-08-24 | Langlott, Jürgen | Self-propelled harvester controlling method, involves allocating detected and mapped/ factored biomass stock data by software, and creating control process to control and adjust all functional units among each other, and speed of harvester |
| US7194965B2 (en) | 2005-01-06 | 2007-03-27 | Deere & Company | Variety locator |
| RU2005102554A (en) | 2005-02-02 | 2006-07-10 | Дальневосточный научно-исследовательский и проектно-технологический институт механизации и электрификации сельского хоз йства (ГНУ ДальНИПТИМЭСХ) (RU) | METHOD FOR ASSESSING FIELD DENSITY |
| DE102005008105A1 (en) | 2005-02-21 | 2006-08-31 | Amazonen-Werke H. Dreyer Gmbh & Co. Kg | Electronic Machine Management System |
| US20060200334A1 (en) | 2005-03-07 | 2006-09-07 | Deere & Company, A Delaware Corporation | Method of predicting suitability for a soil engaging operation |
| US7167797B2 (en) | 2005-03-07 | 2007-01-23 | Deere & Company | Method of predicting suitability for a crop harvesting operation |
| US7167800B2 (en) | 2005-04-12 | 2007-01-23 | Deere & Company | Method of optimizing remote sensing operation timing |
| HU3056U (en) | 2005-04-29 | 2006-03-28 | G & G Noevenyvedelmi Es Keresk | Construction for making weed map |
| DE102005025318A1 (en) | 2005-06-02 | 2006-12-14 | Deere & Company, Moline | Agricultural harvester with a discharge device and a collision sensor |
| BRPI0502658A (en) | 2005-06-28 | 2007-02-13 | Unicamp | weight monitoring system and process on conveyor belts |
| DE102005031426A1 (en) | 2005-07-04 | 2007-01-18 | Claas Selbstfahrende Erntemaschinen Gmbh | Method and device for optimizing operating parameters of an agricultural working machine |
| US20070021948A1 (en) | 2005-07-21 | 2007-01-25 | Anderson Noel W | Variable rate prescription generation using heterogenous prescription sources with learned weighting factors |
| DE102005038553A1 (en) | 2005-08-12 | 2007-02-22 | Claas Selbstfahrende Erntemaschinen Gmbh | Process for overloading crops |
| DE102005043991A1 (en) | 2005-09-14 | 2007-08-09 | Claas Selbstfahrende Erntemaschinen Gmbh | Method for adjusting a working unit of a harvester |
| CN100416590C (en) | 2005-09-23 | 2008-09-03 | 中国农业机械化科学研究院 | Method for automatically identifying field weeds in crop seeding-stage using site and grain characteristic |
| US7302837B2 (en) | 2005-09-27 | 2007-12-04 | Cnh America Llc | Tire inflation system for use with an agricultural implement |
| US7945364B2 (en) | 2005-09-30 | 2011-05-17 | Caterpillar Inc. | Service for improving haulage efficiency |
| US7725233B2 (en) | 2005-10-25 | 2010-05-25 | Deere & Company | Crop attribute map input for vehicle guidance |
| US7827042B2 (en) | 2005-11-30 | 2010-11-02 | The Invention Science Fund I, Inc | Methods and systems related to transmission of nutraceutical associated information |
| DE102005059003A1 (en) | 2005-12-08 | 2008-03-27 | Claas Selbstfahrende Erntemaschinen Gmbh | Route planning system for agricultural machines |
| ES2311322B1 (en) | 2005-12-16 | 2009-11-30 | Consejo Superior Investigaciones Cientificas | PROCEDURE FOR THE DISCRIMINATION AND MAPPING OF THE RODALS OF BAD GRAMINE HERBS IN CEREAL CROPS BY REMOTE-DETECTION. |
| WO2007071585A1 (en) | 2005-12-22 | 2007-06-28 | Basf Se | Pestcidal compositions |
| US7318010B2 (en) | 2006-02-07 | 2008-01-08 | Deere & Company | Method of regulating wireless sensor network energy use |
| US20070185749A1 (en) | 2006-02-07 | 2007-08-09 | Anderson Noel W | Method for tracking hand-harvested orchard crops |
| US20080276590A1 (en) | 2006-02-10 | 2008-11-13 | Agco Corporation | Flexible draper and cutter bar with tilt arm for cutterbar drive |
| US20070208510A1 (en) | 2006-03-02 | 2007-09-06 | Deere & Company, A Delaware Corporation | Method of identifying and localizing drainage tile problems |
| DE102006015204A1 (en) | 2006-03-30 | 2007-10-18 | Claas Selbstfahrende Erntemaschinen Gmbh | Method for creating a route plan for agricultural machine systems |
| DE102006015203A1 (en) | 2006-03-30 | 2007-11-15 | Claas Selbstfahrende Erntemaschinen Gmbh | Method for controlling agricultural machine systems |
| US20070239337A1 (en) | 2006-04-10 | 2007-10-11 | Deere & Company, A Delaware Corporation | System and method of optimizing ground engaging operations in multiple-fields |
| US7347168B2 (en) | 2006-05-15 | 2008-03-25 | Freightliner Llc | Predictive auxiliary load management (PALM) control apparatus and method |
| DE102006026572A1 (en) | 2006-06-06 | 2007-12-13 | Claas Selbstfahrende Erntemaschinen Gmbh | Method and device for displaying vehicle movements |
| US7313478B1 (en) | 2006-06-08 | 2007-12-25 | Deere & Company | Method for determining field readiness using soil moisture modeling |
| DE102006028909A1 (en) | 2006-06-21 | 2007-12-27 | Claas Selbstfahrende Erntemaschinen Gmbh | Communication network has multiple nodes equipped with transceiver units for conduction-free communication and memory assigned to each node for operating-parameter-profiles of multiple mobile machines |
| MXGT06000012A (en) | 2006-08-01 | 2008-01-31 | Univ Guanajuato | Device for measuring and mapping soil compaction, engageable to an agricultural tractor. |
| US20080030320A1 (en) | 2006-08-03 | 2008-02-07 | Deere & Company, A Delaware Corporation | Agricultural lift with data gathering capability |
| DE102006045280A1 (en) | 2006-09-22 | 2008-04-03 | Claas Selbstfahrende Erntemaschinen Gmbh | Device and method for coordinating a machine park |
| CZ17266U1 (en) | 2006-11-09 | 2007-02-15 | Šarec@Ondrej | Device for measuring soil compaction - penetrometer |
| US7628059B1 (en) | 2006-11-22 | 2009-12-08 | The Toro Company | Mobile turf instrument apparatus having driven, periodically insertable, ground penetrating probe assembly |
| US20080140431A1 (en) | 2006-12-07 | 2008-06-12 | Noel Wayne Anderson | Method of performing an agricultural work operation using real time prescription adjustment |
| EP1938686A1 (en) | 2006-12-29 | 2008-07-02 | Bayer CropScience AG | Substituted 1-(3-pyridinyl)pyrazol-4-yl-acetic acids, process for their preparation and their use as herbicide and plant growth regulator. |
| US9615501B2 (en) | 2007-01-18 | 2017-04-11 | Deere & Company | Controlling the position of an agricultural implement coupled to an agricultural vehicle based upon three-dimensional topography data |
| CN101236188B (en) | 2007-01-31 | 2011-04-13 | 北京林业大学 | Soil moisture wireless measuring apparatus |
| DE102007016670A1 (en) | 2007-04-04 | 2008-10-09 | Claas Selbstfahrende Erntemaschinen Gmbh | Self-propelled agricultural harvester with controllable transfer device |
| US8177610B2 (en) | 2007-04-05 | 2012-05-15 | Iowa State University Research Foundation, Inc. | Combination residue spreader and collector for single pass harvesting systems |
| DE102007018743A1 (en) | 2007-04-22 | 2008-10-23 | Bomag Gmbh | Method and system for controlling compaction machines |
| US7487024B2 (en) | 2007-04-26 | 2009-02-03 | Cnh America Llc | Apparatus and method for automatically setting operating parameters for a remotely adjustable spreader of an agricultural harvesting machine |
| EP1987718A1 (en) | 2007-04-30 | 2008-11-05 | Bayer CropScience AG | Utilisation of pyridine-2-oxy-3-carbon amides as safener |
| US8010261B2 (en) | 2007-05-23 | 2011-08-30 | Cnh America Llc | Automatic steering correction of an agricultural harvester using integration of harvester header row sensors and harvester auto guidance system |
| TW200904330A (en) | 2007-06-15 | 2009-02-01 | Bayer Cropscience Sa | Pesticidal composition comprising a strigolactone derivative and a fungicide compound |
| TW200904331A (en) | 2007-06-15 | 2009-02-01 | Bayer Cropscience Sa | Pesticidal composition comprising a strigolactone derivative and an insecticide compound |
| FR2901291B1 (en) | 2007-07-06 | 2020-10-09 | Soc Du Canal De Provence Et Damenagement De La Region Provencale | DEVICE FOR MEASURING THE SETTLEMENT OF SOIL SUPPORTING A CONSTRUCTION |
| DE102007032309A1 (en) | 2007-07-11 | 2009-01-15 | Deere & Company, Moline | operating device |
| ATE546991T1 (en) | 2007-08-03 | 2012-03-15 | Agrocom Gmbh & Co Agrarsystem Kg | AGRICULTURAL WORKING MACHINE |
| AU2008287109B2 (en) | 2007-08-13 | 2012-03-15 | Dow Agrosciences Llc | 2-(2-fluoro-substituted phenyl)-6-amino-5-chloro-4-pyrimidinecarboxylates and their use as herbicides |
| US8073235B2 (en) | 2007-08-13 | 2011-12-06 | Pioneer Hi-Bred International, Inc. | Method and system for digital image analysis of ear traits |
| GB0717986D0 (en) | 2007-09-14 | 2007-10-24 | Cnh Belgium Nv | A method and apparatus for detecting errors in electronically processed images |
| EP2193352B1 (en) | 2007-09-26 | 2017-04-12 | Precision Planting LLC | System and method for determining proper downforce for a planter row unit |
| US8060283B2 (en) | 2007-10-15 | 2011-11-15 | Deere & Company | Method and system for controlling the loading of a container associated with a vehicle |
| EP2052604A1 (en) | 2007-10-24 | 2009-04-29 | Bayer CropScience AG | Salts of 2-lodo-N-[(4-methoxy-6-methyl-1,3,5-triazin-2-yl)carbamoyl] benzol sulphonamide, method for its manufacture and its application as herbicide and plant growth regulator |
| EP2052616A1 (en) | 2007-10-24 | 2009-04-29 | Bayer CropScience AG | Herbicide safener combination |
| DE102007053912A1 (en) | 2007-11-09 | 2009-05-14 | Claas Selbstfahrende Erntemaschinen Gmbh | Overcharge assistance system |
| US8024074B2 (en) | 2007-12-07 | 2011-09-20 | Deere & Company | System and method of managing substances in a plant root zone |
| US8924030B2 (en) | 2008-01-24 | 2014-12-30 | Cnh Industrial America Llc | Method and apparatus for optimization of agricultural field operations using weather, product and environmental information |
| US8190335B2 (en) | 2008-02-04 | 2012-05-29 | Caterpillar Inc. | Performance management system for multi-machine worksite |
| CA2715006A1 (en) | 2008-02-13 | 2009-08-20 | Grains Research And Development Corporation | Weed and volunteer crop seed destruction |
| US20090216410A1 (en) | 2008-02-26 | 2009-08-27 | William Edward Allen | Automated machine management system with destination selection |
| DE102008015277A1 (en) | 2008-03-20 | 2009-09-24 | Deere & Company, Moline | Method and device for steering a second agricultural machine, which is steerable over a field relative to a first agricultural machine |
| US20090259483A1 (en) | 2008-04-11 | 2009-10-15 | Larry Lee Hendrickson | Method for making a land management decision based on processed elevational data |
| US8060269B2 (en) | 2008-04-16 | 2011-11-15 | Cnh America Llc | Swath line creation including slope compensation for an automatic guidance system of a work vehicle |
| DE102008020494A1 (en) | 2008-04-23 | 2009-10-29 | Claas Selbstfahrende Erntemaschinen Gmbh | Method for coordinating multiple mobile agricultural machines, involves signalizing newly simulated cycles when deviation is occurred between real operating condition and operating condition performed according to simulated cycles |
| DE102008021785A1 (en) | 2008-04-30 | 2009-11-05 | Claas Selbstfahrende Erntemaschinen Gmbh | Device for coordinating operating phase of agricultural surface, has medium for receiving position information of multiple vehicles under operating vehicles and transport vehicles |
| CN201218789Y (en) | 2008-05-09 | 2009-04-08 | 昆明理工大学 | Hand-hold constant-pressure soil compactness measuring apparatus |
| CA2629555A1 (en) | 2008-05-14 | 2009-11-14 | Gerard Voon | Related/overlapping innovations in health/energy/transport/farming and infrastructure |
| DE102008002006A1 (en) | 2008-05-27 | 2009-12-03 | Deere & Company, Moline | Control arrangement for controlling the transfer of agricultural crop from a harvester to a transport vehicle |
| DE102008027282A1 (en) | 2008-06-06 | 2009-12-10 | Claas Industrietechnik Gmbh | Agricultural vehicle and operating procedure for it |
| US8175775B2 (en) | 2008-06-11 | 2012-05-08 | Cnh America Llc | System and method employing short range communications for establishing performance parameters of an exemplar agricultural machine among a plurality of like-purpose agricultural machines |
| DE102008027906A1 (en) | 2008-06-12 | 2009-12-17 | Claas Selbstfahrende Erntemaschinen Gmbh | Agricultural harvester |
| US8147176B2 (en) | 2008-06-17 | 2012-04-03 | Deere & Company | Work machine and unloading system for unloading an agricultural product from a work machine |
| ES2332567B1 (en) | 2008-06-27 | 2011-02-10 | Consejo Superior Investigacion | AUTOMATIC PROCEDURE TO SECTION REMOTE IMAGES AND CHARACTERIZE AGRONOMIC AND ENVIRONMENTAL INDICATORS IN THE SAME |
| US8032255B2 (en) | 2008-06-30 | 2011-10-04 | Deere & Company | Monitoring of bin level for an agricultural product |
| CN101303338B (en) | 2008-07-01 | 2011-10-05 | 中国农业大学 | Vehicle mounted traveling type soil density sensor |
| WO2010003421A1 (en) | 2008-07-08 | 2010-01-14 | Aarhus Universitet | Method for optimizing harvesting of crops |
| DE102008032418A1 (en) | 2008-07-10 | 2010-01-14 | Claas Selbstfahrende Erntemaschinen Gmbh | Agricultural machine association |
| BRPI0802384B1 (en) | 2008-07-23 | 2019-04-30 | Roberto Shiniti Sako | PORTABLE PENETROMETER FOR SOIL COMPACTION ANALYSIS |
| KR100974892B1 (en) | 2008-08-01 | 2010-08-11 | 한국철도기술연구원 | Quality Control Method of Reinforcing Ground |
| US9152938B2 (en) | 2008-08-11 | 2015-10-06 | Farmlink Llc | Agricultural machine and operator performance information systems and related methods |
| US8280595B2 (en) | 2008-08-12 | 2012-10-02 | Cnh America Llc | System and method employing short range communications for communicating and exchanging operational and logistical status information among a plurality of agricultural machines |
| US9235214B2 (en) | 2008-09-11 | 2016-01-12 | Deere & Company | Distributed knowledge base method for vehicular localization and work-site management |
| US8478493B2 (en) | 2008-09-11 | 2013-07-02 | Deere & Company | High integrity perception program |
| US8224500B2 (en) | 2008-09-11 | 2012-07-17 | Deere & Company | Distributed knowledge base program for vehicular localization and work-site management |
| US8195342B2 (en) | 2008-09-11 | 2012-06-05 | Deere & Company | Distributed knowledge base for vehicular localization and work-site management |
| US8818567B2 (en) | 2008-09-11 | 2014-08-26 | Deere & Company | High integrity perception for machine localization and safeguarding |
| US8195358B2 (en) | 2008-09-11 | 2012-06-05 | Deere & Company | Multi-vehicle high integrity perception |
| US8145393B2 (en) | 2008-09-17 | 2012-03-27 | Cnh America Llc | System and method employing short range communications for interactively coordinating unloading operations between a harvester and a grain transport |
| GB0817172D0 (en) | 2008-09-19 | 2008-10-29 | Cnh Belgium Nv | Control system for an agricultural harvesting machine |
| CN101363833B (en) | 2008-09-25 | 2012-02-22 | 中国科学院地质与地球物理研究所 | Soil tamp and drainage model test device |
| DE102008050460A1 (en) | 2008-10-08 | 2010-04-15 | Claas Selbstfahrende Erntemaschinen Gmbh | Method for controlling the use of agricultural machines |
| US8639408B2 (en) | 2008-10-15 | 2014-01-28 | Deere & Company | High integrity coordination system for multiple off-road vehicles |
| DE102008056557A1 (en) | 2008-11-10 | 2010-05-12 | Claas Selbstfahrende Erntemaschinen Gmbh | Creation of image databases for image analysis |
| DE102008061252A1 (en) | 2008-11-24 | 2010-05-27 | Claas Selbstfahrende Erntemaschinen Gmbh | Method for supporting the automation of agricultural services |
| EP2191719A1 (en) | 2008-11-29 | 2010-06-02 | Bayer CropScience AG | Herbicide safener combination |
| KR101067576B1 (en) | 2008-12-03 | 2011-09-27 | 한국수자원공사 | Measurement method and device of characteristics of soil compaction in laboratory |
| US8577537B2 (en) | 2008-12-16 | 2013-11-05 | Agco Corporation | Methods and systems for optimizing performance of vehicle guidance systems |
| EP2210879A1 (en) | 2008-12-30 | 2010-07-28 | Bayer CropScience AG | Pyrimidine derivatives and use thereof for combating undesired plant growth |
| DE102009009817A1 (en) | 2009-02-20 | 2010-08-26 | Claas Selbstfahrende Erntemaschinen Gmbh | Agricultural work vehicle and control unit for it |
| DE102009009767A1 (en) | 2009-02-20 | 2010-08-26 | Claas Selbstfahrende Erntemaschinen Gmbh | Driver assistance system for agricultural machine |
| CN101929166B (en) | 2009-04-14 | 2012-08-08 | 洛阳路为电子科技有限公司 | Portable soil matrix compactness measuring apparatus |
| US8321365B2 (en) | 2009-04-21 | 2012-11-27 | Deere & Company | Horticultural knowledge base for managing yards and gardens |
| US9538714B2 (en) | 2009-04-21 | 2017-01-10 | Deere & Company | Managing resource prescriptions of botanical plants |
| US7993188B2 (en) | 2009-06-09 | 2011-08-09 | Deere & Company | Variable rate diverter for a crop residue collecting device carried by a combine harvester |
| DE102009025438A1 (en) | 2009-06-16 | 2011-01-05 | Claas Selbstfahrende Erntemaschinen Gmbh | Route planning procedure and system |
| US20100319941A1 (en) | 2009-06-22 | 2010-12-23 | Agco Corp. | Trenching Device And System |
| DE102009027245A1 (en) | 2009-06-26 | 2010-12-30 | Deere & Company, Moline | Control arrangement for controlling the transfer of agricultural crop from a harvester to a transport vehicle |
| KR20110018582A (en) | 2009-08-18 | 2011-02-24 | 진성기 | Production of soil brick and block using liquid or powder hardening agent |
| EP2311307B1 (en) | 2009-09-07 | 2011-12-07 | CLAAS Agrosystems GmbH & Co. KG | A filling degree gauge, an agricultural vehicle comprising such gauge, and a method of controlling filling of a target area |
| US20110224873A1 (en) | 2009-09-17 | 2011-09-15 | Reeve David R | Vehicle assembly controller with automaton framework and control method |
| DE102009041646A1 (en) | 2009-09-17 | 2011-03-24 | Claas Selbstfahrende Erntemaschinen Gmbh | Self-propelled agricultural machine has receiving tool for receiving harvest from field, contactless proximity sensor, and autopilot unit for guiding machine depending on detected crop edge |
| AU2010224431A1 (en) | 2009-09-29 | 2011-04-14 | Riteway Holdings Australia Pty Ltd | An apparatus to be used in conjunction with a grain harvester for collecting weeds, weed seeds, chaff and so forth |
| US9345194B2 (en) | 2009-09-30 | 2016-05-24 | Cnh Industrial America Llc | Automatic display of remote camera image |
| CZ20252U1 (en) | 2009-10-06 | 2009-11-16 | Šarec@Petr | IInstrument for measuring soil compaction with laser scanning of depth - laser penetrometer |
| US8082809B2 (en) | 2009-10-08 | 2011-12-27 | Pioneer Hi-Bred International, Inc. | Combine harvester and associated method for selectively gathering grain test data |
| US8344897B2 (en) | 2009-10-12 | 2013-01-01 | Agco Corporation | System and method for assisting in the refilling of agricultural vehicles |
| KR101134075B1 (en) | 2009-10-13 | 2012-04-13 | 한국건설기술연구원 | Tracking Method and Apparatus of Construction Vehicle for Soil Compaction |
| US8738238B2 (en) | 2009-11-12 | 2014-05-27 | Deere & Company | Coordination of vehicle movement in a field |
| US8494727B2 (en) | 2009-11-25 | 2013-07-23 | Aarhus Universitet | System for reducing compaction of soil |
| US8635903B2 (en) | 2009-12-22 | 2014-01-28 | Caterpillar Paving Products Inc. | Method and system for compaction measurement |
| US20110160961A1 (en) | 2009-12-29 | 2011-06-30 | Agco Corporation | Guidance using a worked edge for wayline generation |
| DE102010004648A1 (en) | 2010-01-13 | 2011-07-14 | CLAAS Selbstfahrende Erntemaschinen GmbH, 33428 | Harvester i.e. chaff-cutter, for cutting crops, has control unit operating door and manifolds to change overloading device from one position into another position, where harvest jet is directed into loading containers in positions |
| CA2765100C (en) | 2010-01-15 | 2015-02-17 | Leica Geosystems Ag | A system and method of data sharing between roving agricultural vehicles |
| CN102138383A (en) | 2010-01-28 | 2011-08-03 | 中国农业机械化科学研究院 | Method and device for measuring grain loss spatial distribution of combine harvester |
| EP2353353A1 (en) | 2010-02-05 | 2011-08-10 | Flander's Mechatronics Technology Centre v.z.w. | In use adaptation of schedule for multi-vehicle ground processing operations |
| RU2421744C1 (en) | 2010-02-15 | 2011-06-20 | Открытое акционерное общество "Научно-исследовательский институт приборостроения имени В.В. Тихомирова" | Compact testing ground for measuring characteristics of various antenna systems |
| US10537061B2 (en) | 2010-02-26 | 2020-01-21 | Cnh Industrial America Llc | System and method for controlling harvest operations |
| JP5522785B2 (en) | 2010-03-19 | 2014-06-18 | 株式会社日立ソリューションズ | Agricultural work vehicle operation management system |
| JP2011205967A (en) | 2010-03-30 | 2011-10-20 | Takayuki Nishida | Robot for preventing growth of weed in paddy field |
| US20110257850A1 (en) | 2010-04-14 | 2011-10-20 | Reeve David R | Vehicle assembly control system and method for composing or decomposing a task |
| US8527157B2 (en) | 2010-04-28 | 2013-09-03 | Deere & Company | Agricultural combine and draper header |
| US8463510B2 (en) | 2010-04-30 | 2013-06-11 | Cnh America Llc | GPS controlled residue spread width |
| CN101839906B (en) | 2010-05-10 | 2013-10-09 | 吉林大学 | Conical soil-engaging component with abrasion-resistant geometric structural surface |
| CA135611S (en) | 2010-05-19 | 2011-05-05 | Rhonda Genest | Weed removing and grooming garden hand tool |
| US8676620B2 (en) | 2010-05-28 | 2014-03-18 | Agjunction Llc | System and method for workorder management |
| US8380401B2 (en) | 2010-06-09 | 2013-02-19 | Cnh America Llc | Automatic grain transfer control system based on real time modeling of a fill level profile for regions of the receiving container |
| DE102010017687A1 (en) | 2010-07-01 | 2012-01-05 | Claas Selbstfahrende Erntemaschinen Gmbh | Method for adjusting at least one working member of a self-propelled harvester |
| BE1019422A3 (en) | 2010-07-14 | 2012-07-03 | Cnh Belgium Nv | METHOD AND APPARATUS FOR PREDICTIVE CONTROL OF AN AGRICULTURAL VEHICLE SYSTEM. |
| DE102010038661B4 (en) | 2010-07-29 | 2020-07-02 | Deere & Company | Harvester with a sensor attached to an aircraft |
| US8544397B2 (en) | 2010-09-15 | 2013-10-01 | Dawn Equipment Company | Row unit for agricultural implement |
| DE102010053331A1 (en) | 2010-09-28 | 2012-03-29 | Lacos Computerservice Gmbh | Method and navigation device for optimizing the transport of agricultural products |
| US9043129B2 (en) | 2010-10-05 | 2015-05-26 | Deere & Company | Method for governing a speed of an autonomous vehicle |
| US9072227B2 (en) | 2010-10-08 | 2015-07-07 | Deere & Company | System and method for improvement of harvest with crop storage in grain bags |
| US8789563B2 (en) | 2010-10-12 | 2014-07-29 | Deere & Company | Intelligent grain bag loader |
| US8677724B2 (en) | 2010-10-25 | 2014-03-25 | Deere & Company | Round baler for baling crop residue |
| US8596194B2 (en) | 2010-10-28 | 2013-12-03 | Deere & Company | Method and apparatus for determining fraction of hay at different moisture levels |
| DE102010043854B4 (en) | 2010-11-12 | 2016-01-14 | Deere & Company | Control arrangement for controlling the transfer of agricultural crop from a harvester to a transport vehicle |
| DE102010052713A1 (en) | 2010-11-26 | 2012-05-31 | Bomag Gmbh | A traveling soil compacting device and method for detecting a layer E modulus of a topmost layer of said bottom layer structure |
| GB2492954A (en) | 2010-12-06 | 2013-01-23 | Agco Corp | A system for automatic agricultural reporting |
| RU2447640C1 (en) | 2010-12-08 | 2012-04-20 | Василий Васильевич Ефанов | Method of control of operating process of harvesting machine and system for its implementation |
| CN102080373B (en) | 2010-12-09 | 2012-07-04 | 西安建筑科技大学 | Construction method for jointly treating collapsibility of loess foundation by using DDC (Downhole Dynamic Compaction) pile and pile foundation |
| UA115967C2 (en) | 2011-01-04 | 2018-01-25 | Зе Клаймат Корпорейшн | Methods for generating soil maps and application prescriptions |
| ITTO20110133A1 (en) | 2011-02-16 | 2012-08-17 | Cnh Italia Spa | WIRELESS COMMUNICATION SYSTEM FOR AGRICULTURAL VEHICLES |
| US8606454B2 (en) | 2011-02-18 | 2013-12-10 | Cnh America Llc | System and method for synchronized control of a harvester and transport vehicle |
| US8463460B2 (en) | 2011-02-18 | 2013-06-11 | Caterpillar Inc. | Worksite management system implementing anticipatory machine control |
| BR112013021038B1 (en) | 2011-02-18 | 2018-06-26 | Cnh Industrial America Llc | CERTIFIER DISCHARGE NOZZLE CONTROL SYSTEM AND METHOD |
| EP2675260B1 (en) | 2011-02-18 | 2018-10-03 | CNH Industrial Belgium nv | System and method for trajectory control of a transport vehicle used with a harvester |
| US9002591B2 (en) | 2011-02-18 | 2015-04-07 | Cnh Industrial America Llc | Harvester spout control system and method |
| US8655505B2 (en) | 2011-02-18 | 2014-02-18 | Caterpillar Inc. | Worksite management system implementing remote machine reconfiguration |
| BRPI1100258A2 (en) | 2011-02-28 | 2014-03-11 | Apagri Consultoria Agronomica Ltda | PROCEDURE FOR OBTAINING APPLICATION MAPS ON VARIOUS RATE OF PREEMBERGY HERBICIDES |
| US8577561B2 (en) | 2011-03-08 | 2013-11-05 | Deere & Company | Control system and method of operating a product distribution machine |
| DE102011005400B4 (en) | 2011-03-11 | 2015-05-28 | Deere & Company | Arrangement and method for estimating the degree of filling when overloading agricultural crop from a harvester onto a transport vehicle |
| US9631964B2 (en) | 2011-03-11 | 2017-04-25 | Intelligent Agricultural Solutions, Llc | Acoustic material flow sensor |
| US9629308B2 (en) | 2011-03-11 | 2017-04-25 | Intelligent Agricultural Solutions, Llc | Harvesting machine capable of automatic adjustment |
| US10318138B2 (en) | 2011-03-11 | 2019-06-11 | Intelligent Agricultural Solutions Llc | Harvesting machine capable of automatic adjustment |
| WO2012134723A2 (en) | 2011-03-31 | 2012-10-04 | Ag Leader Technology | Combine bin level monitoring system |
| DE102011001858A1 (en) | 2011-04-07 | 2012-10-11 | Claas Selbstfahrende Erntemaschinen Gmbh | Device and method for monitoring the trafficability of a soil |
| DE102011016743A1 (en) | 2011-04-12 | 2012-10-18 | Claas Selbstfahrende Erntemaschinen Gmbh | Agricultural transport vehicle and vehicle network |
| DE102011002071A1 (en) | 2011-04-15 | 2012-10-18 | Claas Selbstfahrende Erntemaschinen Gmbh | System and method for controlling crop overload |
| DE102011007511A1 (en) | 2011-04-15 | 2012-10-18 | Deere & Company | Method for adjusting a cleaning device of a combine harvester and cleaning device |
| CN102277867B (en) | 2011-05-13 | 2013-10-09 | 西安建筑科技大学 | Construction method for collapsible loess foundation |
| CN202110103U (en) | 2011-05-14 | 2012-01-11 | 长沙亚星数控技术有限公司 | Electro-hydraulic servo vehicular mixed backfill soil compactness rapid measuring system |
| DE102011050474A1 (en) | 2011-05-19 | 2012-11-22 | Amazonen-Werke H. Dreyer Gmbh & Co.Kg | Agricultural device |
| DE102011050629A1 (en) | 2011-05-25 | 2012-11-29 | Claas Selbstfahrende Erntemaschinen Gmbh | harvester |
| EP2529610A1 (en) | 2011-05-30 | 2012-12-05 | Agri-Esprit SAS | Method for harvest monitoring |
| CN202119772U (en) | 2011-06-01 | 2012-01-18 | 王新勇 | Online vehicle-mounted soil compactness measuring instrument |
| WO2012174134A1 (en) | 2011-06-13 | 2012-12-20 | Precision Planting, Inc. | Systems and methods for creating prescription maps and plots |
| US20130019580A1 (en) | 2011-07-20 | 2013-01-24 | Anderson Noel W | Bidirectional harvesting system |
| US20130022430A1 (en) | 2011-07-20 | 2013-01-24 | Anderson Noel W | Material transfer system |
| IN2014DN01632A (en) | 2011-08-12 | 2015-05-15 | Rhodia Operations | |
| DE102011052688B4 (en) | 2011-08-12 | 2021-02-04 | Andreas Reichhardt | Method and system for filling transport vehicles with crops |
| US9511633B2 (en) | 2011-08-17 | 2016-12-06 | Deere & Company | Soil compaction management and reporting |
| US8843269B2 (en) | 2011-08-17 | 2014-09-23 | Deere & Company | Vehicle soil pressure management based on topography |
| DE102011082052B4 (en) | 2011-09-02 | 2015-05-28 | Deere & Company | Arrangement and method for the automatic overloading of crop material from a harvester onto a transport vehicle |
| DE102011082908A1 (en) | 2011-09-19 | 2013-03-21 | Deere & Company | Method and arrangement for optically evaluating crops in a harvester |
| DE102011054630A1 (en) | 2011-10-20 | 2013-04-25 | Claas Agrosystems GmbH | visualiser |
| CA2852938A1 (en) | 2011-10-21 | 2013-04-25 | Pioneer Hi-Bred International, Inc. | Combine harvester and associated method for gathering grain |
| EP2771860A4 (en) | 2011-10-24 | 2015-01-21 | Trimble Navigation Ltd | Agricultural and soil management |
| DE102011085380A1 (en) | 2011-10-28 | 2013-05-02 | Deere & Company | Arrangement and method for the prospective investigation of plants to be picked up with a harvester |
| DE102011085977A1 (en) | 2011-11-09 | 2013-05-16 | Deere & Company | Sieve for a cleaning device of a combine harvester |
| US20130124239A1 (en) | 2011-11-15 | 2013-05-16 | Uriel Rosa | Crop yield per location measurer |
| EP2782438B1 (en) | 2011-11-22 | 2017-06-21 | The Climate Corporation | Stalk sensor apparatus, systems, and methods |
| CN202340435U (en) | 2011-11-28 | 2012-07-25 | 南京工业职业技术学院 | Real-time measuring system for maize yields based on working paths |
| DE102011120402A1 (en) | 2011-12-03 | 2013-06-06 | Robert Bosch Gmbh | Method and device for coordinating transport logistics and transport logistics system |
| BR102012017584B1 (en) | 2011-12-08 | 2019-03-26 | Agco Do Brasil Máquinas E Equipamentos Agrícolas Ltda. | SPEED CORRECTION AID SYSTEM AND METHOD |
| DE102011121414A1 (en) | 2011-12-17 | 2013-06-20 | Robert Bosch Gmbh | Method and a device for controlling a drive of a first self-propelled work machine with respect to a second self-propelled work machine |
| US8801512B2 (en) | 2011-12-19 | 2014-08-12 | Agco Corporation | Method for measuring air efficiency and efficacy in a combine harvester |
| US8626406B2 (en) | 2011-12-22 | 2014-01-07 | Deere & Company | Method and system for transferring material between vehicles |
| DE102012201333A1 (en) | 2012-01-31 | 2013-08-01 | Deere & Company | Agricultural machine with a system for the automatic setting of an operating parameter and associated method |
| WO2013162673A2 (en) | 2012-02-10 | 2013-10-31 | Deere & Company | System and method of material handling using one or more imaging devices on the transferring vehicle to control the material distribution into the storage portion of the receiving vehicle |
| US8649940B2 (en) | 2012-02-10 | 2014-02-11 | Deere & Company | Method and stereo vision system for managing the unloading of an agricultural material from a vehicle |
| US9861040B2 (en) | 2012-02-10 | 2018-01-09 | Deere & Company | Method and stereo vision system for facilitating the unloading of agricultural material from a vehicle |
| US9392746B2 (en) | 2012-02-10 | 2016-07-19 | Deere & Company | Artificial intelligence for detecting and filling void areas of agricultural commodity containers |
| US8868304B2 (en) | 2012-02-10 | 2014-10-21 | Deere & Company | Method and stereo vision system for facilitating the unloading of agricultural material from a vehicle |
| DE102012208554A1 (en) | 2012-05-22 | 2013-11-28 | Hamm Ag | Method for planning and carrying out soil compaction operations, in particular for asphalt compaction |
| US9288938B2 (en) | 2012-06-01 | 2016-03-22 | Rowbot Systems Llc | Robotic platform and method for performing multiple functions in agricultural systems |
| US20130319941A1 (en) | 2012-06-05 | 2013-12-05 | American Water Works Company, Inc. | Simultaneous recovery of coagulant and acid |
| US8930039B2 (en) | 2012-06-11 | 2015-01-06 | Cnh Industrial America Llc | Combine performance evaluation tool |
| US9117790B2 (en) | 2012-06-25 | 2015-08-25 | Marvell World Trade Ltd. | Methods and arrangements relating to semiconductor packages including multi-memory dies |
| DE102012211001A1 (en) | 2012-06-27 | 2014-01-02 | Deere & Company | Arrangement for controlling adjustable harvest conveying element of output device of harvester, has controller to bring harvest conveying element from loading into idle position, when overloading process is not possible |
| RU2502047C1 (en) | 2012-07-13 | 2013-12-20 | Федеральное государственное бюджетное учреждение науки Институт геологии и минералогии им. В.С. Соболева Сибирского отделения Российской академии наук (Институт геологии и минералогии СО РАН, ИГМ СО РАН) | Method to estimate off-road terrain trafficability |
| DE102013106128A1 (en) | 2012-07-16 | 2014-06-12 | Claas Selbstfahrende Erntemaschinen Gmbh | Agricultural work machine with at least one control device |
| US20140067745A1 (en) | 2012-08-30 | 2014-03-06 | Pioneer Hi-Bred International, Inc. | Targeted agricultural recommendation system |
| US9095090B2 (en) | 2012-08-31 | 2015-08-04 | Deere & Company | Pressure-based control system for an agricultural implement |
| WO2014046685A1 (en) | 2012-09-24 | 2014-03-27 | Deere & Company | Bidirectional harvesting system |
| WO2014050524A1 (en) | 2012-09-26 | 2014-04-03 | 株式会社クボタ | Agricultural management system and crop harvester |
| WO2014050525A1 (en) | 2012-09-26 | 2014-04-03 | 株式会社クボタ | Ground work vehicle, ground work vehicle management system, and ground work information display method |
| DE202012103730U1 (en) | 2012-09-28 | 2012-10-16 | Agco International Gmbh | Harvesting machine with a transfer device |
| US20140121882A1 (en) | 2012-10-31 | 2014-05-01 | Brian J. Gilmore | System for Coordinating the Relative Movements of an Agricultural Harvester and a Cart |
| CN203053961U (en) | 2012-11-02 | 2013-07-10 | 昆明理工大学 | Soil compaction data monitoring device |
| DE102012021469A1 (en) | 2012-11-05 | 2014-05-08 | Claas Selbstfahrende Erntemaschinen Gmbh | Assistance system for optimizing vehicle operation |
| DE102012220109A1 (en) | 2012-11-05 | 2014-05-08 | Deere & Company | Device for detecting the operating state of a work machine |
| KR101447197B1 (en) | 2012-11-07 | 2014-10-06 | 최준성 | Device of dynamic cone penetrometer test and measuring method of soil compaction using the same |
| DE102012220916A1 (en) | 2012-11-15 | 2014-05-15 | K&K Maschinenentwicklungs GmbH & Co. KG | Process for the new production, renovation or dismantling of a railroad track |
| DE102012221344B3 (en) | 2012-11-22 | 2014-05-15 | Hamm Ag | Cladding assembly, soil tillage roller and method of attaching a cladding assembly |
| WO2014093814A1 (en) | 2012-12-14 | 2014-06-19 | Agco Corporation | Predictive load estimation through forward vision |
| DE102012223434B4 (en) | 2012-12-17 | 2021-03-25 | Deere & Company | Method and arrangement for optimizing an operating parameter of a combine harvester |
| US20140172222A1 (en) | 2012-12-19 | 2014-06-19 | Agco Corporation | Speed control in agricultural vehicle guidance systems |
| DE102012223768B4 (en) | 2012-12-19 | 2014-07-03 | Deere & Company | Foreign body detection device for an agricultural harvester |
| US20140172224A1 (en) | 2012-12-19 | 2014-06-19 | Agco Corporation | Speed control in agricultural vehicle guidance systems |
| US20140172225A1 (en) | 2012-12-19 | 2014-06-19 | Agco Corporation | Speed control in agricultural vehicle guidance systems |
| JP6059027B2 (en) | 2013-01-21 | 2017-01-11 | 株式会社クボタ | Farm machine and farm work management program |
| US9497898B2 (en) | 2013-01-24 | 2016-11-22 | Tribine Industries, LLC | Agricultural harvester unloading assist system and method |
| DE102013001157A1 (en) | 2013-01-24 | 2014-08-07 | Zind Systementwicklungs Gmbh | Production plant for the production of vessels from vessel blanks and manufacturing processes |
| US8955402B2 (en) | 2013-01-25 | 2015-02-17 | Trimble Navigation Limited | Sugar cane yield mapping |
| CN203206739U (en) | 2013-01-25 | 2013-09-25 | 蒋行宇 | Melon combined harvester |
| CN104294810B (en) | 2013-01-30 | 2016-05-11 | 青岛市勘察测绘研究院 | A kind of strong rammer foundation stabilization is with ramming diagnosis real-time processing method and strong rammer real-time diagnosis device |
| US20150379785A1 (en) | 2013-02-07 | 2015-12-31 | Owen J. Brown, Jr. | Wireless monitor maintenance and control system |
| DE102013201996A1 (en) | 2013-02-07 | 2014-08-07 | Deere & Company | Method for setting operating parameters of a harvester |
| US9326444B2 (en) | 2013-02-08 | 2016-05-03 | Deere & Company | Method and stereo vision system for facilitating the unloading of agricultural material from a vehicle |
| GB2510630B (en) | 2013-02-11 | 2015-08-05 | Kverneland Group Les Landes Genusson | Strip tilling system |
| GB2510629B (en) | 2013-02-11 | 2015-10-14 | Kverneland Group Les Landes Genusson | Strip tilling system |
| AR094713A1 (en) | 2013-02-19 | 2015-08-19 | Grains Res & Dev Corp | DEVITALIZATION DEVICE FOR SEEDS OF MALEZAS |
| US9693503B2 (en) | 2013-02-20 | 2017-07-04 | Deere & Company | Crop sensing |
| US9066465B2 (en) | 2013-02-20 | 2015-06-30 | Deere & Company | Soil compaction reduction system and method |
| US10178828B2 (en) | 2013-02-20 | 2019-01-15 | Deere & Company | Per plant crop sensing resolution |
| US9668420B2 (en) | 2013-02-20 | 2017-06-06 | Deere & Company | Crop sensing display |
| US11212962B2 (en) | 2013-02-20 | 2022-01-04 | Deere & Company | Field condition determination |
| US20140257911A1 (en) | 2013-03-08 | 2014-09-11 | Deere & Company | Methods and apparatus to schedule refueling of a work machine |
| CN103181263A (en) | 2013-03-11 | 2013-07-03 | 西北农林科技大学 | Multi-machine collaborated wheat harvest system |
| US9410840B2 (en) | 2013-03-15 | 2016-08-09 | Raven Industries, Inc. | Multi-variable yield monitor and methods for the same |
| US20140277960A1 (en) | 2013-03-18 | 2014-09-18 | Deere & Company | Harvester with fuzzy control system for detecting steady crop processing state |
| WO2014160589A1 (en) | 2013-03-24 | 2014-10-02 | Bee Robotics Corporation | Aerial farm robot system for crop dusting, planting, fertilizing and other field jobs |
| KR102234179B1 (en) | 2013-03-27 | 2021-03-31 | 가부시끼 가이샤 구보다 | Combine |
| US9992932B2 (en) | 2013-04-02 | 2018-06-12 | Deere & Company | Control arrangement and method for controlling a position of a transfer device of a harvesting machine |
| US10129528B2 (en) | 2013-04-02 | 2018-11-13 | Deere & Company | Control arrangement and method for controlling a position of a transfer device of a harvesting machine |
| EP2792229B1 (en) | 2013-04-02 | 2016-03-23 | Deere & Company | Control arrangement and method for controlling a position of a transfer device of a harvesting machine |
| DE102014105643A1 (en) | 2013-04-22 | 2014-10-23 | Carnegie Mellon University | Method for improving the robustness of an automated end-loading system |
| CN203275401U (en) | 2013-04-24 | 2013-11-06 | 陈金 | Novel road soil engineering compaction rapid thickness measuring accommodometer |
| CN203055121U (en) | 2013-04-26 | 2013-07-10 | 昆明理工大学 | Soil compaction data wireless transmitting device based on Zigbee technology |
| EP2798928B1 (en) | 2013-04-29 | 2024-02-07 | CLAAS E-Systems GmbH | Operating system for and method of operating an automatic guidance system of an agricultural vehicle |
| US10740703B2 (en) | 2013-04-29 | 2020-08-11 | Verge Technologies Inc. | Method and system for determining optimized travel path for agricultural implement on land with obstacle |
| CA2814599A1 (en) | 2013-04-29 | 2014-10-29 | Fieldstone Land Management Inc. | Method and apparatus for tangible effect calculation and compensation |
| DE102013209197A1 (en) | 2013-05-17 | 2014-11-20 | Deere & Company | Harvester with predictive propulsion speed control |
| USD721740S1 (en) | 2013-05-23 | 2015-01-27 | Deere & Company | Display interface or housing thereof |
| BE1021150B1 (en) | 2013-06-03 | 2016-01-13 | Cnh Industrial Belgium Nv | METHOD FOR PROCESSING BALEN PRESS TAX SIGNAL |
| DE102013105821A1 (en) | 2013-06-06 | 2014-12-11 | Claas Selbstfahrende Erntemaschinen Gmbh | Harvester for picking up crops |
| DE102013212151A1 (en) | 2013-06-26 | 2014-12-31 | Robert Bosch Gmbh | Construction machine with a vibration unit |
| DE102013107169A1 (en) | 2013-07-08 | 2015-01-08 | Claas Selbstfahrende Erntemaschinen Gmbh | Agricultural harvester |
| WO2015006600A1 (en) | 2013-07-10 | 2015-01-15 | Agco Corporation | Automating distribution of work in a field |
| DE102013012027A1 (en) | 2013-07-19 | 2015-01-22 | Claas Selbstfahrende Erntemaschinen Gmbh | Self-propelled harvester and vehicle network |
| GB2517049B (en) | 2013-07-28 | 2019-09-11 | Deere & Co | Artificial intelligence for detecting and filling void areas of agricultural commodity containers |
| US9301466B2 (en) | 2013-07-29 | 2016-04-05 | Syngenta Participations Ag | Variety corn line HID3259 |
| US9188518B2 (en) | 2013-08-19 | 2015-11-17 | Bridgestone Americas Tire Operations, Llc | Ground compaction images |
| JP6134609B2 (en) | 2013-08-28 | 2017-05-24 | ヤンマー株式会社 | Remote server |
| US9767521B2 (en) | 2013-08-30 | 2017-09-19 | The Climate Corporation | Agricultural spatial data processing systems and methods |
| WO2015034876A1 (en) | 2013-09-03 | 2015-03-12 | Agco Corporation | System and method for automatically changing machine control state |
| WO2015038751A1 (en) | 2013-09-13 | 2015-03-19 | Agco Corporation | Method to automatically estimate and classify spatial data for use on real time maps |
| US9234317B2 (en) | 2013-09-25 | 2016-01-12 | Caterpillar Inc. | Robust system and method for forecasting soil compaction performance |
| US9804756B2 (en) | 2013-09-27 | 2017-10-31 | Iteris, Inc. | Comparative data analytics and visualization tool for analyzing traffic performance data in a traffic management system |
| WO2015048499A1 (en) | 2013-09-27 | 2015-04-02 | John Earl Acheson | Yield monitor calibration method and system |
| US9188986B2 (en) | 2013-10-01 | 2015-11-17 | Jaybridge Robotics, Inc. | Computer-implemented method and system for dynamically positioning a vehicle relative to another vehicle in motion for on-the-fly offloading operations |
| US20160247082A1 (en) | 2013-10-03 | 2016-08-25 | Farmers Business Network, Llc | Crop Model and Prediction Analytics System |
| JP2015070812A (en) | 2013-10-03 | 2015-04-16 | ヤンマー株式会社 | Crop information management system |
| US10130022B2 (en) | 2013-10-14 | 2018-11-20 | Kinze Manufacturing, Inc. | Autonomous systems, methods, and apparatus for AG based operations |
| US10362733B2 (en) | 2013-10-15 | 2019-07-30 | Deere & Company | Agricultural harvester configured to control a biomass harvesting rate based upon soil effects |
| BE1021108B1 (en) | 2013-10-28 | 2016-01-18 | Cnh Industrial Belgium Nv | DISCHARGE SYSTEMS |
| BE1021164B1 (en) | 2013-10-28 | 2016-01-18 | Cnh Industrial Belgium Nv | DISCHARGE SYSTEMS |
| JP6087258B2 (en) | 2013-10-28 | 2017-03-01 | ヤンマー株式会社 | Remote dispatch server |
| DE102013222122B4 (en) | 2013-10-30 | 2020-10-15 | Mts Maschinentechnik Schrode Ag | Method for operating a soil compaction or soil testing device and a soil compaction or compaction testing device |
| US10371561B2 (en) | 2013-11-01 | 2019-08-06 | Iowa State University Research Foundation, Inc. | Yield measurement and base cutter height control systems for a harvester |
| DE102013019098B3 (en) | 2013-11-11 | 2015-01-08 | Hochschule für Technik und Wirtschaft Dresden | System for recording parameters of the environment and environment |
| CN203613525U (en) | 2013-11-25 | 2014-05-28 | 杨振华 | Highway lime soil basic layer compactness measuring sampler |
| CN203658201U (en) | 2013-12-09 | 2014-06-18 | 长安大学 | Device for measuring subgrade soil compactness |
| US9714856B2 (en) | 2013-12-13 | 2017-07-25 | Ag Leader Technology, Inc. | Automatic compensation for the effect of grain properties on mass flow sensor calibration |
| JP5986064B2 (en) | 2013-12-25 | 2016-09-06 | Necプラットフォームズ株式会社 | Cooling system and electronic equipment |
| DE102014100136A1 (en) | 2014-01-08 | 2015-07-09 | Claas Selbstfahrende Erntemaschinen Gmbh | harvester |
| CN203741803U (en) | 2014-01-10 | 2014-07-30 | 瑞和安惠项目管理集团有限公司 | Subgrade compaction measurement soil sampling device for project supervision |
| DE102014201203A1 (en) | 2014-01-23 | 2015-07-23 | Deere & Company | Agricultural work vehicle with an aircraft and associated power supply |
| US20150211199A1 (en) | 2014-01-24 | 2015-07-30 | Caterpillar Inc. | Device and process to measure ground stiffness from compactors |
| CN106102444B (en) | 2014-02-10 | 2020-02-11 | 克莱米特公司 | Method and system for generating shared collaborative graphs |
| JP6298313B2 (en) | 2014-02-18 | 2018-03-20 | 鹿島建設株式会社 | Ground stiffness measuring device, compaction machine, and ground stiffness measuring method |
| DE102014203005B3 (en) | 2014-02-19 | 2015-05-13 | Deere & Company | Vibration damping control of an actuator of an agricultural machine |
| US20150254800A1 (en) | 2014-03-06 | 2015-09-10 | F12 Solutions, Llc | Nitrogen status determination in growing crops |
| NL2012485B1 (en) | 2014-03-20 | 2016-01-18 | Lely Patent Nv | Method and system for navigating an agricultural vehicle on a land area. |
| DE102014205233A1 (en) | 2014-03-20 | 2015-09-24 | Deere & Company | Harvester with predictive propulsion speed specification |
| US9529364B2 (en) | 2014-03-24 | 2016-12-27 | Cnh Industrial America Llc | System for coordinating agricultural vehicle control for loading a truck |
| DE102014205503A1 (en) | 2014-03-25 | 2015-10-01 | Hamm Ag | Method for correcting a measured value profile by eliminating periodically occurring measuring artifacts, in particular in the case of a soil compactor |
| US9489576B2 (en) | 2014-03-26 | 2016-11-08 | F12 Solutions, LLC. | Crop stand analysis |
| BR102014007178B1 (en) | 2014-03-26 | 2020-12-22 | São Martinho S/A | process of generating maps of herbicide application according to weed species and clay and soil organic matter contents |
| US10515425B2 (en) | 2014-04-01 | 2019-12-24 | The Climate Corporation | Agricultural implement and implement operator monitoring apparatus, systems, and methods |
| CN103954738B (en) | 2014-04-01 | 2015-11-04 | 中国科学院力学研究所 | A kind of laboratory testing rig measuring soil body Vibration propagation characteristic |
| US9810679B2 (en) | 2014-04-02 | 2017-11-07 | Colorado School Of Mines | Intelligent pad foot soil compaction devices and methods of using same |
| DE102014104619A1 (en) | 2014-04-02 | 2015-10-08 | Claas Agrosystems Kgaa Mbh & Co. Kg | Planning system and method for planning fieldwork |
| WO2015160837A2 (en) | 2014-04-15 | 2015-10-22 | Raven Industries, Inc. | Reaping based yield monitoring system and method for the same |
| US9974226B2 (en) | 2014-04-21 | 2018-05-22 | The Climate Corporation | Generating an agriculture prescription |
| US9405039B2 (en) | 2014-04-22 | 2016-08-02 | Deere & Company | Ground engaging member accumulation determination |
| US9523180B2 (en) | 2014-04-28 | 2016-12-20 | Deere & Company | Semi-automatic material loading |
| DE102014208070A1 (en) | 2014-04-29 | 2015-12-17 | Deere & Company | The vehicle dynamics taking into account control system for position control of a device for an agricultural work vehicle |
| DE102014208068A1 (en) | 2014-04-29 | 2015-10-29 | Deere & Company | Harvester with sensor-based adjustment of a working parameter |
| WO2015171954A2 (en) | 2014-05-09 | 2015-11-12 | Raven Industries, Inc. | Refined row guidance parameterization with hough transform |
| FR3021114B1 (en) | 2014-05-13 | 2017-08-11 | Sol Solution | DYNAMIC PENETROMETER, MEASUREMENT ASSEMBLY, SYSTEM AND METHOD FOR DETERMINING THE COMPACTNESS AND SOIL CAPACITY OF A SOIL |
| JP6410130B2 (en) | 2014-05-15 | 2018-10-24 | 株式会社Jsol | Crop yield prediction device, crop prediction system, and crop prediction method |
| US9578808B2 (en) | 2014-05-16 | 2017-02-28 | Deere & Company | Multi-sensor crop yield determination |
| US10104836B2 (en) | 2014-06-11 | 2018-10-23 | John Paul Jamison | Systems and methods for forming graphical and/or textual elements on land for remote viewing |
| BR102015013228B1 (en) | 2014-06-13 | 2020-11-24 | Cnh Industrial America Llc | CONTROL SYSTEM AND METHOD FOR AN AGRICULTURAL VEHICLE |
| DE102014009090B4 (en) | 2014-06-19 | 2017-04-06 | Technische Universität Dresden | Agricultural device for conservation tillage |
| WO2015200489A1 (en) | 2014-06-24 | 2015-12-30 | 360 Yield Center, Llc | Agronomic system, methods and apparatuses |
| CN204000818U (en) | 2014-07-02 | 2014-12-10 | 四川农业大学 | A kind of soil compactibility determinator |
| US10126153B2 (en) | 2014-07-22 | 2018-11-13 | Deere & Company | Particulate matter impact sensor |
| US10034423B2 (en) | 2014-07-29 | 2018-07-31 | Deere & Company | Biomass sensing |
| FR3024772B1 (en) | 2014-08-07 | 2016-09-02 | Electricite De France | METHOD AND DEVICE FOR DETERMINING THE DEPTH OF THE ORIGIN OF A SOIL DAMPING |
| US9717178B1 (en) | 2014-08-08 | 2017-08-01 | The Climate Corporation | Systems and method for monitoring, controlling, and displaying field operations |
| WO2016025848A1 (en) | 2014-08-15 | 2016-02-18 | Monsanto Technology Llc | Apparatus and methods for in-field data collection and sampling |
| US9131644B2 (en) | 2014-08-19 | 2015-09-15 | Iteris, Inc. | Continual crop development profiling using dynamical extended range weather forecasting with routine remotely-sensed validation imagery |
| DE102014216593A1 (en) | 2014-08-21 | 2016-02-25 | Deere & Company | Operator assistance system for an agricultural working machine |
| CA3237917A1 (en) | 2014-08-22 | 2016-02-25 | Climate Llc | Methods for agronomic and agricultural monitoring using unmanned aerial systems |
| ES2768949T3 (en) | 2014-08-27 | 2020-06-24 | Premier Crop Systems Llc | System and procedure to control machinery to randomize and replicate predetermined agronomic input levels |
| US9829364B2 (en) | 2014-08-28 | 2017-11-28 | Raven Industries, Inc. | Method of sensing volume of loose material |
| US10109024B2 (en) | 2014-09-05 | 2018-10-23 | The Climate Corporation | Collecting data to generate an agricultural prescription |
| DE102014113001A1 (en) | 2014-09-10 | 2016-03-10 | Claas Selbstfahrende Erntemaschinen Gmbh | Method for controlling an overloading process |
| US10667456B2 (en) | 2014-09-12 | 2020-06-02 | The Climate Corporation | Methods and systems for managing agricultural activities |
| US11113649B2 (en) | 2014-09-12 | 2021-09-07 | The Climate Corporation | Methods and systems for recommending agricultural activities |
| US10564316B2 (en) | 2014-09-12 | 2020-02-18 | The Climate Corporation | Forecasting national crop yield during the growing season |
| US11080798B2 (en) | 2014-09-12 | 2021-08-03 | The Climate Corporation | Methods and systems for managing crop harvesting activities |
| US10085379B2 (en) | 2014-09-12 | 2018-10-02 | Appareo Systems, Llc | Grain quality sensor |
| DE102014113335A1 (en) | 2014-09-16 | 2016-03-17 | Claas Tractor Sas | Agricultural work machine with and method for predictive control of a drive power and / or a drive train |
| US9903979B2 (en) | 2014-09-23 | 2018-02-27 | Deere & Company | Yield estimation |
| US10126282B2 (en) | 2014-09-23 | 2018-11-13 | Deere & Company | Yield estimation |
| DE102014113874A1 (en) | 2014-09-25 | 2016-03-31 | Claas Selbstfahrende Erntemaschinen Gmbh | Overloading method for harvesting machines |
| DE102014113887A1 (en) | 2014-09-25 | 2016-03-31 | Claas Selbstfahrende Erntemaschinen Gmbh | Combine with a distributor |
| DE102014113965A1 (en) | 2014-09-26 | 2016-03-31 | Claas Selbstfahrende Erntemaschinen Gmbh | Combine with driver assistance system |
| JP2016071726A (en) | 2014-09-30 | 2016-05-09 | 井関農機株式会社 | Work information storage device |
| US9807933B2 (en) | 2014-10-20 | 2017-11-07 | Cnh Industrial America Llc | Sensor equipped agricultural harvester |
| KR102404044B1 (en) | 2014-11-13 | 2022-05-30 | 얀마 파워 테크놀로지 가부시키가이샤 | Parallel travel work system |
| AU2014411244B2 (en) | 2014-11-14 | 2018-11-29 | Bitstrata Systems Inc. | System and method for measuring grain cart weight |
| GB201421527D0 (en) | 2014-12-04 | 2015-01-21 | Agco Int Gmbh | Automated agriculture system |
| DE102014226189B4 (en) | 2014-12-17 | 2017-08-24 | Continental Automotive Gmbh | Method for determining a weed component and agricultural technology control device |
| US9563492B2 (en) | 2015-01-09 | 2017-02-07 | Deere & Company | Service diagnostic trouble code sequencer and method |
| US9792557B2 (en) | 2015-01-14 | 2017-10-17 | Accenture Global Services Limited | Precision agriculture system |
| CN204435344U (en) | 2015-01-22 | 2015-07-01 | 中交四公局第二工程有限公司 | A kind of running type sampler for measuring soil layer degree of compaction |
| WO2016118686A1 (en) | 2015-01-23 | 2016-07-28 | Iteris, Inc. | Modeling of crop growth for desired moisture content of targeted livestock feedstuff for determination of harvest windows using field-level diagnosis and forecasting of weather conditions and observations and user input of harvest condition states |
| US9140824B1 (en) | 2015-01-23 | 2015-09-22 | Iteris, Inc. | Diagnosis and prediction of in-field dry-down of a mature small grain, coarse grain, or oilseed crop using field-level analysis and forecasting of weather conditions, crop characteristics, and observations and user input of harvest condition states |
| US9009087B1 (en) | 2015-01-23 | 2015-04-14 | Iteris, Inc. | Modeling the impact of time-varying weather conditions on unit costs of post-harvest crop drying techniques using field-level analysis and forecasts of weather conditions, facility metadata, and observations and user input of grain drying data |
| US20160232621A1 (en) | 2015-02-06 | 2016-08-11 | The Climate Corporation | Methods and systems for recommending agricultural activities |
| US20160247079A1 (en) | 2015-02-20 | 2016-08-25 | Iteris, Inc. | Modeling of soil compaction and structural capacity for field trafficability by agricultural equipment from diagnosis and prediction of soil and weather conditions associated with user-provided feedback |
| JP2016160808A (en) | 2015-02-27 | 2016-09-05 | 井関農機株式会社 | Combine-harvester engine control system |
| US20160260021A1 (en) | 2015-03-06 | 2016-09-08 | William Marek | System and method for improved agricultural yield and efficiency using statistical analysis |
| CN204475304U (en) | 2015-03-17 | 2015-07-15 | 攀枝花天誉工程检测有限公司 | Geotechnique's compaction detect perforating device |
| CN106998651B (en) | 2015-03-18 | 2019-10-18 | 株式会社久保田 | Combine harvester |
| RO130713B1 (en) | 2015-03-19 | 2023-05-30 | Universitatea De Ştiinţe Agronomice Şi Medicină Veterinară Din Bucureşti | Automated gis system for carrying out maps showing weed species distribution |
| US20180014452A1 (en) | 2015-03-25 | 2018-01-18 | 360 Yield Center, Llc | Agronomic systems, methods and apparatuses |
| US10095200B2 (en) | 2015-03-30 | 2018-10-09 | Uop Llc | System and method for improving performance of a chemical plant with a furnace |
| DE102015004343A1 (en) | 2015-04-02 | 2016-10-06 | Claas Selbstfahrende Erntemaschinen Gmbh | Harvester |
| DE102015004174A1 (en) | 2015-04-02 | 2016-10-06 | Claas Selbstfahrende Erntemaschinen Gmbh | Harvester |
| DE102015004344A1 (en) | 2015-04-02 | 2016-10-06 | Claas Selbstfahrende Erntemaschinen Gmbh | Harvester |
| DE102015106302A1 (en) | 2015-04-24 | 2016-10-27 | Claas Selbstfahrende Erntemaschinen Gmbh | Harvesting system with a self-propelled harvester |
| US20170270446A1 (en) | 2015-05-01 | 2017-09-21 | 360 Yield Center, Llc | Agronomic systems, methods and apparatuses for determining yield limits |
| JP2018523447A (en) | 2015-05-01 | 2018-08-16 | ハイリーオン インク.Hyliion Inc. | Motor vehicle equipment to increase power supply and reduce fuel demand |
| US10209235B2 (en) | 2015-05-04 | 2019-02-19 | Deere & Company | Sensing and surfacing of crop loss data |
| US9872433B2 (en) | 2015-05-14 | 2018-01-23 | Raven Industries, Inc. | System and method for adjusting harvest characteristics |
| EP3295344A4 (en) | 2015-05-14 | 2019-01-23 | Board of Trustees of Michigan State University | Methods and systems for crop land evaluation and crop growth management |
| US10039231B2 (en) | 2015-05-19 | 2018-08-07 | Deere & Company | System for measuring plant attributes using a priori plant maps |
| EP3095310B1 (en) | 2015-05-21 | 2018-05-16 | Robert Thomas Farms Ltd | Agricultural apparatus |
| DE102015006398B3 (en) | 2015-05-21 | 2016-05-04 | Helmut Uhrig Strassen- und Tiefbau GmbH | Soil compaction with a dredger cultivator |
| US20160342915A1 (en) | 2015-05-22 | 2016-11-24 | Caterpillar Inc. | Autonomous Fleet Size Management |
| DE102015108374A1 (en) | 2015-05-27 | 2016-12-01 | Claas Selbstfahrende Erntemaschinen Gmbh | Method for controlling a self-propelled harvesting machine |
| EP3307047A4 (en) | 2015-06-05 | 2018-11-14 | The University of Sydney | Automatic target recognition and management system |
| US10791666B2 (en) | 2015-06-08 | 2020-10-06 | The Climate Corporation | Agricultural data analysis |
| DE102015109799A1 (en) | 2015-06-18 | 2016-12-22 | Claas E-Systems Kgaa Mbh & Co Kg | Method for synchronizing two independent, self-propelled agricultural machines |
| EP3310150B1 (en) | 2015-06-18 | 2021-05-12 | Bail&Burnit Pty Ltd. | Mechanical weed seed management system |
| UA126111C2 (en) | 2015-06-30 | 2022-08-17 | Зе Клаймат Корпорейшн | Systems and methods for image capture and analysis of agricultural fields |
| CA3101757C (en) | 2015-07-14 | 2022-04-12 | Dean Mayerle | Weed seed destruction rotor shape |
| US9968027B2 (en) | 2015-07-14 | 2018-05-15 | Clemson University | Automated control systems and methods for underground crop harvesters |
| US10492369B2 (en) | 2015-07-14 | 2019-12-03 | Dean Mayerle | Weed seed destruction |
| US9740208B2 (en) | 2015-07-30 | 2017-08-22 | Deere & Company | UAV-based sensing for worksite operations |
| CN204989174U (en) | 2015-08-05 | 2016-01-20 | 中国农业大学 | Be used for measuring soil compacting test platform |
| US10015928B2 (en) | 2015-08-10 | 2018-07-10 | Deere & Company | Method and stereo vision system for managing the unloading of an agricultural material from a vehicle |
| US9642305B2 (en) | 2015-08-10 | 2017-05-09 | Deere & Company | Method and stereo vision system for managing the unloading of an agricultural material from a vehicle |
| DE102015113527A1 (en) | 2015-08-17 | 2017-02-23 | Claas Selbstfahrende Erntemaschinen Gmbh | Agricultural harvester |
| EP3341129B1 (en) | 2015-08-28 | 2024-04-03 | Tecfarm PTY Ltd | Apparatus and method for processing a crop residue |
| DE102015217496A1 (en) | 2015-09-14 | 2017-03-16 | Deere & Company | Method for spreading seed particles or plants on a field and a corresponding machine |
| JP6502221B2 (en) | 2015-09-14 | 2019-04-17 | 株式会社クボタ | Work vehicle support system |
| US10183667B2 (en) | 2015-09-15 | 2019-01-22 | Deere & Company | Human presence detection on a mobile machine |
| US9696162B2 (en) | 2015-09-17 | 2017-07-04 | Deere & Company | Mission and path planning using images of crop wind damage |
| CN105205248B (en) | 2015-09-17 | 2017-12-08 | 哈尔滨工业大学 | A kind of design method of the vehicle terrain trafficability simulation analysis component based on ODE physical engines |
| US10025983B2 (en) | 2015-09-21 | 2018-07-17 | The Climate Corporation | Ponding water detection on satellite imagery |
| US10188037B2 (en) | 2015-09-24 | 2019-01-29 | Deere & Company | Yield estimation |
| US9699967B2 (en) | 2015-09-25 | 2017-07-11 | Deere & Company | Crosswind compensation for residue processing |
| JP6770300B2 (en) | 2015-09-29 | 2020-10-14 | 株式会社ミツトヨ | Signal processing circuit for measuring equipment |
| US9807940B2 (en) | 2015-09-30 | 2017-11-07 | Deere & Company | System for prediction and control of drydown for windrowed agricultural products |
| EP3150052B1 (en) | 2015-09-30 | 2018-06-13 | CLAAS E-Systems KGaA mbH & Co KG | Crop harvesting machine |
| PL3358932T5 (en) | 2015-10-05 | 2024-02-05 | Basf Agro Trademarks Gmbh | Method for operating a harvester using a plant growth model |
| KR20170041377A (en) | 2015-10-07 | 2017-04-17 | 안범주 | vehicle with rear-side soil compaction sensor |
| US10342174B2 (en) | 2015-10-16 | 2019-07-09 | The Climate Corporation | Method for recommending seeding rate for corn seed using seed type and sowing row width |
| US9681605B2 (en) | 2015-10-26 | 2017-06-20 | Deere & Company | Harvester feed rate control |
| US20170112061A1 (en) | 2015-10-27 | 2017-04-27 | Cnh Industrial America Llc | Graphical yield monitor static (previous) data display on in-cab display |
| US20170115862A1 (en) | 2015-10-27 | 2017-04-27 | Cnh Industrial America Llc | Graphical yield monitor real-time data display |
| US10080325B2 (en) | 2015-10-27 | 2018-09-25 | Cnh Industrial America Llc | Predictive overlap control model |
| US10586158B2 (en) | 2015-10-28 | 2020-03-10 | The Climate Corporation | Computer-implemented calculation of corn harvest recommendations |
| DE102015118767A1 (en) | 2015-11-03 | 2017-05-04 | Claas Selbstfahrende Erntemaschinen Gmbh | Environment detection device for agricultural machine |
| US20180232674A1 (en) | 2015-11-05 | 2018-08-16 | Agco International Gmbh | Method and system for determining work trajectories for a fleet of working units in a harvest operation |
| US20170127606A1 (en) | 2015-11-10 | 2017-05-11 | Digi-Star, Llc | Agricultural Drone for Use in Controlling the Direction of Tillage and Applying Matter to a Field |
| DE102016121523A1 (en) | 2015-11-17 | 2017-05-18 | Lacos Computerservice Gmbh | Method for predicatively generating data for controlling a route and an operating sequence for agricultural vehicles and machines |
| US10890922B2 (en) | 2015-11-19 | 2021-01-12 | Agjunction Llc | Automated multi-vehicle alignment steering |
| DK178711B1 (en) | 2015-11-24 | 2016-11-28 | Green Agro And Transp Aps | Flexible wheel track system for in-field trailer |
| US11062223B2 (en) | 2015-12-02 | 2021-07-13 | The Climate Corporation | Forecasting field level crop yield during a growing season |
| US9721181B2 (en) | 2015-12-07 | 2017-08-01 | The Climate Corporation | Cloud detection on remote sensing imagery |
| DE102015121210A1 (en) | 2015-12-07 | 2017-06-08 | Claas Selbstfahrende Erntemaschinen Gmbh | Agricultural working machine |
| WO2017096489A1 (en) | 2015-12-09 | 2017-06-15 | Scanimetrics Inc. | Measuring and monitoring a body of granular material |
| US10091925B2 (en) * | 2015-12-09 | 2018-10-09 | International Business Machines Corporation | Accurately determining crop yield at a farm level |
| WO2017099570A1 (en) | 2015-12-11 | 2017-06-15 | Pacheco Sanchez José Antonio | System and method for precision agriculture by means of multispectral and hyperspectral aerial image analysis using unmanned aerial vehicles |
| CN105432228A (en) | 2015-12-16 | 2016-03-30 | 无锡同春新能源科技有限公司 | Unmanned corn harvester |
| DE102015122269A1 (en) | 2015-12-18 | 2017-06-22 | Claas Selbstfahrende Erntemaschinen Gmbh | Method for operating a combine harvester |
| US9856612B2 (en) | 2015-12-21 | 2018-01-02 | Caterpillar Paving Products Inc. | Compaction measurement using nearby sensors |
| EP3397042A1 (en) | 2015-12-29 | 2018-11-07 | Agco Corporation | Integrated driveline slip clutch system for large square baler |
| BR102016024930B1 (en) | 2016-01-06 | 2021-08-24 | Cnh Industrial America Llc | CONTROL SYSTEM FOR A TOW VEHICLE AND METHOD FOR CONTROLLING AN AGRICULTURAL VEHICLE |
| BR102016024151B1 (en) | 2016-01-06 | 2021-10-13 | Cnh Industrial America Llc | COMPUTER-READABLE TANGIBLE NON TRANSITIONAL MEDIUM, SYSTEM AND METHOD FOR CONTROLLING AT LEAST ONE STANDALONE AGRICULTURAL VEHICLE |
| US10019790B2 (en) | 2016-01-15 | 2018-07-10 | Deere & Company | Fill level indicator for an automated unloading system |
| EP3195719B1 (en) | 2016-01-20 | 2018-10-24 | CLAAS E-Systems KGaA mbH & Co KG | Agricultural machine |
| EP3195720A1 (en) | 2016-01-21 | 2017-07-26 | CLAAS E-Systems KGaA mbH & Co KG | Crop tank system |
| US10529036B2 (en) | 2016-01-22 | 2020-01-07 | The Climate Corporation | Forecasting national crop yield during the growing season using weather indices |
| BE1023467B1 (en) | 2016-02-01 | 2017-03-29 | Cnh Industrial Belgium Nv | MANAGEMENT OF A RESTANT SYSTEM OF A CUTTER BY USING FIELD DATA |
| US9891629B2 (en) | 2016-02-04 | 2018-02-13 | Deere & Company | Autonomous robotic agricultural machine and system thereof |
| JP6688542B2 (en) | 2016-02-04 | 2020-04-28 | ヤンマー株式会社 | Follow-up combine |
| JP6567440B2 (en) | 2016-02-05 | 2019-08-28 | 鹿島建設株式会社 | Ground compaction state measuring device, compaction state measuring method, and compaction machine |
| BE1023485B1 (en) | 2016-02-23 | 2017-04-06 | Cnh Industrial Belgium Nv | CHAIN SPREADER WITH SEED BUGS |
| US10588258B2 (en) | 2016-02-25 | 2020-03-17 | Deere & Company | Automatic determination of the control unit parameters of an arrangement to control an actuator for the adjustment of an adjustable element of an agricultural machine |
| US9675008B1 (en) | 2016-02-29 | 2017-06-13 | Cnh Industrial America Llc | Unloading arrangement for agricultural harvesting vehicles |
| US10201121B1 (en) | 2016-03-01 | 2019-02-12 | Ag Leader Technology | Prediction of amount of crop or product remaining for field |
| US10028435B2 (en) | 2016-03-04 | 2018-07-24 | Deere & Company | Sensor calibration using field information |
| KR101653750B1 (en) | 2016-03-10 | 2016-09-02 | 한국건설기술연구원 | Apparatus And Method for Testing Extraction Force of Vegetation-mat Fixing Pin |
| BE1023982B1 (en) | 2016-03-23 | 2017-10-03 | Cnh Industrial Belgium Nv | Automated unloading system for unloading crops |
| EP3435319A4 (en) | 2016-03-25 | 2019-08-21 | Nec Corporation | Information processing device, control method for information processing device, and recording medium having control program for information processing device recorded therein |
| KR102394967B1 (en) | 2016-03-29 | 2022-05-04 | 얀마 파워 테크놀로지 가부시키가이샤 | Combine harvester |
| US9903077B2 (en) | 2016-04-04 | 2018-02-27 | Caterpillar Paving Products Inc. | System and method for performing a compaction operation |
| RU164128U1 (en) | 2016-04-05 | 2016-08-20 | Федеральное государственное автономное образовательное учреждение высшего образования "Крымский федеральный университет имени В.И. Вернадского" | INSTALLATION FOR WEARING TEST FOR MATERIALS FOR WORKING BODIES OF TILLING MACHINES |
| WO2017181127A1 (en) | 2016-04-15 | 2017-10-19 | The Regents Of The University Of California | Robotic plant care systems and methods |
| CN105741180B (en) | 2016-04-21 | 2021-06-18 | 江苏大学 | Grain yield graph drawing system of combined harvester |
| JP6755117B2 (en) | 2016-04-26 | 2020-09-16 | ヤンマーパワーテクノロジー株式会社 | combine |
| US10275550B2 (en) | 2016-04-27 | 2019-04-30 | The Climate Corporation | Assimilating a soil sample into a digital nutrient model |
| US10152891B2 (en) | 2016-05-02 | 2018-12-11 | Cnh Industrial America Llc | System for avoiding collisions between autonomous vehicles conducting agricultural operations |
| DE102016118203A1 (en) | 2016-05-10 | 2017-11-16 | Claas Selbstfahrende Erntemaschinen Gmbh | Tractor-implement combination with driver assistance system |
| BR112018073172A8 (en) | 2016-05-12 | 2023-04-04 | Basf Se | METHOD FOR IDENTIFICATION OF A TYPE OF WEED, IDENTIFICATION SYSTEM AND COMPUTER PROGRAM PRODUCT |
| DE102016108902A1 (en) | 2016-05-13 | 2017-11-16 | Claas Saulgau Gmbh | Method and control device for operating an agricultural transport vehicle and transport trolley |
| US10051787B2 (en) | 2016-05-17 | 2018-08-21 | Deere & Company | Harvesting head with yield monitor |
| CN106053330B (en) | 2016-05-23 | 2018-12-18 | 北京林业大学 | Soil density and moisture combined measurement method and device |
| WO2017205410A1 (en) | 2016-05-24 | 2017-11-30 | Cnh Industrial America Llc | Grain cart for continuous conveying agricultural product |
| EP3462833A1 (en) | 2016-05-24 | 2019-04-10 | CNH Industrial Belgium NV | Autonomous grain cart dimensioned to fit behind header |
| US9563852B1 (en) | 2016-06-21 | 2017-02-07 | Iteris, Inc. | Pest occurrence risk assessment and prediction in neighboring fields, crops and soils using crowd-sourced occurrence data |
| DE102016111665A1 (en) | 2016-06-24 | 2017-12-28 | Claas Selbstfahrende Erntemaschinen Gmbh | Agricultural work machine and method for operating an agricultural work machine |
| EP3262934A1 (en) | 2016-06-28 | 2018-01-03 | Bayer CropScience AG | Method for combating undesired plant growth |
| UY36763A (en) | 2016-07-01 | 2018-01-31 | Carlos Hartwich | BREAKER AND PLANTOR IN UNITED MOTORIZED PLATFORM WITH AUTOMATIC NAVIGATOR |
| US9563848B1 (en) | 2016-07-06 | 2017-02-07 | Agrian, Inc. | Weighted multi-year yield analysis for prescription mapping in site-specific variable rate applications in precision agriculture |
| US9928584B2 (en) | 2016-07-11 | 2018-03-27 | Harvest Moon Automation Inc. | Inspecting plants for contamination |
| US10231371B2 (en) | 2016-07-18 | 2019-03-19 | Tribine Industries Llc | Soil compaction mitigation assembly and method |
| US10795351B2 (en) | 2016-07-19 | 2020-10-06 | Raven Industries, Inc. | System and method for autonomous control of agricultural machinery and equipment |
| CN106198879B (en) | 2016-07-22 | 2018-11-16 | 广东双木林科技有限公司 | A method of detection Chinese fir wind resisting stability can |
| CN106198877A (en) | 2016-07-22 | 2016-12-07 | 陈显桥 | By the method measuring unit check willow stability |
| CN106226470B (en) | 2016-07-22 | 2019-06-11 | 孙红 | A method of measuring the firm performance of Chinese scholartree by measuring device |
| CN106248873B (en) | 2016-07-22 | 2019-04-12 | 黄哲敏 | A method of pine tree firmness degree is measured by detection device |
| US20180022559A1 (en) | 2016-07-22 | 2018-01-25 | Scott William Knutson | Loader Positioning System |
| DE102016009085A1 (en) | 2016-07-26 | 2018-02-01 | Bomag Gmbh | Soil compaction roller with sensor device on the rolling drum and method for determining the soil stiffness |
| DE102016214554A1 (en) | 2016-08-05 | 2018-02-08 | Deere & Company | Method for optimizing a working parameter of a machine for applying agricultural material to a field and corresponding machine |
| US10351364B2 (en) | 2016-08-05 | 2019-07-16 | Deere & Company | Automatic vehicle and conveyor positioning |
| US10154624B2 (en) | 2016-08-08 | 2018-12-18 | The Climate Corporation | Estimating nitrogen content using hyperspectral and multispectral images |
| EP3287007A1 (en) | 2016-08-24 | 2018-02-28 | Bayer CropScience AG | Control of pests based on the prediction of infestation risks |
| US10410299B2 (en) | 2016-08-24 | 2019-09-10 | The Climate Corporation | Optimizing split fertilizer application |
| DE102016116043A1 (en) | 2016-08-29 | 2018-03-01 | Claas Selbstfahrende Erntemaschinen Gmbh | transport vehicle |
| US10609856B2 (en) | 2016-08-29 | 2020-04-07 | Troy Oliver | Agriculture system and method |
| CN106327349A (en) | 2016-08-30 | 2017-01-11 | 张琦 | Landscaping fine management device based on cloud computing |
| JP2018033407A (en) | 2016-09-01 | 2018-03-08 | ヤンマー株式会社 | Vehicle allocation system |
| DE102016116461A1 (en) | 2016-09-02 | 2018-03-08 | Claas Saulgau Gmbh | Method and control device for operating an agricultural transport vehicle and transport trolley |
| DE102016117757A1 (en) | 2016-09-21 | 2018-03-22 | Claas Selbstfahrende Erntemaschinen Gmbh | Forage |
| EP3298873B1 (en) | 2016-09-21 | 2020-03-04 | Exel Industries | Control device for a vehicle, corresponding vehicle and method |
| DE102016118297A1 (en) | 2016-09-28 | 2018-03-29 | Claas Tractor Sas | Method and system for determining an operating point |
| DE102016118283A1 (en) | 2016-09-28 | 2018-03-29 | Claas Tractor Sas | Agricultural working machine |
| US10078890B1 (en) | 2016-09-29 | 2018-09-18 | CHS North LLC | Anomaly detection |
| US11185006B2 (en) | 2016-09-29 | 2021-11-30 | Agro Intelligence Aps | System and a method for determining a trajectory to be followed by an agricultural work vehicle |
| DE102016118651A1 (en) | 2016-09-30 | 2018-04-05 | Claas Selbstfahrende Erntemaschinen Gmbh | Self-propelled agricultural machine |
| CN106290800B (en) | 2016-09-30 | 2018-10-12 | 长沙理工大学 | Soil slope water flow erosion resistance simulation test method and device |
| US10165725B2 (en) | 2016-09-30 | 2019-01-01 | Deere & Company | Controlling ground engaging elements based on images |
| US20180092302A1 (en) | 2016-10-01 | 2018-04-05 | Deere & Company | Residue spread control using operator input of wind direction and combine bearing |
| US20180092301A1 (en) | 2016-10-01 | 2018-04-05 | Deere & Company | Residue spread control using crop deflector commands input by the operator and satnav combine bearing |
| EP3528608B2 (en) | 2016-10-18 | 2024-01-10 | BASF Agro Trademarks GmbH | Planning and implementing agricultural measures |
| US20190335674A1 (en) | 2016-10-24 | 2019-11-07 | Board Of Trustees Of Michigan State University | Methods for mapping temporal and spatial stability and sustainability of a cropping system |
| JP6832828B2 (en) | 2016-10-26 | 2021-02-24 | 株式会社クボタ | Travel route determination device |
| EP3315005B1 (en) | 2016-10-28 | 2022-04-06 | Deere & Company | Stereo vision system for managing the unloading of an agricultural material from a vehicle |
| US11256999B2 (en) | 2016-10-28 | 2022-02-22 | Deere & Company | Methods and systems of forecasting the drying of an agricultural crop |
| AR110005A1 (en) | 2016-10-31 | 2019-02-13 | Bayer Cropscience Lp | METHOD AND SYSTEM FOR MAPPING CROPS PERFORMANCES |
| US10408645B2 (en) | 2016-11-01 | 2019-09-10 | Deere & Company | Correcting bias in parameter monitoring |
| US10832351B2 (en) | 2016-11-01 | 2020-11-10 | Deere & Company | Correcting bias in agricultural parameter monitoring |
| US10928821B2 (en) | 2016-11-04 | 2021-02-23 | Intel Corporation | Unmanned aerial vehicle-based systems and methods for generating landscape models |
| EP4241549A3 (en) | 2016-11-07 | 2024-03-20 | Climate LLC | Agricultural implement for soil analysis |
| BR112019009310B8 (en) | 2016-11-07 | 2023-04-04 | Climate Corp | SOIL IMAGE GENERATION SYSTEMS |
| US10028451B2 (en) | 2016-11-16 | 2018-07-24 | The Climate Corporation | Identifying management zones in agricultural fields and generating planting plans for the zones |
| US10398096B2 (en) * | 2016-11-16 | 2019-09-03 | The Climate Corporation | Identifying management zones in agricultural fields and generating planting plans for the zones |
| US20180146624A1 (en) | 2016-11-28 | 2018-05-31 | The Climate Corporation | Determining intra-field yield variation data based on soil characteristics data and satellite images |
| WO2018101351A1 (en) | 2016-12-02 | 2018-06-07 | 株式会社クボタ | Travel route management system and travel route determination device |
| US10178823B2 (en) | 2016-12-12 | 2019-01-15 | Cnh Industrial Canada, Ltd. | Agricultural implement with automatic shank depth control |
| CN106644663B (en) | 2016-12-12 | 2023-07-21 | 江苏省海洋水产研究所 | Filtering device for laver spore counting and counting method |
| WO2018116772A1 (en) | 2016-12-19 | 2018-06-28 | 株式会社クボタ | Work vehicle automatic traveling system |
| JP6936356B2 (en) | 2016-12-19 | 2021-09-15 | 株式会社クボタ | Work vehicle automatic driving system |
| WO2018116770A1 (en) | 2016-12-19 | 2018-06-28 | 株式会社クボタ | Work vehicle automatic traveling system |
| GB201621879D0 (en) | 2016-12-21 | 2017-02-01 | Branston Ltd | A crop monitoring system and method |
| JP6615085B2 (en) | 2016-12-22 | 2019-12-04 | 株式会社クボタ | Harvesting machine |
| WO2018112615A1 (en) | 2016-12-22 | 2018-06-28 | Greentronics Ltd. | Systems and methods for automated tracking of harvested materials |
| KR101873657B1 (en) | 2016-12-22 | 2018-08-03 | 현대건설주식회사 | Quality Control Method and Equipment of Soil Compaction Fills using Elastic Wave Velocity |
| CN206330815U (en) | 2017-01-06 | 2017-07-14 | 福建九邦环境检测科研有限公司 | A kind of Soil K+adsorption soil fast compacting device |
| US10255670B1 (en) | 2017-01-08 | 2019-04-09 | Dolly Y. Wu PLLC | Image sensor and module for agricultural crop improvement |
| US10775796B2 (en) | 2017-01-10 | 2020-09-15 | Cnh Industrial America Llc | Aerial vehicle systems and methods |
| DE102017200336A1 (en) | 2017-01-11 | 2018-07-12 | Deere & Company | Model-based predictive speed control of a harvester |
| KR200485051Y1 (en) | 2017-01-16 | 2017-11-22 | 서울특별시 | Apparatus for measuring soil compaction |
| US10699185B2 (en) | 2017-01-26 | 2020-06-30 | The Climate Corporation | Crop yield estimation using agronomic neural network |
| JP6767892B2 (en) | 2017-02-03 | 2020-10-14 | ヤンマーパワーテクノロジー株式会社 | Yield management system |
| DE102017104009A1 (en) | 2017-02-27 | 2018-08-30 | Claas Selbstfahrende Erntemaschinen Gmbh | Agricultural harvesting system |
| US10315655B2 (en) * | 2017-03-07 | 2019-06-11 | Deere & Company | Vehicle control based on soil compaction |
| CN206515119U (en) | 2017-03-10 | 2017-09-22 | 南京宁曦土壤仪器有限公司 | Electric compaction device |
| CN206515118U (en) | 2017-03-10 | 2017-09-22 | 南京宁曦土壤仪器有限公司 | Multi-function electric ramming instrument |
| JP7075787B2 (en) | 2017-03-14 | 2022-05-26 | 株式会社フジタ | Trafficability estimator and program |
| DE102017105490A1 (en) | 2017-03-15 | 2018-09-20 | Amazonen-Werke H. Dreyer Gmbh & Co. Kg | Agricultural terminal |
| DE102017105496A1 (en) | 2017-03-15 | 2018-09-20 | Amazonen-Werke H. Dreyer Gmbh & Co. Kg | Agricultural terminal |
| DE102017204511A1 (en) | 2017-03-17 | 2018-09-20 | Deere & Company | Agricultural harvester for processing and conveying crop with a sensor assembly for detecting unwanted hazardous substances and ingredients in the crop |
| EP3582603A4 (en) | 2017-03-21 | 2021-01-06 | Blue River Technology Inc. | Combine harvester including machine feedback control |
| CN206616118U (en) | 2017-03-21 | 2017-11-07 | 嵊州市晟祥盈净水设备有限公司 | A kind of multi-level advanced water purifying equipment |
| DE102017205293A1 (en) | 2017-03-29 | 2018-10-04 | Deere & Company | Method and device for controlling unwanted organisms in a field |
| US10152035B2 (en) | 2017-04-12 | 2018-12-11 | Bayer Ag | Value added pest control system with smart learning |
| CN206906093U (en) | 2017-04-21 | 2018-01-19 | 青岛科技大学 | A kind of rock soil test piece compacting process can measure the device of weight |
| RU2017114139A (en) | 2017-04-24 | 2018-10-24 | Общество с ограниченной ответственностью "Завод инновационных продуктов "КТЗ" | HARVEST MANAGEMENT METHOD |
| WO2018200870A1 (en) | 2017-04-26 | 2018-11-01 | The Climate Corporation | Method for leveling sensor readings across an implement |
| US10952374B2 (en) | 2017-05-01 | 2021-03-23 | Cnh Industrial America Llc | System and method for monitoring residue output from a harvester |
| US10548260B2 (en) | 2017-05-04 | 2020-02-04 | Dawn Equipment Company | System for automatically setting the set point of a planter automatic down pressure control system with a seed furrow sidewall compaction measurement device |
| DE102017109849A1 (en) | 2017-05-08 | 2018-11-08 | Claas Selbstfahrende Erntemaschinen Gmbh | Method for processing an agricultural harvesting process |
| BE1024513B1 (en) | 2017-05-09 | 2018-03-21 | Cnh Industrial Belgium Nv | AGRICULTURAL SYSTEM |
| BE1024475B1 (en) | 2017-05-09 | 2018-03-01 | Cnh Industrial Belgium Nv | METHOD FOR HARVESTING AND HARVESTING DEVICE |
| US10531603B2 (en) | 2017-05-09 | 2020-01-14 | Cnh Industrial America Llc | Agricultural system |
| US10317272B2 (en) | 2017-05-17 | 2019-06-11 | Deere & Company | Automatic wireless wagon detection apparatus and method |
| CN206696107U (en) | 2017-05-18 | 2017-12-01 | 贵州省山地农业机械研究所 | Multipurpose soil compactibility measurement apparatus |
| DE102017208442A1 (en) | 2017-05-18 | 2018-11-22 | Deere & Company | Self-learning, corrective input-taking arrangement for the automatic control of a working parameter of a Erntegutförder- and / or processing device |
| US10481142B2 (en) | 2017-05-25 | 2019-11-19 | Deere & Company | Sensor system for determining soil characteristics |
| US10537062B2 (en) | 2017-05-26 | 2020-01-21 | Cnh Industrial America Llc | Aerial vehicle systems and methods |
| CN207079558U (en) | 2017-05-31 | 2018-03-09 | 中铁二十一局集团第六工程有限公司 | High-speed railway subgrade settlement monitoring element protection |
| BE1025282B1 (en) | 2017-06-02 | 2019-01-11 | Cnh Industrial Belgium Nv | Carrying capacity of the ground |
| US9984455B1 (en) | 2017-06-05 | 2018-05-29 | Hana Resources, Inc. | Organism growth prediction system using drone-captured images |
| SE542261C2 (en) | 2017-06-05 | 2020-03-31 | Scania Cv Ab | Method and control arrangement for loading |
| CN206941558U (en) | 2017-06-16 | 2018-01-30 | 中石化中原建设工程有限公司 | A kind of road lime soil foundation compactedness measurement sampler |
| US10459447B2 (en) | 2017-06-19 | 2019-10-29 | Cnh Industrial America Llc | System and method for generating partitioned swaths |
| US11589507B2 (en) | 2017-06-19 | 2023-02-28 | Deere & Company | Combine harvester control interface for operator and/or remote user |
| US10437243B2 (en) | 2017-06-19 | 2019-10-08 | Deere & Company | Combine harvester control interface for operator and/or remote user |
| US10310455B2 (en) | 2017-06-19 | 2019-06-04 | Deere & Company | Combine harvester control and communication system |
| US10314232B2 (en) | 2017-06-21 | 2019-06-11 | Cnh Industrial America Llc | System and method for destroying seeds in crop residue prior to discharge from agricultural harvester |
| JP6887323B2 (en) | 2017-06-23 | 2021-06-16 | 株式会社クボタ | Combine and field farming map generation method |
| KR102589076B1 (en) | 2017-06-23 | 2023-10-16 | 가부시끼 가이샤 구보다 | harvest |
| WO2019003851A1 (en) | 2017-06-26 | 2019-01-03 | 株式会社クボタ | Farm field map generation system |
| JP6827373B2 (en) | 2017-06-26 | 2021-02-10 | 株式会社クボタ | combine |
| DE102017006844B4 (en) | 2017-07-18 | 2019-04-11 | Bomag Gmbh | Soil compactor and method for determining substrate properties by means of a soil compactor |
| US10757859B2 (en) | 2017-07-20 | 2020-09-01 | Deere & Company | System for optimizing platform settings based on crop state classification |
| US11263707B2 (en) | 2017-08-08 | 2022-03-01 | Indigo Ag, Inc. | Machine learning in agricultural planting, growing, and harvesting contexts |
| DK179454B1 (en) | 2017-08-17 | 2018-10-19 | Agro Intelligence Aps | A system for controlling soil compaction caused by wheels, and use of such system |
| US10438302B2 (en) | 2017-08-28 | 2019-10-08 | The Climate Corporation | Crop disease recognition and yield estimation |
| CN107576674A (en) | 2017-08-30 | 2018-01-12 | 曲阜师范大学 | A kind of method based on GPR measurement soil compression degree |
| US11140807B2 (en) | 2017-09-07 | 2021-10-12 | Deere & Company | System for optimizing agricultural machine settings |
| CA3073291C (en) | 2017-09-11 | 2023-01-17 | Farmers Edge Inc. | Generating a yield map for an agricultural field using classification and regression methods |
| US10368488B2 (en) | 2017-09-18 | 2019-08-06 | Cnh Industrial America Llc | System and method for sensing harvested crop levels within an agricultural harvester |
| US10883437B2 (en) | 2017-09-19 | 2021-01-05 | Doug Abolt | Horsepower on demand system |
| DE102017121654A1 (en) | 2017-09-19 | 2019-03-21 | Claas Tractor Sas | Agricultural working machine |
| CN107736088B (en) | 2017-09-22 | 2020-06-26 | 江苏大学 | Be used for closely knit degree of soil of finishing ground to measure and automatic regulating system |
| DE102017122300A1 (en) | 2017-09-26 | 2019-03-28 | Claas Selbstfahrende Erntemaschinen Gmbh | working machine |
| DE102017122710A1 (en) | 2017-09-29 | 2019-04-04 | Claas E-Systems Kgaa Mbh & Co. Kg | Method for operating a self-propelled agricultural machine |
| DE102017122712A1 (en) | 2017-09-29 | 2019-04-04 | Claas Selbstfahrende Erntemaschinen Gmbh | Method for operating a self-propelled agricultural machine |
| DE102017122711A1 (en) | 2017-09-29 | 2019-04-04 | Claas E-Systems Kgaa Mbh & Co. Kg | Method for operating a self-propelled agricultural machine |
| CA3199299A1 (en) | 2017-10-02 | 2019-04-11 | Precision Planting Llc | Systems and apparatuses for soil and seed monitoring |
| US10423850B2 (en) | 2017-10-05 | 2019-09-24 | The Climate Corporation | Disease recognition from images having a large field of view |
| CN107795095A (en) | 2017-10-10 | 2018-03-13 | 上海科城建设工程有限公司 | A kind of Joining Technology of precast concrete terrace |
| US10517215B2 (en) | 2017-10-12 | 2019-12-31 | Deere & Company | Roll center for attachment frame control arms |
| US11308735B2 (en) | 2017-10-13 | 2022-04-19 | Deere & Company | Unmanned aerial vehicle (UAV)-assisted worksite data acquisition |
| AU2018350912B2 (en) | 2017-10-17 | 2024-06-13 | Precision Planting Llc | Soil sensing systems and implements for sensing different soil parameters |
| EP4218381A1 (en) | 2017-10-24 | 2023-08-02 | BASF Agro Trademarks GmbH | Generation of digital processing maps |
| CN107957408B (en) | 2017-10-30 | 2021-01-12 | 汕头大学 | Method for measuring soil suction by light reflection theory |
| US20190124819A1 (en) | 2017-10-31 | 2019-05-02 | Agjunction Llc | Vehicle implement control |
| CN108009542B (en) | 2017-11-01 | 2021-06-15 | 华中农业大学 | Weed image segmentation method in rape field environment |
| US10914054B2 (en) | 2017-11-07 | 2021-02-09 | ModernAg, Inc. | System and method for measurement and abatement of compaction and erosion of soil covering buried pipelines |
| US11568340B2 (en) | 2017-11-09 | 2023-01-31 | Climate Llc | Hybrid seed selection and seed portfolio optimization by field |
| DK179951B1 (en) | 2017-11-11 | 2019-10-24 | Agro Intelligence Aps | A system and a method for optimizing a harvesting operation |
| US10853377B2 (en) | 2017-11-15 | 2020-12-01 | The Climate Corporation | Sequential data assimilation to improve agricultural modeling |
| US10521526B2 (en) | 2017-11-20 | 2019-12-31 | Nfl Players, Inc. | Hybrid method of assessing and predicting athletic performance |
| US11151500B2 (en) | 2017-11-21 | 2021-10-19 | The Climate Corporation | Digital modeling of disease on crops on agronomic fields |
| DE102017221134A1 (en) | 2017-11-27 | 2019-05-29 | Robert Bosch Gmbh | Method and apparatus for operating a mobile system |
| US10412889B2 (en) | 2017-12-05 | 2019-09-17 | Deere & Company | Combine harvester control information for a remote user with visual feed |
| US11197405B2 (en) | 2017-12-07 | 2021-12-14 | Kubota Corporation | Harvesting machine and travel mode switching method |
| US11835955B2 (en) | 2017-12-08 | 2023-12-05 | Camso Inc. | Systems and methods for monitoring off-road vehicles |
| CN207567744U (en) | 2017-12-08 | 2018-07-03 | 山西省交通科学研究院 | Road lime soil foundation compactedness measurement sampler |
| DE102017222403A1 (en) | 2017-12-11 | 2019-06-13 | Deere & Company | Method and device for mapping any foreign bodies present in a field |
| EP3725632A4 (en) | 2017-12-15 | 2021-10-20 | Kubota Corporation | Slip determination system, travel path generation system, and field work vehicle |
| US10660268B2 (en) | 2017-12-16 | 2020-05-26 | Deere & Company | Harvester with electromagnetic plane crop material flow sensor |
| WO2019124225A1 (en) | 2017-12-18 | 2019-06-27 | 株式会社クボタ | Agricultural vehicle, work vehicle collision warning system, and work vehicle |
| KR20200096496A (en) | 2017-12-18 | 2020-08-12 | 가부시끼 가이샤 구보다 | Combine control system, combine control program, recording medium recording the combine control program, combine control method, harvester control system, harvester control program, recording medium recording harvester control program, harvester control method |
| KR20200096500A (en) | 2017-12-18 | 2020-08-12 | 가부시끼 가이샤 구보다 | Automatic steering system and automatic steering method |
| EP3498074A1 (en) | 2017-12-18 | 2019-06-19 | DINAMICA GENERALE S.p.A | An harvest analysis system intended for use in a machine |
| CN111386030B (en) | 2017-12-18 | 2023-01-31 | 株式会社久保田 | Automatic travel system, automatic travel management program and method, and recording medium |
| CN111343854B (en) | 2017-12-20 | 2022-08-12 | 株式会社久保田 | Work vehicle, travel route selection system for work vehicle, and travel route calculation system |
| CN208047351U (en) | 2017-12-26 | 2018-11-06 | 南安市振邦家庭农场有限公司 | A kind of efficient maize sheller |
| US10568261B2 (en) | 2017-12-28 | 2020-02-25 | Cnh Industrial America Llc | Dynamic combine fire risk index and display |
| DK179768B1 (en) | 2017-12-29 | 2019-05-15 | Agro Intelligence Aps | Apparatus and method for improving the conditioning quality of grass and clover prior to the collecting thereof |
| DK179878B1 (en) | 2017-12-29 | 2019-08-16 | Agro Intelligence Aps | Apparatus and method for improving the quality of grass and clover by tedding |
| DK179771B1 (en) | 2017-12-29 | 2019-05-15 | Agro Intelligence Aps | Apparatus and method for improving the yield of grass and clover harvested from an agricultural field |
| CN107941286A (en) | 2018-01-09 | 2018-04-20 | 东北农业大学 | A kind of portable field multiparameter measuring device |
| US10477756B1 (en) | 2018-01-17 | 2019-11-19 | Cibo Technologies, Inc. | Correcting agronomic data from multiple passes through a farmable region |
| US10909368B2 (en) | 2018-01-23 | 2021-02-02 | X Development Llc | Crop type classification in images |
| US10687466B2 (en) | 2018-01-29 | 2020-06-23 | Cnh Industrial America Llc | Predictive header height control system |
| CN108304796A (en) | 2018-01-29 | 2018-07-20 | 深圳春沐源控股有限公司 | A kind of intelligence weeds alarming method for power and system |
| JP7101488B2 (en) | 2018-01-30 | 2022-07-15 | 株式会社クボタ | Work vehicle management system |
| JP2019146506A (en) | 2018-02-26 | 2019-09-05 | 井関農機株式会社 | Automatic travel control device for combine |
| US11006577B2 (en) | 2018-02-26 | 2021-05-18 | Cnh Industrial America Llc | System and method for adjusting operating parameters of an agricultural harvester based on estimated crop volume |
| DE102018104286A1 (en) | 2018-02-26 | 2019-08-29 | Claas Selbstfahrende Erntemaschinen Gmbh | Self-propelled forage harvester |
| DE102018001551A1 (en) | 2018-02-28 | 2019-08-29 | Class Selbstfahrende Erntemaschinen Gmbh | Self-propelled harvester and operating method for it |
| US10830634B2 (en) | 2018-03-06 | 2020-11-10 | Deere & Company | Fill level detection and control |
| CN208013131U (en) | 2018-03-16 | 2018-10-26 | 云南群林科技有限公司 | A kind of Agricultural Information acquisition system based on multisensor |
| US10785903B2 (en) | 2018-04-17 | 2020-09-29 | Hrl Laboratories, Llc | System and method for determining crop residue fraction using blind source separation of color images |
| DE102018206507A1 (en) | 2018-04-26 | 2019-10-31 | Deere & Company | Cutting unit with automatic adjustment of the hook tine orientation |
| US11240959B2 (en) | 2018-04-30 | 2022-02-08 | Deere & Company | Adaptive forward-looking biomass conversion and machine control during crop harvesting operations |
| EP3563654B1 (en) | 2018-05-02 | 2022-12-21 | AGCO Corporation | Automatic header control simulation |
| BE1025780B1 (en) | 2018-05-07 | 2019-07-08 | Cnh Industrial Belgium Nv | SYSTEM AND METHOD FOR LOCALIZING A TRAILER WITH REGARD TO AN AGRICULTURAL MACHINE |
| DE102018111077A1 (en) | 2018-05-08 | 2019-11-14 | Claas Selbstfahrende Erntemaschinen Gmbh | Combine harvester and method for operating a combine harvester |
| DE102018111076A1 (en) | 2018-05-08 | 2019-11-14 | Claas Selbstfahrende Erntemaschinen Gmbh | Harvester |
| US10820516B2 (en) | 2018-05-08 | 2020-11-03 | Cnh Industrial America Llc | System and method for monitoring the amount of plant materials entering an agricultural harvester |
| CN108614089A (en) | 2018-05-09 | 2018-10-02 | 重庆交通大学 | Compacted fill freeze thawing and weathering environmental simulation system and its test method |
| US11641790B2 (en) | 2018-05-09 | 2023-05-09 | Deere & Company | Method of planning a path for a vehicle having a work tool and a vehicle path planning system |
| US10782672B2 (en) | 2018-05-15 | 2020-09-22 | Deere & Company | Machine control system using performance score based setting adjustment |
| DE102018111746A1 (en) | 2018-05-16 | 2019-11-21 | Claas Selbstfahrende Erntemaschinen Gmbh | Agricultural working machine |
| US20190351765A1 (en) | 2018-05-18 | 2019-11-21 | Cnh Industrial America Llc | System and method for regulating the operating distance between work vehicles |
| JP7039026B2 (en) | 2018-05-28 | 2022-03-22 | ヤンマーパワーテクノロジー株式会社 | Map information generation system and work support system |
| US10813288B2 (en) | 2018-05-31 | 2020-10-27 | Deere & Company | Automated belt speed control |
| DE102018113327A1 (en) | 2018-06-05 | 2019-12-05 | Claas Selbstfahrende Erntemaschinen Gmbh | Method for controlling an agricultural harvest campaign |
| CN108881825A (en) | 2018-06-14 | 2018-11-23 | 华南农业大学 | Rice weed monitoring unmanned system and its monitoring method based on Jetson TK1 |
| US11064653B2 (en) | 2018-06-18 | 2021-07-20 | Ag Leader Technology | Agricultural systems having stalk sensors and data visualization systems and related devices and methods |
| US11419261B2 (en) | 2018-06-25 | 2022-08-23 | Deere & Company | Prescription cover crop seeding with combine |
| US11395452B2 (en) | 2018-06-29 | 2022-07-26 | Deere & Company | Method of mitigating compaction and a compaction mitigation system |
| DE102018116578A1 (en) | 2018-07-09 | 2020-01-09 | Claas Selbstfahrende Erntemaschinen Gmbh | harvesting system |
| AU2019299980B2 (en) | 2018-07-11 | 2022-03-17 | Raven Industries, Inc. | Agricultural control and interface system |
| DE102018116817A1 (en) | 2018-07-11 | 2020-01-16 | Claas Selbstfahrende Erntemaschinen Gmbh | Method for controlling a data transmission between an agricultural working machine and an external transmitting / receiving unit |
| DE102018116990A1 (en) | 2018-07-13 | 2020-01-16 | Claas Selbstfahrende Erntemaschinen Gmbh | Agricultural work machine |
| DE102018212150A1 (en) | 2018-07-20 | 2020-01-23 | Deere & Company | Process for supplying energy to a wired field chopper |
| MX2021000907A (en) | 2018-07-26 | 2021-03-31 | Climate Llc | Generating agronomic yield maps from field health imagery. |
| US11277956B2 (en) | 2018-07-26 | 2022-03-22 | Bear Flag Robotics, Inc. | Vehicle controllers for agricultural and industrial applications |
| WO2020026578A1 (en) | 2018-07-31 | 2020-02-06 | 株式会社クボタ | Travel route generation system, travel route generation method, travel route generation program, storage medium storing travel route generation program, operation management system, operation management method, operation management program, storage medium storing operation management program, harvester, travel pattern generation system, travel pattern generation program, storage medium storing travel pattern generation program, and travel pattern generation method |
| CN112752500A (en) | 2018-08-01 | 2021-05-04 | 株式会社久保田 | Harvester, travel system, travel method, travel program, and storage medium |
| WO2020026650A1 (en) | 2018-08-01 | 2020-02-06 | 株式会社クボタ | Automatic travel control system, automatic travel control method, automatic travel control program, and storage medium |
| JP6958508B2 (en) | 2018-08-02 | 2021-11-02 | 井関農機株式会社 | Harvesting work system |
| US11234357B2 (en) | 2018-08-02 | 2022-02-01 | Cnh Industrial America Llc | System and method for monitoring field conditions of an adjacent swath within a field |
| WO2020031473A1 (en) | 2018-08-06 | 2020-02-13 | 株式会社クボタ | External shape calculation system, external shape calculation method, external shape calculation program, storage medium having external shape calculation program stored therein, farm field map generation system, farm field map generation program, storage medium having farm field map generation program stored therein, and farm field map generation method |
| JP7034866B2 (en) | 2018-08-20 | 2022-03-14 | 株式会社クボタ | Harvester |
| US11154008B2 (en) | 2018-08-20 | 2021-10-26 | Cnh Industrial America Llc | System and method for steering an agricultural harvester |
| EP3840560A1 (en) | 2018-08-22 | 2021-06-30 | Precision Planting LLC | Implements and application units having sensors for sensing data to determine agricultural plant characteristics of agricultural fields |
| US11954743B2 (en) | 2018-08-22 | 2024-04-09 | Agco International Gmbh | Harvest logistics |
| DE102018120741A1 (en) | 2018-08-24 | 2020-02-27 | Claas Selbstfahrende Erntemaschinen Gmbh | Harvester |
| KR20210039452A (en) | 2018-08-29 | 2021-04-09 | 가부시끼 가이샤 구보다 | Automatic steering system and harvester, automatic steering method, automatic steering program, recording medium |
| JP7121598B2 (en) | 2018-08-31 | 2022-08-18 | 三菱マヒンドラ農機株式会社 | harvester |
| CA3108902A1 (en) | 2018-08-31 | 2020-03-05 | The Climate Corporation | Subfield moisture model improvement using overland flow modeling with shallow water computations |
| US11197417B2 (en) | 2018-09-18 | 2021-12-14 | Deere & Company | Grain quality control system and method |
| US20200090094A1 (en) | 2018-09-19 | 2020-03-19 | Deere & Company | Harvester control system |
| CN113168577B (en) | 2018-09-21 | 2024-11-05 | 克莱米特有限责任公司 | Method and system for executing machine learning algorithm |
| DE102018123478A1 (en) | 2018-09-24 | 2020-03-26 | Claas Tractor Sas | Agricultural work machine |
| AU2019358788A1 (en) | 2018-10-11 | 2021-05-06 | Mtd Products Inc. | Localized data mapping for indoor and outdoor applications |
| US11676244B2 (en) | 2018-10-19 | 2023-06-13 | Mineral Earth Sciences Llc | Crop yield prediction at field-level and pixel-level |
| US10729067B2 (en) | 2018-10-20 | 2020-08-04 | Deere & Company | Biomass impact sensor having a conformal encasement enveloping a pressure sensitive film |
| CA3116429A1 (en) | 2018-10-24 | 2020-04-30 | Bitstrata Systems Inc. | Machine operational state and material movement tracking |
| US11467605B2 (en) | 2019-04-10 | 2022-10-11 | Deere & Company | Zonal machine control |
| US11240961B2 (en) | 2018-10-26 | 2022-02-08 | Deere & Company | Controlling a harvesting machine based on a geo-spatial representation indicating where the harvesting machine is likely to reach capacity |
| US11079725B2 (en) | 2019-04-10 | 2021-08-03 | Deere & Company | Machine control using real-time model |
| US11178818B2 (en) | 2018-10-26 | 2021-11-23 | Deere & Company | Harvesting machine control system with fill level processing based on yield data |
| US10986778B2 (en) | 2018-10-31 | 2021-04-27 | Deere & Company | Weed seed devitalizer control |
| US11399462B2 (en) | 2018-10-31 | 2022-08-02 | Cnh Industrial America Llc | System and method for calibrating alignment of work vehicles |
| US20200128738A1 (en) | 2018-10-31 | 2020-04-30 | Cnh Industrial America Llc | System and method for calibrating alignment of work vehicles |
| US11206763B2 (en) | 2018-10-31 | 2021-12-28 | Deere & Company | Weed seed based harvester working member control |
| US11564349B2 (en) | 2018-10-31 | 2023-01-31 | Deere & Company | Controlling a machine based on cracked kernel detection |
| US20200133262A1 (en) | 2018-10-31 | 2020-04-30 | Cnh Industrial America Llc | System and method for calibrating alignment of work vehicles |
| US11175170B2 (en) | 2018-11-07 | 2021-11-16 | Trimble Inc. | Estimating yield of agricultural crops |
| US10996656B2 (en) | 2018-11-08 | 2021-05-04 | Premier Crop Systems, LLC | System and method for aggregating test plot results based on agronomic environments |
| US20200146203A1 (en) | 2018-11-13 | 2020-05-14 | Cnh Industrial America Llc | Geographic coordinate based setting adjustment for agricultural implements |
| CN109357804B (en) | 2018-11-13 | 2023-09-19 | 西南交通大学 | Compacted soil horizontal stress testing device and testing method |
| KR20210089652A (en) | 2018-11-15 | 2021-07-16 | 가부시끼 가이샤 구보다 | Harvester and routing system |
| CN111201879B (en) | 2018-11-21 | 2023-10-03 | 金华中科艾特智能科技研究所有限公司 | Grain harvesting and transporting integrated loading device/method based on image recognition |
| KR20210093873A (en) | 2018-11-26 | 2021-07-28 | 가부시끼 가이샤 구보다 | Agricultural equipment, agricultural equipment control program, recording medium recording agricultural equipment control program, agricultural equipment control method, harvester, harvester control program, recording medium recording harvester control program, harvester control method |
| US11363766B2 (en) * | 2018-11-27 | 2022-06-21 | Valmont Industries, Inc. | System, method and apparatus for providing constant pressure within an irrigation system at reduced flow rates |
| US11483970B2 (en) | 2018-11-28 | 2022-11-01 | Cnh Industrial America Llc | System and method for adjusting the orientation of an agricultural harvesting implement based on implement height |
| DE102018131142A1 (en) | 2018-12-06 | 2020-06-10 | Claas Selbstfahrende Erntemaschinen Gmbh | Agricultural machine and method for operating an agricultural machine |
| US11067994B2 (en) | 2018-12-06 | 2021-07-20 | Deere & Company | Machine control through active ground terrain mapping |
| DE102018132144A1 (en) | 2018-12-13 | 2020-06-18 | Claas E-Systems Gmbh | Agricultural work system |
| EP3671590A1 (en) | 2018-12-21 | 2020-06-24 | AGCO Corporation | Method of unloading batch grain quantities for harvesting machines |
| JP7182471B2 (en) | 2019-01-11 | 2022-12-02 | 株式会社クボタ | Work management system and work machine |
| CN109485353A (en) | 2019-01-18 | 2019-03-19 | 安徽马钢嘉华新型建材有限公司 | A kind of novel steel slag composite soil road basement material and preparation method |
| DE102019200794A1 (en) | 2019-01-23 | 2020-07-23 | Amazonen-Werke H. Dreyer Gmbh & Co. Kg | System and method for the identification of time windows and areas of an agricultural field with favorable conditions for an effective and environmentally friendly use and / or the passability of agricultural machinery |
| CN109633127B (en) | 2019-01-24 | 2024-06-04 | 山东省农业机械科学研究院 | Soil compactness measuring mechanism, device and method |
| US11154002B2 (en) * | 2019-01-29 | 2021-10-26 | Cnh Industrial America Llc | System and method for controlling the operation of an agricultural implement based on determined soil moisture content |
| US20200265527A1 (en) | 2019-02-15 | 2020-08-20 | Growers Edge Financial, Inc. | Agronomic prescription product |
| CN109961024A (en) | 2019-03-08 | 2019-07-02 | 武汉大学 | Wheat weeds in field detection method based on deep learning |
| CN109763476B (en) | 2019-03-12 | 2024-06-28 | 上海兰德公路工程咨询设计有限公司 | Device and method for rapidly detecting compactness of filled roadbed |
| JP7062610B2 (en) | 2019-03-26 | 2022-05-06 | ヤンマーパワーテクノロジー株式会社 | Work control system |
| CN210585958U (en) | 2019-03-28 | 2020-05-22 | 宁夏大学 | Auxiliary device for identifying and sorting mildewed corns |
| DE102019108505A1 (en) | 2019-04-02 | 2020-10-08 | Claas E-Systems Gmbh | Agricultural work machine |
| US10677637B1 (en) | 2019-04-04 | 2020-06-09 | Scale Tec, Ltd. | Scale controller with dynamic weight measurement |
| CN110232494A (en) | 2019-04-09 | 2019-09-13 | 丰疆智能科技股份有限公司 | Logistic car dispatches system and method |
| CN110232493B (en) | 2019-04-09 | 2021-07-30 | 丰疆智能科技股份有限公司 | Intelligent matching system and method for harvester and logistics vehicle |
| WO2020210607A1 (en) | 2019-04-10 | 2020-10-15 | Kansas State University Research Foundation | Autonomous robot system for steep terrain farming operations |
| US11778945B2 (en) | 2019-04-10 | 2023-10-10 | Deere & Company | Machine control using real-time model |
| US11234366B2 (en) | 2019-04-10 | 2022-02-01 | Deere & Company | Image selection for machine control |
| US11016049B2 (en) | 2019-04-17 | 2021-05-25 | Deere & Company | Agricultural moisture and test weight sensor with co-planar electrodes |
| US20200337232A1 (en) | 2019-04-24 | 2020-10-29 | Deere & Company | Information inference for agronomic data generation in sugarcane applications |
| FR3095572B1 (en) | 2019-05-02 | 2023-03-17 | Agreenculture | Method for managing fleets of self-guided agricultural vehicles |
| DE102019206734A1 (en) | 2019-05-09 | 2020-11-12 | Deere & Company | Seed drill with predictive control |
| US10703277B1 (en) | 2019-05-16 | 2020-07-07 | Cnh Industrial America Llc | Heads-up display for an agricultural combine |
| US11674288B2 (en) | 2019-05-30 | 2023-06-13 | Deere & Company | System and method for obscurant mitigation |
| DE102019114872A1 (en) | 2019-06-03 | 2020-12-03 | Horsch Leeb Application Systems Gmbh | System and method for simulating and / or configuring a work process to be carried out by means of an agricultural work machine and an agricultural work machine |
| US11457563B2 (en) | 2019-06-27 | 2022-10-04 | Deere & Company | Harvester stability monitoring and control |
| CN110262287A (en) | 2019-07-14 | 2019-09-20 | 南京林业大学 | Canopy height on-line water flushing method for the highly automated control of the harvest machinery ceding of Taiwan |
| DE102019119110A1 (en) | 2019-07-15 | 2021-01-21 | Claas Selbstfahrende Erntemaschinen Gmbh | Method for processing an agricultural work process in a field |
| JP2019216744A (en) | 2019-09-03 | 2019-12-26 | ヤンマー株式会社 | Combine |
| US11904871B2 (en) | 2019-10-30 | 2024-02-20 | Deere & Company | Predictive machine control |
| CN110720302A (en) | 2019-11-29 | 2020-01-24 | 河南瑞创通用机械制造有限公司 | Intelligent adjusting system of grain harvester and control method thereof |
| US11540447B2 (en) * | 2019-12-17 | 2023-01-03 | Deere & Company | Predictive crop characteristic mapping for product application |
| US11800829B2 (en) | 2019-12-17 | 2023-10-31 | Deere & Company | Work machine zone generation and control system with geospatial constraints |
| US11641801B2 (en) | 2020-04-21 | 2023-05-09 | Deere & Company | Agricultural harvesting machine control using machine learning for variable delays |
| CN111406505A (en) | 2020-04-30 | 2020-07-14 | 江苏大学 | Device and method for monitoring remaining capacity and remaining walking distance of grain tank of combine harvester |
| EP4172898A1 (en) | 2020-06-25 | 2023-05-03 | The Toro Company | Turf management systems and methods |
-
2022
- 2022-04-08 US US17/716,383 patent/US12058951B2/en active Active
-
2023
- 2023-02-02 EP EP23154795.1A patent/EP4256937A1/en active Pending
Patent Citations (2)
| Publication number | Priority date | Publication date | Assignee | Title |
|---|---|---|---|---|
| US7171912B2 (en) * | 2001-02-28 | 2007-02-06 | The Mosaic Company | Method for prescribing site-specific fertilizer application in agricultural fields |
| US10482539B2 (en) * | 2014-12-05 | 2019-11-19 | Board Of Trustees Of Michigan State University | Methods and systems for precision crop management |
Also Published As
| Publication number | Publication date |
|---|---|
| US20230320259A1 (en) | 2023-10-12 |
| US12058951B2 (en) | 2024-08-13 |
Similar Documents
| Publication | Publication Date | Title |
|---|---|---|
| US20220232816A1 (en) | Predictive weed map and material application machine control | |
| EP3987927A1 (en) | System confidence display and control for mobile machines | |
| EP4256943A1 (en) | Systems and methods for predictive power requirements and control | |
| EP4256937A1 (en) | Predictive nutrient map and control | |
| US20230320274A1 (en) | Residue characteristic confidence and control | |
| US20230309437A1 (en) | Systems and methods for predictive ground engaging machine control | |
| EP4260671A1 (en) | Systems and methods for generating predictive tractive characteristics and for predictive tractive control | |
| EP4256935A1 (en) | Agricultural planting system and method of generating a functional predictive ground engagement map | |
| EP4256942A1 (en) | Systems and methods for predictive power requirements and control | |
| US20230309450A1 (en) | Cotton harvester control using predictive maps | |
| EP4256930A1 (en) | Predictive material consumption map and control | |
| EP4256957A1 (en) | Predictive weed map and material application machine control | |
| US20240138284A1 (en) | Map based farming for windrower operation | |
| EP4218392A1 (en) | Systems and methods for predicting material dynamics | |
| EP4197312A1 (en) | Crop constituents, predictive mapping, and agricultural harvester control | |
| EP4256931A1 (en) | Agricultural ground engaging machine and method of controlling such | |
| US20240049634A1 (en) | Systems and methods for predictive harvesting logistics | |
| US20240049635A1 (en) | Systems and methods for coordinating work machines during material transfer | |
| US20240049633A1 (en) | Systems and methods for predictive harvesting logistics | |
| EP4445711A1 (en) | A method and system for estimating performance for position-specific control of an agricultural machine | |
| EP4260672A1 (en) | Generation of a predictive machine setting map and control system | |
| US20240138280A1 (en) | Map based farming for windrower operation | |
| AU2022473991A1 (en) | Systems and methods for predictive harvesting logistics | |
| US12082531B2 (en) | Systems and methods for predicting material dynamics | |
| US20240122111A1 (en) | Systems and methods for automated deck plate control based on feedback and prediction |
Legal Events
| Date | Code | Title | Description |
|---|---|---|---|
| PUAI | Public reference made under article 153(3) epc to a published international application that has entered the european phase |
Free format text: ORIGINAL CODE: 0009012 |
|
| STAA | Information on the status of an ep patent application or granted ep patent |
Free format text: STATUS: THE APPLICATION HAS BEEN PUBLISHED |
|
| AK | Designated contracting states |
Kind code of ref document: A1 Designated state(s): AL AT BE BG CH CY CZ DE DK EE ES FI FR GB GR HR HU IE IS IT LI LT LU LV MC ME MK MT NL NO PL PT RO RS SE SI SK SM TR |
|
| STAA | Information on the status of an ep patent application or granted ep patent |
Free format text: STATUS: REQUEST FOR EXAMINATION WAS MADE |
|
| 17P | Request for examination filed |
Effective date: 20240411 |
|
| RBV | Designated contracting states (corrected) |
Designated state(s): AL AT BE BG CH CY CZ DE DK EE ES FI FR GB GR HR HU IE IS IT LI LT LU LV MC ME MK MT NL NO PL PT RO RS SE SI SK SM TR |