EP1209720A2 - Energieverteilungsmessung - Google Patents
Energieverteilungsmessung Download PDFInfo
- Publication number
- EP1209720A2 EP1209720A2 EP01127285A EP01127285A EP1209720A2 EP 1209720 A2 EP1209720 A2 EP 1209720A2 EP 01127285 A EP01127285 A EP 01127285A EP 01127285 A EP01127285 A EP 01127285A EP 1209720 A2 EP1209720 A2 EP 1209720A2
- Authority
- EP
- European Patent Office
- Prior art keywords
- electron beam
- spectrum
- energy
- electron
- peak
- Prior art date
- Legal status (The legal status is an assumption and is not a legal conclusion. Google has not performed a legal analysis and makes no representation as to the accuracy of the status listed.)
- Ceased
Links
- 238000001228 spectrum Methods 0.000 title claims abstract description 148
- 238000005259 measurement Methods 0.000 title description 5
- 238000010894 electron beam technology Methods 0.000 claims abstract description 214
- 238000000619 electron energy-loss spectrum Methods 0.000 claims abstract description 77
- 238000000034 method Methods 0.000 claims description 22
- 230000005540 biological transmission Effects 0.000 claims description 10
- 239000002245 particle Substances 0.000 claims 3
- 238000012937 correction Methods 0.000 abstract description 44
- 239000000463 material Substances 0.000 description 25
- 239000006185 dispersion Substances 0.000 description 17
- IJGRMHOSHXDMSA-UHFFFAOYSA-N Atomic nitrogen Chemical compound N#N IJGRMHOSHXDMSA-UHFFFAOYSA-N 0.000 description 16
- 238000012545 processing Methods 0.000 description 10
- 229910052757 nitrogen Inorganic materials 0.000 description 8
- 230000000694 effects Effects 0.000 description 6
- 230000005672 electromagnetic field Effects 0.000 description 5
- QVGXLLKOCUKJST-UHFFFAOYSA-N atomic oxygen Chemical compound [O] QVGXLLKOCUKJST-UHFFFAOYSA-N 0.000 description 4
- 238000003705 background correction Methods 0.000 description 4
- 230000005284 excitation Effects 0.000 description 4
- 239000001301 oxygen Substances 0.000 description 4
- 229910052760 oxygen Inorganic materials 0.000 description 4
- 230000003287 optical effect Effects 0.000 description 3
- 238000004458 analytical method Methods 0.000 description 2
- 239000010408 film Substances 0.000 description 2
- 238000010030 laminating Methods 0.000 description 2
- 239000004065 semiconductor Substances 0.000 description 2
- 239000000126 substance Substances 0.000 description 2
- XEEYBQQBJWHFJM-UHFFFAOYSA-N Iron Chemical compound [Fe] XEEYBQQBJWHFJM-UHFFFAOYSA-N 0.000 description 1
- 230000004075 alteration Effects 0.000 description 1
- 238000003491 array Methods 0.000 description 1
- 230000015556 catabolic process Effects 0.000 description 1
- 239000013078 crystal Substances 0.000 description 1
- 238000006731 degradation reaction Methods 0.000 description 1
- 230000000593 degrading effect Effects 0.000 description 1
- 238000001514 detection method Methods 0.000 description 1
- 238000005430 electron energy loss spectroscopy Methods 0.000 description 1
- 239000000284 extract Substances 0.000 description 1
- 238000009434 installation Methods 0.000 description 1
- 230000003993 interaction Effects 0.000 description 1
- 239000002648 laminated material Substances 0.000 description 1
- 238000013208 measuring procedure Methods 0.000 description 1
- 238000001000 micrograph Methods 0.000 description 1
- 238000003825 pressing Methods 0.000 description 1
- 230000035945 sensitivity Effects 0.000 description 1
- 239000010409 thin film Substances 0.000 description 1
Images


Classifications
-
- G—PHYSICS
- G01—MEASURING; TESTING
- G01N—INVESTIGATING OR ANALYSING MATERIALS BY DETERMINING THEIR CHEMICAL OR PHYSICAL PROPERTIES
- G01N23/00—Investigating or analysing materials by the use of wave or particle radiation, e.g. X-rays or neutrons, not covered by groups G01N3/00 – G01N17/00, G01N21/00 or G01N22/00
- G01N23/22—Investigating or analysing materials by the use of wave or particle radiation, e.g. X-rays or neutrons, not covered by groups G01N3/00 – G01N17/00, G01N21/00 or G01N22/00 by measuring secondary emission from the material
- G01N23/225—Investigating or analysing materials by the use of wave or particle radiation, e.g. X-rays or neutrons, not covered by groups G01N3/00 – G01N17/00, G01N21/00 or G01N22/00 by measuring secondary emission from the material using electron or ion
- G01N23/2251—Investigating or analysing materials by the use of wave or particle radiation, e.g. X-rays or neutrons, not covered by groups G01N3/00 – G01N17/00, G01N21/00 or G01N22/00 by measuring secondary emission from the material using electron or ion using incident electron beams, e.g. scanning electron microscopy [SEM]
-
- H—ELECTRICITY
- H01—ELECTRIC ELEMENTS
- H01J—ELECTRIC DISCHARGE TUBES OR DISCHARGE LAMPS
- H01J37/00—Discharge tubes with provision for introducing objects or material to be exposed to the discharge, e.g. for the purpose of examination or processing thereof
- H01J37/02—Details
- H01J37/04—Arrangements of electrodes and associated parts for generating or controlling the discharge, e.g. electron-optical arrangement, ion-optical arrangement
- H01J37/05—Electron or ion-optical arrangements for separating electrons or ions according to their energy or mass
-
- H—ELECTRICITY
- H01—ELECTRIC ELEMENTS
- H01J—ELECTRIC DISCHARGE TUBES OR DISCHARGE LAMPS
- H01J37/00—Discharge tubes with provision for introducing objects or material to be exposed to the discharge, e.g. for the purpose of examination or processing thereof
- H01J37/02—Details
- H01J37/244—Detectors; Associated components or circuits therefor
-
- H—ELECTRICITY
- H01—ELECTRIC ELEMENTS
- H01J—ELECTRIC DISCHARGE TUBES OR DISCHARGE LAMPS
- H01J37/00—Discharge tubes with provision for introducing objects or material to be exposed to the discharge, e.g. for the purpose of examination or processing thereof
- H01J37/252—Tubes for spot-analysing by electron or ion beams; Microanalysers
-
- H—ELECTRICITY
- H01—ELECTRIC ELEMENTS
- H01J—ELECTRIC DISCHARGE TUBES OR DISCHARGE LAMPS
- H01J37/00—Discharge tubes with provision for introducing objects or material to be exposed to the discharge, e.g. for the purpose of examination or processing thereof
- H01J37/26—Electron or ion microscopes; Electron or ion diffraction tubes
- H01J37/28—Electron or ion microscopes; Electron or ion diffraction tubes with scanning beams
-
- H—ELECTRICITY
- H05—ELECTRIC TECHNIQUES NOT OTHERWISE PROVIDED FOR
- H05H—PLASMA TECHNIQUE; PRODUCTION OF ACCELERATED ELECTRICALLY-CHARGED PARTICLES OR OF NEUTRONS; PRODUCTION OR ACCELERATION OF NEUTRAL MOLECULAR OR ATOMIC BEAMS
- H05H1/00—Generating plasma; Handling plasma
- H05H1/0006—Investigating plasma, e.g. measuring the degree of ionisation or the electron temperature
- H05H1/0012—Investigating plasma, e.g. measuring the degree of ionisation or the electron temperature using electromagnetic or particle radiation, e.g. interferometry
- H05H1/0037—Investigating plasma, e.g. measuring the degree of ionisation or the electron temperature using electromagnetic or particle radiation, e.g. interferometry by spectrometry
-
- H—ELECTRICITY
- H01—ELECTRIC ELEMENTS
- H01J—ELECTRIC DISCHARGE TUBES OR DISCHARGE LAMPS
- H01J2237/00—Discharge tubes exposing object to beam, e.g. for analysis treatment, etching, imaging
- H01J2237/244—Detection characterized by the detecting means
- H01J2237/24485—Energy spectrometers
-
- H—ELECTRICITY
- H01—ELECTRIC ELEMENTS
- H01J—ELECTRIC DISCHARGE TUBES OR DISCHARGE LAMPS
- H01J2237/00—Discharge tubes exposing object to beam, e.g. for analysis treatment, etching, imaging
- H01J2237/244—Detection characterized by the detecting means
- H01J2237/24495—Signal processing, e.g. mixing of two or more signals
-
- H—ELECTRICITY
- H01—ELECTRIC ELEMENTS
- H01J—ELECTRIC DISCHARGE TUBES OR DISCHARGE LAMPS
- H01J2237/00—Discharge tubes exposing object to beam, e.g. for analysis treatment, etching, imaging
- H01J2237/248—Components associated with the control of the tube
- H01J2237/2485—Electric or electronic means
- H01J2237/2487—Electric or electronic means using digital signal processors
-
- H—ELECTRICITY
- H01—ELECTRIC ELEMENTS
- H01J—ELECTRIC DISCHARGE TUBES OR DISCHARGE LAMPS
- H01J2237/00—Discharge tubes exposing object to beam, e.g. for analysis treatment, etching, imaging
- H01J2237/26—Electron or ion microscopes
- H01J2237/262—Non-scanning techniques
-
- H—ELECTRICITY
- H01—ELECTRIC ELEMENTS
- H01J—ELECTRIC DISCHARGE TUBES OR DISCHARGE LAMPS
- H01J2237/00—Discharge tubes exposing object to beam, e.g. for analysis treatment, etching, imaging
- H01J2237/26—Electron or ion microscopes
- H01J2237/28—Scanning microscopes
- H01J2237/2802—Transmission microscopes
Definitions
- the present invention relates to an electron energy loss spectrum measuring apparatus, a transmission electron microscope or a scanning transmission electron microscope, and an electron energy loss spectrum measuring method.
- the elements As semiconductor devices and magnetic head elements become small and microscopic, the elements has a structure where thin films of several nm (nanometer) are laminated in an area of about submicron. Since the structure, the element distribution, the crystal structure, and the chemical bonding state of the micro area largely affect characteristics of the semiconductor elements and the magnetic head elements, it is important to analyze the micro area.
- Methods for observing the micro area include a scanning electron microscope (SEM), a transmission electron microscope (TEM), and a scanning transmission electron microscope (STEM).
- SEM scanning electron microscope
- TEM transmission electron microscope
- STEM scanning transmission electron microscope
- the TEM and the STEM have a spatial resolution at nanometer level.
- the TEM is an apparatus which irradiates an electron beam almost parallel to a specimen, and magnifies the transmitted electron beam with a lens or the like.
- the STEM converges an electron beam into a micro area, measures the transmitted electron beam while scanning the electron beam in two dimensions on a specimen, and obtains a 2D image.
- Electron energy loss spectroscopy uses an electron spectrometer to apply an energy analysis to electrons which have transmitted through the specimen, and is an analyzing method which can analyze elements in the specimen.
- a difference in chemical bonding state of identical elements especially reflects the electron structure of the element, and is appears as an energy shift at a level of a few eV.
- the TEM or the STEM combined with an electron energy loss spectrometer (EELS) of parallel detection type is widely used.
- the EELS has such a structure that a magnetic sector in a fan shape serves as an electron spectrometer, a quadrupole electromagnetic lens and a hexapole electromagnetic lens are provided front and behind of it, and a parallel type electron beam detector is provided most downstream.
- the quadrupole electromagnetic lens is used for adjusting a focus of an electron energy loss spectrum, and magnifying the electron energy loss spectrum.
- the hexapole electromagnetic lens is used to reduce an aberration of the electron energy loss spectrum projected on the electron beam detector.
- the electron energy loss spectrum magnified by the quadrupole electromagnetic lens is projected on the electron beam detector, and the electron energy loss spectrum spanning a wide range is measured.
- the electron beam detector comprises a scintillator receiving an electron beam and emitting fluorescence, and an element comprising multiple pixels for receiving the fluorescence. Alternately, it is a detector comprising multiple pixels for receiving an electron beam.
- the electron energy loss spectrum is measured based on the incident fluorescence or electron beam intensity.
- a user has to repeat an operation comprising (1) specifying a location to be measured, (2) specifying an element or an energy range to be measured, and (3) using an EELS to measure an electron energy loss spectrum at points to be measured for a conventional analyzing apparatus constituted by combining an STEM with an EELS.
- a location to be measured is specified before hand, and the location is stored in a controller for controlling electron beam scan, and conducts operations (2) and (3) described above.
- the degradation of the energy precision and accuracy of the electron energy loss spectrum causes the following problems when the electron energy loss spectrum at a specific location or multiple locations is measured on a specimen as described above.
- the purpose of the present invention is to provide an apparatus and a method for measuring electron energy loss spectrum at high precision and high accuracy with an apparatus combining a TEM or an STEM with an EELS.
- the present invention provides an EELS apparatus provided with an electron beam detector which comprises multiple pixels, and measures a spectrum of an electron beam which has transmitted through a specimen, and a controller which controls the position of the electron beam incident to the electron beam detector such that the electron beam detector measures a spectrum with a know dispersion, a position deviation pixel number between a pixel position for a peak appeared on the spectrum measured by the electron beam detector, and a reference pixel position designated as a reference position on the electron beam detector is measured, the position deviation pixel number is converted into a control factor for controlling the position of the electron beam such as a voltage value or a current value based on the spectrum dispersion, and the position deviation is corrected based on the control factor.
- the electron energy loss spectrum measuring method of the present invention features that after an operation for correcting the peak position deviation of the spectrum is conducted with the EELS apparatus provided with the peak position control apparatus for correcting a peak position in a spectrum, the electron energy loss spectrum is measured at high precision.
- the electron beam detector detects zero-loss peak where the spectrum intensity is at the maximum, and the controller corrects such that the peak position of the zero-loss peak matches a reference peak position of the electron beam detector, thereby correcting spectrum energy at high precision in a short period, resulting in measuring an electron energy loss spectrum at high precision and high accuracy.
- the controller can control such that the zero-loss peak appears on the electron beam detector, and then the controller can again control such that the zero-loss peak matches the reference pixel position of the electron beam detector.
- the energy correction takes a short period, and the measuring is conducted at high precision and at high accuracy when a wider range of electron energy loss spectrum is measured.
- An STEM or a TEM provided with the EELS according to the present invention has a controller comprising a memory for storing a result of spectrum measuring by the electron beam detector, a data base for storing a database for core loss energy or plasmon loss energy for elements to be analyzed, measuring conditions and the like, and a central controller for controlling the spectrum measuring and peak position control operation.
- the STEM provided with the EELS has a controller comprises a memory for storing a spectrum measured by the electron beam detector, an energy filter controller for controlling the peak position on the electron beam detector, and an STEM controller for controlling the electron beam position on a specimen.
- the EELS apparatus of the present invention includes at least two electron beam detectors comprising an electron beam detector for detecting a zero-loss to correct energy, and an electron beam detector for measuring an electron energy loss spectrum.
- the present invention allows automatically adjusting the focus of a spectrum.
- Fig. 1 is a structural schematic of a major part of a scanning transmission electron microscope (also referred as electron microscope in this document).
- a part from an electron beam source 1 to a Z contrast detector 21 is described as an electron microscope main unit, and a part from a magnetic field lens 16 for adjusting focus to an electron beam detector 13 is described as an EELS apparatus in Fig. 1.
- a cold cathode field emission type electron beam source can be applied to the electron beam source 1.
- An electron beam scan coil 3 deflects an electron beam 2 generated from the electron beam source 1.
- a magnetic field above objective lens 4 converges the deflected electron beam 2 on a face of a specimen 5, and the electron beam 2 scans on the specimen surface.
- the objective lens and a projection lens apply a lens effect to the electron beam which has transmitted through the specimen, and an object point 10 is formed.
- the electron beam from the object point 10 comes into a magnetic field sector 11 in a fan shape.
- the magnetic field of a magnet constituting the magnetic filed sector 11 forms a magnetic field space perpendicular to the paper of Fig. 1.
- the electron beam which comes into the magnetic field sector 11 is deflected by 90 degree, is made into a energy spectrum, and is focused on the energy dispersion surface 12.
- the energy dispersion surface 12 exists on an electron beam detector 13 in the present embodiment.
- the spectrum formed on the energy dispersion surface 12 is about 1 eV/ ⁇ m in the present embodiment when the rotation radius of an electron beam of an electron spectrometer 11 is 100 mm.
- a magnetic lens 15 for magnifying the spectrum magnifies it by 100 times.
- a magnetic field of an electromagnetic field lens 16 is adjusted to focus the spectrum on the electron beam detector 13.
- an electron energy loss spectrum 18 projected on the electron beam detector 13 becomes 0.01 eV/ ⁇ m.
- a multi-channel plate array with 25 ⁇ m/channel is used as the electron beam detector 13 provides 0.25 eV/channel.
- a controller 26 comprises a central controller 29, an energy filter controller 28, an operation unit 23, a database 24, a memory 27, and a STEM electron beam position controller 30, and the controller 26 is connected with an input apparatus 31 into which an operator enters measuring conditions and the like, and a display apparatus 25 for showing a spectrum, an electron microscope image, an element distribution image and the like.
- the following section describes an operation in the controller 26 while measuring a spectrum.
- the central controller 29 extracts corresponding element information from the database 24, and provides the energy filter controller 28 with measuring conditions specific to individual elements included in the element information.
- the energy filter controller 28 controls a magnetic field lens for adjusting focus 16, a magnetic lens 15 for magnifying the spectrum, a drift tube 19, and a magnetic field sector 11, and makes an electron beam in an energy range including energy specific to the element incident to the electron beam detector 13.
- Electron intensity signals corresponding to individual channels of the electron beam detector 13 represent an electron energy loss spectrum.
- the electron beam intensity signals from the electron beam detector 13 enter the operation unit 23, and background correction for the spectrum, gain correction for the electron beam detector and the like are conducted in the operation unit 23.
- the spectrum after the operation is stored in the memory 27, and is simultaneously shown on the display apparatus 25. The operator can obtain a spectrum with these series of operations.
- An exposure time (time for receiving an electron beam) of the electron beam detector 13 extends if a spectrum is obtained at high sensitivity. For example, about five seconds of the exposure time can obtain an electron energy loss spectrum caused by electrons which have lost energy to excite K shell electrons of nitrogen. If the energy of the spectrum shifts in the exposure time, it is required to correct the energy of the spectrum.
- the energy shift of a spectrum means that an electron trajectory in the electron microscope or the energy filter is disturbed, electrons with the equivalent energy come into different channels of the electron beam detector 13, and the energy value shifts while the shape of a measured spectrum is being maintained.
- the present embodiment measures a spectrum while correcting this type of an energy shift.
- the overview of the spectrum measuring steps includes steps of (1) an operator enters measuring conditions, (2) an electron energy loss spectrum is measured in a determined exposure time following the measuring conditions, and (3) a peak of zero-loss electron or an inner shell electron excitation peak of a known element is used to correct the energy.
- a zero-loss electron is an electron of electron beams which have transmitted through a specimen, and have the same energy as the incident electron beams.
- Measuring continues after returning to (2). Namely, the measuring continues consecutively in the sequence of (1), (2a), (3a), (2b), and (3b). The following section describes the individual steps.
- an operator enters an element to be observed and a timing for correcting energy, for example, a time interval for correcting or a spacing between observed points.
- the central controller 29, the data base 24, and the energy filter 28 operate to make an electron beam in an energy range including energy specific to the element come into the electron beam detector 13.
- the electron beam detector 13 receives the electron beam for a time calculated from the exposure time and the timing for correcting energy specified by the operator.
- the operation unit 23 receives the received electron beam intensity signal, and the operation unit conducts the background correction for the spectrum and the gain correction for the electron beam detector 13.
- the spectrum after the operation is stored in the memory 27, and is shown on the display apparatus 25.
- the energy filter controller 28 adjusts voltage of the electron beam source 1 or the drift tube 19 such that the peak of the zero-loss electrons appears near a reference pixel position (also referred as base pixel position. Described in detail later) specified by the operator on the electron beam detector 13, and the electron beam detector 13 measures the intensity of the electron beam.
- the condition for adjusting such that the peak of the zero-loss electrons appears near the reference pixel position is a condition that the peak of the zero-loss electron matches the reference pixel position when there is no interference.
- the operation unit 23 receives the measured electron beam intensity signal, measures a deviation between the reference pixel position and the peak position of the zero-loss electrons, and calculates conditions for controlling the electron beam source 1, the drift tube 19, the magnetic field sector 11, or what can control the electron beam position such that the deviation becomes zero.
- the calculated condition is sent to the central controller 29, and the central controller 29 provides the energy filter controller 28 with a control signal.
- the central controller 29 provides the energy filter controller 28 with a control signal.
- the following section describes an energy correction while using a peak which appears when inner shell electrons specific to an element are exited.
- the measuring procedure continues in a sequence of (1), (2a), (2b), (3b'), (2c), (3c'), and (2d).
- the following section specifically describes an operation in (3b').
- the operation unit 23 receives the electron beam intensity signal (designated as Ib) measured in (2b).
- the operation unit 23 receives the electron beam intensity signal (designated as Ia) from the memory 27, the spectrum of Ib is compared with the spectrum of Ia, and a position deviation of the peak position specific to the element is measured.
- the operation unit 23 calculates a condition for controlling the electron beam source 1, the drift tube 19, the magnetic field sector 11, or what can control the electron beam position such that the deviation becomes zero.
- the calculated condition is sent to the central controller 29, and the central controller 29 provides the energy filter controller 28 with a control signal.
- the central controller 29 provides the energy filter controller 28 with a control signal.
- the operator can obtain a spectrum applied with the energy correction with these series of operation.
- the electron beam detector 13 comprises multiple channels, an example of the number of the channels is 1024, and it may be less than or more than 1024.
- the zero-loss electrons are observed as a peak on the electron energy loss spectrum 18 formed on the energy dispersion surface 12.
- Fig. 1 (b) shows a positional relationship between the electron energy loss spectrum 18 formed on the energy dispersion surface 12, and the electron beam detector 13.
- the film thickness of a specimen for a transmission electron microscope is thin, and if the film thickness is 100 nm or less, for example, the peak intensity caused by the zero-loss electrons is at the maximum in the electron energy loss spectrum 18.
- the peak position of the zero-loss electrons is at the zero-point on horizontal axis, which becomes the reference point of energy when the electron energy loss spectrum 18 is drawn as in Fig. 1 (b) where the energy loss is the horizontal axis, and the electron beam intensity is the vertical axis.
- reference pixel position 40 (also referred as reference channel position) before hand in the present embodiment (See Fig. 1 (b)).
- reference pixel position 40 also referred as reference channel position
- the electron energy loss spectrum 18 is measured in a wider loss energy range when the reference pixel position 40 is set on a higher energy side of the electron energy loss spectrum 18 detected by the electron beam detector 13.
- the peak of the zero-loss electron is moved to the reference pixel position 40.
- the electron beam source 1, the drift tube 19, or the magnetic sector 11 is used for the control.
- an operator simply selects one button or one key on the input apparatus 21, and the controller 26 automatically moves the zero-loss peak in the present embodiment. This operation completes the automatic energy zero-point correction for the electron energy loss spectrum measurement. After completing the zero-point correction, when the electron energy loss spectrum 18 is measured, an electron beam detected in the same channel always has the same energy.
- the following section describes the energy reference position when the electron energy loss spectrum for an element which has a large energy loss is measured.
- the electron beam detector 13 comprises 1024 channels, and the dispersion of the electron energy loss spectrum 18, namely, the energy range detected by a single channel, is 0.25 eV/channel, for example, the energy range which can be detected by the electron beam detector 13 is 256 eV.
- An electron which transmitted through a specimen excites inner shell electrons of atoms constituting the specimen, and loses energy, and when an element whose energy loss is 256 eV or more (energy loss for exciting the K shell electron of nitrogen is 400 eV, and that for the K shell of oxygen is 532 eV, for example) is measured, the peak of the zero-loss electron moves outside of the electron beam detector 13. It moves to the left side of the electron beam detector 13 in Fig. 1 (b).
- an element to be measured is nitrogen, after the energy zero-point correction described before is applied, the voltage of the drift tube 19 increased by 400 eV is applied, the energy of electrons coming into the reference pixel position 40 becomes 400 eV.
- the electron energy loss spectrum measured after this operation presents 400 eV of the energy loss at the reference pixel position 40, and is an electron energy loss spectrum including a peak caused by exciting the K shell electron of nitrogen.
- the operator simply selects an element to be measured, and instructs the start of measuring, and the controller automatically conducts the other operations. The detail is described later.
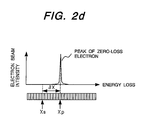
- Fig. 2 is used to show an example of processing for measuring the electron energy loss spectrum.
- an operator sets a specimen on a scanning transmission electron microscope (STEM), adjusts the optical axis of the STEM, (1) specifies a location to be analyzed on the specimen, (2) adjusts the focus, (3) corrects the energy zero-point of a spectrum, (4) specifies an element to be analyzed, or an energy range to be measured, and (5) measures a spectrum.
- STEM scanning transmission electron microscope
- an operator simply sets a specimen on a scanning transmission electronic microscope (STEM), adjusts the optical axis of the STEM, (1) specifies a location to be analyzed on the specimen, and (2) specifies an element to be analyzed, or an energy range to be measured, and the controller 26 follows the instruction of the operator, and controls the other operations comprising (3) adjusting the focus, (4) correcting the energy zero-point of a spectrum, (5) adjusting measuring conditions corresponding to the element to be measured, namely, adjusting the voltage for the drift tube 19 and the current for the magnetic lens 15 for magnifying the spectrum based on the EELS table, (6) correcting the energy of the spectrum, and (7) measuring a spectrum.
- STEM scanning transmission electronic microscope
- a button for selecting automatic focusing (2) a button for detecting the peak of the zero-loss electrons on a spectrum, and automatically correcting the energy zero-point of the spectrum, (3) buttons with icons showing element symbols for specifying an element to be analyzed, and (4) a button for selecting the energy shift correction for the spectrum should be selectable on a monitor screen of the input apparatus 31 for these operations, and icons for illustrating the individual operations on the monitor, for example, in the present embodiment.
- the display of the button for selecting automatic focusing and the button for automatically correcting the energy zero-point is a characteristic of the apparatus of the present embodiment. The following section describes each automatic processing under the control of the controller 26.
- Adjusting the optical axis of the STEM makes zero-loss electrons incident to the electron beam detector 13. If the focus of the spectrum is not adjusted, the half-width of the zero-loss electrons peak becomes wider, and takes a shape shown in Fig. 2 (b).
- the button for adjusting the automatic focusing shown on the monitor screen of the input apparatus 31 the automatic focus adjusting is completed automatically in the present embodiment.
- the following section describes a basic principle of the automatic focus adjusting.
- the electron beam detector 13 detects the zero-loss electrons while sequentially changing magnetic field intensity of the magnetic field lens for adjusting focus 16.
- a condition where the peak of the half width caused by the zero-loss electrons is minimum and/or a condition where the peak intensity of the zero-loss electrons is maximum is selected from the magnetic field intensity changed sequentially, and a corresponding magnetic field intensity is designated as an optimal condition for the focus of the spectrum.
- the controller 26 conducts the following processing to realize the principle described above as indicated in Fig. 2 (c).
- the central controller 29 sets a control range and a current step for the lens current for changing the magnetic field intensity of the magnetic field lens for adjusting focus 16, and the exposure time for measuring the spectrum with the electron beam detector 13, and provides the energy filter controller 28 with the individual measuring conditions.
- the energy filter controller 28 follows the entered conditions to set the lens current and the magnetic field of the magnetic field lens for adjusting focus 16, (4) the electron beam detector 13 measures the incident electron beam intensity for the set exposure time.
- the operation unit 23 receives the measured electron beam intensity, and stores it into the memory 27 after the background correction and the gain correction of the electron beam detector 13.
- the energy filter controller 28 receives new conditions for setting the magnetic field lens for adjusting focus 16.
- the spectrum measuring is conducted with a new lens current.
- the condition where the half-width of the zero-loss peak is minimum and/or the condition where the zero-loss peak intensity is maximum in the specified lens current range are selected from data stored in the memory 27, and the conditions are set through the energy filter controller 28 as the current value for the magnetic field lens for adjusting focus.
- the reference pixel position 40 is set on the higher energy side on the electron beam detector 13. This operation is conducted in a situation such as initial installation of the apparatus, and is not required each time when a specimen is set.
- an operator simply selects the button for automatically correcting the energy zero-point displayed on the monitor screen of the input apparatus 31 in the present embodiment.
- the controller 26 automatically processes the following operation, and completes the energy zero-point correction.
- the following section shows and describes the energy zero-point automatic correction in detail in Fig. 2 (e).
- the central controller 29 provides the energy filter controller 28 with conditions for measuring the zero-loss electrons, for example, voltage conditions for the drift tube 19, (3) the energy filter controller 28 sets the voltage provided for the drift tube 19.
- the operation unit 23 receives the electron beam intensity signal.
- the zero-loss electrons are not detected, the voltage for the drift tube 19 is changed, and the electron beam detector 13 measures again. The voltage for the drift tube 19 is adjusted until the zero-loss electrons are measured.
- the operation (1) through (4) is an operation to retrieve the zero-loss electron automatically.
- the peak of the zero-loss electrons matches the reference pixel position on the electron beam detector 13.
- the impressed drift tube voltage is directly read as energy loss (eV) of the electron energy loss spectrum when the following measuring conditions are adjusted.
- an operator specifies an element shown on the monitor screen of the input apparatus 31, (2) the central controller 29 obtains data corresponding to the element entered from the EELS table stored in the database 24.
- An example of the EELS table for nitrogen and oxygen is shown in FIG 2 (g).
- (a) Element number, (b) element name, (c) inner shell of electrons excited by the incident electrons, (d) bond energy of the inner shell electrons (unit is eV), and (e) optimal energy dispersion for measuring spectrum (unit is eV/ch) are stored in the table.
- the central controller 29 determines the voltage impressed on the drift tube 19 with the voltage (V0) of the drift tube after energy zero-point correction as a reference, namely, with the energy loss as 0 eV referring to the bond energy of the element to be measured.
- the bond energy is E1 (eV)
- E1 400 for nitrogen
- a voltage V0+E1 volt is a new voltage impressed on the drift tube 19.
- set current value for the magnetic field magnifying lens 15 is determined for controlling the energy dispersion optimal for measuring the spectrum.
- the central controller 29 provides the energy filter controller 28 with the voltage impressed on the drift tube 19, and the set current for the magnetic lens 15 for magnifying the spectrum.
- the operator selects the button for staring spectrum measuring shown on the monitor screen of the input apparatus 31.
- the electron beam detector 13 measures the spectrum for the set exposure time, the operation unit 23 applies the background correction and the gain correction for the electron beam detector 13, the memory 27 stores the spectrum, and the spectrum is shown on the display apparatus 25. For example, after the setting described above, the electron energy loss spectrum of nitrogen is measured, a peak caused by the excitation of the K shell electrons of nitrogen is observed at the reference pixel position on the electron beam detector 13.
- an operator simply presses the button for specifying an element to be measured, and then presses the button for starting measuring the spectrum to measure the spectrum.
- the energy correction for a spectrum is used when a spectrum is measured for a long period.
- trajectories of electrons in the electron microscope and the energy filter may change because of an effect of a disturbance of a external magnetic field and the like when the measuring requires a long period.
- electron beams detected in the same channel of the electron beam detector 13 have different energy, and the energy zero-point correction is required again.
- the energy zero-point correction is always available as long as the electron energy loss spectrum is being measured in the present embodiment.
- the energy zero-point correction is conducted in the same way as the energy zero-point correction for a spectrum described before.
- An operator can set a time interval for conducting the energy zero-point correction before hand as the timing for conducting the energy zero-point correction.
- the spectrum measuring continues with the energy filter control conditions after the energy zero-point correction as a new reference. It is possible to use the STEM controller 30 in the controller 26 to conduct the energy zero-point correction each time when the position of the electron beam on a specimen moves.
- the following method is available in addition to the energy zero-point correction described above. Note that this method is possible only when the electron beam remains to the same location on a specimen. As a spectrum is measured at the same location, the peak position appearing on the spectrum, namely, energy loss, is the same, and the pixel position of the electron beam detector 13 which detects the peak is the same as well. However, the spectrum on the electron beam detector 13 shifts in the direction of energy dispersion due to an interference such as an external magnetic field and the like, the pixel position of the electron beam detector 13 for detecting the peak appearing on the spectrum deviates. Comparing the pixel position for detecting the peak with the result of a spectrum measured immediately before allows measuring the shift of the spectrum in pixel as a deviation.
- the deviation is converted into a voltage or a current for controlling the drift tube 19 or the magnetic field sector 11 for example, and is corrected.
- a core loss peak which exciting inner shell electrons generates on the electron energy loss spectrum is observed as a small peak or an edge on a background with high electron beam intensity.
- As a mean for determining a pixel position for the small peak on the electron beam detector 13 at high precision (1) differentiating an obtained spectrum by energy loss, or (2) representing the vertical axis in logarithm are selectable in the present embodiment.
- An electron beam incident to a specimen is converged into about 1 nm or less in diameter in a scanning transmission microscope, and scans on a specimen in two dimensions.
- the electron beam scan coil 3 of the electron microscope is used to control the scan of the electron beam, and the controller 26 controls the electron beam scan coil 3.
- the electron beam energy loss spectrum is measured while sequentially moving to locations to be measured set by an operator before measuring in the present embodiment. It is possible to conduct the energy zero-point correction described before each time when the location to be measured is moved when an operator is set so before measuring. The operation above is described while showing it in Fig. 2 (h).
- Fig. 2 (h) shows the electron beam position control on a specimen by the STEM controller 30, and the timing for the spectrum measuring and the energy shift correction by the electron beam detector 30. Since signal level provided by the STEM controller is constant until the energy shift correction and the spectrum measuring are completed, the electron beam remains at the same position on the specimen.
- the central controller 29 provides the STEM controller 30 with an instruction for increasing the signal level by one step. The increase of the output signal level by one step from the STEM controller 30 corresponds to a travel of the electron beam on the specimen by a prescribed distance. The spectrum is measured while moving among locations to be measured under this control.
- Fig. 3 (a) shows an example of an electron energy loss spectrum caused by inner shell excitation of elements constituting a specimen measured by the apparatus of the present embodiment.
- a peak shown in Fig. 3 (a) appears on the electron energy loss spectrum because the electron beam excites the inner shell electrons of atoms when the electron beam transmits through the specimen, and the electron beam loses energy specific to the element. Since the dispersion of the spectrum is 0.25 eV/ ⁇ m, a spectrum whose measuring accuracy at the peak position is 0.25 eV can be measured as shown in Fig. 3 (a).
- Examples of information on the core loss peak 27 stored in the database 24 include 721 eV of bonding energy for L2 shell electron and 708 eV of bonding energy for L2 for iron (Fe). It may be 600 to 800 eV as an energy range including EL2: 721eV and EL3: 708 eV. The energy dispersion is 0.3 eV/ch.
- one multi-channel plate array is used as the electron beam detector 13 in the present embodiment, it is possible to use two multi-channel plate arrays, where one is used for measuring the electron energy loss spectrum, the remaining one is placed to measure a zero-loss, always detects a change in the zero-loss peak position on the multi-channel plate array, and uses the controller 26 to correct energy so as to return the peak position to the reference pixel position when the zero-loss peak position deviates from the reference pixel position 40. Correcting such that the zero-loss peak always matches the reference pixel position 40 in this way makes the peak appear at an accurate position without a spectrum shift shown in Fig. 3 (b), and makes the measurement highly accurate.
- Fig. 4 (a) shows a schematic of a specimen to be measured.
- the specimen has a structure of laminating a material A (constituting element: A), a material with an unknown constituting element (constituting element is assumed to be B), and material and material C (constituting element C), and a line analysis is applied to the individual materials in a sequence of the material A, the material B, and the material C as shown in Fig. 4 (a).
- An operator simply (1) specifies a start point and an end point of a line to be measured, and (2) participates in a specification process for an element to be analyzed, or an energy range to be measured, and the controller 26 consecutively conducts the operations of (3) energy correction processing for the spectrum, (4) spectrum measuring, and (5) controlling the electron beam position on the specimen until the electron beam reaches the end point specified by the operator.
- An existence of the energy shift is always detected while measuring a spectrum, and the deviation is detected if the energy of the spectrum shifts, the deviation of the spectrum is converted into a voltage or a current for controlling the drift tube 19, the magnetic field sector 11, or the electron beam source 1 for controlling the spectrum position on the electron beam detector 13 based on the dispersion of the spectrum, thereby correcting the deviation of the spectrum during measuring the spectrum.
- Measuring the spectrum in this way allows measuring the electron energy loss spectrum at high precision and at high accuracy.
- Fig. 4 (b) shows an example measured by the apparatus of the present embodiment. Peaks respectively appear at energy (a), (b), and (c) on an electron energy loss spectrum when the electron beam exists on the materials A, B, and C as shown in Fig. 4 (b), and the measuring accuracy of these peak positions is 0.25 eV. Due to the disturbance, it is impossible to measure accurately the electron energy loss spectrum as shown in Figs. 10c and 10d.
- the controller 26 (1) detects a position for the largest peak (zero-loss peak). If (1)' the largest peak (zero-loss peak) does not exist on the electron beam detector 13, the drift tube 19 or the magnetic field sector 11 are controlled such that the zero-loss peak appears on the electron beam detector 13, (2) a deviation between the reference pixel position of the electron beam detector 13 and the zero-loss peak position appearing as the result of the operation (1) or (1)', and (3) the drift tube 19 or the magnetic sector 11 are controlled so as to correct the deviation based on the spectrum dispersion. Controlling the controller 26 in this way allows an operator to automatically correct the zero-loss peak position with a single operation.
- a zero-loss peak is automatically detected, and is moved on the electron beam detector 13, and the energy is corrected when the zero-loss peak does not appear on the electron beam detector 13.
- the button for conducting the automatic zero-loss peak retrieval is provided as a keyboard or a dedicated button when an operator operates. Pressing this button makes the controller 26 conducts the processing described above.
- the detectable energy range with the electron beam detector is 256 eV. Because of the limitation on the energy range detected by one electron beam detector once, when a spectrum of electrons which lose energy of 256 eV or more is measured, it is required to correct energy and measure a spectrum alternately using the zero-loss peak with one electron beam detector. When the two electron beam detectors are used, however, one detects the zero-loss peak to correct the energy, and the remaining one measures the electron energy loss spectrum.
- One of two electron beam detectors corrects the energy using the zero-loss peak, and the remaining one detects electron beam intensity forming a electron energy loss spectrum at the individual pixels, conducts an operation using electron beam intensities in multiple energy ranges specified before hand, and shows the operation results as image, thereby allowing observing an element distribution image with an energy resolution at high precision.
- the operation described before includes an operation subtracting a background for a core loss peak part caused by inner shell excited electrons, and dividing electron beam intensity for the core loss peak part by electron beam intensity with energy loss lower than that.
- the present invention provides an apparatus and a method for obtaining a high precision electron energy loss spectrum with an electron microscope provided with an electron energy loss spectrum apparatus.
Applications Claiming Priority (4)
| Application Number | Priority Date | Filing Date | Title |
|---|---|---|---|
| JP2000359475A JP3726673B2 (ja) | 2000-11-21 | 2000-11-21 | エネルギースペクトル測定装置,電子エネルギー損失分光装置、及びそれを備えた電子顕微鏡、及び電子エネルギー損失スペクトル測定方法 |
| JP2000359475 | 2000-11-21 | ||
| JP2001346019 | 2001-11-12 | ||
| JP2001346019A JP2003151478A (ja) | 2001-11-12 | 2001-11-12 | 電子エネルギー損失分光装置、及びそれを備えた電子顕微鏡、及び電子エネルギー損失スペクトル測定方法 |
Publications (2)
| Publication Number | Publication Date |
|---|---|
| EP1209720A2 true EP1209720A2 (de) | 2002-05-29 |
| EP1209720A3 EP1209720A3 (de) | 2006-11-15 |
Family
ID=26604619
Family Applications (1)
| Application Number | Title | Priority Date | Filing Date |
|---|---|---|---|
| EP01127285A Ceased EP1209720A3 (de) | 2000-11-21 | 2001-11-16 | Energieverteilungsmessung |
Country Status (2)
| Country | Link |
|---|---|
| US (3) | US6703613B2 (de) |
| EP (1) | EP1209720A3 (de) |
Cited By (2)
| Publication number | Priority date | Publication date | Assignee | Title |
|---|---|---|---|---|
| EP1463089A2 (de) * | 2003-03-24 | 2004-09-29 | Hitachi High-Technologies Corporation | Elektronenmikroskop mit Energiefilter |
| CN101231252B (zh) * | 2007-09-03 | 2012-11-14 | 清华大学 | 消除电子显微镜电子能量损失谱的能量漂移的方法及装置 |
Families Citing this family (25)
| Publication number | Priority date | Publication date | Assignee | Title |
|---|---|---|---|---|
| EP1209720A3 (de) * | 2000-11-21 | 2006-11-15 | Hitachi High-Technologies Corporation | Energieverteilungsmessung |
| JP4199629B2 (ja) * | 2003-09-18 | 2008-12-17 | 株式会社日立ハイテクノロジーズ | 内部構造観察方法とその装置 |
| EP1790203B1 (de) * | 2004-07-21 | 2015-12-30 | Mevion Medical Systems, Inc. | Programmierbarer hochfrequenz-signalgenerator für ein synchrocyclotron |
| US7411188B2 (en) * | 2005-07-11 | 2008-08-12 | Revera Incorporated | Method and system for non-destructive distribution profiling of an element in a film |
| US7687978B2 (en) * | 2006-02-27 | 2010-03-30 | Itt Manufacturing Enterprises, Inc. | Tandem continuous channel electron multiplier |
| EP1883094B1 (de) * | 2006-07-24 | 2012-05-02 | ICT, Integrated Circuit Testing Gesellschaft für Halbleiterprüftechnik mbH | Teilchenstrahlapparat und Verfahren zur Untersuchung einer Probe |
| JP4997013B2 (ja) * | 2007-07-31 | 2012-08-08 | 株式会社日立ハイテクノロジーズ | 電子分光器を備えた電子顕微鏡 |
| JP5086818B2 (ja) * | 2008-01-16 | 2012-11-28 | 株式会社日立ハイテクノロジーズ | 電子顕微鏡装置 |
| JP4474473B2 (ja) * | 2008-03-31 | 2010-06-02 | 株式会社日立ハイテクノロジーズ | 電子分光器を備えた透過型電子顕微鏡 |
| JP5147567B2 (ja) * | 2008-06-27 | 2013-02-20 | 株式会社日立ハイテクノロジーズ | 電子分光器を有する透過型電子顕微鏡装置,試料ホルダ,試料台及びスペクトル像の取得方法 |
| JP5315033B2 (ja) | 2008-12-09 | 2013-10-16 | 株式会社日立ハイテクノロジーズ | 電子分光器を備えた透過型電子顕微鏡 |
| US8488902B2 (en) * | 2009-01-29 | 2013-07-16 | Koninklijke Philips Electronics N.V. | Detection values correction apparatus |
| JP5517584B2 (ja) | 2009-12-08 | 2014-06-11 | 株式会社日立ハイテクノロジーズ | 電子顕微鏡 |
| EP2388796A1 (de) * | 2010-05-21 | 2011-11-23 | FEI Company | Simultane Elektronendetektion |
| CN101950963B (zh) * | 2010-08-24 | 2011-09-21 | 西安交通大学 | 一种热电联产机组配合纯凝汽式火电机组避免开停机调峰的系统及方法 |
| CN103123325B (zh) * | 2011-11-18 | 2015-06-03 | 中国科学院物理研究所 | 能量、动量二维解析的高分辨电子能量损失谱仪 |
| EP2642279B1 (de) * | 2012-03-19 | 2015-07-01 | Universidad de Barcelona | Verfahren und System zur Verbesserung von kennzeichnenden Spitzensignalen bei der analytischen Elektronenmikroskopie |
| WO2015200649A2 (en) * | 2014-06-27 | 2015-12-30 | Gatan, Inc. | Electron energy loss spectrometer |
| JP6429677B2 (ja) * | 2015-02-27 | 2018-11-28 | 日本電子株式会社 | 測定方法および電子顕微鏡 |
| WO2016142481A1 (en) * | 2015-03-10 | 2016-09-15 | Vladimir Petrovich Ovsyannikov | Method and device for the production of highly charged ions |
| EP3070732A1 (de) * | 2015-03-18 | 2016-09-21 | Fei Company | Vorrichtung und verfahren zur spektroskopiedurchführung in einem transmissionmikroskop mit geladenen teilchen |
| CN108738343B (zh) * | 2015-11-30 | 2022-02-01 | Asml荷兰有限公司 | 多个带电粒子束的设备 |
| EP3577678B1 (de) * | 2017-02-03 | 2023-01-18 | Gatan Inc. | Vorrichtung zur korrektur von harmonischen leitungsgeräuschen für elektronenenergieverlust-spektrometer |
| CN110579494B (zh) * | 2019-09-19 | 2021-12-17 | 长江存储科技有限责任公司 | 一种金属硅化物的表征方法 |
| EP4002420A1 (de) * | 2020-11-12 | 2022-05-25 | FEI Company | Verfahren zur bestimmung der energiebreite eines geladenen teilchenstrahls |
Citations (6)
| Publication number | Priority date | Publication date | Assignee | Title |
|---|---|---|---|---|
| US4743756A (en) | 1987-08-10 | 1988-05-10 | Gatan Inc. | Parallel-detection electron energy-loss spectrometer |
| JPH0721967A (ja) | 1993-07-05 | 1995-01-24 | Hitachi Ltd | 電子エネルギー損失同時検知器 |
| JPH0721966A (ja) | 1993-07-05 | 1995-01-24 | Hitachi Ltd | 分析電子顕微鏡 |
| JPH0729544A (ja) | 1993-07-12 | 1995-01-31 | Hitachi Ltd | 電子エネルギ損失同時計測装置 |
| US5798524A (en) | 1996-08-07 | 1998-08-25 | Gatan, Inc. | Automated adjustment of an energy filtering transmission electron microscope |
| JP2000113854A (ja) | 1998-10-05 | 2000-04-21 | Nec Corp | 電子エネルギー損失分光分析装置およびそのスペクトルシフト補正方法 |
Family Cites Families (8)
| Publication number | Priority date | Publication date | Assignee | Title |
|---|---|---|---|---|
| JP2563134B2 (ja) * | 1989-01-25 | 1996-12-11 | 日本電子株式会社 | 走査透過型位相差電子顕微鏡 |
| US5450463A (en) * | 1992-12-25 | 1995-09-12 | Olympus Optical Co., Ltd. | X-ray microscope |
| US6184524B1 (en) * | 1996-08-07 | 2001-02-06 | Gatan, Inc. | Automated set up of an energy filtering transmission electron microscope |
| JPH10213538A (ja) | 1997-01-29 | 1998-08-11 | Hitachi Ltd | エネルギ損失分光法システム |
| JPH1167138A (ja) | 1997-08-25 | 1999-03-09 | Hitachi Ltd | 微小領域観察装置 |
| WO2000041206A1 (fr) | 1999-01-04 | 2000-07-13 | Hitachi, Ltd. | Dispositif de mappage d'elements, microscope electronique a transmission et a balayage, et procede associe |
| JP2000348670A (ja) | 1999-06-08 | 2000-12-15 | Ricoh Co Ltd | 電子線分光装置および電子顕微鏡 |
| EP1209720A3 (de) * | 2000-11-21 | 2006-11-15 | Hitachi High-Technologies Corporation | Energieverteilungsmessung |
-
2001
- 2001-11-16 EP EP01127285A patent/EP1209720A3/de not_active Ceased
- 2001-11-19 US US09/988,339 patent/US6703613B2/en not_active Expired - Lifetime
-
2004
- 2004-02-17 US US10/778,327 patent/US7067805B2/en not_active Expired - Lifetime
-
2006
- 2006-03-10 US US11/372,057 patent/US7250601B2/en not_active Expired - Lifetime
Patent Citations (6)
| Publication number | Priority date | Publication date | Assignee | Title |
|---|---|---|---|---|
| US4743756A (en) | 1987-08-10 | 1988-05-10 | Gatan Inc. | Parallel-detection electron energy-loss spectrometer |
| JPH0721967A (ja) | 1993-07-05 | 1995-01-24 | Hitachi Ltd | 電子エネルギー損失同時検知器 |
| JPH0721966A (ja) | 1993-07-05 | 1995-01-24 | Hitachi Ltd | 分析電子顕微鏡 |
| JPH0729544A (ja) | 1993-07-12 | 1995-01-31 | Hitachi Ltd | 電子エネルギ損失同時計測装置 |
| US5798524A (en) | 1996-08-07 | 1998-08-25 | Gatan, Inc. | Automated adjustment of an energy filtering transmission electron microscope |
| JP2000113854A (ja) | 1998-10-05 | 2000-04-21 | Nec Corp | 電子エネルギー損失分光分析装置およびそのスペクトルシフト補正方法 |
Non-Patent Citations (2)
| Title |
|---|
| A. BLELOCH ET AL.: "Institute of Physics Conference Series", 1999, IOP PUBLISHING, article "Cancelling energy drift in a PEELS spectrometer", pages: 195 - 198 |
| MCMULLAN D: "BEAM STABILISER FOR AN ELECTRON SPECTROMETER", INSTITUTE OF PHYSICS CONFERENCE SERIES, IOP PUBLISHING, GB, vol. 138, no. 11, 17 September 1993 (1993-09-17), pages 511 - 514, XP009072698, ISSN: 0951-3248 * |
Cited By (3)
| Publication number | Priority date | Publication date | Assignee | Title |
|---|---|---|---|---|
| EP1463089A2 (de) * | 2003-03-24 | 2004-09-29 | Hitachi High-Technologies Corporation | Elektronenmikroskop mit Energiefilter |
| EP1463089A3 (de) * | 2003-03-24 | 2009-07-29 | Hitachi High-Technologies Corporation | Elektronenmikroskop mit Energiefilter |
| CN101231252B (zh) * | 2007-09-03 | 2012-11-14 | 清华大学 | 消除电子显微镜电子能量损失谱的能量漂移的方法及装置 |
Also Published As
| Publication number | Publication date |
|---|---|
| US6703613B2 (en) | 2004-03-09 |
| US20020096632A1 (en) | 2002-07-25 |
| US20040183011A1 (en) | 2004-09-23 |
| US7250601B2 (en) | 2007-07-31 |
| US7067805B2 (en) | 2006-06-27 |
| US20060163479A1 (en) | 2006-07-27 |
| EP1209720A3 (de) | 2006-11-15 |
Similar Documents
| Publication | Publication Date | Title |
|---|---|---|
| US7250601B2 (en) | Energy spectrum measuring apparatus, electron energy loss spectrometer, electron microscope provided therewith, and electron energy loss spectrum measuring method | |
| US7928376B2 (en) | Element mapping unit, scanning transmission electron microscope, and element mapping method | |
| EP2511937B1 (de) | Elektronenmikroskop | |
| US20040251428A1 (en) | Charged-particle-beam mapping projection-optical systems and methods for adjusting same | |
| US6933501B2 (en) | Ultimate analyzer, scanning transmission electron microscope and ultimate analysis method | |
| JP3726673B2 (ja) | エネルギースペクトル測定装置,電子エネルギー損失分光装置、及びそれを備えた電子顕微鏡、及び電子エネルギー損失スペクトル測定方法 | |
| US9362082B2 (en) | Electron microscope and method of adjusting monochromator | |
| JP4006165B2 (ja) | 元素分析装置及び走査透過型電子顕微鏡並びに元素分析方法 | |
| US6930306B2 (en) | Electron microscope | |
| JP2006012583A (ja) | 走査透過電子顕微鏡及びそれを用いた電子線エネルギー分光方法 | |
| US6855927B2 (en) | Method and apparatus for observing element distribution | |
| JP4111908B2 (ja) | 走査電子顕微鏡 | |
| JP3780620B2 (ja) | 電子分光器及びそれを備えた透過型電子顕微鏡 | |
| US20030085350A1 (en) | Ultimate analyzer, scanning transmission electron microscope and ultimate analysis method | |
| JP4449573B2 (ja) | 元素マッピング装置,走査透過型電子顕微鏡および元素マッピング方法 | |
| JP2003151478A (ja) | 電子エネルギー損失分光装置、及びそれを備えた電子顕微鏡、及び電子エネルギー損失スペクトル測定方法 | |
| JP2001093459A (ja) | 走査透過型電子顕微鏡 | |
| JP2001266783A (ja) | 元素マッピング装置、走査透過型電子顕微鏡及び元素マッピング方法 | |
| JP2004171801A (ja) | 電子顕微鏡 | |
| JP3430788B2 (ja) | 試料像測定装置 | |
| JP2000131045A (ja) | 走査型荷電粒子ビーム装置 | |
| JPH08273568A (ja) | 電子ビーム装置における絞り位置調整方法および電子ビーム装置 | |
| JP2002352759A (ja) | 電界放射型電子銃を備えた電子ビーム装置 | |
| JP2005302335A (ja) | 電子線エネルギー分光装置及びそれを備えた電子顕微鏡 | |
| JPH11224639A (ja) | 電子顕微鏡 |
Legal Events
| Date | Code | Title | Description |
|---|---|---|---|
| PUAI | Public reference made under article 153(3) epc to a published international application that has entered the european phase |
Free format text: ORIGINAL CODE: 0009012 |
|
| AK | Designated contracting states |
Kind code of ref document: A2 Designated state(s): AT BE CH CY DE DK ES FI FR GB GR IE IT LI LU MC NL PT SE TR |
|
| AX | Request for extension of the european patent |
Free format text: AL;LT;LV;MK;RO;SI |
|
| 17P | Request for examination filed |
Effective date: 20060331 |
|
| PUAL | Search report despatched |
Free format text: ORIGINAL CODE: 0009013 |
|
| AK | Designated contracting states |
Kind code of ref document: A3 Designated state(s): AT BE CH CY DE DK ES FI FR GB GR IE IT LI LU MC NL PT SE TR |
|
| AX | Request for extension of the european patent |
Extension state: AL LT LV MK RO SI |
|
| 17Q | First examination report despatched |
Effective date: 20070613 |
|
| AKX | Designation fees paid |
Designated state(s): DE FR GB NL |
|
| STAA | Information on the status of an ep patent application or granted ep patent |
Free format text: STATUS: THE APPLICATION HAS BEEN REFUSED |
|
| 18R | Application refused |
Effective date: 20110701 |