BACKGROUND OF THE INVENTION
The present invention relates to an electron
energy loss spectrum measuring apparatus, a
transmission electron microscope or a scanning
transmission electron microscope, and an electron
energy loss spectrum measuring method.
As semiconductor devices and magnetic head
elements become small and microscopic, the elements
has a structure where thin films of several nm
(nanometer) are laminated in an area of about
submicron. Since the structure, the element
distribution, the crystal structure, and the chemical
bonding state of the micro area largely affect
characteristics of the semiconductor elements and the
magnetic head elements, it is important to analyze the
micro area.
Methods for observing the micro area include a
scanning electron microscope (SEM), a transmission
electron microscope (TEM), and a scanning transmission
electron microscope (STEM). The TEM and the STEM have
a spatial resolution at nanometer level. The TEM is an
apparatus which irradiates an electron beam almost
parallel to a specimen, and magnifies the transmitted
electron beam with a lens or the like. On the other
hand, the STEM converges an electron beam into a micro
area, measures the transmitted electron beam while
scanning the electron beam in two dimensions on a
specimen, and obtains a 2D image.
An energy loss specific to an element (electron
structure) is generated by an interaction with the
elements constituting a specimen when an electron beam
transmits through the specimen in the TEM and the STEM.
Electron energy loss spectroscopy (EELS) uses an
electron spectrometer to apply an energy analysis to
electrons which have transmitted through the specimen,
and is an analyzing method which can analyze elements
in the specimen. A difference in chemical bonding
state of identical elements especially reflects the
electron structure of the element, and is appears as
an energy shift at a level of a few eV. As a
conventional analyzing apparatus, the TEM or the STEM
combined with an electron energy loss spectrometer
(EELS) of parallel detection type is widely used.
An electron beam transmits through a specimen,
passes through an objective lens, a projection lens,
and an incident aperture, and enters into the EELS in
the STEM. The EELS has such a structure that a
magnetic sector in a fan shape serves as an electron
spectrometer, a quadrupole electromagnetic lens and a
hexapole electromagnetic lens are provided front and
behind of it, and a parallel type electron beam
detector is provided most downstream. The quadrupole
electromagnetic lens is used for adjusting a focus of
an electron energy loss spectrum, and magnifying the
electron energy loss spectrum. The hexapole
electromagnetic lens is used to reduce an aberration
of the electron energy loss spectrum projected on the
electron beam detector. The electron energy loss
spectrum magnified by the quadrupole electromagnetic
lens is projected on the electron beam detector, and
the electron energy loss spectrum spanning a wide
range is measured.
The electron beam detector comprises a
scintillator receiving an electron beam and emitting
fluorescence, and an element comprising multiple
pixels for receiving the fluorescence. Alternately, it
is a detector comprising multiple pixels for receiving
an electron beam. The electron energy loss spectrum is
measured based on the incident fluorescence or
electron beam intensity.
Prior art relating to the structure of the EELS
includes US patent No. 4,743,756, Japanese application
patent laid-open publication No. Hei 07-21966,
Japanese application patent laid-open publication No.
Hei 07-21967, and Japanese application patent laid-open
publication No. Hei 07-29544.
SUMMARY OF THE INVENTION:
A user has to repeat an operation comprising (1)
specifying a location to be measured, (2) specifying
an element or an energy range to be measured, and (3)
using an EELS to measure an electron energy loss
spectrum at points to be measured for a conventional
analyzing apparatus constituted by combining an STEM
with an EELS. Alternately, a location to be measured
is specified before hand, and the location is stored
in a controller for controlling electron beam scan,
and conducts operations (2) and (3) described above.
There used to be a problem that a pixel position
changes when a trajectory of the electron beam changes
because of an effect of an external electromagnetic
field, thereby degrading energy precision and accuracy
of the electron energy loss spectrum.
The degradation of the energy precision and
accuracy of the electron energy loss spectrum causes
the following problems when the electron energy loss
spectrum at a specific location or multiple locations
is measured on a specimen as described above.
Prior art for solving this problem includes US
patent No. 5,798,524 and Japanese application patent
laid-open publication No. 2000-113854. However, they
cannot solve the problem described in (B).
Thus, it is essential to measure an electron
energy loss spectrum after energy correction for
solving the problem describe above.
The purpose of the present invention is to provide
an apparatus and a method for measuring electron
energy loss spectrum at high precision and high
accuracy with an apparatus combining a TEM or an STEM
with an EELS.
The present invention provides an EELS apparatus
provided with an electron beam detector which
comprises multiple pixels, and measures a spectrum of
an electron beam which has transmitted through a
specimen, and a controller which controls the position
of the electron beam incident to the electron beam
detector such that the electron beam detector measures
a spectrum with a know dispersion, a position
deviation pixel number between a pixel position for a
peak appeared on the spectrum measured by the electron
beam detector, and a reference pixel position
designated as a reference position on the electron
beam detector is measured, the position deviation
pixel number is converted into a control factor for
controlling the position of the electron beam such as
a voltage value or a current value based on the
spectrum dispersion, and the position deviation is
corrected based on the control factor.
The electron energy loss spectrum measuring method
of the present invention features that after an
operation for correcting the peak position deviation
of the spectrum is conducted with the EELS apparatus
provided with the peak position control apparatus for
correcting a peak position in a spectrum, the electron
energy loss spectrum is measured at high precision.
In addition, the electron beam detector detects
zero-loss peak where the spectrum intensity is at the
maximum, and the controller corrects such that the
peak position of the zero-loss peak matches a
reference peak position of the electron beam detector,
thereby correcting spectrum energy at high precision
in a short period, resulting in measuring an electron
energy loss spectrum at high precision and high
accuracy. Even if the zero-loss peak does not exist on
the electron beam detector, the controller can control
such that the zero-loss peak appears on the electron
beam detector, and then the controller can again
control such that the zero-loss peak matches the
reference pixel position of the electron beam detector.
Thus, the energy correction takes a short period, and
the measuring is conducted at high precision and at
high accuracy when a wider range of electron energy
loss spectrum is measured.
An STEM or a TEM provided with the EELS according
to the present invention has a controller comprising a
memory for storing a result of spectrum measuring by
the electron beam detector, a data base for storing a
database for core loss energy or plasmon loss energy
for elements to be analyzed, measuring conditions and
the like, and a central controller for controlling the
spectrum measuring and peak position control operation.
In addition, the STEM provided with the EELS has a
controller comprises a memory for storing a spectrum
measured by the electron beam detector, an energy
filter controller for controlling the peak position on
the electron beam detector, and an STEM controller for
controlling the electron beam position on a specimen.
An operation is repeated such that a spectrum is
measured after the energy correction, then measuring
is switched to another location, and again, a spectrum
is measured after the energy correction in the
electron energy loss spectrum measuring method of the
present invention where locations for measuring are
changed sequentially on a specimen. With this method,
the electron energy loss spectrum is measured at high
precision and at high accuracy when multiple locations
are measured on a specimen.
The EELS apparatus of the present invention
includes at least two electron beam detectors
comprising an electron beam detector for detecting a
zero-loss to correct energy, and an electron beam
detector for measuring an electron energy loss
spectrum.
The present invention allows automatically
adjusting the focus of a spectrum.
BRIEF DESCRIPTION OF THE DRAWINGS
Fig. 1a is a structural schematic for a main part
of an embodiment of the present invention
Fig. 1b is a drawing showing a relationship
between an electron energy loss spectrum and an
electron beam detector for detecting it
Fig. 2a is a drawing for showing an example of a
processing for obtaining an electron energy loss
spectrum
Fig. 2b is a drawing for showing an example of a
state where the focus of an electron energy loss
spectrum is not adjusted and a state where the focus
is adjusted
Fig. 2c is a drawing for showing an example of a
processing for automatically adjusting the focus of an
electron energy loss spectrum
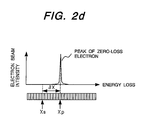
Fig. 2d is a drawing for showing an example of a
relationship between a peak position of zero-loss
electrons and a reference pixel position of an
electron beam detector
Fig. 2e is a drawing for showing an example of a
processing for automatically adjusting an energy shift
on an electron energy loss spectrum
Fig. 2f is a drawing for showing an example of a
processing for adjusting measuring conditions for
measuring an electron energy loss spectrum for an
element selected by an operator
Fig. 2g is a drawing for showing an example of
data stored in an EELS table
Fig. 2h is a drawing for showing an example of a
relationship between a signal level of an STEM
controller, and timings for spectrum measuring and an
energy shift correction in order to measure an
electron energy loss spectrum while moving an electron
beam position on a specimen
Fig. 3 is a drawing for showing an example of an
electron energy loss spectrum of core loss electrons
Fig.4 is a drawing for showing a schematic for
laminated materials, and an example of consecutively
measuring an electron energy loss spectrum between two
points on the materials.
DESCRIPTION OF THE PREFERRED EMBODIMENTS
The following section describes embodiments of the
present invention while referring to figures.
Fig. 1 is a structural schematic of a major part
of a scanning transmission electron microscope (also
referred as electron microscope in this document). A
part from an electron beam source 1 to a Z contrast
detector 21 is described as an electron microscope
main unit, and a part from a magnetic field lens 16
for adjusting focus to an electron beam detector 13 is
described as an EELS apparatus in Fig. 1.
A cold cathode field emission type electron beam
source can be applied to the electron beam source 1.
An electron beam scan coil 3 deflects an electron beam
2 generated from the electron beam source 1. A
magnetic field above objective lens 4 converges the
deflected electron beam 2 on a face of a specimen 5,
and the electron beam 2 scans on the specimen surface.
The objective lens and a projection lens apply a lens
effect to the electron beam which has transmitted
through the specimen, and an object point 10 is formed.
The electron beam from the object point 10 comes
into a magnetic field sector 11 in a fan shape. The
magnetic field of a magnet constituting the magnetic
filed sector 11 forms a magnetic field space
perpendicular to the paper of Fig. 1. The electron
beam which comes into the magnetic field sector 11 is
deflected by 90 degree, is made into a energy spectrum,
and is focused on the energy dispersion surface 12.
The energy dispersion surface 12 exists on an electron
beam detector 13 in the present embodiment.
The spectrum formed on the energy dispersion
surface 12 is about 1 eV/µm in the present embodiment
when the rotation radius of an electron beam of an
electron spectrometer 11 is 100 mm. A magnetic lens 15
for magnifying the spectrum magnifies it by 100 times.
A magnetic field of an electromagnetic field lens 16
is adjusted to focus the spectrum on the electron beam
detector 13. As the result, an electron energy loss
spectrum 18 projected on the electron beam detector 13
becomes 0.01 eV/µm. A multi-channel plate array with
25 µm/channel is used as the electron beam detector 13
provides 0.25 eV/channel.
A controller 26 comprises a central controller 29,
an energy filter controller 28, an operation unit 23,
a database 24, a memory 27, and a STEM electron beam
position controller 30, and the controller 26 is
connected with an input apparatus 31 into which an
operator enters measuring conditions and the like, and
a display apparatus 25 for showing a spectrum, an
electron microscope image, an element distribution
image and the like.
[Electron energy loss spectrum measuring]
The following section describes an operation in
the controller 26 while measuring a spectrum.
When an operator uses the input apparatus 31 to
enter an element to be observed, the central
controller 29 extracts corresponding element
information from the database 24, and provides the
energy filter controller 28 with measuring conditions
specific to individual elements included in the
element information. The energy filter controller 28
controls a magnetic field lens for adjusting focus 16,
a magnetic lens 15 for magnifying the spectrum, a
drift tube 19, and a magnetic field sector 11, and
makes an electron beam in an energy range including
energy specific to the element incident to the
electron beam detector 13. Electron intensity signals
corresponding to individual channels of the electron
beam detector 13 represent an electron energy loss
spectrum. The electron beam intensity signals from the
electron beam detector 13 enter the operation unit 23,
and background correction for the spectrum, gain
correction for the electron beam detector and the like
are conducted in the operation unit 23. The spectrum
after the operation is stored in the memory 27, and is
simultaneously shown on the display apparatus 25. The
operator can obtain a spectrum with these series of
operations.
[Energy correction for spectrum]
An exposure time (time for receiving an electron
beam) of the electron beam detector 13 extends if a
spectrum is obtained at high sensitivity. For example,
about five seconds of the exposure time can obtain an
electron energy loss spectrum caused by electrons
which have lost energy to excite K shell electrons of
nitrogen. If the energy of the spectrum shifts in the
exposure time, it is required to correct the energy of
the spectrum. The energy shift of a spectrum means
that an electron trajectory in the electron microscope
or the energy filter is disturbed, electrons with the
equivalent energy come into different channels of the
electron beam detector 13, and the energy value shifts
while the shape of a measured spectrum is being
maintained.
The present embodiment measures a spectrum while
correcting this type of an energy shift. The overview
of the spectrum measuring steps includes steps of (1)
an operator enters measuring conditions, (2) an
electron energy loss spectrum is measured in a
determined exposure time following the measuring
conditions, and (3) a peak of zero-loss electron or an
inner shell electron excitation peak of a known
element is used to correct the energy. A zero-loss
electron is an electron of electron beams which have
transmitted through a specimen, and have the same
energy as the incident electron beams. (4) Measuring
continues after returning to (2). Namely, the
measuring continues consecutively in the sequence of
(1), (2a), (3a), (2b), and (3b). The following section
describes the individual steps.
(1) First, an operator enters an element to be
observed and a timing for correcting energy, for
example, a time interval for correcting or a spacing
between observed points. (2a) As described in
"Electron energy loss spectrum measuring" before, the
central controller 29, the data base 24, and the
energy filter 28 operate to make an electron beam in
an energy range including energy specific to the
element come into the electron beam detector 13. The
electron beam detector 13 receives the electron beam
for a time calculated from the exposure time and the
timing for correcting energy specified by the operator.
The operation unit 23 receives the received electron
beam intensity signal, and the operation unit conducts
the background correction for the spectrum and the
gain correction for the electron beam detector 13. The
spectrum after the operation is stored in the memory
27, and is shown on the display apparatus 25. (3a) The
following section describes an energy correction while
using the peak of the zero-loss electron. The energy
filter controller 28 adjusts voltage of the electron
beam source 1 or the drift tube 19 such that the peak
of the zero-loss electrons appears near a reference
pixel position (also referred as base pixel position.
Described in detail later) specified by the operator
on the electron beam detector 13, and the electron
beam detector 13 measures the intensity of the
electron beam. The condition for adjusting such that
the peak of the zero-loss electrons appears near the
reference pixel position is a condition that the peak
of the zero-loss electron matches the reference pixel
position when there is no interference. The operation
unit 23 receives the measured electron beam intensity
signal, measures a deviation between the reference
pixel position and the peak position of the zero-loss
electrons, and calculates conditions for controlling
the electron beam source 1, the drift tube 19, the
magnetic field sector 11, or what can control the
electron beam position such that the deviation becomes
zero. The calculated condition is sent to the central
controller 29, and the central controller 29 provides
the energy filter controller 28 with a control signal.
As the result, trajectories of the electrons in the
electron microscope and the energy filter are
corrected, and the energy correction for the spectrum
is completed. Then, an operation (2b) equivalent to
the (2a) described above is conducted, and the
measuring continues.
(3') The following section describes an energy
correction while using a peak which appears when inner
shell electrons specific to an element are exited. In
this case, the measuring procedure continues in a
sequence of (1), (2a), (2b), (3b'), (2c), (3c'), and
(2d). The following section specifically describes an
operation in (3b'). The operation unit 23 receives the
electron beam intensity signal (designated as Ib)
measured in (2b). The operation unit 23 receives the
electron beam intensity signal (designated as Ia) from
the memory 27, the spectrum of Ib is compared with the
spectrum of Ia, and a position deviation of the peak
position specific to the element is measured. The
operation unit 23 calculates a condition for
controlling the electron beam source 1, the drift tube
19, the magnetic field sector 11, or what can control
the electron beam position such that the deviation
becomes zero. The calculated condition is sent to the
central controller 29, and the central controller 29
provides the energy filter controller 28 with a
control signal. As the result, trajectories of the
electrons in the electron microscope and the energy
filter are corrected, and the energy correction for
the spectrum is completed. Then, an operation (2c)
equivalent to the (2a) described above is conducted,
and the measuring continues.
The operator can obtain a spectrum applied with
the energy correction with these series of operation.
[Reference pixel position of energy on electron
beam detector 13]
The electron beam detector 13 comprises multiple
channels, an example of the number of the channels is
1024, and it may be less than or more than 1024. The
zero-loss electrons are observed as a peak on the
electron energy loss spectrum 18 formed on the energy
dispersion surface 12. Fig. 1 (b) shows a positional
relationship between the electron energy loss spectrum
18 formed on the energy dispersion surface 12, and the
electron beam detector 13. Usually, the film thickness
of a specimen for a transmission electron microscope
is thin, and if the film thickness is 100 nm or less,
for example, the peak intensity caused by the zero-loss
electrons is at the maximum in the electron
energy loss spectrum 18. Since the zero-loss electrons
have no energy loss, the peak position of the zero-loss
electrons is at the zero-point on horizontal axis,
which becomes the reference point of energy when the
electron energy loss spectrum 18 is drawn as in Fig. 1
(b) where the energy loss is the horizontal axis, and
the electron beam intensity is the vertical axis.
The operator determines the reference pixel
position of the energy on the electron beam detector
13, namely, reference pixel position 40 (also referred
as reference channel position) before hand in the
present embodiment (See Fig. 1 (b)). There is no
restriction on the reference pixel position as long as
it exists on the electron beam detector 13. However,
considering the electron energy loss spectrum 18 is
measured, the electron energy loss spectrum 18 is
measured in a wider loss energy range when the
reference pixel position 40 is set on a higher energy
side of the electron energy loss spectrum 18 detected
by the electron beam detector 13. The peak of the
zero-loss electron is moved to the reference pixel
position 40. As a mean of the movement, the electron
beam source 1, the drift tube 19, or the magnetic
sector 11 is used for the control. As described later
in detail, an operator simply selects one button or
one key on the input apparatus 21, and the controller
26 automatically moves the zero-loss peak in the
present embodiment. This operation completes the
automatic energy zero-point correction for the
electron energy loss spectrum measurement. After
completing the zero-point correction, when the
electron energy loss spectrum 18 is measured, an
electron beam detected in the same channel always has
the same energy.
The following section describes the energy
reference position when the electron energy loss
spectrum for an element which has a large energy loss
is measured. When the electron beam detector 13
comprises 1024 channels, and the dispersion of the
electron energy loss spectrum 18, namely, the energy
range detected by a single channel, is 0.25 eV/channel,
for example, the energy range which can be detected by
the electron beam detector 13 is 256 eV. An electron
which transmitted through a specimen excites inner
shell electrons of atoms constituting the specimen,
and loses energy, and when an element whose energy
loss is 256 eV or more (energy loss for exciting the K
shell electron of nitrogen is 400 eV, and that for the
K shell of oxygen is 532 eV, for example) is measured,
the peak of the zero-loss electron moves outside of
the electron beam detector 13. It moves to the left
side of the electron beam detector 13 in Fig. 1 (b).
When an element to be measured is nitrogen, after the
energy zero-point correction described before is
applied, the voltage of the drift tube 19 increased by
400 eV is applied, the energy of electrons coming into
the reference pixel position 40 becomes 400 eV. The
electron energy loss spectrum measured after this
operation presents 400 eV of the energy loss at the
reference pixel position 40, and is an electron energy
loss spectrum including a peak caused by exciting the
K shell electron of nitrogen. For these series of
operation, the operator simply selects an element to
be measured, and instructs the start of measuring, and
the controller automatically conducts the other
operations. The detail is described later.
The following section described an embodiment for
a method for measuring electron energy loss using the
present embodiment.
Fig. 2 is used to show an example of processing
for measuring the electron energy loss spectrum.
Conventionally, an operator sets a specimen on a
scanning transmission electron microscope (STEM),
adjusts the optical axis of the STEM, (1) specifies a
location to be analyzed on the specimen, (2) adjusts
the focus, (3) corrects the energy zero-point of a
spectrum, (4) specifies an element to be analyzed, or
an energy range to be measured, and (5) measures a
spectrum.
With the present embodiment of the present
invention, an operator simply sets a specimen on a
scanning transmission electronic microscope (STEM),
adjusts the optical axis of the STEM, (1) specifies a
location to be analyzed on the specimen, and (2)
specifies an element to be analyzed, or an energy
range to be measured, and the controller 26 follows
the instruction of the operator, and controls the
other operations comprising (3) adjusting the focus,
(4) correcting the energy zero-point of a spectrum,
(5) adjusting measuring conditions corresponding to
the element to be measured, namely, adjusting the
voltage for the drift tube 19 and the current for the
magnetic lens 15 for magnifying the spectrum based on
the EELS table, (6) correcting the energy of the
spectrum, and (7) measuring a spectrum.
(1) A button for selecting automatic focusing, (2)
a button for detecting the peak of the zero-loss
electrons on a spectrum, and automatically correcting
the energy zero-point of the spectrum, (3) buttons
with icons showing element symbols for specifying an
element to be analyzed, and (4) a button for selecting
the energy shift correction for the spectrum should be
selectable on a monitor screen of the input apparatus
31 for these operations, and icons for illustrating
the individual operations on the monitor, for example,
in the present embodiment. Especially, the display of
the button for selecting automatic focusing and the
button for automatically correcting the energy zero-point
is a characteristic of the apparatus of the
present embodiment. The following section describes
each automatic processing under the control of the
controller 26.
[Automatic focusing for spectrum]
Adjusting the optical axis of the STEM makes zero-loss
electrons incident to the electron beam detector
13. If the focus of the spectrum is not adjusted, the
half-width of the zero-loss electrons peak becomes
wider, and takes a shape shown in Fig. 2 (b). When an
operator selects the button for adjusting the
automatic focusing shown on the monitor screen of the
input apparatus 31, the automatic focus adjusting is
completed automatically in the present embodiment. The
following section describes a basic principle of the
automatic focus adjusting.
The electron beam detector 13 detects the zero-loss
electrons while sequentially changing magnetic
field intensity of the magnetic field lens for
adjusting focus 16. A condition where the peak of the
half width caused by the zero-loss electrons is
minimum and/or a condition where the peak intensity of
the zero-loss electrons is maximum is selected from
the magnetic field intensity changed sequentially, and
a corresponding magnetic field intensity is designated
as an optimal condition for the focus of the spectrum.
The controller 26 conducts the following
processing to realize the principle described above as
indicated in Fig. 2 (c). (1) When an operator selects
the automatic focus adjusting from the input apparatus
31, (2) the central controller 29 sets a control range
and a current step for the lens current for changing
the magnetic field intensity of the magnetic field
lens for adjusting focus 16, and the exposure time for
measuring the spectrum with the electron beam detector
13, and provides the energy filter controller 28 with
the individual measuring conditions. (3) The energy
filter controller 28 follows the entered conditions to
set the lens current and the magnetic field of the
magnetic field lens for adjusting focus 16, (4) the
electron beam detector 13 measures the incident
electron beam intensity for the set exposure time. (5)
The operation unit 23 receives the measured electron
beam intensity, and stores it into the memory 27 after
the background correction and the gain correction of
the electron beam detector 13. (6) When the memory 27
notifies the central controller 29 that the measuring
was completed, and (7) the energy filter controller 28
receives new conditions for setting the magnetic field
lens for adjusting focus 16. (8) In the following
procedure, the spectrum measuring is conducted with a
new lens current. (9) In this way, the condition where
the half-width of the zero-loss peak is minimum and/or
the condition where the zero-loss peak intensity is
maximum in the specified lens current range are
selected from data stored in the memory 27, and the
conditions are set through the energy filter
controller 28 as the current value for the magnetic
field lens for adjusting focus.
[Energy zero-point correction for spectrum]
The reference pixel position 40 is set on the
higher energy side on the electron beam detector 13.
This operation is conducted in a situation such as
initial installation of the apparatus, and is not
required each time when a specimen is set. When the
peak position of the zero-loss electrons is different
from the reference pixel position 40, an operator
simply selects the button for automatically correcting
the energy zero-point displayed on the monitor screen
of the input apparatus 31 in the present embodiment.
When the button for automatically correcting the
energy zero-point is selected, the controller 26
automatically processes the following operation, and
completes the energy zero-point correction. The
following section shows and describes the energy zero-point
automatic correction in detail in Fig. 2 (e).
First, (1) an operator selects the energy zero-point
correction from the input apparatus 31, (2) the
central controller 29 provides the energy filter
controller 28 with conditions for measuring the zero-loss
electrons, for example, voltage conditions for
the drift tube 19, (3) the energy filter controller 28
sets the voltage provided for the drift tube 19. (4)
When the electron beam detector 13 measures the peak
position of the zero-loss electrons, the operation
unit 23 receives the electron beam intensity signal.
When the zero-loss electrons are not detected, the
voltage for the drift tube 19 is changed, and the
electron beam detector 13 measures again. The voltage
for the drift tube 19 is adjusted until the zero-loss
electrons are measured. The operation (1) through (4)
is an operation to retrieve the zero-loss electron
automatically.
Then, (5) the operation unit 23 compares the peak
position of the zero-loss electrons (designated as Xp
channel, see Fig. 2 (d)) with the reference pixel
position on the electron beam detector 13 (designated
as Xs), and calculates the deviation between them
(δX=Xp-Xs), and the energy zero-point correction is
completed when δX=0. If δX is not zero, (6) the
operation unit 23 converts the deviation of the
spectrum into energy (δE=D × δX (eV)) based on the
energy dispersion D (unit: eV/channel) of the spectrum,
and provides the central controller 29 with δE, (7)
the central controller 29 converts the deviation of
the energy δE into a control factor for the energy
filter controller to control the trajectory of the
electrons in the electron microscope or the energy
filter. Specifically, the voltage of the drift tube 19
should be increased by δE. (8) When the energy filter
controller 28 receives the converted control factor,
the electron beam source 1 or the drift tube 19
operates under new conditions. With this automatic
energy zero-point correction, the peak of the zero-loss
electrons matches the reference pixel position on
the electron beam detector 13. Making the drift tube
voltage after the adjusting appears to be 0 eV, the
impressed drift tube voltage is directly read as
energy loss (eV) of the electron energy loss spectrum
when the following measuring conditions are adjusted.
[Adjusting measuring conditions corresponding to
element to be measured]
When the electron energy loss spectrum of an
element specified by an operator is measured, it is
required to adjust optimal measuring conditions for
individual elements to be measured, and the controller
26 is used for adjusting automatically as described in
Fig.2 (f).
First, (1) an operator specifies an element shown
on the monitor screen of the input apparatus 31, (2)
the central controller 29 obtains data corresponding
to the element entered from the EELS table stored in
the database 24. An example of the EELS table for
nitrogen and oxygen is shown in FIG 2 (g). (a) Element
number, (b) element name, (c) inner shell of electrons
excited by the incident electrons, (d) bond energy of
the inner shell electrons (unit is eV), and (e)
optimal energy dispersion for measuring spectrum (unit
is eV/ch) are stored in the table. (3) The central
controller 29 determines the voltage impressed on the
drift tube 19 with the voltage (V0) of the drift tube
after energy zero-point correction as a reference,
namely, with the energy loss as 0 eV referring to the
bond energy of the element to be measured. When the
bond energy is E1 (eV),for example E1=400 for nitrogen,
a voltage V0+E1 volt is a new voltage impressed on the
drift tube 19. Also set current value for the magnetic
field magnifying lens 15 is determined for controlling
the energy dispersion optimal for measuring the
spectrum. (4) The central controller 29 provides the
energy filter controller 28 with the voltage impressed
on the drift tube 19, and the set current for the
magnetic lens 15 for magnifying the spectrum.
Then, (5) after setting the measuring conditions
is completed, the operator selects the button for
staring spectrum measuring shown on the monitor screen
of the input apparatus 31. (6) The electron beam
detector 13 measures the spectrum for the set exposure
time, the operation unit 23 applies the background
correction and the gain correction for the electron
beam detector 13, the memory 27 stores the spectrum,
and the spectrum is shown on the display apparatus 25.
For example, after the setting described above, the
electron energy loss spectrum of nitrogen is measured,
a peak caused by the excitation of the K shell
electrons of nitrogen is observed at the reference
pixel position on the electron beam detector 13.
As described above, an operator simply presses the
button for specifying an element to be measured, and
then presses the button for starting measuring the
spectrum to measure the spectrum.
[Energy correction processing for spectrum and
measuring spectrum]
When a spectrum is measured, the energy of the
spectrum is corrected, and a location to be measured
is moved properly based on the operator's setting as
follows.
The energy correction for a spectrum is used when
a spectrum is measured for a long period. Before a
spectrum is measured, though the energy zero-point
correction of a spectrum described before is conducted,
trajectories of electrons in the electron microscope
and the energy filter may change because of an effect
of a disturbance of a external magnetic field and the
like when the measuring requires a long period. In
that case, electron beams detected in the same channel
of the electron beam detector 13 have different energy,
and the energy zero-point correction is required again.
The energy zero-point correction is always available
as long as the electron energy loss spectrum is being
measured in the present embodiment. The energy zero-point
correction is conducted in the same way as the
energy zero-point correction for a spectrum described
before. An operator can set a time interval for
conducting the energy zero-point correction before
hand as the timing for conducting the energy zero-point
correction. The spectrum measuring continues
with the energy filter control conditions after the
energy zero-point correction as a new reference. It is
possible to use the STEM controller 30 in the
controller 26 to conduct the energy zero-point
correction each time when the position of the electron
beam on a specimen moves.
For a position deviation of the spectrum, the
following method is available in addition to the
energy zero-point correction described above. Note
that this method is possible only when the electron
beam remains to the same location on a specimen. As a
spectrum is measured at the same location, the peak
position appearing on the spectrum, namely, energy
loss, is the same, and the pixel position of the
electron beam detector 13 which detects the peak is
the same as well. However, the spectrum on the
electron beam detector 13 shifts in the direction of
energy dispersion due to an interference such as an
external magnetic field and the like, the pixel
position of the electron beam detector 13 for
detecting the peak appearing on the spectrum deviates.
Comparing the pixel position for detecting the peak
with the result of a spectrum measured immediately
before allows measuring the shift of the spectrum in
pixel as a deviation. The deviation is converted into
a voltage or a current for controlling the drift tube
19 or the magnetic field sector 11 for example, and is
corrected. A core loss peak which exciting inner shell
electrons generates on the electron energy loss
spectrum is observed as a small peak or an edge on a
background with high electron beam intensity. As a
mean for determining a pixel position for the small
peak on the electron beam detector 13 at high
precision, (1) differentiating an obtained spectrum by
energy loss, or (2) representing the vertical axis in
logarithm are selectable in the present embodiment. By
measuring a spectrum in this way it is possible to
measure an electron energy loss spectrum at high
accuracy and at high precision.
[Moving location to be measured]
An electron beam incident to a specimen is
converged into about 1 nm or less in diameter in a
scanning transmission microscope, and scans on a
specimen in two dimensions. The electron beam scan
coil 3 of the electron microscope is used to control
the scan of the electron beam, and the controller 26
controls the electron beam scan coil 3. The electron
beam energy loss spectrum is measured while
sequentially moving to locations to be measured set by
an operator before measuring in the present embodiment.
It is possible to conduct the energy zero-point
correction described before each time when the
location to be measured is moved when an operator is
set so before measuring. The operation above is
described while showing it in Fig. 2 (h).
Fig. 2 (h) shows the electron beam position
control on a specimen by the STEM controller 30, and
the timing for the spectrum measuring and the energy
shift correction by the electron beam detector 30.
Since signal level provided by the STEM controller is
constant until the energy shift correction and the
spectrum measuring are completed, the electron beam
remains at the same position on the specimen. When the
energy shift correction and the spectrum measuring are
completed, the central controller 29 provides the STEM
controller 30 with an instruction for increasing the
signal level by one step. The increase of the output
signal level by one step from the STEM controller 30
corresponds to a travel of the electron beam on the
specimen by a prescribed distance. The spectrum is
measured while moving among locations to be measured
under this control.
Fig. 3 (a) shows an example of an electron energy
loss spectrum caused by inner shell excitation of
elements constituting a specimen measured by the
apparatus of the present embodiment. A peak shown in
Fig. 3 (a) appears on the electron energy loss
spectrum because the electron beam excites the inner
shell electrons of atoms when the electron beam
transmits through the specimen, and the electron beam
loses energy specific to the element. Since the
dispersion of the spectrum is 0.25 eV/µm, a spectrum
whose measuring accuracy at the peak position is 0.25
eV can be measured as shown in Fig. 3 (a).
Examples of information on the core loss peak 27
stored in the database 24 include 721 eV of bonding
energy for L2 shell electron and 708 eV of bonding
energy for L2 for iron (Fe). It may be 600 to 800 eV
as an energy range including EL2: 721eV and EL3: 708
eV. The energy dispersion is 0.3 eV/ch.
Though one multi-channel plate array is used as
the electron beam detector 13 in the present
embodiment, it is possible to use two multi-channel
plate arrays, where one is used for measuring the
electron energy loss spectrum, the remaining one is
placed to measure a zero-loss, always detects a change
in the zero-loss peak position on the multi-channel
plate array, and uses the controller 26 to correct
energy so as to return the peak position to the
reference pixel position when the zero-loss peak
position deviates from the reference pixel position 40.
Correcting such that the zero-loss peak always matches
the reference pixel position 40 in this way makes the
peak appear at an accurate position without a spectrum
shift shown in Fig. 3 (b), and makes the measurement
highly accurate.
The following section describes a second
embodiment of the present invention. Fig. 4 (a) shows
a schematic of a specimen to be measured. The specimen
has a structure of laminating a material A
(constituting element: A), a material with an unknown
constituting element (constituting element is assumed
to be B), and material and material C (constituting
element C), and a line analysis is applied to the
individual materials in a sequence of the material A,
the material B, and the material C as shown in Fig. 4
(a).
An operator simply (1) specifies a start point and
an end point of a line to be measured, and (2)
participates in a specification process for an element
to be analyzed, or an energy range to be measured, and
the controller 26 consecutively conducts the
operations of (3) energy correction processing for the
spectrum, (4) spectrum measuring, and (5) controlling
the electron beam position on the specimen until the
electron beam reaches the end point specified by the
operator. An existence of the energy shift is always
detected while measuring a spectrum, and the deviation
is detected if the energy of the spectrum shifts, the
deviation of the spectrum is converted into a voltage
or a current for controlling the drift tube 19, the
magnetic field sector 11, or the electron beam source
1 for controlling the spectrum position on the
electron beam detector 13 based on the dispersion of
the spectrum, thereby correcting the deviation of the
spectrum during measuring the spectrum. Measuring the
spectrum in this way allows measuring the electron
energy loss spectrum at high precision and at high
accuracy.
Fig. 4 (b) shows an example measured by the
apparatus of the present embodiment. Peaks
respectively appear at energy (a), (b), and (c) on an
electron energy loss spectrum when the electron beam
exists on the materials A, B, and C as shown in Fig. 4
(b), and the measuring accuracy of these peak
positions is 0.25 eV. Due to the disturbance, it is
impossible to measure accurately the electron energy
loss spectrum as shown in Figs. 10c and 10d.
The following section describes a third embodiment
of the present invention. The energy can be corrected
even when a zero-loss peak does not appear on the
electron beam detector 13 with the apparatus of the
present invention. (122) Automatic zero-loss electron
retrieval in Fig. 2 (e) shows the procedure of this
process.
An operator simply presses the button to conduct
the automatic zero-loss peak retrieval, for example,
and the controller 26 (1) detects a position for the
largest peak (zero-loss peak). If (1)' the largest
peak (zero-loss peak) does not exist on the electron
beam detector 13, the drift tube 19 or the magnetic
field sector 11 are controlled such that the zero-loss
peak appears on the electron beam detector 13, (2) a
deviation between the reference pixel position of the
electron beam detector 13 and the zero-loss peak
position appearing as the result of the operation (1)
or (1)', and (3) the drift tube 19 or the magnetic
sector 11 are controlled so as to correct the
deviation based on the spectrum dispersion.
Controlling the controller 26 in this way allows an
operator to automatically correct the zero-loss peak
position with a single operation. A zero-loss peak is
automatically detected, and is moved on the electron
beam detector 13, and the energy is corrected when the
zero-loss peak does not appear on the electron beam
detector 13. The button for conducting the automatic
zero-loss peak retrieval is provided as a keyboard or
a dedicated button when an operator operates. Pressing
this button makes the controller 26 conducts the
processing described above.
When the number of pixels of the electron beam
detector is 1024 channels, and the dispersion of the
electron energy loss spectrum is 0.25 eV per channel,
the detectable energy range with the electron beam
detector is 256 eV. Because of the limitation on the
energy range detected by one electron beam detector
once, when a spectrum of electrons which lose energy
of 256 eV or more is measured, it is required to
correct energy and measure a spectrum alternately
using the zero-loss peak with one electron beam
detector. When the two electron beam detectors are
used, however, one detects the zero-loss peak to
correct the energy, and the remaining one measures the
electron energy loss spectrum.
One of two electron beam detectors corrects the
energy using the zero-loss peak, and the remaining one
detects electron beam intensity forming a electron
energy loss spectrum at the individual pixels,
conducts an operation using electron beam intensities
in multiple energy ranges specified before hand, and
shows the operation results as image, thereby allowing
observing an element distribution image with an energy
resolution at high precision. The operation described
before includes an operation subtracting a background
for a core loss peak part caused by inner shell
excited electrons, and dividing electron beam
intensity for the core loss peak part by electron beam
intensity with energy loss lower than that.
The present invention provides an apparatus and a
method for obtaining a high precision electron energy
loss spectrum with an electron microscope provided
with an electron energy loss spectrum apparatus.