WO2016140017A1 - 自動分析装置 - Google Patents
自動分析装置 Download PDFInfo
- Publication number
- WO2016140017A1 WO2016140017A1 PCT/JP2016/053574 JP2016053574W WO2016140017A1 WO 2016140017 A1 WO2016140017 A1 WO 2016140017A1 JP 2016053574 W JP2016053574 W JP 2016053574W WO 2016140017 A1 WO2016140017 A1 WO 2016140017A1
- Authority
- WO
- WIPO (PCT)
- Prior art keywords
- information
- analysis
- event
- sample
- reagent
- Prior art date
Links
Images


Classifications
-
- G—PHYSICS
- G01—MEASURING; TESTING
- G01N—INVESTIGATING OR ANALYSING MATERIALS BY DETERMINING THEIR CHEMICAL OR PHYSICAL PROPERTIES
- G01N35/00—Automatic analysis not limited to methods or materials provided for in any single one of groups G01N1/00 - G01N33/00; Handling materials therefor
- G01N35/00584—Control arrangements for automatic analysers
-
- G—PHYSICS
- G01—MEASURING; TESTING
- G01D—MEASURING NOT SPECIALLY ADAPTED FOR A SPECIFIC VARIABLE; ARRANGEMENTS FOR MEASURING TWO OR MORE VARIABLES NOT COVERED IN A SINGLE OTHER SUBCLASS; TARIFF METERING APPARATUS; MEASURING OR TESTING NOT OTHERWISE PROVIDED FOR
- G01D9/00—Recording measured values
- G01D9/005—Solid-state data loggers
-
- G—PHYSICS
- G01—MEASURING; TESTING
- G01N—INVESTIGATING OR ANALYSING MATERIALS BY DETERMINING THEIR CHEMICAL OR PHYSICAL PROPERTIES
- G01N35/00—Automatic analysis not limited to methods or materials provided for in any single one of groups G01N1/00 - G01N33/00; Handling materials therefor
-
- G—PHYSICS
- G01—MEASURING; TESTING
- G01N—INVESTIGATING OR ANALYSING MATERIALS BY DETERMINING THEIR CHEMICAL OR PHYSICAL PROPERTIES
- G01N35/00—Automatic analysis not limited to methods or materials provided for in any single one of groups G01N1/00 - G01N33/00; Handling materials therefor
- G01N35/00584—Control arrangements for automatic analysers
- G01N35/00722—Communications; Identification
- G01N2035/00891—Displaying information to the operator
-
- G—PHYSICS
- G01—MEASURING; TESTING
- G01N—INVESTIGATING OR ANALYSING MATERIALS BY DETERMINING THEIR CHEMICAL OR PHYSICAL PROPERTIES
- G01N35/00—Automatic analysis not limited to methods or materials provided for in any single one of groups G01N1/00 - G01N33/00; Handling materials therefor
- G01N35/00584—Control arrangements for automatic analysers
- G01N35/00594—Quality control, including calibration or testing of components of the analyser
- G01N35/00613—Quality control
-
- G—PHYSICS
- G01—MEASURING; TESTING
- G01N—INVESTIGATING OR ANALYSING MATERIALS BY DETERMINING THEIR CHEMICAL OR PHYSICAL PROPERTIES
- G01N35/00—Automatic analysis not limited to methods or materials provided for in any single one of groups G01N1/00 - G01N33/00; Handling materials therefor
- G01N35/00584—Control arrangements for automatic analysers
- G01N35/00594—Quality control, including calibration or testing of components of the analyser
- G01N35/00693—Calibration
Definitions
- the present invention relates to an automatic analyzer that performs qualitative and quantitative analysis of biological samples such as serum and urine.
- specimens In automated analyzers that perform qualitative and quantitative analysis of biological samples such as serum and urine (hereinafter referred to as specimens), dedicated reagents are registered and used for each analysis item. Measure the physical properties (absorbance, scattered light intensity, etc.) of the reagent (standard solution reagent / calibrator) in advance using the previously registered reagent and express the relationship between each concentration and the measured value (absorbance, scattered light intensity, etc.) Calibration curve data is created, and the concentration of the sample is calculated based on the calibration curve data and analysis parameters such as preset analysis conditions.
- reagent standard solution reagent / calibrator
- Patent Document 1 Japanese Patent Laid-Open No. 2009-168729 uses an analysis system element as a technique for supporting investigation / analysis in the case where a defect such as data abnormality occurs in a sample measurement result in an automatic analyzer. And an analysis system for measuring the components of the sample, a storage unit for storing measurement results composed of measurement result elements measured by the analysis system, and an output unit for outputting the measurement results stored in the storage unit.
- a data processing unit is provided that performs data processing on the measurement result stored in the storage unit according to a combination of the analysis system elements arbitrarily selected, and the output unit is the data processing unit Discloses an automatic analyzer characterized in that it can output the result of data processing.
- the present invention has been made in view of the above, and investigates a defect by improving the searchability and visibility of various information related to a defect investigation in the event of a malfunction such as a data abnormality in a sample measurement result.
- -It aims at providing the automatic analyzer which can aim at shortening of the time which analysis requires, and improvement in reliability.
- the present invention provides an analysis unit that performs an analysis process for analyzing a sample to be analyzed, and registers, changes, and deletes analysis parameters such as analysis conditions in the analysis process as a result of the analysis process. For each sample analysis item, cumulative information regarding the occurrence of events and cumulative information regarding the occurrence of events such as registration / deletion / exchange of reagent information, which is reagent information used for the analysis of the sample, are stored.
- a storage unit for storing, a display unit for displaying information on the analysis result of the sample and the occurrence status of the event, and the like, and controlling the operation of the analysis process by the analysis unit of the sample, and information on the event of the analysis parameter, And a control unit that reads out the event information of the reagent information from the storage unit and displays the event information in time series on the display unit.
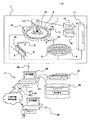
- FIG. 1 is a diagram schematically showing the overall configuration of the automatic analyzer according to the present embodiment.
- an automatic analyzer 100 includes at least one analysis unit 1 and an operation unit 2.
- the analysis unit 1 applies a reagent to a sample to be analyzed (for example, a biological sample such as blood or urine). Etc. and the physical properties (absorbance, high intensity of scattering, etc.) are measured, the rack 4 that houses the specimen container 3 containing the specimen to be analyzed and is transported by the rack transport belt 18, and the specimen to be analyzed
- a reagent disk 6 containing a plurality of reagent bottles 5 containing reagents to be added to the sample
- a reaction disk 8 containing a plurality of reaction containers 7 containing a reaction solution in which a reagent is added to a sample to be analyzed
- a sample container 3 A sample dispensing probe 9 for dispensing a contained sample into a predetermined reaction container 7, a reagent dispensing probe 10 for dispensing a reagent contained in a reagent bottle 5 into a predetermined reaction container 7, Reaction vessel 7 A stirr
- an A / D converter 15 that converts a detection signal from the multiwavelength photometer 13
- a cleaning device 14 that cleans the reaction vessel 7
- a computer 16 that controls the operation of each component of the analysis unit 1.
- Each component of the analysis unit 1 is connected to the computer 16 via the internal interface 17.
- the operation unit 2 is used to operate the analysis unit 1.
- the control unit 21 controls the operation of the entire automatic analysis apparatus including the operation unit 2, and input devices such as a keyboard 22 and a mouse 23 for inputting various commands and information. 24, a storage device 25 such as a hard disk for storing various data such as measurement request information and analysis parameters, a display device 26 for displaying an operation screen and the like, and a printing device 27, and via an external interface 28.
- the analyzer 1 is connected.
- the operation unit 2 is connected to the external information processing apparatus 30 via a network 29 such as a public line or a dedicated line, and can exchange parameters and data.
- the operator performs various analysis operations by inputting various commands such as measurement instructions using the input device 24 of the operation unit 2.
- the sample dispensing probe 9 dispenses a predetermined amount of the sample contained in the sample container 3 to each reaction container 7 according to the requested number of items.
- the rack transport belt 18 moves the rack 4 so that the next sample container 3 comes to the sample dispensing position (just below the sample dispensing probe 9).
- the reaction container 7 into which the sample has been dispensed is moved by the rotating operation of the reaction disk 8.
- reaction container 7 on the reaction disk 8 With respect to the reaction container 7 on the reaction disk 8, reagent dispensing in the reagent bottle 5 by the reagent dispensing probe 10, stirring of the reaction liquid by the stirring device 11, and measurement of absorbance by the light source 12 and the multiwavelength photometer 13 are performed.
- the reaction vessel 7 that has been measured in sequence and then measured is cleaned by the cleaning device 14.
- An absorbance signal (detection signal) detected by the multiwavelength photometer 13 is converted by the A / D converter 15 and input to the computer 16 via the internal interface 17. From the absorbance signal input to the computer 16, analysis is performed by a program based on an analysis method set in advance for each measurement item. For example, when measuring a standard solution sample (calibrator), calibration curve data is calculated from the set known concentration value.
- concentration data is calculated using calibration curve data obtained by measuring standard liquid samples. These data are added with information indicating the type of sample as a measurement result, transmitted to the operation unit 2 via the external interface 28, stored in the storage device 25, and printed by the printing device 27 as necessary. Is done. Further, the operation unit 2 and the external information processing apparatus 30 exchange data as necessary.
- Each analysis item name, event type (analysis parameters, reagent information, calibration results, quality control information, etc.), event contents (generation, registration, editing, inheritance, Change / exchange / deletion, etc.), event occurrence time, and detailed contents thereof are stored in association with each other.
- the analysis parameters include analysis conditions in the analysis process (amount of sample to be collected, type and amount of reagents used in the analysis process, optimum measurement conditions, etc.), etc., which are registered in advance before the start of the analysis process, and if necessary Changed and deleted.
- Reagent information is information related to the reagent used for the analysis of the sample, is registered in advance before the start of the analysis process, is deleted as necessary, and information related to reagent replacement is added. Reagents used in the analysis processing are managed in units of lots, and a plurality of reagents are registered and waited for each analysis item in the automatic analyzer 100.
- the calibration result is generated when the reagent used in the sample analysis process is calibrated, and is edited and deleted as necessary. In addition, when the capacity of the reagent used in the analysis process is exhausted, it is automatically replaced with a waiting reagent and the analysis of the analysis item is continued. At that time, it is used for the analysis with the replaced reagent.
- the calibration curve data the optimum calibration curve data created in the past using the reagent of the same lot is inherited.
- the calibration result is inherited by the inheritance function of the calibration result, so that it is not necessary to perform calibration again with the replaced reagent to create calibration curve data.
- Quality control information is generated when quality control processing is performed.
- a quality control sample with a known concentration is periodically measured, and the sample is analyzed by checking whether the measurement results obtained from the reagent and its calibration curve data are within the valid range of the known concentration.
- the accuracy of the reagent used for processing is controlled to ensure the reliability of the analysis results.
- the automatic analyzer 100 in order to grasp how the corresponding analysis item is measured in the case where some trouble such as data abnormality occurs in the analysis result of the sample, the analysis parameter, the reagent information The calibration result and the quality control information are displayed on the display unit. The operator investigates the cause of the failure based on the information displayed on the display unit and promptly solves the problem.
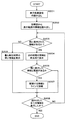
- FIG. 2 is a flowchart showing information display processing on the analysis item trace screen displayed on the display unit.
- the control device 21 reads the display range set on the display range setting screen (described later) (step S201), and based on the read display range, analysis parameters, reagent information, calibration results, and accuracy.
- Management information is read from the storage device 25 (step S202). It is determined whether or not there is a display already displayed (step S203). If the determination result is NO, the information with the earliest occurrence time is displayed among the read information (step S205), and the process proceeds to step S208. . If the determination result in step S203 is YES, the information is displayed in time series corresponding to the already displayed information (step S204). Subsequently, it is determined whether or not the information already displayed is related (step S206).
- step S207 If the determination result is YES, the information is connected to the related information with a line (step S207), and the process proceeds to step S208. If the determination result in step S206 is NO, the process proceeds to step S208. In step S208, it is determined whether all the read information has been displayed (step S208). If the determination result is NO, the process returns to step S203, and if the determination result is YES, the process ends.
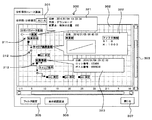
- FIG. 3 is a diagram showing an analysis item trace screen displayed on the display device by the control device.
- the analysis item trace screen 300 displays the occurrence status of events of various items (event types) related to the measurement result of the analysis item in time series, and the operator selects the analysis item to be investigated.
- Pull-down list 301 to be displayed information display unit 302 that displays the occurrence status of each event in time series, vertical scroll bar 303 and horizontal scroll bar 304 that move the display range of information display unit 302, and filter setting of information to be displayed
- a filter setting button 305 for displaying a screen for performing the analysis a display range setting button 306 for setting the display range of the analysis item trace screen 300, and a close button 307 for closing the analysis item trace screen 300.
- the occurrence order of various items is set in the vertical axis direction, and the time is set in the horizontal axis direction, and each event occurrence date and time is displayed in time series in a configuration represented by the horizontal axis.
- the information display unit 302 displays an analysis parameter event (registration / change / deletion) occurrence status 310 as basic information related to the analysis item selected in the pull-down list 301 so that each event can be identified in one line. It will be done. The transition of the entire information is confirmed by operating the horizontal scroll bar 304.
- an analysis parameter event registration / change / deletion
- reagent event (registration / exchange / deletion) occurrence statuses 311 and 113 are displayed, a plurality of reagents can be registered in the analysis parameter, so that they are displayed in separate lines for each reagent. .
- they are connected by a line 311a indicating the relation with the event of the related analysis parameter.
- Each event for one reagent is displayed so that it can be identified in one line, and the transition of the entire information is confirmed by operating the horizontal scroll bar. The process of how many reagents have been registered is confirmed by operating the vertical scroll bar.
- a calibration event (result registration / editing / inheritance / deletion) occurrence state 312 or 314 for the displayed reagent is displayed so that each event can be identified in one line.
- the overall transition of events for one calibration is confirmed by operating the horizontal scroll bar 304. At this time, they are connected by a line 312a indicating a relation with related reagent information.
- the calibration result is inherited by the function of inheriting the past calibration result, it is connected to the inherited calibration result by the line 314a so that it can be understood from which past calibration result. It is clearly indicated.
- event (measurement) occurrence statuses 315, 316, 317, and 318 of quality control (QC) information using one calibration result are displayed in one line.
- the lines 315a and 316a indicating the relation with the related calibration result are connected.
- the calibration analyzer and the QC information are incidental information derived from the reagent information. It will be positioned as. Therefore, it is displayed as a group of three lines composed of one reagent, calibration, and QC. This is displayed in a three-line configuration for another reagent, and the transition of the entire information is confirmed by operating the vertical scroll bar.
- FIG. 3 shows an example of displaying each event
- each event is displayed / hidden based on the setting of display conditions on a filter setting screen 700 (see FIG. 7 later). . Therefore, depending on the setting of the filter setting screen 700, the analysis parameter, the calibration result, and the reagent information as well as the case of displaying the analysis parameter, the calibration result, the reagent information, and the quality control information as shown in FIG. May be displayed, or analysis parameters, calibration results, and quality control information may be displayed.
- FIG. 4 is a diagram showing an example of displaying details of each event content when pointing to each event part on the analysis item trace screen.
- FIG. 5 is a diagram showing the linkage between the analysis item trace screen and the quality control screen.
- the accuracy management screen 500 displays details of the accuracy management information, and displays various information such as an analysis item setting unit 501, accuracy management information creation (measurement) date and time, measurement results, and the like.
- a display unit 502, a result display unit 503 that displays a cumulative measurement result of quality control, and a horizontal scroll bar 504 are provided.
- the screen transits to the accuracy management screen 500 and is cumulatively managed.
- the data plot 505 corresponding to the event occurrence state 318 of the selected quality control information is highlighted from the data plot group (data plot 506, etc.) of the measurement results displayed on the result display unit 503. Display the image with focus.
- the event occurrence state of the accuracy management information on the analysis item trace screen 300 and the measurement results of the accuracy management information on the accuracy management screen 500 are linked, and the operator can select from the data plot group in the accuracy management screen. Therefore, there is no need to manually search for the target data, and the target data can be easily searched.
- FIG. 6 is a diagram showing an example when information is displayed by filtering the analysis item trace screen
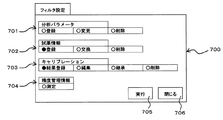
- FIG. 7 is a diagram showing an example of the filter setting screen.
- a filter setting screen 700 is a screen for setting filtering conditions for information displayed on the information display unit 302 of the analysis item trace screen 300, and an analysis parameter filtering condition setting unit 701 for setting filtering conditions related to analysis parameters.
- a reagent information filtering condition setting unit 702 that sets filtering conditions related to reagent information
- a calibration result filtering condition setting unit 703 that sets filtering conditions related to calibration results
- accuracy management information that sets filtering conditions related to accuracy management information
- a filtering condition setting unit 704, an execution button 705, and a close button 706 are provided.
- Each of the filtering condition setting sections 701, 702, 703, and 704 is provided with a filtering condition setting section regarding event contents (generation, registration, editing, inheritance, change, exchange, deletion, etc.).
- event contents generation, registration, editing, inheritance, change, exchange, deletion, etc.
- the display content of the information on the analysis item trace screen 300 is switched to the display of only the event selected on the filter setting screen 700.
- the display content of the information display unit 302 is a collection of selected events, and the display interval of each piece of information in the vertical direction (vertical direction) of the screen is reduced. A plurality of event contents can be selected. If all the events of each item are selected, only a specific item can be displayed.
- 6 and 7 exemplify a case where the analysis item trace screen 300 is displayed by selecting and executing the registration of reagent information and the result registration of the calibration result. That is, the operator can easily obtain necessary information by pressing the filter setting button 305 and setting the filtering condition on the filter setting screen 700 when he / she wants to focus only on a specific event or a specific item. .
- FIG. 8 is a diagram showing an example of a display range setting screen for setting the display period range of each item.
- the display range setting screen 800 is displayed by pressing a display range setting button 306 on the analysis item trace screen 300.
- the display range setting screen 800 is used by the operator to set the display period range of each item.
- the display range setting screen 800 sets an analysis parameter display range setting unit 801 for setting the display period range related to the analysis parameter, and the display period range related to the reagent information.
- Reagent information display range setting unit 802 to be set, calibration result display range setting unit 803 for setting the range of the display period related to the calibration result, and accuracy management information display range setting unit for setting the range of the display period related to the system management information 804, an execution button 805, and a close button 806 are provided.
- Each of the display range setting sections 801, 802, 803, and 804 is provided with a display period range setting section, and the display range is appropriately selected as one day, one week, one month, all, or none.
- the execution button 805 is pressed, the display period of the information of each item on the analysis item trace screen 300 is switched to display only the set display period range. At this time, since the display periods are aggregated and displayed, the interval between the items in the horizontal direction of the screen is reduced.
- the operator can confirm the event occurrence status of various items related to the analysis item to be investigated from various aspects. Become.
- an analysis unit that performs analysis processing for analyzing a sample to be analyzed, and an event such as the result of analysis processing, analysis parameter registration / change / deletion such as analysis conditions in analysis processing, etc.
- Storage unit that stores, for each analysis item of the sample, cumulative information related to the occurrence of events, and cumulative information related to the occurrence of events such as registration, deletion, and exchange of reagent information that is reagent information used for sample analysis
- a display unit that displays information on the analysis result of the sample and the occurrence status of the event, and a control unit, and controls the operation of the analysis process by the sample analysis unit, and information on the event of the analysis parameter, and Since the event information of the reagent information is read from the storage unit and displayed in time series on the display unit, there is some problem such as data abnormality of the sample measurement result Search ease and visibility of various information relating to defect investigation when none can be improved, whereby it is possible to shorten the time required for investigation and analysis of defects and improve the reliability.
Landscapes
- Physics & Mathematics (AREA)
- General Physics & Mathematics (AREA)
- Health & Medical Sciences (AREA)
- Life Sciences & Earth Sciences (AREA)
- Chemical & Material Sciences (AREA)
- Analytical Chemistry (AREA)
- Biochemistry (AREA)
- General Health & Medical Sciences (AREA)
- Immunology (AREA)
- Pathology (AREA)
- Automatic Analysis And Handling Materials Therefor (AREA)
- Investigating Or Analysing Biological Materials (AREA)
Abstract
Description
2 操作部
21 制御装置
25 記憶装置
26 表示装置
100 自動分析装置
300 分析項目トレース画面
302 情報表示部
305 フィルタ設定ボタン
306 表示範囲設定ボタン
500 精度管理画面
700 フィルタ設定画面
800 表示範囲設定画面
Claims (9)
- 分析対象の検体を分析する分析処理を行う分析部と、
前記分析処理の結果、前記分析処理における分析条件などの分析パラメータの登録・変更・削除などのイベントの発生に関する累積的な情報、及び、前記検体の分析に用いる試薬の情報である試薬情報の登録・削除・交換等のイベントの発生に関する累積的な情報を、前記検体の分析項目ごとに記憶する記憶部と、
前記検体の分析結果、及びイベントの発生状況に関する情報等を表示する表示部と、
前記検体の分析部による分析処理の動作を制御するとともに、前記分析パラメータのイベントの情報、及び前記試薬情報のイベントの情報を前記記憶部から読み出して前記表示部に時系列で表示する制御部と
を備えたことを特徴とする自動分析装置。 - 請求項1記載の自動分析装置において、
前記制御部は、前記表示部において前記イベントの発生時間に関する軸と前記イベントの発生順序に関する軸とが直交するように設定した平面上に、前記分析パラメータのイベントの情報、及び前記試薬情報のイベントの情報の情報を配置することを特徴とする自動分析装置。 - 請求項1記載の自動分析装置において、
前記記憶部は、前記検体の分析処理に用いる試薬のキャリブレーション結果の生成・編集・継承・削除等のイベントの発生に関する累積的な情報をさらに記憶し、
前記制御部は、前記キャリブレーション結果のイベントの情報を、前記分析パラメータのイベントの情報、及び前記試薬情報のイベントの情報と併せて前記表示部に時系列で表示することを特徴とする自動分析装置。 - 請求項3記載の自動分析装置において、
前記記憶部は、前記検体の分析処理に用いる試薬の精度管理情報の生成等のイベントの発生に関する累積的な情報をさらに記憶し、
前記制御部は、前記精度管理情報のイベントの情報を、前記前記分析パラメータのイベントの情報、前記試薬情報のイベントの情報、及び前記キャリブレーション結果のイベントの情報と併せて前記表示部に時系列で表示することを特徴とする自動分析装置。 - 請求項1記載の自動分析装置において、
前記記憶部は、前記検体の分析処理に用いる試薬の精度管理情報の生成等のイベントの発生に関する累積的な情報をさらに記憶し、
前記制御部は、前記精度管理情報のイベントの情報を、前記前記分析パラメータのイベントの情報、及び前記試薬情報のイベントの情報と併せて前記表示部に時系列で表示することを特徴とする自動分析装置。 - 請求項1記載の自動分析装置において、
前記表示部上での操作を行うためのカーソルによって、前記表示部に表示された前記分析パラメータの登録・変更、削除等、又は、前記検体の分析処理に用いる試薬のキャリブレーション結果の生成・編集・継承・削除等の各イベントを選択した場合、各イベントの内容の詳細情報が表示部上に表示されることを特徴とする自動分析装置。 - 請求項1記載の自動分析装置において、
前記表示部上での操作を行うためのカーソルによって、前記表示部に表示された前記分析パラメータの登録・変更、削除等、又は、キャリブレーション結果の生成・編集・継承・削除等の各イベントを選択した場合、各イベントの内容の詳細情報が表示部上にポップアップ表示されることを特徴とする自動分析装置。 - 請求項1記載の自動分析装置において、
前記制御部は、前記分析パラメータ、前記試薬情報、前記検体の分析処理に用いる試薬のキャリブレーション結果、前記検体の分析処理に用いる試薬の精度管理情報等の情報の種類、又は、登録・変更・削除・交換等のイベントで前記表示部に表示させる情報をフィルタリングできることを特徴とする自動分析装置。 - 請求項1記載の自動分析装置において、
前記表示部は、前記分析パラメータ、前記試薬情報、前記検体の分析処理に用いる試薬のキャリブレーション結果、及び前記検体の分析処理に用いる試薬の精度管理情報の前記イベントの表示期間範囲を設定する設定部を備えたことを特徴とする自動分析装置。
Priority Applications (4)
| Application Number | Priority Date | Filing Date | Title |
|---|---|---|---|
| EP16758712.0A EP3267202B1 (en) | 2015-03-02 | 2016-02-05 | Automatic analysis device |
| US15/553,179 US10895579B2 (en) | 2015-03-02 | 2016-02-05 | Automatic analyzer |
| JP2017503386A JP6694868B2 (ja) | 2015-03-02 | 2016-02-05 | 自動分析装置 |
| CN201680012622.3A CN107407686B (zh) | 2015-03-02 | 2016-02-05 | 自动分析装置 |
Applications Claiming Priority (2)
| Application Number | Priority Date | Filing Date | Title |
|---|---|---|---|
| JP2015040429 | 2015-03-02 | ||
| JP2015-040429 | 2015-03-02 |
Publications (1)
| Publication Number | Publication Date |
|---|---|
| WO2016140017A1 true WO2016140017A1 (ja) | 2016-09-09 |
Family
ID=56849334
Family Applications (1)
| Application Number | Title | Priority Date | Filing Date |
|---|---|---|---|
| PCT/JP2016/053574 WO2016140017A1 (ja) | 2015-03-02 | 2016-02-05 | 自動分析装置 |
Country Status (5)
| Country | Link |
|---|---|
| US (1) | US10895579B2 (ja) |
| EP (1) | EP3267202B1 (ja) |
| JP (1) | JP6694868B2 (ja) |
| CN (1) | CN107407686B (ja) |
| WO (1) | WO2016140017A1 (ja) |
Cited By (6)
| Publication number | Priority date | Publication date | Assignee | Title |
|---|---|---|---|---|
| WO2018056175A1 (ja) * | 2016-09-21 | 2018-03-29 | 株式会社日立ハイテクノロジーズ | 自動分析装置 |
| JP2019174424A (ja) * | 2018-03-29 | 2019-10-10 | シスメックス株式会社 | 検体分析装置のモニタリングデータの生成装置、検体分析装置、検体分析装置のモニタリングデータ生成システム、前記システムの構築方法、検体分析装置のモニタリングデータの生成方法及び検体分析装置のモニタリング方法 |
| WO2019198455A1 (ja) | 2018-04-13 | 2019-10-17 | 株式会社日立ハイテクノロジーズ | 自動分析装置 |
| JP2020112549A (ja) * | 2018-12-18 | 2020-07-27 | エフ ホフマン−ラ ロッシュ アクチェン ゲゼルシャフト | 体外診断システムのキャリブレーション管理 |
| JP2020139875A (ja) * | 2019-02-28 | 2020-09-03 | シスメックス株式会社 | 検体分析装置及び検体分析方法 |
| JP2021036249A (ja) * | 2020-12-01 | 2021-03-04 | シスメックス株式会社 | 検体分析装置及び検体分析方法 |
Families Citing this family (7)
| Publication number | Priority date | Publication date | Assignee | Title |
|---|---|---|---|---|
| JP6601854B1 (ja) * | 2018-06-21 | 2019-11-06 | 株式会社リガク | 蛍光x線分析システム |
| JP2020071570A (ja) * | 2018-10-30 | 2020-05-07 | ファナック株式会社 | データ作成装置、デバッグ装置、データ作成方法及びデータ作成プログラム |
| US20210349114A1 (en) * | 2019-03-27 | 2021-11-11 | Hitachi High-Tech Corporation | Automatic Analyzer |
| JP6954949B2 (ja) * | 2019-04-26 | 2021-10-27 | 日本電子株式会社 | 自動分析装置 |
| JP7326205B2 (ja) * | 2020-03-31 | 2023-08-15 | 株式会社日立ハイテク | 自動分析装置 |
| JP7488728B2 (ja) * | 2020-08-31 | 2024-05-22 | シスメックス株式会社 | 検量線設定方法、検量線設定プログラムおよび検体分析装置 |
| JP2022041059A (ja) * | 2020-08-31 | 2022-03-11 | シスメックス株式会社 | 検量線の表示方法および分析装置 |
Citations (2)
| Publication number | Priority date | Publication date | Assignee | Title |
|---|---|---|---|---|
| JP2009168729A (ja) * | 2008-01-18 | 2009-07-30 | Hitachi High-Technologies Corp | 自動分析装置 |
| WO2010073479A1 (ja) * | 2008-12-26 | 2010-07-01 | 株式会社 日立ハイテクノロジーズ | 精度管理方法 |
Family Cites Families (27)
| Publication number | Priority date | Publication date | Assignee | Title |
|---|---|---|---|---|
| US6098029A (en) * | 1994-06-14 | 2000-08-01 | Hitachi, Ltd. | Liquid-level position measuring method and system |
| JP4576307B2 (ja) * | 2005-09-12 | 2010-11-04 | 株式会社日立ハイテクノロジーズ | 自動分析装置 |
| DE102005048053A1 (de) * | 2005-10-07 | 2007-04-12 | Voith Patent Gmbh | Messvorrichtung, insbesondere zur Messung von Entwässerungsmengen von Papiermaschinen |
| US7853465B2 (en) * | 2005-12-02 | 2010-12-14 | Oracle International Corp. | Methods and apparatus to present event information with respect to a timeline |
| EP1892531B1 (en) * | 2006-08-22 | 2017-04-05 | Sysmex Corporation | Sample analyzer |
| JP4945236B2 (ja) * | 2006-12-27 | 2012-06-06 | 株式会社東芝 | 映像コンテンツ表示装置、映像コンテンツ表示方法及びそのプログラム |
| JP4969292B2 (ja) * | 2007-03-30 | 2012-07-04 | シスメックス株式会社 | 試料分析装置 |
| GB0718590D0 (en) * | 2007-09-24 | 2007-10-31 | Univ Edinburgh | Improved medical image processing |
| JP4894709B2 (ja) * | 2007-10-04 | 2012-03-14 | 株式会社Ihi | 製品設計支援システム及びコンピュータにおける製品設計支援のための動作方法 |
| US7634378B2 (en) * | 2007-11-30 | 2009-12-15 | Siemens Healthcare Diagnostics Inc. | Detection of insufficient sample during aspiration with a pipette |
| EP2116851B1 (en) * | 2008-02-13 | 2018-09-19 | Hitachi High-Technologies Corporation | Automatic analyzer |
| JP4659054B2 (ja) * | 2008-02-27 | 2011-03-30 | 株式会社日立ハイテクノロジーズ | 自動分析装置 |
| JP5196605B2 (ja) * | 2008-11-28 | 2013-05-15 | パナソニック株式会社 | 電力監視装置および電力監視方法ならびに部品実装用装置 |
| JP5350811B2 (ja) * | 2009-01-09 | 2013-11-27 | ベックマン コールター, インコーポレイテッド | 自動分析装置 |
| JP5286134B2 (ja) * | 2009-03-31 | 2013-09-11 | 株式会社日立ハイテクノロジーズ | 検体検査システムとその装置管理サーバの運用方法 |
| US8715574B2 (en) * | 2009-06-19 | 2014-05-06 | Abbott Laboratories | System for managing inventory of bulk liquids |
| JP5513040B2 (ja) * | 2009-08-28 | 2014-06-04 | シスメックス株式会社 | 自動分析装置 |
| EP2316795A1 (en) * | 2009-11-03 | 2011-05-04 | Koninklijke Philips Electronics N.V. | Device for subjecting a liquid to a purifying process |
| JP5147906B2 (ja) * | 2010-07-22 | 2013-02-20 | 株式会社日立ハイテクノロジーズ | 精度管理システム |
| JP5898410B2 (ja) | 2011-03-30 | 2016-04-06 | シスメックス株式会社 | 検体分析装置 |
| JP2012242122A (ja) * | 2011-05-16 | 2012-12-10 | Hitachi High-Technologies Corp | 自動分析装置及び自動分析プログラム |
| JP5855372B2 (ja) * | 2011-07-07 | 2016-02-09 | シスメックス株式会社 | 検体分析装置及びコンピュータプログラム |
| CN104024861B (zh) * | 2012-01-05 | 2015-11-25 | 株式会社日立高新技术 | 自动分析装置以及自动分析装置中的试剂处理方法 |
| JP6180721B2 (ja) * | 2012-10-25 | 2017-08-16 | 株式会社日立ハイテクノロジーズ | 自動分析装置 |
| US20160341752A1 (en) * | 2013-02-18 | 2016-11-24 | Theranos, Inc. | Methods, systems, and devices for real time execution and optimization of concurrent test protocols on a single device |
| US9928526B2 (en) * | 2013-12-26 | 2018-03-27 | Oracle America, Inc. | Methods and systems that predict future actions from instrumentation-generated events |
| EP2907575A1 (de) * | 2014-02-14 | 2015-08-19 | Eppendorf Ag | Laborgerät mit Benutzereingabefunktion und Verfahren zur Benutzereingabe bei einem Laborgerät |
-
2016
- 2016-02-05 CN CN201680012622.3A patent/CN107407686B/zh active Active
- 2016-02-05 EP EP16758712.0A patent/EP3267202B1/en active Active
- 2016-02-05 JP JP2017503386A patent/JP6694868B2/ja active Active
- 2016-02-05 US US15/553,179 patent/US10895579B2/en active Active
- 2016-02-05 WO PCT/JP2016/053574 patent/WO2016140017A1/ja active Application Filing
Patent Citations (2)
| Publication number | Priority date | Publication date | Assignee | Title |
|---|---|---|---|---|
| JP2009168729A (ja) * | 2008-01-18 | 2009-07-30 | Hitachi High-Technologies Corp | 自動分析装置 |
| WO2010073479A1 (ja) * | 2008-12-26 | 2010-07-01 | 株式会社 日立ハイテクノロジーズ | 精度管理方法 |
Non-Patent Citations (1)
| Title |
|---|
| See also references of EP3267202A4 * |
Cited By (16)
| Publication number | Priority date | Publication date | Assignee | Title |
|---|---|---|---|---|
| WO2018056175A1 (ja) * | 2016-09-21 | 2018-03-29 | 株式会社日立ハイテクノロジーズ | 自動分析装置 |
| CN109690322A (zh) * | 2016-09-21 | 2019-04-26 | 株式会社日立高新技术 | 自动分析装置 |
| JPWO2018056175A1 (ja) * | 2016-09-21 | 2019-08-08 | 株式会社日立ハイテクノロジーズ | 自動分析装置 |
| US11125765B2 (en) | 2016-09-21 | 2021-09-21 | Hitachi High-Tech Corporation | Automatic analyzer |
| CN109690322B (zh) * | 2016-09-21 | 2023-02-24 | 株式会社日立高新技术 | 自动分析装置 |
| JP2019174424A (ja) * | 2018-03-29 | 2019-10-10 | シスメックス株式会社 | 検体分析装置のモニタリングデータの生成装置、検体分析装置、検体分析装置のモニタリングデータ生成システム、前記システムの構築方法、検体分析装置のモニタリングデータの生成方法及び検体分析装置のモニタリング方法 |
| JP7064365B2 (ja) | 2018-03-29 | 2022-05-10 | シスメックス株式会社 | 検体分析装置のモニタリングデータの生成装置、検体分析装置、検体分析装置のモニタリングデータ生成システム、前記システムの構築方法、検体分析装置のモニタリングデータの生成方法及び検体分析装置のモニタリング方法 |
| JPWO2019198455A1 (ja) * | 2018-04-13 | 2021-05-13 | 株式会社日立ハイテク | 自動分析装置 |
| US20210025907A1 (en) * | 2018-04-13 | 2021-01-28 | Hitachi High-Tech Corporation | Automatic analyzer |
| WO2019198455A1 (ja) | 2018-04-13 | 2019-10-17 | 株式会社日立ハイテクノロジーズ | 自動分析装置 |
| US11971424B2 (en) | 2018-04-13 | 2024-04-30 | Hitachi High-Tech Corporation | Automatic analyzer |
| JP7219760B2 (ja) | 2018-04-13 | 2023-02-08 | 株式会社日立ハイテク | 自動分析装置 |
| JP2020112549A (ja) * | 2018-12-18 | 2020-07-27 | エフ ホフマン−ラ ロッシュ アクチェン ゲゼルシャフト | 体外診断システムのキャリブレーション管理 |
| JP2020139875A (ja) * | 2019-02-28 | 2020-09-03 | シスメックス株式会社 | 検体分析装置及び検体分析方法 |
| JP2021036249A (ja) * | 2020-12-01 | 2021-03-04 | シスメックス株式会社 | 検体分析装置及び検体分析方法 |
| JP7114680B2 (ja) | 2020-12-01 | 2022-08-08 | シスメックス株式会社 | 検体分析装置及び検体分析方法 |
Also Published As
| Publication number | Publication date |
|---|---|
| CN107407686B (zh) | 2021-03-23 |
| US10895579B2 (en) | 2021-01-19 |
| JP6694868B2 (ja) | 2020-05-20 |
| US20180113142A1 (en) | 2018-04-26 |
| EP3267202A4 (en) | 2018-10-17 |
| CN107407686A (zh) | 2017-11-28 |
| JPWO2016140017A1 (ja) | 2017-12-21 |
| EP3267202A1 (en) | 2018-01-10 |
| EP3267202B1 (en) | 2022-01-26 |
Similar Documents
| Publication | Publication Date | Title |
|---|---|---|
| WO2016140017A1 (ja) | 自動分析装置 | |
| JP6097856B2 (ja) | 自動分析装置 | |
| JP5425487B2 (ja) | 自動分析装置 | |
| US8758684B2 (en) | Automatic analyzer | |
| US20130011298A1 (en) | Sample analyzer and storage medium | |
| US9500662B2 (en) | Sample analyzer and sample analyzing method | |
| CN103733070B (zh) | 自动分析装置 | |
| JP7219760B2 (ja) | 自動分析装置 | |
| JP2011174844A (ja) | 臨床検査情報管理装置、臨床検査情報管理システム、及びコンピュータプログラム | |
| JP2011191204A (ja) | 臨床検査装置、臨床検査情報管理システム、及びコンピュータプログラム | |
| JP5923396B2 (ja) | 自動分析装置 | |
| JP2009281802A (ja) | 自動分析装置および検体検索システム | |
| JP6039940B2 (ja) | 自動分析装置 | |
| JP6788745B2 (ja) | 自動分析装置 | |
| JP5106906B2 (ja) | 自動分析装置 | |
| WO2018056175A1 (ja) | 自動分析装置 | |
| CN114174835A (zh) | 自动分析装置 | |
| JP2017125721A (ja) | 自動分析装置及び通知情報表示方法 | |
| JP2015184017A (ja) | 自動分析装置及び異常判定方法 | |
| JPH08101208A (ja) | 自動化学分析装置 | |
| JP5414286B2 (ja) | 自動分析装置 | |
| JP2021173639A (ja) | 自動分析装置 | |
| JP2022083293A (ja) | 自動分析装置 | |
| JP6147557B2 (ja) | 自動分析装置 |
Legal Events
| Date | Code | Title | Description |
|---|---|---|---|
| 121 | Ep: the epo has been informed by wipo that ep was designated in this application |
Ref document number: 16758712 Country of ref document: EP Kind code of ref document: A1 |
|
| DPE1 | Request for preliminary examination filed after expiration of 19th month from priority date (pct application filed from 20040101) | ||
| REEP | Request for entry into the european phase |
Ref document number: 2016758712 Country of ref document: EP |
|
| ENP | Entry into the national phase |
Ref document number: 2017503386 Country of ref document: JP Kind code of ref document: A |
|
| WWE | Wipo information: entry into national phase |
Ref document number: 15553179 Country of ref document: US |
|
| NENP | Non-entry into the national phase |
Ref country code: DE |