EP3411689B1 - Système et procédé de mesure d'absorption optique de sang total - Google Patents
Système et procédé de mesure d'absorption optique de sang total Download PDFInfo
- Publication number
- EP3411689B1 EP3411689B1 EP16889601.7A EP16889601A EP3411689B1 EP 3411689 B1 EP3411689 B1 EP 3411689B1 EP 16889601 A EP16889601 A EP 16889601A EP 3411689 B1 EP3411689 B1 EP 3411689B1
- Authority
- EP
- European Patent Office
- Prior art keywords
- light
- cuvette
- module
- optical path
- optical
- Prior art date
- Legal status (The legal status is an assumption and is not a legal conclusion. Google has not performed a legal analysis and makes no representation as to the accuracy of the status listed.)
- Active
Links
- 230000003287 optical effect Effects 0.000 title claims description 110
- 239000008280 blood Substances 0.000 title claims description 108
- 210000004369 blood Anatomy 0.000 title claims description 95
- 238000000034 method Methods 0.000 title claims description 60
- 238000011481 absorbance measurement Methods 0.000 title claims description 12
- 238000002835 absorbance Methods 0.000 claims description 60
- 108010054147 Hemoglobins Proteins 0.000 claims description 39
- 102000001554 Hemoglobins Human genes 0.000 claims description 39
- 239000013307 optical fiber Substances 0.000 claims description 38
- 238000013507 mapping Methods 0.000 claims description 27
- 230000003595 spectral effect Effects 0.000 claims description 26
- 238000008050 Total Bilirubin Reagent Methods 0.000 claims description 16
- 239000000758 substrate Substances 0.000 claims description 13
- 238000012545 processing Methods 0.000 claims description 12
- BPYKTIZUTYGOLE-IFADSCNNSA-N Bilirubin Chemical compound N1C(=O)C(C)=C(C=C)\C1=C\C1=C(C)C(CCC(O)=O)=C(CC2=C(C(C)=C(\C=C/3C(=C(C=C)C(=O)N\3)C)N2)CCC(O)=O)N1 BPYKTIZUTYGOLE-IFADSCNNSA-N 0.000 claims description 10
- 238000011144 upstream manufacturing Methods 0.000 claims description 2
- 230000001131 transforming effect Effects 0.000 claims 2
- 230000006870 function Effects 0.000 description 32
- 238000005259 measurement Methods 0.000 description 25
- 108010061951 Methemoglobin Proteins 0.000 description 21
- 108010003320 Carboxyhemoglobin Proteins 0.000 description 19
- 230000008859 change Effects 0.000 description 16
- 239000011159 matrix material Substances 0.000 description 15
- 230000000694 effects Effects 0.000 description 13
- 108010064719 Oxyhemoglobins Proteins 0.000 description 12
- 230000004044 response Effects 0.000 description 12
- 239000006185 dispersion Substances 0.000 description 11
- 238000009826 distribution Methods 0.000 description 10
- 239000000835 fiber Substances 0.000 description 9
- 239000012530 fluid Substances 0.000 description 9
- 230000008569 process Effects 0.000 description 9
- 238000001228 spectrum Methods 0.000 description 9
- 239000000243 solution Substances 0.000 description 8
- INGWEZCOABYORO-UHFFFAOYSA-N 2-(furan-2-yl)-7-methyl-1h-1,8-naphthyridin-4-one Chemical compound N=1C2=NC(C)=CC=C2C(O)=CC=1C1=CC=CO1 INGWEZCOABYORO-UHFFFAOYSA-N 0.000 description 7
- 238000010521 absorption reaction Methods 0.000 description 7
- 239000012491 analyte Substances 0.000 description 7
- 108010002255 deoxyhemoglobin Proteins 0.000 description 7
- 230000008901 benefit Effects 0.000 description 6
- 238000004422 calculation algorithm Methods 0.000 description 6
- 238000012937 correction Methods 0.000 description 6
- 238000010801 machine learning Methods 0.000 description 6
- 108010044495 Fetal Hemoglobin Proteins 0.000 description 5
- 238000004458 analytical method Methods 0.000 description 5
- 241000894007 species Species 0.000 description 5
- 238000012549 training Methods 0.000 description 5
- 230000008602 contraction Effects 0.000 description 4
- 230000010287 polarization Effects 0.000 description 4
- 229920001955 polyphenylene ether Polymers 0.000 description 4
- -1 HHb Proteins 0.000 description 3
- 238000004497 NIR spectroscopy Methods 0.000 description 3
- 238000004847 absorption spectroscopy Methods 0.000 description 3
- 238000000149 argon plasma sintering Methods 0.000 description 3
- 238000004364 calculation method Methods 0.000 description 3
- 239000011248 coating agent Substances 0.000 description 3
- 238000000576 coating method Methods 0.000 description 3
- 150000001875 compounds Chemical class 0.000 description 3
- 238000002790 cross-validation Methods 0.000 description 3
- 238000001514 detection method Methods 0.000 description 3
- 239000007789 gas Substances 0.000 description 3
- 239000011521 glass Substances 0.000 description 3
- 238000003384 imaging method Methods 0.000 description 3
- 238000009413 insulation Methods 0.000 description 3
- 230000010354 integration Effects 0.000 description 3
- 230000007246 mechanism Effects 0.000 description 3
- 238000012986 modification Methods 0.000 description 3
- 230000004048 modification Effects 0.000 description 3
- 238000011160 research Methods 0.000 description 3
- 239000000126 substance Substances 0.000 description 3
- 239000004721 Polyphenylene oxide Substances 0.000 description 2
- 230000004075 alteration Effects 0.000 description 2
- 238000003491 array Methods 0.000 description 2
- QVGXLLKOCUKJST-UHFFFAOYSA-N atomic oxygen Chemical compound [O] QVGXLLKOCUKJST-UHFFFAOYSA-N 0.000 description 2
- 230000008033 biological extinction Effects 0.000 description 2
- 210000000601 blood cell Anatomy 0.000 description 2
- 230000017531 blood circulation Effects 0.000 description 2
- 210000004556 brain Anatomy 0.000 description 2
- 238000013480 data collection Methods 0.000 description 2
- 238000013461 design Methods 0.000 description 2
- 238000010586 diagram Methods 0.000 description 2
- 239000003814 drug Substances 0.000 description 2
- 210000003743 erythrocyte Anatomy 0.000 description 2
- 238000010438 heat treatment Methods 0.000 description 2
- 229910052743 krypton Inorganic materials 0.000 description 2
- DNNSSWSSYDEUBZ-UHFFFAOYSA-N krypton atom Chemical compound [Kr] DNNSSWSSYDEUBZ-UHFFFAOYSA-N 0.000 description 2
- 230000002934 lysing effect Effects 0.000 description 2
- 239000000463 material Substances 0.000 description 2
- 239000000203 mixture Substances 0.000 description 2
- 238000005457 optimization Methods 0.000 description 2
- 229910052760 oxygen Inorganic materials 0.000 description 2
- 239000001301 oxygen Substances 0.000 description 2
- 229920006380 polyphenylene oxide Polymers 0.000 description 2
- 230000001681 protective effect Effects 0.000 description 2
- 230000005855 radiation Effects 0.000 description 2
- 238000001055 reflectance spectroscopy Methods 0.000 description 2
- 229920005989 resin Polymers 0.000 description 2
- 239000011347 resin Substances 0.000 description 2
- 230000035945 sensitivity Effects 0.000 description 2
- VYPSYNLAJGMNEJ-UHFFFAOYSA-N silicon dioxide Inorganic materials O=[Si]=O VYPSYNLAJGMNEJ-UHFFFAOYSA-N 0.000 description 2
- LPXPTNMVRIOKMN-UHFFFAOYSA-M sodium nitrite Chemical compound [Na+].[O-]N=O LPXPTNMVRIOKMN-UHFFFAOYSA-M 0.000 description 2
- 239000002904 solvent Substances 0.000 description 2
- 238000012360 testing method Methods 0.000 description 2
- 238000002834 transmittance Methods 0.000 description 2
- 229910052724 xenon Inorganic materials 0.000 description 2
- FHNFHKCVQCLJFQ-UHFFFAOYSA-N xenon atom Chemical compound [Xe] FHNFHKCVQCLJFQ-UHFFFAOYSA-N 0.000 description 2
- 208000026310 Breast neoplasm Diseases 0.000 description 1
- YZCKVEUIGOORGS-OUBTZVSYSA-N Deuterium Chemical compound [2H] YZCKVEUIGOORGS-OUBTZVSYSA-N 0.000 description 1
- 239000004727 Noryl Substances 0.000 description 1
- 229920001207 Noryl Polymers 0.000 description 1
- 208000018262 Peripheral vascular disease Diseases 0.000 description 1
- 239000004793 Polystyrene Substances 0.000 description 1
- 239000006096 absorbing agent Substances 0.000 description 1
- 238000000862 absorption spectrum Methods 0.000 description 1
- 230000003044 adaptive effect Effects 0.000 description 1
- 239000000853 adhesive Substances 0.000 description 1
- 230000001070 adhesive effect Effects 0.000 description 1
- 239000003905 agrochemical Substances 0.000 description 1
- 238000013528 artificial neural network Methods 0.000 description 1
- 230000000712 assembly Effects 0.000 description 1
- 238000000429 assembly Methods 0.000 description 1
- 230000006399 behavior Effects 0.000 description 1
- 230000033228 biological regulation Effects 0.000 description 1
- 230000005540 biological transmission Effects 0.000 description 1
- 239000012482 calibration solution Substances 0.000 description 1
- 238000001444 catalytic combustion detection Methods 0.000 description 1
- 210000004027 cell Anatomy 0.000 description 1
- 238000012512 characterization method Methods 0.000 description 1
- 238000006243 chemical reaction Methods 0.000 description 1
- 238000002485 combustion reaction Methods 0.000 description 1
- 239000002131 composite material Substances 0.000 description 1
- 238000010276 construction Methods 0.000 description 1
- 238000000354 decomposition reaction Methods 0.000 description 1
- 229910052805 deuterium Inorganic materials 0.000 description 1
- 239000012895 dilution Substances 0.000 description 1
- 238000010790 dilution Methods 0.000 description 1
- 238000005562 fading Methods 0.000 description 1
- 229910052736 halogen Inorganic materials 0.000 description 1
- 150000002367 halogens Chemical class 0.000 description 1
- 108010036302 hemoglobin AS Proteins 0.000 description 1
- 230000002452 interceptive effect Effects 0.000 description 1
- 238000012417 linear regression Methods 0.000 description 1
- 239000007788 liquid Substances 0.000 description 1
- 229920002521 macromolecule Polymers 0.000 description 1
- 238000012423 maintenance Methods 0.000 description 1
- 238000004519 manufacturing process Methods 0.000 description 1
- 238000001465 metallisation Methods 0.000 description 1
- 238000004476 mid-IR spectroscopy Methods 0.000 description 1
- 238000001320 near-infrared absorption spectroscopy Methods 0.000 description 1
- 238000002610 neuroimaging Methods 0.000 description 1
- 230000003702 neurovascular coupling effect Effects 0.000 description 1
- 150000002894 organic compounds Chemical class 0.000 description 1
- 238000002496 oximetry Methods 0.000 description 1
- 239000004033 plastic Substances 0.000 description 1
- 229920003023 plastic Polymers 0.000 description 1
- 229920002223 polystyrene Polymers 0.000 description 1
- 230000003334 potential effect Effects 0.000 description 1
- 102000004169 proteins and genes Human genes 0.000 description 1
- 108090000623 proteins and genes Proteins 0.000 description 1
- 238000002106 pulse oximetry Methods 0.000 description 1
- 238000003908 quality control method Methods 0.000 description 1
- 239000010453 quartz Substances 0.000 description 1
- 230000009467 reduction Effects 0.000 description 1
- 238000013515 script Methods 0.000 description 1
- 235000010288 sodium nitrite Nutrition 0.000 description 1
- 239000007787 solid Substances 0.000 description 1
- 238000004611 spectroscopical analysis Methods 0.000 description 1
- 238000012421 spiking Methods 0.000 description 1
- 238000002849 thermal shift Methods 0.000 description 1
- 229910001428 transition metal ion Inorganic materials 0.000 description 1
- WFKWXMTUELFFGS-UHFFFAOYSA-N tungsten Chemical compound [W] WFKWXMTUELFFGS-UHFFFAOYSA-N 0.000 description 1
- 229910052721 tungsten Inorganic materials 0.000 description 1
- 239000010937 tungsten Substances 0.000 description 1
- 238000000870 ultraviolet spectroscopy Methods 0.000 description 1
- XLYOFNOQVPJJNP-UHFFFAOYSA-N water Substances O XLYOFNOQVPJJNP-UHFFFAOYSA-N 0.000 description 1
Images


Classifications
-
- G—PHYSICS
- G01—MEASURING; TESTING
- G01N—INVESTIGATING OR ANALYSING MATERIALS BY DETERMINING THEIR CHEMICAL OR PHYSICAL PROPERTIES
- G01N21/00—Investigating or analysing materials by the use of optical means, i.e. using sub-millimetre waves, infrared, visible or ultraviolet light
- G01N21/17—Systems in which incident light is modified in accordance with the properties of the material investigated
- G01N21/25—Colour; Spectral properties, i.e. comparison of effect of material on the light at two or more different wavelengths or wavelength bands
- G01N21/31—Investigating relative effect of material at wavelengths characteristic of specific elements or molecules, e.g. atomic absorption spectrometry
-
- A—HUMAN NECESSITIES
- A61—MEDICAL OR VETERINARY SCIENCE; HYGIENE
- A61B—DIAGNOSIS; SURGERY; IDENTIFICATION
- A61B5/00—Measuring for diagnostic purposes; Identification of persons
- A61B5/145—Measuring characteristics of blood in vivo, e.g. gas concentration, pH value; Measuring characteristics of body fluids or tissues, e.g. interstitial fluid, cerebral tissue
- A61B5/14535—Measuring characteristics of blood in vivo, e.g. gas concentration, pH value; Measuring characteristics of body fluids or tissues, e.g. interstitial fluid, cerebral tissue for measuring haematocrit
-
- A—HUMAN NECESSITIES
- A61—MEDICAL OR VETERINARY SCIENCE; HYGIENE
- A61B—DIAGNOSIS; SURGERY; IDENTIFICATION
- A61B5/00—Measuring for diagnostic purposes; Identification of persons
- A61B5/145—Measuring characteristics of blood in vivo, e.g. gas concentration, pH value; Measuring characteristics of body fluids or tissues, e.g. interstitial fluid, cerebral tissue
- A61B5/1455—Measuring characteristics of blood in vivo, e.g. gas concentration, pH value; Measuring characteristics of body fluids or tissues, e.g. interstitial fluid, cerebral tissue using optical sensors, e.g. spectral photometrical oximeters
- A61B5/14551—Measuring characteristics of blood in vivo, e.g. gas concentration, pH value; Measuring characteristics of body fluids or tissues, e.g. interstitial fluid, cerebral tissue using optical sensors, e.g. spectral photometrical oximeters for measuring blood gases
- A61B5/14557—Measuring characteristics of blood in vivo, e.g. gas concentration, pH value; Measuring characteristics of body fluids or tissues, e.g. interstitial fluid, cerebral tissue using optical sensors, e.g. spectral photometrical oximeters for measuring blood gases specially adapted to extracorporeal circuits
-
- A—HUMAN NECESSITIES
- A61—MEDICAL OR VETERINARY SCIENCE; HYGIENE
- A61B—DIAGNOSIS; SURGERY; IDENTIFICATION
- A61B5/00—Measuring for diagnostic purposes; Identification of persons
- A61B5/145—Measuring characteristics of blood in vivo, e.g. gas concentration, pH value; Measuring characteristics of body fluids or tissues, e.g. interstitial fluid, cerebral tissue
- A61B5/1455—Measuring characteristics of blood in vivo, e.g. gas concentration, pH value; Measuring characteristics of body fluids or tissues, e.g. interstitial fluid, cerebral tissue using optical sensors, e.g. spectral photometrical oximeters
- A61B5/14558—Measuring characteristics of blood in vivo, e.g. gas concentration, pH value; Measuring characteristics of body fluids or tissues, e.g. interstitial fluid, cerebral tissue using optical sensors, e.g. spectral photometrical oximeters by polarisation
-
- G—PHYSICS
- G01—MEASURING; TESTING
- G01J—MEASUREMENT OF INTENSITY, VELOCITY, SPECTRAL CONTENT, POLARISATION, PHASE OR PULSE CHARACTERISTICS OF INFRARED, VISIBLE OR ULTRAVIOLET LIGHT; COLORIMETRY; RADIATION PYROMETRY
- G01J3/00—Spectrometry; Spectrophotometry; Monochromators; Measuring colours
- G01J3/02—Details
- G01J3/0202—Mechanical elements; Supports for optical elements
-
- G—PHYSICS
- G01—MEASURING; TESTING
- G01J—MEASUREMENT OF INTENSITY, VELOCITY, SPECTRAL CONTENT, POLARISATION, PHASE OR PULSE CHARACTERISTICS OF INFRARED, VISIBLE OR ULTRAVIOLET LIGHT; COLORIMETRY; RADIATION PYROMETRY
- G01J3/00—Spectrometry; Spectrophotometry; Monochromators; Measuring colours
- G01J3/02—Details
- G01J3/0205—Optical elements not provided otherwise, e.g. optical manifolds, diffusers, windows
- G01J3/0208—Optical elements not provided otherwise, e.g. optical manifolds, diffusers, windows using focussing or collimating elements, e.g. lenses or mirrors; performing aberration correction
-
- G—PHYSICS
- G01—MEASURING; TESTING
- G01J—MEASUREMENT OF INTENSITY, VELOCITY, SPECTRAL CONTENT, POLARISATION, PHASE OR PULSE CHARACTERISTICS OF INFRARED, VISIBLE OR ULTRAVIOLET LIGHT; COLORIMETRY; RADIATION PYROMETRY
- G01J3/00—Spectrometry; Spectrophotometry; Monochromators; Measuring colours
- G01J3/02—Details
- G01J3/0286—Constructional arrangements for compensating for fluctuations caused by temperature, humidity or pressure, or using cooling or temperature stabilization of parts of the device; Controlling the atmosphere inside a spectrometer, e.g. vacuum
-
- G—PHYSICS
- G01—MEASURING; TESTING
- G01J—MEASUREMENT OF INTENSITY, VELOCITY, SPECTRAL CONTENT, POLARISATION, PHASE OR PULSE CHARACTERISTICS OF INFRARED, VISIBLE OR ULTRAVIOLET LIGHT; COLORIMETRY; RADIATION PYROMETRY
- G01J3/00—Spectrometry; Spectrophotometry; Monochromators; Measuring colours
- G01J3/02—Details
- G01J3/0291—Housings; Spectrometer accessories; Spatial arrangement of elements, e.g. folded path arrangements
-
- G—PHYSICS
- G01—MEASURING; TESTING
- G01J—MEASUREMENT OF INTENSITY, VELOCITY, SPECTRAL CONTENT, POLARISATION, PHASE OR PULSE CHARACTERISTICS OF INFRARED, VISIBLE OR ULTRAVIOLET LIGHT; COLORIMETRY; RADIATION PYROMETRY
- G01J3/00—Spectrometry; Spectrophotometry; Monochromators; Measuring colours
- G01J3/02—Details
- G01J3/10—Arrangements of light sources specially adapted for spectrometry or colorimetry
-
- G—PHYSICS
- G01—MEASURING; TESTING
- G01J—MEASUREMENT OF INTENSITY, VELOCITY, SPECTRAL CONTENT, POLARISATION, PHASE OR PULSE CHARACTERISTICS OF INFRARED, VISIBLE OR ULTRAVIOLET LIGHT; COLORIMETRY; RADIATION PYROMETRY
- G01J3/00—Spectrometry; Spectrophotometry; Monochromators; Measuring colours
- G01J3/12—Generating the spectrum; Monochromators
- G01J3/14—Generating the spectrum; Monochromators using refracting elements, e.g. prisms
-
- G—PHYSICS
- G01—MEASURING; TESTING
- G01J—MEASUREMENT OF INTENSITY, VELOCITY, SPECTRAL CONTENT, POLARISATION, PHASE OR PULSE CHARACTERISTICS OF INFRARED, VISIBLE OR ULTRAVIOLET LIGHT; COLORIMETRY; RADIATION PYROMETRY
- G01J3/00—Spectrometry; Spectrophotometry; Monochromators; Measuring colours
- G01J3/12—Generating the spectrum; Monochromators
- G01J3/18—Generating the spectrum; Monochromators using diffraction elements, e.g. grating
-
- G—PHYSICS
- G01—MEASURING; TESTING
- G01J—MEASUREMENT OF INTENSITY, VELOCITY, SPECTRAL CONTENT, POLARISATION, PHASE OR PULSE CHARACTERISTICS OF INFRARED, VISIBLE OR ULTRAVIOLET LIGHT; COLORIMETRY; RADIATION PYROMETRY
- G01J3/00—Spectrometry; Spectrophotometry; Monochromators; Measuring colours
- G01J3/28—Investigating the spectrum
- G01J3/42—Absorption spectrometry; Double beam spectrometry; Flicker spectrometry; Reflection spectrometry
-
- G—PHYSICS
- G01—MEASURING; TESTING
- G01N—INVESTIGATING OR ANALYSING MATERIALS BY DETERMINING THEIR CHEMICAL OR PHYSICAL PROPERTIES
- G01N21/00—Investigating or analysing materials by the use of optical means, i.e. using sub-millimetre waves, infrared, visible or ultraviolet light
- G01N21/01—Arrangements or apparatus for facilitating the optical investigation
- G01N21/03—Cuvette constructions
- G01N21/0303—Optical path conditioning in cuvettes, e.g. windows; adapted optical elements or systems; path modifying or adjustment
-
- G—PHYSICS
- G01—MEASURING; TESTING
- G01N—INVESTIGATING OR ANALYSING MATERIALS BY DETERMINING THEIR CHEMICAL OR PHYSICAL PROPERTIES
- G01N21/00—Investigating or analysing materials by the use of optical means, i.e. using sub-millimetre waves, infrared, visible or ultraviolet light
- G01N21/17—Systems in which incident light is modified in accordance with the properties of the material investigated
- G01N21/25—Colour; Spectral properties, i.e. comparison of effect of material on the light at two or more different wavelengths or wavelength bands
- G01N21/27—Colour; Spectral properties, i.e. comparison of effect of material on the light at two or more different wavelengths or wavelength bands using photo-electric detection ; circuits for computing concentration
- G01N21/274—Calibration, base line adjustment, drift correction
-
- G—PHYSICS
- G01—MEASURING; TESTING
- G01N—INVESTIGATING OR ANALYSING MATERIALS BY DETERMINING THEIR CHEMICAL OR PHYSICAL PROPERTIES
- G01N21/00—Investigating or analysing materials by the use of optical means, i.e. using sub-millimetre waves, infrared, visible or ultraviolet light
- G01N21/17—Systems in which incident light is modified in accordance with the properties of the material investigated
- G01N21/25—Colour; Spectral properties, i.e. comparison of effect of material on the light at two or more different wavelengths or wavelength bands
- G01N21/31—Investigating relative effect of material at wavelengths characteristic of specific elements or molecules, e.g. atomic absorption spectrometry
- G01N21/35—Investigating relative effect of material at wavelengths characteristic of specific elements or molecules, e.g. atomic absorption spectrometry using infrared light
- G01N21/359—Investigating relative effect of material at wavelengths characteristic of specific elements or molecules, e.g. atomic absorption spectrometry using infrared light using near infrared light
-
- G—PHYSICS
- G01—MEASURING; TESTING
- G01N—INVESTIGATING OR ANALYSING MATERIALS BY DETERMINING THEIR CHEMICAL OR PHYSICAL PROPERTIES
- G01N33/00—Investigating or analysing materials by specific methods not covered by groups G01N1/00 - G01N31/00
- G01N33/48—Biological material, e.g. blood, urine; Haemocytometers
- G01N33/483—Physical analysis of biological material
- G01N33/487—Physical analysis of biological material of liquid biological material
- G01N33/49—Blood
- G01N33/492—Determining multiple analytes
-
- G—PHYSICS
- G01—MEASURING; TESTING
- G01J—MEASUREMENT OF INTENSITY, VELOCITY, SPECTRAL CONTENT, POLARISATION, PHASE OR PULSE CHARACTERISTICS OF INFRARED, VISIBLE OR ULTRAVIOLET LIGHT; COLORIMETRY; RADIATION PYROMETRY
- G01J5/00—Radiation pyrometry, e.g. infrared or optical thermometry
- G01J5/02—Constructional details
- G01J5/08—Optical arrangements
- G01J5/0878—Diffusers
-
- G—PHYSICS
- G01—MEASURING; TESTING
- G01N—INVESTIGATING OR ANALYSING MATERIALS BY DETERMINING THEIR CHEMICAL OR PHYSICAL PROPERTIES
- G01N21/00—Investigating or analysing materials by the use of optical means, i.e. using sub-millimetre waves, infrared, visible or ultraviolet light
- G01N21/17—Systems in which incident light is modified in accordance with the properties of the material investigated
- G01N21/21—Polarisation-affecting properties
- G01N2021/216—Polarisation-affecting properties using circular polarised light
-
- G—PHYSICS
- G01—MEASURING; TESTING
- G01N—INVESTIGATING OR ANALYSING MATERIALS BY DETERMINING THEIR CHEMICAL OR PHYSICAL PROPERTIES
- G01N2201/00—Features of devices classified in G01N21/00
- G01N2201/06—Illumination; Optics
- G01N2201/062—LED's
-
- G—PHYSICS
- G01—MEASURING; TESTING
- G01N—INVESTIGATING OR ANALYSING MATERIALS BY DETERMINING THEIR CHEMICAL OR PHYSICAL PROPERTIES
- G01N2201/00—Features of devices classified in G01N21/00
- G01N2201/06—Illumination; Optics
- G01N2201/063—Illuminating optical parts
- G01N2201/0634—Diffuse illumination
Definitions
- the present invention relates generally to spectroscopic systems and methods for the identification and characterization of hemoglobin parameters in blood.
- An ultraviolet-visible light spectroscopic system involves absorption spectroscopy or reflectance spectroscopy. As the name implies, such systems use light in the visible and near ultraviolet ranges for analyzing a sample. The wavelength range is typically from about 400 nm to about 700 nm. The absorption or reflectance of the visible light directly affects the perceived color of the chemicals involved. UV/Vis spectroscopy is routinely used in analytical chemistry for the quantitative determination of different analytes, such as transition metal ions, highly conjugated organic compounds, and biological macromolecules. Spectroscopic analysis is commonly carried out in solutions but solids and gases may also be studied.
- a near-infrared spectroscopic system also involves absorption spectroscopy or reflectance spectroscopy. Such systems use light in the near-infrared range for analyzing a sample.
- the wavelength range is typically from about 700 nm to less than 2,500 nm.
- Typical applications include pharmaceutical, medical diagnostics (including blood sugar and pulse oximetry), food and agrochemical quality control, and combustion research, as well as research in functional neuroimaging, sports medicine & science, elite sports training, ergonomics, rehabilitation, neonatal research, brain computer interface, urology (bladder contraction), and neurology (neurovascular coupling).
- Instrumentation for near-IR (NIR) spectroscopy is similar to instruments for the UV-visible and mid-IR ranges.
- the basic parts of a spectrophotometer are a light source, a holder for the sample, a diffraction grating in a monochromator or a prism to separate the different wavelengths of light, and a detector.
- the radiation source is often a Tungsten filament (300-2500 nm), a deuterium arc lamp, which is continuous over the ultraviolet region (190-400 nm), Xenon arc lamp, which is continuous from 160-2,000 nm, or more recently, light emitting diodes (LED) for the visible wavelengths.
- Tungsten filament 300-2500 nm
- a deuterium arc lamp which is continuous over the ultraviolet region (190-400 nm)
- Xenon arc lamp which is continuous from 160-2,000 nm, or more recently, light emitting diodes (LED) for the visible wavelengths.
- LED light emitting
- the detector is typically a photomultiplier tube, a photodiode, a photodiode array or a charge-coupled device (CCD).
- CCD charge-coupled device
- Single photodiode detectors and photomultiplier tubes are used with scanning monochromators, which filter the light so that only light of a single wavelength reaches the detector at one time.
- the scanning monochromator moves the diffraction grating to "step-through" each wavelength so that its intensity may be measured as a function of wavelength.
- Fixed monochromators are used with CCDs and photodiode arrays. As both of these devices consist of many detectors grouped into one or two dimensional arrays, they are able to collect light of different wavelengths on different pixels or groups of pixels simultaneously.
- LEDs Light-emitting diodes
- the type of detector used depends primarily on the range of wavelengths to be measured.
- NIR spectroscopy uses the fact that the transmission and absorption of NIR light in human body tissues contains information about hemoglobin concentration changes.
- blood flow, volume and absolute tissue saturation StO 2 or Tissue Saturation Index (TSI)
- TSI Tissue Saturation Index
- Applications of oximetry by NIRS methods include neuroscience, ergonomics, rehabilitation, brain computer interface, urology, the detection of illnesses that affect the blood circulation (e.g., peripheral vascular disease), the detection and assessment of breast tumors, and the optimization of training in sports medicine.
- ⁇ is a constant known as the molar absorptivity or extinction coefficient. This constant is a fundamental molecular property in a given solvent, at a particular temperature and pressure, and has units of 1/M*cm or often AU/M*cm.
- the absorbance and extinction ⁇ are sometimes defined in terms of the natural logarithm instead of the base-10 logarithm.
- Beer-Lambert Law is useful for characterizing many compounds but does not hold as a universal relationship for the concentration and absorption of all substances.
- Stray light is an important factor that affects spectroscopic systems. Stray light causes an instrument to report an incorrectly low absorbance.
- Deviations from the Beer-Lambert law arise based on concentrations. At sufficiently high concentrations, the absorption bands will saturate and show absorption flattening. The absorption peak appears to flatten because close to 100% of the light is already being absorbed. The concentration at which this occurs depends on the particular compound being measured.
- Measurement uncertainty arises in quantitative chemical analysis where the results are additionally affected by uncertainty sources from the nature of the compounds and/or solutions that are measured. These include spectral interferences caused by absorption band overlap, fading of the color of the absorbing species (caused by decomposition or reaction) and possible composition mismatch between the sample and the calibration solution.
- US 2015/0316471 A1 an apparatus for detecting a component in a sample is known which comprises two light sources emitting light at different wavelengths and arranged along an optical path in front of a sample chamber. The absorbance of the light emitted by the second light source in the sample chamber is used to estimate a path length through the sample chamber. The absorbance of the light emitted by the first light source in the sample chamber and the estimated path length are used to determine the hemoglobin concentration of the sample.
- the apparatus further comprises a xenon lamp which is used for calibrating the wavelength of the spectrometer.
- HGB human hemoglobin
- COOx analyzers are used to measure the hemoglobin parameters of blood, such as total hemoglobin (tHb), carboxyhemoglobin (COHb), deoxyhemoglobin (HHb), oxyhemoglobin (O2Hb), methemoglobin (MetHb), and fetal hemoglobin (FHb) as well as total bilirubin (tBil) using optical absorbance measurements.
- typical COOx analyzers use lysed blood instead of whole blood because of the problems encountered with spectrometric analysis of whole blood.
- the measurement of lysed blood is relatively straightforward since the lysing process dissolves the red blood cells and turns the blood into an almost non-diffusing medium.
- the absorbance is measured with a simple collimated beam through the cuvette with little loss of light due to scattering. Because of the low loss of light due to scattering, a straightforward linear analysis may be used to find the hemoglobin and total bilirubin parameters.
- the components in a prism-based spectrometer naturally have a low stray light profile.
- the major contributing factor to stray light performance is related to how the components are used.
- Typical collection optics for systems using lysed blood are designed to collect light from the cuvette in a cone of about +/-0.7 degrees wide and have an upper measure absorbance limit of 1.5 A.U. (absorbance units). It was discovered by the inventors that for whole blood the system needs to collect light from the cuvette in a cone of about +/-12 degrees and that the upper absorbance limit had to increase to about 3.5 A.U. As for blood settling effects, the typical time it takes to measure the absorbance spectrum (approx. 1 minute), the whole blood in the cuvette is settling and the blood cells are forming clumps or rouleaux. Consequently, the scattering effects and the absorbance change with time.
- step functions in the composite absorbance scan which is stitched together from scans from several integration times.
- adding more scans to expand the absorbance upper limit increases the data collection time.
- integration time was lowered from 5 msec to 1.2 msec to reduce data collection time. It was discovered, however, that this only works if the light level is increased by a corresponding factor. Thus, the LED white light brightness must be increased.
- the optical absorbance measurement of a diffuse sample such as whole blood presents a unique problem.
- the diffuse transmittance of the whole blood sample scrambles the initial spatial light distribution of the measurement system caused by the non-uniformity typical of light sources.
- the spatial light distribution of the "blank" scan can be quite different from the whole blood sample scan. Since optical detectors have response that varies spatially, the response can vary due to spatial distribution changes of the incident light, even if the overall intensity has not changed.
- An absorbance scan which is based on the ratio of the whole blood sample scan to the blank scan will have a significant absorbance component due to this this non-uniformity of the light source in addition to the absorbance due to the sample alone. This results in a significant measurement error of the whole blood sample absorbance that is intolerable for cooximetry.
- the diffusers are specially chosen so that they diffuse a ray of incident light into the full acceptance cone of the optical system, but not more, so that as much light throughput as possible may be preserved while scrambling the ray completely across the field.
- spectral acquisition times which must be faster. Instead of the typical 12 seconds, it must be 5 seconds or less.
- the spectral acquisition time includes integration time multiplied by the number of coadded spectra and the processing time to produce one spectrum (full light, dark or sample) meeting all the following requirements. Absolute wavelength accuracy must be less; less than +0.03/-0.03 nm compared to +0.1/-0.0 nm.
- Wavelength calibration maintenance (less than +0.06/-0.0 nm versus +0.1/-0.0 nm), wavelength calibration drift (less than 0.024 nm/°C compared to 0.04 nm/°C), dark current level (less than 0.06%/°C for maximum dynamic range versus 0.1%/°C of maximum dynamic range), response nonlinearity (less than 0.06% after correction and less than 1.2% for lowest and highest 10% of dynamic range compared to 0.1% after correction and 2.0% for lowest and highest 10% of dynamic range), scattered light level (less than 0.02% of maximum dynamic range for fully illuminated detector array versus 0.1% of maximum dynamic range for fully illuminated detector array), thermal drift of response (intensity change maximum of 6% and tilt max of 6% over spectral range compared to intensity change maximum of 10% and tilt max of 10% over spectral range), and temperature excursion allowed during measurement (less than 0.5°C compared to 2°C) must all be less.
- spectrometers typically use diffraction gratings (reflective or transmissive) to disperse the light input.
- Diffraction gratings give a high degree of dispersion in a small volume, and produce a relatively constant bandwidth (or resolution) vs. wavelength preferred by the typical user.
- Gratings suffer from high stray light due to multiple diffraction orders and also from the imperfections inherent in the lines that are etched to produce the grating surface.
- mass-produced but expensive master holographic gratings are typically employed in applications requiring low stray light, rather than the more commonly available replicated gratings.
- Prisms are also used to make spectrometers. Prisms have no issues with multiple diffraction orders and their surfaces have orders of magnitude fewer imperfections than the surface of a grating.
- the components in a prism-based spectrometer naturally have a low stray light profile.
- stray light in a prism spectrometer can potentially be lower by an order of magnitude or more compared to a grating spectrometer of otherwise similar design.
- the major contributing factor to stray light performance arises from how the components are used. There are three main sources of stray light. These include (1) overfilling of the spectrometer numerical aperture, (2) retroreflection from the light-array detector, and (3) the focal plane image.
- the numerical aperture of the optical fiber is 0.22 and the numerical aperture of the prism spectrometer is 0.1.
- a stop placed above the optical fiber input restricts the light input cone from the optical fiber to prevent excess light input.
- the light-array detector does not absorb all of the light impinging upon it, but back-reflects a portion. This retroreflection must be controlled to land into an absorbing surface or beam trap to prevent it from scattering onto the detector. Imparting a slight tilt of the light-array detector forces the retroreflection back into a harmless direction.
- the image of the slit on the detector focal plane must be as sharp as possible. Any excessive overfill of the detector due to defocus can be a potential source of stray light. If this light hits detector structures such as bond wires, metallization pads, etc., it can bounce back onto the sensitive surface of the detector.
- a prism spectrometer spreads the blue end of the spectrum out over more pixels than a diffraction grating spectrometer and, thus, the blue end of the spectrum gives a lower signal per pixel.
- an LED with higher blue power, or a cool-white LED is used.
- the signal in the blue can be further boosted by adding an inexpensive filter glass after the LED that slightly attenuates the red end.
- Kopp filter glass type 4309, about 3 mm thick, is useful for this purpose.
- the main disadvantage of prisms is the lower dispersive power they have compared to a grating, and the variation of resolution with wavelength. In embodiments of the present invention when a prism is used, the former disadvantage is mitigated by using a small enough light-array detector; the latter is mitigated because the analysis of whole blood does not require a uniformly small resolution across the waveband of interest.
- the spectral region is expanded and covers the spectral region of 422-695 mm. Further, the resolution is selectively changed upward in regions where low resolution is not required (such as the 600-695 nm region and 422-455 nm region). In embodiments of the present invention, these regions have a resolution greater than 1 nm. Typically, the resolution is about 3.0 to about 3.5 nm. These ranges are used to capture additional wavelength calibration peaks for wavelength calibration and fluid detection. The larger spectral region of embodiments of the present invention requires consideration of the dispersed spectrum from the prism.
- the dispersed spectrum must be spread out over the light-array detector and cover enough pixels to sample the spectrum at a fine enough resolution but not so much as to extend outside of the detector array. Due to the wider spectral range, embodiments of the present invention incorporate a light-array detector having 1024 pixels with an active area length of about 8.0 mm.
- a minimal-part reference design for an optical dispersion spectrometer requires only two optical components: a light dispersion element (i.e. prism or grating) and a doublet (achromatic) lens.
- the prism/grating has a reflective coating on the base.
- a light dispersion element i.e. prism or grating
- the Littrow prism has a structure such that it is usable for a compact and low-cost spectrometer of embodiments of the present invention.
- the prism material (dispersion characteristic) and the lens focal length are further considerations.
- one embodiment of the present invention incorporates a Schott F5 glass prism and an 80 mm focal length lens. This particular combination provides a dispersion length of the spectrum of about 6.48 mm. This dispersion length leaves about 0.75 mm on either end of the light-array detector available for tolerance variations and dark correction pixels.
- Thermal drift of the spectral response must be considered. It is critical that the spectral response of the spectrometer stays within a certain range between the full light and whole blood scans. Any change in spectrometer response will cause absorbance errors. The main precaution against this change is to make sure that the image of the slit overfills the pixels so that image drift due to temperature does not cause a reduction of light on the detector pixel.
- the 1:1 imaging of the system combined with a 200 ⁇ m diameter optical fiber overfills the 125 ⁇ m tall pixels. As long as image drift is confined to less than about 30 ⁇ m of movement in either direction along the detector over a measurement interval, thermal drift is not a problem.
- the present invention also contemplates various mechanisms to minimize thermal drift effects on the spectral response.
- These mechanisms include insulating the spectrometer housing to minimize temperature changes external to the spectrometer housing, maintaining the temperature within the spectrometer housing using a temperature-controlled heat source, and/or incorporating a temperature-compensating lens mount for the achromatic lens.
- the absorbance is measured, which is minus the base-ten logarithm of the ratio of the electrical signal received when the blood sample is in the cuvette to the electrical signal received when a clear fluid is in the cuvette.
- the absorbance values at each wavelength are put into a mapping function that maps absorbance values to the analyte levels (COOx parameters and bilirubin) in the whole blood sample.
- the mapping function and its coefficients are established by using the absorbance values measured for whole blood samples with known analyte values, and establishing the relationship between these absorbance values and the known analyte values.
- Embodiments of the present invention achieve these and other objectives by providing a compact, low-cost COOx analyzer subsystem.
- an optical absorbance measurement system for measuring whole-blood hemoglobin parameters with the features of claim 1.
- the system includes, inter alia, (a) an optical-sample module having a light-emitting module, a replaceable cuvette assembly, and a calibrating-light module, (b) an optical fiber, (c) a spectrometer module, and (d) a processor module.
- the light-emitting module has an LED light source capable of emitting light where the light is directed along an optical path.
- the cuvette assembly is adjacent the light-emitting module where the cuvette assembly is adapted for receiving a whole-blood sample and has a sample receiving chamber with a first cuvette window and a second cuvette window aligned with each other.
- the sample receiving chamber is disposed in the optical path for receiving light from the LED light source and has a defined optical path length between the first cuvette window and the second cuvette window along with an electronic chip capable of storing a path-length value of the sample receiving chamber.
- the calibrating-light module has a calibrating-light source with one or more known wavelengths of light where the calibrating-light module is capable of emitting a calibrating light into the optical path.
- the optical fiber has a light-receiving end and a light-emitting end. The light-receiving end optically connects to the optical-sample module where the light-receiving end receives the light from the optical path and conducts the light to the light-emitting end.
- the spectrometer module receives the light from the light-emitting end of the optical fiber, separates the light into a plurality of light beams where each light beam has a different wavelength, and converts the plurality of light beams into an electrical signal.
- the processor module (1) obtains the path-length value of the sample receiving chamber of the replaceable cuvette from the electronic chip and (2) receives and processes the electrical signal from the spectrometer module generated for a whole-blood sample.
- the path-length value of the sample chamber is used to transform the electrical signal into an output signal useable for displaying and reporting hemoglobin parameter values and/or total bilirubin parameter values for the whole-blood sample.
- the light-emitting module includes a plurality of optical components disposed in the optical path between the LED light source and the cuvette assembly where the plurality of optical components includes at least the first optical diffuser and one or more of a collimating lens, a circular polarizer, and a focusing lens.
- the calibrating-light module includes a second diffuser disposed in the optical path downstream from the cuvette assembly but upstream from a beam splitter.
- an optical absorbance measurement system for whole blood.
- the system includes an optical-sample module, an optical fiber, a spectrometer module, and a processor module.
- the optical-sample module includes a light-emitting module, a cuvette module, a first optical diffuser, and a second optical diffuser.
- the cuvette module is positioned between the first optical diffuser and the second optical diffuser.
- the spectrometer module receives the light from the light-emitting end of the optical fiber, separating the light into a plurality of light beams and converting the plurality of light beams into an electrical signal.
- the processor module receives and processes the electrical signal from the spectrometer module generated for the whole-blood sample and transforms the electrical signal into an output signal useable for displaying and reporting hemoglobin parameter values and/or total bilirubin parameter values for the whole-blood sample.
- the spectrometer module includes an input slit positioned in the optical path to receive the light emitted from the light-emitting end of the optical fiber and to transmit the light therethrough, a light dispersing element disposed in the optical path where the light dispersing element receives the light transmitted through the input slit, separates the light into the plurality of light beams where each light beam has a different wavelength, and re-directs the plurality of light beams back toward but offset from the input slit, and a light-array detector capable of receiving the plurality of light beams and converting the plurality of light beams into an electrical signal for further processing.
- the spectrometer module has a thermal-compensating means for maintaining a position of the plurality of light beams on the light-array detector.
- the thermal-compensating means includes one or more of insulation disposed around the spectrometer housing, a temperature controller assembly disposed on the spectrometer housing (the temperature controller assembly being, for example, a heating tape with a thermistor or other temperature measuring component and a program that controls the heating of the tape based on the temperature within the spectrometer housing), and a thermal-compensating lens mount.
- the thermal-compensating lens mount has a fixed mount end and an unfixed mount end that permits thermal expansion and contraction of the thermal-compensating lens mount.
- the fixed mount end is fixedly attached to a baseplate or a bottom of the spectrometer housing.
- the lens mount has a coefficient of expansion greater than the coefficient of expansion of the baseplate or the spectrometer housing to which the lens mount is attached.
- the thermal-compensating lens mount moves linearly and transversely relative to an optical path of the light from the light input slit based on the coefficient of expansion of the lens mount. This temperature-based movement of the lens mount maintains the position of the dispersed light from the light dispersing element onto the light-array detector.
- thermal re-positioning of the achromatic lens by way of the thermal-compensating lens mount causes the dispersed light from the light dispersing element to impinge onto the light-array detector without affecting the electric signal generated by the light-array detector from the impinging light.
- the shift of the light beam is caused by the light-dispersing element reacting to a temperature change.
- a compact spectrometer for measuring hemoglobin parameters in whole blood.
- the spectrometer includes an enclosed housing having a light input end/an optical fiber housing end with a light entrance port, a light input slit disposed on an electronic circuit substrate, the electronic circuit substrate disposed in the enclosed housing where the light input slit is aligned with and adjacent to the light entrance port, a light-array detector disposed on the circuit board substrate adjacent the light input slit, and an optical component group consisting of a light dispersing element disposed downstream from the light input slit and a spherical achromatic lens disposed between the light input slit and the light dispersing element where the light dispersing element has a reflective surface on a back side to reflect the dispersed light back toward the achromatic lens.
- the achromatic lens transmits light from the light input slit to the light dispersing element and transmits dispersed light reflected from the light dispersing element to the light-array detector.
- the achromatic lens is slightly off axis relative to the light coming from the light input slit so that the dispersed light from the light dispersing element is not directed back to the light input slit but to the light-array detector.
- a method of measuring whole-blood hemoglobin parameters despite strong optical scattering caused by whole blood includes providing a light source such as a LED light source with a spectral range of about 422 nm to about 695 nm, guiding light having the spectral range from the light source along an optical path, providing a cuvette module with a sample receiving chamber having a first cuvette window disposed in the optical path where the first cuvette window transmits the light through the sample receiving chamber and through a second cuvette window aligned with the first cuvette window where the sample receiving chamber contains a sample of whole blood, providing a pair of diffusers (i.e.
- a first diffuser and a second diffuser disposed in the optical path where the first cuvette window and the second cuvette window of the sample receiving chamber of the cuvette are disposed between the pair of diffusers, guiding light from the cuvette module into a spectrometer having a light dispersing element that separates the light into a plurality of light beams where each light beam has a different wavelength and converts the plurality of light beams into an electrical signal, and processing the electrical signal into an output signal useable for displaying and reporting hemoglobin parameter values and/or total bilirubin parameter values of the sample of whole blood.
- the processing step includes processing the electrical signal to spectral absorbance and then mapping the spectral absorbance to hemoglobin parameter values and/or bilirubin parameter values using a computational mapping function.
- the processing step includes using a kernel-based orthogonal projection to latent structures mapping function as the computational mapping function.
- a method of measuring hemoglobin parameters in a whole blood sample includes (1) measuring and recording a transmitted light intensity scan over a plurality of wavelengths in a measurement range by transmitting light through a cuvette module having an optical path with a known optical path length therethrough where the cuvette module is filled with a transparent fluid, (2) measuring and recording a transmitted light intensity scan over the plurality of wavelengths of the measurement range by transmitting light through the cuvette a second time having the optical path with the known optical path length therethrough where the cuvette module is filled with a whole blood sample, wherein each measuring and recording step of the transparent fluid and the whole blood sample includes diffusing and circularly polarizing the transmitted light before transmitting the transmitted light through the cuvette module and then diffusing the transmitted light emitting from the cuvette module before determining a spectral absorbance, (3) determining a spectral absorbance at each wavelength of the plurality of wavelengths of the measurement range based on a ratio of the transmitted light intensity scan of the whole blood sample to the transmitted light intensity scan
- FIG. 1 shows one embodiment of a COOx analyzer subsystem 10.
- COOx analyzer subsystem 10 includes at least an optical-sample module 20, an optical fiber 90 and a spectrometer module 100.
- COOx analyzer subsystem 10 may optionally include a processor module 150 or processor module 150 may optionally be included in an electronics circuit of a diagnostic system in which the COOx analyzer subsystem 10 is a part.
- Line 5 is included to signify that the processor module 150 may or may not be part of the COOx subsystem 10.
- Processor module 150 includes, but is not limited to a microprocessor module152 and a memory module 154.
- the processor module 150 may also include a converter module 156 or converter module 156 may be external to the COOx analyzer subsystem 10.
- COOx analyzer subsystem 10 is used to measure the hemoglobin parameters of blood such as total hemoglobin (tHb), carboxyhemoglobin (COHb), deoxyhemoglobin (HHb), oxyhemoglobin (O2Hb), methemoglobin (MetHb), and fetal hemoglobin (FHb) as well as total bilirubin (tBil) using optical absorbance.
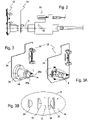
- FIG. 2 illustrates optical-sample module 20.
- Optical-sample module 20 includes a light-emitting module 22, a cuvette assembly 40 and a calibrating-light module 60.
- the light beam 12 defines an optical path 21.
- Figures 3-3A illustrate perspective views of the embodiment of light-emitting module 22 of Fig. 2 .
- Light-emitting module 22 includes a light-emitting module substrate 24 that contains an electrical circuit (not shown) and a light-emitting optics assembly 25.
- Light-emitting optics assembly 25 has an optics assembly housing 26 with an optics assembly end 26a.
- a beam of visible light 28a emits from optics assembly end 26a of light-emitting optics assembly 25 when light-emitting module 22 is powered on by a signal received from processor module 150.
- Fig. 3A illustrates light-emitting optics assembly 25 with optics assembly housing 26 removed exposing a plurality of optical components B contained within light-emitting assembly 25.
- optical components B includes a light-emitting diode (LED) light source 28, a collimating lens 30, a first diffuser 32, a circular polarizer 34, a focusing lens 36, and an optional protective window 38.
- Circular polarizer 34 provides a distinct advantage. This advantage provides improved sensitivity and accuracy of the system. Hemoglobin has optical rotary characteristics, which means that the polarization sensitivity of a spectrometer will cause an absorbance error if noncircularly polarized light is used to measure hemoglobin absorbance.
- the polarization state of the circularly polarized light is not changed when passing through hemoglobin.
- the polarization response of the spectrometer is the same for the circularly polarized light passing through the hemoglobin as it is for the reference scan taken with the cuvette filled with a transparent fluid.
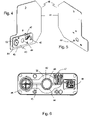
- FIG. 4 and 5 illustrated front and rear perspective views of one embodiment of the cuvette assembly 40.
- Cuvette assembly 40 includes a cuvette substrate 41 and a cuvette module 43.
- Cuvette substrate 41 provides a support for securing the cuvette assembly 40 within the analyte subsystem 10 and includes a cuvette light path opening 42 that is disposed within optical path 21 and is aligned with the light beam emitted from light-emitting module 22.
- Cuvette module 43 includes a cuvette first portion 44 having a sample receiving recess 45, a sample inlet port 46, a sample outlet port 47, an electronic chip assembly 48, and a first cuvette window 49, and a cuvette second portion 50 having a second cuvette window 52 (shown in Fig.
- Cuvette first portion 44 and cuvette second portion 50 are bonded to each with or without a gasket disposed between cuvette first and second portions 44, 50. Bonding may be achieved using adhesives, ultrasonic techniques, solvent based techniques, etc.
- sample receiving recess 45 of cuvette first portion 44 forms a sample receiving chamber 54 with cuvette second portion 50 that fluidly communicates with sample inlet and outlet ports 46, 47.
- first and second cuvette windows 49, 52 of sample receiving chamber 54 define a cuvette optical path length, which is accurately measured and stored within electronic chip 48 for later retrieval by processor module 150.
- a typical optical path length used in this embodiment of the present invention is 0.0035 inches (0.090 mm).
- FIG. 7 there is illustrates an enlarged, rear perspective view of cuvette first and second portions 44, 50.
- cuvette first portion 44 has sample chamber recess 45 with first cuvette window 49 and electronic chip recess 48a for receiving electronic chip assembly 48.
- Cuvette second portion 50 has second cuvette window 52 that forms sample receiving chamber 54 when assembled together with cuvette first portion 44.
- Second cuvette window 52 as delineated by an outline 53 on cuvette second portion 50 is a raised surface that forms a water-tight seal around sample chamber recess 45 and sample receiving chamber 54.
- a thin gasket may be positioned between cuvette first and second portions 44, 50 to more easily ensure a water-tight seal.
- Figure 8 shows a rear view of cuvette first portion 44 with electronic chip assembly 48 disposed within electronic chip recess 48a.
- Electronic chip assembly 48 includes a chip circuit board 48b and an electronic chip 48c that stores the cuvette optical path length value for the particular cuvette module 43.
- First cuvette window 49 is disposed within the optical path 21 and transmits the light beam passing through the sample to the calibrating light module 60, which then passes the light beam to the spectrometer module 100.
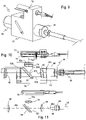
- Calibrating light module 60 includes a calibrating module housing 62, a light beam receiving portion 64, a calibrating light portion 70, and an optic fiber portion 80 where calibrating module housing 62, light beam receiving portion 64 and optic fiber portion 80 are aligned with optical path 21.
- Calibrating light portion 70 is spaced from and transverse to optical path 21.
- FIG 10 is a cross-sectional, elevation view of calibrating light module 60.
- Calibrating module housing 62 includes a first tubular conduit 62a between a light beam input opening 62b and a light beam exit opening 62c as well as a second tubular conduit 62d that is transverse to and intersects with first tubular conduit 62a on one end and has a calibrating light beam opening 62e on an opposite end.
- Light beam receiving portion 64 houses a collimating lens 66 that collimates light beam 28a received along optical path 21 from cuvette module 43 and directs light beam 28a into first tubular conduit 62a.
- beam splitter holder assembly 67 Disposed within calibrating module housing 62 is beam splitter holder assembly 67 that is disposed transversely across first tubular conduit 62a.
- Beam splitter holder assembly 67 has an upward slanting surface 67a facing calibrating light beam opening 62e and light beam exit opening 62c within optical path 21.
- Beam splitter holder assembly 67 supports a second diffuser 68 and a beam splitter 69 (shown in Fig. 11 ) that is disposed downstream along optical path 21 from second diffuser 68 so that it is positioned to receive calibrating light beam 72a and direct it along optical path 21 and first tubular conduit 62a to light beam exit opening 62c.
- Calibrating light portion 70 includes a calibrating light source 72 disposed adjacent but spaced from optical path 21 that is capable of directing a calibrating light beam 72a into calibrating module housing 62 through a calibrating light opening 62e transversely to optical path 21 toward beam splitter holder assembly 67. Within calibrating light portion 70, there is a collimating lens 74 that collimates calibrating light beam 72a before it is reflected by beam splitter assembly 67 toward light beam exit opening 62c.
- Optic fiber portion 80 is located within optical path 21 at or in the vicinity of light beam exit opening 62c.
- Optic fiber portion 80 includes a focusing lens 82 and a optic fiber connector assembly 84 that includes a connector housing 86 adapted for receiving an optical fiber assembly 90.
- Optic fiber portion 80 is adapted to insure that light beam 28a is properly focused by focusing lens 82 into optical fiber assembly 90.
- Figure 11 is a simplified illustration of Fig. 10 showing the positional relationship of the optical components 66, 68, 69, 74, 82 and light beams 28a, 72a as well as optical fiber assembly 90.
- light beam 28a is received by collimating lens 66, transmitted through second diffuser 68 and beam splitter 69 to focusing lens 82 and into optical fiber assembly 90.
- the importance of using a pair of diffusers (first diffuser 32 and second diffuser 68) with cuvette module 43 in between the pair of diffusers 32, 68 is that the spatial light distribution will appear the same for the blank scan and the whole blood sample scan.
- diffusers 32, 68 removes the error effect caused by nonuniformity of the light source and/or variation in the spatial distribution changes of the incident light even if the overall intensity has not changed.
- Diffusers 32, 68 are chosen so that they diffuse a ray of incident light into the full acceptance cone of the optical component group 120 of the spectrometer module 100. This effectively scrambles the ray completely across the optical measuring field.
- Calibrating light beam 72a when activated is received by collimating lens 74, transmitted to beam splitter 69 and directed to focusing lens 82 where it is focused into optical fiber assembly 90.
- Calibrating light beam 72a has specific wavelengths of light used for calibrating the wavelength scale of spectrometer module 100.
- An acceptable calibrating light source 72 is a krypton (Kr) gas discharge lamp, which provides seven Kr line wavelengths in nanometers covering the range of 422 to 695 nm.
- Prism 131 of light dispersion component 130 has a nonlinear dispersion versus wavelength that requires a polynomial or other function of a higher order.
- An embodiment of the present invention uses a 5 th order polynomial to the pixel locations of the Kr line peaks to provide residual errors well below the absolute wavelength accuracy requirement of +/- 0.03 nm.
- Optical fiber assembly 90 includes an optical fiber 92, a first optical fiber connector 94 and a second optical fiber connector 96 (shown in Fig. 12 ).
- First optical fiber connector 94 is secured to a light receiving end 92a of optical fiber 92 and directly and removably connects to connector housing 86 of optic fiber connector assembly 84.
- One embodiment of optical fiber 92 includes a 200 ⁇ m silica core fiber with a numerical aperture (NA) of 0.22.
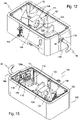
- Spectrometer module 100 includes a spectrometer housing 102, a spectrometer base 104, a spectrometer cover 106 (shown in Fig. 1 ), an optical fiber housing end 108, and an electrical signal output coupler 103.
- Spectrometer module 100 has an outside envelope dimension of 11 cm x 8 cm x 2 cm and optionally includes thermal compensation structures discussed later.
- spectrometer housing 102 Within spectrometer housing 102 are contained the essential components of spectrometer module 100. These components include a light-receiving and converting assembly 110 and an optical component group 120.
- Optical component group 120 includes an achromatic lens assembly 121 and a light dispersing element 130.
- Light dispersing element 130 may be a prism 131 or a grating 136.
- Optical fiber assembly 90 is removably secured to optical fiber housing end 108 at light entrance port 109, which optical fiber assembly 90 transmits the light beams 28a, 72a to spectrometer module 100.
- light beam 28a represents the light transmitted from light-emitting module 22 through cuvette module 43
- light beam 72a is the calibrating light transmitted from calibrating light module 60, which is used to calibrate spectrometer module 100.
- Achromatic lens assembly 121 includes a lens mount 122 and a spherical achromatic lens 124.
- Achromatic lens 124 receives light beams 28a, 72a, as the case may be, and directs the light beam to light dispersion element 130, which in this embodiment is prism 131.
- Prism 131 has a reflective coating 132 on an outside back surface. Prism 130 refracts light beam 28a and reflects the light back through achromatic lens 124.
- Light-receiving and converting assembly 110 is securely mounted adjacent an inside surface 108a of optical fiber housing end 108.
- Light-receiving and converting assembly 110 includes a circuit board substrate 112 upon which is mounted a light input slit 114 that is aligned with light-emitting end 92b (not shown) of optical fiber 92.
- Adjacent input slit 114 is a light-array detector 116 that receives the refracted light from prism 131.
- Light-array detector 116 converts the refracted light to an electrical signal, which is output through output connector 118 to processor module 150.
- Providing light input slit 114 and light-array detector 116 adjacent each other on circuit board 112 has several advantages.
- This feature greatly simplifies the construction and improves the precision of spectrometer module 100.
- Other spectrometers place these items on separate planes, where they have separate mounting structures, and have to be adjusted independently.
- This feature of mounting the input slit and light-array detector adjacent each other on circuit board 112 eliminates the need to mount and position each structure (i.e. slit and detector) separately.
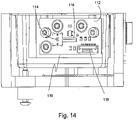
- Figure 14 is an enlarged view of light-receiving and converting assembly 110.
- Light input slit 114 is 15 ⁇ m wide by 1000 ⁇ m long that projects an optical fiber-slit image that is a rectangle approximately 15 ⁇ m wide by 200 ⁇ m high onto the light-array detector 116 (Hamamatsu S10226-10 is an example of a usable light array detector).
- Input slit 114 is applied directly onto the same circuit board substrate 112 as and in close proximity to light-array detector 116.
- Light-array detector 116 has a pixel height between about 100 to about 150 ⁇ m, which allows a one-to-one imaging of the 200 ⁇ m diameter optical fiber onto the detector.
- input slit 114 is laser etched in a precise position relative to light-array detector 116 making alignment less labor intensive. Because input slit 114 and light-array detector 116 are only slightly off-axis relative to the center axis of the achromatic lens 124, there is minimal aberration and a one-to-one imaging on light-array detector 116 is possible so that no cylindrical focusing lens is required to shrink the optical fiber image (200 ⁇ m diameter fiber) to match the pixel height of light-array detector 116.
- FIG. 15 there is a top view of spectrometer module 100 of Fig. 13 .
- light beam 28a enters spectrometer module 100 through input slit 114 toward achromatic lens 124.
- Achromatic lens 124 is used off-axis; that is, the achromatic lens is slightly off-axis to the light beam 28a.
- Light beam 28a is transmitted by achromatic lens 124 to prism 131, where light beam 28a is refracted into a plurality of light beams 138a, 138b, 138c of different wavelengths as prisms are ought to do.
- the plurality of light beams 138a, 138b, 138c are reflected by prism 131 back through achromatic lens 124.
- Achromatic lens 124 is used off-axis in order to direct the plurality of refracted and reflected light beams 138a, 138b, 138c from prism 131 onto light-array detector 116.
- Figure 16 is an enlarged view of ray trace diagram 140.
- Achromatic lens 124 is used off-axis relative to entering light beam 28a.
- achromatic lens 124 off-axis along with prism 131 having a reflective coating 132 on a base of prism 131 there is achieved a compact, simplified, minimal-component spectrometer module 100 capable of being used for measuring hemoglobin parameters and/or total bilirubin parameters in whole blood.
- a change in temperature has a greater effect on beam refraction angle when using a prism instead of a diffraction grating.
- a thermal-compensating means 160 is provided to compensate for a thermal shift in the incoming light beam caused by the light-dispersing element 130.
- a temperature change within spectrometer module 100 causes a thermally-induced movement of the slit image from input slit 114 on light-array detector 116 caused in turn by thermally-induced changes in refractive index of the dispersive prism 131.
- Fig. 16 shows the direction of movement of the image on light-array detector 116 for the thermal refractive index change in prism 131 with arrow 400.
- the thermal-compensating means 160 may be a simple as wrapping spectrometer module 100 with insulation to minimize temperature change within spectrometer module 100 from a temperature change occurring outside of spectrometer module 100 or to place spectrometer module 100 within a temperature controlled space.
- a temperature controller assembly 170 that includes at least a ribbon heater 172 attached to an inside surface or an outside surface of the spectrometer housing 102 and a temperature sensor 174 such as thermocouple or thermistor to measure the temperature of the spectrometer housing and a heater circuit to maintain a predefined constant temperature.
- a temperature controller assembly 170 that includes at least a ribbon heater 172 attached to an inside surface or an outside surface of the spectrometer housing 102 and a temperature sensor 174 such as thermocouple or thermistor to measure the temperature of the spectrometer housing and a heater circuit to maintain a predefined constant temperature.
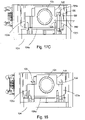
- Figure 17A and 17B illustrate these possibilities.
- achromatic lens mount 122 is a thermal-compensating lens mount.
- Thermal-compensating lens mount 122 has a fixed mount end 122a and an unfixed mount end 122b.
- Fixed mount end 122a is fixedly secured to spectrometer base 104 or a baseplate 104a that is securely attached to spectrometer base 104.
- Unfixed mount end 122b typically has a fastener 126 that extends through a lens mount slot 122c of lens mount 122 and into spectrometer base 104 or baseplate 104a.
- Between a head 126a of fastener 126 and lens mount 122 is a hold-down spring 128.
- lens mount slot 122c and fastener 126 there is sufficient spacing between lens mount slot 122c and fastener 126 to permit expansion/contraction of lens mount 122 caused by a temperature change.
- the coefficient of expansion of lens mount 122 is greater than the coefficient of expansion of spectrometer base 104 and/or baseplate 104a so that unfixed mount end 122b permits thermal expansion and contraction of thermal-compensating lens mount 122 in a direction shown by arrow 500, which is linear and transverse to the light beam from input slit 114.
- This structure allows achromatic lens 124 to slide relative to other components mounted on baseplate 104a and/or spectrometer base 104.
- Thermal-compensated lens mount 122 ensures that the plurality of light beams 138a, 138b, 138c will always impinge with sufficient intensity onto light-array detector 116 without affecting the electrical signal generated by light-array detector 116 notwithstanding a temperature change within spectrometer housing 102.
- One such material that meets the requirement that lens mount 122 have a greater coefficient of expansion than spectrometer base 104 and/or baseplate 104a (as the case may be) is a plastic that is a modified polyphenylene ether (PPE) resin consisting of amorphous blends of polyphenylene oxide (PPO) polyphenylene ether (PPE) resin and polystyrene sold under the trademark NORYL ® .
- PPE modified polyphenylene ether
- FIG 18 illustrates an alternative embodiment of lens mount 122.
- lens mount 122 has two fixed mount ends 122a, where each end 122a is secured to baseplate 104a and/or spectrometer base 104 by fastener 126. Because both ends 122a of lens mount 122 are fixed, any temperature change within spectrometer module 100 will affect angle of the plurality of light beams 138a, 138b, 138c and where they impinge on light-array detector 116. As previously disclosed regarding the slit image and the length of the light-array detector 116, a temperature change of greater than 0.5°C will cause the intensity of one of the light beams to not impinge completely on the light-array detector thereby causing an inaccurate reading.
- spectrometer module 100 is equipped with a temperature controller assembly (not shown) so that prism 131 and achromatic lens assembly 121 remain at a constant temperature.
- a temperature controller assembly to accomplish this is a ribbon heater with a thermistor (not shown) adhesively attached to the inside or outside of spectrometer module 100, which ribbon heater is controlled by an electronic regulation circuit (not shown).
- spectrometer module 100 may also be insulated either inside or outside or both to more easily maintain a given temperature and protect against changes in temperature in the vicinity surrounding spectrometer module 100.
- Other mechanisms include placement of spectrometer module 100 within a temperature controlled environment.
- a data set of about 180 blood samples from approximately 15 different individuals was developed.
- the blood samples were manipulated using sodium nitrite to raise MetHb values, and using CO gas to raise COHb values.
- Plasma was removed from or added to samples to change the tHb level.
- Bilirubin spiking solution was added to vary the tBil level.
- a tonometer was used to manipulate the oxygen level.
- the blood samples were manipulated to cover a large range of analyte values. The blood samples were then measured on a reference lysing pHOx Ultra analyzer equipped with COOx analyzer and analysis software.
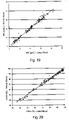
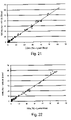
- the next step in the calculation is to create a prediction model.
- Three models were developed for the analysis: one for the COOx parameters tHb and COHb, a second for HHb and MetHb, and a third for tBil.
- the quantity for O2Hb was determined by subtracting COHb, HHb, and MetHb from 100%.
- the X-data array was constructed from terms created from the measured absorbance at the wavelengths between 462-650 nm, 1 nm spacing.
- the tBil model was developed using the same set of data as the COOx model, except that samples with MetHb values greater than or equal to 20% were left out of the model.
- Y-predictive values were assigned (O2Hb, HHb, COHb, MetHb, tBil) with tHb determined by adding the results for O2Hb, HHb, COHb, and MetHb.
- the number of Y-orthogonal values needed was determined by manual optimization of the correlation residual of the mapping function blood predictions with the reference analyzer values.
- the calibration sequence of a machine learning algorithm establishes a relationship between a matrix of known sample characteristics (the Y matrix) and a matrix of measured absorbance values at several wavelengths and potentially other measured values based on absorbance versus wavelength (the X matrix). Once this relationship is established, it is used by the analyzer to predict the unknown Y values from new measurements of X on whole blood samples.
- Table 1 summarizes the settings and inputs used for the optimized models.
- the X-data consists of the absorbance and other terms based on absorbance vs. wavelength. In the process of optimizing the model, absorbance derivatives vs. wavelength were added. Models for analytes more sensitive to nonlinear scatter effects were built up with square root terms of the absorbance and its derivative. The model for analytes more affected by scatter had a correction term proportional to the fourth power of the wavelength.
- the X-vector row has one value for each wavelength for each of the three absorbance-based terms f , g, and h shown in the table for each model.
- Table 1 Parameters used to construct algorithm models (KOPLS method).
- f , g , h are the absorbance-based functions listed in Table 1 versus wavelength, respectively.
- the matrix X includes contributions from absorbance at the various wavelengths.
- the scope of the invention includes optionally adding other measurements to the calculation to reduce interferent effects.
- mapping function is computed according to the procedures particular to the machine learning algorithm chosen.
- KOPLS Kernel-Based Orthogonal Projection to Latent Structures
- KOPLS has an additional advantage over other calculations such as, for example, conventional partial least squares because it can not only establish a relationship between quantified variations and analyte values to be determined, but can also remove unquantitated yet consistently present variation in the original data. These unquantitated variations might be due to analyzer and/or blood effects such as scatter losses and other interfering phenomena that are not explicitly measured.
- the KOPLS model uses an initial training data set to establish a relationship (mapping function) between the matrix of known sample characteristics (the H matrix) , and a matrix of measured absorbance values at several wavelengths and potentially other measured values based on absorbance versus wavelength (the X matrix) as processed through a kernel function as specified by the KOPLS method. Once the KOPLS coefficients of this relationship are established, they are used with the kernel function by the analyzer to predict the unknown hemoglobin parameter values from new measurements of absorbance on samples.
- mapping function Once the set of training coefficients, or mapping function, is established, it is used to predict the hemoglobin parameter values and/or total bilirubin parameter values of a blood sample from future measurements.
- a single-row X matrix is created from the new measurements, then the value from this single-row X matrix is put through the kernel and mapping functions to produce the hemoglobin parameter values and/or total bilirubin parameter values according to the procedures necessary for the mapping function used according to the KOPLS procedures described in detail in the KOPLS references disclosed previously.
- Cross-validation is a process for using a data set to test a method. Several data rows are set aside and the rest are used to create a mapping function. The set-aside values are then used as "new" measurements and their Y matrix values calculated. This process is repeated by setting aside other measured values and computing another mapping function. By plotting the known values of the blood data vs. the calculated, the effectiveness of the method may be ascertained by inspecting the plot.
- FIGS 18-23 there are illustrated graphical plots of the correlation results comparing the various hemoglobin parameters of lysed blood to whole blood using the KOPLS method.
- the blood samples were manipulated to cover a large range of analyte values.
- the technique of n-fold cross-validation using 60 folds was used to test the data.
- the process is repeated 60 times for each group. Every data point is thus predicted using a model made from most of the other data points, without being included in the model.
- Fig. 19 shows the correlation results for tHb using the K-OPLS method.
- the horizontal axis has units representing the total hemoglobin in grams per deciliter of lysed blood.
- the vertical axis has units representing total hemoglobin in grams per deciliter of whole blood.
- the method of determining tHb of a whole blood sample has a correlation of greater than 99%.
- Fig. 20 shows the correlation results for O2Hb using the K-OPLS method.
- the horizontal axis has units representing the percent oxyhemoglobin of lysed blood.
- the vertical axis has unit representing percent oxyhemoglobin of whole blood.
- the method of determining O2Hb of a whole blood sample has a correlation of greater than 99%.
- Fig. 21 shows the correlation results for carboxyhemoglobin using the K-OPLS method.
- the horizontal axis has units representing the percent carboxyhemoglobin of lysed blood.
- the vertical axis has unit representing percent carboxyhemoglobin of whole blood.
- the method of determining COHb of a whole blood sample has a correlation of greater than 99%.
- Fig. 22 shows the correlation results for deoxyhemoglobin using the KOPLS method.
- the horizontal axis has units representing the percent deoxyhemoglobin of lysed blood.
- the vertical axis has unit representing percent deoxyhemoglobin of whole blood.
- the method of determining HHb of a whole blood sample has a correlation of greater than 99%.
- Fig. 23 shows the correlation results for methemoglobin using the KOPLS method.
- the horizontal axis has units representing the percent methemoglobin of lysed blood.
- the vertical axis has unit representing percent methemoglobin of whole blood. As seen from the plot, the method of determining MetHb of a whole blood sample has a correlation of greater than 99%.
- Fig. 24 shows the correlation results for tBil using the K-OPLS method.
- the horizontal axis has units representing the total bilirubin in milligrams per deciliter of lysed blood.
- the vertical axis has units representing total bilirubin in milligrams per deciliter of whole blood.
- the method of determining tBil of a whole blood sample has a correlation of greater than 99%.
- An absorbance scan is measured by first recording a transmitted light intensity scan with cuvette module 43 filled with a transparent fluid such as water or analyzer flush solution otherwise known as the 'blank' scan. Then a transmitted light intensity scan with cuvette module 43 filled with the whole blood sample is recorded. After corrections for spectrometer dark response and detector linearity, the spectral absorbance is the negative of the logarithm to the base ten of the ratio of the whole blood scan to the transparent fluid scan computed at each wavelength in the measurement range.
- a depiction of the components of a COOx analyzer subsystem is shown in Figs. 1-18 .
- This subsystem embodiment measures the optical absorbance of liquids introduced into cuvette module 43.
- the light used to perform the absorbance measurement originates from LED light source 28, is collected and transmitted by collimating lens 30, passes through first diffuser 32, circular polarizer 34, focusing lens 36, and optional protective window 38 before reaching cuvette module 43.
- Critical to an absolute absorbance measurement is knowledge of the cuvette path length.
- the cuvette path length is pre-measured for each individual cuvette module 43 and programmed into an electronic chip 48c on cuvette module 43.
- the path length information is read/retrieved by data processor module 130 of the analyzer whenever required.
- the light After passing through cuvette module 43, the light is collected by lens 66, collimated and sent through second diffuser 68 and beam splitter 69.
- the purpose of beam splitter 69 is to allow light from calibrating light source 72 (for example, a krypton gas-discharge lamp), collimated by lens 74, to enter optical path 21.
- Calibrating light source 72 provides light at a few known wavelengths, which are used to periodically recalibrate the wavelength scale of spectrometer module 100.
- the light After passing through the beam splitter 69, the light is focused by lens 82 onto an optical fiber 92.
- the optical fiber 92 guides the light to input slit 114 of spectrometer module 100.
- Light-array detector 116 converts the light energy into an electrical signal which represents the spectral intensity of the light. The electrical signal is sent to data processor module 150 for further processing and display of the final results to the user.
- Light-receiving and converting assembly 110 is a single board that holds input slit 114 and light-array detector 116 in close proximity as an integrated unit.
- Input slit 114 is applied directly onto the same circuit board substrate 112 as and in close proximity to light-array detector 116.
- Other prior art spectrometers place these components on separate planes where they have separate mounting structures needing independent adjustment and alignment.
- the mounting scheme has several advantages that lower the cost and size of spectrometer module 100: 1) cost of separate mounting structures is avoided, 2) input slit 114 can be laser etched in a precise position relative to light-array detector 116 making alignment less labor intensive, 3) inexpensive spherical surface optics can be used in the optical system since the image of the slit on the detector is only slightly off-axis from the center axis of the optical system, minimizing aberration, and 4) a single alignment procedure for a unified slit and detector assembly replaces alignment procedures for two separate assemblies.
- first diffuser 32 and second diffuser 68 are positioned before and after cuvette module 43, respectively.
- Optical absorbance measurement of a diffuse sample presents a unique problem.
- the diffuse transmittance of the sample scrambles the initial spatial light distribution of the measurement system caused by the nonuniformity typical of light sources.
- the spatial light distribution of the 'blank' scan can be quite different from the whole blood sample scan. Since optical detectors have response that varies spatially, the response can vary due to spatial distribution changes of the incident light, even if the overall intensity has not changed.
- An absorbance scan which is based on the ratio of the sample scan to the blank scan will have a significant absorbance component due to this effect in addition to the absorbance due to the sample alone. This results in a significant measurement error of the sample absorbance that is intolerable for cooximetry.
- the advantage of placing cuvette module 43 between first and second diffusers 32, 68 is that the spatial light distribution will appear the same for the blank and sample scans, removing this error effect.
- Diffusers 32, 68 are specially chosen so that they diffuse a ray of incident light into the full acceptance cone of the optical system, but not more so, so that as much light throughput as possible may be preserved while scrambling the light ray completely across the field.
Landscapes
- Physics & Mathematics (AREA)
- Spectroscopy & Molecular Physics (AREA)
- Health & Medical Sciences (AREA)
- Life Sciences & Earth Sciences (AREA)
- General Physics & Mathematics (AREA)
- Engineering & Computer Science (AREA)
- Pathology (AREA)
- General Health & Medical Sciences (AREA)
- Chemical & Material Sciences (AREA)
- Biochemistry (AREA)
- Immunology (AREA)
- Analytical Chemistry (AREA)
- Biomedical Technology (AREA)
- Molecular Biology (AREA)
- Biophysics (AREA)
- Hematology (AREA)
- Animal Behavior & Ethology (AREA)
- Heart & Thoracic Surgery (AREA)
- Veterinary Medicine (AREA)
- Public Health (AREA)
- Surgery (AREA)
- Medical Informatics (AREA)
- Optics & Photonics (AREA)
- Mathematical Physics (AREA)
- Theoretical Computer Science (AREA)
- Urology & Nephrology (AREA)
- Ecology (AREA)
- Medicinal Chemistry (AREA)
- Food Science & Technology (AREA)
- Investigating Or Analysing Materials By Optical Means (AREA)
- Investigating Or Analysing Biological Materials (AREA)
- Optical Measuring Cells (AREA)
Claims (5)
- Système de mesure d'absorbance optique (10) pour mesurer des paramètres d'hémoglobine du sang total comprenant :un module d'échantillonnage optique (20) comprenant :un module électroluminescent (22) ayant une source de lumière à DEL (28) apte à émettre de la lumière dans laquelle la lumière est dirigée, définissant ainsi un trajet optique (21) ;un ensemble cuvette remplaçable (40) adjacent au module électroluminescent (22), dans lequel l'ensemble cuvette (40) est adapté pour recevoir un échantillon de sang total et comprend un substrat de cuvette (41) et un module de cuvette (4, 3) sur le substrat de cuvette (41), le module de cuvette (43) comprenant une première partie de cuvette (44) et une seconde partie de cuvette (52) liées ensemble, la première partie de cuvette (41) ayant un creux de réception d'échantillon (45), une premier fenêtre de cuvette (49) et un ensemble puce électronique (48) et la seconde partie de cuvette (52) ayant une seconde fenêtre de cuvette (52), dans lequel le creux de réception d'échantillon (45) de la première partie de cuvette (44) et la seconde partie de cuvette partie (52) forment une chambre de réception d'échantillon (54) avec la première fenêtre de cuvette (49) et la seconde fenêtre de cuvette (52) alignée avec la première fenêtre de cuvette (49), la chambre de réception d'échantillon (54) étant disposée dans le trajet optique (21) pour recevoir la lumière de la source de lumière à DEL (28), la distance entre la première fenêtre de cuvette (49) et la seconde fenêtre de cuvette (52) définissant une longueur de trajet optique (43a) de la chambre de réception d'échantillon (54), et dans lequel une puce électronique (48c) de l'ensemble puce électronique (48) comprend la longueur de trajet optique (43a) de la chambre de réception d'échantillon (54) pré-mesurée et programmée dans la puce électronique (48c) ;un premier diffuseur optique (32) positionné à l'intérieur du trajet optique (21) entre la source de lumière à DEL (28) et l'ensemble cuvette remplaçable (40) ;un module de lumière d'étalonnage (60) après le module de cuvette remplaçable (40) ayant un séparateur de faisceau (69) et une source de lumière d'étalonnage (72) avec une ou plusieurs longueurs d'onde de lumière connues, le module de lumière d'étalonnage (60) étant apte à émettre une lumière d'étalonnage (72a) transversalement au trajet optique (21) dans le trajet optique (21) au niveau du séparateur de faisceau (69) ; etun second diffuseur optique (68) positionné à l'intérieur du trajet optique (21) en aval de l'ensemble cuvette remplaçable (40) et en amont du séparateur de faisceau (69) ;une fibre optique (92) ayant une extrémité de réception de lumière (92a) et une extrémité d'émission de lumière (92b), l'extrémité de réception de lumière (92a) étant connectée optiquement au module de lumière d'étalonnage (60) en aval du séparateur de faisceau (69) dans laquelle l'extrémité de réception de lumière (92a) reçoit la lumière émise le long du trajet optique (21) et conduit la lumière vers l'extrémité d'émission de lumière (92b) ;un module spectromètre (100) apte à recevoir la lumière de l'extrémité d'émission de lumière (92b) de la fibre optique (92), à séparer la lumière en une pluralité de faisceaux lumineux, chaque faisceau lumineux ayant une longueur d'onde différente, et à convertir la pluralité de faisceaux lumineux en un signal électrique ; etun module processeur (150) apte à(1) obtenir la longueur de trajet optique pré-mesurée de la chambre de réception d'échantillon (54) à partir de la puce électronique (48c) et(2) recevoir et à traiter le signal électrique provenant du module spectromètre (100) généré pour un échantillon de sang total et, avec la longueur de trajet optique obtenue de la chambre de réception d'échantillon (54), à transformer le signal électrique en un signal de sortie utilisable pour afficher et rapporter des valeurs de paramètres d'hémoglobine et/ou des valeurs de paramètres de bilirubine totale pour l'échantillon de sang total.
- Système de mesure d'absorbance optique (10) selon la revendication 1, dans lequel le module électroluminescent (22) comprend une pluralité de composants optiques (B) disposés dans le trajet optique (21) entre la source de lumière à DEL (28) et l'ensemble cuvette (40), la pluralité de composants optiques (B) comprend au moins le premier diffuseur optique (32) et un ou plusieurs éléments parmi une lentille de collimation (30), un polariseur circulaire (34) et une lentille de focalisation (36).
- Système de mesure d'absorbance optique (10) selon la revendication 1, dans lequel le module spectromètre (100) comprend :une fente d'entrée (114) positionnée dans le trajet optique (21) pour recevoir la lumière émise à partir de l'extrémité d'émission de lumière (92b) de la fibre optique (92) et pour transmettre la lumière à travers cette dernière ;un groupe de composants optiques (120) ayant une lentille achromatique (124) et un élément de dispersion de lumière (130) dans lequel l'élément de dispersion de lumière (130) est disposé dans le trajet optique (21) dans lequel l'élément de dispersion de lumière (130) est apte à recevoir la lumière transmise à travers la fente d'entrée (114) et la lentille achromatique (124), à séparer la lumière en la pluralité de faisceaux lumineux, chaque faisceau lumineux ayant une longueur d'onde différente, et à rediriger la pluralité de faisceaux lumineux à travers la lentille achromatique (124) vers la fente d'entrée (114) mais décalés de cette dernière ; etun détecteur à réseau lumineux (116) apte à recevoir la pluralité de faisceaux lumineux et à convertir la pluralité de faisceaux lumineux en un signal électrique.
- Procédé de mesure de paramètres d'hémoglobine du sang total malgré une forte diffusion optique provoquée par le sang total, le procédé comprenant :la fourniture d'une source de lumière à DEL (28) avec une plage spectrale d'environ 422 nm à environ 695 nm ;le guidage de la lumière ayant la plage spectrale à partir de la source de lumière à DEL (28) le long d'un trajet optique (21) ;la fourniture d'un module de cuvette remplaçable (43) comprenant un substrat de cuvette (41) et un module de cuvette (43) sur le substrat de cuvette (41) par liaison ensemble d'une première partie de cuvette (44) et d'une seconde partie de cuvette (52), la première partie de cuvette (41) ayant un creux de réception d'échantillon (45), une première fenêtre de cuvette (49) et un ensemble puce électronique (48) et la seconde partie de cuvette (52) ayant une seconde fenêtre de cuvette (52), dans lequel le creux de réception d'échantillon (45) de la première partie de cuvette (44) et la seconde partie de cuvette (52) forment une chambre de réception d'échantillon (54) avec la première fenêtre de cuvette (49) et la seconde fenêtre de cuvette (52) alignée avec la première fenêtre de cuvette (49) est disposée dans le trajet optique (21), la distance entre la première fenêtre de cuvette (49) et la seconde fenêtre de cuvette (52) définissant une longueur de trajet optique de la chambre de réception d'échantillon (54) qui est pré-mesurée et stockée sur une puce électronique (48c) de l'ensemble puce électronique (48) du module de cuvette (43), dans lequel la seconde fenêtre de cuvette (52) du module de cuvette (43) transmet la lumière à travers la chambre de réception d'échantillon (54) et à travers la première fenêtre de cuvette (49) dans lequel la chambre de réception d'échantillon (54) contient un échantillon de sang total ;la fourniture d'une paire de premier et second diffuseurs optiques (32, 68) disposés dans le trajet optique (21), la première fenêtre de cuvette (49) et la seconde fenêtre de cuvette (52) de la chambre de réception d'échantillon (54) du module de cuvette (43) étant disposées entre la paire de premier et second diffuseurs optiques (32, 68) ;la fourniture d'une source de lumière d'étalonnage (72) après le module de cuvette remplaçable (43) apte à émettre un faisceau lumineux d'étalonnage (72a) dans le trajet optique (21) au niveau d'un séparateur de faisceau (69) transversal au trajet optique (21) ;le guidage de la lumière du trajet optique (21) après le second diffuseur (68) dans un spectromètre (100) ayant un élément de dispersion de lumière (130) qui sépare la lumière en une pluralité de faisceaux lumineux, chaque faisceau lumineux ayant une longueur d'onde différente et qui convertit la pluralité de faisceaux lumineux en un signal électrique ;l'obtention de la longueur du trajet optique pré-mesurée et stockée de la chambre de réception d'échantillon (54) à partir de la puce électronique (48c) ; etle traitement du signal électrique provenant du module spectromètre (100) généré pour l'échantillon de sang total et, avec la longueur de trajet optique obtenue de la chambre de réception d'échantillon (54), la transformation du signal électrique en un signal de sortie utilisable pour afficher et rapporter des valeurs de paramètre d'hémoglobine et/ou des valeurs de paramètres de bilirubine totale de l'échantillon de sang total.
- Procédé selon la revendication 4, dans lequel l'étape de traitement comprend en outre le traitement du signal électrique en absorbance spectrale, puis le mappage de l'absorbance spectrale sur les valeurs de paramètres d'hémoglobine et/ou les valeurs de paramètres de bilirubine à l'aide d'une fonction de mappage informatique, et, comprend l'utilisation d'une fonction de mappage de projection orthogonale basée sur le noyau sur des structures latentes en tant que fonction de mappage informatique.
Priority Applications (4)
| Application Number | Priority Date | Filing Date | Title |
|---|---|---|---|
| EP22174613.4A EP4067869B1 (fr) | 2016-02-04 | 2016-02-04 | Groupe de composants optique a utiliser dans un module de spectrometre |
| EP22174620.9A EP4071460A1 (fr) | 2016-02-04 | 2016-02-04 | Un assemblage de cuvette remplaçable |
| EP22174592.0A EP4067867A1 (fr) | 2016-02-04 | 2016-02-04 | Module électrolumineux |
| EP22174601.9A EP4067868A1 (fr) | 2016-02-04 | 2016-02-04 | Un module de calibrage de la lumière |
Applications Claiming Priority (1)
| Application Number | Priority Date | Filing Date | Title |
|---|---|---|---|
| PCT/US2016/016560 WO2017135952A1 (fr) | 2016-02-04 | 2016-02-04 | Système d'analyte et procédé de détermination de paramètres de l'hémoglobine dans le sang total |
Related Child Applications (8)
| Application Number | Title | Priority Date | Filing Date |
|---|---|---|---|
| EP22174620.9A Division-Into EP4071460A1 (fr) | 2016-02-04 | 2016-02-04 | Un assemblage de cuvette remplaçable |
| EP22174620.9A Division EP4071460A1 (fr) | 2016-02-04 | 2016-02-04 | Un assemblage de cuvette remplaçable |
| EP22174592.0A Division-Into EP4067867A1 (fr) | 2016-02-04 | 2016-02-04 | Module électrolumineux |
| EP22174592.0A Division EP4067867A1 (fr) | 2016-02-04 | 2016-02-04 | Module électrolumineux |
| EP22174601.9A Division EP4067868A1 (fr) | 2016-02-04 | 2016-02-04 | Un module de calibrage de la lumière |
| EP22174601.9A Division-Into EP4067868A1 (fr) | 2016-02-04 | 2016-02-04 | Un module de calibrage de la lumière |
| EP22174613.4A Division EP4067869B1 (fr) | 2016-02-04 | 2016-02-04 | Groupe de composants optique a utiliser dans un module de spectrometre |
| EP22174613.4A Division-Into EP4067869B1 (fr) | 2016-02-04 | 2016-02-04 | Groupe de composants optique a utiliser dans un module de spectrometre |
Publications (3)
| Publication Number | Publication Date |
|---|---|
| EP3411689A1 EP3411689A1 (fr) | 2018-12-12 |
| EP3411689A4 EP3411689A4 (fr) | 2020-01-22 |
| EP3411689B1 true EP3411689B1 (fr) | 2022-07-06 |
Family
ID=59499943
Family Applications (5)
| Application Number | Title | Priority Date | Filing Date |
|---|---|---|---|
| EP22174601.9A Pending EP4067868A1 (fr) | 2016-02-04 | 2016-02-04 | Un module de calibrage de la lumière |
| EP16889601.7A Active EP3411689B1 (fr) | 2016-02-04 | 2016-02-04 | Système et procédé de mesure d'absorption optique de sang total |
| EP22174620.9A Pending EP4071460A1 (fr) | 2016-02-04 | 2016-02-04 | Un assemblage de cuvette remplaçable |
| EP22174592.0A Pending EP4067867A1 (fr) | 2016-02-04 | 2016-02-04 | Module électrolumineux |
| EP22174613.4A Active EP4067869B1 (fr) | 2016-02-04 | 2016-02-04 | Groupe de composants optique a utiliser dans un module de spectrometre |
Family Applications Before (1)
| Application Number | Title | Priority Date | Filing Date |
|---|---|---|---|
| EP22174601.9A Pending EP4067868A1 (fr) | 2016-02-04 | 2016-02-04 | Un module de calibrage de la lumière |
Family Applications After (3)
| Application Number | Title | Priority Date | Filing Date |
|---|---|---|---|
| EP22174620.9A Pending EP4071460A1 (fr) | 2016-02-04 | 2016-02-04 | Un assemblage de cuvette remplaçable |
| EP22174592.0A Pending EP4067867A1 (fr) | 2016-02-04 | 2016-02-04 | Module électrolumineux |
| EP22174613.4A Active EP4067869B1 (fr) | 2016-02-04 | 2016-02-04 | Groupe de composants optique a utiliser dans un module de spectrometre |
Country Status (10)
| Country | Link |
|---|---|
| EP (5) | EP4067868A1 (fr) |
| JP (6) | JP6886473B2 (fr) |
| KR (1) | KR102477340B1 (fr) |
| CN (1) | CN108885166B (fr) |
| BR (1) | BR112018015948B1 (fr) |
| CA (5) | CA3220750A1 (fr) |
| ES (1) | ES2923758T3 (fr) |
| MX (1) | MX2018009526A (fr) |
| RU (1) | RU2730366C2 (fr) |
| WO (1) | WO2017135952A1 (fr) |
Families Citing this family (13)
| Publication number | Priority date | Publication date | Assignee | Title |
|---|---|---|---|---|
| CN107505266B (zh) * | 2017-08-14 | 2023-08-25 | 重庆电子工程职业学院 | 半自动光学检测分析系统 |
| US10883925B2 (en) * | 2018-09-24 | 2021-01-05 | Hf Scientific, Inc. | Spectrophotometer for use in explosive atmospheres |
| US11125738B2 (en) | 2018-11-06 | 2021-09-21 | Thermo Finnigan Llc | Blood sample analysis systems and methods |
| KR102278503B1 (ko) * | 2019-10-31 | 2021-07-16 | 주식회사 엠젠 | 분광반사 측정장치 |
| CN111537409B (zh) * | 2020-05-06 | 2022-10-14 | 南京邮电大学 | 一种高精度血沉温度补偿测量方法与装置 |
| CN111781171A (zh) * | 2020-06-12 | 2020-10-16 | 迈克医疗电子有限公司 | 体外检测样本中对象参数的测量方法、装置及设备 |
| CN111707589A (zh) * | 2020-07-10 | 2020-09-25 | 基蛋生物科技股份有限公司 | 一种hct测量装置及方法以及装有该装置的化学发光仪器 |
| CN116235039A (zh) * | 2020-08-14 | 2023-06-06 | 深圳迈瑞生物医疗电子股份有限公司 | 一种血液分析仪及血红蛋白检测方法 |
| CN114755194B (zh) * | 2022-04-15 | 2023-06-06 | 苏州赛分医疗器械有限公司 | 一种糖化血红蛋白检测器及其信号产生和处理方法 |
| CN115120249B (zh) * | 2022-05-19 | 2023-08-15 | 深圳未来脑律科技有限公司 | 一种双模态脑功能成像装置 |
| CN116359132B (zh) * | 2023-05-19 | 2023-08-15 | 无锡迅杰光远科技有限公司 | 多功能在线光谱采集装置 |
| CN116746917B (zh) * | 2023-05-24 | 2024-02-23 | 深圳京柏医疗科技股份有限公司 | 黄疸测试仪校准装置 |
| KR102623539B1 (ko) * | 2023-08-21 | 2024-01-11 | 코리아스펙트랄프로덕츠(주) | 가축분뇨 액비의 성분 분석장치 및 분석방법 |
Family Cites Families (77)
| Publication number | Priority date | Publication date | Assignee | Title |
|---|---|---|---|---|
| US1143675A (en) * | 1914-06-19 | 1915-06-22 | James L Whitney | Hemoglobinometer. |
| US2850941A (en) * | 1955-08-10 | 1958-09-09 | Welch Allyn Inc | Device for measuring light transmission |
| US3552865A (en) * | 1968-04-01 | 1971-01-05 | Beckman Instruments Inc | High pressure flow-through cuvette |
| US3569721A (en) * | 1969-01-13 | 1971-03-09 | American Optical Corp | Measuring bilirubin in blood using light at two wavelengths |
| US4057734A (en) * | 1975-08-28 | 1977-11-08 | Barringer Research Limited | Spectroscopic apparatus with balanced dual detectors |
| US4172663A (en) * | 1977-04-27 | 1979-10-30 | Board of Trustees Leland Stanford Jr., University | Optical wavelength meter |
| US4310249A (en) * | 1979-10-09 | 1982-01-12 | Miles Laboratories, Inc. | Spectrophotometer |
| JPS5928642A (ja) * | 1982-08-11 | 1984-02-15 | Hitachi Ltd | 散乱光度計 |
| DK163194C (da) * | 1988-12-22 | 1992-06-22 | Radiometer As | Fremgangsmaade ved fotometrisk in vitro bestemmelse af en blodgasparameter i en blodproeve |
| JP2837868B2 (ja) * | 1988-05-24 | 1998-12-16 | アンリツ株式会社 | 分光装置 |
| US5351686A (en) * | 1990-10-06 | 1994-10-04 | In-Line Diagnostics Corporation | Disposable extracorporeal conduit for blood constituent monitoring |
| JPH0534275A (ja) * | 1991-07-31 | 1993-02-09 | Jasco Corp | 流体成分測定装置 |
| US5371020A (en) * | 1991-09-19 | 1994-12-06 | Radiometer A/S | Method of photometric in vitro determination of the content of an analyte in a sample |
| JP2942654B2 (ja) * | 1992-03-06 | 1999-08-30 | アンリツ株式会社 | 光スペクトラムアナライザ |
| WO1994013199A1 (fr) * | 1992-12-10 | 1994-06-23 | Sunshine Medical Instruments, Inc. | Mesure non invasive de la glycemie |
| JPH06300952A (ja) * | 1993-04-13 | 1994-10-28 | Canon Inc | 走査レンズの保持構造 |
| EP0653625B1 (fr) * | 1993-11-12 | 2002-09-11 | Inverness Medical Switzerland GmbH | Dispositif de lecture des bandes d'analyse |
| US5428558A (en) * | 1993-12-17 | 1995-06-27 | The Perkin-Elmer Corporation | Correction of spectra for stray radiation |
| JP3364323B2 (ja) * | 1994-05-17 | 2003-01-08 | 謙 石原 | 非侵襲血液分析装置 |
| US5644396A (en) * | 1995-06-20 | 1997-07-01 | Hewlett-Packard Company | Spectrograph with low focal ratio |
| JPH09269299A (ja) * | 1996-03-29 | 1997-10-14 | Kirin Techno Syst:Kk | ペットボトル検査装置 |
| JP2000515778A (ja) * | 1996-07-08 | 2000-11-28 | アニマス コーポレーシヨン | 体液成分レベルの生体内測定および制御のための埋込可能センサーおよびシステム |
| CA2231305C (fr) * | 1997-03-11 | 2007-03-20 | Merrit Nyles Jacobs | Rendement ameliore d'un analyseur executant une analyse a travers la pointe |
| US5944660A (en) * | 1997-07-08 | 1999-08-31 | Optical Sensors Incorporated | Disposable cartridge assembly with optional integrated temperature control system, and systems containing same |
| JPH1184199A (ja) * | 1997-07-16 | 1999-03-26 | Nikon Corp | 鏡筒支持機構 |
| US5905824A (en) * | 1997-12-09 | 1999-05-18 | Delisle; Vincent | Temperature compensated insensitive optical multiplexor/demultiplexor |
| JP3731784B2 (ja) * | 1997-12-25 | 2006-01-05 | 富士写真フイルム株式会社 | グルコース濃度測定方法および装置 |
| EP0980518B1 (fr) * | 1998-02-10 | 2007-03-14 | Daedalus I, LLC | APPAREIL POUR LA DETERMINATION DU pH, pCO2, DE L'HEMOGLOBINE ET DE LA SATURATION EN OXYGENE DE L'HEMOGLOBINE |
| US6128519A (en) * | 1998-12-16 | 2000-10-03 | Pepex Biomedical, Llc | System and method for measuring a bioanalyte such as lactate |
| US6091502A (en) * | 1998-12-23 | 2000-07-18 | Micronics, Inc. | Device and method for performing spectral measurements in flow cells with spatial resolution |
| US6650412B1 (en) * | 1999-09-10 | 2003-11-18 | Kaiser Optical Systems | Thermal compensation for optical apparatus |
| US6215597B1 (en) * | 1999-11-17 | 2001-04-10 | Duncan Technologies, Inc. | Apparatus for forming a plurality of subimages having different characteristics |
| US20050037505A1 (en) * | 2000-05-11 | 2005-02-17 | James Samsoondar | Spectroscopic method and apparatus for analyte measurement |
| US6545826B2 (en) * | 2000-12-20 | 2003-04-08 | Finisar Corporation | Thermally compensated wavelength division demultiplexer and multiplexer and method of fabrication thereof |
| US6774368B2 (en) * | 2001-03-08 | 2004-08-10 | Baylor University | Dispersive near-infrared spectrometer with automatic wavelength calibration |
| US6989891B2 (en) * | 2001-11-08 | 2006-01-24 | Optiscan Biomedical Corporation | Device and method for in vitro determination of analyte concentrations within body fluids |
| KR100994306B1 (ko) * | 2002-03-15 | 2010-11-12 | 소니 주식회사 | 바이오 어세이용 기판, 바이오 어세이 방법, 바이오 어세이 장치 및 기판 기록 정보의 판독 장치 |
| KR20050071640A (ko) * | 2002-10-30 | 2005-07-07 | 도판 인사츠 가부시키가이샤 | 배선패턴의 검사장치, 검사방법, 검출장치, 검출방법 |
| CN1268916C (zh) * | 2002-12-12 | 2006-08-09 | 上海交通大学 | 用于十二指肠胃返流检测的传感器 |
| JP2004361289A (ja) * | 2003-06-05 | 2004-12-24 | Olympus Corp | グルコース濃度測定装置 |
| US7671974B2 (en) * | 2003-10-29 | 2010-03-02 | Chf Solutions Inc. | Cuvette apparatus and system for measuring optical properties of a liquid such as blood |
| US7333212B2 (en) | 2004-01-23 | 2008-02-19 | Chien Chou | Method and apparatus for measuring the absorption coefficient and the reduced scattering coefficient of a multiple scattering medium |
| US7245373B2 (en) * | 2004-04-26 | 2007-07-17 | University Of Massachusetts | Spectrometer system for optical reflectance measurements |
| JP2006091008A (ja) * | 2004-08-25 | 2006-04-06 | Ceratec Japan Co Ltd | 光学成分計 |
| US20060170917A1 (en) * | 2004-08-30 | 2006-08-03 | Daryoosh Vakhshoori | Use of free-space coupling between laser assembly, optical probe head assembly, spectrometer assembly and/or other optical elements for portable optical applications such as Raman instruments |
| US20060045151A1 (en) * | 2004-08-30 | 2006-03-02 | Daryoosh Vakhshoori | External cavity wavelength stabilized Raman lasers insensitive to temperature and/or external mechanical stresses, and Raman analyzer utilizing the same |
| JP2006084446A (ja) * | 2004-09-17 | 2006-03-30 | Toppan Printing Co Ltd | 配線パターンの検出装置、検出方法、検査装置、及び検査方法 |
| US7491546B2 (en) * | 2004-09-27 | 2009-02-17 | Industrial Test Systems, Inc. | Reagent delivery and photometric chlorine analysis |
| JP2006153765A (ja) * | 2004-11-30 | 2006-06-15 | Nikon Corp | 分光システム |
| US7456957B2 (en) * | 2005-08-03 | 2008-11-25 | Carl Zeiss Meditec, Inc. | Littrow spectrometer and a spectral domain optical coherence tomography system with a Littrow spectrometer |
| US9597024B2 (en) * | 2005-02-09 | 2017-03-21 | Medici Instruments Llc | Methods and apparatuses for noninvasive determinations of analytes |
| SE530896C2 (sv) * | 2005-04-01 | 2008-10-14 | Diaspect Medical Ab | Anordning för att fastställa en hemoglobinkoncentration i blod |
| JP2006350044A (ja) * | 2005-06-17 | 2006-12-28 | Yokogawa Electric Corp | 光チャネルモニタ |
| WO2007033318A2 (fr) * | 2005-09-13 | 2007-03-22 | Edwards Lifesciences Corporation | Mesure spectroscopique continue de l'hemoglobine totale |
| EP1987762A1 (fr) * | 2007-05-03 | 2008-11-05 | F.Hoffmann-La Roche Ag | Oxymetre |
| JP2009053029A (ja) * | 2007-08-27 | 2009-03-12 | Olympus Corp | 自動分析装置 |
| JP4811380B2 (ja) * | 2007-09-28 | 2011-11-09 | パナソニック株式会社 | バイオセンサを用いた測定方法 |
| JP5288768B2 (ja) | 2007-10-18 | 2013-09-11 | パナソニック株式会社 | 分析容器と分析装置 |
| JP2009121986A (ja) * | 2007-11-15 | 2009-06-04 | Omron Corp | 分光装置 |
| JP5453730B2 (ja) | 2008-04-18 | 2014-03-26 | 横河電機株式会社 | 分光器 |
| JP5556370B2 (ja) * | 2010-05-25 | 2014-07-23 | 横河電機株式会社 | 分光器およびこれを用いた光スペクトラムアナライザ |
| EP2415393B1 (fr) * | 2010-08-05 | 2016-07-27 | Nidek Co., Ltd. | Appareil ophtalmique |
| US9194792B2 (en) * | 2010-09-07 | 2015-11-24 | Fresenius Medical Care Holdings, Inc. | Blood chamber for an optical blood monitoring system |
| US20120206714A1 (en) * | 2011-02-10 | 2012-08-16 | DIRAmed | Shutter Assembly with Calibration Material |
| CN103796709B (zh) * | 2011-02-25 | 2016-10-19 | 费森尤斯医疗控股股份有限公司 | 光学血液监测系统的有罩传感器夹组件和血液腔室 |
| KR101275742B1 (ko) | 2011-06-23 | 2013-06-17 | 주식회사 아이센스 | 광학 분석용 셀 |
| DE102012205311B4 (de) * | 2012-03-30 | 2013-10-17 | Anton Paar Gmbh | Optische Vorrichtung, insbesondere Polarimeter, zur Detektion von Inhomogenitäten in einer Probe |
| US9068933B2 (en) * | 2012-06-08 | 2015-06-30 | Ut-Battelle, Llc | EGR distribution and fluctuation probe based on CO2 measurements |
| US9568362B2 (en) * | 2012-12-19 | 2017-02-14 | Viavi Solutions Inc. | Spectroscopic assembly and method |
| DK2936118T3 (da) * | 2012-12-20 | 2023-07-24 | Radiometer Medical Aps | Apparat til detektering af koncentrationen af en bestanddel i en prøve |
| JP6107254B2 (ja) * | 2013-03-14 | 2017-04-05 | セイコーエプソン株式会社 | 光学フィルターデバイス、光学モジュール、及び電子機器 |
| JP2014202555A (ja) | 2013-04-03 | 2014-10-27 | 独立行政法人産業技術総合研究所 | 耐熱性を備えた集光系 |
| US8858886B1 (en) * | 2013-05-08 | 2014-10-14 | Agilent Technologies, Inc. | Scanning system with interchangeable optical cartridges for fluorescence measurements |
| DE102013209819B4 (de) * | 2013-05-27 | 2018-01-25 | Fraunhofer-Gesellschaft zur Förderung der angewandten Forschung e.V. | Optische Struktur mit daran angeordneten Stegen und Verfahren zur Herstellung derselben |
| US9689744B2 (en) * | 2013-07-17 | 2017-06-27 | Massachusetts Institute Of Technology | Visible-infrared plane grating imaging spectrometer |
| JP2015097664A (ja) * | 2013-11-19 | 2015-05-28 | 株式会社アライ・メッドフォトン研究所 | 医療用具及び光線治療装置 |
| MX2016013984A (es) * | 2014-05-23 | 2017-04-06 | Nova Biomedical Corp | Sistema y metodo de deteccion de hemolisis. |
-
2016
- 2016-02-04 EP EP22174601.9A patent/EP4067868A1/fr active Pending
- 2016-02-04 MX MX2018009526A patent/MX2018009526A/es unknown
- 2016-02-04 RU RU2018128410A patent/RU2730366C2/ru active
- 2016-02-04 EP EP16889601.7A patent/EP3411689B1/fr active Active
- 2016-02-04 WO PCT/US2016/016560 patent/WO2017135952A1/fr active Application Filing
- 2016-02-04 KR KR1020187025571A patent/KR102477340B1/ko active IP Right Grant
- 2016-02-04 CA CA3220750A patent/CA3220750A1/fr active Pending
- 2016-02-04 CN CN201680084438.XA patent/CN108885166B/zh active Active
- 2016-02-04 JP JP2018541224A patent/JP6886473B2/ja active Active
- 2016-02-04 CA CA3013694A patent/CA3013694C/fr active Active
- 2016-02-04 EP EP22174620.9A patent/EP4071460A1/fr active Pending
- 2016-02-04 ES ES16889601T patent/ES2923758T3/es active Active
- 2016-02-04 EP EP22174592.0A patent/EP4067867A1/fr active Pending
- 2016-02-04 EP EP22174613.4A patent/EP4067869B1/fr active Active
- 2016-02-04 CA CA3220706A patent/CA3220706A1/fr active Pending
- 2016-02-04 CA CA3220899A patent/CA3220899A1/fr active Pending
- 2016-02-04 CA CA3220701A patent/CA3220701A1/fr active Pending
- 2016-02-04 BR BR112018015948-4A patent/BR112018015948B1/pt active IP Right Grant
-
2021
- 2021-05-14 JP JP2021082607A patent/JP7245284B2/ja active Active
- 2021-05-14 JP JP2021082609A patent/JP7256228B2/ja active Active
- 2021-05-14 JP JP2021082608A patent/JP7256227B2/ja active Active
- 2021-05-14 JP JP2021082610A patent/JP7266063B2/ja active Active
-
2023
- 2023-03-29 JP JP2023053866A patent/JP2023099529A/ja active Pending
Also Published As
Similar Documents
| Publication | Publication Date | Title |
|---|---|---|
| EP3411689B1 (fr) | Système et procédé de mesure d'absorption optique de sang total | |
| US10337980B2 (en) | Analyte system and method for determining hemoglobin parameters in whole blood | |
| US10088360B2 (en) | Spectroscopic analyte system and method for determining hemoglobin parameters in whole blood | |
| US9535053B1 (en) | Analyte system and method for determining hemoglobin parameters in whole blood | |
| US9638686B1 (en) | Analyte system and method for determining hemoglobin parameters in whole blood | |
| US10151630B2 (en) | Analyte system and method for determining hemoglobin parameters in whole blood | |
| US9933411B2 (en) | Analyte system and method for determining hemoglobin parameters in whole blood |
Legal Events
| Date | Code | Title | Description |
|---|---|---|---|
| STAA | Information on the status of an ep patent application or granted ep patent |
Free format text: STATUS: THE INTERNATIONAL PUBLICATION HAS BEEN MADE |
|
| PUAI | Public reference made under article 153(3) epc to a published international application that has entered the european phase |
Free format text: ORIGINAL CODE: 0009012 |
|
| STAA | Information on the status of an ep patent application or granted ep patent |
Free format text: STATUS: REQUEST FOR EXAMINATION WAS MADE |
|
| 17P | Request for examination filed |
Effective date: 20180806 |
|
| AK | Designated contracting states |
Kind code of ref document: A1 Designated state(s): AL AT BE BG CH CY CZ DE DK EE ES FI FR GB GR HR HU IE IS IT LI LT LU LV MC MK MT NL NO PL PT RO RS SE SI SK SM TR |
|
| AX | Request for extension of the european patent |
Extension state: BA ME |
|
| DAV | Request for validation of the european patent (deleted) | ||
| DAX | Request for extension of the european patent (deleted) | ||
| RIC1 | Information provided on ipc code assigned before grant |
Ipc: G01J 3/42 20060101ALI20190905BHEP Ipc: G01N 21/03 20060101ALI20190905BHEP Ipc: G01N 21/17 20060101ALI20190905BHEP Ipc: G01N 21/31 20060101ALI20190905BHEP Ipc: G01J 3/14 20060101ALI20190905BHEP Ipc: G01N 21/21 20060101ALI20190905BHEP Ipc: A61B 5/145 20060101ALI20190905BHEP Ipc: G01N 21/01 20060101AFI20190905BHEP Ipc: G01J 3/02 20060101ALI20190905BHEP Ipc: G01J 3/10 20060101ALI20190905BHEP Ipc: G01N 21/49 20060101ALI20190905BHEP Ipc: G01N 15/05 20060101ALI20190905BHEP Ipc: G01N 21/27 20060101ALI20190905BHEP |
|
| A4 | Supplementary search report drawn up and despatched |
Effective date: 20191220 |
|
| RIC1 | Information provided on ipc code assigned before grant |
Ipc: A61B 5/145 20060101ALI20191216BHEP Ipc: G01J 3/14 20060101ALI20191216BHEP Ipc: G01N 21/21 20060101ALI20191216BHEP Ipc: G01N 21/31 20060101ALI20191216BHEP Ipc: G01N 21/17 20060101ALI20191216BHEP Ipc: G01J 3/42 20060101ALI20191216BHEP Ipc: G01J 3/02 20060101ALI20191216BHEP Ipc: G01N 21/27 20060101ALI20191216BHEP Ipc: G01N 21/49 20060101ALI20191216BHEP Ipc: G01N 15/05 20060101ALI20191216BHEP Ipc: G01N 21/01 20060101AFI20191216BHEP Ipc: G01J 3/10 20060101ALI20191216BHEP Ipc: G01N 21/03 20060101ALI20191216BHEP |
|
| STAA | Information on the status of an ep patent application or granted ep patent |
Free format text: STATUS: EXAMINATION IS IN PROGRESS |
|
| STAA | Information on the status of an ep patent application or granted ep patent |
Free format text: STATUS: EXAMINATION IS IN PROGRESS |
|
| 17Q | First examination report despatched |
Effective date: 20201124 |
|
| STAA | Information on the status of an ep patent application or granted ep patent |
Free format text: STATUS: EXAMINATION IS IN PROGRESS |
|
| GRAP | Despatch of communication of intention to grant a patent |
Free format text: ORIGINAL CODE: EPIDOSNIGR1 |
|
| STAA | Information on the status of an ep patent application or granted ep patent |
Free format text: STATUS: GRANT OF PATENT IS INTENDED |
|
| RIC1 | Information provided on ipc code assigned before grant |
Ipc: G01N 33/49 20060101ALI20220119BHEP Ipc: G01N 21/21 20060101ALI20220119BHEP Ipc: G01N 21/49 20060101ALI20220119BHEP Ipc: G01N 21/31 20060101ALI20220119BHEP Ipc: G01N 21/27 20060101ALI20220119BHEP Ipc: G01N 21/03 20060101ALI20220119BHEP Ipc: G01J 3/42 20060101ALI20220119BHEP Ipc: G01J 3/14 20060101ALI20220119BHEP Ipc: G01J 3/10 20060101ALI20220119BHEP Ipc: G01J 3/02 20060101ALI20220119BHEP Ipc: A61B 5/145 20060101ALI20220119BHEP Ipc: G01N 15/05 20060101ALI20220119BHEP Ipc: G01N 21/17 20060101ALI20220119BHEP Ipc: G01N 21/01 20060101AFI20220119BHEP |
|
| INTG | Intention to grant announced |
Effective date: 20220204 |
|
| GRAS | Grant fee paid |
Free format text: ORIGINAL CODE: EPIDOSNIGR3 |
|
| GRAA | (expected) grant |
Free format text: ORIGINAL CODE: 0009210 |
|
| STAA | Information on the status of an ep patent application or granted ep patent |
Free format text: STATUS: THE PATENT HAS BEEN GRANTED |
|
| AK | Designated contracting states |
Kind code of ref document: B1 Designated state(s): AL AT BE BG CH CY CZ DE DK EE ES FI FR GB GR HR HU IE IS IT LI LT LU LV MC MK MT NL NO PL PT RO RS SE SI SK SM TR |
|
| REG | Reference to a national code |
Ref country code: AT Ref legal event code: REF Ref document number: 1503194 Country of ref document: AT Kind code of ref document: T Effective date: 20220715 Ref country code: CH Ref legal event code: EP |
|
| REG | Reference to a national code |
Ref country code: DE Ref legal event code: R096 Ref document number: 602016073424 Country of ref document: DE |
|
| REG | Reference to a national code |
Ref country code: IE Ref legal event code: FG4D |
|
| REG | Reference to a national code |
Ref country code: ES Ref legal event code: FG2A Ref document number: 2923758 Country of ref document: ES Kind code of ref document: T3 Effective date: 20220930 |
|
| REG | Reference to a national code |
Ref country code: LT Ref legal event code: MG9D |
|
| REG | Reference to a national code |
Ref country code: NL Ref legal event code: MP Effective date: 20220706 |
|
| PG25 | Lapsed in a contracting state [announced via postgrant information from national office to epo] |
Ref country code: SE Free format text: LAPSE BECAUSE OF FAILURE TO SUBMIT A TRANSLATION OF THE DESCRIPTION OR TO PAY THE FEE WITHIN THE PRESCRIBED TIME-LIMIT Effective date: 20220706 Ref country code: RS Free format text: LAPSE BECAUSE OF FAILURE TO SUBMIT A TRANSLATION OF THE DESCRIPTION OR TO PAY THE FEE WITHIN THE PRESCRIBED TIME-LIMIT Effective date: 20220706 Ref country code: PT Free format text: LAPSE BECAUSE OF FAILURE TO SUBMIT A TRANSLATION OF THE DESCRIPTION OR TO PAY THE FEE WITHIN THE PRESCRIBED TIME-LIMIT Effective date: 20221107 Ref country code: NO Free format text: LAPSE BECAUSE OF FAILURE TO SUBMIT A TRANSLATION OF THE DESCRIPTION OR TO PAY THE FEE WITHIN THE PRESCRIBED TIME-LIMIT Effective date: 20221006 Ref country code: NL Free format text: LAPSE BECAUSE OF FAILURE TO SUBMIT A TRANSLATION OF THE DESCRIPTION OR TO PAY THE FEE WITHIN THE PRESCRIBED TIME-LIMIT Effective date: 20220706 Ref country code: LV Free format text: LAPSE BECAUSE OF FAILURE TO SUBMIT A TRANSLATION OF THE DESCRIPTION OR TO PAY THE FEE WITHIN THE PRESCRIBED TIME-LIMIT Effective date: 20220706 Ref country code: LT Free format text: LAPSE BECAUSE OF FAILURE TO SUBMIT A TRANSLATION OF THE DESCRIPTION OR TO PAY THE FEE WITHIN THE PRESCRIBED TIME-LIMIT Effective date: 20220706 Ref country code: FI Free format text: LAPSE BECAUSE OF FAILURE TO SUBMIT A TRANSLATION OF THE DESCRIPTION OR TO PAY THE FEE WITHIN THE PRESCRIBED TIME-LIMIT Effective date: 20220706 |
|
| REG | Reference to a national code |
Ref country code: AT Ref legal event code: MK05 Ref document number: 1503194 Country of ref document: AT Kind code of ref document: T Effective date: 20220706 |
|
| PG25 | Lapsed in a contracting state [announced via postgrant information from national office to epo] |
Ref country code: PL Free format text: LAPSE BECAUSE OF FAILURE TO SUBMIT A TRANSLATION OF THE DESCRIPTION OR TO PAY THE FEE WITHIN THE PRESCRIBED TIME-LIMIT Effective date: 20220706 Ref country code: IS Free format text: LAPSE BECAUSE OF FAILURE TO SUBMIT A TRANSLATION OF THE DESCRIPTION OR TO PAY THE FEE WITHIN THE PRESCRIBED TIME-LIMIT Effective date: 20221106 Ref country code: HR Free format text: LAPSE BECAUSE OF FAILURE TO SUBMIT A TRANSLATION OF THE DESCRIPTION OR TO PAY THE FEE WITHIN THE PRESCRIBED TIME-LIMIT Effective date: 20220706 Ref country code: GR Free format text: LAPSE BECAUSE OF FAILURE TO SUBMIT A TRANSLATION OF THE DESCRIPTION OR TO PAY THE FEE WITHIN THE PRESCRIBED TIME-LIMIT Effective date: 20221007 |
|
| REG | Reference to a national code |
Ref country code: DE Ref legal event code: R097 Ref document number: 602016073424 Country of ref document: DE |
|
| PG25 | Lapsed in a contracting state [announced via postgrant information from national office to epo] |
Ref country code: SM Free format text: LAPSE BECAUSE OF FAILURE TO SUBMIT A TRANSLATION OF THE DESCRIPTION OR TO PAY THE FEE WITHIN THE PRESCRIBED TIME-LIMIT Effective date: 20220706 Ref country code: RO Free format text: LAPSE BECAUSE OF FAILURE TO SUBMIT A TRANSLATION OF THE DESCRIPTION OR TO PAY THE FEE WITHIN THE PRESCRIBED TIME-LIMIT Effective date: 20220706 Ref country code: DK Free format text: LAPSE BECAUSE OF FAILURE TO SUBMIT A TRANSLATION OF THE DESCRIPTION OR TO PAY THE FEE WITHIN THE PRESCRIBED TIME-LIMIT Effective date: 20220706 Ref country code: CZ Free format text: LAPSE BECAUSE OF FAILURE TO SUBMIT A TRANSLATION OF THE DESCRIPTION OR TO PAY THE FEE WITHIN THE PRESCRIBED TIME-LIMIT Effective date: 20220706 Ref country code: AT Free format text: LAPSE BECAUSE OF FAILURE TO SUBMIT A TRANSLATION OF THE DESCRIPTION OR TO PAY THE FEE WITHIN THE PRESCRIBED TIME-LIMIT Effective date: 20220706 |
|
| PGFP | Annual fee paid to national office [announced via postgrant information from national office to epo] |
Ref country code: FR Payment date: 20230217 Year of fee payment: 8 |
|
| PLBE | No opposition filed within time limit |
Free format text: ORIGINAL CODE: 0009261 |
|
| STAA | Information on the status of an ep patent application or granted ep patent |
Free format text: STATUS: NO OPPOSITION FILED WITHIN TIME LIMIT |
|
| PG25 | Lapsed in a contracting state [announced via postgrant information from national office to epo] |
Ref country code: SK Free format text: LAPSE BECAUSE OF FAILURE TO SUBMIT A TRANSLATION OF THE DESCRIPTION OR TO PAY THE FEE WITHIN THE PRESCRIBED TIME-LIMIT Effective date: 20220706 Ref country code: EE Free format text: LAPSE BECAUSE OF FAILURE TO SUBMIT A TRANSLATION OF THE DESCRIPTION OR TO PAY THE FEE WITHIN THE PRESCRIBED TIME-LIMIT Effective date: 20220706 |
|
| PGFP | Annual fee paid to national office [announced via postgrant information from national office to epo] |
Ref country code: IT Payment date: 20230126 Year of fee payment: 8 |
|
| 26N | No opposition filed |
Effective date: 20230411 |
|
| PG25 | Lapsed in a contracting state [announced via postgrant information from national office to epo] |
Ref country code: AL Free format text: LAPSE BECAUSE OF FAILURE TO SUBMIT A TRANSLATION OF THE DESCRIPTION OR TO PAY THE FEE WITHIN THE PRESCRIBED TIME-LIMIT Effective date: 20220706 |
|
| PG25 | Lapsed in a contracting state [announced via postgrant information from national office to epo] |
Ref country code: SI Free format text: LAPSE BECAUSE OF FAILURE TO SUBMIT A TRANSLATION OF THE DESCRIPTION OR TO PAY THE FEE WITHIN THE PRESCRIBED TIME-LIMIT Effective date: 20220706 |
|
| PG25 | Lapsed in a contracting state [announced via postgrant information from national office to epo] |
Ref country code: MC Free format text: LAPSE BECAUSE OF FAILURE TO SUBMIT A TRANSLATION OF THE DESCRIPTION OR TO PAY THE FEE WITHIN THE PRESCRIBED TIME-LIMIT Effective date: 20220706 |
|
| REG | Reference to a national code |
Ref country code: CH Ref legal event code: PL |
|
| REG | Reference to a national code |
Ref country code: BE Ref legal event code: MM Effective date: 20230228 |
|
| PG25 | Lapsed in a contracting state [announced via postgrant information from national office to epo] |
Ref country code: LU Free format text: LAPSE BECAUSE OF NON-PAYMENT OF DUE FEES Effective date: 20230204 Ref country code: LI Free format text: LAPSE BECAUSE OF NON-PAYMENT OF DUE FEES Effective date: 20230228 Ref country code: CH Free format text: LAPSE BECAUSE OF NON-PAYMENT OF DUE FEES Effective date: 20230228 |
|
| P01 | Opt-out of the competence of the unified patent court (upc) registered |
Effective date: 20231018 |
|
| REG | Reference to a national code |
Ref country code: IE Ref legal event code: MM4A |
|
| PG25 | Lapsed in a contracting state [announced via postgrant information from national office to epo] |
Ref country code: IE Free format text: LAPSE BECAUSE OF NON-PAYMENT OF DUE FEES Effective date: 20230204 |
|
| PG25 | Lapsed in a contracting state [announced via postgrant information from national office to epo] |
Ref country code: BE Free format text: LAPSE BECAUSE OF NON-PAYMENT OF DUE FEES Effective date: 20230228 |
|
| PGFP | Annual fee paid to national office [announced via postgrant information from national office to epo] |
Ref country code: ES Payment date: 20240307 Year of fee payment: 9 |
|
| PGFP | Annual fee paid to national office [announced via postgrant information from national office to epo] |
Ref country code: DE Payment date: 20240227 Year of fee payment: 9 Ref country code: GB Payment date: 20240124 Year of fee payment: 9 |