EP1147423B1 - Verfahren und vorrichtung zum vorhersagen von haemostatischer funktionsstörung in patientenproben - Google Patents
Verfahren und vorrichtung zum vorhersagen von haemostatischer funktionsstörung in patientenproben Download PDFInfo
- Publication number
- EP1147423B1 EP1147423B1 EP00913371A EP00913371A EP1147423B1 EP 1147423 B1 EP1147423 B1 EP 1147423B1 EP 00913371 A EP00913371 A EP 00913371A EP 00913371 A EP00913371 A EP 00913371A EP 1147423 B1 EP1147423 B1 EP 1147423B1
- Authority
- EP
- European Patent Office
- Prior art keywords
- time
- profile
- patient
- dependent measurement
- slope
- Prior art date
- Legal status (The legal status is an assumption and is not a legal conclusion. Google has not performed a legal analysis and makes no representation as to the accuracy of the status listed.)
- Expired - Lifetime
Links
- 0 **1**C*1 Chemical compound **1**C*1 0.000 description 1
Images


Classifications
-
- G—PHYSICS
- G01—MEASURING; TESTING
- G01N—INVESTIGATING OR ANALYSING MATERIALS BY DETERMINING THEIR CHEMICAL OR PHYSICAL PROPERTIES
- G01N33/00—Investigating or analysing materials by specific methods not covered by groups G01N1/00 - G01N31/00
- G01N33/48—Biological material, e.g. blood, urine; Haemocytometers
- G01N33/50—Chemical analysis of biological material, e.g. blood, urine; Testing involving biospecific ligand binding methods; Immunological testing
- G01N33/86—Chemical analysis of biological material, e.g. blood, urine; Testing involving biospecific ligand binding methods; Immunological testing involving blood coagulating time or factors, or their receptors
-
- G—PHYSICS
- G01—MEASURING; TESTING
- G01N—INVESTIGATING OR ANALYSING MATERIALS BY DETERMINING THEIR CHEMICAL OR PHYSICAL PROPERTIES
- G01N33/00—Investigating or analysing materials by specific methods not covered by groups G01N1/00 - G01N31/00
- G01N33/48—Biological material, e.g. blood, urine; Haemocytometers
- G01N33/483—Physical analysis of biological material
- G01N33/487—Physical analysis of biological material of liquid biological material
- G01N33/49—Blood
- G01N33/4905—Determining clotting time of blood
-
- Y—GENERAL TAGGING OF NEW TECHNOLOGICAL DEVELOPMENTS; GENERAL TAGGING OF CROSS-SECTIONAL TECHNOLOGIES SPANNING OVER SEVERAL SECTIONS OF THE IPC; TECHNICAL SUBJECTS COVERED BY FORMER USPC CROSS-REFERENCE ART COLLECTIONS [XRACs] AND DIGESTS
- Y02—TECHNOLOGIES OR APPLICATIONS FOR MITIGATION OR ADAPTATION AGAINST CLIMATE CHANGE
- Y02A—TECHNOLOGIES FOR ADAPTATION TO CLIMATE CHANGE
- Y02A90/00—Technologies having an indirect contribution to adaptation to climate change
- Y02A90/10—Information and communication technologies [ICT] supporting adaptation to climate change, e.g. for weather forecasting or climate simulation
Definitions
- Blood clots are the end product of a complex chain reaction where proteins form an enzyme cascade acting as a biologic amplification system. This system enables relatively few molecules of initiator products to induce sequential activation of a series of inactive proteins, known as factors, culminating in the production of the fibrin clot. Mathematical models of the kinetics of the cascade's pathways have been previously proposed.
- Thrombosis and hemostasis testing is the in vitro study of the ability of blood to form clots and to break clots in vivo.
- Coagulation (hemostasis) assays began as manual methods where clot formation was observed in a test tube either by tilting the tube or removing fibrin strands by a wire loop. The goal was to determine if a patient's blood sample would clot after certain materials were added. It was later determined that the amount of time from initiation of the reaction to the point of clot formation in vitro is related to congenital disorders, acquired disorders, and therapeutic monitoring.
- Two assays are widely used to screen for abnormalities in the coagulation system, although several other screening assays can be used, e.g. protein C, fibrinogen, protein S and/or thrombin time. If screening assays show an abnormal result, one or several additional tests are needed to isolate the exact source of the abnormality.
- the PT and APTT assays rely primarily upon measurement of time required for clot time, although some variations of the PT also use the amplitude of the change in optical signal in estimating fibrinogen concentration.
- Blood coagulation is affected by administration of drugs, in addition to the vast array of internal factors and proteins that normally influence clot formation.
- heparin is a widely-used therapeutic drug that is used to prevent thrombosis following surgery or under other cohditions, or is used to combat existing thrombosis.
- the administration of heparin is typically monitored using the APTT assay, which gives a prolonged clot time in the presence of heparin. Clot times for PT assays are affected to a much smaller degree. Since a number of other plasma abnormalities may also cause prolonged APTT results, the ability to discriminate between these effectors from screening assay results may be clinically significant.
- Baumann, et al [4] showed that a ratio of two coefficients was unique for a select group of blood factor deficiencies when fibrinogen was artificially maintained by addition of exogenous fibrinogen to a fixed concentration, and that same ratio also correlates heparin to FII deficiency and FXa deficiencies.
- the requirement for artificially fixed fibrinogen makes this approach inappropriate for analysis of clinical specimens.
- the present invention makes it possible to predict haemostatic dysfunction for clinical samples from a time-dependent measurement profile without artificial manipulation of samples.
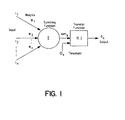
- the present invention was conceived of and developed for predicting haemostatic dysfunction in an unknown sample based on one or more time-dependent measurement profiles, such as optical time-dependent measurement profiles, where one or more predictor variables are provided which define characteristics of profile, and where in turn a model is derived that represents the relationship between the haemostatic dysfunction and the one or more predictor variables (so as to, in turn, utilize this model to predict the haemostatic dysfunction in the unknown sample).
- the present invention is directed to predicting the presence of Disseminated Intravascular Coagulation in a patient based on a time-dependent profile, such as an optical transmission profile, from a clotting assay run on the patient's blood or plasma sample.
- the present invention is directed to a method and apparatus for predicting haemostatic dysfunction from at least one time-dependent measurement profile.
- the present invention is also directed to such a method and apparatus for predicting Disseminated Intravascular Coagulation (DIC).
- the method and apparatus include a) performing at least one assay on an unknown sample and measuring a respective property over time so as to derive a time-dependent measurement profile, b) defining one or more predictor variables (one of which is slope prior to clot formation) which sufficiently define the data of the time-dependent profile, c) deriving a model that represents the relationship between a diagnostic output and the set of predictor variables, and d) utilizing the model to predict the existence of a haemosatic condition (e.g.
- training data is provided by performing a plurality of assays on known samples
- the model is a multilayer perceptron
- the relationship between the diagnostic output and the one or more predictor variable is determined by at least one algorithm
- the at least one algorithm is a back propagation learning algorithm.
- the relationship between the diagnostic output and the at least one predictor variable is derived by a set of statistical equations.
- time-dependent measurement profiles are derived, which time-dependent measurement profiles can be optical time-dependent measurement profiles such as ones provided by a automated analyzer for thrombosis and hemostasis, where a plurality of optical (e.g. optical transmission) measurements are taken over time, and where the plurality of optical measurements are normalized.
- the optical profiles can include one or more of a PT profile, a fibrinogen profile, an APTT profile, a TT profile, a protein C profile, a protein S profile and a plurality of other assays associated with haemostatic dysfunction.
- time-dependent measurement is referred to herein to include measurements derived from assays (e.g. PT, APTT, fibrinogen, protein C, protein ⁇ S, TT, ATIII, plasminogen and factor assays).
- assays e.g. PT, APTT, fibrinogen, protein C, protein ⁇ S, TT, ATIII, plasminogen and factor assays.
- unknown sample and “clinical sample” refer to a sample, such as one from a medical patient (100), where haemostatic dysfunction associated with thrombosis/hemostasis is not known (or, if suspected, has not been confirmed).
- a coagulation property is measured over time so as to derive a time-dependent measurement profile.
- the time-dependent measurement is an optical measurement for deriving an optical profile.
- a PT profile, a fibrinogen profile, a TT profile, an APTT profile and/or variations thereof can be provided where, an unknown sample is analyzed for clot formation based on light transmittance over time through the unknown sample.
- two (or more) optical profiles are provided, such as both a PT profile and an APTT profile.
- a set of predictor variables are defined (110) which sufficiently define the data of the time-dependent profile.
- One or more predictor variables comprise the set. And, in one embodiment, three or more, and in a preferred embodiment, four or more predictor variables were found to desirably make up the set.
- the characteristics of the time-dependent measurement profile could best be defined by one or more predictor variables, including the minimum of the first derivative of the optical profile, the time index of this minimum, the minimum of the second derivative of the optical profile, the time index of this minimum, the maximum of the second derivative, the time index of this maximum, the overall change in transmittance during the time-dependent measurement, clotting time, slope of the optical profile prior to clot formation, and slope of the optical profile after clot formation.
- a model (113) is derived which represents the relationship between a congenital or acquired imbalance or therapeutic condition and the set of predictor variables.
- This model can be derived from a neural network in one embodiment of the present invention. In another embodiment, the model is derived via a set of statistical equations.
- Neural networks represent a branch of artificial intelligence that can be used to learn and model complex, unknown systems given some known data (115) from which it can train.
- neural networks that make them an attractive alternative for modeling complex systems are :
- the synaptic weights are learned by adjusting their values through a learning algorithm.
- the model is utilized to predict (120) the existence of a congenital or acquired imbalance or therapeutic condition in the unknown sample relative to the time-dependent measurement profile(s).
- a congenital or acquired imbalance or therapeutic condition can be predicted.
- Conditions which can be predicted as being abnormal in the present invention can include, among others, a) factor deficiencies, e.g. fibrinogen, Factors II, V, VII, VIII, IX, X, XI and XII, as well as ATIII, plasminogen, protein C, protein S, etc., b) therapeutic conditions, e.g.
- the method is performed on an automated analyzer (90).
- the time-dependent measurement profile such as an optical data profile, can be provided automatically by the automated analyzer, where the unknown sample is automatically removed by an automated probe from a sample container to a test well, one or more reagents are automatically added to the test well so as to initiate the reaction within the sample.
- a property over time is automatically optically monitored so as to derive the optical profile.
- the predicted congenital or therapeutic condition (120) can be automatically stored in a memory (122) of an automated analyzer and/or displayed (124) on the automated analyzer, such as on a computer monitor, or printed out on paper.
- the predicted congenital or acquired imbalance or therapeutic condition (128) is an abnormal condition
- one or more assays for confirming the existence of the abnormal condition are performed on the automated analyzer.
- the one or more confirming assays are automatically ordered and performed on the analyzer once the predicted condition is determined, with the results of the one or more confirming assays being stored in a memory (131) of the automated analyzer and/or displayed (133) on the analyzer.
- This example shows a set of predictor variables that adequately describe screening assay optical profiles, develops an optimal neural network design, and determines the predictive capabilities of an abnormal condition associated with thrombosis/hemostasis (in this case for the detection of heparin) with a substantial and well-quantified test data set.
- SimplastinTM L, PlatelinTM L, calcium chloride solution (0.025 M), imidazole buffer were obtained from Organon Teknika Corporation, Durham, NC, 27712, USA. All plasma specimens were collected in 3.2% or 3.8% sodium citrate in the ratio of one part anticoagulant to nine parts whole blood. The tubes were centrifuged at 2000 g for 30 minutes and then decanted into polypropylene tubes and stored at -80°C until evaluated. 757 specimens were prepared from 200 samples. These specimens were tested by the following specific assays: FII, FV, FVII, FVIII, FIX, FX, FXI, FXII, heparin, fibrinogen, plasminogen, protein C, and AT-III.
- Samples represented normal patients, a variety of deficiencies, and therapeutic conditions. Of the specimen population 216 were positive for heparin determined by a heparin concentration greater than 0.05 units/ml measured with a chromogenic assay specific for heparin. The remaining specimens, classified as heparin-negative, included normal specimens, a variety of single or multiple factor deficiencies, and patients receiving other therapeutic drugs. Positive heparin samples ranged to 0.54 units/ml.
- PT and APTT screening assays were performed on each specimen five days.
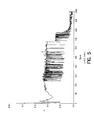
- clot-based coagulation assays are performed by an automated optically-based analyzer such as the MDA 180, data are collected over time that represents the normalized level of light transmission through a sample as a clot forms (the optical profile). As the fibrin clot forms, the transmission of light is decreased. The optical profile was stored from each test.
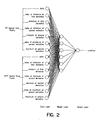
- M condition The network configuration chosen, a multilayer perceptron (M condition.
- M condition A similar network was also employed for PT-only variables and APTT-only variables.
- This specific MLP consists of three layers: the input layer, one hidden layer, and the output layer.
- a normal optical profile is shown in Figure 3.
- the set of predictor variables were chosen with the intent of describing optical profiles as completely as possible with a minimum number of variables. They are summarized in Table 1 where t is time from initiation of reaction, T is normalized light transmission through the reaction mixture, and pv jk is the kth predictor variable of assay j .
- the predictor variables were scaled to values between 0 and 1, based on the range of values observed for each variable for assay type k
- the input variable set includes i 1 ... 7 for both a PT assay and APTT assay for each specimen.
- heparin samples with results of greater than 0.05 units/ml were considered positive and assigned a value of 1 while negative samples were assigned a value of 0.
- the error-correction learning rule is an iterative process used to update the synaptic weights by a method of gradient descent in which the network minimizes the error as pattern associations (known input-output pairs) in the training set are presented to the network.
- pattern associations known input-output pairs
- Each cycle through the training set is known as an epoch.
- the order or presentation of the pattern associations was the same for all epochs.
- the learning algorithm consists of six steps which make up the forward pass and the backward pass.
- g h h(1- h)W2g o .
- the forward pass and backward pass are repeated for all of the pattern associations in the training set, referred to as an epoch, 1000 times.
- the trained network is applied to the cross-validation set.
- the learning curve is defined as the plot of E versus epoch.
- the percent classification ⁇ describes the percent of the total test set (training and cross-validation) that is correctly classified based on some defined decision boundary, ⁇ .
- Receiver-Operating Characteristic (ROC) plots have also been utilized to describe trained networks' ability to discriminate between the alternative possible outcome states. In these plots, measures of sensitivity and specificity are shown for a complete range of decision boundaries.
- experiments were performed to determine if the presence of heparin could be predicted with this method.
- experiments were conducted to determine optimal error-correction backpropagation learning parameters: (1) hidden layer size, (2) learning rate, and (3) momentum. Additional experiments were also conducted to compare the performance of networks based on PT and APTT assays alone with that of one combining the results of both, the effect of the training error tolerance, and the decision boundary selection.
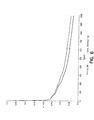
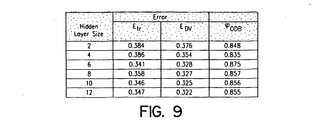
- Figure 9 shows the effect of the hidden layer size on the training and cross validation error and the percent correct classification for the optimal decision boundary, defined as the decision boundary which yielded the lowest total number of false positives and false negatives from the total test set.
- the hidden layer size As the hidden layer size is increased, the error is decreased. However, the ability to generalize does not increase after a hidden layer size of 6. The most significant benefit in terms of both error and percentage correct classification is between 4 and 6. A hidden layer size of 6 was used for the remainder of the experiments.
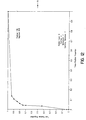
- Figure 4 shows the learning curves for two of the best combinations of parameters.
- Figure 5 shows an example learning curve when the learning rate is so high it leads to oscillations and convergence to a higher E.
- ⁇ ⁇ 0 the network converged to a lower E and as ⁇ ⁇ 1, the rate of convergence improved.
- ⁇ ⁇ 1 the value of E converged too increased and oscillations increased.
- ⁇ ⁇ 1 ⁇ ⁇ 1 exacerbated the oscillations.
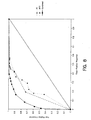
- Figure 8 shows the ROC plot for networks trained with the predictor variables from each of the two screening assays with that of them combined.
- the hidden layer size was 3. While using the data from one assay does lead to some success, using the information from both assays makes a significant improvement in the ability of the network to correctly predict the presence of heparin.
- FIG. 10 is a receiver operator characteristic plot related to predicting an abnormality in relation to Factor VIII.
- Figure 10 everything below 30% activity was indicated as positive, and everything above 30% was indicated as negative. Cutoff values other than 30% could also be used.
- the activity percentage has a known accuracy of approximately + or - 10%.
- Figure 11 the actual percent activity was utilized as the output.
- Duplicate APTT and PT screening assays were performed on each specimen with two MDA 180s using single lots of APTT and PT reagents. These specimens were also analyzed using specific assays for FII, FV, FVII, FVIII, FIX, FX, FXI, FXII, heparin, fibrinogen, plasminogen, protein C and antithrombin-III.
- Optical profile data files were exported from the MDA 180s and processed off-line. A set of nine parameters was derived to describe the timing, rate and magnitude of coagulation events. These parameters were calculated for all APTT and PT tests. The parameter set is modified slightly from that for Example 1. In this approach, the optical data for a PT or APTT assay was divided into three segments (a pre-coagulation segment, a coagulation segment and a post-coagulation segment) using divisions based on the minimum and maximum value of the second derivative for changes in optical signal with respect to time.
- Each neural network was trained for 1000 epochs. Training parameters were learning rate, 0.01; momentum, 0.5; learning tolerance, 0.10; decay; 0.05; input layer size, 18 (or 9 for single assays); hidden layer size, 9 (or 5 for single assays); and output layer size, 1.
- Three types of networks were trained. These included networks that classified specimens as deficient or non-deficient based on a single diagnostic cut-off, sets of networks that used diagnostic cut-offs at different levels of the same factor, and networks trained to estimate the actual concentration of a specific factor.
- neural networks were trained to classify plasma samples into two groups, positive (factor-deficient) and negative (non-deficient), and results were compared to classification based on the measured factor concentration for the specimens.
- the diagnostic cut-off for defining factor deficiencies was set as 30%; that is, specimens with a measured concentration of less that 30% of normal for a specific factor were defined as deficient and those with greater than 30% activity were defined as non-deficient.
- These diagnostic cut-off levels were arbitrarily defined, but are based on clinical requirements and reagent sensitivity.
- the desired output from positive samples and negative samples were defined as '1' and '0', respectively; the actual output for each specimen was a floating point value, a , where 0 ⁇ a ⁇ 1.
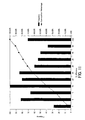
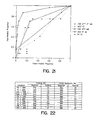
- Figure 22 shows the constituency of the training and cross-validation sets with regard to each factor deficiency.
- Classification of specimens was evaluated at varying "decision boundaries" that divided the neural network outputs into positive and negative groups. This positive or negative classification was then compared to the desired output (the known classification) for each input data set. Results were plotted as nonparametric receiver-operating characteristic (ROC) curves and the areas under the curves were computed along with their associated standard errors. ROC curves were also derived for APTT and PT clot time values for comparison. Data points on the ROC curves represent the proportion of true-positive and false-positive classifications at various decision boundaries. Optimum results are obtained as the true-positive proportion approaches 1.0 and the false-positive proportion approaches 0.0 (upper-left corner of graph). The optimum global measure of the ROC curve is an area of 1.0.
- a second set of networks was trained for FX classification in a similar manner to the first set except that the diagnostic cut-off level was varied (10%, 30%, and 50%). FX was chosen for this experiment because the data set contained a greater number of positive samples at all cut-off levels than other factors.
- a third set of networks were trained to approximate actual specific factor activities (FII, FV, FVII, FVIII, FIX, FX, FXI and FXII) and fibrinogen levels from combined PT and APTT parameters from unknown samples.
- the desired output of the training and cross-validation sets was the measured activity for a specific factor for each specimen and the actual output of the neural network was a predicted concentration for this specific factor activity.
- the coefficients of linear regressions using the desired outputs versus the actual neural network outputs for the cross-validation set were used to describe the performance of these networks.
- the Pearson product moment correlation coefficient, r was used to estimate the correlation between the two data sets.
- ROC receiver-operating curves
- an ROC plot for diagnosis of FII deficiencies using PT clot time was generated by varying the decision boundary (value of PT clot time) used to differentiate between deficient and non-deficient specimens.
- the decision boundary value of PT clot time
- most deficient specimens can be identified but a significant proportion of non-deficient specimens may also be flagged (false-positives).
- the proportion of false-positives decreases, but the number of true-positive specimens that are not diagnosed may also increase.
- a decision boundary can be identified from an ROC curve that produces a very high proportion of true-positives and a very low proportion of false-positives.
- sensitivity refers to the ability to detect positive specimens and corresponds to the y-axis of the ROC plots.
- Specificity refers to the proportion of specimens diagnosed as negative which are correctly identified.
- the ROC x-axis equals (1-specificity).
- Visual assessment of the ROC curves is one method used to evaluate the performance of the neural networks and compare them to the diagnostic power of PT and APTT clot times. Another method is to measure the diagnostic performance by using the area under the ROC curves.
- the area under the ROC curve is equivalent to an estimate of the probability that a randomly chosen positive specimen will have a more positive result than a randomly chosen negative specimen.
- ROC curves overlap, the shape of the curves as well as the areas beneath them becomes important.
- An ROC curve encompassing a smaller area may be preferable to an overlapping curve with greater area depending on the desired performance for a given diagnostic system.
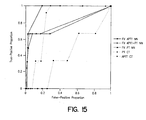
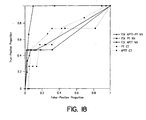
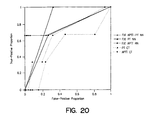
- Figures 14 - 21 show ROC curves for neural networks trained to predict FII, FV, FVII, FVIII, FIX, FX, FXI, and FXII deficiencies from PT parameters alone, from APTT parameters alone, or from combined APTT and PT parameters. ROC plots based on classification using APTT and PT clot times are included for comparison. Figure 23 shows the area under these curves and their associated standard errors.
- Results from classification of FV deficiencies showed somewhat different characteristics ( Figures 15 and 23). Best results were observed for classification from a neural network using APTT data parameters, based on visual inspection and area under the ROC curve. Less successful classification were obtained from neural networks using PT data parameters alone or combined with APTT data, and from PT clot time, as judged from areas under ROC curves. Classification based on PT clot time was qualitatively different from neural networks using PT data, however, and tended toward higher sensitivity rather than specificity. This type of pattern was observed for classification of several coagulation factors, especially factors VIII, X and XI. In situations where overlapping ROC curves were obtained, consideration of the relative value of specificity and sensitivity, as well as the area under ROC curves, becomes important in comparing diagnostic results.
- misclassified positive specimens were clustered in several categories: 1) Specimens with "no clot" APTT or PT results (specimens with very prolonged or very weak coagulation reaction for which no clot time can be reliably calculated); 2) specimens with multiple deficiencies or abnormalities; 3) specimens with borderline deficiencies (factor activity marginally lower than the diagnostic cut-off of 30%); and 4) specimens with atypically steep slope during the pre-coagulation phase for APTT assays that were not characteristic of other specimens in the same classification (FX deficiencies were not detected for two specimens exhibiting this characteristic with FX activities of 26.8% and 16.8%, respectively).
- Neural networks were also trained to estimate actual protein concentrations (as opposed to a positive/negative classification at a defined cut-off) for FII, FV, FVII, FVIII, FIX, FX, FXI, FXII and fibrinogen. Linear correlation coefficients for the estimated and measured concentrations are shown in Figure 25 for all experiments, and plots of the correlation data are shown in Figure 26 for fibrinogen and Figure 27 for FX. Correlation data between PT and APTT clot time and measured concentrations are also shown in Figure 25 for comparison.
- Neural networks using self-organizing feature maps and learning vector quantization were used to analyze optical data from clinical coagulation tests.
- Self-organizing feature maps using an unsupervised learning algorithm were trained with data from normal donors, patients with abnormal levels of coagulation proteins and patients undergoing anticoagulant therapy. Specimen categories were distinguishable in these maps with varying levels of resolution.
- a supervised neural network method, learning vector quantization was used to train maps to classify coagulation data.
- Self-organizing feature maps contain layers of input and output neurons only and contain no hidden layers. Training is based on competitive learning where the output neurons compete with one another to be activated and only one output neuron is activated for any given set of inputs. Output neurons become selectively tuned to certain input patterns, and data with similar features tend to be grouped together spatially.
- This type of neural network may use either an unsupervised or supervised learning algorithm. When an unsupervised method is used, such as the self-organizing map (SOM) algorithm, unidentified input patterns are presented to the network during training and the output for each input pattern is the coordinates of the winning neuron in the output layer, or map.
- SOM self-organizing map
- LVQ learning vector quantization
- MDA Simplastin L (PT reagent), MDA Platelin L (APTT reagent) and other reagents were obtained from Organon Teknika Corporation, Durham, NC 27712, USA, unless otherwise indicated.
- Factor-deficient plasmas for factor assays were obtained from Organon Teknika and George King Bio-Medical Corporation, Overland Park, Kansas 66210, USA. Additional factor-deficient plasmas were obtained from HRF, Raleigh, NC 27612, USA. Random samples, specimens from patients receiving heparin or oral anticoagulant therapy, and other specimens were obtained from Duke University Medical Center Coagulation Laboratory.
- coagulation factors FII, FV, FVII, FVIII, FIX, FX, FXI, FXII
- the diagnostic cut-off for defining factor deficiencies was set at 30%; that is, specimens with a measured concentration of less that 30% of normal for a specific factor were defined as deficient and those with greater than 30% activity were defined as non-deficient.
- Samples were defined as positive for heparin if the measured heparin concentration was greater than 0.05 IU/ml.
- Optical profile data files were exported from MDA 180s and processed off-line. A set of nine parameters was derived to describe the timing, rate and magnitude of coagulation events for PT and APTT tests, as described previously. In this approach, the optical data for a PT or APTT assay was divided into three segments (a pre-coagulation segment, a coagulation segment and a post-coagulation segment) using divisions based on the minimum and maximum value of the second derivative for changes in optical signal with respect to time.
- a self-organizing feature map neural network consists of input and output layers of neurons.
- the self-organizing map (SOM) algorithm transforms an input vector (a set of data parameters from PT or APTT optical data for a single test) to an individual output neuron whose location in the output layer, or map, corresponds to features of the input data. These features tend to be spatially correlated in the map.
- SOM learning process There are five steps in the SOM learning process:
- the SOM tests were performed using the Self-Organizing Map Program Package (SOM_PAK) available from the Helsinki University of Technology, Laboratory of Computer Sciences. Two different sets of parameters were used as input to the SOMs: (1) the nine parameters from a PT assay, and (2) the nine parameters from the APTT assay. All data sets (786) were used to train the SOMs.
- a 10x10 map was trained using a hexagonal neighborhood in two stages. In the first stage, the map was trained for 1000 epochs (an epoch is one cycle through all data sets) with an initial learning rate parameter of 0.5 (decreasing linearly to zero during training) and a neighborhood radius of 10 (decreasing linearly to 1 during training). In the second stage, the map was trained for 10000 epochs using a learning rate parameter of 0.1 and a radius of 3.
- LVQ Learning vector quantization
- the LVQ tests were performed using the Learning Vector Quantization Program Package (LVQ_PAK), also available from the Helsinki University of Technology, Laboratory of Computer Sciences.
- LVQ_PAK Learning Vector Quantization Program Package
- the sets of parameters from the APTT assay or PT assays were used for the LVQ networks.
- the data parameter sets were divided evenly into training and cross-validation sets randomly by specimen, where all replicates for a given specimen were grouped either in the cross-validation set or training set. The same training and cross-validation sets were used throughout this study.
- the LVQ networks were trained to classify plasma samples into two categories, positive (factor-deficient specimens or specimens from patients undergoing anticoagulant therapy) and negative (non-deficient or no anticoagulant therapy), and results were compared to classification based on the measured factor concentration or therapeutic condition for the specimens.
- LVQ training was performed using 200 weight vectors, 10000 epochs, initial learning rate parameter of 0.5 (decreasing linearly to 0), and 7 neighbors used in knn-classification.
- LVQ networks were evaluated using sensitivity (the proportion of known positive specimens that were correctly classified as positive by the network), specificity (the proportion of known negative specimens that were correctly classified as negative by the network), positive predictive value (PPV), negative predictive value (NPV) and efficiency. These terms are defined below, where TP, TN, FP and FN correspond to true positive, true negative, false positive and false negative classifications, respectively.
- PPV TP TP + FP
- Self-organizing feature maps were trained using optical data parameters from either PT or APTT data for 200 specimens as input.
- Network output consisted of map coordinates for each specimen.
- Contour plots were constructed for six categories of known specimen classifications: normal donors, specimens with heparin > 0.05 IU/ml, fibrinogen >600mg/dl, fibrinogen ⁇ 200 mg/dl, patients receiving oral anticoagulants, and factor-deficient specimens (specimens with ⁇ 30% of normal activity for FII, FV, FVII, FVIII, FIX, FX, FXI, or FXII). These contour plots depict the distribution of specimens within a category according to their map coordinates.
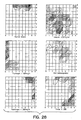
- Figure 28 Contour plots for populations of samples used in training a self-organizing feature map using the unsupervised training method SOM based on data from APTT assays. Optical data parameters from 765 APTT assays were used to train this self-organizing feature map. The shaded areas represent the distribution of output neurons for specific specimen populations within the feature map. Each contour line represents an incremental step of one test result located at a given set of map coordinates.
- Figure 28 shows SOM contour plots derived from APTT optical data for the six specimen categories. Specimens containing low fibrinogen and high fibrinogen were classified at opposite borders of the SOM with no overlap. Normal populations showed some overlapping with low fibrinogen, factor deficient and oral anticoagulated categories. Overlap between normal specimens and edges of the high and low fibrinogen populations is expected, since some proportion of healthy donors have fibrinogen levels that are lower or higher than normal. Overlap between mapping of normal specimens and factor-deficient plasmas is also not surprising, since APTT tests are sensitive to some factor-deficiencies (but not others), whereas PT assays are sensitive to a separate subset of factor deficiencies.
- the low fibrinogen category tended to overlap the factor-deficient category, consistent with our observation that many factor-deficient specimens also had reduced fibrinogen levels.
- the heparin category tended to overlap the high fibrinogen category, again consistent with measured levels of fibrinogen for these specimens. Little or no overlap was observed between normal. specimens and specimens containing heparin. Specimens from patients receiving oral anticoagulant therapy show significant overlap with both normal and heparin populations. This is consistent with known properties of APTT assays, which are sensitive to heparin therapy but relatively insensitive to oral anticoagulant therapy.
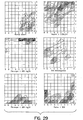
- Figure 29 Contour plots for populations of samples used in training a self-organizing feature map using the unsupervised training method SOM based on optical data from 765 PT assays. Experimental details are as described in the Materials and Methods section and in Figure 28.
- Contour plots for self-organizing feature maps trained with PT data are shown in Figure 29. Results are similar to maps from APTT data in several respects: (1) high and low fibrinogen were well resolved at opposite sides of the map; (2) normal specimens were localized in a region that overlapped low fibrinogen specimens slightly; (3) factor-deficient specimens were distributed between non-overlapping regions and regions that overlapped low fibrinogen and normal populations. Overlap was consistent with measured fibrinogen for some specimens, and with poor sensitivity of PT reagents to some factor deficiencies in other cases; (4) oral anticoagulated specimens showed some overlap with both normal and heparin populations; and (5) the heparinized population was distributed over a large portion of the map. Overlap between heparinized specimens and high fibrinogen populations was consistent with measured fibrinogen levels. The resolution of the heparin population is somewhat surprising, considering that PT reagents are relatively insensitive to heparin.
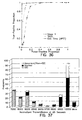
- LVQ networks were trained to predict the presence or absence of a specific factor deficiency or therapeutic condition from APTT or PT optical data. Results for the cross-validation data are summarized in Figure 30. Previous studies concluded that back-propagation neural networks were capable of sensitivity > 0.6 while maintaining specificity >0.9 for all factors except FVII using an appropriate choice of PT and APTT data separately or in combination. In this study, LVQ networks using APTT data gave sensitivity > 0.6 with specificity > 0.85 for factors II, X, XI, and XII, and heparin.
- LVQ networks using PT data were able to achieve > 0.6 sensitivity while maintaining > 0.85 specificity for Factors II, X, and XI, and heparin ( Figure 30).
- Results from LVQ networks showed less sensitivity for prediction of FVII deficiencies, consistent with results from back-propagation networks.
- sensitivity for predicting deficiencies from LVQ cross-validation sets was generally less ( ⁇ 0.35) than for factors II, X, XI and XII.
- Haemostatic Dysfunction is the activation of coagulation prior to initiation of clot formation, which results in a biphasic waveform.
- DIC Disseminated intravascular coagulation
- the invention has been found to be not only useful as an early diagnostic and single monitoring marker of DIC, but in addition the quantifiable and standardizable changes also allow for prognostic applicability in clinical management.
- DIC Disseminated intravascular coagulation
- Freshly collected blood samples that required a PT or an APTT were analyzed prospectively over a two week working period. These were in 0.105M tri-sodium citrate in the ratio of 1 part anticoagulant to 9 parts whole blood and the platelet-poor plasma was analyzed on the MDA (Multichannel Discrete Analyzer) 180, an automated analyzer for performing clinical laboratory coagulation assays using an optical detection system (Organon Teknika Corporation, Durham, NC, USA).
- MDA Multichannel Discrete Analyzer
- Decreasing levels of light transmittance therefore correlates directly with increasing steepness of the bi-phasic slope.
- the recording of the light transmittance at 25 seconds also allows for standardization between patients and within the same patient with time. If the minimum level of light transmittance for each sample were to be used instead, this would be affected by variations in the clot time of the APTT and would therefore not be ideal for comparisons.
- Platelet counts (Plt) normal 150-400 10 9 /l
- Plt normal 150-400 10 9 /l
- the diagnosis of DIC was strictly defined in the context of both laboratory and clinical findings of at least 2 abnormalities in the screening tests (increased PT, increased APTT, reduced Fgn, increased TT or reduced Plt) plus the finding of an elevated D-dimer level (>0.5 mg/l) in association with a primary condition recognized in the pathogenesis of DIC.
- Serial screening tests were also available on those patients to chart progression and confirmation of the diagnosis of DIC as was direct clinical assessment and management.
- values for the sensitivity, specificity, positive and negative prediction of the APTT-TW for the diagnosis of DIC were calculated employing a two-by-two table. 95% confidence intervals (CI) were calculated by the exact binomial method.
- the one false negative result occurred in a patient with pre-eclampsia (PET) where the single sample available for analysis showed a prolonged PT of 21.0s, APTT of 44.0s and raised D-dimers of 1.5mg/l. 5 other patients were identified in this study with PET and none had either DIC or a bi-phasic TW. Of the 14 patients with a bi-phasic TW which did not fulfil the criteria of DIC, all had some evidence of a coagulopathy with abnormalities in one or two of the screening tests. These abnormal results fell short of the criterion for DIC as defined above. 4 of these 14 patients had chronic liver disease with prolonged PT and mild thrombocytopaenia.
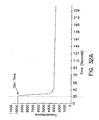
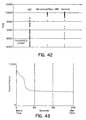
- the positive predictive value of the test was 74%, which increased with increasing steepness of the bi-phasic slope and decreasing levels of light transmittance (Table 2 and Figure 33).
- Table 2 and Figure 33 The positive predictive value of the test was 74%, which increased with increasing steepness of the bi-phasic slope and decreasing levels of light transmittance.
- In the first two days of the study there were 12 patients who had an abnormality in the clotting tests plus elevation of D-dimer levels. These were patients who were clinically recovering from DIC that occurred in the week preceding the study. This led to the impression that TW changes might correlate more closely with clinical events than the standard markers of DIC.
- Table 3 illustrates one such example with serial test results from a patient with E. coli septicaemia.
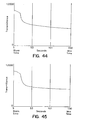
- FIG. 34 illustrates the results of a patient who initially presented with peritonitis following bowel perforation. This was further complicated by gram negative septicaemia postoperatively with initial worsening of DIC followed by a gradual recovery after appropriate therapy. As DIC progressed initially, there was increasing steepness in the bi-phasic slope of the TW and a fall in the light transmittance level. A reversal of this heralded clinical recovery.
- Figure 35 illustrates the results of a patient who sustained severe internal and external injuries following a jet-ski accident. Although initially stabilized with blood product support, his condition deteriorated with continuing blood loss and development of fulminant DIC. The bi-phasic slope became increasingly steep with falls in transmittance level as the consequences of his injuries proved fatal.
- TW data from the MDA-180 would also fulfil the criteria of simplicity and rapidity unlike the measurements of thrombin-antithrombin complexes or other markers that are dependent on ELISA technology.
- the advantages of TW analysis are that: (a) the bi-phasic TW change appears to be the single most useful correlate within an isolated sample for DIC and as such, reliance need no longer be placed on serial estimations of a battery of tests, and (b) the appearance or resolution of the bi-phasic TW can precede changes in the standard, traditional parameters monitored in DIC with strong, clear correlation to clinical events and outcome.
- bi-phasic TW was also seen in patients who did not have DIC per se as defined by the above criteria, the clinical conditions were associated with Haemostatic Dysfunction - namely activated coagulation prior to initiation of clot formation resulting in a biphasic waveform (for example in chronic liver disease or in the very ill patients on the Intensive Care Unit who had multiple organ dysfunction). It appears that bi-phasic TW is sensitive to non-overt or compensated DIC and that a transmittance level of less than 90% ( Figure 33) or sequential falls in that level ( Figure 35), reflects decompensation towards a more overt manifestation and potentially fulminant form of DIC.
- a second embodiment of the invention has been found that greatly improves sensitivity and specificity. It has been found that looking at transmittance at a particular time can result in detecting an artifact or other decrease in transmittance at that point, even though the waveform is not a bi-phasic waveform. For example, a temporary dip in transmittance at 25 seconds would cause such a patient sample to be flagged as bi-phasic, even if the waveform was normal or at least not bi-phasic. Also, if a patient sample had a particularly short clotting time, then if clot formation begins e.g. prior to 25 seconds (or whatever time is preselected), then the waveform could be flagged as biphasic, even though the real reason for decreased transmittance at 25 seconds is because clot formation has already begun/occurred.
- Fig. 36 illustrates ROC plots for the prediction of DIC for three different parameters derived from the APTT assay using the combined data sets described: (1) transmittance at 25 seconds (TR25), (2) APTT clot time, and (3) slope 1 (the slope up to initiation of clot formation). Slope 1 exhibited the best predictive power, followed by TR25.
- Tables 5 and 6 show the data for the histograms in Figures 37 and 38 respectively: Bins DIC Normal Abnormal/Non-DIC - 0.006 3 0 0 - 0.005 2 0 0 - 0.004 1 0 0 - 0.003 10 0 0 - 0.002 24 0 0 - 0.001 33 0 0 - 0.0005 12 0 0 - 0.0002 5 5 2 - 0.0001 1 37 13 More 0 68 22 Bin DIC Normal Abnormal/Non-DIC 7000 34 1 0 8000 18 2 0 9000 26 6 1 9500 8 3 0 9600 3 2 1 9700 1 0 0 9800 1 3 0 9900 0 21 4 10000 0 62 30 More 0 10 1
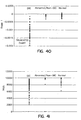
- Figures 39 and 41 show the group distributions for Slope 1 and TR25 respectively; and Figures 40 and 42 show the group distributions for Slope 1 and TR25 respectively. Figures 40 and 42 show partial subpopulations of the data shown in Figures 39 and 41.
- the detected bi-phasic waveform can be flagged.
- the operator of the machine, or an individual interpreting the test results e.g. a doctor or other medical practitioner
- the flag can be displayed on a monitor or printed out.
- a slope of less than about -0.0003 or less than about -0.0005 is the preferred cutoff for indicating a bi-phasic waveform. An increasing steepness in slope prior to clot formation correlates to disease progression.
- the PT waveform profile was derived using PT reagents (thromboplastin), namely RecombiplastTM (Ortho), ThromborelTM (Dade-Behring) and InnovinTM (Dade-Behring). Both Recombiplast and Thromborel were particularly good at showing bi-phasic responses. Innovin was intermediate in its sensitivity. Using the transmittance level at 10 seconds into the PT reaction as the quantitative index, Recombiplast and Thromborel objectively showed lower levels of light transmittance than Innovin. Thromborel can show a slight increase in initial light transmittance before the subsequent fall. This may be, in part, related to the relative opaqueness of Thromborel.
Landscapes
- Health & Medical Sciences (AREA)
- Life Sciences & Earth Sciences (AREA)
- Hematology (AREA)
- Engineering & Computer Science (AREA)
- Molecular Biology (AREA)
- Biomedical Technology (AREA)
- Chemical & Material Sciences (AREA)
- Immunology (AREA)
- Urology & Nephrology (AREA)
- Biotechnology (AREA)
- Biochemistry (AREA)
- Cell Biology (AREA)
- Food Science & Technology (AREA)
- Medicinal Chemistry (AREA)
- Physics & Mathematics (AREA)
- Analytical Chemistry (AREA)
- Microbiology (AREA)
- General Health & Medical Sciences (AREA)
- General Physics & Mathematics (AREA)
- Pathology (AREA)
- Investigating Or Analysing Biological Materials (AREA)
- Analysing Materials By The Use Of Radiation (AREA)
- Measurement Of The Respiration, Hearing Ability, Form, And Blood Characteristics Of Living Organisms (AREA)
Claims (39)
- Verfahren zur Prädiktion des Vorhandenseins einer hämostatischen Dysfunktion in einem Patienten anhand eines zumindest zeitabhängigen Messprofils, wobei das Verfahren folgendes umfasst:a) Vornehmen mindestens einer zeitabhängigen Messung an einer unbekannten Probe und Messen einer entsprechenden Eigenschaft im Zeitverlauf, um ein zeitabhängiges Messprofil abzuleiten;b) Definieren einer Prädiktorvariable, die zumindest teilweise die Daten des zeitabhängigen Messprofils definiert, wobei die genannte Prädiktorvariable die Steigung des zeitabhängigen Messprofils vor der Gerinnselbildung aufweist;c) Ableiten eines Modells, das das Verhältnis zwischen der hämostatischen Fehlfunktion und der einen Prädiktorvariable darstellt; undd) Einsatz des Modells aus Schritt c) zur Prädiktion des Vorhandenseins einer hämostatischen Dysfunktion in dem Patienten.
- Verfahren nach Anspruch 1, wobei es sich bei dem genannten mindestens einem zeitabhängigen Messprofil um mindestens ein optisches Profil handelt.
- Verfahren nach Anspruch 2, wobei das genannte mindestens eine optische Profil durch einen automatisierten Analysator für Thrombose- und Hämostasetests vorgesehen wird.
- Verfahren nach Anspruch 2 oder 3, wobei eine Mehrzahl optischer Messungen bei einer oder mehreren Wellenlängen im Zeitverlauf vorgenommen werden, um das genannte mindestens eine optische Profil abzuleiten, wobei die genannten optischen Messungen Änderungen der Lichtübertragung durch die Patientenprobe entsprechen.
- Verfahren nach einem der Ansprüche 2 bis 4, wobei eine Mehrzahl optischer Messungen im Zeitverlauf vorgenommen werden, um das genannte mindestens eine optische Profil abzuleiten, und wobei die genannte Mehrzahl optischer Messungen jeweils auf eine erste optische Messung vereinheitlicht werden.
- Verfahren nach Anspruch 3, wobei in Schritt a) das genannte mindestens eine optische Profil automatisch durch den genannten Analysator vorgesehen wird, wodurch die genannte unbekannte Probe automatisch durch eine automatisierte Sonde aus einem Probenbehälter in einen Testschacht entfernt wird, wobei ein Reagenz oder mehrere Reagenzien automatisch dem genannten Testschacht hinzugefügt werden, um die genannten Eigenschaftsveränderungen in der genannten Probe einzuleiten, und wobei die Entwicklung der genannten Eigenschaft im Zeitverlauf automatisch optisch überwacht wird, um das genannte optische Datenprofil abzuleiten.
- Verfahren nach Anspruch 6, wobei nach Schritt d) ein vorhergesehenes angeborenes oder erworbenes Ungleichgewicht oder ein therapeutischer Zustand automatisch in einem Speicher des genannten automatisierten Analysators gespeichert und/oder auf dem genannten automatisierten Analysator angezeigt wird.
- Verfahren nach Anspruch 6 oder 7, wobei in Schritt d) eine oder mehrere Analysen zur Bestätigung des Vorhandenseins des genannten angeborenen oder erworbenen Ungleichgewichts oder des therapeutischen Zustands automatisch vorgenommen werden.
- Verfahren nach Anspruch 8, wobei die genannte eine oder mehrere Analysen an dem genannten Analysator automatisch neu angeordnet und vorgenommen werden, wobei die Ergebnisse der genannten einen oder mehreren Analysen in einem Speicher des genannten automatisierten Analysators gespeichert und/oder an dem genannten Analysator angezeigt werden.
- Verfahren nach einem der vorstehenden Ansprüche, wobei dieses ferner folgendes umfasst:vor dem Schritt a) das Vorsehen einer Gruppe von Daten aus bekannten Proben, wobei die Daten in Schritt c) zum Ableiten des genannten Modells verwendet werden.
- Verfahren nach Anspruch 10, wobei die genannten Daten aus bekannten Proben durch das Vornehmen einer Mehrzahl von Analysen an den genannten Proben vorgesehen werden.
- Verfahren nach einem der vorstehenden Ansprüche, wobei in Schritt a) eine Mehrzahl von zeitabhängigen Messprofilen zur Verwendung in Schritt b) abgeleitet wird.
- Verfahren nach Anspruch 12, wobei die genannte Mehrzahl von zeitabhängigen Messprofilen mindestens zwei Profile aus Analysen aufweist, die mit PT-Reagenzien, APTT-Reagenzien, Fibrinogenreagenzien und TT-Reagenzien eingeleitet werden.
- Verfahren nach einem der vorstehenden Ansprüche, wobei es sich bei der genannten unbekannten Probe um eine Probe eines medizinischen Patienten handelt, und wobei in Schritt d) sowohl die genannten Modelldaten als auch zusätzliche medizinische Patientendaten verwendet werden, um das Vorhandensein des genannten angeborenen oder erworbenen Ungleichgewichts oder des therapeutischen Zustands vorauszusehen.
- Verfahren nach Anspruch 14, wobei die genannten zusätzlichen medizinischen Patientendaten eine oder mehrere der folgenden Informationen aufweisen: Fibrinogen, D-Dimer und Plättchenzählwert.
- Verfahren nach einem der vorstehenden Ansprüche, wobei in Schritt d) die Prädiktion der hämostatischen Dysfunktion mehrfach vorgenommen wird, um das Fortschreiten oder den Rückgang einer Erkrankung in dem Patienten zu überwachen.
- Verfahren nach einem der vorstehenden Ansprüche, wobei die Prädiktion der hämostatischen Dysfunktion eine Prädiktion der disseminierten intravaskulären Gerinnung ist.
- Verfahren nach Anspruch 17, wobei die genannte Prädiktion der disseminierten intravaskulären Gerinnung in mindestens 75% der vorausgesagten Fälle richtig ist.
- Verfahren nach einem der vorstehenden Ansprüche, wobei es sich bei dem genannten zeitabhängigen Messprofil um eine optische Übertragung durch eine Probe während einer APPT-Analyse oder einer PT-Analyse handelt.
- Verfahren nach einem der vorstehenden Ansprüche, wobei in Schritt b) die Steigung des zeitabhängigen Messprofils vom Ende der Austastzeit bis unmittelbar vor dem Einsetzen der Gerinnselbildung oder über einen vorbestimmten Zeitraum ermittelt wird.
- Verfahren nach einem der vorstehenden Ansprüche, wobei es sich bei dem genannten zeitabhängigen Messprofil um ein optisches Übertragungsprofil handelt, und wobei der genannte eine oder mehrere Parameter eine Mindestübertragungs- und/oder Gerinnselbildungszeit aufweist.
- Verfahren nach einem der vorstehenden Ansprüche, wobei die genannte hämostatische Dysfunktion auf einen oder mehrere Zustände zurückgeht, die disseminierter intravaskulärer Gerinnung zugeordnet sind, einschließlich Trauma, Malignität, Chirurgie, Aorten-Aneurysma-Ruptur und systemischinflammatorischem Syndrom.
- Verfahren nach einem der vorstehenden Ansprüche, wobei die genannte Prädiktion des Vorhandenseins einer hämostatischen Dysfunktion das Kennzeichnen des Vorhandenseins einer hämostatischen Dysfunktion oder der Wahrscheinlichkeit für eine hämostatische Dysfunktion aufweist.
- Verfahren nach einem der vorstehenden Ansprüche, wobei es sich bei der einzigen Prädiktorvariable um die Steigung des zeitabhängigen Messprofils vor der Gerinnselbildung handelt.
- Verfahren nach einem der vorstehenden Ansprüche, wobei es sich bei der Prädiktorvariable der Steigung des zeitabhängigen Messprofils vor der Gerinnselbildung um eine Steigung von weniger als -0,0005 handelt.
- Verfahren nach einem der vorstehenden Ansprüche, wobei es sich bei der Prädiktorvariable der Steigung des zeitabhängigen Messprofils vor der Gerinnselbildung um eine Steigung von weniger als -0,0003 handelt.
- Verfahren nach Anspruch 26, wobei die genannte Steigung von weniger als -0,0003 der Aktivierung der Koagulation vor dem Einsetzen der Gerinnselbildung entspricht.
- Verfahren nach einem der vorstehenden Ansprüche, wobei die vorausgesagte hämostatische Dysfunktion auf einen oder mehrere der folgenden Zustände zurückgeht: Infektion, Trauma, einen schweren chirurgischen Eingriff, eine Lebererkrankung, Schwangerschaft und/oder Geburt eines Kindes, Hypoxie, Azidose, eine Lithiumüberdosis und die Abstoßung eines Transplantats.
- Verfahren nach einem der vorstehenden Ansprüche, wobei die Verfahrensschritte a) bis d) an einem automatisierten oder halbautomatischen Analysator ausgeführt werden, und wobei die genannte Kennzeichnung einen Warnhinweis an eine den genannten Analysator bedienende Person darstellt oder an eine Person, die die Ergebnisse einer Testreihe an dem genannten Analysator liest oder auswertet, dass in Bezug auf einen Patienten, dessen Testprobe den Analysator durchlaufen hat und gekennzeichnet worden ist, die Möglichkeit oder Wahrscheinlichkeit einer hämostatischen Dysfunktion gegeben ist.
- Verfahren nach Anspruch 29, wobei es sich bei dem genannten Warnhinweis um einen Warnhinweis auf einem Papierausdruck oder auf einem Monitor handelt.
- Verfahren nach Anspruch 27, wobei eine Steigung von weniger als -0,0003 eine Kennzeichnung der Patientenprobe bewirkt, und wobei ein Anstieg der Steilheit der Steigung von Test zu Test einem Fortschreiten der Erkrankung entspricht.
- Verfahren nach einem der vorstehenden Ansprüche, wobei es sich bei der genannten Patientenprobe um Vollblut oder einen Teil dessen handelt.
- Verfahren nach Anspruch 32, wobei es sich bei der genannten Patientenprobe um eine Plasmaprobe handelt.
- Verfahren nach einem der vorstehenden Ansprüche, wobei die genannte Prädiktion des Vorhandenseins einer hämostatischen Dysfunktion in dem Patienten eine Spezifizität und Empfindlichkeit aufweist, die größer sind als bei anderen zur Diagnostizierung einer hämostatischen Dysfunktion verwendeten Tests.
- Verfahren nach einem der vorstehenden Ansprüche, wobei es sich bei der genannten hämostatischen Dysfunktion um disseminierte intravaskuläre Gerinnung handelt, und wobei die genannte Prädiktion der disseminierten intravaskulären Gerinnung in dem Patienten eine Spezifizität und Empfindlichkeit aufweist, die größer sind als bei anderen zur Diagnostizierung einer disseminierten intravaskulären Gerinnung verwendeten Tests.
- Verfahren nach Anspruch 35, wobei es sich bei den genannten anderen Tests um einen oder mehrere der folgenden Tests handelt: Plättchenzählen, Bestimmung eines D-Dimer-Werts sowie Bestimmung des Fibrinogenwerts.
- Verfahren nach einem der vorstehenden Ansprüche, wobei es sich bei der genannten hämostatischen Dysfunktion gemäß der Prädiktion um disseminierte intravaskuläre Gerrinung handelt, und wobei das Verfahren ferner die Durchführung der Analysen des Plättchenzählwerts, des D-Dimer-Werts und/oder des Fibrinogenwerts umfasst.
- Verfahren nach einem der vorstehenden Ansprüche, wobei die genannte Steigung aus dem kürzeren Wert der Austastzeit bis zum Einsetzen der Gerinnselbildung oder aus der Austastzeit bis zu einem vorbestimmten Zeitraum bestimmt wird, der kürzer ist als der Zeitraum des Einsetzens der Gerinnselbildung.
- Verfahren zur Prädiktion des Vorhandenseins von disseminierter intravaskulärer Gerinnung in einem Patienten anhand eines zeitabhängigen Messprofils, wobei das Verfahren folgendes umfasst:a) Ausführen einer zeitabhängigen Messung an einer unbekannten Probe und Messen einer entsprechenden Eigenschaft im Zeitverlauf, um ein zeitabhängiges Messprofil abzuleiten;b) Berechnen der Steigung des zeitabhängigen Messprofils bis zum Einsetzen der Gerinnselbildung oder bis zu einem vorbestimmten Zeitraum abzüglich des Zeitpunkts des Einsetzens der Gerinnselbildung, je nachdem, welcher Wert niedriger ist;c) Definieren einer Prädiktorvariable durch Berechnen eines Schwellenwerts für den Parameter in b) aus bekannten positiven und bekannten negativen Proben, wobei positive und negative Proben ausreichend separiert werden; undd) Verwenden des Schwellenwerts in Schritt c) zur Prädiktion des Vorhandenseins disseminierter intravaskulärer Gerinnung in dem Patienten.
Priority Applications (1)
| Application Number | Priority Date | Filing Date | Title |
|---|---|---|---|
| EP04025887A EP1522860A1 (de) | 1999-02-04 | 2000-02-04 | Verfahren und Vorrichtung zum Vorhersagen von haemostatischer Funktionsstörung in Patientenproben |
Applications Claiming Priority (3)
| Application Number | Priority Date | Filing Date | Title |
|---|---|---|---|
| US24434099A | 1999-02-04 | 1999-02-04 | |
| US244340 | 1999-02-04 | ||
| PCT/US2000/002987 WO2000046603A1 (en) | 1999-02-04 | 2000-02-04 | A method and apparatus for predicting the presence of haemostatic dysfunction in a patient sample |
Related Child Applications (1)
| Application Number | Title | Priority Date | Filing Date |
|---|---|---|---|
| EP04025887A Division EP1522860A1 (de) | 1999-02-04 | 2000-02-04 | Verfahren und Vorrichtung zum Vorhersagen von haemostatischer Funktionsstörung in Patientenproben |
Publications (3)
| Publication Number | Publication Date |
|---|---|
| EP1147423A1 EP1147423A1 (de) | 2001-10-24 |
| EP1147423A4 EP1147423A4 (de) | 2002-04-17 |
| EP1147423B1 true EP1147423B1 (de) | 2004-11-10 |
Family
ID=22922329
Family Applications (1)
| Application Number | Title | Priority Date | Filing Date |
|---|---|---|---|
| EP00913371A Expired - Lifetime EP1147423B1 (de) | 1999-02-04 | 2000-02-04 | Verfahren und vorrichtung zum vorhersagen von haemostatischer funktionsstörung in patientenproben |
Country Status (9)
| Country | Link |
|---|---|
| US (1) | US7211438B2 (de) |
| EP (1) | EP1147423B1 (de) |
| JP (1) | JP4486260B2 (de) |
| AT (1) | ATE282208T1 (de) |
| AU (1) | AU774889B2 (de) |
| CA (1) | CA2362055C (de) |
| DE (1) | DE60015726T2 (de) |
| ES (1) | ES2231167T3 (de) |
| WO (1) | WO2000046603A1 (de) |
Families Citing this family (22)
| Publication number | Priority date | Publication date | Assignee | Title |
|---|---|---|---|---|
| US7732213B2 (en) * | 1999-02-22 | 2010-06-08 | Coramed Healthcare, Inc. | Method of evaluating patient hemostasis |
| US6743596B1 (en) * | 2000-10-27 | 2004-06-01 | Biomerieux, Inc. | Method of determining global coagulability hemostatic potential |
| EP1476752A4 (de) * | 2002-02-27 | 2008-02-13 | Bio Merieux Inc | Verfahren zur diagnose und überwachung von hämostatischer fehlfunktion, einer schweren infektion und dem systematische-entzündungsreaktion-syndrom |
| EP1565570A4 (de) | 2002-11-12 | 2005-12-28 | Becton Dickinson Co | Sepsis- oder sirs-diagnose mittels biomarkerprofilen |
| EP1575978A4 (de) | 2002-11-12 | 2006-04-19 | Becton Dickinson Co | Sepsis- oder sirs-diagnose mittels biomarkerprofilen |
| WO2005038690A2 (en) * | 2003-10-21 | 2005-04-28 | Philips Intellectual Property & Standards Gmbh | Method of automatically displaying medical measurement data |
| JP2008538007A (ja) | 2005-04-15 | 2008-10-02 | ベクトン,ディッキンソン アンド カンパニー | 敗血症の診断 |
| US7480593B2 (en) * | 2005-08-03 | 2009-01-20 | Suresh Gopalan | Methods and systems for high confidence utilization of datasets |
| CN101946169B (zh) * | 2008-02-14 | 2013-06-12 | 欧雷恩诊断公司 | 用于预测未来特性的方法 |
| US8669113B2 (en) | 2008-04-03 | 2014-03-11 | Becton, Dickinson And Company | Advanced detection of sepsis |
| WO2011159820A1 (en) * | 2010-06-15 | 2011-12-22 | Bayer Healthcare Llc | Device |
| KR102044940B1 (ko) | 2012-05-07 | 2019-11-14 | 가부시키가이샤 엘에스아이 메디엔스 | 파종성 혈관 내 응고 증후군 또는 감염성 파종성 혈관 내 응고 증후군을 검출하는 방법 |
| US9597001B2 (en) * | 2012-08-22 | 2017-03-21 | Ben-Gurion University Of The Negev Research & Development Authority | Separating clinically relevant sources of electrical activity in ECG signals |
| US10823743B1 (en) | 2013-10-28 | 2020-11-03 | Ifirst Medical Technologies, Inc. | Methods of measuring coagulation of a biological sample |
| JP6430809B2 (ja) * | 2014-12-19 | 2018-11-28 | 公立大学法人奈良県立医科大学 | 血液検体を判定するための方法、システム及びコンピュータプログラム、並びに血液検体分析装置 |
| US10872410B2 (en) | 2016-09-29 | 2020-12-22 | Animantis, Llc | Methods and apparatus for assessing immune system activity and therapeutic efficacy |
| EP3404665B1 (de) * | 2017-05-15 | 2024-03-06 | Medial Research Ltd. | Systeme und verfahren zur aggregation von automatisch generierten labor-testergebnissen |
| GB202004047D0 (en) | 2020-03-20 | 2020-05-06 | Ainger Phill | Point of care sepsis assay device and method |
| EP4212880A1 (de) * | 2020-09-08 | 2023-07-19 | Sekisui Medical Co., Ltd. | Blutgerinnungsreaktionsanalyseverfahren |
| JP2022062969A (ja) * | 2020-10-09 | 2022-04-21 | シスメックス株式会社 | 血液検体の分析方法、分析装置、および分析プログラム |
| WO2022092248A1 (ja) * | 2020-10-29 | 2022-05-05 | 積水メディカル株式会社 | 血液凝固反応の検出方法 |
| JPWO2022186381A1 (de) * | 2021-03-05 | 2022-09-09 |
Family Cites Families (107)
| Publication number | Priority date | Publication date | Assignee | Title |
|---|---|---|---|---|
| US590665A (en) * | 1897-09-28 | Machine | ||
| US1691741A (en) * | 1928-11-13 | Carrying bag and handle therefor | ||
| US177089A (en) * | 1876-05-09 | Improvement in bit-stocks | ||
| US1076086A (en) * | 1910-10-21 | 1913-10-21 | Charles C Vosburgh | Window-furnishing. |
| US2070327A (en) * | 1931-06-08 | 1937-02-09 | Wood Newspaper Mach Corp | Paper roll braking mechanism |
| US2005014A (en) * | 1932-04-19 | 1935-06-18 | Warner Brothers Pictures Inc | Focusing device for a motion picture camera |
| US2012877A (en) * | 1932-11-03 | 1935-08-27 | Iwasa Morizo | Hearing appliance |
| US2061953A (en) * | 1936-02-12 | 1936-11-24 | Sampson Max | Toy aeroplane and control therefor |
| US2364453A (en) * | 1939-09-13 | 1944-12-05 | Standard Oil Co | Processing hydrocarbon distillates |
| US2635081A (en) * | 1950-12-13 | 1953-04-14 | Sun Oil Co | Molybdenum disulfide on a spent cracking catalyst |
| US3307392A (en) * | 1964-05-04 | 1967-03-07 | Research Corp | Automatic prothrombin timer apparatus and method |
| US3458287A (en) * | 1965-04-29 | 1969-07-29 | Medical Laboratory Automation | Method and means of determining endpoint times in blood clotting tests |
| US3502878A (en) * | 1967-09-22 | 1970-03-24 | Us Health Education & Welfare | Automatic x-ray apparatus for limiting the field size of a projected x-ray beam in response to film size and to source-to-film distance |
| US3658480A (en) * | 1970-04-13 | 1972-04-25 | Bio Data Corp | Coagulation timing apparatus, and method |
| US4047890A (en) * | 1973-11-01 | 1977-09-13 | Bio/Data Corporation | Method and apparatus for determining deficiencies in enzymatic reactors particularly clotting factor levels in blood plasmas |
| SU590665A1 (ru) | 1976-02-11 | 1978-01-30 | Новосибирский государственный медицинский институт | Способ исследовани процесса свертывани крови |
| US4040788A (en) * | 1976-04-05 | 1977-08-09 | Sanford L. Simons | Apparatus, instrumentation, and method for comparing samples |
| DE2635081C3 (de) | 1976-08-04 | 1980-08-07 | Bio/Data Corp., Willow Grove, Pa. (V.St.A.) | Verfahren und Vorrichtung zur Bestimmung von Blutplasma-Gerinnungsfaktorpegeln |
| FR2364453A1 (fr) | 1976-09-08 | 1978-04-07 | Lacombe Pierre | Dispositif electronique apportant un perfectionnement aux appareils destines a analyser la coagulation sanguine : prothrombinometre citrate-oxalate |
| US4199748A (en) * | 1976-11-01 | 1980-04-22 | Rush-Presbyterian-St. Luke's Medical Center | Automated method and apparatus for classification of cells with application to the diagnosis of anemia |
| JPS5451893A (en) | 1977-09-30 | 1979-04-24 | Sankyo Co | Measuring of blood coagulating time |
| JPS5822703B2 (ja) * | 1978-08-30 | 1983-05-10 | 三共株式会社 | 血液凝固測定方法 |
| US4254760A (en) * | 1978-09-22 | 1981-03-10 | Sirimarco Robert A | Ceramic heat absorption panel |
| US4289498A (en) * | 1979-01-08 | 1981-09-15 | Ortho Diagnostics, Inc. | One-stage prothrombin assay and compositions useful therein |
| US4766083A (en) * | 1982-04-04 | 1988-08-23 | Wako Pure Chemical Industries, Ltd. | Method for the photometric determination of biological agglutination |
| SU1076086A1 (ru) | 1982-12-28 | 1984-02-29 | Всесоюзный Научно-Исследовательский И Конструкторский Институт Медицинской Лабораторной Техники | Гемокоагулограф |
| US4705756A (en) | 1983-01-26 | 1987-11-10 | University Of Medicine And Dentistry Of New Jersey | Method of determining the existence and/or the monitoring of a pathological condition in a mammal |
| EP0115459A3 (de) | 1983-01-26 | 1986-11-20 | University Of Medicine And Dentistry Of New Jersey | Haematologische Voraussage von Sepsis und anderen erkrankten Zuständen |
| JPS59203959A (ja) | 1983-05-04 | 1984-11-19 | Toa Medical Electronics Co Ltd | 血液凝固時間測定装置 |
| JPH0695095B2 (ja) | 1983-11-25 | 1994-11-24 | 株式会社島津製作所 | 全自動血液分析装置 |
| DE3502878A1 (de) | 1985-01-29 | 1986-07-31 | Boehringer Mannheim Gmbh, 6800 Mannheim | Verfahren zur bestimmung des fibrinolytischen zustands von plasma |
| JPS61272655A (ja) | 1985-05-28 | 1986-12-02 | Iryo Kogaku Kenkyusho:Kk | 血小板凝集能の定量的判定方法 |
| GB8516081D0 (en) * | 1985-06-25 | 1985-07-31 | Ciba Geigy Ag | Assay & purification of amyloid components |
| US4902630A (en) * | 1985-07-22 | 1990-02-20 | Abbott Laboratories | Fluorescence polarization immunoassy and reagents for measurement of c-reactive protein |
| WO1989009628A1 (en) | 1988-04-04 | 1989-10-19 | Potempa Lawrence A | Binding of immune complexes by modified forms of c-reactive protein |
| US5593897A (en) * | 1988-04-04 | 1997-01-14 | Northwestern University | Binding of immune complexes by modified forms of C-reactive protein |
| US4965725B1 (en) * | 1988-04-08 | 1996-05-07 | Neuromedical Systems Inc | Neural network based automated cytological specimen classification system and method |
| US5156974A (en) * | 1988-05-27 | 1992-10-20 | Biodata Corporation | Method for determining the fibrinogen level of a blood sample |
| US5003065A (en) * | 1988-06-14 | 1991-03-26 | Carey Merritt | Compounds and process for measuring c-reactive protein |
| US5697369A (en) * | 1988-12-22 | 1997-12-16 | Biofield Corp. | Method and apparatus for disease, injury and bodily condition screening or sensing |
| US5055412A (en) * | 1989-03-21 | 1991-10-08 | Proksch Gary J | Factor sensitive reagent for testing of blood coagulation containing ellagic acid and divalent metal ions and method of making the same |
| US5500345A (en) * | 1989-04-25 | 1996-03-19 | Iatron Laboratories, Inc. | Hybridomas producing monoclonal antibodies specific for C-reactive protein and methods for detection of C-reactive protein |
| WO1991000872A1 (en) | 1989-06-27 | 1991-01-24 | Rush-Presbyterian-St. Luke's Medical Centre | Monoclonal antibodies to c-reactive protein |
| US5051357A (en) | 1989-07-14 | 1991-09-24 | Board Of Trustees Operating Michigan State University | Method and assay using inactivation of factors Va and VIIIa by activated Protein C to diagnose thrombic disease or assay for Protein C and kit therefor |
| WO1991001383A1 (en) * | 1989-07-14 | 1991-02-07 | Michigan State University | Method for diagnosing blood clotting disorders |
| JP3055933B2 (ja) | 1989-07-20 | 2000-06-26 | アナリティカル・コントロール・システムズ・インコーポレーテッド | 改良された安定な凝固対照 |
| SU1691741A1 (ru) | 1989-08-25 | 1991-11-15 | Донецкий государственный медицинский институт | Способ прогнозировани геморрагических осложнений при травматической болезни |
| US4998535A (en) * | 1989-09-05 | 1991-03-12 | Univ. of Washington New England Medical Center Hospitals, Inc. | Thrombolysis predictive instrument |
| US5262303A (en) | 1989-10-13 | 1993-11-16 | Trustees Of Boston University | Ligand/anti-ligand assays for adherent proteins |
| IE904244A1 (en) | 1989-12-01 | 1991-06-05 | Akzo Nv | Direct fibrinogen assay |
| US5646046A (en) * | 1989-12-01 | 1997-07-08 | Akzo Nobel N.V. | Method and instrument for automatically performing analysis relating to thrombosis and hemostasis |
| US5169786A (en) * | 1989-12-19 | 1992-12-08 | Ortho Diagnostic Systems, Inc. | Method of determining levels of extrinsic and intrinsic clotting factors and protein c |
| EP0525035B1 (de) | 1990-04-17 | 1996-07-03 | Analytical Control Systems, Inc. | Koagulationsassays und reagenzien |
| US5862304A (en) * | 1990-05-21 | 1999-01-19 | Board Of Regents, The University Of Texas System | Method for predicting the future occurrence of clinically occult or non-existent medical conditions |
| US5218529A (en) * | 1990-07-30 | 1993-06-08 | University Of Georgia Research Foundation, Inc. | Neural network system and methods for analysis of organic materials and structures using spectral data |
| JPH04254760A (ja) | 1991-01-30 | 1992-09-10 | Eiken Chem Co Ltd | 血清アミロイドa標準物質、およびその設定方法 |
| US5221628A (en) * | 1991-03-19 | 1993-06-22 | Northwestern University | Binding of aggregated immunoglobulin or immune complexes by serum amyloid P component |
| RU2012877C1 (ru) | 1991-04-01 | 1994-05-15 | Белорусский научно-исследовательский институт охраны материнства и детства | Способ прогнозирования синдрома дыхательных расстройств у недоношенных новорожденных |
| US5180835A (en) * | 1991-06-25 | 1993-01-19 | American Cyanamid Company | Process for the preparation of monomeric tetramethoxymethylglycoloril |
| DE69122752T2 (de) | 1991-08-02 | 1997-04-10 | Grifols Grupo Sa | Verfahren und Vorrichtung zur Bestimmung der Gerinnungszeit von Blut und Plasma |
| AU2870992A (en) | 1991-10-04 | 1993-05-03 | Board Of Regents Of The University Of Nebraska, The | A soluble thrombomodulin-based one-stage assay for vitamin k-dependent coagulation-inhibiting proteins |
| US5716795A (en) * | 1991-10-04 | 1998-02-10 | Matschiner; John T. | Thrombomodulin-based coagulometric assay of the protein C system |
| CA2121680C (en) | 1991-11-04 | 2005-03-22 | Andrew E. Senyei | Screening method for identifying women at increased risk for preterm delivery |
| JPH05180835A (ja) | 1991-12-27 | 1993-07-23 | S R L:Kk | ループスアンチコアグラントの測定方法 |
| US5318958A (en) | 1992-05-29 | 1994-06-07 | Queen's University At Kingston | Amyloid precursor protein |
| JP2934557B2 (ja) | 1992-07-10 | 1999-08-16 | 国際試薬株式会社 | 血液凝固時間測定方法とその装置 |
| JPH0636061A (ja) * | 1992-07-21 | 1994-02-10 | Fujitsu Ltd | 階層型ニューラルネットワークの学習方式 |
| US5388164A (en) * | 1992-08-19 | 1995-02-07 | Olympus Optical Co., Ltd. | Method for judging particle agglutination patterns using neural networks |
| JP3224607B2 (ja) | 1992-09-11 | 2001-11-05 | 株式会社アズウェル | 血液凝固第xiii因子活性測定方法および該測定用試薬キット |
| US5369484A (en) | 1992-11-09 | 1994-11-29 | Akzo N.V. | Multiple discrete analyzer test apparatus and method |
| US5358852A (en) * | 1992-12-21 | 1994-10-25 | Eastman Kodak Company | Use of calcium in immunoassay for measurement of C-reactive protein |
| RU2070327C1 (ru) | 1992-12-25 | 1996-12-10 | Безруков Александр Васильевич | Устройство для измерения времени свертывания крови |
| US5344754A (en) | 1993-01-13 | 1994-09-06 | Avocet Medical, Inc. | Assay timed by electrical resistance change and test strip |
| JP2938302B2 (ja) | 1993-02-25 | 1999-08-23 | 国際試薬株式会社 | 血液凝固時間測定方法とその装置 |
| JPH06249857A (ja) * | 1993-02-26 | 1994-09-09 | Hitachi Ltd | 自動分析装置 |
| RU2061953C1 (ru) | 1993-03-10 | 1996-06-10 | Тюменский государственный медицинский институт МЗ РФ | Способ количественного определения общей коагуляционной активности тромбоцитов |
| US5670329A (en) * | 1993-05-28 | 1997-09-23 | Cardiovascular Diagnostics, Inc. | Method and analytical system for performing fibrinogen assays accurately, rapidly and simply using a rotating magnetic field |
| DE59309435D1 (de) * | 1993-06-30 | 1999-04-15 | Diagnostische Forsch Stiftung | Messung des aktivierten partiellen Thromboplastinzeit (APTT) in einer Einstufen-Reaktion |
| DE69434128T2 (de) | 1993-08-16 | 2005-11-10 | Biomerieux, Inc. | Methode und gerät zur automatischen durchführung von analysen bezüglich thrombose und blutgerinnung |
| US5526111A (en) * | 1993-08-31 | 1996-06-11 | Boehringer Mannheim Corporation | Method and apparatus for calculating a coagulation characteristic of a sample of blood a blood fraction or a control |
| US5472852A (en) | 1993-09-15 | 1995-12-05 | Oklahoma Medical Research Foundation | Assay for detection of selective Protein C inhibition by patients |
| US5473732A (en) * | 1993-11-02 | 1995-12-05 | Chang; Hou-Mei H. | Relational artificial intelligence system |
| US5553616A (en) * | 1993-11-30 | 1996-09-10 | Florida Institute Of Technology | Determination of concentrations of biological substances using raman spectroscopy and artificial neural network discriminator |
| US5856114A (en) * | 1994-03-21 | 1999-01-05 | The University Of Vermont | Immunologic detection of factor VA fragments in hemorrhagic and thrombotic clinical settings |
| ATE202633T1 (de) | 1994-04-28 | 2001-07-15 | Dade Behring Inc | Kalibrator für prothrombin-zeit-assays |
| AU1287595A (en) | 1994-08-26 | 1996-03-22 | Immtech International, Inc. | A mutant protein and methods and materials for making and using it |
| US5504011A (en) * | 1994-10-21 | 1996-04-02 | International Technidyne Corporation | Portable test apparatus and associated method of performing a blood coagulation test |
| SE9403833D0 (sv) * | 1994-11-08 | 1994-11-08 | Global Hemostasis Inst Mgr Ab | Analysförfarande och kit |
| US5705395A (en) * | 1994-11-14 | 1998-01-06 | The Scripps Research Institute | Method for diagnosis of thrombotic disorders |
| US5567596A (en) * | 1994-12-29 | 1996-10-22 | Research Foundation Of State University Of New York | Rapid assay of activators and inhibitors of clotting |
| DE69615339T2 (de) | 1995-01-10 | 2002-07-04 | Hemker Hendrik Coenraad | Verfahren zum nachweis des endogenen thrombin-potentials und thrombin substrate zur verwendung in diesen verfahren |
| US5708591A (en) * | 1995-02-14 | 1998-01-13 | Akzo Nobel N.V. | Method and apparatus for predicting the presence of congenital and acquired imbalances and therapeutic conditions |
| US6429017B1 (en) * | 1999-02-04 | 2002-08-06 | Biomerieux | Method for predicting the presence of haemostatic dysfunction in a patient sample |
| US6898532B1 (en) * | 1995-06-07 | 2005-05-24 | Biomerieux, Inc. | Method and apparatus for predicting the presence of haemostatic dysfunction in a patient sample |
| US6321164B1 (en) * | 1995-06-07 | 2001-11-20 | Akzo Nobel N.V. | Method and apparatus for predicting the presence of an abnormal level of one or more proteins in the clotting cascade |
| US5780255A (en) | 1995-06-09 | 1998-07-14 | Instrumentation Laboratory, S.P.A. | Protein C pathway screening test |
| US6194163B1 (en) | 1995-07-21 | 2001-02-27 | The Provost, Fellows And Scholars Of The College Of The Holy And Undivided Trinity Of Queen Elizabeth Near Dublin | Method for the quantitative measurement of human acute phase serum amyloid A protein; recombinant protein; specific antibody |
| US5766869A (en) | 1995-11-30 | 1998-06-16 | Ahs Hospital Corp. | Factor V ratio blood test for susceptibility to thromboembolism |
| ES2231860T3 (es) | 1996-03-22 | 2005-05-16 | Dade Behring Inc. | Dispositivo de conservacion y prueba de reactivos que se usan en combinacion. |
| JPH1026621A (ja) | 1996-07-12 | 1998-01-27 | Dai Ichi Pure Chem Co Ltd | イムノアッセイ法 |
| JP3876022B2 (ja) | 1996-09-26 | 2007-01-31 | 生化学工業株式会社 | 血液凝固時間に影響を与える物質の定量方法 |
| EP0841566A1 (de) | 1996-11-11 | 1998-05-13 | Pentapharm A.G. | Positivkontrollplasma für den Lupus-Antikoagulant-Nachweiser |
| DK1493439T3 (da) * | 1997-04-02 | 2012-01-30 | Brigham & Womens Hospital | Middel til fastlæggelse af en persons risikoprofil for aterosklerotisk sygdom |
| US6010911A (en) * | 1997-04-30 | 2000-01-04 | Medtronic, Inc. | Apparatus for performing a heparin-independent high sensitivity platelet function evaluation technique |
| US6027115A (en) * | 1998-03-25 | 2000-02-22 | International Game Technology | Slot machine reels having luminescent display elements |
| US6249855B1 (en) * | 1998-06-02 | 2001-06-19 | Compaq Computer Corporation | Arbiter system for central processing unit having dual dominoed encoders for four instruction issue per machine cycle |
| CN1309770A (zh) * | 1998-07-31 | 2001-08-22 | 华莱士·E·卡罗尔 | 确定抗凝治疗因子的设备和方法 |
-
2000
- 2000-02-04 JP JP2000597634A patent/JP4486260B2/ja not_active Expired - Fee Related
- 2000-02-04 AU AU34833/00A patent/AU774889B2/en not_active Ceased
- 2000-02-04 EP EP00913371A patent/EP1147423B1/de not_active Expired - Lifetime
- 2000-02-04 ES ES00913371T patent/ES2231167T3/es not_active Expired - Lifetime
- 2000-02-04 DE DE60015726T patent/DE60015726T2/de not_active Expired - Lifetime
- 2000-02-04 CA CA2362055A patent/CA2362055C/en not_active Expired - Fee Related
- 2000-02-04 AT AT00913371T patent/ATE282208T1/de not_active IP Right Cessation
- 2000-02-04 WO PCT/US2000/002987 patent/WO2000046603A1/en active IP Right Grant
-
2004
- 2004-07-02 US US10/884,293 patent/US7211438B2/en not_active Expired - Fee Related
Also Published As
| Publication number | Publication date |
|---|---|
| WO2000046603A1 (en) | 2000-08-10 |
| DE60015726T2 (de) | 2005-12-22 |
| CA2362055C (en) | 2010-07-20 |
| US7211438B2 (en) | 2007-05-01 |
| ES2231167T3 (es) | 2005-05-16 |
| AU774889B2 (en) | 2004-07-08 |
| AU3483300A (en) | 2000-08-25 |
| JP2002541431A (ja) | 2002-12-03 |
| ATE282208T1 (de) | 2004-11-15 |
| DE60015726D1 (de) | 2004-12-16 |
| JP4486260B2 (ja) | 2010-06-23 |
| EP1147423A1 (de) | 2001-10-24 |
| US20040248308A1 (en) | 2004-12-09 |
| CA2362055A1 (en) | 2000-08-10 |
| EP1147423A4 (de) | 2002-04-17 |
Similar Documents
| Publication | Publication Date | Title |
|---|---|---|
| EP1147423B1 (de) | Verfahren und vorrichtung zum vorhersagen von haemostatischer funktionsstörung in patientenproben | |
| US6564153B2 (en) | Method and apparatus for predicting the presence of an abnormal level of one or more proteins in the clotting cascade | |
| EP0834145B1 (de) | Verfahren und apparat zum vorhersagen der präsenz von angeborenen und erworbenen unausgewogenheiten und therapeutischen zuständen | |
| AU2008201621B2 (en) | A method for predicting the presence of haemostatic dysfunction in a patient sample | |
| US6898532B1 (en) | Method and apparatus for predicting the presence of haemostatic dysfunction in a patient sample | |
| US20030049851A1 (en) | Method for predicting the presence of haemostatic dysfunction in a patient sample | |
| EP1188060B1 (de) | Verfahren und apparatur zum präsentieren von daten von thrombose- und haemostaseassays | |
| EP1522860A1 (de) | Verfahren und Vorrichtung zum Vorhersagen von haemostatischer Funktionsstörung in Patientenproben | |
| Givens et al. | Predicting the presence of plasma heparin using neural networks to analyze coagulation screening assay optical profiles | |
| Givens et al. | Classification of factor deficiencies from coagulation assays using neural networks | |
| AU2005201099A1 (en) | Method for predicting the presence of haemostatic dysfunction in a patient sample |
Legal Events
| Date | Code | Title | Description |
|---|---|---|---|
| PUAI | Public reference made under article 153(3) epc to a published international application that has entered the european phase |
Free format text: ORIGINAL CODE: 0009012 |
|
| 17P | Request for examination filed |
Effective date: 20010816 |
|
| AK | Designated contracting states |
Kind code of ref document: A1 Designated state(s): AT BE CH CY DE DK ES FI FR GB GR IE IT LI LU MC NL PT SE |
|
| A4 | Supplementary search report drawn up and despatched |
Effective date: 20020306 |
|
| AK | Designated contracting states |
Kind code of ref document: A4 Designated state(s): AT BE CH CY DE DK ES FI FR GB GR IE IT LI LU MC NL PT SE |
|
| 17Q | First examination report despatched |
Effective date: 20020913 |
|
| GRAP | Despatch of communication of intention to grant a patent |
Free format text: ORIGINAL CODE: EPIDOSNIGR1 |
|
| GRAS | Grant fee paid |
Free format text: ORIGINAL CODE: EPIDOSNIGR3 |
|
| GRAA | (expected) grant |
Free format text: ORIGINAL CODE: 0009210 |
|
| RAP1 | Party data changed (applicant data changed or rights of an application transferred) |
Owner name: BIOMERIEUX, INC. |
|
| AK | Designated contracting states |
Kind code of ref document: B1 Designated state(s): AT BE CH CY DE DK ES FI FR GB GR IE IT LI LU MC NL PT SE |
|
| PG25 | Lapsed in a contracting state [announced via postgrant information from national office to epo] |
Ref country code: NL Free format text: LAPSE BECAUSE OF FAILURE TO SUBMIT A TRANSLATION OF THE DESCRIPTION OR TO PAY THE FEE WITHIN THE PRESCRIBED TIME-LIMIT Effective date: 20041110 Ref country code: AT Free format text: LAPSE BECAUSE OF FAILURE TO SUBMIT A TRANSLATION OF THE DESCRIPTION OR TO PAY THE FEE WITHIN THE PRESCRIBED TIME-LIMIT Effective date: 20041110 Ref country code: BE Free format text: LAPSE BECAUSE OF FAILURE TO SUBMIT A TRANSLATION OF THE DESCRIPTION OR TO PAY THE FEE WITHIN THE PRESCRIBED TIME-LIMIT Effective date: 20041110 Ref country code: FI Free format text: LAPSE BECAUSE OF FAILURE TO SUBMIT A TRANSLATION OF THE DESCRIPTION OR TO PAY THE FEE WITHIN THE PRESCRIBED TIME-LIMIT Effective date: 20041110 |
|
| REG | Reference to a national code |
Ref country code: GB Ref legal event code: FG4D |
|
| REG | Reference to a national code |
Ref country code: CH Ref legal event code: EP |
|
| REG | Reference to a national code |
Ref country code: IE Ref legal event code: FG4D |
|
| REF | Corresponds to: |
Ref document number: 60015726 Country of ref document: DE Date of ref document: 20041216 Kind code of ref document: P |
|
| REG | Reference to a national code |
Ref country code: CH Ref legal event code: NV Representative=s name: E. BLUM & CO. PATENTANWAELTE |
|
| PG25 | Lapsed in a contracting state [announced via postgrant information from national office to epo] |
Ref country code: LU Free format text: LAPSE BECAUSE OF NON-PAYMENT OF DUE FEES Effective date: 20050204 Ref country code: CY Free format text: LAPSE BECAUSE OF FAILURE TO SUBMIT A TRANSLATION OF THE DESCRIPTION OR TO PAY THE FEE WITHIN THE PRESCRIBED TIME-LIMIT Effective date: 20050204 |
|
| PG25 | Lapsed in a contracting state [announced via postgrant information from national office to epo] |
Ref country code: DK Free format text: LAPSE BECAUSE OF FAILURE TO SUBMIT A TRANSLATION OF THE DESCRIPTION OR TO PAY THE FEE WITHIN THE PRESCRIBED TIME-LIMIT Effective date: 20050210 Ref country code: GR Free format text: LAPSE BECAUSE OF FAILURE TO SUBMIT A TRANSLATION OF THE DESCRIPTION OR TO PAY THE FEE WITHIN THE PRESCRIBED TIME-LIMIT Effective date: 20050210 Ref country code: SE Free format text: LAPSE BECAUSE OF FAILURE TO SUBMIT A TRANSLATION OF THE DESCRIPTION OR TO PAY THE FEE WITHIN THE PRESCRIBED TIME-LIMIT Effective date: 20050210 |
|
| PG25 | Lapsed in a contracting state [announced via postgrant information from national office to epo] |
Ref country code: MC Free format text: LAPSE BECAUSE OF NON-PAYMENT OF DUE FEES Effective date: 20050228 |
|
| NLV1 | Nl: lapsed or annulled due to failure to fulfill the requirements of art. 29p and 29m of the patents act | ||
| REG | Reference to a national code |
Ref country code: ES Ref legal event code: FG2A Ref document number: 2231167 Country of ref document: ES Kind code of ref document: T3 |
|
| PLBE | No opposition filed within time limit |
Free format text: ORIGINAL CODE: 0009261 |
|
| STAA | Information on the status of an ep patent application or granted ep patent |
Free format text: STATUS: NO OPPOSITION FILED WITHIN TIME LIMIT |
|
| ET | Fr: translation filed | ||
| 26N | No opposition filed |
Effective date: 20050811 |
|
| REG | Reference to a national code |
Ref country code: CH Ref legal event code: PFA Owner name: BIOMERIEUX, INC. Free format text: BIOMERIEUX, INC.#100 RODOLPHE STREET#DURHAM, NC 27712 (US) -TRANSFER TO- BIOMERIEUX, INC.#100 RODOLPHE STREET#DURHAM, NC 27712 (US) |
|
| PG25 | Lapsed in a contracting state [announced via postgrant information from national office to epo] |
Ref country code: PT Free format text: LAPSE BECAUSE OF NON-PAYMENT OF DUE FEES Effective date: 20050410 |
|
| PGFP | Annual fee paid to national office [announced via postgrant information from national office to epo] |
Ref country code: CH Payment date: 20080228 Year of fee payment: 9 |
|
| REG | Reference to a national code |
Ref country code: CH Ref legal event code: PL |
|
| PG25 | Lapsed in a contracting state [announced via postgrant information from national office to epo] |
Ref country code: CH Free format text: LAPSE BECAUSE OF NON-PAYMENT OF DUE FEES Effective date: 20090228 Ref country code: LI Free format text: LAPSE BECAUSE OF NON-PAYMENT OF DUE FEES Effective date: 20090228 |
|
| PGFP | Annual fee paid to national office [announced via postgrant information from national office to epo] |
Ref country code: IT Payment date: 20100224 Year of fee payment: 11 |
|
| PG25 | Lapsed in a contracting state [announced via postgrant information from national office to epo] |
Ref country code: IT Free format text: LAPSE BECAUSE OF NON-PAYMENT OF DUE FEES Effective date: 20110204 |
|
| PGFP | Annual fee paid to national office [announced via postgrant information from national office to epo] |
Ref country code: IE Payment date: 20120221 Year of fee payment: 13 |
|
| PGFP | Annual fee paid to national office [announced via postgrant information from national office to epo] |
Ref country code: FR Payment date: 20130301 Year of fee payment: 14 Ref country code: DE Payment date: 20130222 Year of fee payment: 14 |
|
| PGFP | Annual fee paid to national office [announced via postgrant information from national office to epo] |
Ref country code: ES Payment date: 20120227 Year of fee payment: 13 |
|
| REG | Reference to a national code |
Ref country code: IE Ref legal event code: MM4A |
|
| PG25 | Lapsed in a contracting state [announced via postgrant information from national office to epo] |
Ref country code: IE Free format text: LAPSE BECAUSE OF NON-PAYMENT OF DUE FEES Effective date: 20130204 |
|
| REG | Reference to a national code |
Ref country code: ES Ref legal event code: FD2A Effective date: 20140408 |
|
| PGFP | Annual fee paid to national office [announced via postgrant information from national office to epo] |
Ref country code: GB Payment date: 20140203 Year of fee payment: 15 |
|
| PG25 | Lapsed in a contracting state [announced via postgrant information from national office to epo] |
Ref country code: ES Free format text: LAPSE BECAUSE OF NON-PAYMENT OF DUE FEES Effective date: 20130205 |
|
| REG | Reference to a national code |
Ref country code: DE Ref legal event code: R119 Ref document number: 60015726 Country of ref document: DE |
|
| REG | Reference to a national code |
Ref country code: FR Ref legal event code: ST Effective date: 20141031 |
|
| REG | Reference to a national code |
Ref country code: DE Ref legal event code: R119 Ref document number: 60015726 Country of ref document: DE Effective date: 20140902 |
|
| PG25 | Lapsed in a contracting state [announced via postgrant information from national office to epo] |
Ref country code: FR Free format text: LAPSE BECAUSE OF NON-PAYMENT OF DUE FEES Effective date: 20140228 Ref country code: DE Free format text: LAPSE BECAUSE OF NON-PAYMENT OF DUE FEES Effective date: 20140902 |
|
| GBPC | Gb: european patent ceased through non-payment of renewal fee |
Effective date: 20150204 |
|
| PG25 | Lapsed in a contracting state [announced via postgrant information from national office to epo] |
Ref country code: GB Free format text: LAPSE BECAUSE OF NON-PAYMENT OF DUE FEES Effective date: 20150204 |