WO2019123956A1 - 信号処理装置及び信号処理方法 - Google Patents
信号処理装置及び信号処理方法 Download PDFInfo
- Publication number
- WO2019123956A1 WO2019123956A1 PCT/JP2018/042940 JP2018042940W WO2019123956A1 WO 2019123956 A1 WO2019123956 A1 WO 2019123956A1 JP 2018042940 W JP2018042940 W JP 2018042940W WO 2019123956 A1 WO2019123956 A1 WO 2019123956A1
- Authority
- WO
- WIPO (PCT)
- Prior art keywords
- time
- measurement
- signal
- series signal
- signal processing
- Prior art date
Links
- 238000012545 processing Methods 0.000 title claims abstract description 41
- 238000003672 processing method Methods 0.000 title claims abstract description 12
- 238000005259 measurement Methods 0.000 claims abstract description 128
- 230000005856 abnormality Effects 0.000 claims abstract description 84
- 230000002159 abnormal effect Effects 0.000 claims description 16
- 238000009826 distribution Methods 0.000 claims description 7
- 238000009499 grossing Methods 0.000 claims description 6
- 230000000630 rising effect Effects 0.000 claims description 5
- 239000000284 extract Substances 0.000 claims description 3
- 239000003153 chemical reaction reagent Substances 0.000 description 17
- 239000000523 sample Substances 0.000 description 12
- 238000000034 method Methods 0.000 description 11
- 238000005070 sampling Methods 0.000 description 11
- 238000003860 storage Methods 0.000 description 8
- 238000004458 analytical method Methods 0.000 description 7
- 238000006243 chemical reaction Methods 0.000 description 6
- 230000008859 change Effects 0.000 description 4
- 238000000605 extraction Methods 0.000 description 4
- 238000002372 labelling Methods 0.000 description 4
- 230000000694 effects Effects 0.000 description 3
- 238000001914 filtration Methods 0.000 description 3
- 230000007774 longterm Effects 0.000 description 3
- 238000004020 luminiscence type Methods 0.000 description 3
- 230000007246 mechanism Effects 0.000 description 3
- 239000013598 vector Substances 0.000 description 3
- 239000012472 biological sample Substances 0.000 description 2
- 239000008280 blood Substances 0.000 description 2
- 210000004369 blood Anatomy 0.000 description 2
- 238000004364 calculation method Methods 0.000 description 2
- 238000001514 detection method Methods 0.000 description 2
- 238000010586 diagram Methods 0.000 description 2
- 238000007689 inspection Methods 0.000 description 2
- 238000004519 manufacturing process Methods 0.000 description 2
- 238000000691 measurement method Methods 0.000 description 2
- 238000003756 stirring Methods 0.000 description 2
- 239000000126 substance Substances 0.000 description 2
- 230000002123 temporal effect Effects 0.000 description 2
- 210000002700 urine Anatomy 0.000 description 2
- 241000894006 Bacteria Species 0.000 description 1
- 238000013019 agitation Methods 0.000 description 1
- 239000012491 analyte Substances 0.000 description 1
- 238000013459 approach Methods 0.000 description 1
- 210000001124 body fluid Anatomy 0.000 description 1
- 239000010839 body fluid Substances 0.000 description 1
- 239000010432 diamond Substances 0.000 description 1
- 230000005284 excitation Effects 0.000 description 1
- 230000006872 improvement Effects 0.000 description 1
- 239000004973 liquid crystal related substance Substances 0.000 description 1
- 239000011159 matrix material Substances 0.000 description 1
- 238000012986 modification Methods 0.000 description 1
- 230000004048 modification Effects 0.000 description 1
- 230000000737 periodic effect Effects 0.000 description 1
- 238000005375 photometry Methods 0.000 description 1
- 230000008569 process Effects 0.000 description 1
- 239000000941 radioactive substance Substances 0.000 description 1
- 239000002683 reaction inhibitor Substances 0.000 description 1
- 239000000758 substrate Substances 0.000 description 1
Images
Classifications
-
- G—PHYSICS
- G01—MEASURING; TESTING
- G01N—INVESTIGATING OR ANALYSING MATERIALS BY DETERMINING THEIR CHEMICAL OR PHYSICAL PROPERTIES
- G01N35/00—Automatic analysis not limited to methods or materials provided for in any single one of groups G01N1/00 - G01N33/00; Handling materials therefor
- G01N35/00584—Control arrangements for automatic analysers
- G01N35/00594—Quality control, including calibration or testing of components of the analyser
- G01N35/00613—Quality control
- G01N35/00623—Quality control of instruments
-
- G—PHYSICS
- G01—MEASURING; TESTING
- G01N—INVESTIGATING OR ANALYSING MATERIALS BY DETERMINING THEIR CHEMICAL OR PHYSICAL PROPERTIES
- G01N21/00—Investigating or analysing materials by the use of optical means, i.e. using sub-millimetre waves, infrared, visible or ultraviolet light
- G01N21/17—Systems in which incident light is modified in accordance with the properties of the material investigated
- G01N21/25—Colour; Spectral properties, i.e. comparison of effect of material on the light at two or more different wavelengths or wavelength bands
- G01N21/27—Colour; Spectral properties, i.e. comparison of effect of material on the light at two or more different wavelengths or wavelength bands using photo-electric detection ; circuits for computing concentration
- G01N21/272—Colour; Spectral properties, i.e. comparison of effect of material on the light at two or more different wavelengths or wavelength bands using photo-electric detection ; circuits for computing concentration for following a reaction, e.g. for determining photometrically a reaction rate (photometric cinetic analysis)
-
- G—PHYSICS
- G01—MEASURING; TESTING
- G01N—INVESTIGATING OR ANALYSING MATERIALS BY DETERMINING THEIR CHEMICAL OR PHYSICAL PROPERTIES
- G01N35/00—Automatic analysis not limited to methods or materials provided for in any single one of groups G01N1/00 - G01N33/00; Handling materials therefor
-
- G—PHYSICS
- G01—MEASURING; TESTING
- G01N—INVESTIGATING OR ANALYSING MATERIALS BY DETERMINING THEIR CHEMICAL OR PHYSICAL PROPERTIES
- G01N21/00—Investigating or analysing materials by the use of optical means, i.e. using sub-millimetre waves, infrared, visible or ultraviolet light
- G01N21/75—Systems in which material is subjected to a chemical reaction, the progress or the result of the reaction being investigated
- G01N21/77—Systems in which material is subjected to a chemical reaction, the progress or the result of the reaction being investigated by observing the effect on a chemical indicator
- G01N2021/7769—Measurement method of reaction-produced change in sensor
- G01N2021/7786—Fluorescence
-
- G—PHYSICS
- G01—MEASURING; TESTING
- G01N—INVESTIGATING OR ANALYSING MATERIALS BY DETERMINING THEIR CHEMICAL OR PHYSICAL PROPERTIES
- G01N35/00—Automatic analysis not limited to methods or materials provided for in any single one of groups G01N1/00 - G01N33/00; Handling materials therefor
- G01N35/00584—Control arrangements for automatic analysers
- G01N2035/0097—Control arrangements for automatic analysers monitoring reactions as a function of time
-
- G—PHYSICS
- G01—MEASURING; TESTING
- G01N—INVESTIGATING OR ANALYSING MATERIALS BY DETERMINING THEIR CHEMICAL OR PHYSICAL PROPERTIES
- G01N21/00—Investigating or analysing materials by the use of optical means, i.e. using sub-millimetre waves, infrared, visible or ultraviolet light
- G01N21/62—Systems in which the material investigated is excited whereby it emits light or causes a change in wavelength of the incident light
- G01N21/63—Systems in which the material investigated is excited whereby it emits light or causes a change in wavelength of the incident light optically excited
- G01N21/64—Fluorescence; Phosphorescence
- G01N21/6408—Fluorescence; Phosphorescence with measurement of decay time, time resolved fluorescence
-
- G—PHYSICS
- G01—MEASURING; TESTING
- G01N—INVESTIGATING OR ANALYSING MATERIALS BY DETERMINING THEIR CHEMICAL OR PHYSICAL PROPERTIES
- G01N21/00—Investigating or analysing materials by the use of optical means, i.e. using sub-millimetre waves, infrared, visible or ultraviolet light
- G01N21/75—Systems in which material is subjected to a chemical reaction, the progress or the result of the reaction being investigated
- G01N21/76—Chemiluminescence; Bioluminescence
Definitions
- the present invention relates to a signal processing apparatus and a signal processing method.
- the concentration of the target component using a labeling reagent that specifically binds to the component to be measured and generates luminescence when given a trigger The method of measuring is widely used.
- the labeling reagent include radioactive substances, substances that emit light due to chemical reactions, substances that emit fluorescence upon irradiation with excitation light, and the like.
- the signal intensity of light emission from the labeling reagent after trigger application is measured over time for a fixed time, and the integrated value of the signal intensity at the fixed signal measurement time is converted to the concentration of the target component Do.
- an error in the concentration measurement value may occur due to an abnormality in measurement, which includes an abnormality in each part of the device, a temporal change in the quality of a biological sample or a labeled reagent, and an external noise.
- an abnormality in measurement which includes an abnormality in each part of the device, a temporal change in the quality of a biological sample or a labeled reagent, and an external noise.
- Patent Document 1 determines the measurement abnormality by comparing the peak time of the time-series signal to be measured with the peak time set in advance.
- the method described in Patent Document 2 extracts the attenuation after a certain time from the peak of the time-series signal to be measured, and determines the measurement abnormality by comparing with the attenuation in the normal case. is there.
- Patent Documents 1 and 2 based on a time-series signal to be used for calculation of an integral value converted to the concentration of the measurement target component, one specific feature amount (each from peak time or peak) A method is proposed for extracting the amount of attenuation after a certain time, and using this one feature amount to determine measurement anomalies.
- the present invention provides a signal processing apparatus and a signal processing method that realize more reliable measurement by detecting an abnormality that has only a slight influence on a time-series signal.
- the purpose is
- a signal processing device includes a first measurement unit that acquires a first time-series signal with a first time resolution, and a second measurement unit that is higher than the first time resolution.
- a signal processing apparatus and the signal processing method of the present invention even when an abnormality that has only a slight influence on a time-series signal occurs, more reliable measurement is realized by detecting the abnormality.
- a signal processing apparatus and a signal processing method can be provided.
- FIG. 1 shows a configuration example of a signal processing device according to a first embodiment.
- the structural example of the automatic analyzer 200 as an example of the 1st measurement part 11 shown in FIG. 1 and the 2nd measurement part 12 is shown.
- production of a trigger signal from A / D converter 210A is shown.
- production of a trigger signal from A / D converter 210B is shown.
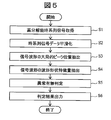
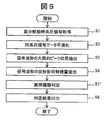
- FIG. 10 is a flowchart illustrating an example of processing to determine the presence or absence of measurement abnormality based on the shape of the signal waveform of the high resolution time-series signal in the first embodiment. It is a conceptual diagram which shows the extraction method of the peak position of a signal waveform. It is a conceptual diagram explaining the feature-value calculated from a signal waveform.
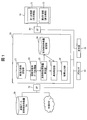
- FIG. 1 shows a configuration example of a signal processing apparatus according to the first embodiment of the present invention.
- This signal processing apparatus is roughly composed of a measuring unit 10, a signal processing unit 20, a reference data waveform shape feature amount database 30, a processor 40, and a display unit 50, and these components and an external network are interface 60 , 70, and are configured to be able to exchange data.
- the measurement unit 10 includes a measurement unit that measures signal strength in time series over a predetermined time, and includes a plurality of measurement units that can measure different time resolutions.
- a first measurement unit 11 that acquires a time-series signal (first time-series signal) with low time resolution
- two measuring units with two measuring units 12 are provided, three or more measuring units may be provided.
- the first measuring unit 11 and the second measuring unit 12 are, for example, automatic analyzers that analyze body fluid components such as blood and urine as samples. In ordinary component analysis, the measurement result of the first measurement unit 11 with low time resolution is used.
- the measurement result of the second measuring unit 12 with high time resolution is used for determination of measurement abnormality. This point will be described in detail later.
- the signal processing unit 20 includes a time-series signal storage unit 21, a time-series signal data processing unit 22, a waveform shape feature amount extraction unit 23, a waveform shape feature amount storage unit 24, an abnormality determination unit 25, and a result output unit 26.
- the time-series signal newly acquired by the measuring unit 10 is first stored in the time-series signal storage unit 21, and then subjected to predetermined data processing by the time-series signal data processing unit 22.
- the time-series signal data processing unit 22 processes the measurement results (time-series signals) of the first measurement unit 11 and the second measurement unit 12 and performs analysis and calculation of other necessary data.
- the waveform shape feature quantity extraction unit 23 extracts feature quantities of the shape of the signal waveform of the measurement signal obtained by the second measurement unit 12 (waveform shape feature quantity: hereinafter may be simply referred to as “feature quantity”). It has a function.
- the extracted waveform shape feature amount is stored in the waveform shape feature amount storage unit 24.
- the abnormality determination unit 25 compares the waveform shape feature amount newly measured and stored in the waveform shape feature amount storage unit 24 with the waveform shape feature amount of the reference data stored in the reference data waveform shape feature amount database 30. And make an abnormality judgment.
- the result output unit 26 outputs the result of the abnormality determination to the display unit 50 and the like.
- the processor 40 cooperates with the signal processing unit 20 to execute various data processing.
- the display unit 50 is a device such as a liquid crystal display, an organic EL display, or a printer that can output the result of the abnormality determination and other measurement results.
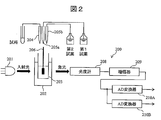
- FIG. 2 shows a configuration example of an automatic analyzer 200 as an example of the first measuring unit 11 and the second measuring unit 12.
- the automatic analyzer 200 includes, for example, a light source 201, a thermostatic bath 202, a cell 203, a sample dispensing nozzle 204, a first reagent dispensing nozzle 205a, a second reagent dispensing nozzle 205b, and a stirring mechanism 206. , A photometer 208, an amplifier 209, and A / D converters 210A and 210B.
- the light emitted from the light source (LED) 201 is irradiated to the cell 203 immersed in the thermostatic bath 202, and the light emitted from the sample is incident on the photometer 208.
- the detection signal of the photometer 208 is amplified by the amplifier 209.
- the amplified signal (analog signal) is converted into a digital signal by the A / D converters 210A and 210B and output.
- the A / D converter 210A has a small sampling frequency (a large sampling interval), and functions as the first measurement unit 11 (low resolution) in FIG.
- the A / D converter 210B performs sampling at a sampling frequency (small sampling interval) larger than that of the A / D converter 210A, and functions as the second measurement unit 12 of FIG.
- the sampling interval of the A / D converter 210A can be set to about 10 mS to 50 mS, and the sampling interval of the A / D converter 210B can be set to about 100 ⁇ S to 300 ⁇ S.
- the cell 203 is a reaction container for reacting a sample to be tested with a reagent.
- the sample is injected from the sample dispensing nozzle 204 into the cell 203, the first reagent is dispensed from the first reagent dispensing nozzle 205a, and the second reagent is dispensed from the second reagent dispensing nozzle 205b.
- the sample and the reagent are agitated by the agitation mechanism 206 to cause a chemical reaction inside the cell 203.
- the concentration of the analyte in the sample can be measured by measuring the degree of luminescence time-sequentially (photometry) for the chemical reaction at this time.
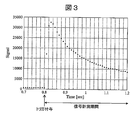
- FIG. 3 shows an example of a graph showing measurement results in the case of acquiring data of 40 points at a sampling interval of 10 mS and a signal measurement period of 400 mS after generation of a trigger signal in the A / D converter 210A.
- the measured data of 40 points are integrated over the signal measurement period (400 mS) in the time-series signal data processing unit 22 of the signal processing unit 20, and the concentration of the component to be inspected is obtained based on the obtained integral value.
- the A / D converter 210A the first measurement unit 11
- a signal with a higher time resolution than this is obtained from the A / D converter 210B (second measurement unit 12) as necessary.
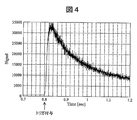
- FIG. 4 shows an example of a high resolution time series signal obtained at a sampling interval of 250 ⁇ s after generation of a trigger signal from the A / D converter 210B.
- the high resolution time series signal from the A / D converter 210B may be acquired over the entire signal measurement time of the low time resolution signal from the A / D converter 210A, or the obtained high resolution time may be obtained. Depending on the shape of interest of the series signal, only the time domain shorter than the signal measurement time may be acquired.
- step S2 the time series signal data processing unit 22 first reduces the influence of noise.
- step S2 data smoothing
- step S3 the position of the peak found in the signal waveform is extracted.
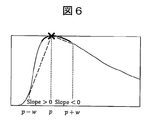
- the method of extracting the position of the peak will be described with reference to FIG.
- a position p defined by the following equation [Equation 1] as a method for extracting a global peak portion while avoiding detection of a local minute peak due to noise Is extracted as a peak part.
- w is an arbitrary value including the peak portion to be extracted. The smaller the value of w, the easier it is to detect a local minute peak. The optimal value of w can be exhaustively searched and determined according to the data.
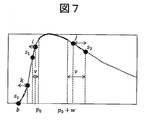
- waveform shape feature quantities representing the shape of the signal waveform are extracted from the smoothed time-series signal (step S4).
- local slopes of the signal waveform are calculated as the following feature quantities s 0 , s 1 , and s 2 .
- ⁇ y when normalized signal strength series signal normalized by the maximum signal strength, x is a function of time.
- b indicates the time of the rising point of the time-series signal
- p 0 indicates the time of the starting point of the peak portion
- v indicates the time width from the starting point and the end point of the peak portion.
- w shows the time width of a peak part.
- i, j, k indicate a minute time width for which the inclination at each point is calculated.
- the feature amount s 0 is a feature amount corresponding to the slope at the rising point of the time-series signal.
- the feature amount s 0 is calculated as a feature amount corresponding to the slope of the minute section k (b to b + k) at time b when the time-series signal rises by the trigger signal as shown in the above equation and FIG. can do.
- the feature amount s 1 is a feature amount corresponding to the inclination of the peak portion (p 0 to p 0 + w) including the peak position p extracted in step s 3 in the vicinity of the starting point.
- the feature s 1 is formula above, and as shown in FIG.
- Feature value s 2 is a characteristic quantity that corresponds to the slope in the vicinity of the end point of the peak portion including the peak positions p extracted in step s3 (p 0 ⁇ p 0 + w).
- the feature amount s 2 is a minute section j (p 0 + w + v ⁇ j) at a time earlier by time width v than time p 0 + w of the end point of the peak portion.
- i, j, k, i, j, k such that the difference between normal data when it is determined that there is no measurement abnormality and data when it is determined that there is measurement abnormality is the largest.
- the search is exhaustive, and the values of i, j, k can be determined according to the search result.
- step S5 the presence or absence of measurement abnormality in the measurement unit 10 is determined based on the waveform shape feature amounts s 0 , s 1 , s 2 calculated in step S4.
- discriminant analysis based on Mahalanobis's general distance can be used.
- the Mahalanobis' general distance D is a generalization of the distance from a data cluster in consideration of the distribution of data in the cluster, and is defined by the following equation.
- ⁇ is a feature quantity vector of data (eg, feature quantities s 0 , s 1 , s 2 ) for which the distance is to be obtained
- ⁇ is an average of feature quantity vectors of data in a cluster
- S is a feature quantity of data in a cluster It is a variance-covariance matrix of vectors.
- Discriminant analysis based on Mahalanobis's general distance D is to measure normal reference data clusters (measurement data group obtained by normal measurement) and abnormal reference data clusters (predetermined abnormal state) with respect to the feature quantities of the new time-series signal.
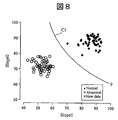
- the feature quantity s 1 and s 0 An example of data distribution in a two-dimensional space is shown.
- the horizontal axis (slope 1) indicates the distribution of Mahalanobis pan distances of the feature quantity s1
- the vertical axis (slope 0 ) indicates the distribution of the Mahalanobis pan distances of the feature quantity s0.
- the graph of FIG. 8 can be displayed on the display unit 50, and by presenting it to the operator, it can be shown whether or not there is a measurement abnormality in the newly obtained time-series signal (measurement result).
- the measurement result on one side of the curve C1 may be determined as normal, and the measurement result on the other side may be determined as abnormal.
- a high resolution time-series signal is acquired separately from this. By analyzing this, it is possible to accurately detect the measurement abnormality of the measurement device. Since high-resolution time-series signals can be appropriately determined at the timing of determination of measurement abnormality, determination of measurement abnormality can be appropriately performed without lengthening the time required for normal measurement.
- the abnormality determination unit 25 determines not only the presence or absence of the measurement abnormality but also the type of the measurement abnormality. It is configured to estimate.
- Types of measurement abnormalities include, for example, abnormalities of each part of the device, abnormalities due to changes in quality of samples and labeling reagents over time, abnormalities based on extraneous noise, so-called hook effects (measurement results of numerically low numerical values from high concentration samples Abnormalities based on what can be obtained, measurement abnormalities based on reaction inhibitors contained in the sample, and the like.
- hook effects measurement results of numerically low numerical values from high concentration samples Abnormalities based on what can be obtained
- measurement abnormalities based on reaction inhibitors contained in the sample and the like.
- the number of types of measurement anomalies detected simultaneously is not limited to two, and may be three or more.
- a high resolution time-series signal is acquired and stored (step S1), smoothing is performed (step S2), and the peak position of the signal waveform is extracted (step S3).
- step S4 the feature amounts s 0 , s 1 , and s 2 are calculated, and in step S5 ′, the presence or absence of an abnormality and the type thereof are determined.
- step S6 the determination result is output.
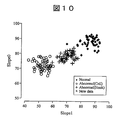
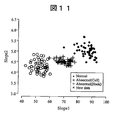
- FIG. 10 and FIG. 11 are an example of the graph which plotted the result of the measurement according to 2nd Embodiment.
- the horizontal axis in FIG. 10 corresponds to the feature quantity s 1
- the vertical axis corresponds to the feature quantity s 0 .
- the horizontal axis in FIG. 11 corresponds to the feature amount s 1
- the vertical axis corresponds to the feature amount s 2 .
- the Mahalanobis's functional distances of the feature amounts s 0 , s 1 , and s 2 are represented by three-dimensional coordinates according to FIGS. 10 and 11.
- black diamond dots are data determined to be normal
- cross dots are data determined to be measurement abnormal due to the hook phenomenon
- white dots are cells. It is data that is determined to be measurement abnormality due to the over-life of.
- the type of measurement abnormality can also be determined.
- Automatic analyzer 201: light source (LED), 202: constant temperature bath, 203: cell, 204: sample dispensing nozzle, 205a: first reagent dispensing nozzle, 205b: second reagent dispensing nozzle, 206: stirring mechanism, 208 ... photometer, 209 ... amplifier, 210A, 210B ... A / D converter.
- LED light source
- 202 constant temperature bath
- 203 cell
- 204 sample dispensing nozzle
- 205a first reagent dispensing nozzle
- 205b second reagent dispensing nozzle
- 206 stirring mechanism, 208 ... photometer, 209 ... amplifier, 210A, 210B ... A / D converter.
Landscapes
- Physics & Mathematics (AREA)
- Chemical & Material Sciences (AREA)
- Engineering & Computer Science (AREA)
- General Physics & Mathematics (AREA)
- Biochemistry (AREA)
- Pathology (AREA)
- Immunology (AREA)
- Health & Medical Sciences (AREA)
- Life Sciences & Earth Sciences (AREA)
- Analytical Chemistry (AREA)
- General Health & Medical Sciences (AREA)
- Quality & Reliability (AREA)
- Chemical Kinetics & Catalysis (AREA)
- Mathematical Physics (AREA)
- Spectroscopy & Molecular Physics (AREA)
- Theoretical Computer Science (AREA)
- Plasma & Fusion (AREA)
- Automatic Analysis And Handling Materials Therefor (AREA)
- Investigating Or Analysing Materials By The Use Of Chemical Reactions (AREA)
Abstract
時系列信号に僅かな影響しか及ぼさない異常が発生した場合に対しても、それを検知することによって、より信頼性の高い測定を実現する信号処理装置及び信号処理方法を提供する。この信号処理装置は、第1の時間分解能で第1の時系列信号を取得する第1計測部と、前記第1の時間分解能よりも高い第2の時間分解能で第2の時系列信号を取得する第2計測部と、前記第2の時系列信号に基づいて、測定異常の判定を行う判定部とを備えたことを特徴とする。第1の時系列信号により通常の測定が行われる一方で、第2の時系列信号を得て、これに基づいて測定異常の判定が行われる。
Description
本発明は、信号処理装置及び信号処理方法に関する。
血液、尿等の生体サンプル中に含まれる成分の定量を行う測定方法として、測定対象成分と特異的に結合し、かつトリガを付与されると発光を生じる標識試薬を利用して対象成分の濃度を測定する方法が広く用いられている。標識試薬の例としては、放射性物質、化学反応によって発光する物質、励起光の照射によって蛍光を発する物質等を挙げることができる。この測定方法では、トリガ付与後の標識試薬からの発光の信号強度を一定の時間に亘って時系列的に計測して、一定の信号計測時間における信号強度の積分値を対象成分の濃度に換算する。
ここで、装置各部の異常、生体サンプルや標識試薬の品質の経時的変化、及び外来ノイズなどを含む測定異常が光の信号強度の時系列信号に影響を及ぼし、濃度測定値に誤差が生じる虞がある。このような測定異常を検知する方法として、特許文献1及び特許文献2に記載された方法が提案されている。
特許文献1に記載された方法は、測定対象である時系列信号のピーク時刻を、あらかじめ設定したピーク時刻と比較することで、測定異常を判定するものである。特許文献2に記載された方法は、測定対象である時系列信号のピークからの一定時間後の減衰量を抽出し、正常な場合の減衰量と比較することで、測定異常を判定するものである。
また、特許文献1、2には、測定対象成分の濃度に換算される積分値の算出に使用するための時系列信号を基にして、特定の1つの特徴量(それぞれピーク時刻またはピークからの一定時間後の減衰量)を抽出し、この1つの特徴量を用いて測定異常を判定する方法が提示されている。
また、特許文献1、2には、測定対象成分の濃度に換算される積分値の算出に使用するための時系列信号を基にして、特定の1つの特徴量(それぞれピーク時刻またはピークからの一定時間後の減衰量)を抽出し、この1つの特徴量を用いて測定異常を判定する方法が提示されている。
しかし、実際に起こりうる異常には、発光シグナルの時系列信号に及ぼす影響が僅かなものも多い。本発明者らは、例えば、長期間使用後の寿命超過容器やバクテリアの繁殖した発光基質溶液を使用したような異常系では、従来の時系列信号から抽出された上記の特徴量には顕著な変化が見られないことを見出した。
本発明は、時系列信号に僅かな影響しか及ぼさない異常が発生した場合に対しても、それを検知することによって、より信頼性の高い測定を実現する信号処理装置及び信号処理方法を提供することを目的とする。
上記の課題を解決するため、本発明に係る信号処理装置は、第1の時間分解能で第1の時系列信号を取得する第1計測部と、前記第1の時間分解能よりも高い第2の時間分解能で第2の時系列信号を取得する第2計測部と、前記第2の時系列信号に基づいて、測定異常の判定を行う判定部とを備えたことを特徴とする。
また、本発明に係る信号処理方法は、第1の時間分解能で第1の時系列信号を取得する第1の計測工程と、前記第1の時間分解能よりも高い第2の時間分解能で第2の時系列信号を取得する第2の計測工程と、前記第2の時系列信号に基づいて、測定異常の判定を行う判定工程とを備えたことを特徴とする。
また、本発明に係る信号処理方法は、第1の時間分解能で第1の時系列信号を取得する第1の計測工程と、前記第1の時間分解能よりも高い第2の時間分解能で第2の時系列信号を取得する第2の計測工程と、前記第2の時系列信号に基づいて、測定異常の判定を行う判定工程とを備えたことを特徴とする。
本発明の信号処理装置及び信号処理方法によれば、時系列信号に僅かな影響しか及ぼさない異常が発生した場合に対しても、それを検知することによって、より信頼性の高い測定を実現する信号処理装置及び信号処理方法を提供することができる。
以下、添付図面を参照して本実施形態について説明する。添付図面では、機能的に同じ要素は同じ番号で表示される場合もある。なお、添付図面は本開示の原理に則った実施形態と実装例を示しているが、これらは本開示の理解のためのものであり、決して本開示を限定的に解釈するために用いられるものではない。本明細書の記述は典型的な例示に過ぎず、本開示の特許請求の範囲又は適用例を如何なる意味においても限定するものではない。
本実施形態では、当業者が本開示を実施するのに十分詳細にその説明がなされているが、他の実装・形態も可能で、本開示の技術的思想の範囲と精神を逸脱することなく構成・構造の変更や多様な要素の置き換えが可能であることを理解する必要がある。従って、以降の記述をこれに限定して解釈してはならない。
[第1の実施の形態]
図1に、本発明の第1の実施の形態に係る信号処理装置の構成例を示す。この信号処理装置は、測定部10と、信号処理部20と、参照データ波形形状特徴量データベース30と、プロセッサ40と、表示部50とから大略構成され、これらの構成要素及び外部ネットワークがインタフェース60,70により接続されて、データのやり取りが可能に構成されている。
図1に、本発明の第1の実施の形態に係る信号処理装置の構成例を示す。この信号処理装置は、測定部10と、信号処理部20と、参照データ波形形状特徴量データベース30と、プロセッサ40と、表示部50とから大略構成され、これらの構成要素及び外部ネットワークがインタフェース60,70により接続されて、データのやり取りが可能に構成されている。
測定部10は、信号強度を一定の時間に亘って時系列的に計測する計測部を備えており、異なる時間分解能の測定が可能な複数の測定手段を備える。この図示の例では、低い時間分解能で時系列信号(第1の時系列信号)を取得する第1計測部11と、高い時間分解能で時系列信号(第2の時系列信号)を取得する第2計測部12との2つの計測手段を備えるが、3つ以上の計測手段を備えることも可能である。
第1計測部11、及び第2計測部12は、一例として血液や尿などの体液成分を検体としてその成分を分析する自動分析装置である。通常の成分分析においては、低い時間分解能の第1計測部11の測定結果が用いられる。高い時間分解能の第2計測部12の測定結果は、測定異常の判定のために用いられる。この点は、後に詳しく説明する。
第1計測部11、及び第2計測部12は、一例として血液や尿などの体液成分を検体としてその成分を分析する自動分析装置である。通常の成分分析においては、低い時間分解能の第1計測部11の測定結果が用いられる。高い時間分解能の第2計測部12の測定結果は、測定異常の判定のために用いられる。この点は、後に詳しく説明する。
このような自動分析装置が設置される診療現場では、受診当日に実施した検査の結果に基づく診療が定着しつつあり、臨床検査の迅速化が望まれてきている。また同時に、臨床検査装置として測定結果の確からしさをいかに担保するかがより重要視されてきている。近年、自動分析装置の性能の向上により、微量なサンプル、試薬でも様々な項目を高精度に分析することが可能となっている。その反面、装置各部の僅かな異常、サンプルや試薬の品質の微妙な経時的変化、また微小な外来ノイズなどが測定結果の精度に影響を及ぼすことがある。これらの測定異常を自動で迅速に検知することにより、測定結果の信頼性を向上させることが可能であると考えられる。この第1の実施の形態の信号処理装置は、以下に説明する特徴を有することにより、測定異常を迅速に検知し、測定結果の信頼性を向上させることができるものである。
信号処理部20は、時系列信号記憶部21、時系列信号データ処理部22、波形形状特徴量抽出部23、波形形状特徴量記憶部24、異常判定部25、及び結果出力部26を備える。
測定部10で新規に取得した時系列信号は、まず時系列信号記憶部21に記憶され、その後、時系列信号データ処理部22で所定のデータ処理を受ける。時系列信号データ処理部22は、第1計測部11及び第2計測部12の測定結果(時系列信号)を処理し、分析、その他必要なデータの演算を行う。
波形形状特徴量抽出部23は、第2計測部12で得られた測定信号の信号波形の形状の特徴量(波形形状特徴量:以下、単に「特徴量」と呼ぶこともある)を抽出する機能を有する。抽出された波形形状特徴量は波形形状特徴量記憶部24に記憶される。
測定部10で新規に取得した時系列信号は、まず時系列信号記憶部21に記憶され、その後、時系列信号データ処理部22で所定のデータ処理を受ける。時系列信号データ処理部22は、第1計測部11及び第2計測部12の測定結果(時系列信号)を処理し、分析、その他必要なデータの演算を行う。
波形形状特徴量抽出部23は、第2計測部12で得られた測定信号の信号波形の形状の特徴量(波形形状特徴量:以下、単に「特徴量」と呼ぶこともある)を抽出する機能を有する。抽出された波形形状特徴量は波形形状特徴量記憶部24に記憶される。
異常判定部25は、新規に測定され波形形状特徴量記憶部24に記憶された波形形状特徴量と、参照データ波形形状特徴量データベース30に蓄積された参照データの波形形状特徴量とを比較して異常判定を行う。結果出力部26は、その異常判定の結果を表示部50その他に出力する。プロセッサ40は、信号処理部20と連携して様々なデータ処理を実行する。表示部50は、液晶ディスプレイ、有機ELディスプレイ、プリンタなど、上記異常判定の結果や、その他の測定結果を出力可能なデバイスである。
図2に、第1計測部11、及び第2計測部12の一例としての自動分析装置200の構成例を示す。自動分析装置200は、一例として、光源201と、恒温槽202と、セル203と、試料分注ノズル204と、第1試薬分注ノズル205aと、第2試薬分注ノズル205bと、攪拌機構206と、光度計208と、増幅器209と、A/D変換器210A,210Bとで構成される。分析時には、光源(LED)201から発せられた光が、恒温槽202に浸されたセル203に照射され、試料からの発光光が光度計208に入射する。この光度計208の検出信号が増幅器209により増幅される。増幅された信号(アナログ信号)はA/D変換器210A,210Bにおいてデジタル信号に変換され出力される。A/D変換器210Aは、サンプリング周波数が小さく(サンプリング間隔が大きく)、図1の第1計測部11(低分解能)として機能する。一方、A/D変換器210Bは、A/D変換器210Aよりも大きなサンプリング周波数(小さなサンプリング間隔)でサンプリングを行い、図1の第2計測部12として機能する。一例として、A/D変換器210Aのサンプリング間隔は10mS~50mS程度、A/D変換器210Bのサンプリング間隔は100μS~300μS程度に設定することができる。
セル203は、検査対象である試料と試薬とを反応させるための反応容器である。セル203には、試料分注ノズル204から試料が注入され、第1試薬分注ノズル205aから第1試薬が分注され、第2試薬分注ノズル205bから第2試薬が分注される。これらの試料と試薬が、攪拌機構206によって撹拌されることで、セル203の内部で化学反応が起こる。このときの化学反応について、時系列的に発光度を測定(測光)することで、試料中の分析対象物の濃度を測定することができる。
図3は、A/D変換器210Aにおいて、トリガ信号の発生後、サンプリング間隔10mS、信号計測期間400mSで40点のデータを取得した場合の測定結果を示すグラフの例を示している。この40点の測定データが信号処理部20の時系列信号データ処理部22において信号計測期間(400mS)に亘って積分され、この得られた積分値に基づいて、検査対象の成分の濃度が求められる。
このような低い時間分解能の時系列信号においても、何らかの測定異常が発生すると、それは時系列信号のピークの大きさや位置のズレとして現れることはある。しかし、そのようなピークの大きさや位置のズレとしては現れず、判定が難しい測定異常があることに本発明者らは着目した。そこで、この第1の実施の形態では、本来の分析のために用いる低い時間分解能の信号をA/D変換器210Aから得ることに加え、高い時間分解能の信号をA/D変換器210Bから取得し、この高い時間分解能の信号に基づいて測定異常の有無を判定する。具体的には、低い時間分解能の信号をA/D変換器210A(第1計測部11)から取得して本来の測定に供する一方、定期的に(例えば1週間ごと)、又は所定のタイミング(毎朝の装置起動時、スタンバイ状態)又は測定異常が疑われたときに必要に応じて、これよりも高い時間分解能の信号をA/D変換器210B(第2計測部12)から得て測定異常の有無を判定する。
図4に、A/D変換器210Bから、トリガ信号の発生後、250μSのサンプリング間隔で得られた高分解能時系列信号の例を示す。A/D変換器210Bからの高分解能時系列信号は、A/D変換器210Aからの低時間分解能の信号の信号計測時間の全体に亘って取得されてもよいし、得られた高分解能時系列信号の注目する形状に応じて、当該信号計測時間よりも短い時間領域のみについて取得してもよい。
以下、図5のフローチャートを参照して、高分解能時系列信号の信号波形の形状に基づいて測定異常の有無を判定する処理方法の一例を説明する。
前述の通り、通常の検体の分析は、A/D変換器210Aからの低分解能時系列信号に基づいて行われるが、定期検査、及び必要に応じた検査により、装置の測定異常を判定する場合において、A/D変換器210Bからの高分解能時系列信号が用いられる。
A/D変換器210Bから高分解能時系列信号が取得され時系列信号記憶部21に記憶されると(ステップS1)、まず、時系列信号データ処理部22において、ノイズの影響を小さくした上で信号波形の形状を抽出するために、データの平滑化が行われる(ステップS2)。平滑化には、高速フーリエ変換を用いたローパスフィルタリング、平均値フィルタリング、メディアンフィルタリングなどの一般的な平滑化技術を用いることができる。
次に、信号波形に見られるピークの位置を抽出する(ステップS3)。ピークの位置の抽出方法を、図6を参照して説明する。平滑化後の時系列信号において、ノイズによる局所的な微小ピークの検出を避けて、大局的なピーク部分を抽出するための方法として、例えば、以下の式[数1]で定義される位置pをピーク部分として抽出する。
これは、平滑化された時系列信号において、ある時間幅wをもつ区間での傾きが正から負に変わる点をピーク部分として抽出することに相当する。ここで、wは抽出するピーク部分を含む任意の値である。wの値が小さい値となるほど、局所的な微小ピークを検出してしまいやすくなる。最適なwの値は、データに応じて網羅的に探索して決めることができる。
次に、信号波形の形状を表す波形形状特徴量を、平滑化された時系列信号から抽出する(ステップS4)。例えば、信号波形の局所的な傾きを、以下の特徴量s0、s1、s2として算出する。

ここで、~yは、時系列信号を最大信号強度で規格化した規格化信号強度、xは時間の関数である。bは時系列信号の立ち上がり時点の時刻を示し、また、p0はピーク部分の起点の時刻を示し、vはピーク部分の起点及び終点からの時間幅を示す。また、wはピーク部分の時間幅を示す。また、i、j、kは、各地点での傾きが計算される微小時間幅を示す。
特徴量s0は、時系列信号の立ち上がり時点での傾きに相当する特徴量である。一例として、特徴量s0は、上述の数式、及び図7に示すように、時系列信号がトリガ信号により立ち上がった時刻bにおける微小区間k(b~b+k)の傾きに相当する特徴量として算出することができる。特徴量s1は、ステップs3で抽出されたピーク位置pを含むピーク部分(p0~p0+w)の起点付近における傾きに相当する特徴量である。一例として、特徴量s1は、上述の数式、及び図7に示すように、ピーク部分の起点の時刻p0よりも時間幅vだけ前の時刻における微小区間i(p0-v~p0-v+i)の傾きに相当する特徴量として算出することができる。特徴量s2は、ステップs3で抽出されたピーク位置pを含むピーク部分(p0~p0+w)の終点付近における傾きに相当する特徴量である。一例として、特徴量s2は、上述の数式、及び図7に示すように、ピーク部分の終点の時刻p0+wよりも時間幅vだけ前の時刻における微小区間j(p0+w+v―j~p0+w+v)の傾きに相当する特徴量として算出することができる。
i、j、kに関しては、測定異常がないと判定されるときの正常データと、測定異常があると判定されるときのデータとの間の相違が最も大きくなるようなi、j、kが網羅的に探索され、この探索結果に従いi、j、kの値が決定され得る。
i、j、kに関しては、測定異常がないと判定されるときの正常データと、測定異常があると判定されるときのデータとの間の相違が最も大きくなるようなi、j、kが網羅的に探索され、この探索結果に従いi、j、kの値が決定され得る。
この後、ステップS5では、ステップS4で算出した波形形状特徴量s0、s1、s2に基づいて測定部10における測定異常の有無を判別する。測定異常の有無を判定する方法として、マハラノビス汎距離に基づく判別分析を用いることができる。マハラノビス汎距離Dは、あるデータクラスタからの距離を、クラスタ内のデータの分散を考慮して一般化したものであり、以下の式で定義される。
ここで、χは距離を求めたいデータ(例えば特徴量s0、s1、s2)の特徴量ベクトル、μはクラスタ内のデータの特徴量ベクトルの平均、Sはクラスタ内のデータの特徴量ベクトルの分散共分散行列である。マハラノビス汎距離Dに基づく判別分析は、新規の時系列信号の特徴量に関して、それぞれ正常参照データクラスタ(正常な測定により得られた測定データ群)と異常参照データクラスタ(所定の異常状態での測定により得られた測定データ群)からのマハラノビス汎距離D2
Normal、D2
Abnormalを求め、その大小関係を判別することにより、測定が正常か異常かを判断するものである。具体的には、大小関係が以下の判別関数となる場合に、式の右側に示される判断を行うものである。

図8に、長期間使用後の寿命超過反応容器を使用した測定システムにおいて異常判定を行うため、上述の特徴量s1と特徴量s0を計算した場合における、特徴量s1とs0の2次元空間でのデータ分布の例を示す。図8のグラフにおいて、横軸(slope1)は特徴量s1のマハラノビス汎距離の分布を示し、縦軸(slope0)は、特徴量s0のマハラノビス汎距離の分布を示す。この図8のグラフは、表示部50において表示することができ、オペレータに提示することで、新規に得られた時系列信号(測定結果)に測定異常が存在するか否かを示すことができる。
図8のグラフにおいて、黒の菱形のドットは正常と判定されたデータであり、白丸のドットは異常と判定されたデータである。図8中の曲線C1は、特徴量s1、s0についてD2 Normal=D2 Abnormalとなる位置を示している。この曲線C1を挟んで一方の側の測定結果は正常と判断され、他方の側の測定結果は異常と判断し得る。
図8のグラフにおいて、黒の菱形のドットは正常と判定されたデータであり、白丸のドットは異常と判定されたデータである。図8中の曲線C1は、特徴量s1、s0についてD2 Normal=D2 Abnormalとなる位置を示している。この曲線C1を挟んで一方の側の測定結果は正常と判断され、他方の側の測定結果は異常と判断し得る。
1つの特徴量のみに基づいた異常有無の判定の場合、正常と判定されたデータと異常と判定されたデータとが接近し測定の正常/異常の判断が難しい場合があり得るが、図8のように2つかそれ以上の特徴量に基づいた測定異常の有無の判定を行う場合には、正常と判定されたデータと異常と判定されたデータとの境界が明確になり、測定異常の有無の判定を正確且つ迅速に行うことが可能となる。図8は、2つの特徴量に基づく判定の場合を示したが、3つ、又はそれ以上の特徴量を用いることで、より正確な異常有無の判定を行うことが可能になる。
以上説明したように、この第1の実施の形態の信号処理装置によれば、低分解能の時系列信号で通常の測定を行う一方で、これとは別に高分解能の時系列信号を取得し、これを分析することにより、測定装置の測定異常を正確に検知することができる。高分解能の時系列信号は、測定異常の判定を行うタイミングで適宜行うことができるため、通常の測定の所要時間を長くすることなく、適切に測定異常の判定を行うことができる。
以上説明したように、この第1の実施の形態の信号処理装置によれば、低分解能の時系列信号で通常の測定を行う一方で、これとは別に高分解能の時系列信号を取得し、これを分析することにより、測定装置の測定異常を正確に検知することができる。高分解能の時系列信号は、測定異常の判定を行うタイミングで適宜行うことができるため、通常の測定の所要時間を長くすることなく、適切に測定異常の判定を行うことができる。
上記の例では、異常の有無の判定において、正常参照データと異常参照データの両方を用い、正常参照データに基づくマハラノビス汎距離D2
Normalと、異常参照データに基づくマハラノビス汎距離D2
Abnormalとを求め、その大小関係を比較して異常判定を行う。しかし、異常判定はこれに限定されるものではなく、例えば、正常参照データに基づくマハラノビス汎距離D2
Normalのみを用いて異常判定を行うこともできる。マハラノビス汎距離は、第一自由度p、第二自由度nのF分布に従うことが分かっている。ここで、pは特徴量の数、nはデータの数である。この性質を利用して、判別基準をp値=0.05に設定すると、判別関数を以下のように定義することができる。

なお、上記の例で示した各種判別関数は、ある装置で得られたものを汎用的に用いるだけでなく、装置毎に定義することもできる。
[第2の実施の形態]
次に、第2の実施の形態に係る信号処理装置を、図9~図11を参照して説明する。装置の全体構成は、第1の実施の形態(図1)と同様であるので、以下では重複する説明は省略する。この第2の実施の形態では、異常判定部25が、A/D変換器210Bから得られた高分解能時系列信号の信号波形の形状に基づき、測定異常の有無だけでなく測定異常の種類を推定するように構成されている。測定異常の種類は、例えば、装置各部の異常、試料や標識試薬の品質の経時的変化による異常、外来ノイズに基づく異常、いわゆるフック効果(高濃度の検体から疑似的に低い数値の測定結果が得られること)に基づく異常、検体に含まれる反応阻害物質に基づく測定異常などを含む。
以下に説明する具体例では、測定異常の種類として、セル203における異常と、フック効果に基づく異常の2つを識別する例を説明するが、これはあくまでも一例であり、別の種類の測定異常を検知することもできるし、同時に検知される測定異常の種類の数も、2種類に限らず、3種類以上とすることも可能である。
図9のフローチャートを参照して、高分解能時系列信号の信号波形の形状に基づいて測定異常有無及びその種類を判定する処理の一例について説明する。ここでは、第1の実施の形態で説明した3種類の特徴量s1、s2、s0を高分解能時系列信号から取得し、それぞれについてマハラノビス汎距離を計算した例を説明する。
第1の実施の形態と同様に、高分解能時系列信号が取得・記憶され(ステップS1)、平滑化が行われ(ステップS2)、信号波形のピークの位置が抽出される(ステップS3)。次に、ステップS4において、特徴量s0、s1、s2が算出され、ステップS5’において異常の有無、及びその種類が判定される。ステップS6では、その判定結果が出力される。
ステップS5’における、特徴量s0、s1、s2に基づく測定異常の有無及びその種類の判定について、図10及び図11を参照して説明する。図10及び図11は、第2の実施の形態に従った測定の結果をプロットしたグラフの一例である。図10の横軸は、特徴量s1に対応し、縦軸は特徴量s0に対応する。図11の横軸は、特徴量s1に対応し、縦軸は特徴量s2に対応する。すなわち、図10と図11とにより、特徴量s0、s1、s2のマハラノビス汎距離が3次元座標で表されている。
この第2の実施の形態では、特徴量のマハラノビス汎距離を計算し、このマハラノビス汎距離に基づいて測定異常の有無を判定し、更に測定の種類も判定することができる。すなわち、新規の時系列信号に対して、それぞれ正常参照データクラスタ、フック現象由来異常参照データクラスタ、セル由来異常参照データクラスタからのマハラノビス汎距離D2 Normal、D2 AbnormalH、D2 AbnormalCを求め、その大小関係を判別することにより、測定が正常か異常かを判断することができる。図10及び図11のグラフにおいて、黒の菱形のドットは正常と判定されたデータであり、十字のドットはフック現象が原因となって測定異常と判定されるデータであり、白丸のドットはセルの寿命超過が原因で測定異常と判定されるデータである。
以上説明したように、第2の実施の形態によれば、第1の実施の形態と同一の効果を得ることができることに加え、測定異常の種類も判定することができる。
以上、本発明のいくつかの実施の形態を説明したが、これらの実施の形態は、例として提示したものであり、発明の範囲を限定することは意図していない。これら新規な実施の形態は、その他の様々な形態で実施されることが可能であり、発明の要旨を逸脱しない範囲で、種々の省略、置き換え、変更を行うことができる。これら実施の形態やその変形は、発明の範囲や要旨に含まれるとともに、特許請求の範囲に記載された発明とその均等の範囲に含まれる。
10…測定部、 11…第1計測部、 12…第2計測部、 20…信号処理部、 21…時系列信号記憶部、 22…時系列信号データ処理部、 23…波形形状特徴量抽出部24…波形形状特徴量記憶部、 25…異常判定部、 26…結果出力部、 30…参照データ波形形状特徴量データベース、 40…プロセッサ、 50…表示部、 60…インタフェース、 70…インタフェース、 200…自動分析装置、 201…光源(LED)、 202…恒温槽、 203…セル、 204…試料分注ノズル、 205a…第1試薬分注ノズル、 205b…第2試薬分注ノズル、 206…攪拌機構、 208…光度計、 209…増幅器、 210A,210B…A/D変換器。
Claims (13)
- 第1の時間分解能で第1の時系列信号を取得する第1計測部と、
前記第1の時間分解能よりも高い第2の時間分解能で第2の時系列信号を取得する第2計測部と、
前記第2の時系列信号に基づいて、測定異常の判定を行う判定部と
を備えたことを特徴とする信号処理装置。 - 前記判定部は、前記第2の時系列信号のピーク位置に関する特徴量に基づき、測定異常の判定を行う、請求項1に記載の信号処理装置。
- 前記判定部は、前記第2の時系列信号のピーク位置を含むピーク部分の起点付近及び終点付近の特徴量に基づき、測定異常の判定を行う、請求項2に記載の信号処理装置。
- 前記判定部は、前記第2の時系列信号の立ち上がり部分の特徴量に基づき、測定異常の判定を行う、請求項1~3のいずれか1項に記載の信号処理装置。
- 前記判定部は、前記第2の時系列信号の立ち上がり部分の特徴量、前記第2の時系列信号のピーク位置を含むピーク部分の起点付近の特徴量、及び前記第2の時系列信号のピーク位置を含むピーク部分の終点付近の特徴量のうちの少なくとも1つに基づき、測定異常の判定を行う、請求項1に記載の信号処理装置。
- 前記第2の時系列信号を平滑化し、前記平滑化後の前記第2の時系列信号のピーク位置を抽出するデータ処理部を更に備え、
前記判定部は、前記ピーク位置に関する特徴量に基づき、測定異常の判定を行う、請求項1に記載の信号処理装置。 - 前記判定部は、前記特徴量の参照データクラスタからのマハラノビス汎距離を求め、このマハラノビス汎距離に基づき測定異常の判定を行う、請求項6に記載の信号処理装置。
- 前記参照データクラスタは、正常な測定に基づく測定データ群である正常参照データクラスタと、所定の異常状態での測定に基づく測定データ群である異常参照データクラスタとを含み、
前記判定部は、前記特徴量の前記正常参照データクラスタからのマハラノビス汎距離と、前記特徴量の前記異常参照データクラスタからのマハラノビス汎距離とを比較し、その比較結果に基づき測定異常の判定を行う、請求項7に記載の信号処理装置。 - 前記判定部は、前記特徴量の分布状態に基づき、前記測定異常の有無に加え、前記測定異常の種類の判定を行うことを特徴とする、請求項2又は4に記載の信号処理装置。
- 第1の時間分解能で第1の時系列信号を取得する第1の計測工程と、
前記第1の時間分解能よりも高い第2の時間分解能で第2の時系列信号を取得する第2の計測工程と、
前記第2の時系列信号に基づいて、測定異常の判定を行う判定工程と
を備えたことを特徴とする、信号処理方法。 - 前記判定工程は、前記第2の時系列信号のピーク位置に関する特徴量に基づき、測定異常の判定を行う、請求項10に記載の信号処理方法。
- 前記判定工程は、前記第2の時系列信号のピーク位置を含むピーク部分の起点付近及び終点付近の特徴量に基づき、測定異常の判定を行う、請求項11に記載の信号処理方法。
- 前記判定工程は、前記第2の時系列信号の立ち上がり部分の特徴量に基づき、測定異常の判定を行う、請求項10~12のいずれか1項に記載の信号処理方法。
Priority Applications (3)
| Application Number | Priority Date | Filing Date | Title |
|---|---|---|---|
| EP18890119.3A EP3730930B1 (en) | 2017-12-19 | 2018-11-21 | Signal processing device and signal processing method |
| US16/772,252 US20210102964A1 (en) | 2017-12-19 | 2018-11-21 | Signal processing device and signal processing method |
| CN201880076352.1A CN111727366B (zh) | 2017-12-19 | 2018-11-21 | 信号处理装置和信号处理方法 |
Applications Claiming Priority (2)
| Application Number | Priority Date | Filing Date | Title |
|---|---|---|---|
| JP2017-242815 | 2017-12-19 | ||
| JP2017242815A JP6762927B2 (ja) | 2017-12-19 | 2017-12-19 | 信号処理装置及び信号処理方法 |
Publications (1)
| Publication Number | Publication Date |
|---|---|
| WO2019123956A1 true WO2019123956A1 (ja) | 2019-06-27 |
Family
ID=66993231
Family Applications (1)
| Application Number | Title | Priority Date | Filing Date |
|---|---|---|---|
| PCT/JP2018/042940 WO2019123956A1 (ja) | 2017-12-19 | 2018-11-21 | 信号処理装置及び信号処理方法 |
Country Status (5)
| Country | Link |
|---|---|
| US (1) | US20210102964A1 (ja) |
| EP (1) | EP3730930B1 (ja) |
| JP (1) | JP6762927B2 (ja) |
| CN (1) | CN111727366B (ja) |
| WO (1) | WO2019123956A1 (ja) |
Families Citing this family (3)
| Publication number | Priority date | Publication date | Assignee | Title |
|---|---|---|---|---|
| JP7346858B2 (ja) * | 2019-03-14 | 2023-09-20 | 株式会社リコー | 生体情報計測装置、生体情報計測システム、生体情報計測方法及び生体情報計測プログラム |
| JP7323816B2 (ja) * | 2021-06-21 | 2023-08-09 | 東亜ディーケーケー株式会社 | エンドトキシン測定方法 |
| CN115754151A (zh) * | 2022-11-18 | 2023-03-07 | 中冶赛迪工程技术股份有限公司 | 输出信号质量确定方法、报警方法、系统、设备及介质 |
Citations (15)
| Publication number | Priority date | Publication date | Assignee | Title |
|---|---|---|---|---|
| JPS63101758A (ja) * | 1986-10-20 | 1988-05-06 | Toshiba Corp | 自動化学分析装置 |
| JPH1137921A (ja) * | 1997-07-14 | 1999-02-12 | Horiba Ltd | 分析装置および分析装置の表示装置 |
| JP2003524753A (ja) * | 1998-04-23 | 2003-08-19 | サンディア コーポレーション | プラズマ処理操作を監視する方法及び装置 |
| JP2004125780A (ja) * | 2002-08-07 | 2004-04-22 | Hitachi High-Technologies Corp | サンプル分注装置およびそれを用いた自動分析装置 |
| JP2004239790A (ja) * | 2003-02-07 | 2004-08-26 | Matsushita Electric Ind Co Ltd | 分析装置 |
| JP2005127757A (ja) * | 2003-10-22 | 2005-05-19 | Hitachi High-Technologies Corp | 自動分析装置 |
| JP2006023214A (ja) * | 2004-07-09 | 2006-01-26 | Hitachi High-Technologies Corp | 測定反応過程の異常の有無判定方法,該方法を実行可能な自動分析装置及び該方法のプログラムを記憶した記憶媒体 |
| JP2007085804A (ja) | 2005-09-21 | 2007-04-05 | Hitachi High-Technologies Corp | 積分型データ演算法におけるチェック機能を備えたデータ処理方法 |
| JP2007248089A (ja) * | 2006-03-14 | 2007-09-27 | Hitachi High-Technologies Corp | 自己診断型自動分析装置 |
| JP2008032582A (ja) * | 2006-07-31 | 2008-02-14 | Hitachi High-Technologies Corp | 異物・欠陥検査装置および異物欠陥・検査方法 |
| JP2009192490A (ja) * | 2008-02-18 | 2009-08-27 | Hamamatsu Photonics Kk | 蛍光解析装置及び解析方法 |
| JP2012035152A (ja) * | 2010-08-03 | 2012-02-23 | Nippon Steel & Sumikin Metal Products Co Ltd | フロック形成状態判定方法、フロック形成状態判定装置、凝集反応槽、pH調整槽、及び異常発生通報システム |
| JP2013036756A (ja) * | 2011-08-03 | 2013-02-21 | Sysmex Corp | 検体分析装置 |
| JP2013152215A (ja) | 2012-01-25 | 2013-08-08 | F. Hoffmann-La Roche Ag | 液体試料中の分析物を検出する発光法及び分析システム |
| JP6126290B1 (ja) * | 2016-10-17 | 2017-05-10 | ヴィスコ・テクノロジーズ株式会社 | 外観検査装置 |
Family Cites Families (11)
| Publication number | Priority date | Publication date | Assignee | Title |
|---|---|---|---|---|
| JP2008146157A (ja) * | 2006-12-06 | 2008-06-26 | Mitsubishi Electric Corp | ネットワーク異常判定装置 |
| JP2010069065A (ja) * | 2008-09-19 | 2010-04-02 | Panasonic Corp | 非侵襲血糖測定装置 |
| EP2330426B1 (en) * | 2008-09-30 | 2020-03-11 | Hitachi High-Technologies Corporation | Automatic analyzing system |
| JP5865633B2 (ja) * | 2011-09-01 | 2016-02-17 | 株式会社日立ハイテクノロジーズ | 自動分析装置 |
| CN103760133B (zh) * | 2014-01-24 | 2016-04-20 | 深圳市安鑫宝科技发展有限公司 | 检测农副产品异常成分的方法及装置 |
| US10288637B2 (en) * | 2014-05-15 | 2019-05-14 | Hitachi High-Technologies Corporation | Automatic analyzer |
| CA2944147A1 (en) * | 2014-06-06 | 2015-12-10 | Dexcom, Inc. | Fault discrimination and responsive processing based on data and context |
| CN107110743B (zh) * | 2015-01-21 | 2019-12-10 | 三菱电机株式会社 | 检查数据处理装置以及检查数据处理方法 |
| US9696204B2 (en) * | 2015-08-03 | 2017-07-04 | Spectrasensors, Inc. | Determination and correction of frequency registration deviations for quantitative spectroscopy |
| CN106442574B (zh) * | 2016-08-31 | 2019-05-28 | 上海创和亿电子科技发展有限公司 | 一种基于微波水分仪的产品霉变检测系统和检测方法 |
| WO2019008677A1 (ja) * | 2017-07-04 | 2019-01-10 | オリンパス株式会社 | 信号取得装置 |
-
2017
- 2017-12-19 JP JP2017242815A patent/JP6762927B2/ja active Active
-
2018
- 2018-11-21 WO PCT/JP2018/042940 patent/WO2019123956A1/ja active Search and Examination
- 2018-11-21 EP EP18890119.3A patent/EP3730930B1/en active Active
- 2018-11-21 US US16/772,252 patent/US20210102964A1/en not_active Abandoned
- 2018-11-21 CN CN201880076352.1A patent/CN111727366B/zh active Active
Patent Citations (15)
| Publication number | Priority date | Publication date | Assignee | Title |
|---|---|---|---|---|
| JPS63101758A (ja) * | 1986-10-20 | 1988-05-06 | Toshiba Corp | 自動化学分析装置 |
| JPH1137921A (ja) * | 1997-07-14 | 1999-02-12 | Horiba Ltd | 分析装置および分析装置の表示装置 |
| JP2003524753A (ja) * | 1998-04-23 | 2003-08-19 | サンディア コーポレーション | プラズマ処理操作を監視する方法及び装置 |
| JP2004125780A (ja) * | 2002-08-07 | 2004-04-22 | Hitachi High-Technologies Corp | サンプル分注装置およびそれを用いた自動分析装置 |
| JP2004239790A (ja) * | 2003-02-07 | 2004-08-26 | Matsushita Electric Ind Co Ltd | 分析装置 |
| JP2005127757A (ja) * | 2003-10-22 | 2005-05-19 | Hitachi High-Technologies Corp | 自動分析装置 |
| JP2006023214A (ja) * | 2004-07-09 | 2006-01-26 | Hitachi High-Technologies Corp | 測定反応過程の異常の有無判定方法,該方法を実行可能な自動分析装置及び該方法のプログラムを記憶した記憶媒体 |
| JP2007085804A (ja) | 2005-09-21 | 2007-04-05 | Hitachi High-Technologies Corp | 積分型データ演算法におけるチェック機能を備えたデータ処理方法 |
| JP2007248089A (ja) * | 2006-03-14 | 2007-09-27 | Hitachi High-Technologies Corp | 自己診断型自動分析装置 |
| JP2008032582A (ja) * | 2006-07-31 | 2008-02-14 | Hitachi High-Technologies Corp | 異物・欠陥検査装置および異物欠陥・検査方法 |
| JP2009192490A (ja) * | 2008-02-18 | 2009-08-27 | Hamamatsu Photonics Kk | 蛍光解析装置及び解析方法 |
| JP2012035152A (ja) * | 2010-08-03 | 2012-02-23 | Nippon Steel & Sumikin Metal Products Co Ltd | フロック形成状態判定方法、フロック形成状態判定装置、凝集反応槽、pH調整槽、及び異常発生通報システム |
| JP2013036756A (ja) * | 2011-08-03 | 2013-02-21 | Sysmex Corp | 検体分析装置 |
| JP2013152215A (ja) | 2012-01-25 | 2013-08-08 | F. Hoffmann-La Roche Ag | 液体試料中の分析物を検出する発光法及び分析システム |
| JP6126290B1 (ja) * | 2016-10-17 | 2017-05-10 | ヴィスコ・テクノロジーズ株式会社 | 外観検査装置 |
Non-Patent Citations (3)
| Title |
|---|
| JAPAN SPECTROSCOPY SOCIETY: "Chapter 5, Analyzing Spectral Data", SPECTROMETER Q&A, 20 July 2009 (2009-07-20), pages 130 - 152, XP009520851, DOI: 978-4-06-157110-5 * |
| See also references of EP3730930A4 |
| TETSUO SHIBA ET.AL.: "3.6 How to read the chromatogram", INSTRUMENT ANALYSIS TOOL (2), 2ND ED., vol. 2, 30 March 1996 (1996-03-30), pages 48 - 52, XP009520852, ISBN: 4-7598-0293-2 * |
Also Published As
| Publication number | Publication date |
|---|---|
| EP3730930A4 (en) | 2021-11-17 |
| EP3730930A1 (en) | 2020-10-28 |
| CN111727366A (zh) | 2020-09-29 |
| JP2019109152A (ja) | 2019-07-04 |
| JP6762927B2 (ja) | 2020-09-30 |
| EP3730930B1 (en) | 2023-08-09 |
| US20210102964A1 (en) | 2021-04-08 |
| CN111727366B (zh) | 2023-06-27 |
Similar Documents
| Publication | Publication Date | Title |
|---|---|---|
| JP3093270B2 (ja) | 光学的試料分析装置及び方法 | |
| JP4276894B2 (ja) | 異常検出システム及び異常検出方法 | |
| US10203277B2 (en) | Automatic analysis device and automatic analysis method | |
| WO2009145251A1 (ja) | 反応過程データの異常判定支援方法及び自動分析装置 | |
| EP3828531B1 (en) | Information processing device, information processing method, information processing system, and program | |
| WO2019123956A1 (ja) | 信号処理装置及び信号処理方法 | |
| WO2015098473A1 (ja) | 自動分析装置及び分析方法 | |
| US20210254125A1 (en) | Method and device for estimating number of cells | |
| JPWO2017115775A1 (ja) | 分析装置、分析方法、および、分析システム | |
| JP2007322243A (ja) | 自動分析装置 | |
| JP2005127757A (ja) | 自動分析装置 | |
| KR102205900B1 (ko) | 분석장치 및 분석장치의 카트리지 장착상태를 판단하는 방법 | |
| CN114174800B (zh) | 自动分析装置 | |
| JP5787948B2 (ja) | 反応過程データの異常判定支援方法及び自動分析装置 | |
| JP2006275771A (ja) | 細胞画像解析装置 | |
| JP2017020956A (ja) | 自動分析装置、自動分析方法及びプログラム | |
| JP2010117290A (ja) | 液体試料成分の分析装置および分析方法 | |
| US20180185838A1 (en) | A biochemical analytical technique | |
| JPWO2020080271A1 (ja) | 異常判定方法、および自動分析装置 | |
| JP2005207897A (ja) | 自動分析装置 | |
| EP4502610A1 (en) | Data processing system and method for automatic analyzer | |
| CN118962125B (zh) | 一种荧光免疫层析测试数据的处理方法 | |
| JP2005030950A (ja) | 固定化された物質の定量方法 | |
| HK1014598B (en) | Optical specimen analysis system and method |
Legal Events
| Date | Code | Title | Description |
|---|---|---|---|
| 121 | Ep: the epo has been informed by wipo that ep was designated in this application |
Ref document number: 18890119 Country of ref document: EP Kind code of ref document: A1 |
|
| DPE1 | Request for preliminary examination filed after expiration of 19th month from priority date (pct application filed from 20040101) | ||
| NENP | Non-entry into the national phase |
Ref country code: DE |
|
| ENP | Entry into the national phase |
Ref document number: 2018890119 Country of ref document: EP Effective date: 20200720 |