WO2019088271A1 - 歯周ポケット炎症面積の推定方法 - Google Patents
歯周ポケット炎症面積の推定方法 Download PDFInfo
- Publication number
- WO2019088271A1 WO2019088271A1 PCT/JP2018/040916 JP2018040916W WO2019088271A1 WO 2019088271 A1 WO2019088271 A1 WO 2019088271A1 JP 2018040916 W JP2018040916 W JP 2018040916W WO 2019088271 A1 WO2019088271 A1 WO 2019088271A1
- Authority
- WO
- WIPO (PCT)
- Prior art keywords
- bacteria
- streptococcus
- pisa
- value
- amount
- Prior art date
Links
- 0 C*(C)C(/C=C/C=*1*****)=C(C)C=*C=CC=C2C=CC1=CC2 Chemical compound C*(C)C(/C=C/C=*1*****)=C(C)C=*C=CC=C2C=CC1=CC2 0.000 description 4
Images


Classifications
-
- C—CHEMISTRY; METALLURGY
- C12—BIOCHEMISTRY; BEER; SPIRITS; WINE; VINEGAR; MICROBIOLOGY; ENZYMOLOGY; MUTATION OR GENETIC ENGINEERING
- C12Q—MEASURING OR TESTING PROCESSES INVOLVING ENZYMES, NUCLEIC ACIDS OR MICROORGANISMS; COMPOSITIONS OR TEST PAPERS THEREFOR; PROCESSES OF PREPARING SUCH COMPOSITIONS; CONDITION-RESPONSIVE CONTROL IN MICROBIOLOGICAL OR ENZYMOLOGICAL PROCESSES
- C12Q1/00—Measuring or testing processes involving enzymes, nucleic acids or microorganisms; Compositions therefor; Processes of preparing such compositions
- C12Q1/68—Measuring or testing processes involving enzymes, nucleic acids or microorganisms; Compositions therefor; Processes of preparing such compositions involving nucleic acids
- C12Q1/6813—Hybridisation assays
- C12Q1/6834—Enzymatic or biochemical coupling of nucleic acids to a solid phase
- C12Q1/6837—Enzymatic or biochemical coupling of nucleic acids to a solid phase using probe arrays or probe chips
-
- C—CHEMISTRY; METALLURGY
- C12—BIOCHEMISTRY; BEER; SPIRITS; WINE; VINEGAR; MICROBIOLOGY; ENZYMOLOGY; MUTATION OR GENETIC ENGINEERING
- C12Q—MEASURING OR TESTING PROCESSES INVOLVING ENZYMES, NUCLEIC ACIDS OR MICROORGANISMS; COMPOSITIONS OR TEST PAPERS THEREFOR; PROCESSES OF PREPARING SUCH COMPOSITIONS; CONDITION-RESPONSIVE CONTROL IN MICROBIOLOGICAL OR ENZYMOLOGICAL PROCESSES
- C12Q1/00—Measuring or testing processes involving enzymes, nucleic acids or microorganisms; Compositions therefor; Processes of preparing such compositions
- C12Q1/68—Measuring or testing processes involving enzymes, nucleic acids or microorganisms; Compositions therefor; Processes of preparing such compositions involving nucleic acids
- C12Q1/6876—Nucleic acid products used in the analysis of nucleic acids, e.g. primers or probes
- C12Q1/6883—Nucleic acid products used in the analysis of nucleic acids, e.g. primers or probes for diseases caused by alterations of genetic material
-
- C—CHEMISTRY; METALLURGY
- C12—BIOCHEMISTRY; BEER; SPIRITS; WINE; VINEGAR; MICROBIOLOGY; ENZYMOLOGY; MUTATION OR GENETIC ENGINEERING
- C12Q—MEASURING OR TESTING PROCESSES INVOLVING ENZYMES, NUCLEIC ACIDS OR MICROORGANISMS; COMPOSITIONS OR TEST PAPERS THEREFOR; PROCESSES OF PREPARING SUCH COMPOSITIONS; CONDITION-RESPONSIVE CONTROL IN MICROBIOLOGICAL OR ENZYMOLOGICAL PROCESSES
- C12Q1/00—Measuring or testing processes involving enzymes, nucleic acids or microorganisms; Compositions therefor; Processes of preparing such compositions
- C12Q1/68—Measuring or testing processes involving enzymes, nucleic acids or microorganisms; Compositions therefor; Processes of preparing such compositions involving nucleic acids
- C12Q1/6876—Nucleic acid products used in the analysis of nucleic acids, e.g. primers or probes
- C12Q1/6888—Nucleic acid products used in the analysis of nucleic acids, e.g. primers or probes for detection or identification of organisms
- C12Q1/689—Nucleic acid products used in the analysis of nucleic acids, e.g. primers or probes for detection or identification of organisms for bacteria
-
- G—PHYSICS
- G16—INFORMATION AND COMMUNICATION TECHNOLOGY [ICT] SPECIALLY ADAPTED FOR SPECIFIC APPLICATION FIELDS
- G16B—BIOINFORMATICS, i.e. INFORMATION AND COMMUNICATION TECHNOLOGY [ICT] SPECIALLY ADAPTED FOR GENETIC OR PROTEIN-RELATED DATA PROCESSING IN COMPUTATIONAL MOLECULAR BIOLOGY
- G16B20/00—ICT specially adapted for functional genomics or proteomics, e.g. genotype-phenotype associations
- G16B20/20—Allele or variant detection, e.g. single nucleotide polymorphism [SNP] detection
-
- G—PHYSICS
- G16—INFORMATION AND COMMUNICATION TECHNOLOGY [ICT] SPECIALLY ADAPTED FOR SPECIFIC APPLICATION FIELDS
- G16B—BIOINFORMATICS, i.e. INFORMATION AND COMMUNICATION TECHNOLOGY [ICT] SPECIALLY ADAPTED FOR GENETIC OR PROTEIN-RELATED DATA PROCESSING IN COMPUTATIONAL MOLECULAR BIOLOGY
- G16B40/00—ICT specially adapted for biostatistics; ICT specially adapted for bioinformatics-related machine learning or data mining, e.g. knowledge discovery or pattern finding
- G16B40/20—Supervised data analysis
-
- C—CHEMISTRY; METALLURGY
- C12—BIOCHEMISTRY; BEER; SPIRITS; WINE; VINEGAR; MICROBIOLOGY; ENZYMOLOGY; MUTATION OR GENETIC ENGINEERING
- C12N—MICROORGANISMS OR ENZYMES; COMPOSITIONS THEREOF; PROPAGATING, PRESERVING, OR MAINTAINING MICROORGANISMS; MUTATION OR GENETIC ENGINEERING; CULTURE MEDIA
- C12N15/00—Mutation or genetic engineering; DNA or RNA concerning genetic engineering, vectors, e.g. plasmids, or their isolation, preparation or purification; Use of hosts therefor
- C12N15/09—Recombinant DNA-technology
-
- G—PHYSICS
- G16—INFORMATION AND COMMUNICATION TECHNOLOGY [ICT] SPECIALLY ADAPTED FOR SPECIFIC APPLICATION FIELDS
- G16B—BIOINFORMATICS, i.e. INFORMATION AND COMMUNICATION TECHNOLOGY [ICT] SPECIALLY ADAPTED FOR GENETIC OR PROTEIN-RELATED DATA PROCESSING IN COMPUTATIONAL MOLECULAR BIOLOGY
- G16B30/00—ICT specially adapted for sequence analysis involving nucleotides or amino acids
- G16B30/10—Sequence alignment; Homology search
-
- G—PHYSICS
- G16—INFORMATION AND COMMUNICATION TECHNOLOGY [ICT] SPECIALLY ADAPTED FOR SPECIFIC APPLICATION FIELDS
- G16H—HEALTHCARE INFORMATICS, i.e. INFORMATION AND COMMUNICATION TECHNOLOGY [ICT] SPECIALLY ADAPTED FOR THE HANDLING OR PROCESSING OF MEDICAL OR HEALTHCARE DATA
- G16H10/00—ICT specially adapted for the handling or processing of patient-related medical or healthcare data
- G16H10/40—ICT specially adapted for the handling or processing of patient-related medical or healthcare data for data related to laboratory analysis, e.g. patient specimen analysis
-
- G—PHYSICS
- G16—INFORMATION AND COMMUNICATION TECHNOLOGY [ICT] SPECIALLY ADAPTED FOR SPECIFIC APPLICATION FIELDS
- G16H—HEALTHCARE INFORMATICS, i.e. INFORMATION AND COMMUNICATION TECHNOLOGY [ICT] SPECIALLY ADAPTED FOR THE HANDLING OR PROCESSING OF MEDICAL OR HEALTHCARE DATA
- G16H50/00—ICT specially adapted for medical diagnosis, medical simulation or medical data mining; ICT specially adapted for detecting, monitoring or modelling epidemics or pandemics
- G16H50/20—ICT specially adapted for medical diagnosis, medical simulation or medical data mining; ICT specially adapted for detecting, monitoring or modelling epidemics or pandemics for computer-aided diagnosis, e.g. based on medical expert systems
-
- G—PHYSICS
- G16—INFORMATION AND COMMUNICATION TECHNOLOGY [ICT] SPECIALLY ADAPTED FOR SPECIFIC APPLICATION FIELDS
- G16H—HEALTHCARE INFORMATICS, i.e. INFORMATION AND COMMUNICATION TECHNOLOGY [ICT] SPECIALLY ADAPTED FOR THE HANDLING OR PROCESSING OF MEDICAL OR HEALTHCARE DATA
- G16H50/00—ICT specially adapted for medical diagnosis, medical simulation or medical data mining; ICT specially adapted for detecting, monitoring or modelling epidemics or pandemics
- G16H50/30—ICT specially adapted for medical diagnosis, medical simulation or medical data mining; ICT specially adapted for detecting, monitoring or modelling epidemics or pandemics for calculating health indices; for individual health risk assessment
-
- Y—GENERAL TAGGING OF NEW TECHNOLOGICAL DEVELOPMENTS; GENERAL TAGGING OF CROSS-SECTIONAL TECHNOLOGIES SPANNING OVER SEVERAL SECTIONS OF THE IPC; TECHNICAL SUBJECTS COVERED BY FORMER USPC CROSS-REFERENCE ART COLLECTIONS [XRACs] AND DIGESTS
- Y02—TECHNOLOGIES OR APPLICATIONS FOR MITIGATION OR ADAPTATION AGAINST CLIMATE CHANGE
- Y02A—TECHNOLOGIES FOR ADAPTATION TO CLIMATE CHANGE
- Y02A50/00—TECHNOLOGIES FOR ADAPTATION TO CLIMATE CHANGE in human health protection, e.g. against extreme weather
- Y02A50/30—Against vector-borne diseases, e.g. mosquito-borne, fly-borne, tick-borne or waterborne diseases whose impact is exacerbated by climate change
Definitions
- the present invention relates to a method of estimating periodontal pocket inflammation area.
- Patent Document 1 discloses a periodontal disease diagnosis method using a protein contained in gingival crevicular fluid as a periodontal disease marker.
- Patent Document 2 discloses a method of predicting the depth of a periodontal pocket (PPD) and the gum bleeding index (BOP) by analyzing a plurality of proteins in saliva.
- PPD periodontal pocket
- BOP gum bleeding index
- Patent Document 3 measurement of periodontitis bacteria present in gingival crevicular fluid and measurement of periodontitis bacteria in saliva are carried out.
- an inflammation area (PISA value) calculated from the depth of periodontal pocket (PPD) and gingival bleeding index (BOP) has been proposed (PISA value) Patent Document 1).
- the PISA value is calculated by multiplying the PESA value (surface area in periodontal pocket) calculated from the depth of periodontal pocket (PPD) by the gum bleeding index (BOP).
- Non-Patent Document 2 This index is, as described in the literature, from the attachment level to the clinical root surface area (sum of the surface area of the root located on the apical side from the gingival margin; Clinical Area of Tooth Root Surface; CARS), and from that value the effective root surface area Calculated by subtracting a value.
- the position of the gingival margin is calculated by replacing all cases with the anatomical neck line, which is identical to the value of PESA shown in Fig. 1 (b) of Non-Patent Document 1 Conceivable.
- the gingival bleeding index (BOP) is not taken into account in the calculation, the CAPRS value approximately captures the area itself as an inflammation area on the inner surface of the pocket as described in the literature and should be considered as a "periodontal pocket inflammation area" together with the PISA value. Can.
- Periodontal inflamed surface area quantifying inflammatory burden. J Clin Periodontol. 2008 Aug; 35 (8): 668-73. "Clinical significance of the periodontal pocket area evaluation method as a test marker for systemic disease related to periodontal disease" Journal of Japan Oral Examination Society Volume 1 No. 1: 7-12, 2009
- the present invention has been made in consideration of the above situation, and provides a method for estimating the periodontal pocket inflammation area and a method for comprehensively estimating the degree of inflammation of periodontal tissue shown below.
- [1] A method for detecting the bacterial amount of two or more kinds of bacteria in saliva and estimating the periodontal pocket inflammation area using the obtained detection result as an index, wherein the bacteria to be detected are the bacterial amount of the bacteria Bacteria showing positive correlation with periodontal pocket inflammation area, A method comprising the bacteria showing a negative correlation between the bacterial amount of the bacteria and the periodontal pocket inflammation area. [2] The method according to [1], wherein the periodontal pocket inflammation area is represented by the value of PISA or CAPRS. [3] Bacteria showing positive correlation are Treponema denticola, Tannerella forsythia, Fusobacterium nucleatum subsp.
- Streptococcus intermedius Capnocytophaga ochracea, Capnocytophaga spumblea, Aggregatibacter actinomycetemcomitans, Fusobacterium nucleatum subsp. polymorphum, Fusobacterium periodonticum, SR1 sp.
- OT 345 Porphyromonas catoniae, Selenomonas sproda, Neisseria flavescens, Streptococcus sobrinus, Parvimonas micra, Peptostreptococcus stomatis, Treponema socranskii, Eubacterium [1] or [2], which is at least one member selected from the group consisting of saphenum, Eubacterium nodatum, Treponema medium, Filifactor alocis, and Porphyromonas endodontalis.
- [4] Bacteria that show a negative correlation are Streptococcus mutans, Actinomyces odontolyticus, Streptococcus mitis bv 2, Streptococcus mitis, Campylobacter concisus, Capnocytophaga gingalis, Prevotella salivani, which are used.
- [7] A method for comprehensively estimating the degree of inflammation of periodontal tissue by detecting the amount of bacteria of one or more bacteria in saliva and using the obtained detection result as an index.
- the method according to [7], wherein the degree of inflammation of periodontal tissue is the value of PISA or CAPRS.
- the method according to [7] or [8], wherein the amount of bacteria detected is the copy number of the bacteria in saliva.
- the method according to any one of [7] to [8], wherein the amount of bacteria to be detected is the amount of bacteria based on 16S rRNA sequence information of the bacteria in saliva.
- the bacteria to be detected are selected from Porphyromonas, Tannerella, Treponema, Prevotella, Campylobacter, Fusobacterium, Streptococcus, Aggregatibacter, Capnocytophaga, Eikenella, Actinomyces, Veillonella and The method according to any one of [7] to [10], which is a bacterium belonging to at least one genus.
- the bacteria to be detected are Streptococcus mutans, Actinomyces odontolyticus, Streptococcus mitis bv 2, Streptococcus mitis, Campylobacter concisus, Prevotella intermedia, Campylobacter showi, Prevotella ceruvateh, and the Eikenella secretoryus. , Fusobacterium periodonticum, Fusobacterium nucleatum subsp. polymorphum, Aggregatibacter actinomycetemcomitans, Capnocytophaga sproda, Capnocytophaga ochracea, Streptococcus intermedius, Fusobacterium nucleatum subsp.
- the above-mentioned positive-cognition bacteria may be used as the above-mentioned positive bacteria.
- the following factors may be used: bacteria;
- the method according to any one of [7] to [12], wherein the bacteria to be detected include bacteria in which the bacterial amount of the bacteria and the degree of inflammation of the periodontal tissue may be negatively correlated.
- the bacteria that may be negatively correlated include Streptococcus mutans, Actinomyces odontolyticus, Streptococcus mitis bv 2, Streptococcus mitis, Campylobacter concisus, Prevotella intermedia, Campylobacter showae, Prevotella nigechitives, Contiguchitechl
- the method according to [15] which is at least one selected from Constellatus and Campylobacter gracilis.
- the periodontal pocket inflammation area can be easily predicted based on the detection result of the amount of bacteria in saliva. That is, the degree of inflammation of the entire oral cavity can be easily estimated using collected saliva without precise periodontal disease examination (pocket measurement or imaging). Furthermore, according to the present invention, it is possible to simply predict the degree of inflammation of periodontal tissue such as the area of inflammation (PISA value, CAPRS value) based on the detection result of the amount of bacteria in saliva. That is, even without precise periodontal disease examination (pocket measurement or imaging), it is possible to simply estimate the degree of inflammation (inflation index numerical value) of the entire oral cavity using collected saliva.
- the degree of inflammation of periodontal tissue such as the area of inflammation (PISA value, CAPRS value)
- FIG. 10 shows a scatter plot of PISA actual values and the ratio of bacteria showing a positive correlation to the bacteria showing a negative correlation (“balance index”).
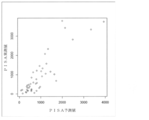
- the test was performed on 56 samples, and the amount of bacteria of bacterial species with statistically significant correlation with the PISA value (horizontal axis) was used as an explanatory variable, and a prediction model formula was created by multiple regression analysis to predict the PISA value ( It is a scatter diagram of the result of having made the vertical axis
- the invention of a method for estimating periodontal pocket inflammation area which is the first aspect of the present invention (hereinafter also referred to as "first invention group”) includes the following steps. i) detecting bacterial amounts of two or more kinds of bacteria in saliva, and ii) estimating periodontal pocket inflammation area using the obtained detection result as an index.
- the invention of the method of comprehensively estimating the degree of inflammation of periodontal tissue which is the second aspect of the present invention (hereinafter also referred to as "the second invention group”) includes the following steps: . i) detecting the bacterial amount of one or more bacteria in saliva (subject, particularly in human saliva); and ii) comprehensively measuring the degree of inflammation of periodontal tissue using the obtained detection result as an index Step of estimating.
- a DNA chip can be used when measuring the amount of bacteria in the oral cavity from saliva collected from a subject.
- the following probes (a) (bacteria-specific probes) can be mounted on the DNA chip, and furthermore, the probes (b) (total amount index probes) and probes (c) (absolute amount index probes) It can also be installed.
- Bacteria-specific probe A probe consisting of a nucleic acid that specifically hybridizes to a bacterial gene (or a part thereof) to be detected
- a total mass index probe From nucleic acids that hybridize to all bacterial genes
- C absolute quantity index probe: a probe consisting of a nucleic acid that specifically hybridizes to one or more absolute quantity indices
- a DNA chip is a generic term for a substrate on which a probe is disposed.
- the names of the DNA chip and the DNA microarray are not distinguished from each other, but are synonymous.
- bacteria in saliva to be detected are not limited, but, for example, belong to each genus listed below Bacteria, ie, Porphyromonas, Tannerella, Treponema, Prevotella, Campylobacter, Fusobacterium, Streptococcus, Aggregatibacter, Capnocytophaga, Eikenellaces, Veillonella, Serenomonas, etc.
- the bacterium belongs to at least one genus selected from the genus Haemophilus, Alloprevotella, Sorobacterium, Rothia, Peptostreptococcosis, Gemella, Corynebacterium, Neisseria, Granulicatella, Megasphaera and SR1. . More specifically, it is more preferable to detect at least one or more selected from various bacteria listed below.
- Porphyromonas gingivalis Tannerella forsythia Treponema denticola Campylobacter gracilis Campylobacter rectus Campylobacter showae Fusobacterium nucleatum subsp. Vincentii Fusobacterium nucleatum subsp. Fusobacterium nucleatum subsp. Animalis Fusobacterium nucleatum subsp.
- Nucleatum Fusobacterium periodonticum Prevotella intermedia Prevotella nigrescens Streptococcus constellatus Aggregatibacter actinomycetemcomitans Campylobacter concisus Capnocytophaga gingivalis Capnocytophaga ochracea Capnocytopha spumblea Eikenella corrodens Streptococcus gordonii Streptococcus intermedius Streptococcus mitis Streptococcus mitis bv 2 Actinomyces odontolyticus Veillonella parvula Actinomyces naeslundii II Selenomonas noxia Streptococcus mutans Eubacterium nodatum Parvimonas micra Filifactor alocis Streptococcus sobrinus Porphyromonas pasteri Veillonella atypica Haemophilus parainfluenzae Alloprevotella spp
- bacteria showing a positive correlation the relationship between the periodontal pocket inflammation area increases as the amount of bacteria increases
- the bacterial volume of bacteria and the periodontal pocket inflammation area (hereinafter referred to as “bacteria that show positive correlation”)
- bacteria that show positive correlation the relationship between the periodontal pocket inflammation area increases as the amount of bacteria increases
- bacteria that show positive correlation the relationship between the periodontal pocket inflammation area increases as the amount of bacteria increases
- bacteria negative correlation there is a negative correlation between bacterial quantity of bacteria and periodontal pocket inflammation area
- a bacterium showing a decreasing relationship hereinafter sometimes abbreviated as "a bacterium showing a negative correlation”
- the periodontal pocket inflammation area is an area showing inflammation including PISA (periodontal inflamed surface area: periodal inflammation surface area) or CAPRS (conccaled area in periodontal pocket of tooth root surfase: periodontal pocket internal root surface area); If there is an indicator of the concept of the indicator is included.
- the PISA value indicates the inflammation area of periodontal tissue in the entire oral cavity in square millimeters (mm 2 ), and from the presence of periodontal pocket surface area (PESA) and bleeding on probing (BOP) It can be calculated.
- the periodontal pocket surface area (PESA) can be calculated from the area defined in advance for each tooth type and the depth of periodontal pocket (PPD).
- An automatic calculation spreadsheet (Excel file) in the case of the six-point method is distributed as additional information in Non-Patent Document 1 (https://www.parsprototo.info/pisa.html), and the above calculation method is in the Excel file.
- Anyone can check it by looking at the formula shown.
- the CAPRS value is determined from the attachment root surface surface area (total surface area of the tooth root located on the apical side from the gingival margin; Clinical Area of Tooth Root Surface; CARS), and then the effective root surface area is obtained. Calculated by subtracting the value of.
- the position of the gingival margin is calculated by replacing all cases with the anatomical neck line, which is identical to the value of PESA shown in Fig. 1 (b) of Non-Patent Document 1 Conceivable.
- the gingival bleeding index (BOP) is not taken into account in the calculation, the CAPRS value approximately captures the area itself as an inflammation area on the inner surface of the pocket as described in the literature and should be considered as a "periodontal pocket inflammation area" together with the PISA value.
- the periodontal pocket inflammation area is preferably represented by the value of PISA or CAPRS.
- Bacteria that show a positive correlation and bacteria that show a negative correlation can be identified by a tool that can measure the amount of bacteria (or a measured amount that is proportional to the amount of bacteria such as the SN ratio).
- the tool is not particularly limited, and for example, a DNA chip can be used.
- the intraoral sample is measured with a DNA chip, and then the correlation coefficient between the periodontal pocket inflammation area and the measured amount such as the bacterial amount or SN ratio of each bacterium is calculated. It can be classified and specified as a bacteria group whose number is a positive value and a bacteria group whose number is a negative value.
- the absolute value of the correlation coefficient is preferably 0.02 or more when the number of measurements is 40 or more, more preferably 0.1 or more, and 0.2 or more. More preferably, it is particularly preferably 0.4 or more, and most preferably 0.6 or more.
- the data after experimental error correction is also used for classification of bacteria groups.
- Preferred examples of bacteria that show positive correlation include the bacteria listed below. It is more preferable to detect at least one of these, preferably two or more.
- Preferred examples of the bacteria showing negative correlation include the bacteria listed below. It is more preferable to detect at least one of these, preferably two or more.
- Streptococcus mutans Actinomyces odontolyticus Streptococcus mitis bv 2 Streptococcus mitis Campylobacter concisus Capnocytophaga gingivalis Prevotella pallens Streptococcus salivarius Eubacterium sulci Rothia mucilaginosa Prevotella denticola Veillonella atypica Prevotella histicola Megasphaera micronuciformis Streptococcus parasanguinis
- the amount of bacteria in the bacteria has a positive correlation or a negative correlation with the degree of inflammation of periodontal tissue, etc. (PISA value or CAPRS value) Bacteria are preferably mentioned respectively.
- the bacteria having the positive correlation preferably include, for example, the bacteria listed below, and it is more preferable to detect at least one, preferably two or more of them.
- bacteria which have the said negative correlation the bacteria listed below are mentioned preferably, for example, It is more preferable to make at least 1 sort (s), preferably 2 or more sorts of these as detection object.
- Streptococcus mutans Actinomyces odontolyticus Streptococcus mitis bv 2 Streptococcus mitis Campylobacter concisus Capnocytophaga gingivalis
- an oligo DNA that can be used as a bacteria-specific probe can be hybridized with a base sequence in a specific region of a base sequence of a bacteria-derived nucleic acid in saliva.
- the nucleic acid may be any of DNA and RNA including chromosomal DNA, plasmid DNA and the like, and is not limited, but is preferably chromosomal DNA.
- the oligonucleotide used as a probe in the present invention is capable of hybridizing to the base sequence of 16S rRNA gene in chromosomal DNA of the above-mentioned bacteria.
- the probe that can be used in the present invention, it is preferable to select a region that is a nucleotide sequence specific to an individual bacterium to be detected and design the nucleotide sequence of that region.
- Tm melting temperatures
- Specific base sequences corresponding to each species of bacteria in saliva can be found, for example, by means of multiple alignment, designing probes in different regions between species, and the like.
- an algorithm for alignment There is no particular limitation on an algorithm for alignment, but as a more specific analysis program, for example, a program such as Clustal X 1.8 can be used. Parameters for alignment may be executed in the default state of each program, but can be appropriately adjusted according to the type of program and the like.
- the specificity of the probe may be a batch detection of bacteria of the same genus based on the genus level specificity, or may be a specificity detectable at the individual species level, for detection purposes It is possible to appropriately select and design accordingly. Examples of bacteria specific probes that can be used in the present invention are shown in Table A below (SEQ ID NOS: 1-29).
- the total volume index probe is a probe for the purpose of capturing all bacteria in a sample (in saliva) which can be amplified by a specific primer pair. In order to detect bacteria, what proportion of the bacteria to be detected is among the total bacteria including non-detection bacteria, and how many bacteria are originally present in the sample From the point of view, it is also important to detect the total amount of bacteria.
- the non-detection target bacteria can be understood as the sum (sum) of bacteria whose existence and type are known but may not be detected, and bacteria whose existence and type are unknown.
- a base sequence common to many types of bacterial species may be used as the probe. If such a sequence can not be found, a plurality of relatively common sequences may be designed, and they may be comprehensively judged to be a total amount index probe.
- the total amount index probe is preferably a probe that hybridizes to a nucleic acid derived from bacteria contained in the sample, specifically, a plurality of types of bacteria to be detected among base sequences amplified by the specific primer pair It is a probe containing the base sequence which it has in common.
- An example of a total volume index probe is shown in Table A below (SEQ ID NO: 31).
- the total amount index represents the total amount of amplification products specific to individual species, the amount of signal generally increases, so the target signal intensity may exceed the range of detectable signal intensities. . In order to prevent such a situation, it is desirable to limit the amount of sample to be subjected to hybridization.
- the Tm value of the probe is lowered. Specifically, methods for reducing the GC content and shortening the probe sequence length itself are conceivable.
- a nucleic acid for example, a nucleic acid having the same sequence as that of the total amount index probe, or a nucleic acid having all or partially the complementary sequence of the total amount index probe, etc. can be mentioned.
- the absolute amount index probe is a probe that hybridizes only to the absolute amount index nucleic acid.
- the absolute amount index is a nucleic acid added to a sample in a predetermined amount before an amplification reaction or a hybridization reaction.
- the absolute amount index is a nucleic acid for which an amplification reaction is surely performed if a normal amplification reaction is performed, and serves as a so-called positive control. Therefore, if a probe specific to the absolute amount index is mounted on the DNA chip, it can be confirmed from the detection result whether the amplification reaction, hybridization, etc. were properly carried out.
- the correction coefficient can be calculated by comparing the signal intensities of the absolute amount index when amplification efficiency and hybridization efficiency slightly increase and decrease. The corrected signal intensities can be compared in multiple DNA chips.
- an absolute amount index is added before the amplification reaction, it is a nucleic acid amplified by a specific primer pair, that is, possessing a base sequence complementary to the primer pair, and detected by hybridization. For this purpose, it is necessary to possess a base sequence which is not possessed by either the bacteria to be detected or the bacteria not to be detected.
- the specific primer means that the sequence to be amplified is limited, and the primer pair does not necessarily have to be one. Multiplex methods using two or more primer pairs can also be applied as needed. Examples of primer pairs are shown in Table B below. It is possible to use a primer pair for bacterial amplification (SEQ ID NOS: 32, 33) and a primer pair for absolute amount index (SEQ ID NOS: 34, 35).
- the absolute amount index may be, for example, a nucleic acid standard substance for quantitative analysis developed by the National Institute of Advanced Industrial Science and Technology, or may be newly designed.
- EXCEL software “manufactured by MICROSOFT”
- X is an arbitrary number
- sequences in which the sum of G and T is equal to the sum of A and T are extracted, and the extracted sequences are blasted against a database such as NCBI GenBank to obtain nucleic acids derived from organisms.
- a database such as NCBI GenBank
- the length of the base amplified by the bacteria to be detected and the length of the amplified base of the absolute amount index do not have a large difference.
- the amplification product of the bacteria to be detected is about 500 bp
- the amplification product of the absolute amount index is preferably about 300 to 1000 bp.
- the amplification product derived from the absolute amount index is designed after being designed to be an amplification product of a length different from that of the detection target bacteria.
- stringency conditions are, for example, hybridization under conditions of 50 to 60 ° C. for tight conditions, and hybridization under conditions of 30 to 40 ° C. for mild conditions.
- stringent conditions include, for example, “0.24 M Tris ⁇ HCl / 0.24 M NaCl / 0.05% Tween-20, 40 ° C.”, “0.24 M Tris ⁇ HCl / 0.
- the length of the probe used in the present invention is not limited, for example, 10 bases or more are preferable, more preferably 16 to 50 bases, and still more preferably 18 to 35 bases. If the length of the probe is appropriate (if it is within the above range), nonspecific hybridization (mismatch) can be suppressed and used for specific detection.
- Tm means the temperature at which 50% of any nucleic acid strand hybridizes to its complementary strand, and the temperature of hybridization is sufficient for the template DNA or RNA and the probe to form a double strand for hybridization. Need to be optimized. On the other hand, it is desirable that the temperature be as high as possible, since nonspecific reactions are likely to occur if the temperature is lowered too much. Therefore, the Tm of the nucleic acid fragment to be designed is an important factor in carrying out the hybridization.
- Known probe design software can be used to confirm Tm, and examples of software that can be used in the present invention include Probe Quest (registered trademark; Dynacom).
- Tm confirmation can also be performed by self-calculation without using software. In that case, it is possible to use a calculation formula based on the nearest neighbor method, the wallance method, the GC% method or the like.
- the probe of the present invention is preferably, but not limited to, an average Tm of about 35-70 ° C. or 45-60 ° C.
- there are GC content etc. and the conditions are well known to those skilled in the art.
- the nucleotides constituting the probe used in the present invention may be either DNA and RNA or PNA, and may be a hybrid of two or more of DNA, RNA and PNA.
- probe used in the present invention preferably include those containing the base sequence of the following (d) or (e) DNA.
- the sequences shown in Table A SEQ ID NOS: 1-31 listed above can be used as probes, and SEQ ID NOS: 1-31.
- it is preferable to use at least two sequences selected from the nucleotide sequences shown in In addition, it may be a complementary sequence of at least two sequences selected from the nucleotide sequences shown in SEQ ID NOs: 1-31, and is substantially identical to at least two sequences selected from the nucleotide sequences shown in SEQ ID NOs: 1-31.
- substantially identical is one that specifically hybridizes under stringent conditions to the sequence described in SEQ ID NO: 1 to 31 or a complementary sequence.
- the description of Table A given above can be referred to for their specific base sequences, probe names, and bacteria in the oral cavity to be detected.
- the DNA of (e) above is a DNA comprising the various DNAs of (d) above or a nucleotide sequence complementary thereto, or a fragment thereof, as a probe, colony hybridization, plaque hybridization, and Southern hybridization.
- a known hybridization method such as blot can be performed and obtained from a cDNA library or a genomic library.
- the library one prepared by a known method may be used, or a commercially available cDNA library or genomic library may be used without limitation. The same procedures as described above can be referred to for the detailed procedures of the hybridization method.
- stringent conditions are conditions at the time of hybridization, and the salt concentration of the buffer is 24 to 390 mM, the temperature is 40 to 65 ° C., preferably the salt concentration is 48.8. It means a condition of ⁇ 195 mM and a temperature of 45 to 60 ° C. Specifically, for example, conditions such as 97.5 mM and 50 ° C. can be mentioned. Furthermore, in addition to the conditions such as the salt concentration and temperature, various conditions such as the probe concentration, the length of the probe, the reaction time and the like are also taken into consideration, and the conditions for obtaining the DNA of (e) are appropriately set. Can.
- the hybridizing DNA is preferably a nucleotide sequence having at least 60% or more homology to the nucleotide sequence of the DNA of (d), more preferably 80% or more, still more preferably 90% or more. More preferably, it is 95% or more, particularly preferably 98% or more, and most preferably 99% or more.
- the probe used in the present invention can be prepared, for example, by chemical synthesis using conventional oligonucleotide synthesis methods (purification is performed by HPLC etc.). Such a probe can be designed, for example, by Probe Quest (registered trademark: manufactured by Dynacom).
- the probe of the present invention may contain, for example, an additional sequence such as a tag sequence.
- the base sequence of the nucleic acid possessed by the above-mentioned bacteria in saliva to be detected does not have to be the base sequence itself, and a part of the base sequence is mutated by deletion, substitution, insertion, etc. It may be generated.
- the nucleotide sequence of the nucleic acid to be detected is hybridized with a sequence complementary to the nucleotide sequence under stringent conditions, and a mutant gene having a function or activity derived from each nucleotide sequence is also targeted.
- the probe can also be designed based on the nucleotide sequence of such mutant gene.
- stringent conditions here, the same conditions as described above can be applied.
- a DNA chip can be used to detect and measure the amount of bacteria in saliva.
- the DNA chip is used for the purpose of comprehensively estimating the degree of inflammation of periodontal tissue, and a plurality of the oligonucleotide probes described in the section 1 above are arranged on a base serving as a support. It is.
- the thing of any form such as a flat plate (a glass plate, a resin board, a silicon plate etc.), a rod shape, and a bead, can be used.
- a flat plate a glass plate, a resin board, a silicon plate etc.
- a rod shape a rod shape
- a bead a bead
- a predetermined probe can be fixed for each type at a predetermined interval on the flat plate (see spotting method, etc .; Science 270, 467-470 (1995), etc.) .
- predetermined probes can be sequentially synthesized for each type at specific positions on a flat plate (see, for example, photolithography method; Science 251, 767-773 (1991)).
- Other preferred support forms include those using hollow fibers.
- a DNA chip is obtained by fixing predetermined probes to each hollow fiber for each type, focusing and fixing all the hollow fibers, and then repeatedly cutting in the longitudinal direction of the fibers.
- fiber type DNA chip can be preferably exemplified.
- This microarray can also be described as a type in which nucleic acids are immobilized on a through-hole substrate, and is also referred to as a so-called "through-hole type DNA chip" (see, for example, Japanese Patent No. 3510882).
- the method of fixing the probe to the support is not limited, and any binding mode may be used.
- the present invention is not limited to direct fixation to a support, and for example, the support may be previously coated with a polymer such as polylysine and the probe may be fixed to the treated support.
- the support may be previously coated with a polymer such as polylysine and the probe may be fixed to the treated support.
- a tubular body such as a hollow fiber as a support
- the fiber type DNA chip which is one form of a DNA chip is demonstrated in detail. This DNA chip can be produced, for example, through the following steps (i) to (iv).
- the material used for the hollow fiber is not limited, but preferably includes, for example, the materials described in JP-A-2004-163211.
- the hollow fibers are three-dimensionally arranged so that the lengths in the longitudinal direction are the same (step (i)).
- an arrangement method for example, a method of arranging a plurality of hollow fibers in parallel at a predetermined interval on a sheet-like article such as an adhesive sheet and forming a sheet, and then winding the sheet in a spiral (Japanese Patent Laid-Open No. 11- No.
- the manufactured array is embedded so that the array is not disordered (step (ii)).
- a method of embedding in addition to a method of pouring a polyurethane resin, an epoxy resin or the like into a gap between fibers, a method of bonding fibers by heat fusion is preferably mentioned.
- the hollow portion of each hollow fiber is filled with a gel precursor polymerizable solution (gel forming solution) containing an oligonucleotide probe, and the polymerization reaction is carried out in the hollow portion (step (iii)) .
- the gel-like substance to which the probe is fixed can be held in the hollow portion of each hollow fiber.
- the gel precursor polymerizable solution is a solution containing a reactive substance such as a gel-forming polymerizable monomer, and the solution is capable of becoming a gel-like product by polymerizing and crosslinking the monomer and the like.
- a reactive substance such as a gel-forming polymerizable monomer
- the solution is capable of becoming a gel-like product by polymerizing and crosslinking the monomer and the like.
- a monomer include acrylamide, dimethyl acrylamide, vinyl pyrrolidone, methylene bis acrylamide and the like.
- the solution may contain a polymerization initiator and the like.
- the block is cut and exfoliated in a direction (preferably, a direction perpendicular to) the longitudinal direction of the hollow fiber (step (iv)).
- the slice obtained in this manner can be used as a DNA chip.
- the thickness of the DNA chip is preferably about 0.01 mm to 1 mm.
- Cleavage of the block can be carried out, for example, by a microtome and a laser etc.
- a DNA chip (GenopalTM) manufactured by Mitsubishi Chemical Corp. is preferably mentioned.
- the probes are three-dimensionally arrayed in the gel, and it becomes possible to maintain the three-dimensional structure.
- the number of types of probes arranged in the DNA chip is preferably 500 or less, preferably 250 or less, more preferably 100 or less per DNA chip. By limiting the number (types) of probes thus arranged to some extent, it is possible to detect the target intraoral bacteria with higher sensitivity.
- the types of probes are distinguished by the base sequence. Therefore, usually, even if the base sequence is different even if the probe is derived from the same gene, it is specified as another type.
- a method of detecting the bacteria to measure the amount of bacteria in saliva is, for example, a method comprising the following steps.
- step of extracting saliva as a sample from saliva as an intraoral sample collected from a subject and extracting nucleic acid in the sample (in saliva) (ii) the extracted nucleic acid according to the oligonucleotide probe of the present invention or the DNA of the present invention Step of contacting the chip (iii) Step of calculating the amount of bacteria from the signal intensity obtained from the DNA chip
- Step (i) saliva as an intraoral sample collected from a subject or an organism is used as a sample, and nucleic acid of bacteria contained in the sample (in saliva) is extracted.
- the method of collecting saliva is not particularly limited, and examples thereof include a method of using a commercially available saliva collecting kit, a method of collecting a saliva by containing a cotton swab in the mouth, and a method of collecting saliva directly in a container.
- the subject from which saliva is collected is not particularly limited.
- the patient may be a patient with a systemic disease or a pregnant woman who is suggested to be related to the patient, or a healthy person who is not suspected of being afflicted with periodontal disease.
- nucleic acid extraction of bacteria present in the obtained saliva is performed.
- the method of extraction is not limited, and known methods can be used.
- nucleic acid may not be extracted from the sample in particular, and the process may proceed to the next step.
- the nucleic acid obtained from the sample may be directly contacted with a DNA chip or the like, or the desired base sequence region may be amplified by PCR or the like, and the amplified fragment may be contacted with a DNA chip or the like, without limitation.
- the region for amplification using the obtained nucleic acid as a template is a region encoding a nucleic acid region including the base sequence of the probe used in the present invention or the oligonucleotide disposed on the DNA chip.
- the desired region to be amplified is not limited, and can be obtained by amplifying a large number of mixtures at one time using the base sequence of a highly conserved region regardless of bacterial species.
- the sequence for such amplification may be experimentally isolated and purified, and the base sequence of the isolated polynucleotide may be analyzed and determined based on the sequence, or the base sequence etc. It may be determined in In Silico by searching known bases in various databases and taking alignments. Databases such as nucleic acids or amino acids are not particularly limited. For example, DDBJ (DNA Data Bank of Japan), EMBL (European Molecular Biology Laboratory, EMBL nucleic acid sequence data library), GenBank (Genetic sequence data bank) And the Taxonomy database of NCBI (National Center for Biotechnology Information).
- a desired site to be amplified is preferably a ribosomal RNA (16S rRNA) gene in bacterial chromosomal DNA.
- a PCR primer which can be used for amplification of the said area
- amplification of the nucleic acid by PCR method can be performed according to a usual method. The nucleic acid and its amplified fragment extracted in this step can be appropriately labeled and used in the detection process after hybridization.
- a method in which the end of the PCR primer is labeled with various reporter dyes a method in which a reactive nucleotide analog is incorporated during reverse transcription reaction, a method in which a biotin-labeled nucleotide is incorporated, and the like can be considered.
- a fluorescent labeling reagent for labeling.
- various reporter dyes eg, Cy5, Cy3, VIC, FAM, HEX, TET, fluorescein, FITC, TAMRA, Texas red, Yakima Yellow, etc.
- Step (ii) the nucleic acid obtained in step (i) or the amplified fragment thereof is brought into contact with the probe or DNA chip used in the present invention.
- a hybridization solution is prepared, and nucleic acids and the like in the solution are bound (hybridized) to an oligonucleotide probe mounted on a DNA chip.
- the hybridization solution can be appropriately prepared according to a conventional method using a buffer such as SDS or SSC.
- the hybridization reaction is carried out under the reaction conditions (type of buffer, pH, temperature, etc.) so that the nucleic acid etc. in the hybridization solution can hybridize under stringent conditions with the oligonucleotide probe loaded on the DNA chip. It can be set appropriately.
- hybridization reaction refers to the washing conditions of the DNA chip at times or after hybridization.
- the reaction temperature is preferably 35 to 70 ° C., more preferably 40 to 65 ° C.
- the hybridization time is preferably about 1 minute to 16 hours.
- the washing solution composition is preferably 0.24 M Tris ⁇ HCl / 0.24 M NaCl / 0.05% Tween-20, and the temperature at the washing is 35
- the temperature is ⁇ 80 ° C or 40-65 ° C, more preferably 45-60 ° C.
- the salt (sodium) concentration is 48 to 780 mM and the temperature is 37 to 80 ° C.
- the salt concentration is 97.5 to 390 mM
- the temperature is 45 to 60 ° C.
- the detection intensity is measured for each spot by a device capable of detecting a label such as nucleic acid bound to the probe.
- a device capable of detecting a label such as nucleic acid bound to the probe.
- various fluorescence detection devices such as CRBIO (manufactured by Hitachi Software Engineering), arrayWoRx (manufactured by GE Healthcare), Affymetrix 428 Array Scanner (manufactured by Affymetrix, manufactured by GenePix)
- the fluorescence intensity can be measured using (Axon Instruments), ScanArray (PerkinElmer), Genopal Reader (Mitsubishi Chemical), or the like.
- a fluorescence scanner for example, scanning can be performed by appropriately adjusting the laser output and the sensitivity of the detection unit, and in the case of a CCD camera type scanner, the exposure time is appropriately adjusted. You can do a scan.
- the quantification method based on the scan result is performed by quantification software. There is no particular limitation on the quantification software, and quantification can be performed using the average value, median value, etc. of the fluorescence intensities of the spots. Further, in quantitative determination, it is preferable to perform adjustment such as using the fluorescence intensity of a spot not equipped with a probe as a background, in consideration of the dimensional accuracy of the spot range of the DNA fragment and the like.
- Step (iii) the amount of bacteria of bacteria to be detected is calculated from the signal intensity obtained in the above procedure.
- the signal intensity obtained in the above procedure there is a method shown as an SN ratio from the signal intensity of the probe for detecting the bacteria to be detected and the signal intensity of the background.
- a conversion factor (calibration curve) is used to calculate the chromosomal DNA concentration for each bacterium based on the signal intensity obtained by changing the concentration of the chromosomal DNA of the bacterium in advance and changing the concentration of the bacterial chromosomal DNA for each bacteria
- the concentration of chromosomal DNA is calculated from the signal intensities obtained under the respective conditions.
- the amount of bacteria from the signal intensity based on 16S rRNA sequence information of the bacteria to be detected.
- the genome copy number can be calculated by multiplying the signal intensity detected by the DNA chip by each bacterial mass calculation coefficient determined in advance (and by multiplying the dilution ratio of the detection sample, if necessary).
- Each bacterial mass calculation coefficient can measure signal intensity when detecting each bacterial origin genomic DNA, prepare a standard curve, and can be calculated as a coefficient to calculate each bacterial mass from signal intensity of each bacterial . In any case, it is preferable to consider the correction factor in the signal intensity of the bacteria to be detected in each DNA chip.
- the method of the present invention is a method of estimating the periodontal pocket inflammation area using the detection result of the amount of bacteria in the saliva as an index. Further, the method of the present invention is a method for comprehensively estimating the degree of inflammation of periodontal tissue, using the detection result as an index. Any tool may be used to detect the bacterial amount of bacteria in saliva, as described in the section 3. above, a method using a DNA chip, and other methods for confirming the presence of bacteria by enzyme activity, electricity Methods of measuring specific resistance, measuring the total amount of bacteria, counting bacteria by phase contrast microscope and staining, measuring viable cell count by culturing, measuring individual bacterial counts by real time PCR, etc. may be mentioned. .
- the periodontal pocket inflammation area and the degree of inflammation of periodontal tissue are estimated based on the count value etc. which were counted up visually.
- Specific methods for estimating the periodontal pocket inflammation area include the following methods. (1) The amount of bacteria of various bacteria in saliva is detected from a saliva sample of a subject (which can be calculated from the measured PPD etc.) whose periodontal pocket inflammation area (PISA value, CAPRS value etc.) is known. (2) With regard to the amount of bacteria of the various bacteria concerned, the correlation coefficient with the periodontal pocket inflammation area specific to each bacteria is determined, and the relational expression between the amount of bacteria of various bacteria and the periodontal pocket inflammation area is built and a prediction model Create (3) The amount of bacteria of various bacteria in saliva is detected from a saliva sample of a subject whose periodontal pocket inflammation area is unknown. (4) The periodontal pocket inflammation area is estimated by putting the amounts of various bacteria obtained in (3) into the relational expression obtained in (2).
- the method of creating a prediction model is not particularly limited, but various statistical analysis methods such as linear regression, regression tree, model tree, neural network, support vector machine, bagging, boosting, machine learning algorithm such as random forest, etc.
- the method to use is mentioned.
- the model tree shown in the embodiment described later there is no need to predefine a model.
- the “M5” using the “caret” package of statistical software “R” (R Development Core Team) Optimization in the '' method is preferably mentioned.
- the saliva sample of the subject whose periodontal pocket inflammation area is actually measured is preferably a number greater than the number of bacteria (variables) used to create the prediction model.
- the prediction model may be updated each time the number of data is accumulated.
- the amount of bacteria in the bacteria and the periodontal pocket inflammation area positively correlates with the amount of bacteria in the bacteria and the amount of bacteria in the periodontal pocket as bacteria used for creating a prediction model to be detected
- bacteria showing positive correlation with periodontal pocket inflammation area are often not detected (become the number of bacteria is 0), and only bacteria showing positive correlation are The reason is that a prediction model can not be created for a range of values where the periodontal pocket inflammation area is small.
- bacteria used for prediction model creation are the above-mentioned 1. As described in Section, but eventually the accuracy of the prediction is improved, the bacteria respond not only to the magnitude of the correlation coefficient of the bacteria alone but also to changes in the bacteria in response to fluctuations in the periodontal pocket inflammation area It is selected in consideration of the accuracy of the amount and the correlation coefficient of the amount of bacteria among bacteria (avoid multicollinear relations).
- bacteria showing positive correlation preferably the following bacteria are mentioned.
- Porphyromonas gingivalis, Tannerella forsythia, Treponema denticola, Campylobacter rectus Fusobacterium nucleatum subsp.
- Vincentii Fusobacterium nucleatum subsp.
- Polymorphum Fusobacterium nucleatum subsp. Animalis, Fusobacterium nucleatum subsp.
- bacteria More preferably, the following bacteria are mentioned as bacteria showing a positive correlation. Gleida, Porephylogonas gingivalis, Tannerella, sychnicum, Sporella romano sve svelia, Tranella eta, T.
- the negatively correlating bacteria preferably the following bacteria are mentioned.
- the following bacteria can be mentioned as the negatively correlated bacteria.
- Actinomyces odontolyticus, Streptococcus mutans, Prevotella pallens It is preferable to use 1 or more types as bacteria which show a negative correlation, It is more preferable to use 2 or more types, It is more preferable to use 4 or more types, It is especially preferable to use 8 or more types.
- it is preferable to use 100 or less types It is more preferable to use 75 types or less, It is more preferable to use 50 types or less, It is especially preferable to use 25 types or less.
- the present invention statistical analysis processing is performed on a predetermined number of subjects (primary mother samples) and stored in a database. Then, from the analysis result of the correlation between the degree of inflammation of the periodontal tissue and the amount of bacteria in the saliva, what degree of inflammation of the periodontal tissue each subject has or the root surface area of the root in the periodontal pocket You can estimate what you have. Therefore, when the subject individual (one person) is examined, the data of the subject individual is located or applies to the data of the mother sample stored in the database, using the data derived from the plurality of subjects as the mother sample The degree of inflammation of the periodontal tissue or the periodontal pocket internal root surface area can be estimated by examining the subject. The individual subject's data may be incorporated into the value of the mother sample, and after statistical analysis processing again, it may be checked where the subject individual is located in the mother sample.
- the degree of inflammation (PISA value, CAPRS value) of periodontal tissue can be estimated and predicted based on bacterial species in the saliva and the amount of the bacteria, conventionally, PISA values and CAPRS have been known.
- the degree of inflammation of periodontal tissue can be calculated under a constant calculation standard, even for a large number of subjects, much more simply than in the case where the value is actually measured. Further, in the present invention, the degree of inflammation of periodontal tissue is included in the range of estimation / prediction for not only the positive degree but also the negative degree.
- the ratio of the bacterial species in which the amount of bacteria correlates to the degree of inflammation in the periodontal tissue may be used as an index.
- Periodontal pocket depth Indicates the distance from the gingival edge to the tip of the probe when the periodontal probe is inserted into the pocket.
- the buccal side, the buccal center, the buccal side, the lingual side, the lingual side, and the lingual side were measured by the 6-point method, and they were quantified in 1 mm units.
- Bleeding at probing BOP: indicates the presence or absence of bleeding when the periodontal probe is inserted into the pocket. The case where there is no bleeding at the position corresponding to the above six points method is 0, and the case where there is bleeding is 1.
- Periodontal pocket depth (PPD) and (ii) Bleeding at probing (BOP) are summarized in Table 1.
- PCR ⁇ Amplification reaction of bacterial DNA>
- the above DNA solution was diluted to 20 pg / ⁇ l and used as a PCR template.
- PCR was performed under the following reaction solution composition and reaction conditions.
- the kit for PCR was performed by ProFlex (TM) PCR System (manufactured by Thermo Fisher Scientific) using Premix Ex Taq (TM) Hot Start Version (manufactured by Takara).
- the primer used was a primer having the following sequence.
- the forward primer used was one whose 5 'end was labeled with Cy5.
- ⁇ Reaction liquid composition > 2 x Premix Ex Taq (R) Hot Start Version 10 ⁇ L 4 ⁇ M forward primer (for bacterial amplification) 1 ⁇ L 4 ⁇ M reverse primer (for bacterial amplification) 1 ⁇ L 4 ⁇ M forward primer (for absolute index amplification) 1 ⁇ L 4 ⁇ M reverse primer (for absolute index amplification) 1 ⁇ L Template DNA 5 ⁇ L Absolute quantity indicator 1 ⁇ L 20 ⁇ L in total
- ⁇ DNA chip manufacture of DNA chip for detection of bacteria in oral cavity>
- the through-hole type DNA chip was manufactured by the same method as that described in Example 1 of JP-A-2007-74950 (Method for detecting methylated DNA and / or non-methylated DNA).
- a probe having the sequence information shown in Table 4 was used as the loaded oligonucleotide probe.
- An automated hybridization cleaner (model: AHF-200, manufactured by Mitsubishi Chemical Corporation) was used for hybridization and washing of the DNA chip. 200 ⁇ L of the hybridization solution was brought into contact with the DNA chip and hybridized at 50 ° C. for 16 hours. After hybridization, the DNA chip was washed under the following conditions. Repeat washing for 12 seconds with 1000 ⁇ L of 0.24 M Tris ⁇ HCl / 0.24 M NaCl / 0.05% Tween-20 solution, followed by washing for 220 seconds with 1000 ⁇ L 0.24 M Tris ⁇ HCl / 0.24 M NaCl Was repeated four times. After washing, each chip was transferred to a 0.24 M Tris.HCl / 0.24 M NaCl mixed solution at room temperature.
- ⁇ Detection condition> Center excitation wavelength: 633 nm Exposure time: 0.1, 1, 4, 40 seconds
- the fluorescence intensity of the spot carrying the probe for bacteria to be detected is divided by the background value (median value of the fluorescence intensity of the spot not carrying the probe), and the fluorescence intensity derived from hybridization (hereinafter referred to as signal intensity)
- the SN ratio of was calculated.
- Streptococcus mutans, Actinomyces odontolyticus, Streptococcus mitis bv 2, Streptococcus mitis, Campylobacter concisus were shown to show inverse correlation. These were considered to be indicators of overall oral health.
- Constellatus ⁇ 1.75: LM15 (3 / 14.832%) Streptococcus. Constellatus> 1.75:
- Porphyromonas.gingivalis ⁇ 1.35: LM16 (2 / 9.58%)
- LM num: 1 .outcome 5.9609 * Treponema.denticola + 2.719 * Streptococcus.gordonii -2. 4637 * Actinomyces. Odontolyticus -43.3698 * Streptococcus. Mutans + 161.5714 * Capnocytophaga.
- nucleatum + 1294.0756 LM num: 10 .outcome 15.293 * Treponema.denticola + 2.719 * Streptococcus.gordonii -2. 4637 * Actinomyces. Odontolyticus -30.4289 * Streptococcus. Mutans -0.4833 * Control.
- DNA + 5.5586 * Tannerella.forsythia + 1320.5275 LM num: 11 .outcome 3.3786 * Treponema.denticola + 5.1956 * Streptococcus.gordonii -2.8861 * Actinomyces.odontolyticus -0.5662 * Control.
- Streptococcus mutans Actinomyces odontolyticus, Campylobacter concisus, Actinomyces. Having a negative correlation coefficient between the SN ratio showing each bacterial amount shown in Table 6 and the PISA value in the entire oral cavity.
- naes Ausi. II Streptococcus. Constellatus, Capnocytophaga spumblea with positive correlation coefficient, Tannerella forsythia, Streptococcus gordonii, Treponema denticola, Fusobacterium nucleatum subsp. . It was shown that the PISA value can be predicted from the SN ratio of bacterial groups of nucleatum and Porphyromonas gingivalis.
- Example 7 The same detection results as in Example 1 were used to predict the PISA value based on the amount of bacteria. ⁇ Correlation analysis of PISA value and amount of bacteria> First, for each sample, the PISA value and the SN ratio data indicating the amount of each bacterium were matched. Then, the median of the signal-to-noise ratio of the absolute quantity index probe of all the samples was calculated, and the signal-to-noise ratio of the absolute quantity index probe of each sample was divided by this median. Let this be an inter-chip correction value. Subsequently, the SN ratio data between chips was normalized by dividing the SN ratio data of all bacteria of each sample by the interchip correction value of each sample. The results are shown in Table 7.
- the correlations are in the descending order of Tannerella forsythia, Treponema denticola, Porphyromonas gingivalis, Fusobacterium nucleatum subsp. rectus, Fusobacterium nucleatum subsp. It was nucleatum. These included "Red Complex" and were considered to be indicators of the degree of inflammation in the entire oral cavity.
- Streptococcus mutans Actinomyces odontolyticus, Streptococcus mitis bv 2, Streptococcus mitis, Campylobacter concisus were shown to show inverse correlation. These were considered to be indicators of overall oral health.
- Rectus ⁇ 6.4:
- Tannerella.forsythia ⁇ 11.5: LM15 (2 / 8.205%)
- Total.bacteria ⁇ 1916.55: LM18 (2 / 4.176%)
- LM num: 1 .outcome 0.1154 * Total.bacteria -87.6234 * Porphyromonas.gingivalis + 32.2177 * Tannerella.forsythia + 3.4246 * Treponema.denticola + 10.3816 * Fusobacterium. Nucleatum. Subsp .. animalis + 4.5488 * Streptococcus.gordonii -2.8479 * Actinomyces. Odontolyticus -4.1907 * Streptococcus.
- Odontolyticus + 33.5894 LM num: 8 .outcome 0.1154 * Total.bacteria -87.6234 * Porphyromonas.gingivalis + 27.5903 * Tannerella.forsythia + 3.4246 * Treponema.denticola + 10.3816 * Fusobacterium. Nucleatum. Subsp .. animalis + 4.5488 * Streptococcus.gordonii -0.6784 * Actinomyces.
- Bacteria -87.6234 * Porphyromonas.gingivalis + 43.0191 * Tannerella.forsythia + 3.4246 * Treponema.denticola + 10.3816 * Fusobacterium. Nucleatum. Subsp .. animalis + 4.5488 * Streptococcus.gordonii -0.6784 * Actinomyces. Odontolyticus + 93.2371 LM num: 11 .outcome 0.0785 * Total. Bacteria -87.6234 * Porphyromonas.gingivalis + 45. 0694 * Tannerella.
- Odontolyticus + 93.4098 LM num: 14 .outcome -0.0279 * Total.bacteria -142.0103 * Porphyromonas.gingivalis + 9.7177 * Tannerella.forsythia + 5.5503 * Treponema.denticola + 24. 5588 * Campylobacter. Rectus + 16.8253 * Fusobacterium. Nucleatum. Subsp ..
- Streptococcus mutans Actinomyces odontolyticus, Campylobacter concisus, which have a negative correlation coefficient between the SN ratio showing the amount of each bacteria shown in Table 8 and the PISA value in the entire oral cavity, have a positive correlation coefficient.
- Sponyma ⁇ 1.786:
- Eikenella.corrodens ⁇ 1.067:
- Fusobacterium.periodonticum ⁇ 1.502: LM6 (3 / 2.054%)
- Fusobacterium.periodonticum> 1.502: Streptococcus.mitis ⁇ 3.972: LM7 (2 / 7.05%)
- Aggregatibacter.actinomycetemcomitans ⁇ 1.334: LM8 (3 // 5.01%)
- Sproda -197.1112 * Eikenella.corrodens -5.6233 * Streptococcus. Mitis + 637.0725 LM num: 7 .outcome 0.1528 * Total.bacteria + 6.7947 * Tannerella.forsythia + 6.5901 * Treponema. Denticola + 32.1268 * Aggregatibacter. Actinomycetemcomitans + 74.536 * Capnocytophaga. Sproda -197.1112 * Eikenella.corrodens -5.6233 * Streptococcus.
- Sproda -197.1112 * Eikenella.corrodens -5.6233 * Streptococcus. Mitis + 627.9978 LM num: 10 .outcome 0.1528 * Total.bacteria + 6.7947 * Tannerella.forsythia + 6.5901 * Treponema. Denticola + 22.9812 * Aggregatibacter.
- the correlation coefficient between the actual PISA value and the predicted value was 0.5986115.
- the results are shown in the scatter diagram of FIG. The results show that the value of PISA can be predicted even for unknown data.
- Streptococcus mitis which has a negative correlation coefficient
- Tannerella forsythia which has a positive correlation coefficient
- Treponema denticola which has a positive correlation coefficient
- the PISA value can be predicted from the SN ratio of the bacterial groups of Capnocytophaga ochracea, Capnocytophaga spumblea, Eikenella corrodens, Aggregatibacter actinomycetemcomitans, Prevotella intermedia, and Fusobacterium periodonticum.
- the ratio of the SN ratio of the total bacteria indicating the total amount of bacteria and the SN ratio of the red complex Porphyromonas gingivalis, Tannerella forsythia and Treponema denticola is calculated.
- As an existing indicator Based on this indicator, the aforementioned "mild”, “moderate” and “severe” were determined.
- the determination results and the PISA actual measurement values, the PISA predicted values based on the results of Example 3, the SN ratios of the three bacteria, and the SN ratios of Total bacteria are summarized in Table 9.
- the graph which made the PISA actual value shown in Table 9 the X-axis, and made the existing "ratio of 3 microorganisms" the Y-axis is shown in the left graph of FIG.
- a graph in which the PISA actual measurement value is taken as the X axis and the PISA predicted value is taken as the Y axis is shown in the right graph of FIG.
- the determination coefficient with the PISA actual measurement value is about 0.41 for the existing method and about 0.66 for the method according to the present invention, and it has been shown that the periodontal disease state can be predicted more accurately than the existing method.
- the average value of the “PISA prediction” of the samples determined to be “severe” by the existing method is 1424
- the average value of the PISA predictions of the samples determined to be “medium” is 736, which corresponds to the conventional index. It has been shown that comparisons can also be made.
- Forward primer for bacterial amplification: 5'-Cy5-TACGGGAGGCAGCAG-3 '(SEQ ID NO: 72)
- Reverse primer for bacterial amplification: 5'-CRGGGTATCTAATCCYGTT-3 '(SEQ ID NO: 73)
- Forward primer for absolute index amplification: 5'-Cy5-GAGAAGCCCTACACAAACGTAACGTC-3 '(SEQ ID NO: 34
- Reverse primer for absolute index amplification: 5'- CTCTAAAAGACCGCTCTATCTCGG-3 '(SEQ ID NO: 35)
- the hybridization temperature was set to 50 ° C. for 16 hours.
- the resulting fluorescence intensities were processed as follows. The fluorescence intensity of the spot carrying the probe for bacteria to be detected was subtracted by the background value (the median value of the fluorescence intensities of the spots not carrying the probe) to calculate the signal intensity derived from the hybridization. At this time, a signal intensity below a certain threshold is judged as noise and set to “0”.
- the threshold value a value three times the standard deviation of 20 values excluding the upper and lower five out of the tendency intensities of the 30 spots with no probe mounted was used.
- the correlation coefficient between PISA and the value of log10 (relative ratio to the total amount) of each bacterium was calculated for all 36 types, and further, the bacterial species whose absolute value of the correlation coefficient was larger than 0.2 were selected.
- the correlation coefficients showing positive values and negative values are shown below (Table 12).
- the group of bacteria showing a negative correlation coefficient was 9 species of Prevotella pallens, Streptococcus salivarius, Eubacterium sulci, Rothia mucilaginosa, Prevotella denticola, Veillonella aticica, Prevotella histicola, Megasphaera micronuciformis, Streptococcus paranisuis.
- the group of bacteria showing positive values of correlation coefficient is SR1 sp. OT 345, Porphyromonas catoniae, Selenomonas sproda, Neisseria flavescens, Streptococcus sobrinus, Parvimonas micra, Peptostreptococcosis, Treponema socranskii, Eubacteriumetiumumium alocis, Porphyromonas endodontalis 13 species of bacteria.
Landscapes
- Chemical & Material Sciences (AREA)
- Life Sciences & Earth Sciences (AREA)
- Health & Medical Sciences (AREA)
- Engineering & Computer Science (AREA)
- Organic Chemistry (AREA)
- Proteomics, Peptides & Aminoacids (AREA)
- Analytical Chemistry (AREA)
- Physics & Mathematics (AREA)
- Zoology (AREA)
- Wood Science & Technology (AREA)
- Bioinformatics & Cheminformatics (AREA)
- Biotechnology (AREA)
- General Health & Medical Sciences (AREA)
- Biophysics (AREA)
- Genetics & Genomics (AREA)
- Molecular Biology (AREA)
- General Engineering & Computer Science (AREA)
- Biochemistry (AREA)
- Immunology (AREA)
- Microbiology (AREA)
- Medical Informatics (AREA)
- Data Mining & Analysis (AREA)
- Theoretical Computer Science (AREA)
- Bioinformatics & Computational Biology (AREA)
- Evolutionary Biology (AREA)
- Spectroscopy & Molecular Physics (AREA)
- Public Health (AREA)
- Pathology (AREA)
- Computer Vision & Pattern Recognition (AREA)
- Bioethics (AREA)
- Artificial Intelligence (AREA)
- Software Systems (AREA)
- Databases & Information Systems (AREA)
- Evolutionary Computation (AREA)
- Epidemiology (AREA)
- Measuring Or Testing Involving Enzymes Or Micro-Organisms (AREA)
- Investigating Or Analysing Biological Materials (AREA)
Abstract
Description
そこで、これまでに、簡便な歯周病の診断方法が提案されている。例えば、特許文献1では、歯肉溝滲出液に含まれるタンパク質を歯周病疾患マーカーとして利用した歯周病診断方法が開示されている。また、特許文献2では、唾液中の複数のタンパク質を分析することにより、歯周ポケットの深さ(PPD)や歯肉出血指数(BOP)を予測する手法が開示されている。しかしながら、通常、PPDやBOPについては、測定箇所が168箇所(28本の歯×6点法)も存在するため、実際にどの箇所について予測がされているのか不明である。
これまで、これら「歯周ポケット炎症面積」を簡便に評価するために、唾液中の歯周病細菌数との関係について検討されたことがあるが、P.g菌(Porphyromonas gingivalis(ポルフィロモナス・ジンジバリス))の菌数とCAPRS値との間、及び、レッドコンプレックス菌(P.g菌、T.d菌(Treponema denticola(トレポネーマ・デンティコラ))、T.f菌(Tannerella forsythensis(タネレラ・フォーサイセンシス)))の菌数とCAPRS値との間には相関が無く(非特許文献2、図3a,b)、唾液サンプルから簡便に「歯周ポケット炎症面積」予測する方法は知られていなかった。
また、このような状況下において、唾液中の細菌量の検出結果に基づいて、炎症面積(PISA値)等といった歯周組織の炎症度を簡便に予測する方法の提供が望まれていた。
該細菌の細菌量と歯周ポケット炎症面積とが負の相関関係を示す細菌とを含む、方法。
[2] 前記歯周ポケット炎症面積がPISA、又はCAPRSの値で表されるものである、[1]に記載の方法。
[3] 正の相関関係を示す細菌が、Treponema denticola、Tannerella forsythia、Fusobacterium nucleatum subsp. animalis、Porphyromonas gingivalis、Campylobacter rectus、Fusobacterium nucleatum subsp. nucleatum、Selenomonas noxia、Veillonella parvula、Streptococcus gordonii、Fusobacterium nucleatum subsp. vincentii、Streptococcus intermedius、Capnocytophaga ochracea、Capnocytophaga sputigena、Aggregatibacter actinomycetemcomitans、Fusobacterium nucleatum subsp. polymorphum、Fusobacterium periodonticum、SR1 sp. OT 345、Porphyromonas catoniae、Selenomonas sputigena、Neisseria flavescens、Streptococcus sobrinus、Parvimonas micra、Peptostreptococcus stomatis、Treponema socranskii、Eubacterium saphenum、Eubacterium nodatum、Treponema medium、Filifactor alocis、及びPorphyromonas endodontalisからなる群から選ばれる少なくとも1種である、[1]又は[2]に記載の方法。
[4] 負の相関関係を示す細菌が、Streptococcus mutans、Actinomyces odontolyticus、Streptococcus mitis bv 2、Streptococcus mitis、Campylobacter concisus、Capnocytophaga gingivalis、Prevotella pallens、Streptococcus salivarius、Eubacterium sulci、Rothia mucilaginosa、Prevotella denticola、Veillonella atypica、Prevotella histicola、Megasphaera micronuciformis、及びStreptococcus parasanguinisからなる群から選ばれる少なくとも1種である、[1]~[3]のいずれか1項に記載の方法。
[5] 以下の(1)~(4)工程を有する、[1]~[4]のいずれか1項に記載の方法。
(1)歯周ポケット炎症面積が既知の被験者の唾液サンプルから、唾液中の各種細菌の細菌量を検出する工程
(2)当該各種細菌の細菌量について、菌ごとに固有の歯周ポケット炎症面積との相関係数を求め、各種細菌の細菌量と歯周ポケット炎症面積との関係式を構築して予測モデルを作成する工程
(3)歯周ポケット炎症面積が未知の被験者の唾液サンプルから、唾液中の各種細菌の細菌量を検出する工程
(4)(3)で得られた各種細菌量を(2)で得られた関係式に入れて歯周ポケット炎症面積を推定する工程
[6] 前記予測モデルの作成方法が、線形回帰、回帰木、モデル木、ニューラルネットワーク、サポートベクターマシン、バギング、ブースティング、ランダムフォレストの機械学習アルゴリズムから選ばれる1種を使用する方法である、[5]に記載の方法。 [7] 唾液中の1種以上の細菌の細菌量を検出し、得られた検出結果を指標として、歯周組織の炎症度を包括的に推定する方法。
[8] 歯周組織の炎症度が、PISA又はCAPRSの値である、[7]に記載の方法。
[9] 検出される細菌の細菌量が、唾液中の該細菌のコピー数である、[7] 又は[8]に記載の方法。
[10] 検出される細菌の細菌量が、唾液中の該細菌の16S rRNA配列情報に基づく細菌量である、[7]~[8]のいずれか1項に記載の方法。
[11] 検出される細菌が、Porphyromonas属、Tannerella属、Treponema属、Prevotella属、Campylobacter属、Fusobacterium属、Streptococcus属、Aggregatibacter属、Capnocytophaga属、Eikenella属、Actinomyces属、Veillonella属及びSelenomonas属から選ばれる少なくとも1種の属に属する細菌である、[7]~[10]のいずれか1項に記載の方法。
[12] 検出される細菌が、Streptococcus mutans、Actinomyces odontolyticus、Streptococcus mitis bv 2、Streptococcus mitis、Campylobacter concisus、Prevotella intermedia、Campylobacter showae、Prevotella nigrescens、Eikenella corrodens、Capnocytophaga gingivalis、Actinomyces naeslundii II、Streptococcus constellatus、Campylobacter gracilis、Fusobacterium periodonticum、Fusobacterium nucleatum subsp. polymorphum、Aggregatibacter actinomycetemcomitans、Capnocytophaga sputigena、Capnocytophaga ochracea、Streptococcus intermedius、Fusobacterium nucleatum subsp. vincentii、Streptococcus gordonii、Veillonella parvula、Selenomonas noxia、Fusobacterium nucleatum subsp. nucleatum、Campylobacter rectus、Porphyromonas gingivalis、Fusobacterium nucleatum subsp. animalis、Tannerella forsythia及びTreponema denticolaから選ばれる少なくとも1種である、[7]~[11]のいずれか1項に記載の方法。
[13] 検出される細菌は、該細菌の細菌量と歯周組織の炎症度とが正の相関関係となり得る細菌を含む、[7]~[12]のいずれか1項に記載の方法。
[14] 前記正の相関関係となり得る細菌が、Fusobacterium periodonticum、Fusobacterium nucleatum subsp. polymorphum、Aggregatibacter actinomycetemcomitans、Capnocytophaga sputigena、Capnocytophaga ochracea、Streptococcus intermedius、Fusobacterium nucleatum subsp. vincentii、Streptococcus gordonii、Veillonella parvula、Selenomonas noxia、Fusobacterium nucleatum subsp. nucleatum、Campylobacter rectus、Porphyromonas gingivalis、Fusobacterium nucleatum subsp. animalis、Tannerella forsythia及びTreponema denticolaから選ばれる少なくとも1種である、[13]に記載の方法。
[15] 検出される細菌は、該細菌の細菌量と歯周組織の炎症度とが負の相関関係となり得る細菌を含む、[7]~[12]のいずれか1項に記載の方法。
[16] 前記負の相関関係となり得る細菌が、Streptococcus mutans、Actinomyces odontolyticus、Streptococcus mitis bv 2、Streptococcus mitis、Campylobacter concisus、Prevotella intermedia、Campylobacter showae、Prevotella nigrescens、Eikenella corrodens、Capnocytophaga gingivalis、Actinomyces naeslundii II、Streptococcus constellatus及びCampylobacter gracilisから選ばれる少なくとも1種である、[15]に記載の方法。
また、本発明によれば、唾液中の細菌量の検出結果に基づいて、炎症面積(PISA値、CAPRS値)といった歯周組織の炎症度を簡便に予測することができる。すなわち、精密な歯周病検査(ポケット実測や撮像)をしなくとも、採取した唾液を用いて、簡便に口腔全体の炎症度(炎症指標数値)を推定することができる。
i)唾液中の2種以上の細菌の細菌量を検出する工程、及び、ii)得られた検出結果を指標として歯周ポケット炎症面積を推定する工程。
本発明の第二の態様である、歯周組織の炎症度を包括的に推定する方法(以下、「第二の発明群」ともいう。)の発明は、以下の工程を包含するものである。
i)唾液中(被験体、特にヒトの唾液中)の1種以上の細菌の細菌量を検出する工程、及び、ii)得られた検出結果を指標として歯周組織の炎症度を包括的に推定する工程。
本発明の方法においては、被験者から採取された唾液中から口腔内の細菌量を測定する際に、DNAチップを使用することができる。当該DNAチップには、例えば、以下のプローブ(a)(細菌特異的プローブ)を搭載することができ、さらに、プローブ(b)(総量指標プローブ)やプローブ(c)(絶対量指標プローブ)を搭載することもできる。
(b)総量指標プローブ:すべての細菌の遺伝子にハイブリダイズする核酸からなるプローブ
(c)絶対量指標プローブ:1種類又は複数種類の絶対量指標それぞれに特異的にハイブリダイズする核酸からなるプローブ
本発明の方法において、検出対象(細菌量の測定対象)となる唾液中の細菌としては、限定はされないが、例えば、以下に列挙する各属に属する細菌、すなわち、Porphyromonas属、Tannerella属、Treponema属、Prevotella属、Campylobacter属、Fusobacterium属、Streptococcus属、Aggregatibacter属、Capnocytophaga属、Eikenella属、Actinomyces属、Veillonella属、Selenomonas属、Eubacterium属、Parvimonas属、Filifactor属、Haemophilus属、Alloprevotella属、Solobacterium属、Rothia属、Peptostreptococcus属、Gemella属、Corynebacterium属、Neisseria属、Granulicatella属、Megasphaera属及びSR1門から選ばれる少なくとも1種の属に属する細菌であることが好ましい。
より具体的には、以下に列挙する各種細菌から選ばれる少なくも1種、又は2種以上を検出対象とすることがより好ましい。
Tannerella forsythia
Treponema denticola
Campylobacter gracilis
Campylobacter rectus
Campylobacter showae
Fusobacterium nucleatum subsp. vincentii
Fusobacterium nucleatum subsp. polymorphum
Fusobacterium nucleatum subsp. animalis
Fusobacterium nucleatum subsp. nucleatum
Fusobacterium periodonticum
Prevotella intermedia
Prevotella nigrescens
Streptococcus constellatus
Aggregatibacter actinomycetemcomitans
Campylobacter concisus
Capnocytophaga gingivalis
Capnocytophaga ochracea
Capnocytophaga sputigena
Eikenella corrodens
Streptococcus gordonii
Streptococcus intermedius
Streptococcus mitis
Streptococcus mitis bv 2
Actinomyces odontolyticus
Veillonella parvula
Actinomyces naeslundii II
Selenomonas noxia
Streptococcus mutans
Eubacterium nodatum
Parvimonas micra
Filifactor alocis
Streptococcus sobrinus
Porphyromonas pasteri
Veillonella atypica
Haemophilus parainfluenzae
Alloprevotella spp. (A. rava,OT 308)
Streptococcus parasanguinis
Actinomyces israelii
Prevotella pallens
Prevotella loescheii
Prevotella histicola
Solobacterium moorei
Prevotella melaninogenica
Selenomonas sputigena
Rothia dentocariosa
Rothia mucilaginosa
Veillonella rogosae
Peptostreptococcus stomatis
Prevotella denticola
Porphyromonas endodontalis
Streptococcus salivarius
Actinomyces graevenitzii
Treponema medium
Treponema socranskii
Gemella sanguinis
Porphyromonas catoniae
Corynebacterium matruchotii
Eubacterium saphenum
Neisseria flavescens
Granulicatella adiacens
Eubacterium sulci
Megasphaera micronuciformis
Prevotella shahii
SR1 sp. OT 345
歯周ポケット炎症面積とは、PISA(periodontal inflamed surface area:歯周炎症表面積)やCAPRS(conccaled area in periodontal pockt of tooth root surfase : 歯周ポケット内歯根表面積)を含む炎症を示す面積であり、同様の概念の指標があればその指標も含まれる。
DNAチップを用いて確認する場合、口腔内試料をDNAチップで測定し、その後歯周ポケット炎症面積と各細菌の細菌量またはSN比のような測定量との相関係数を算出し、相関係数が正の値となる細菌群と負の値となる細菌群として分類、特定することができる。これらの細菌は、測定回数が40回以上の場合に相関係数の絶対値が0.02以上であることが好ましく、0.1以上であることがより好ましく、0.2以上であることがさらに好ましく、0.4以上であることが特に好ましく、0.6以上であることが最も好ましい。
後述する、歯周ポケット炎症面積を推定するための予測モデルの作成に実験誤差補正後のデータを用いる際は、細菌群の分類にも実験誤差補正後のデータを用いる。
Treponema denticola
Tannerella forsythia
Fusobacterium nucleatum subsp. animalis
Porphyromonas gingivalis
Campylobacter rectus
Fusobacterium nucleatum subsp. nucleatum
Selenomonas noxia
Veillonella parvula
Streptococcus gordonii
Fusobacterium nucleatum subsp. vincentii
Streptococcus intermedius
Capnocytophaga ochracea
Capnocytophaga sputigena
Aggregatibacter actinomycetemcomitans
Fusobacterium nucleatum subsp. polymorphum
Fusobacterium periodonticum
SR1 sp. OT 345
Porphyromonas catoniae
Selenomonas sputigena
Neisseria flavescens
Streptococcus sobrinus
Parvimonas micra
Peptostreptococcus stomatis
Treponema socranskii
Eubacterium saphenum
Eubacterium nodatum
Treponema medium
Filifactor alocis
Porphyromonas endodontalis
Streptococcus mutans
Actinomyces odontolyticus
Streptococcus mitis bv 2
Streptococcus mitis
Campylobacter concisus
Capnocytophaga gingivalis
Prevotella pallens
Streptococcus salivarius
Eubacterium sulci
Rothia mucilaginosa
Prevotella denticola
Veillonella atypica
Prevotella histicola
Megasphaera micronuciformis
Streptococcus parasanguinis
上記正の相関関係を有する細菌としては、例えば、以下に列挙する細菌が好ましく挙げられ、これらのうちの少なくとも1種、好ましくは2種以上を検出対象とすることがより好ましい。
Tannerella forsythia
Fusobacterium nucleatum subsp. animalis
Porphyromonas gingivalis
Campylobacter rectus
Fusobacterium nucleatum subsp. nucleatum
Selenomonas noxia
Veillonella parvula
Streptococcus gordonii
Fusobacterium nucleatum subsp. vincentii
Streptococcus intermedius
Capnocytophaga ochracea
Capnocytophaga sputigena
Aggregatibacter actinomycetemcomitans
Fusobacterium nucleatum subsp. polymorphum
Fusobacterium periodonticum
Actinomyces odontolyticus
Streptococcus mitis bv 2
Streptococcus mitis
Campylobacter concisus
Capnocytophaga gingivalis
本発明において、細菌特異的プローブとして使用され得るオリゴDNAは、唾液中の細菌に由来する核酸の塩基配列のうちの特定の領域中の塩基配列とハイブリダイズすることができるものである。ここで、当該核酸は、染色体DNAやプラスミドDNA等を含むDNA及びRNAのいずれでもよく限定はされないが、染色体DNAであることが好ましい。具体的には、本発明においてプローブとして使用されるオリゴヌクレオチドは、前記細菌の染色体DNA中の16S rRNA遺伝子の塩基配列とハイブリダイズすることができるものである。
本発明に用い得るプローブは、検出目的となる個々の細菌に特異的な塩基配列となるような領域を選択してその領域の塩基配列を設計することが好ましい。一般的に、プローブの設計の際には、特異的な領域を選択することに加え、融解温度(Tm)がそろっていて、二次構造を形成しにくいものである必要がある。
プローブの特異性は、属レベルの特異性を基に同じ属の細菌を一括に検出するものであってもよいし、個々の種レベルで検出可能な特異性であってもよく、検出目的に応じて適宜選択・設計が可能である。
本発明において用い得る細菌特異的なプローブの例を、下記の表Aに示す(配列番号1~29)。
総量指標プローブは、特定のプライマー対で増幅できた、検体中(唾液中)のすべての細菌を捕捉する目的のプローブである。細菌を検出する上では、検出対象細菌が、非検出対象細菌を含む全体の細菌の中でどの程度の割合であるのか、また、そもそも検体中にどれくらいの量の細菌が存在しているのかといった観点から、細菌の総量を検出することも重要となる。
細菌の総量を検出するためには、例えば、DNAチップとは独立に細菌の総量を測定することも可能であるが、DNAチップ中に細菌の総量の指標となるプローブを搭載しておくことにより操作の簡便性が向上する。プローブについては、プライマー対によって増幅される塩基配列の中から、多種類の菌種に共通な塩基配列を使用してもよい。そのような配列が見つからない場合は、比較的共通な配列を複数設計し、それらを総合的に判断することで総量指標プローブとしてもよい。総量指標プローブは、好ましくは、検体中に含まれる細菌に由来する核酸にハイブリダイズするプローブ、詳しくは、前記特定のプライマー対により増幅される塩基配列のうちの、検出対象となる複数種類の細菌が共通に有する塩基配列を含むプローブである。総量指標プローブの例を、下記の表A(配列番号31)に示す。
そのような状況を防ぐためには、ハイブリダイゼーションに供する検体量を制限することが望ましい。又は、プローブを設計する際には、例えば当該プローブのTm値を低くする。具体的にはGC含量を少なくすることや、プローブの配列長自体を短くする方法が考えられる。
また、ハイブリダイゼーションに際して、増幅された核酸と総量指標プローブとのハイブリダイゼーションに対して競合的に作用するような核酸を添加することで、シグナル強度の低減化を図ることが可能である。このような核酸としては、例えば、総量指標プローブと全て又は部分的に同じ配列を有する核酸、又は総量指標プローブの相補配列を全て又は部分的に有する核酸などが挙げられる。
絶対量指標プローブは、絶対量指標の核酸にのみハイブリダイズするプローブである。
本明細書において、絶対量指標とは、増幅反応やハイブリダイゼーション反応の前に、検体中に一定量添加する核酸である。絶対量指標は、通常の増幅反応を行えば増幅反応が確実に行われる核酸であり、いわゆる陽性コントロールとしての役割を果たす。
従って、絶対量指標に特異的なプローブを、DNAチップに搭載しておけば、その検出結果から、増幅反応やハイブリダイゼーション等が適切に実施されたかを確認することができる。また、絶対量指標を1種類設定した場合、多少増幅効率やハイブリダイゼーション効率が増減した場合に、絶対量指標のシグナル強度を比較することにより補正係数を算出することができる。複数のDNAチップにおいて、補正したシグナル強度は比較することができる。
に示す。また絶対量指標の例を、下記の配列番号74に示す。
CTATTCGACCAGCGATATCACTACGTAGGC(配列番号30)
GTGAGAAGCCTACACAAACGTAACGTCAGGGCTAAGACAAACGCTAACGGTACACCCTAGATGGGAGCTTGTAGCTAGATCGCTAAGTCCTACCGACATGTAGGCATACTCACGAAGGCAATTCCCTGAAAGCCTCGTCTTATCCCGAACTTGGCATCTGCTGATACGTCAGGTTGAACGCGTACATTTACCTGTCATGCGTGGGCCTTCTCCGAATAGCCTACGTAGTGATATCGCTGGTCGAATAGGCGGATTGCTCATAAATGCACATTGGCTAAGGCCCACGGAACACGAATCACGTGAGATCACTTACTATTCGACGGAACTACTATACGCACCGGGACATGCAAGTAGCGTCCCACAAGCATAAGGAACTCTATACTCGCCATCTACGCAGCTACAGGGGATACACGTATGAGCGGTTACGAAGTAAAGCCGAGATAGAGCGGTCTTTAGAGAAAAAACAGGATTAGATACCCTGGTAGTCC(配列番号74)
特定のプライマーとは、増幅対象配列が限定されるという意味であり、プライマー対は必ずしも1対である必要はない。必要に応じて2対以上のプライマー対を用いるマルチプレックス手法も適用できる。プライマー対の例を、下記の表Bに示す。細菌増幅用プライマー対(配列番号32、33)や、絶対量指標用プライマー対(配列番号34、35)を利用することが可能である。
これらの配列につき、GとTの和がAとTの和と同数になる配列のみを抜粋し、抜粋された配列を、NCBIのGenBank等のデータベースに対してBlast検索し、生物由来の核酸に対し、類似配列の少ないものを選抜し、配列の両末端にプライマー配列を付加することで、設計可能である。また、設計された配列を適宜連結させて長くしたり、部分的に除去して短くしたりすることも可能である。
一方で、増幅後に電気泳動等で増幅鎖長を確認する場合においては、検出対象細菌とは異なる長さの増幅産物となるように設計した上で、絶対量指標由来の増幅産物を検出対象細菌のバンドとは異なる位置で検出し、ハイブリダイゼーションの前に増幅反応の成否を確認することも可能である。
最後に、検体中に含まれる絶対量指標はあまりにも濃度が高いと検出対象の細菌と増幅反応における競合が激しくなり、本来検出できるはずの検出対象細菌が検出できなくなる可能性もあるため、アプリケーションに応じて適宜濃度調整をする必要がある。


また、本発明に用いるプローブを構成するヌクレオチドは、DNA及びRNA、又はPNAのいずれであってもよく、DNA、RNA及びPNAの2種以上のハイブリッドであってもよい。
ここで、実質的に同一とは、配列番号1~31に記載の配列又は相補配列に対してストリンジェントな条件下で特異的にハイブリダイズするものである。
(e) 上記(d)のDNAに対し相補的な塩基配列からなるDNAとストリンジェントな条件下でハイブリダイズし、かつ唾液中の細菌に由来する核酸の塩基配列のうちの少なくとも一部の塩基配列を検出し得る機能を有するDNA
また、上記(e)のDNAは、上記(d)の各種DNA若しくはそれと相補的な塩基配列からなるDNA、又はこれらを断片化したものをプローブとして用い、コロニーハイブリダイゼーション、プラークハイブリダイゼーション、及びサザンブロット等の公知のハイブリダイゼーション法を実施し、cDNAライブラリーやゲノムライブラリーから得ることができる。ライブラリーは、公知の方法で作製されたものを利用してもよいし、市販のcDNAライブラリーやゲノムライブラリーを利用してもよく、限定はされない。ハイブリダイゼーション法の詳細な手順については、前記と同様のものを参照することができる。上記(e)のDNAに関し、「ストリンジェントな条件」とは、ハイブリダイゼーション時の条件であって、バッファーの塩濃度が24~390mM、温度が40~65℃、好ましくは塩濃度が48.8~195mM、温度が45~60℃の条件を意味する。具体的には、例えば97.5mMで50℃等の条件を挙げることができる。さらに、このような塩濃度や温度等の条件に加えて、プローブ濃度、プローブの長さ、反応時間などの諸条件も考慮し、前記(e)のDNAを得るための条件を適宜設定することができる。ハイブリダイズするDNAとしては、前記(d)のDNAの塩基配列に対して少なくとも60%以上の相同性を有する塩基配列であることが好ましく、より好ましくは80%以上、さらに好ましくは90%以上、さらに好ましくは95%以上、特に好ましくは98%以上、最も好ましくは99%以上である。
本発明の方法において、検出目的となる前述した唾液中の細菌が有する核酸の塩基配列は、当該塩基配列そのものである必要はなく、塩基配列の一部が欠失、置換、挿入等により変異が生じたものであってもよい。したがって、検出目的の核酸の塩基配列は、当該塩基配列に相補的な配列と、ストリンジェントな条件下でハイブリダイズし、かつそれぞれの塩基配列に由来する機能や活性を有する変異型遺伝子も対象とすることができ、プローブは、このような変異型遺伝子の塩基配列を基礎として設計することもできる。ここで「ストリンジェントな条件」は、前記と同様の条件を適用することができる。
前記したように、本発明の方法においては、唾液中の細菌量の検出・測定に、DNAチップを用いることができる。当該DNAチップは、、歯周組織の炎症度を包括的に推定するという用途に用いられるものであり、前記1.項で説明した各種オリゴヌクレオチドプローブが支持体となる基盤に複数配置されたものである。
以下、DNAチップの一形態である繊維型DNAチップに関して詳細に説明する。このDNAチップは、例えば、下記(i)~(iv)の工程を経て作製することができる。
(ii) 前記配列体を包埋し、ブロック体を製造する工程
(iii) オリゴヌクレオチドプローブを含むゲル前駆体重合性溶液を前記ブロック体の各中空繊維の中空部に導入して重合反応を行い、プローブを含むゲル状物を中空部に保持させる工程
(iv) 中空繊維の長手方向と交差する方向で切断して、ブロック体を薄片化する工程
中空繊維は、その長手方向の長さが同一となるように3次元に配列される(工程(i))。配列方法としては、例えば、粘着シート等のシート状物に複数本の中空繊維を所定の間隔をもって平行に配置し、シート状とした後、このシートを螺旋状に巻き取る方法(特開平11-108928号公報参照)や、複数の孔が所定の間隔をもって設けられた多孔板2枚を孔部が一致するように重ね合わせ、それらの孔部に中空繊維を通過させ、その後2枚の多孔板の間隔を開いて仮固定し、2枚の多孔板間における中空繊維の周辺に硬化性樹脂原料を充満させて硬化させる方法(特開2001-133453号公報参照)などが挙げられる。
包埋された配列体には、各中空繊維の中空部に、オリゴヌクレオチドプローブを含むゲル前駆体重合性溶液(ゲル形成溶液)を充填し、中空部内で重合反応を行う(工程(iii))。これにより、各中空繊維の中空部に、プローブが固定されたゲル状物を保持させることができる。
ゲル前駆体重合性溶液とは、ゲル形成重合性モノマー等の反応性物質を含有する溶液であって、該モノマー等を重合、架橋させることにより該溶液がゲル状物となることが可能な溶液をいう。そのようなモノマーとしては、例えば、アクリルアミド、ジメチルアクリルアミド、ビニルピロリドン、メチレンビスアクリルアミド等が挙げられる。この場合、溶液には重合開始剤等が含まれていてもよい。
前記した繊維型DNAチップとしては、例えば、三菱ケミカル社製DNAチップ(Genopal TM)等が好ましく挙げられる。
繊維型DNAチップでは、前記のように、プローブはゲル内で3次元的に配列され、3次元構造を維持することが可能となる。そのため、表面をコートしたスライドガラスにプローブを結合させた平面DNAチップに比べて、検出効率が上昇し、高感度で高再現性の検査をすることが可能となる。
また、DNAチップに配置されるプローブの種類の数は、1つのDNAチップに500種類以下、好ましくは250種類以下、さらに好ましくは100種類以下が好ましい。このように配置されたプローブ数(種類)をある程度制限することにより、目的の口腔内細菌をより高感度で検出することが可能となる。なお、プローブの種類は塩基配列によって区別される。従って、通常、同じ遺伝子に由来のプローブであっても塩基配列が1個でも異なれば別の種類として特定する。
本発明の方法において、唾液中の細菌量を測定するために当該細菌を検出する方法は、例えば、下記の工程を含む方法である。
(ii)抽出した核酸を、前記した本発明のオリゴヌクレオチドプローブ又は本発明のDNAチップに接触させる工程
(iii)DNAチップから得られたシグナル強度から細菌量を算出する工程
(1)工程(i)について
本工程では、被験者又は被生物から採取した口腔内試料としての唾液を検体とし、検体中(唾液中)に含まれる細菌の核酸を抽出する。唾液を採取する方法は特には限定されず、例えば、市販の唾液採取キットを利用する方法、綿棒を口に含み唾液を採取する方法、唾液を容器に直接採取する方法等が挙げられる。
唾液を採取する被験者は、特に限定はされないが、例えば、歯周病などの口内炎症を患っている患者に加え、歯周病などの口内炎症の自覚が無い者、又は心疾患など歯周病と関連が示唆される全身疾患患者や妊婦などでもよいし、あるいは、歯周病の罹患の疑いのない健常者であってもよい。
次いで、得られた唾液中に存在する細菌の核酸抽出を行う。抽出の方法は限定されず、公知の方法を用いることができる。例えば、機器による自動抽出法、市販の核酸抽出キットを利用する方法、プロテイナーゼK処理後にフェノール抽出する方法、クロロホルムを利用する方法又は簡易抽出方法として、試料を加熱、溶解する方法等が挙げられる。また、特に検体中から核酸を抽出せず、次の工程に進んでも良い。
本工程において抽出した核酸及びその増幅断片は、適宜標識化し、ハイブリダイズさせた後の検出過程において利用することも可能である。具体的には、PCRプライマーの末端を各種レポーター色素で標識しておく方法、反応性のヌクレオチドアナログを逆転写反応時に取り込ませる方法、ビオチン標識したヌクレオチドを取り込ませる方法などが考えられる。さらに、調製後に蛍光標識試薬と反応させて標識することも可能である。蛍光試薬としては、例えば、各種レポーター色素(例えば、Cy5、Cy3、VIC、FAM、HEX、TET、フルオレセイン、FITC、TAMRA、Texas red、Yakima Yellow等)を用いることができる。
本工程では、工程(i)で得た核酸又はその増幅断片を、本発明に用いるプローブ又はDNAチップに接触させるが、具体的には、当該核酸等を含むハイブリダイゼーション溶液を調製し、当該溶液中の核酸等を、DNAチップに搭載されたオリゴヌクレオチドプローブに結合(ハイブリダイズ)させる。ハイブリダイゼーション溶液は、SDSやSSC等の緩衝液を用いて、定法に従い、適宜調製することができる。
ハイブリダイゼーション反応は、ハイブリダイゼーション溶液中の核酸等が、DNAチップに搭載されたオリゴヌクレオチドプローブとストリンジェントな条件下でハイブリダイズし得るよう、反応条件(緩衝液の種類、pH、温度等)を適宜設定して行うことができる。なお、ここで言う「ストリンジェントな条件」とは、類似配列によるクロスハイブリダイゼーションを生じにくい、又は類似配列によってクロスハイブリダイゼーションした核酸を解離させる条件のことをいい、具体的には、ハイブリダイゼーション反応時又はハイブリダイゼーション後のDNAチップの洗浄条件を意味する。
例えば、ハイブリダイゼーション反応時の条件としては、反応温度は、35~70℃が好ましく、より好ましくは40~65℃であり、ハイブリダイズさせる際の時間は、約1分~16時間が好ましい。
本工程では、前記の手順で得られたシグナル強度より、検出対象菌種の細菌の細菌量を算出する。たとえば、検出対象細菌を検出するためのプローブのシグナル強度とバックグラウンドのシグナル強度からSN比として示す方法がある。または、あらかじめ細菌ごとに細菌の染色体DNAの濃度を変えて複数条件にて検出し、各濃度条件で得られるシグナル強度をもとに、細菌ごとに染色体DNA濃度を算出する換算係数(検量線)を取得しておき、それぞれの条件で得られたシグナル強度から染色体DNAの濃度を算出する方法などが好ましい。本発明においては、例えば、検出対象の細菌の16S rRNA配列情報に基づく、シグナル強度から、細菌量を算出することが好ましい。また、検出対象の細菌のゲノムコピー数を、細菌量とすることも好ましく採用できる。ゲノムコピー数は、DNAチップで検出されたシグナル強度に、事前に決定していた各細菌量算出係数を乗算し(且つ、必要に応じ、検出検体の希釈率を乗算し)、算出できる。各細菌量算出係数は、各細菌由来ゲノムDNAを検出したときのシグナル強度を測定し検量線を作成しておき、各細菌のシグナル強度から各細菌量を逆算する係数として求めておくことができる。
いずれの場合でも、各DNAチップの検出対象細菌のシグナル強度に補正係数を考慮することが好ましい。
本発明の方法は、唾液中の細菌の細菌量の検出結果を指標として、歯周ポケット炎症面積を推定する方法である。また、本発明の方法は、前記検出結果を指標として、歯周組織の炎症度を包括的に推定する方法である。
唾液中の細菌の細菌量の検出には、いかなるツールを用いてもよく、前記3.項で説明したようにDNAチップを用いる方法や、その他、酵素活性で菌の存在を確認する方法、電気的抵抗を測定し菌の総量を測定する方法、位相差顕微鏡と染色により細菌を数え上げる方法、培養して生菌数を測定する方法、リアルタイムPCRで個々の細菌数を定量する方法等が挙げられる。
(1)歯周ポケット炎症面積(PISA値、CAPRS値等)が既知の(実測されたPPD等から算出可能な)被験者の唾液サンプルから、唾液中の各種細菌の細菌量を検出する。
(2)当該各種細菌の細菌量について、菌ごとに固有の歯周ポケット炎症面積との相関係数を求め、各種細菌の細菌量と歯周ポケット炎症面積との関係式を構築して予測モデルを作成する。
(3)歯周ポケット炎症面積が未知の被験者の唾液サンプルから、唾液中の各種細菌の細菌量を検出する。
(4)(3)で得られた各種細菌量を(2)で得られた関係式に入れて歯周ポケット炎症面積を推定する。
Porphyromonas gingivalis,Tannerella forsythia,Treponema denticola,Campylobacter rectus,Fusobacterium nucleatum subsp. vincentii,Fusobacterium nucleatum subsp. polymorphum,Fusobacterium nucleatum subsp. animalis,Fusobacterium nucleatum subsp. nucleatum,Fusobacterium periodonticum,Aggregatibacter actinomycetemcomitans,Capnocytophaga ochracea,Capnocytophaga sputigena,Streptococcus gordonii,Streptococcus intermedius,Veillonella parvula,Selenomonas noxia,Solobacterium moorei,Prevotella loescheii,Veillonella rogosae,Actinomyces israelii,Corynebacterium matruchotii,SR1 sp. OT 345,Porphyromonas catoniae,Selenomonas sputigena,Neisseria flavescens,Streptococcus sobrinus,Parvimonas micra,Peptostreptococcus stomatis,Treponema socranskii,Eubacterium saphenum,Eubacterium nodatum ,Treponema medium,Filifactor alocis,Porphyromonas endodontalis
,Porphyromonas gingivalis,Tannerella forsythia,Treponema denticola,Campylobacter rectus,Fusobacterium nucleatum subsp. animalis,Fusobacterium nucleatum subsp. nucleatum,Veillonella parvula,Selenomonas noxia,Eubacterium saphenum,Eubacterium nodatum ,Treponema medium,Filifactor alocis,Porphyromonas endodontalis
正の相関を示す細菌としては、1種以上を用いることが好ましく、4種以上を用いることがより好ましく、8種以上を用いることがさらに好ましく、12種以上を用いることが特に好ましい。また、100種以下を用いることが好ましく、75種以下を用いることがより好ましく、50種以下を用いることがさらに好ましく、25種以下を用いることが特に好ましい。
負の相関祖示す細菌として、好ましくは以下の細菌が挙げられる。Streptococcus mitis,Streptococcus mitis bv 2,Actinomyces odontolyticus,Streptococcus mutans,Campylobacter concisus,Capnocytophaga gingivalis,Prevotella pallens,Streptococcus salivarius,Eubacterium sulci,Rothia mucilaginosa,Prevotella denticola,Veillonella atypica,Prevotella histicola,Megasphaera micronuciformis,Streptococcus parasanguinis,Gemella sanguinis,Alloprevotella spp. (A. rava,OT 308),Prevotella melaninogenica,Actinomyces graevenitzii,Prevotella shahii,Rothia dentocariosa,Granulicatella adiacens,Porphyromonas pasteri,Haemophilus parainfluenzae
負の相関を示す細菌としては、1種以上を用いることが好ましく、2種以上を用いることがより好ましく、4種以上を用いることがさらに好ましく、8種以上を用いることが特に好ましい。また、100種以下を用いることが好ましく、75種以下を用いることがより好ましく、50種以下を用いることがさらに好ましく、25種以下を用いることが特に好ましい。
大阪大学歯学部附属病院にて、歯周病治療中の20代~70代の男女被験者計46人から、唾液1ml以上、46サンプルを採取した。採取した唾液は使用前まで-20℃で凍結して保管した。
<臨床情報の取得>
すべてのサンプルについて下記の臨床情報を記録した。下記2項目は歯科において広く活用されている指標である。
(i)歯周ポケットの深さ(PPD):歯周プローブをポケットに挿入した際の,歯肉辺縁からプローブ先端までの距離を示す。6点法で頬側近心、頬側中央、頬側遠心、舌側近心、舌側中央、舌側遠心を測定し、1mm単位で数値化した。
(ii)プロービング時の出血(BOP):歯周プローブをポケットに挿入した際に出血の有無を示す。上記の6点法と対応した位置に対して出血がない場合を0、出血がある場合を1とした。
(i)歯周ポケットの深さ(PPD)と(ii)プロービング時の出血(BOP)を、表1にまとめた。
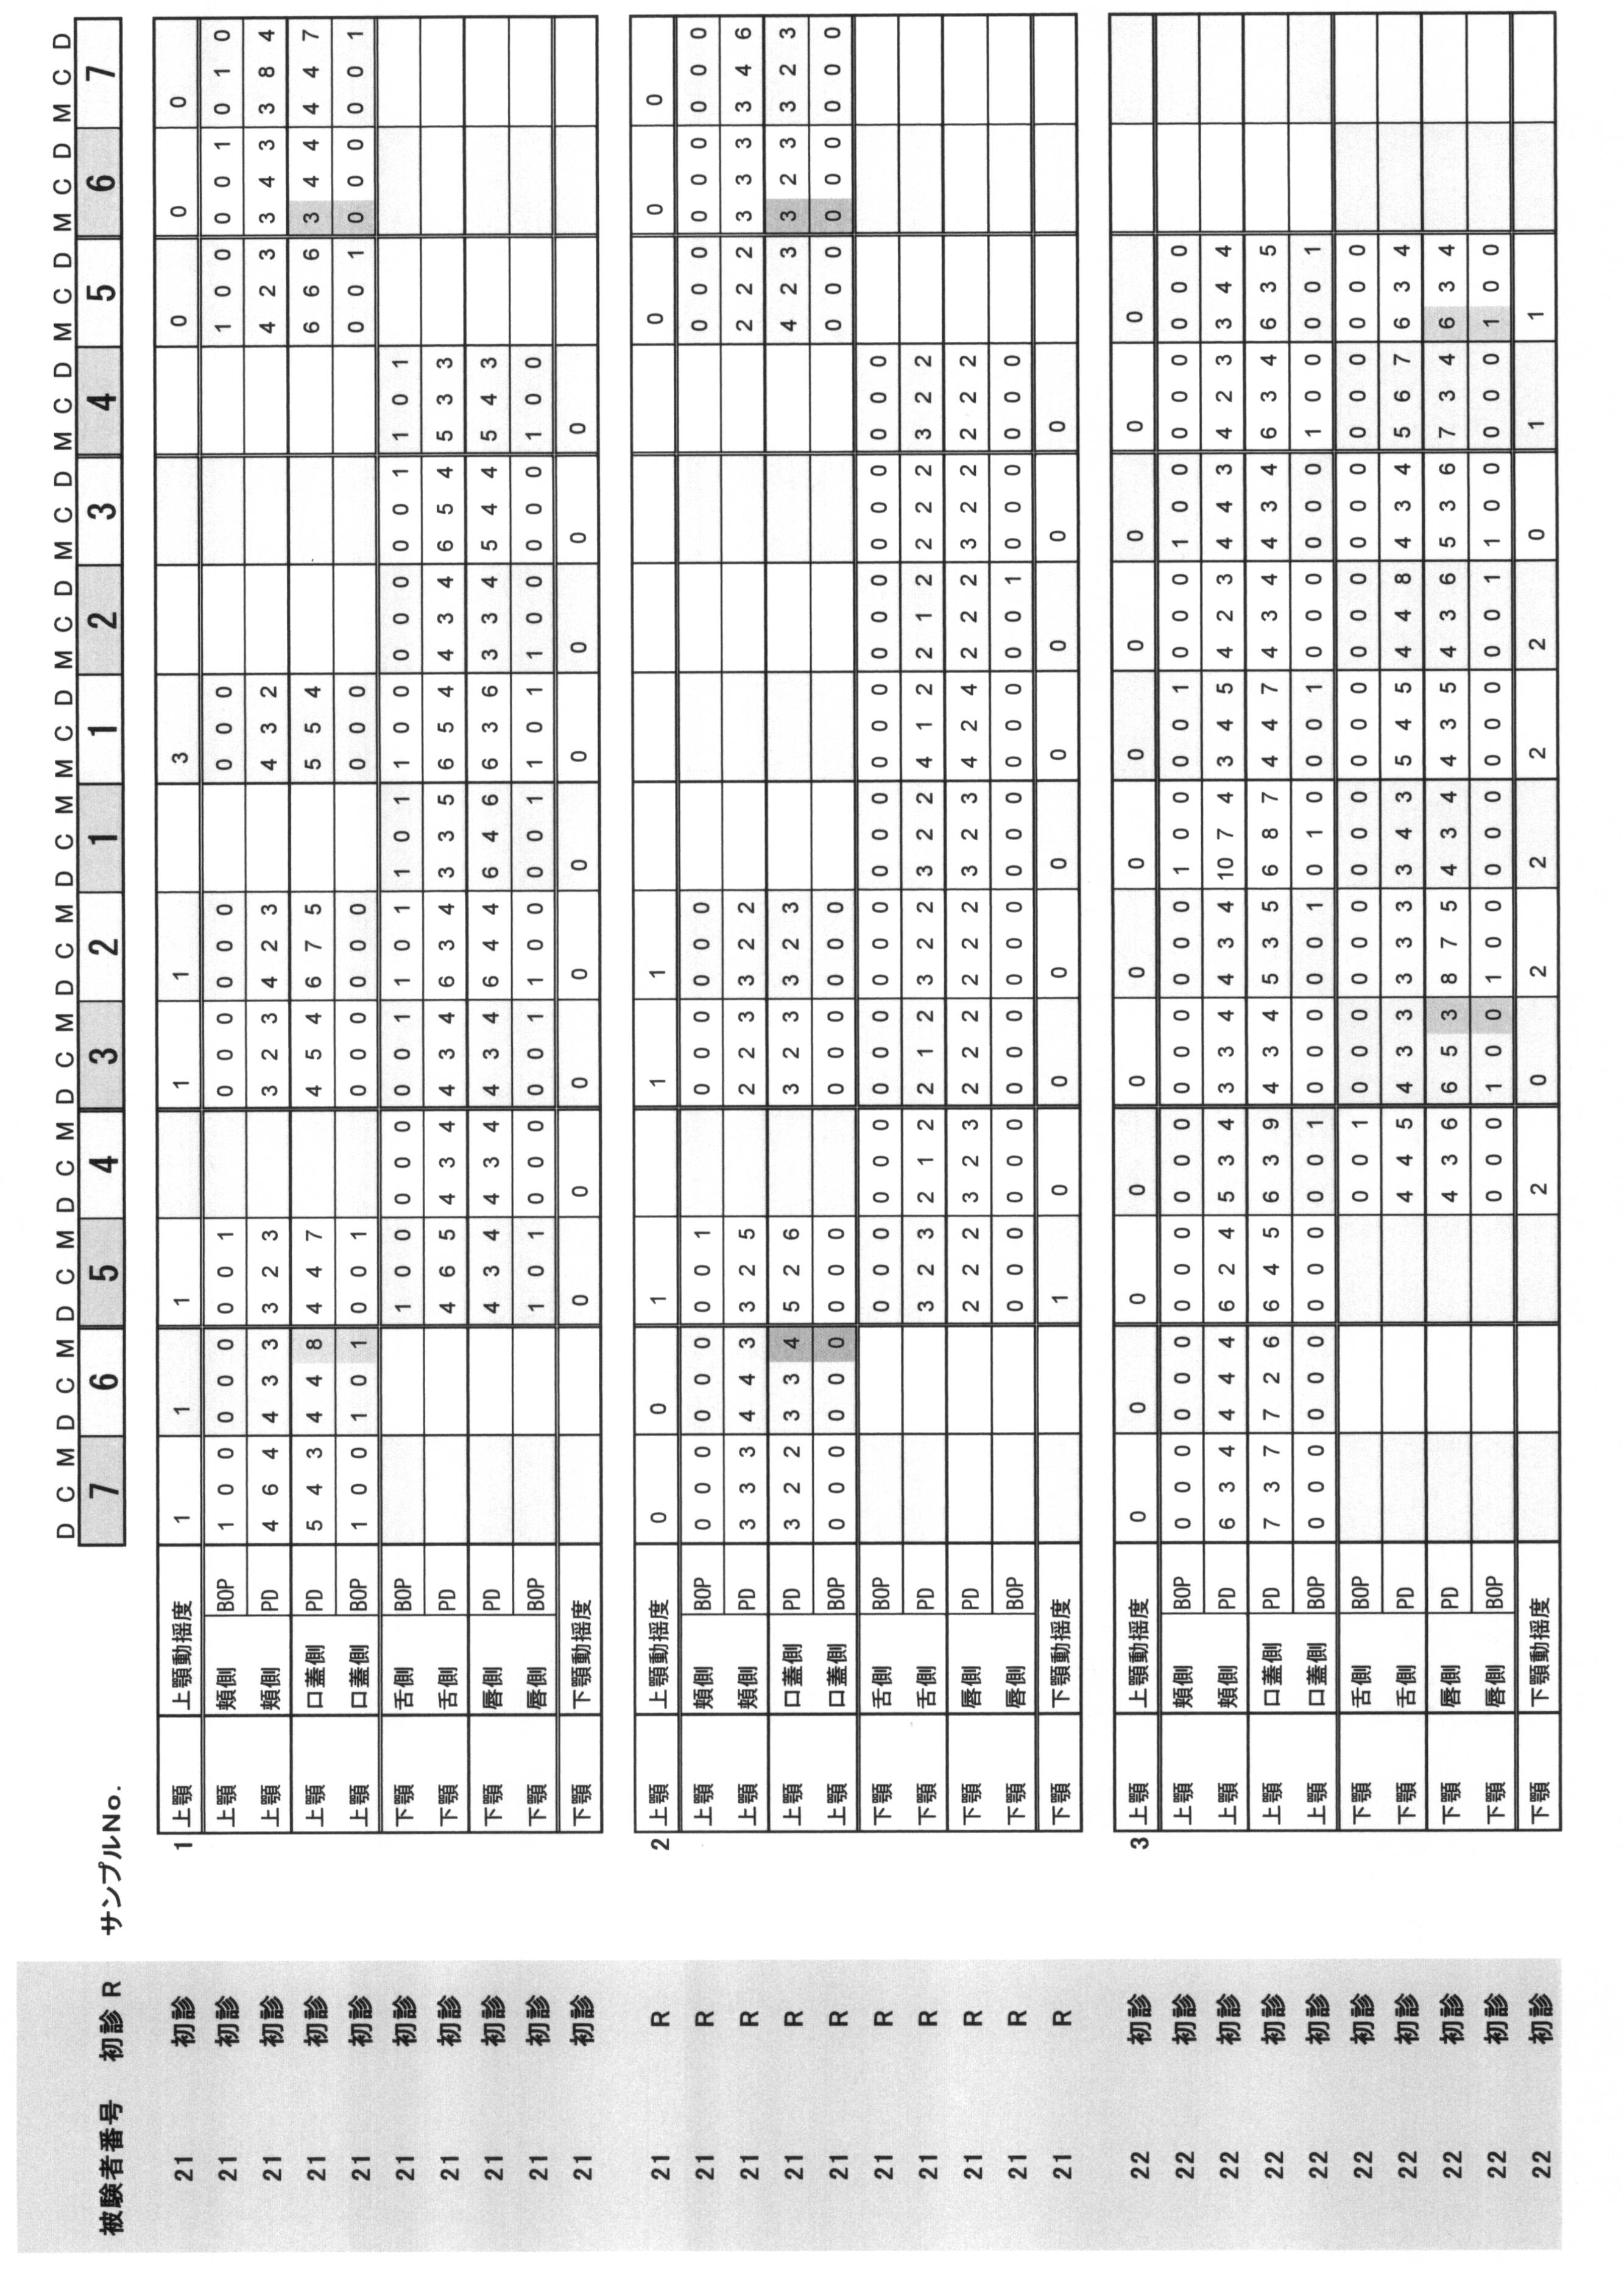
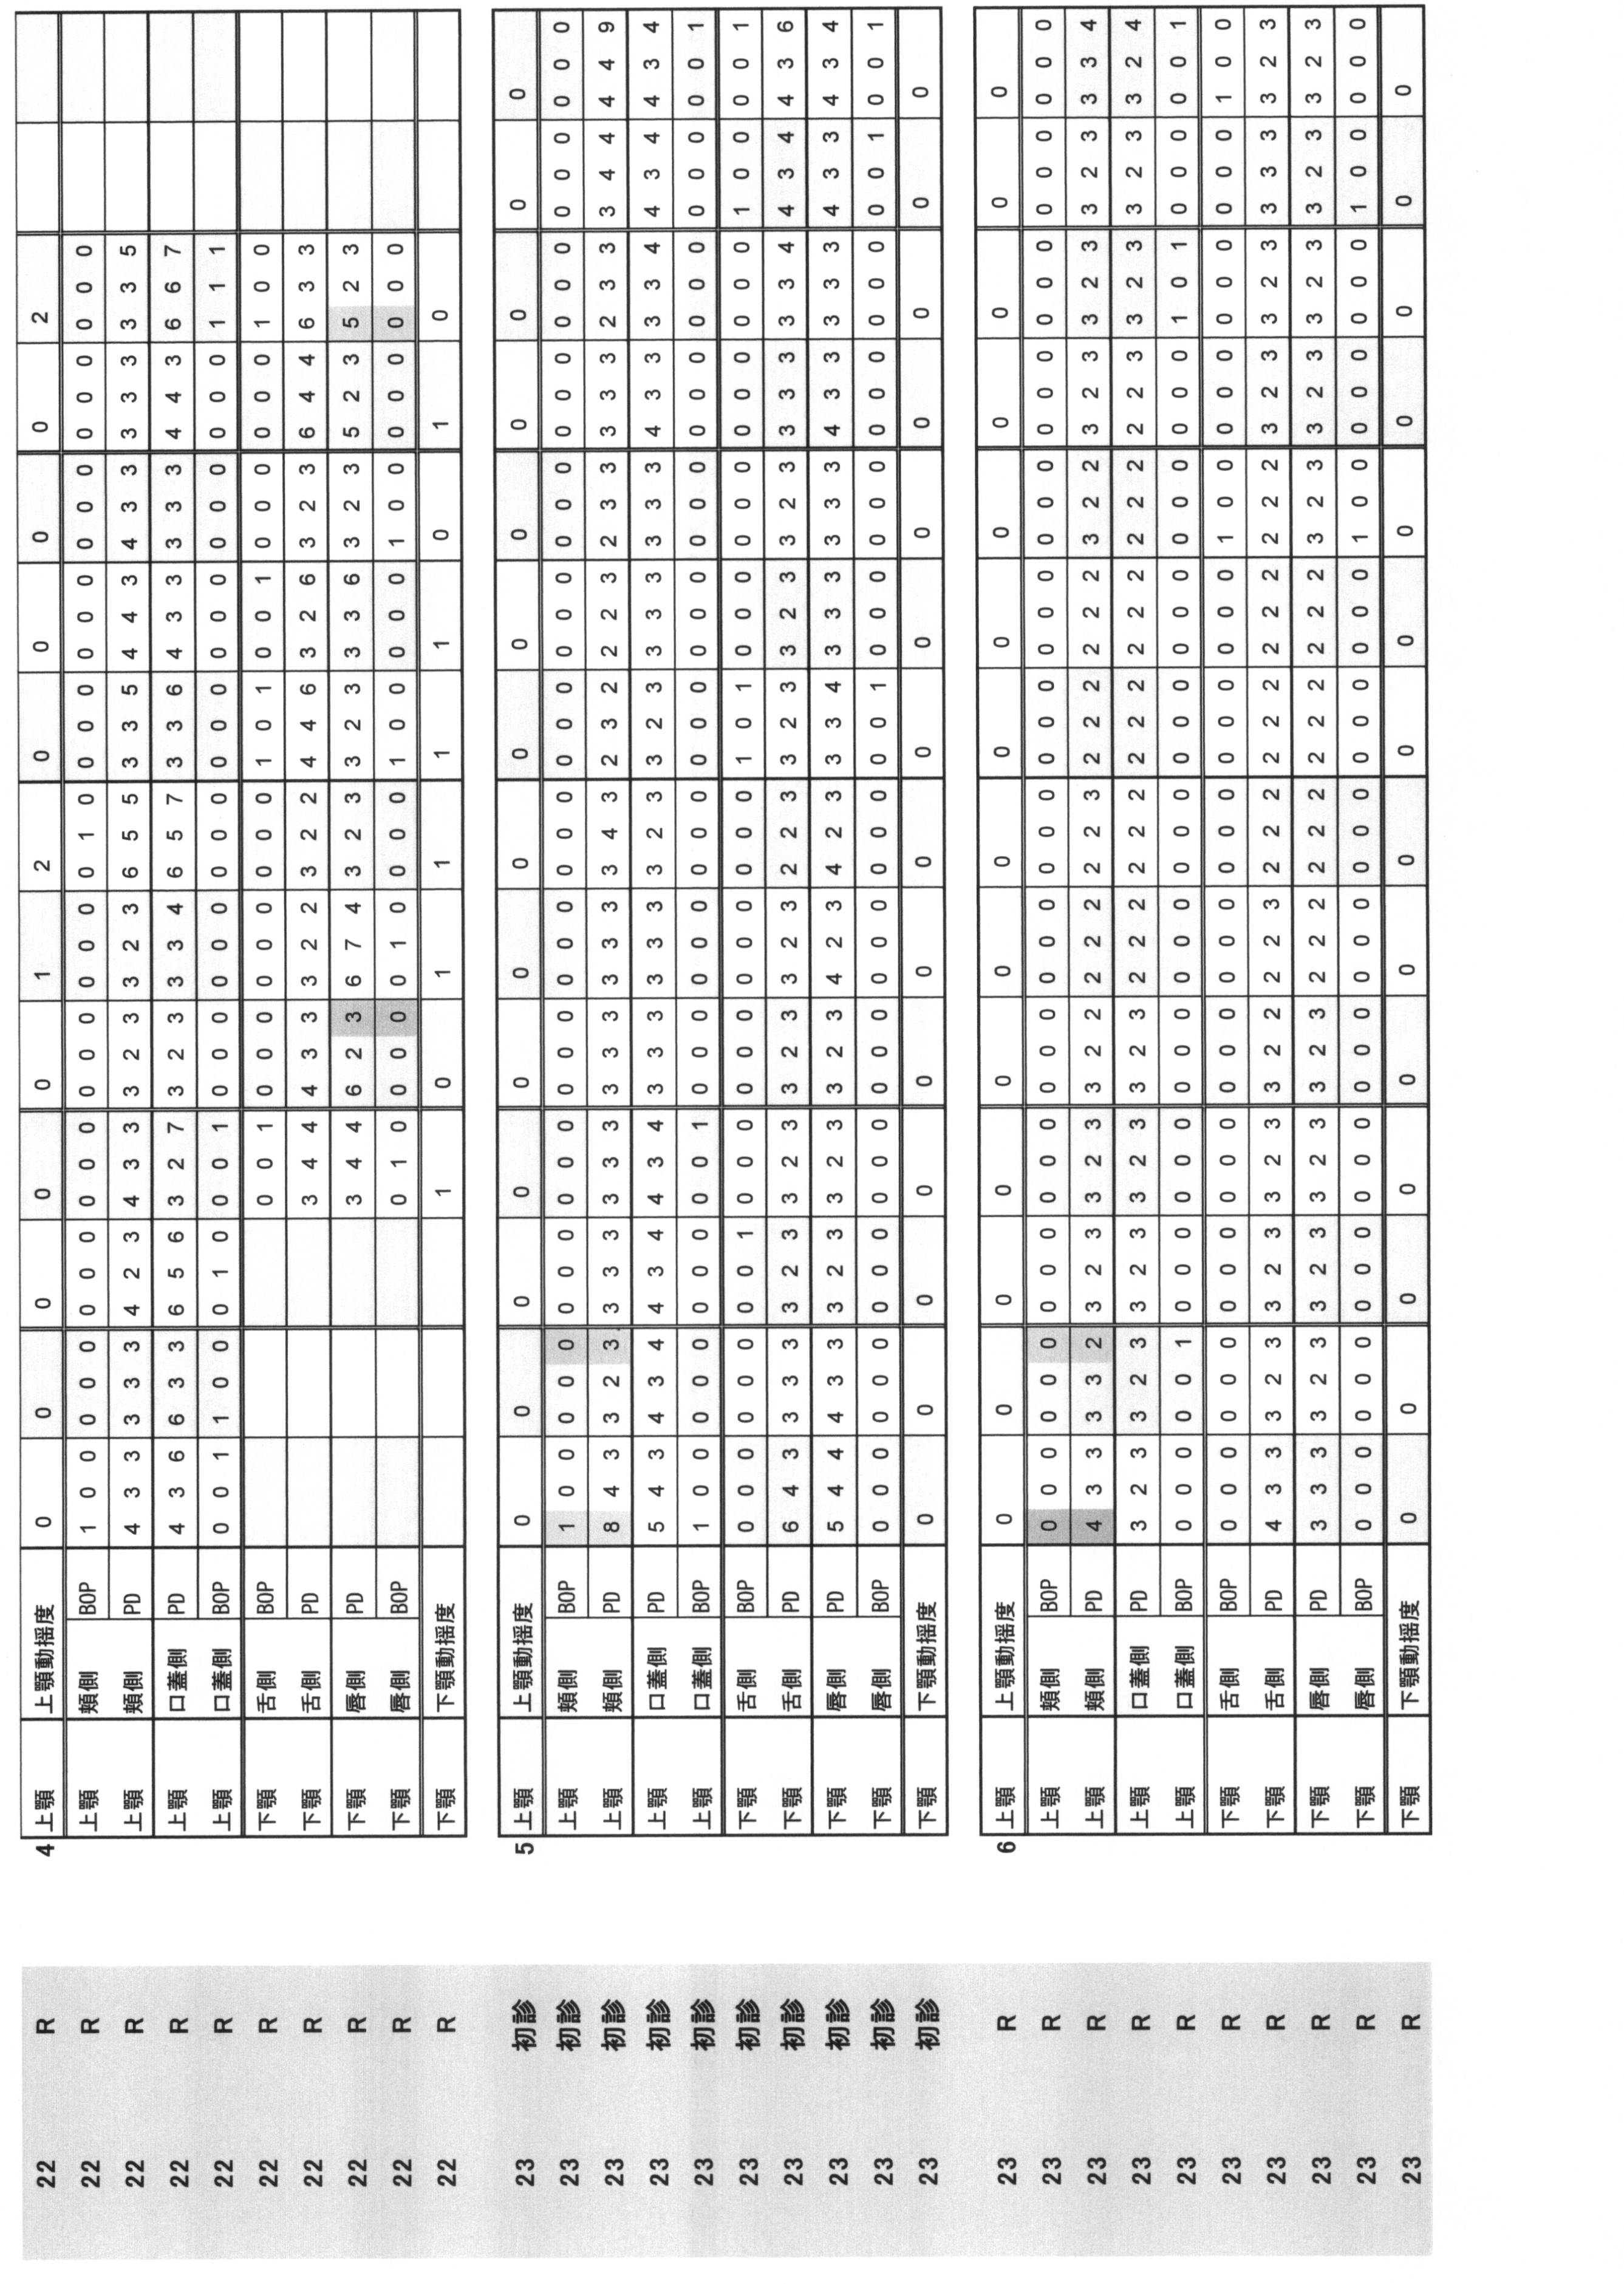
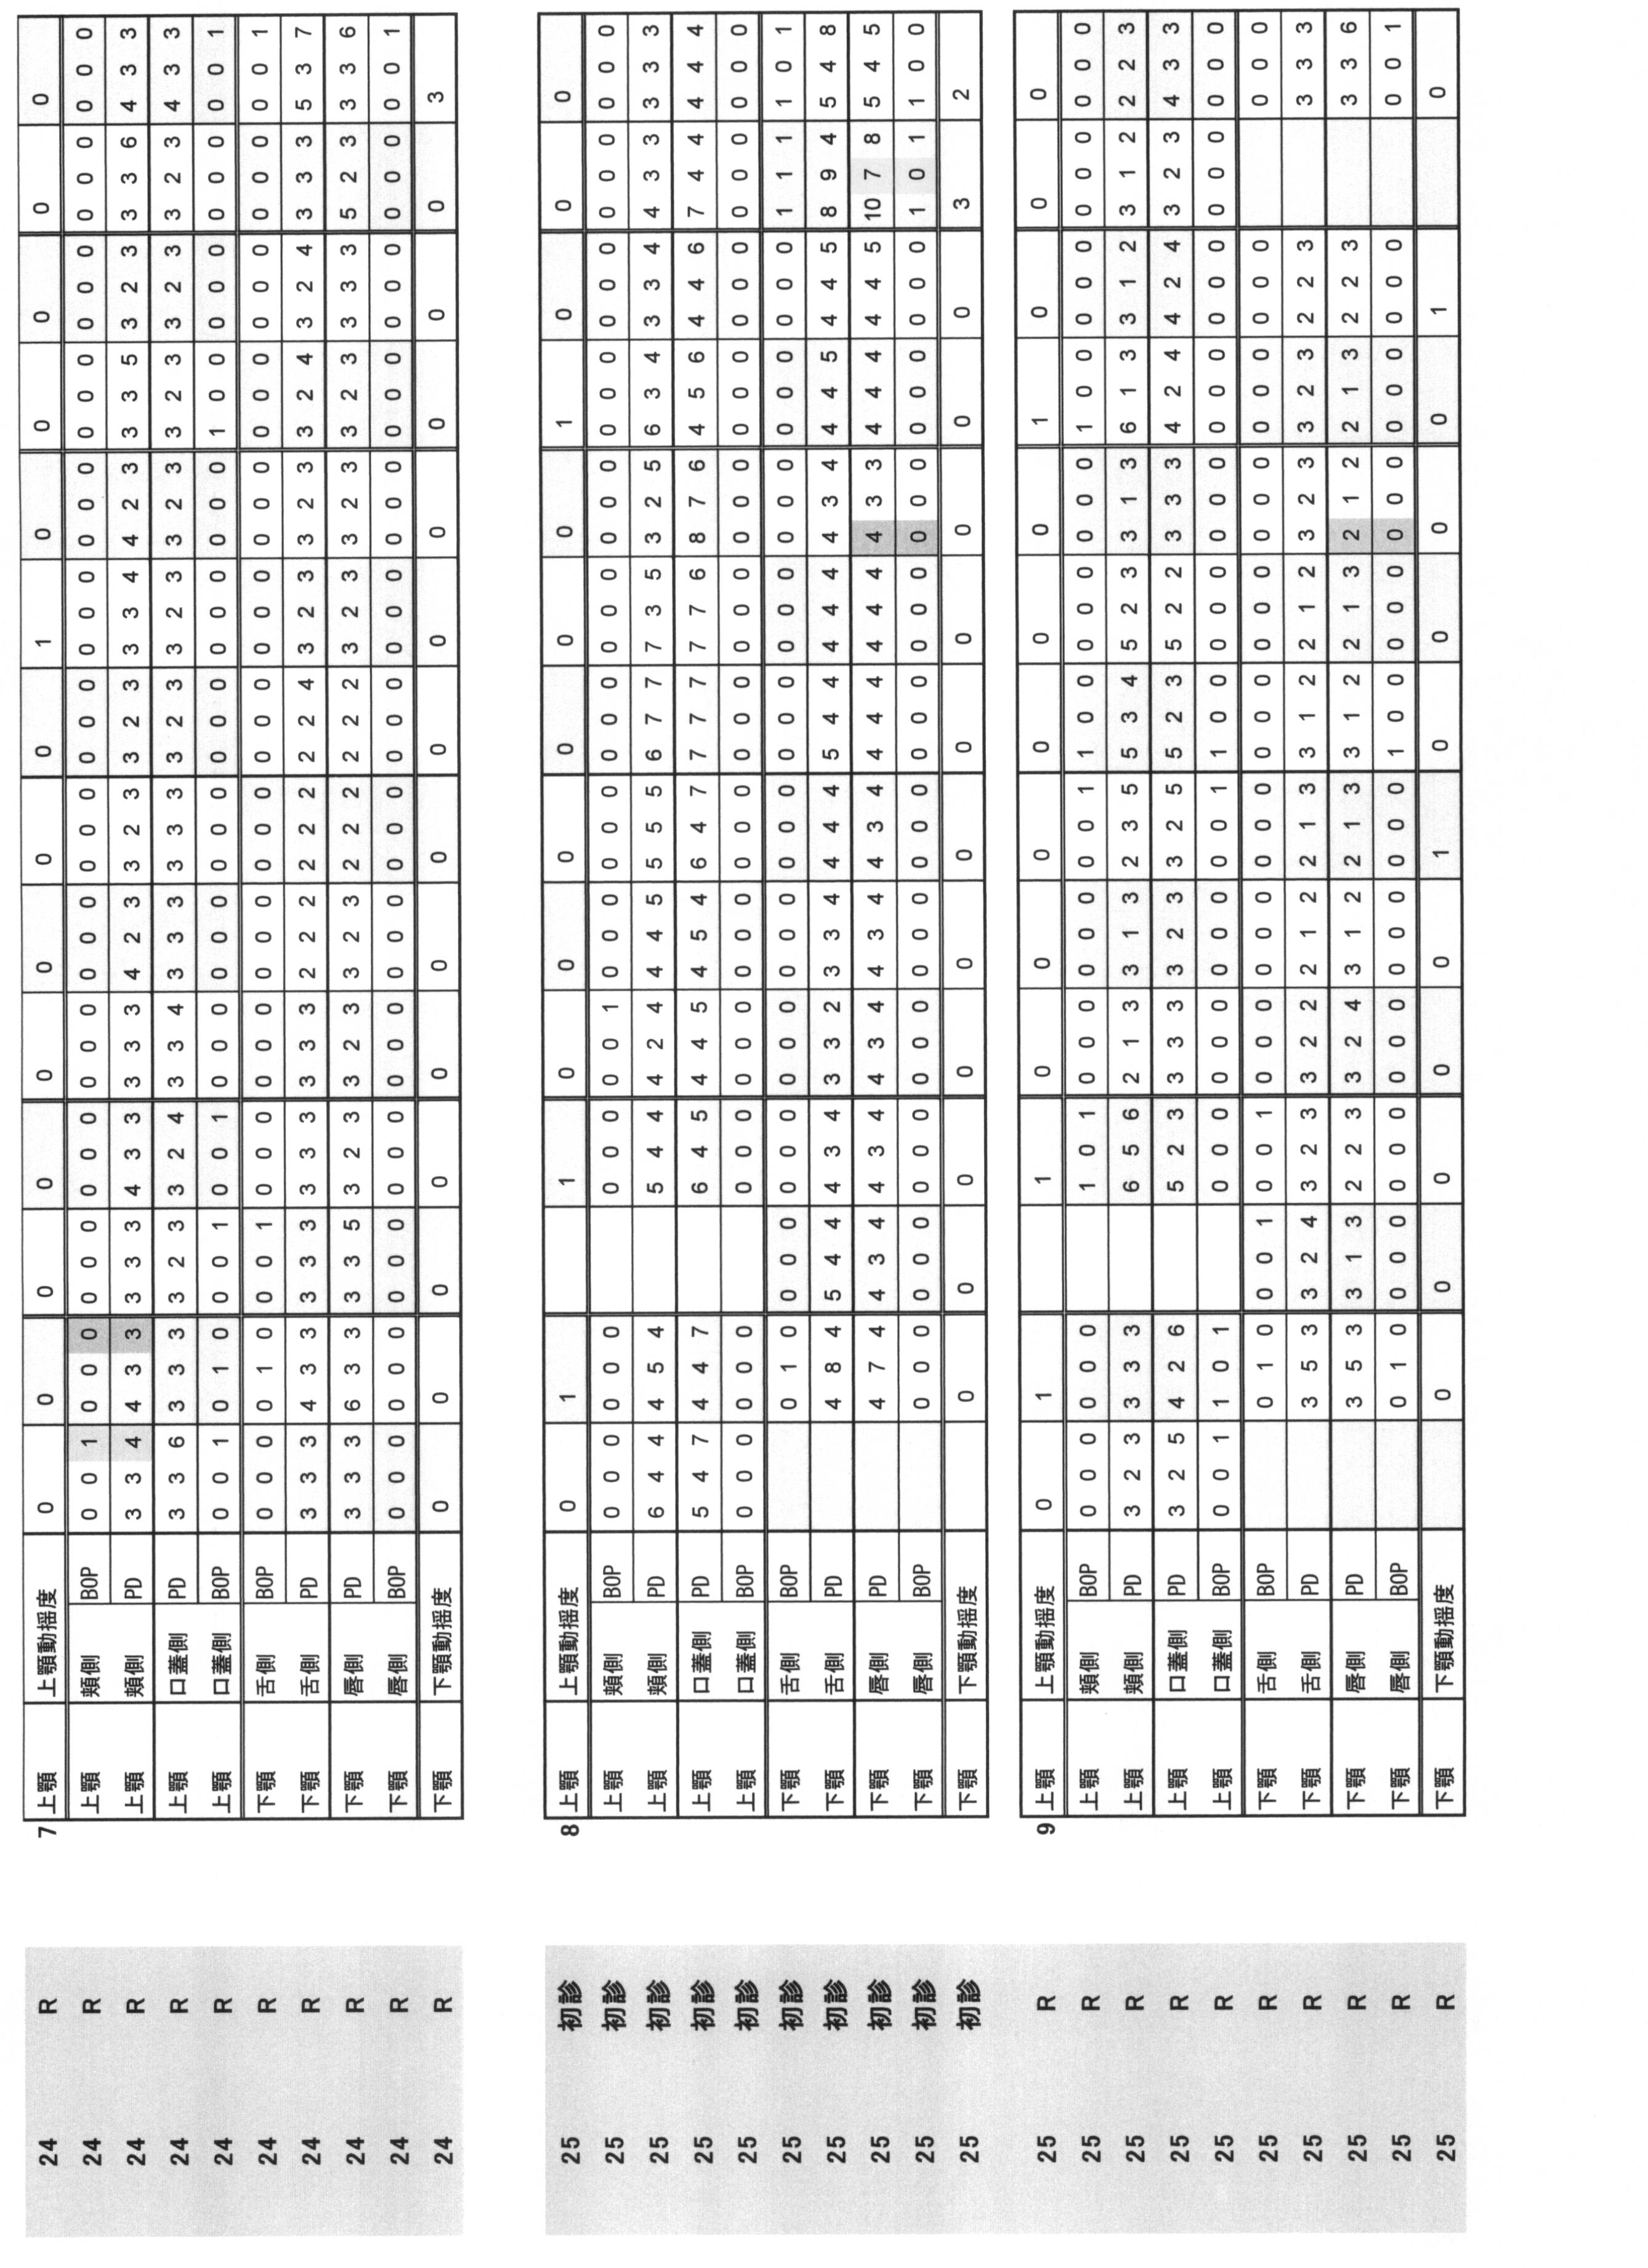
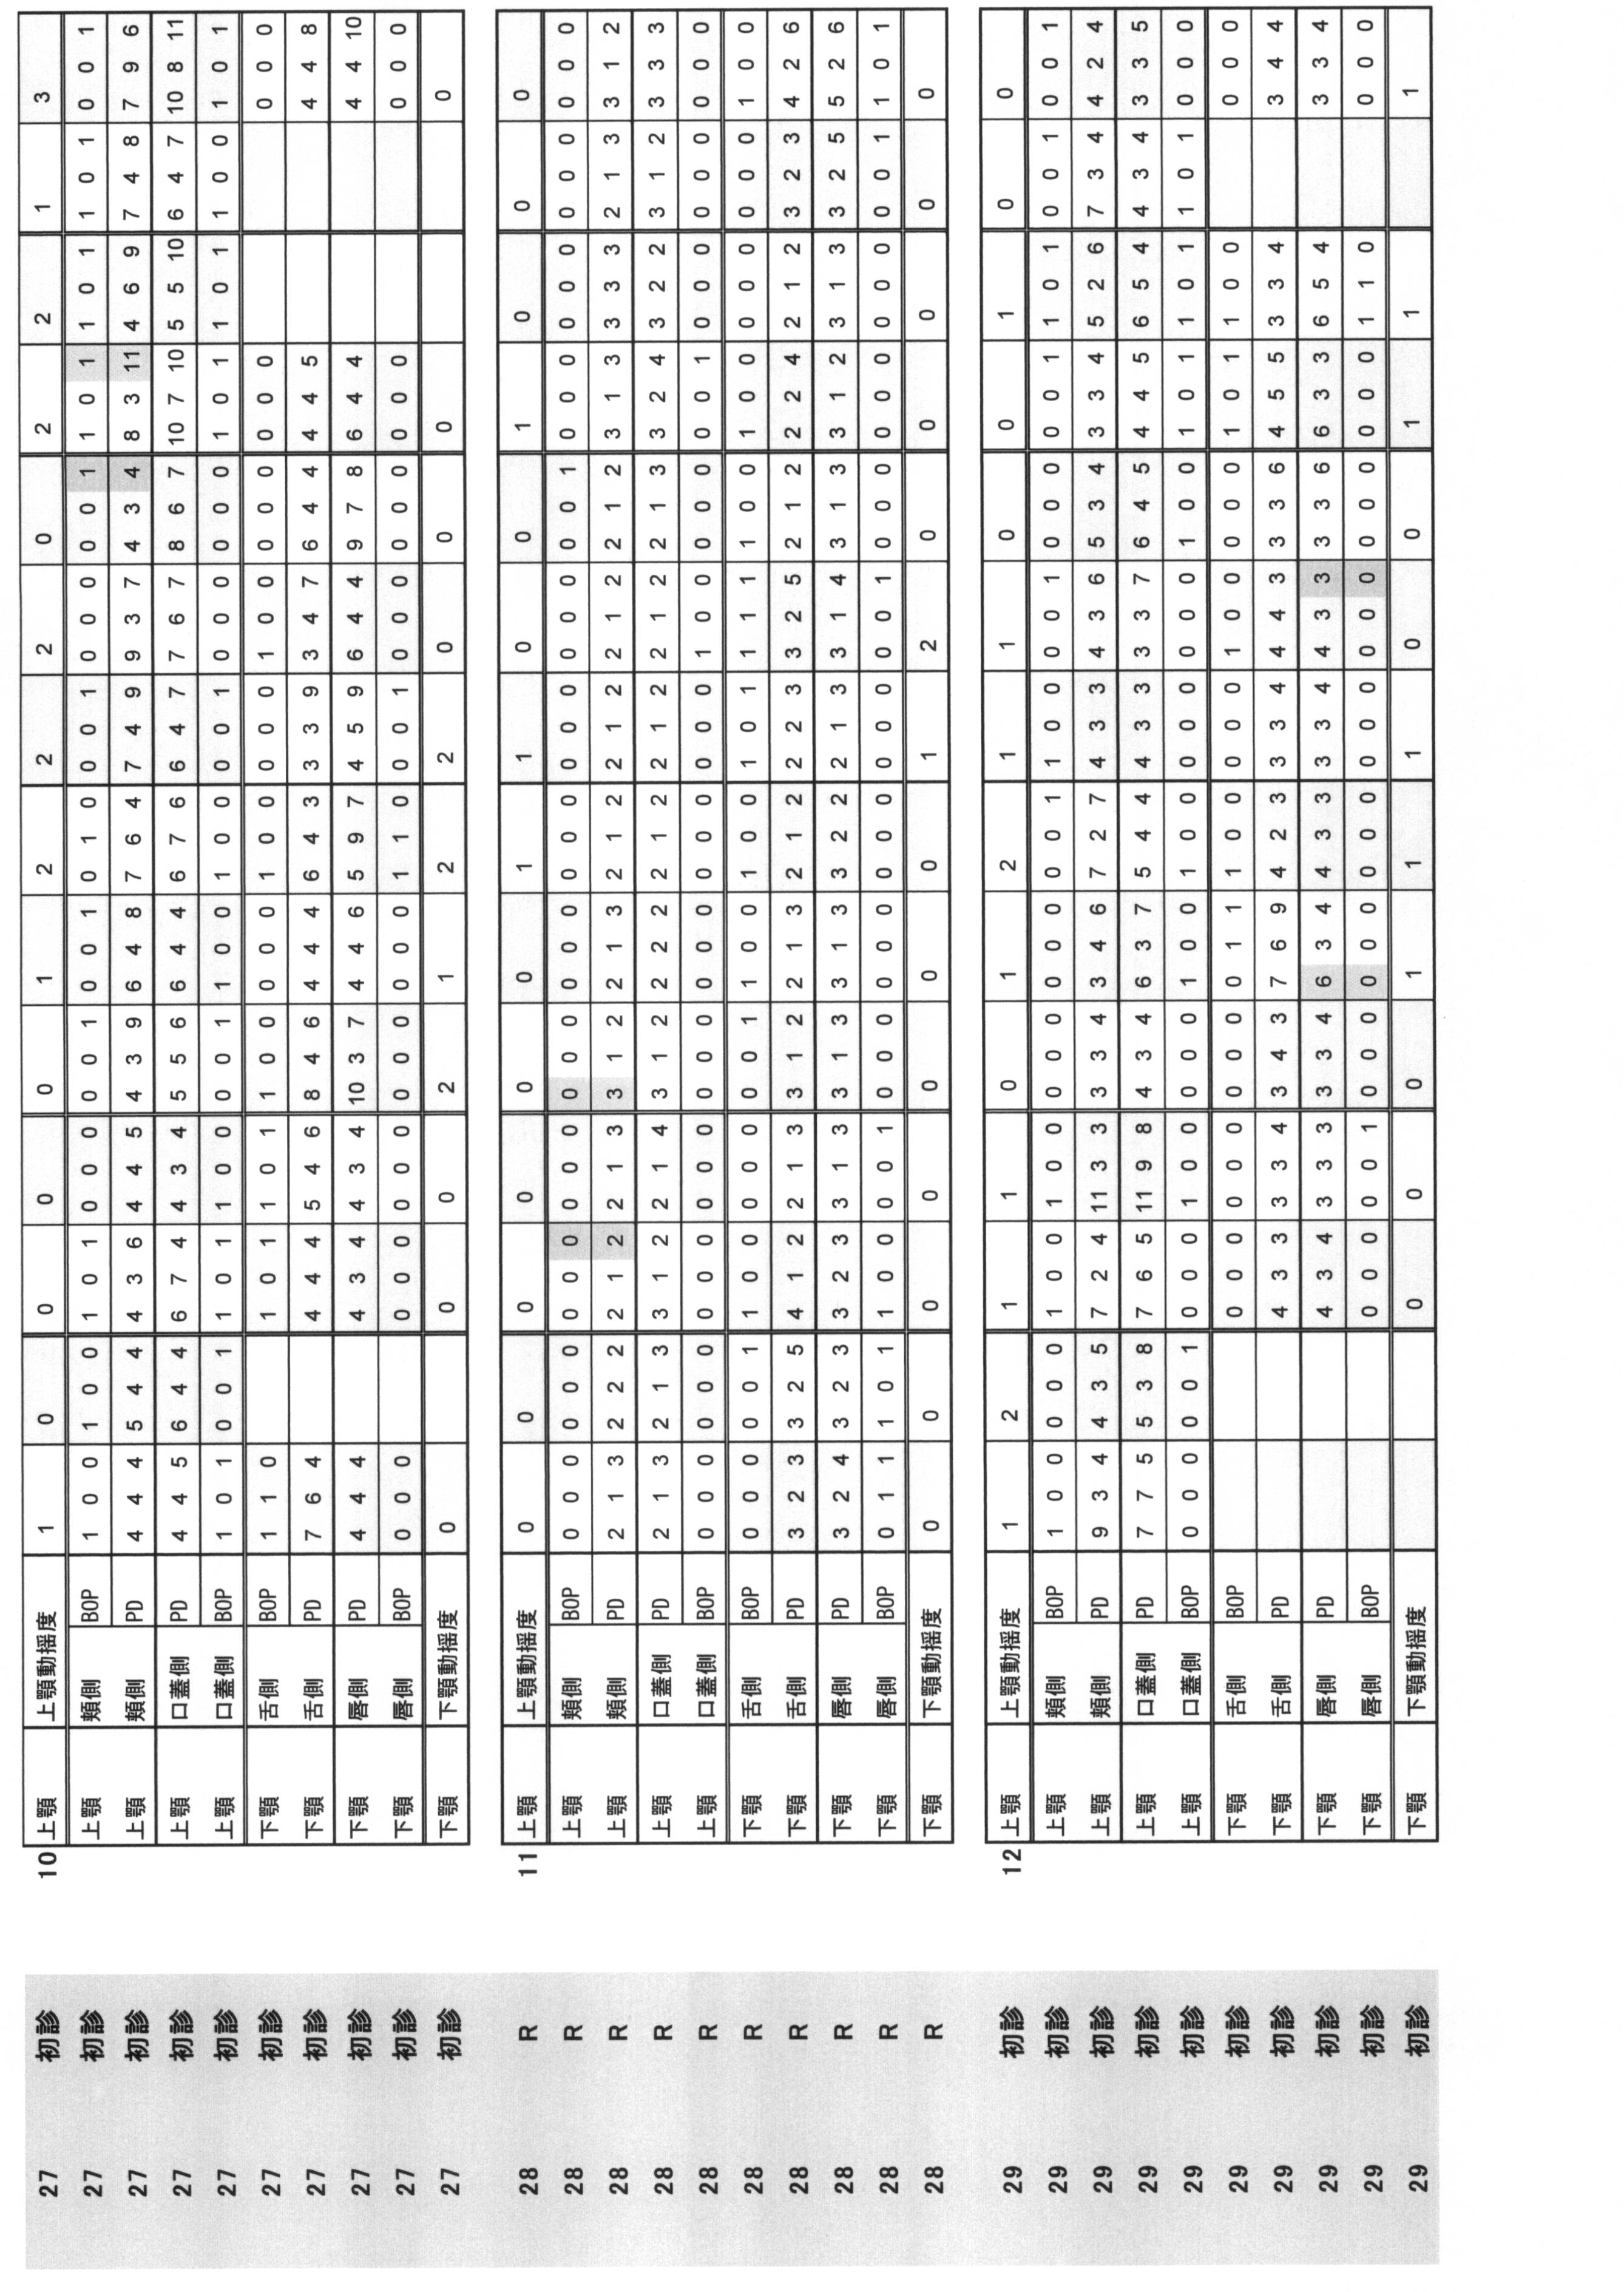

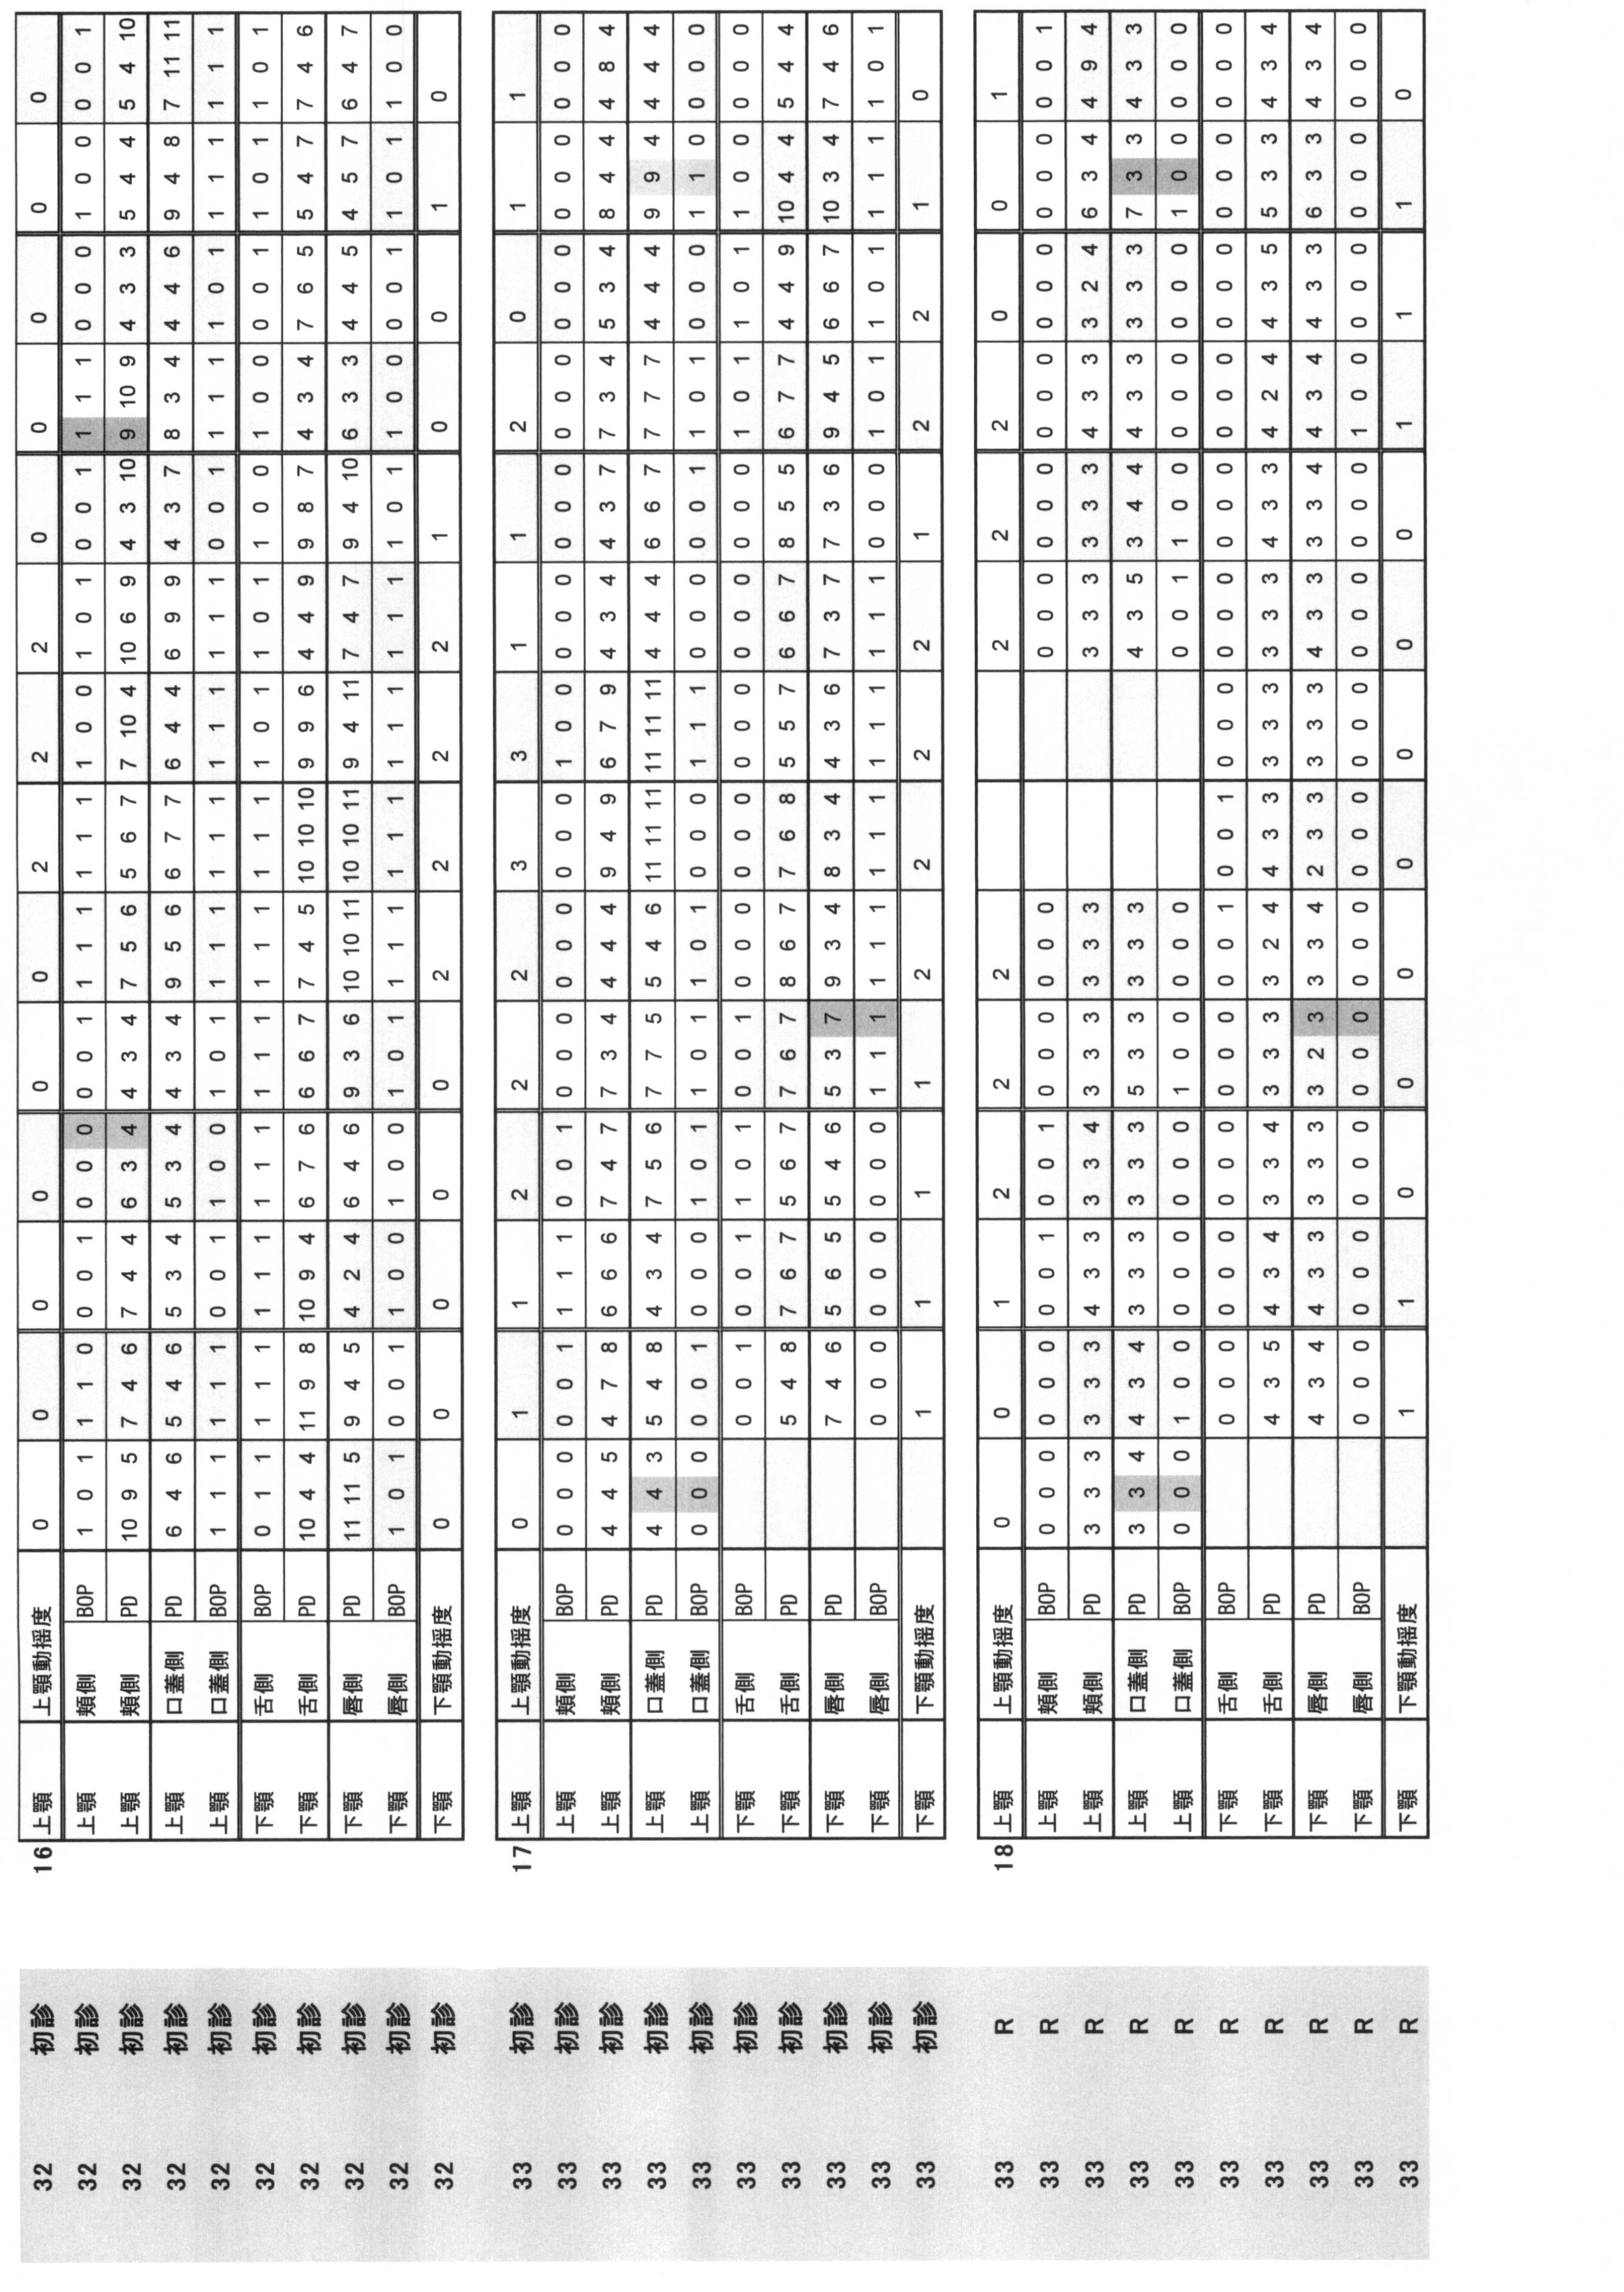
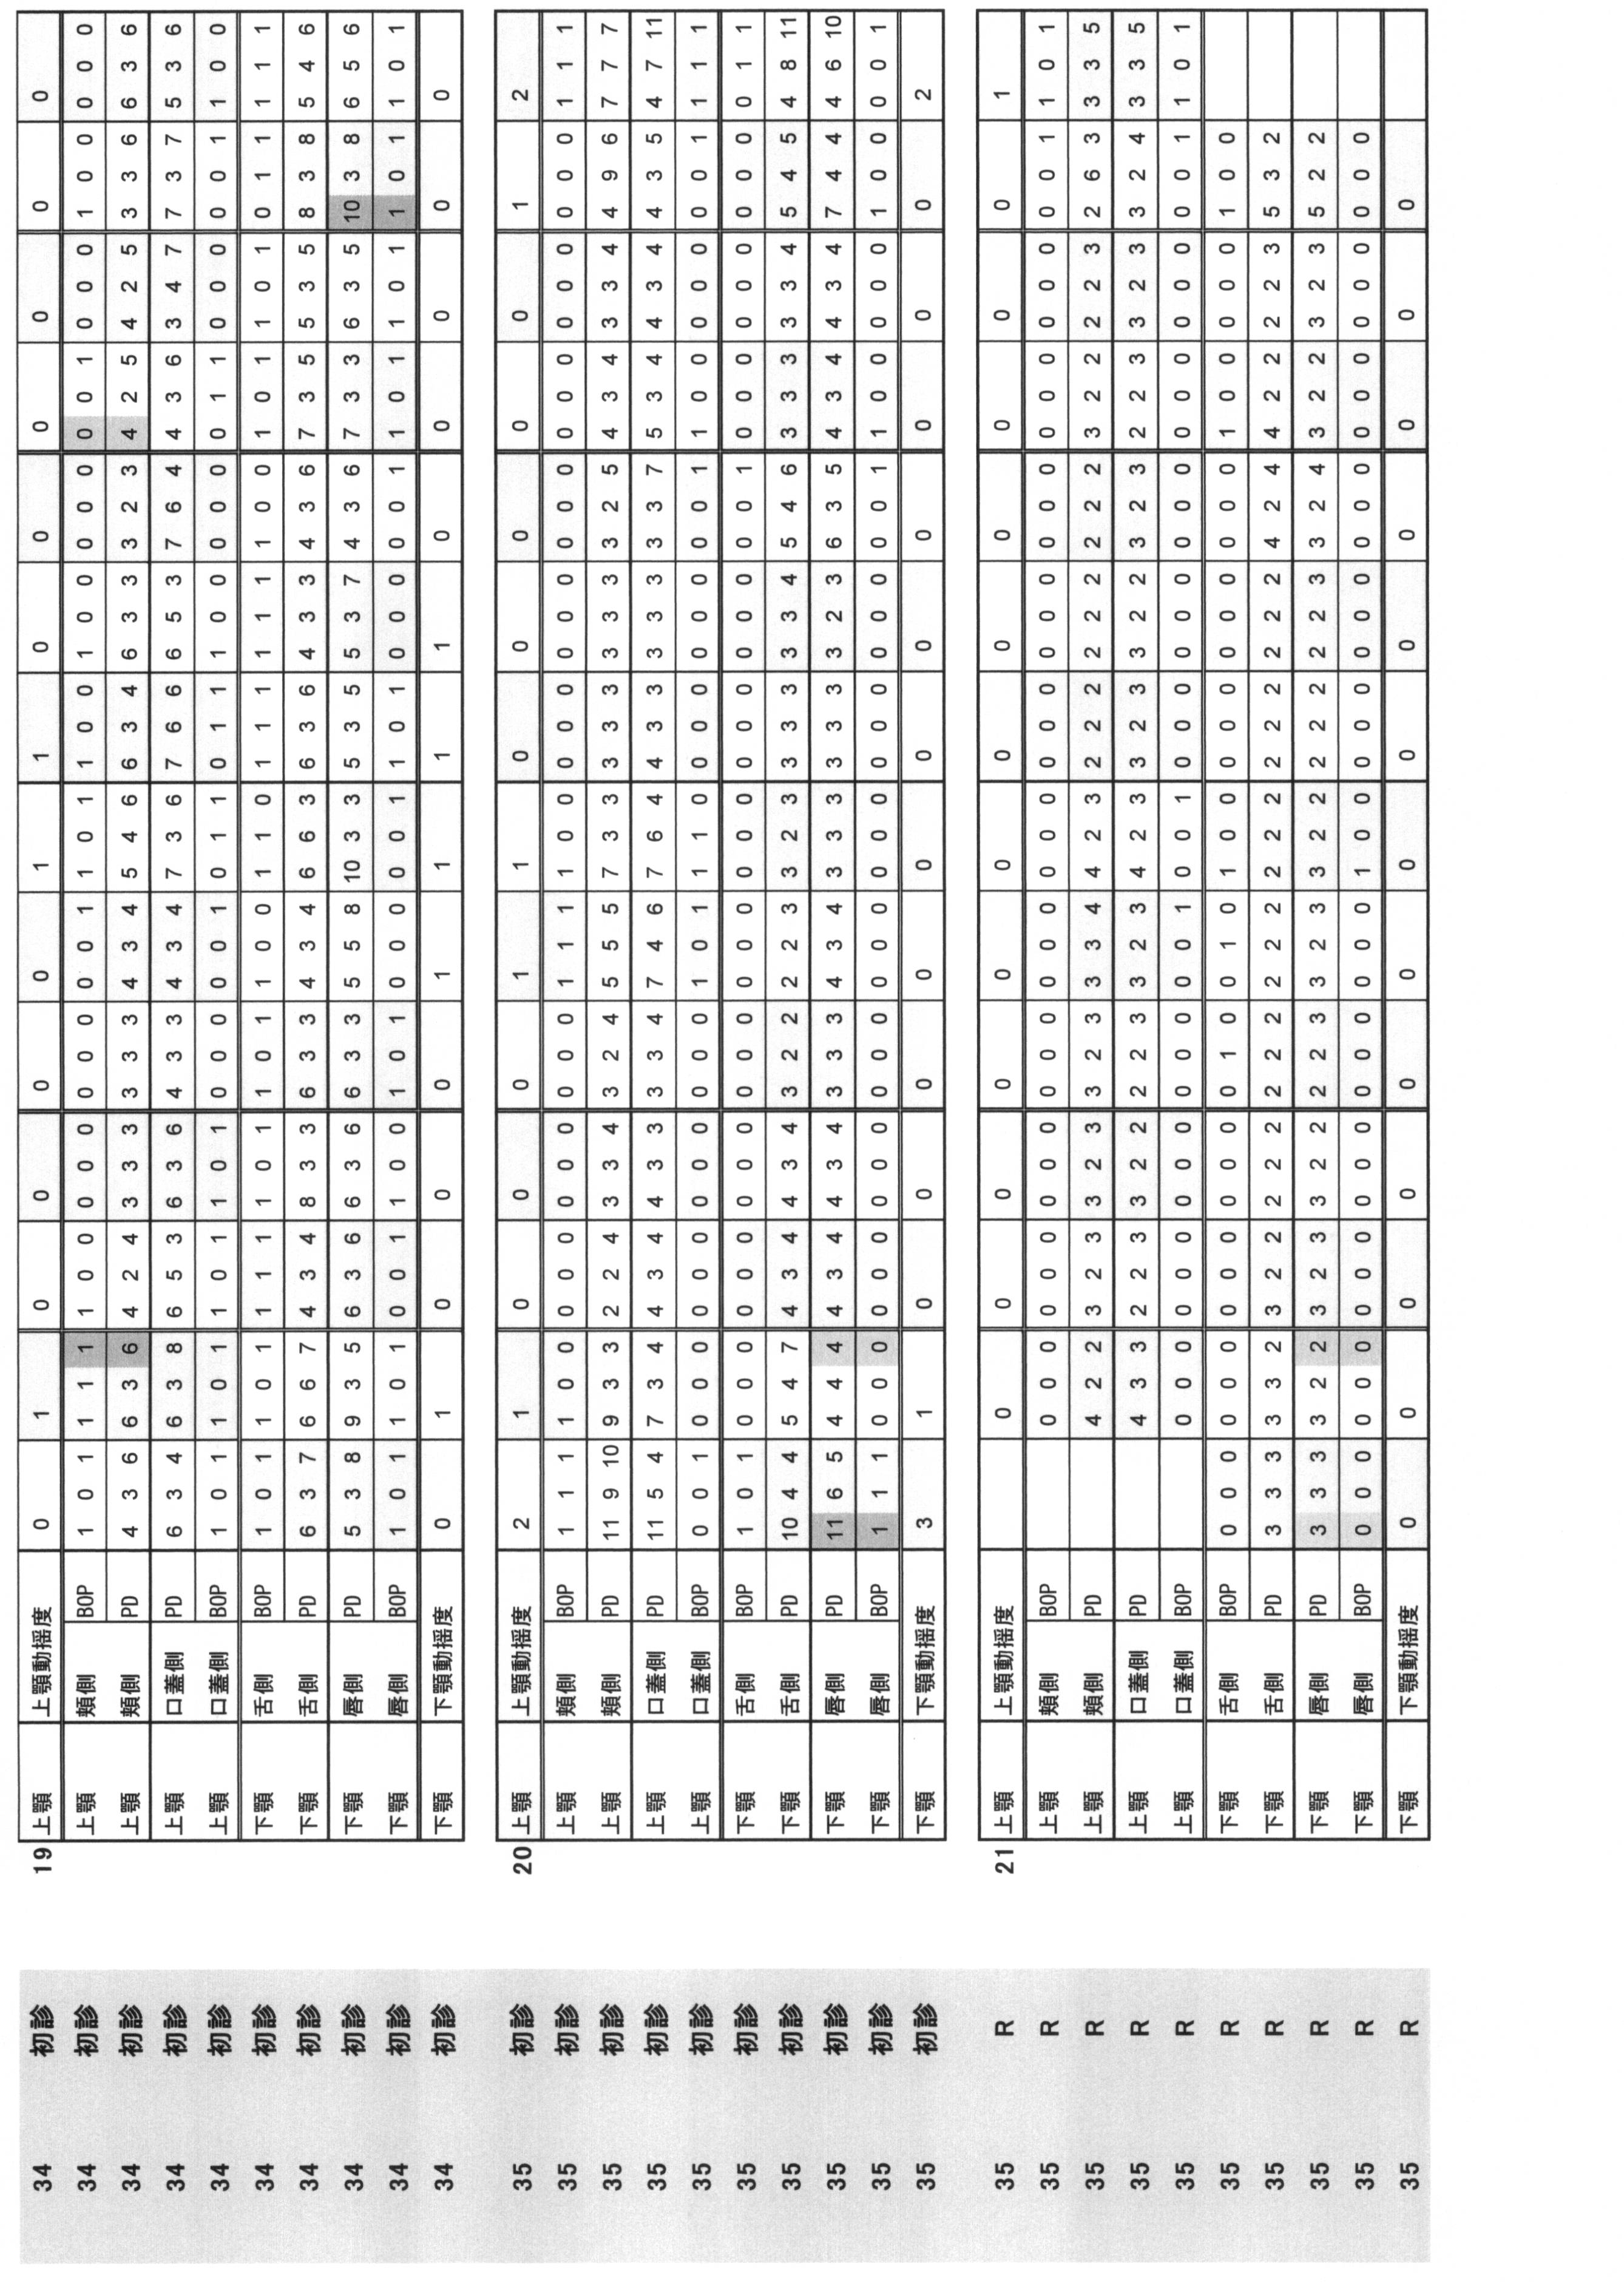


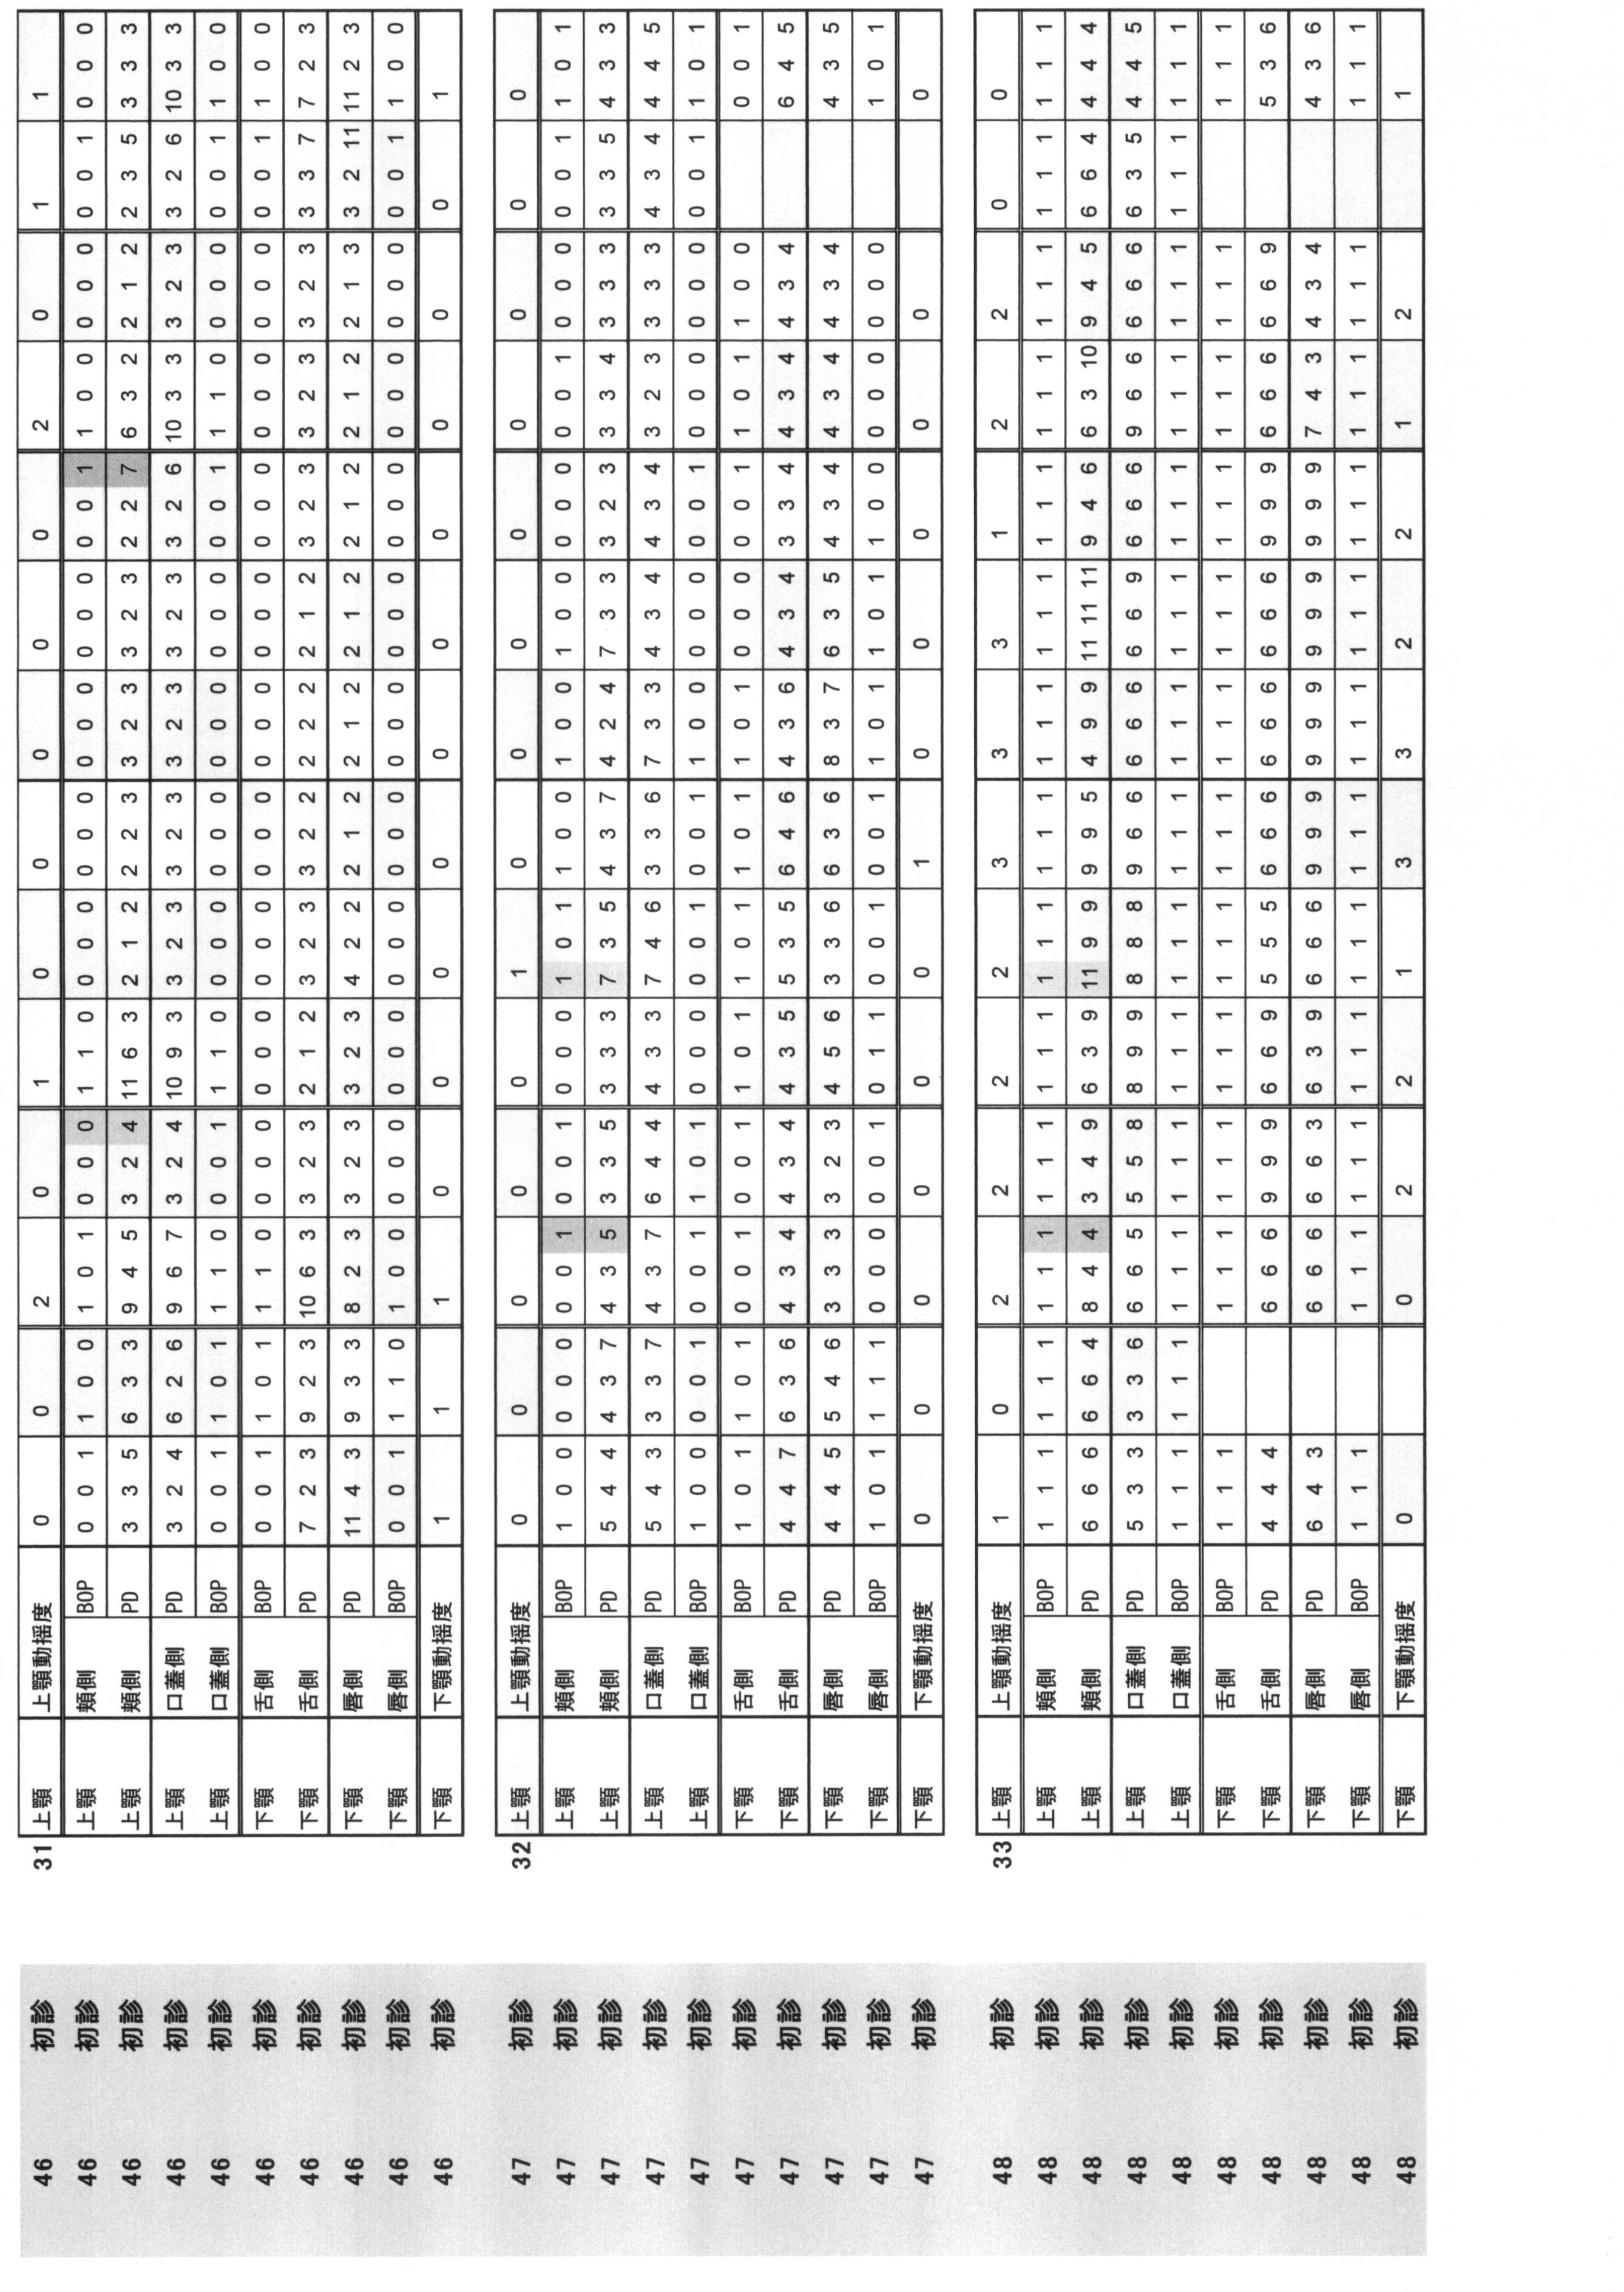


続いて、記録した6点法による歯周病検査結果から、公知文献(Nesse, W., Abbas, F., van der Ploeg, I., Spijkervet, F.K.,Dijkstra ,P.U., Vissink, A.: Periodontal inflamed surface area: quantifying inflammatory burden. Journal of Clinical Periodontology, 35: 668-673, 2008.)を参照し、表2に示すようにPISA(Periodontal inflamed surface area)を算出した。PISAは口腔全体の歯周組織の炎症部位面積を平方ミリメートル(mm2)で示したものである。
表3に、46名のPISA値をまとめて示した。
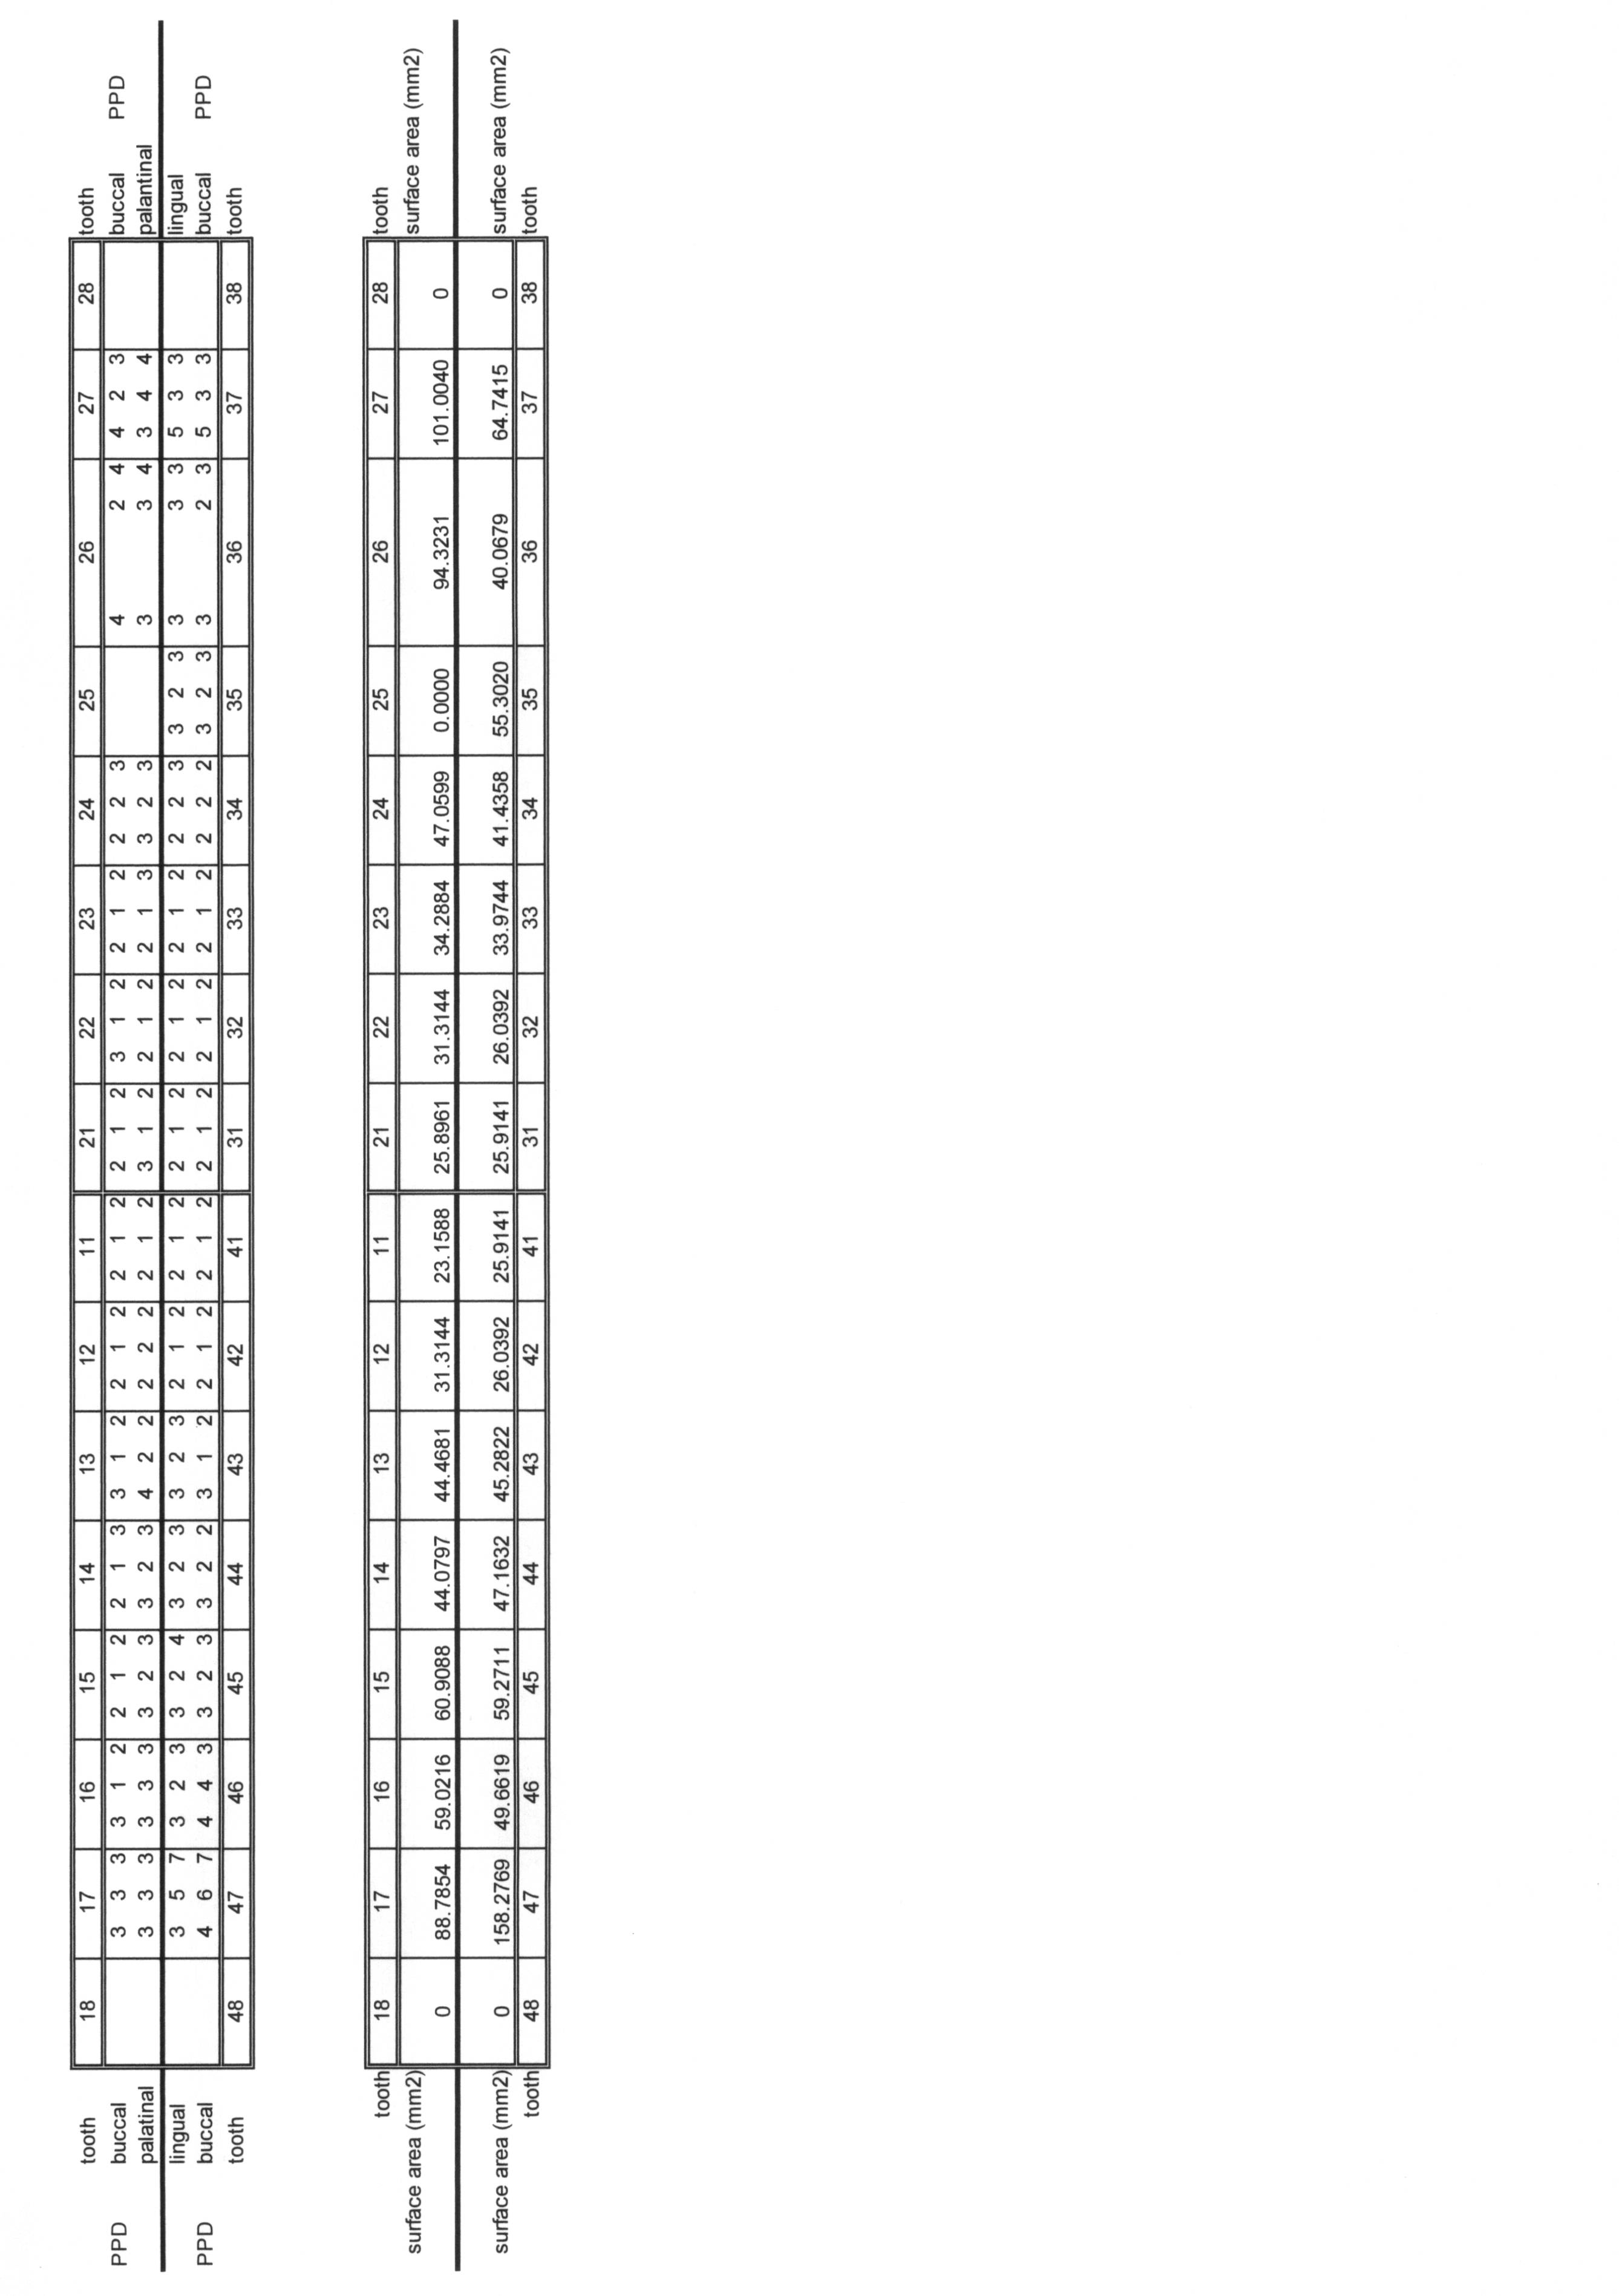


<唾液からのDNAの抽出>
1-1 ビーズ破砕
2mlのチューブに前述の唾液のうち400μl、滅菌水400μlと0.1mmガラスビーズ0.4g(トミー精工社製#GB-01)を入れフタをしっかり締めた後、マイクロスマッシュ(トミー精工社製)にセットし、3200rpmで5分間ビーズ破砕した。その後、ビーズ等を落とすためにチューブを遠心機にセットし、1800gで5分間軽く遠心した。上清400μlを新しい1.5mlチューブに分注した。
1-1のサンプルに対してキアゲン社のBuffer ATL90μl、ProteinaseK 10μl、Buffer AL100μlを混合し、合計600μlとし、56℃で1時間インキュベートした。
インキュベート後、エタノール120μlを加えてボルテックスした。続いてQIAamp DNA Micro Kit(キアゲン社)を使用し、キットのカラムに720μl全量を入れて14000rpmで1分間遠心した後、溶出液を廃棄した。その後、キットのプロトコールに従い、Buffer AW1 500μl、Buffer AW2 500μlでカラムを洗浄した。続いて、空の状態で14000rpmで1分間遠心した後、滅菌水20μlでDNAを溶出した。46サンプルでそれぞれ約4~20ng/μlのDNA溶液を取得した。
前記のDNA溶液を希釈して20pg/μlとし、これをPCRテンプレートとした。サンプル中の口腔内細菌の16SrRNAの検出対象領域の配列を増幅するために、以下の反応液組成及び反応条件でPCRを実施した。PCR用キットは、Premix Ex Taq(TM) Hot Start Version(Takara社製)を用い、ProFlex(TM)PCR System(Thermo Fisher Scientific社製)により行った。プライマーは下記の配列を有するプライマーを用いた。なお、フォワードプライマーは5’末端がCy5で標識化されているものを用いた。
5’-Cy5-TCCTACGGGAGGCAGCAGT-3’ (配列番号32)
リバースプライマー(細菌増幅用):
5’-CAGGGTATCTAATCCTGTTTGCTACC-3’ (配列番号33)
5’-Cy5-GAGAAGCCTACACAAACGTAACGTC-3’ (配列番号34)
リバースプライマー(絶対量指標増幅用):
5’-CTCTAAAGACCGCTCTATCTCGG-3’(配列番号35)
2×Premix Ex Taq(登録商標) Hot Start Version 10μL
4μMフォワードプライマー(細菌増幅用) 1μL
4μMリバースプライマー(細菌増幅用) 1μL
4μMフォワードプライマー(絶対量指標増幅用) 1μL
4μMリバースプライマー(絶対量指標増幅用) 1μL
テンプレートDNA 5μL
絶対量指標 1μL
合計 20μL
95℃で1分間加熱後、「解離:98℃(10sec)→アニーリング:55℃(30sec)→合成:72℃(20sec)」を1サイクルとして計40サイクル行い、4℃で冷却し、増幅産物を得た。
貫通孔型のDNAチップを、特開2007-74950号公報(メチル化DNA及び/又は非メチル化DNAの検出方法)の実施例1に記載の方法と同様の方法で製造を行った。
ただし、搭載させたオリゴヌクレオチドプローブは、表4に示す配列情報をもつプローブを用いた。

以下のように各溶液を混合し、ハイブリダイゼーション溶液を調製した。
1M Tris-HCl 48μL
1M NaCl 48μL
0.5% Tween20 20μL
水 65μL
合計 200μL
200μLのハイブリダイゼーション溶液を前記DNAチップに接触させ、50℃で16時間ハイブリダイゼーションした。
ハイブリダイゼーション後、下記の条件でDNAチップを洗浄した。0.24M Tris・HCl/0.24M NaCl/0.05% Tween-20溶液1000μLで220秒の洗浄を12回繰り返し、続いて、0.24M Tris・HCl/0.24M NaCl1000μLで220秒の洗浄を4回繰り返した。
洗浄終了後に、各チップを室温の0.24M Tris・HCl/0.24M NaCl混合溶液に移した。
前記洗浄後、ジェノパールリーダー(型式:GR-S1、三菱ケミカル社製)を用い、下記条件でDNAチップの各スポットの蛍光強度を測定した。
中心励起波長 :633nm
露光時間 :0.1、1、4、40秒
検出対象細菌用プローブを搭載したスポットの蛍光強度を、バックグラウンド値(プローブを搭載していないスポットの蛍光強度の中央値)で除算し、ハイブリダイゼーションに由来する蛍光強度(以後、シグナル強度と呼ぶ)のSN比を算出した。
<PISA値と細菌量の相関解析>
まず、サンプルごとに、PISA値および各細菌量を示すSN比のデータを対応させた。その結果を、表5に示した。

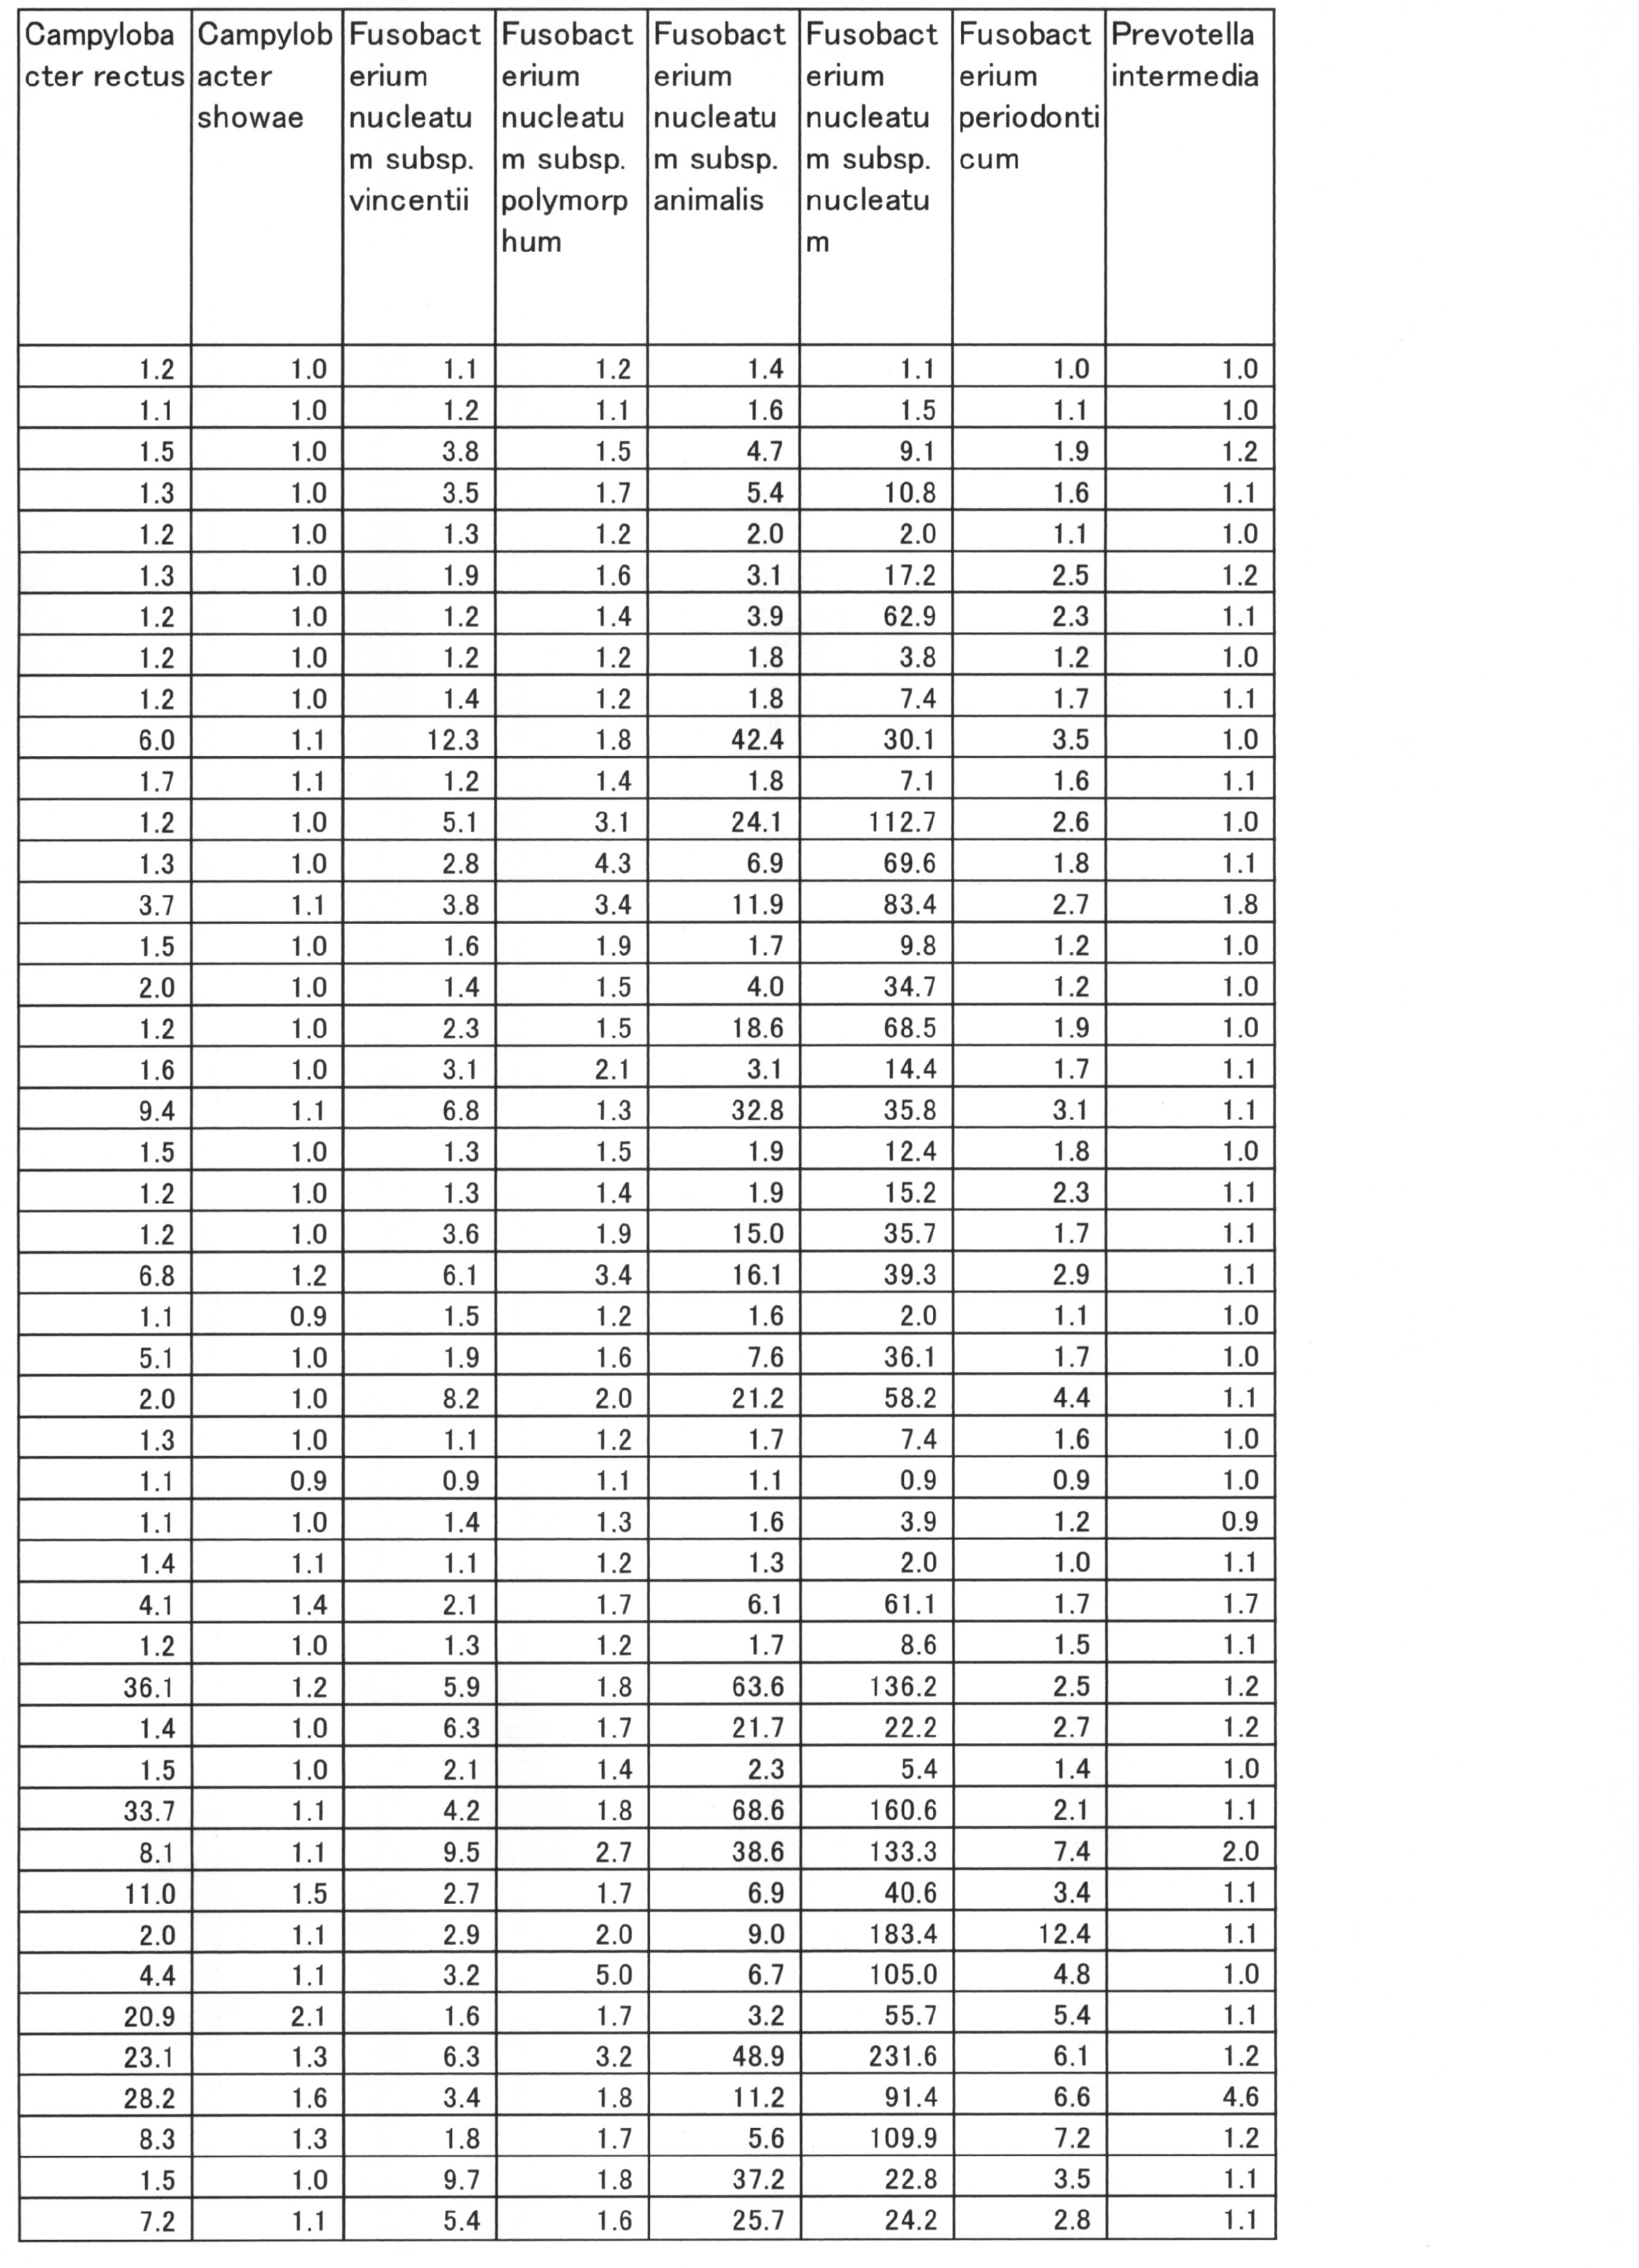


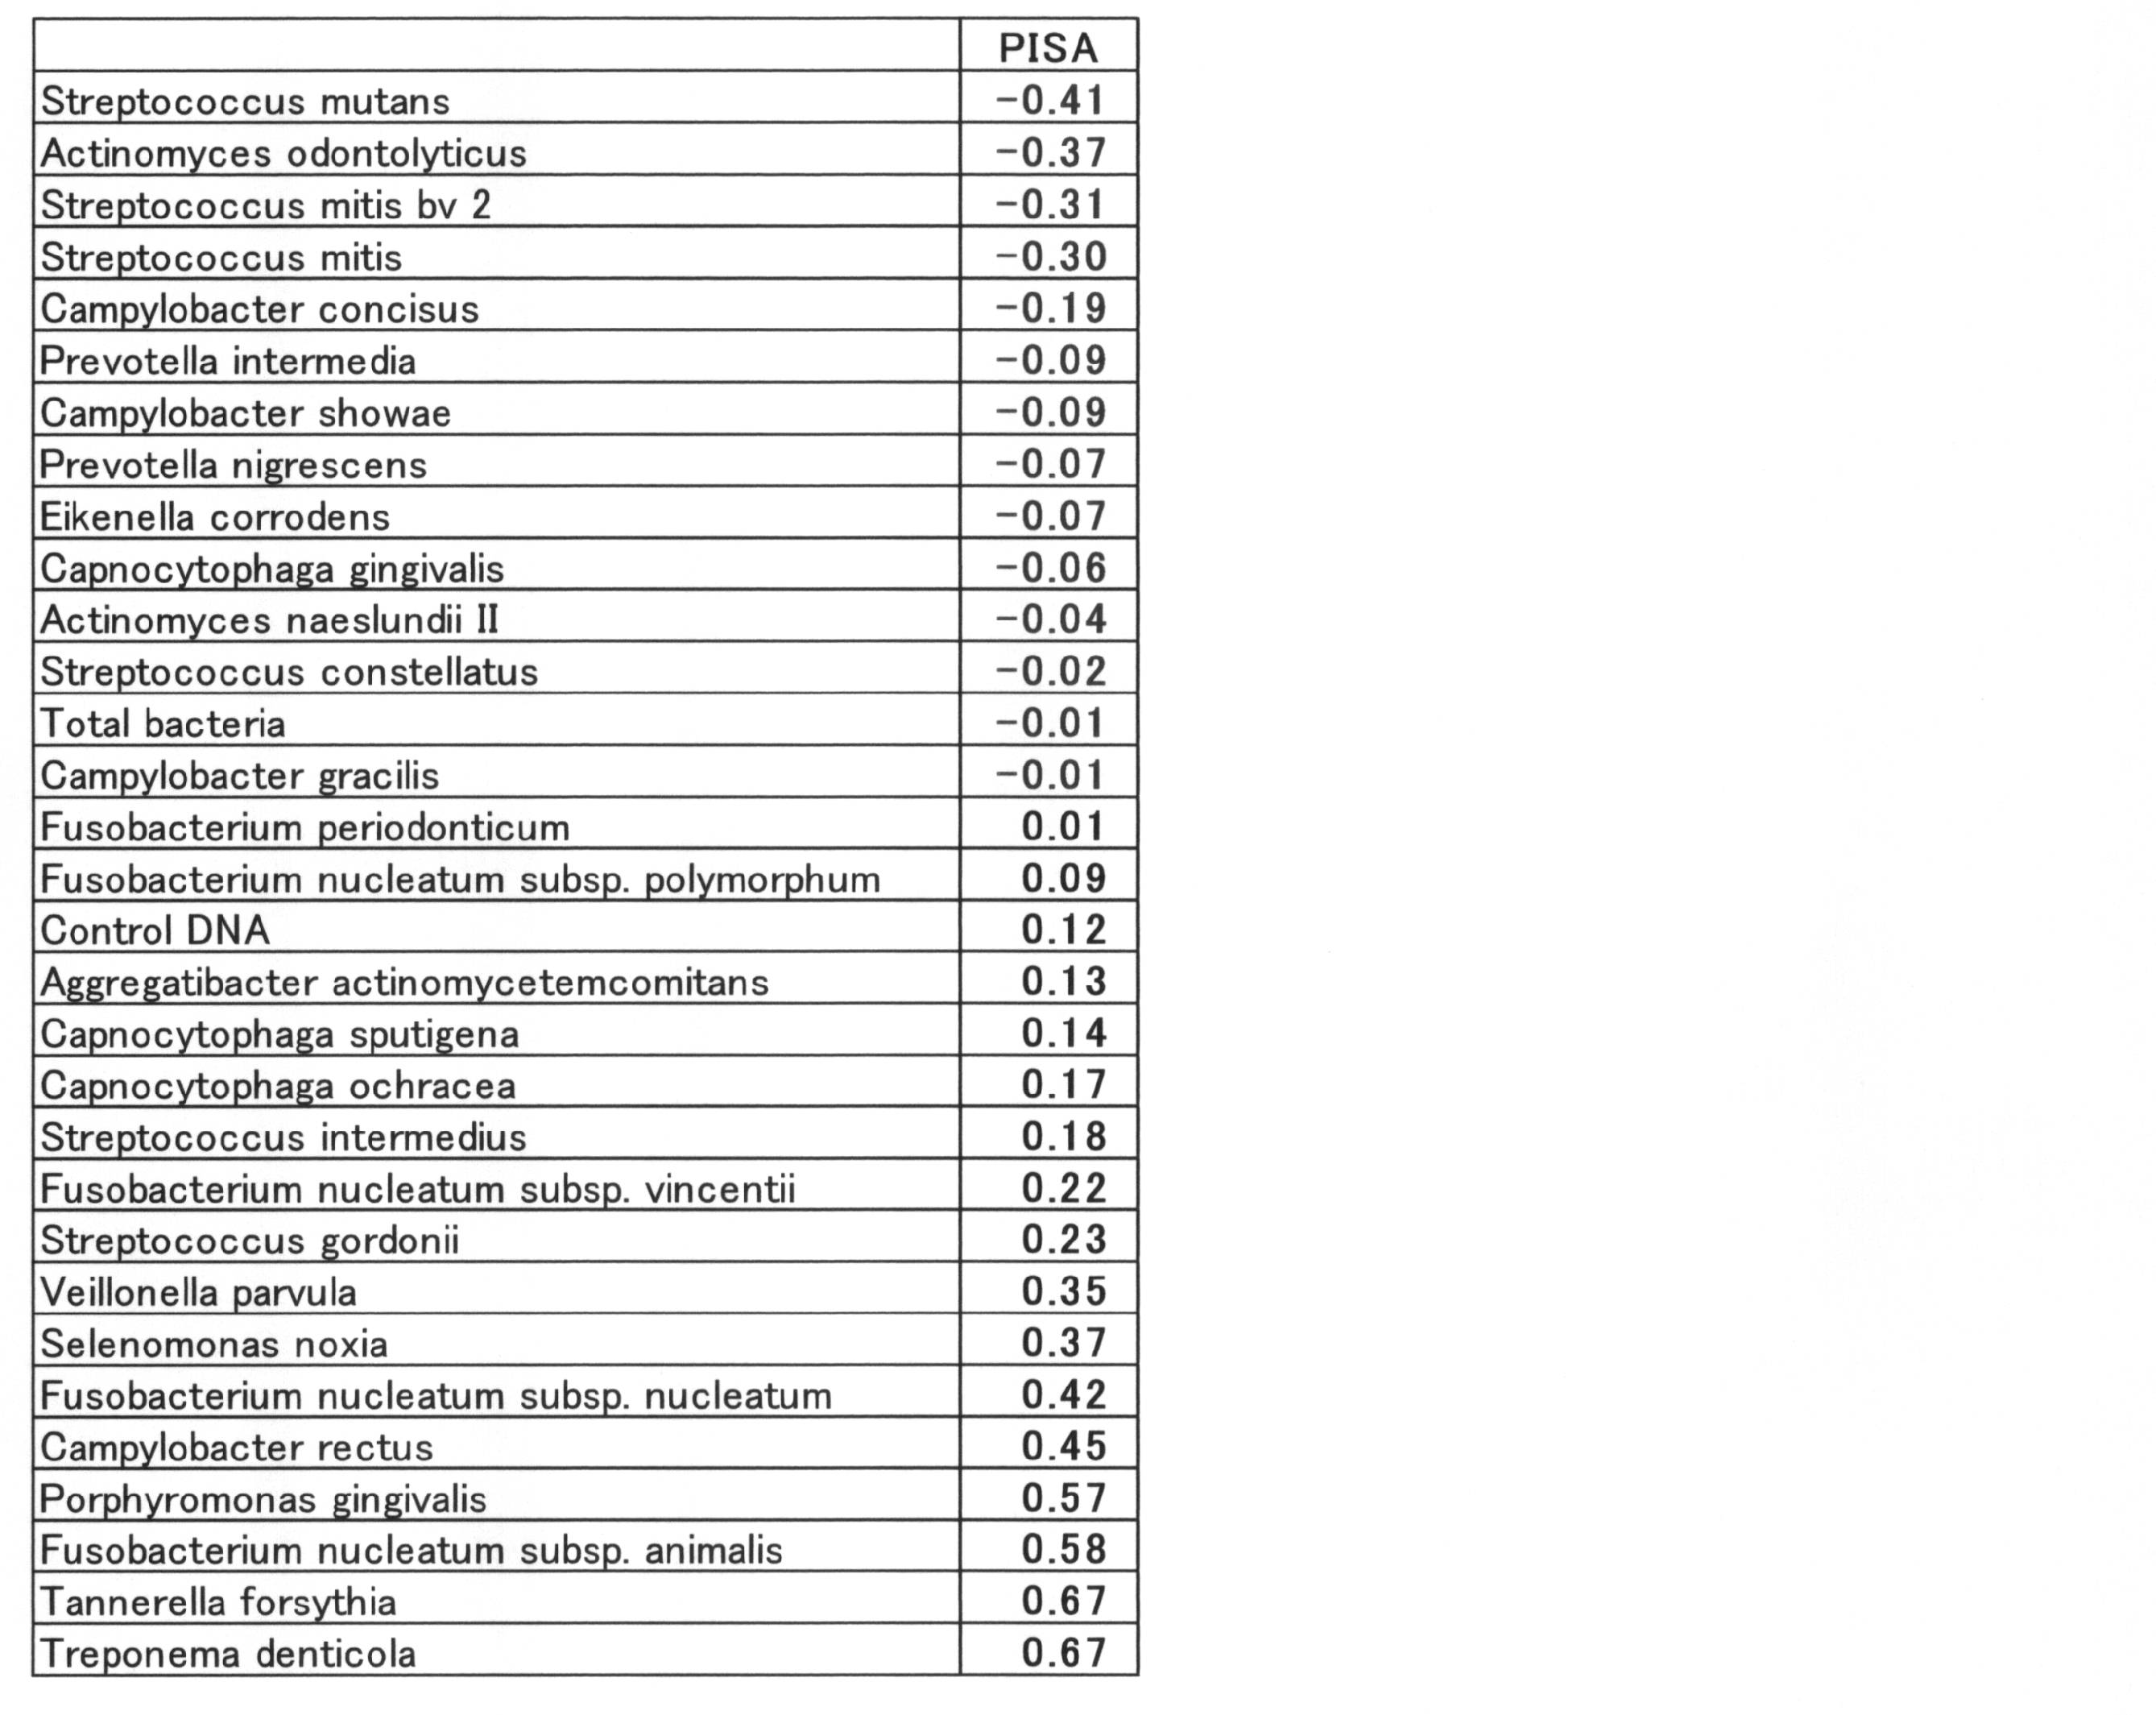
m <- train(PISA~.,data=bacteria ,method="M5")
PISAを目的変数とし、説明変数を表5の細菌全種類としてモデル木を生成させるコマンドである。46サンプルデータすべてを使用した。
(using smoothed linear models)
Actinomyces.odontolyticus <= 20.1 :
| Campylobacter.concisus <= 2.2 :
| | Capnocytophaga.sputigena <= 2.15 :
| | | Tannerella.forsythia <= 6.9 :
| | | | Streptococcus.mutans <= 5.3 : LM1 (2/12.282%)
| | | | Streptococcus.mutans > 5.3 : LM2 (2/32.179%)
| | | Tannerella.forsythia > 6.9 :
| | | | Streptococcus.mutans <= 2.95 : LM3 (3/16.447%)
| | | | Streptococcus.mutans > 2.95 : LM4 (3/2.075%)
| | Capnocytophaga.sputigena > 2.15 :
| | | Streptococcus.gordonii <= 35.45 : LM5 (2/1.965%)
| | | Streptococcus.gordonii > 35.45 : LM6 (3/26.323%)
| Campylobacter.concisus > 2.2 :
| | Treponema.denticola <= 15.35 :
| | | Fusobacterium.nucleatum.subsp..nucleatum <= 38.35 : LM7 (3/2.882%)
| | | Fusobacterium.nucleatum.subsp..nucleatum > 38.35 :
| | | | Actinomyces.odontolyticus <= 10.9 : LM8 (3/4.64%)
| | | | Actinomyces.odontolyticus > 10.9 : LM9 (2/2.948%)
| | Treponema.denticola > 15.35 : LM10 (3/39.648%)
Actinomyces.odontolyticus > 20.1 :
| Tannerella.forsythia <= 2.85 :
| | Streptococcus.gordonii <= 19.6 :
| | | Actinomyces.naeslundii.II <= 4.05 : LM11 (5/2.414%)
| | | Actinomyces.naeslundii.II > 4.05 : LM12 (3/3.304%)
| | Streptococcus.gordonii > 19.6 :
| | | Control.DNA <= 837.15 : LM13 (3/4.132%)
| | | Control.DNA > 837.15 : LM14 (2/0.098%)
| Tannerella.forsythia > 2.85 :
| | Streptococcus.constellatus <= 1.75 : LM15 (3/14.832%)
| | Streptococcus.constellatus > 1.75 :
| | | Porphyromonas.gingivalis <= 1.35 : LM16 (2/9.58%)
| | | Porphyromonas.gingivalis > 1.35 : LM17 (2/2.751%)
LM num: 1
.outcome =
5.9609 * Treponema.denticola
+ 2.719 * Streptococcus.gordonii
- 2.4637 * Actinomyces.odontolyticus
- 43.3698 * Streptococcus.mutans
+ 161.5714 * Capnocytophaga.sputigena
- 0.4833 * Control.DNA
+ 3.734 * Tannerella.forsythia
+ 1510.5973
LM num: 2
.outcome =
5.9609 * Treponema.denticola
+ 2.719 * Streptococcus.gordonii
- 2.4637 * Actinomyces.odontolyticus
- 43.3698 * Streptococcus.mutans
+ 161.5714 * Capnocytophaga.sputigena
- 0.4833 * Control.DNA
+ 3.734 * Tannerella.forsythia
+ 1507.5864
LM num: 3
.outcome =
5.9609 * Treponema.denticola
+ 2.719 * Streptococcus.gordonii
- 2.4637 * Actinomyces.odontolyticus
- 26.3717 * Streptococcus.mutans
+ 161.5714 * Capnocytophaga.sputigena
- 0.4833 * Control.DNA
+ 3.9077 * Tannerella.forsythia
+ 1392.5945
LM num: 4
.outcome =
5.9609 * Treponema.denticola
+ 2.719 * Streptococcus.gordonii
- 2.4637 * Actinomyces.odontolyticus
- 26.3717 * Streptococcus.mutans
+ 161.5714 * Capnocytophaga.sputigena
- 0.4833 * Control.DNA
+ 3.9077 * Tannerella.forsythia
+ 1394.1708
LM num: 5
.outcome =
5.9609 * Treponema.denticola
+ 1.2546 * Streptococcus.gordonii
- 2.4637 * Actinomyces.odontolyticus
- 26.3717 * Streptococcus.mutans
+ 201.9643 * Capnocytophaga.sputigena
- 0.4833 * Control.DNA
+ 5.5586 * Tannerella.forsythia
+ 1565.177
LM num: 6
.outcome =
5.9609 * Treponema.denticola
+ 1.336 * Streptococcus.gordonii
- 2.4637 * Actinomyces.odontolyticus
- 26.3717 * Streptococcus.mutans
+ 201.9643 * Capnocytophaga.sputigena
- 0.4833 * Control.DNA
+ 5.5586 * Tannerella.forsythia
+ 1555.611
LM num: 7
.outcome =
13.3672 * Treponema.denticola
+ 2.719 * Streptococcus.gordonii
- 2.4637 * Actinomyces.odontolyticus
- 30.4289 * Streptococcus.mutans
- 0.4833 * Control.DNA
+ 5.5586 * Tannerella.forsythia
- 0.3524 * Fusobacterium.nucleatum.subsp..nucleatum
+ 1314.4003
LM num: 8
.outcome =
13.3672 * Treponema.denticola
+ 2.719 * Streptococcus.gordonii
- 1.3817 * Actinomyces.odontolyticus
- 30.4289 * Streptococcus.mutans
- 0.4833 * Control.DNA
+ 5.5586 * Tannerella.forsythia
- 0.3171 * Fusobacterium.nucleatum.subsp..nucleatum
+ 1293.9573
LM num: 9
.outcome =
13.3672 * Treponema.denticola
+ 2.719 * Streptococcus.gordonii
- 1.3181 * Actinomyces.odontolyticus
- 30.4289 * Streptococcus.mutans
- 0.4833 * Control.DNA
+ 5.5586 * Tannerella.forsythia
- 0.3171 * Fusobacterium.nucleatum.subsp..nucleatum
+ 1294.0756
LM num: 10
.outcome =
15.293 * Treponema.denticola
+ 2.719 * Streptococcus.gordonii
- 2.4637 * Actinomyces.odontolyticus
- 30.4289 * Streptococcus.mutans
- 0.4833 * Control.DNA
+ 5.5586 * Tannerella.forsythia
+ 1320.5275
LM num: 11
.outcome =
3.3786 * Treponema.denticola
+ 5.1956 * Streptococcus.gordonii
- 2.8861 * Actinomyces.odontolyticus
- 0.5662 * Control.DNA
+ 29.9183 * Tannerella.forsythia
- 2.6289 * Actinomyces.naeslundii.II
+ 826.1665
LM num: 12
.outcome =
3.3786 * Treponema.denticola
+ 5.1956 * Streptococcus.gordonii
- 2.8861 * Actinomyces.odontolyticus
- 0.5662 * Control.DNA
+ 29.9183 * Tannerella.forsythia
- 2.9643 * Actinomyces.naeslundii.II
+ 825.1613
LM num: 13
.outcome =
3.3786 * Treponema.denticola
+ 5.4972 * Streptococcus.gordonii
- 2.8861 * Actinomyces.odontolyticus
- 0.6637 * Control.DNA
+ 29.9183 * Tannerella.forsythia
+ 0.4481 * Actinomyces.naeslundii.II
+ 906.7614
LM num: 14
.outcome =
3.3786 * Treponema.denticola
+ 5.4972 * Streptococcus.gordonii
- 2.8861 * Actinomyces.odontolyticus
- 0.6694 * Control.DNA
+ 29.9183 * Tannerella.forsythia
+ 0.4481 * Actinomyces.naeslundii.II
+ 910.6162
LM num: 15
.outcome =
-215.5803 * Porphyromonas.gingivalis
+ 3.3786 * Treponema.denticola
+ 3.1851 * Streptococcus.gordonii
- 2.8861 * Actinomyces.odontolyticus
- 56.1926 * Streptococcus.constellatus
- 0.5662 * Control.DNA
+ 36.302 * Tannerella.forsythia
+ 1327.7476
LM num: 16
.outcome =
-221.29 * Porphyromonas.gingivalis
+ 3.3786 * Treponema.denticola
+ 3.1851 * Streptococcus.gordonii
- 2.8861 * Actinomyces.odontolyticus
- 53.2351 * Streptococcus.constellatus
- 0.5662 * Control.DNA
+ 36.302 * Tannerella.forsythia
+ 1307.8776
LM num: 17
.outcome =
-221.29 * Porphyromonas.gingivalis
+ 3.3786 * Treponema.denticola
+ 3.1851 * Streptococcus.gordonii
- 2.8861 * Actinomyces.odontolyticus
- 53.2351 * Streptococcus.constellatus
- 0.5662 * Control.DNA
+ 36.302 * Tannerella.forsythia
+ 1307.1008
引き続き、cor(p,bacteria$PISA)をコマンドを入力し、予測PISA値「p」と実測のPISA値の相関係数を計算させたところ、相関係数0.8759666となった。
予測PISA値「p」と実測のPISA値の散布図を図2に示す。
このモデルに示すようにDNAチップのSN比からPISA値を予測可能であることが示された。
特に表6に示した各細菌量を示すSN比と口腔内全体のPISA値との比較において、負の相関係数をもつ、Streptococcus mutans、Actinomyces odontolyticus、Campylobacter concisus、Actinomyces.naeslundii.II、Streptococcus.constellatusと、正の相関係数をもつCapnocytophaga sputigena、Tannerella forsythia、Streptococcus gordonii、Treponema denticola、Fusobacterium nucleatum subsp..nucleatum、Porphyromonas gingivalisの細菌群のSN比からPISA値を予測可能であることが示された。
<PISA値と細菌量の相関解析>
まず、サンプルごとに、PISA値および各細菌量を示すSN比のデータを対応させた。その後、すべてのサンプルの絶対量指標プローブのSN比の中央値を算出し、個々のサンプルの絶対量指標プローブのSN比をこの中央値で除算した。これをチップ間補正値とする。続いて、個々のサンプルのすべての細菌のSN比データを、個々のサンプルのチップ間補正値で除算することにより、チップ間のSN比データを標準化した。その結果を、表7に示した。


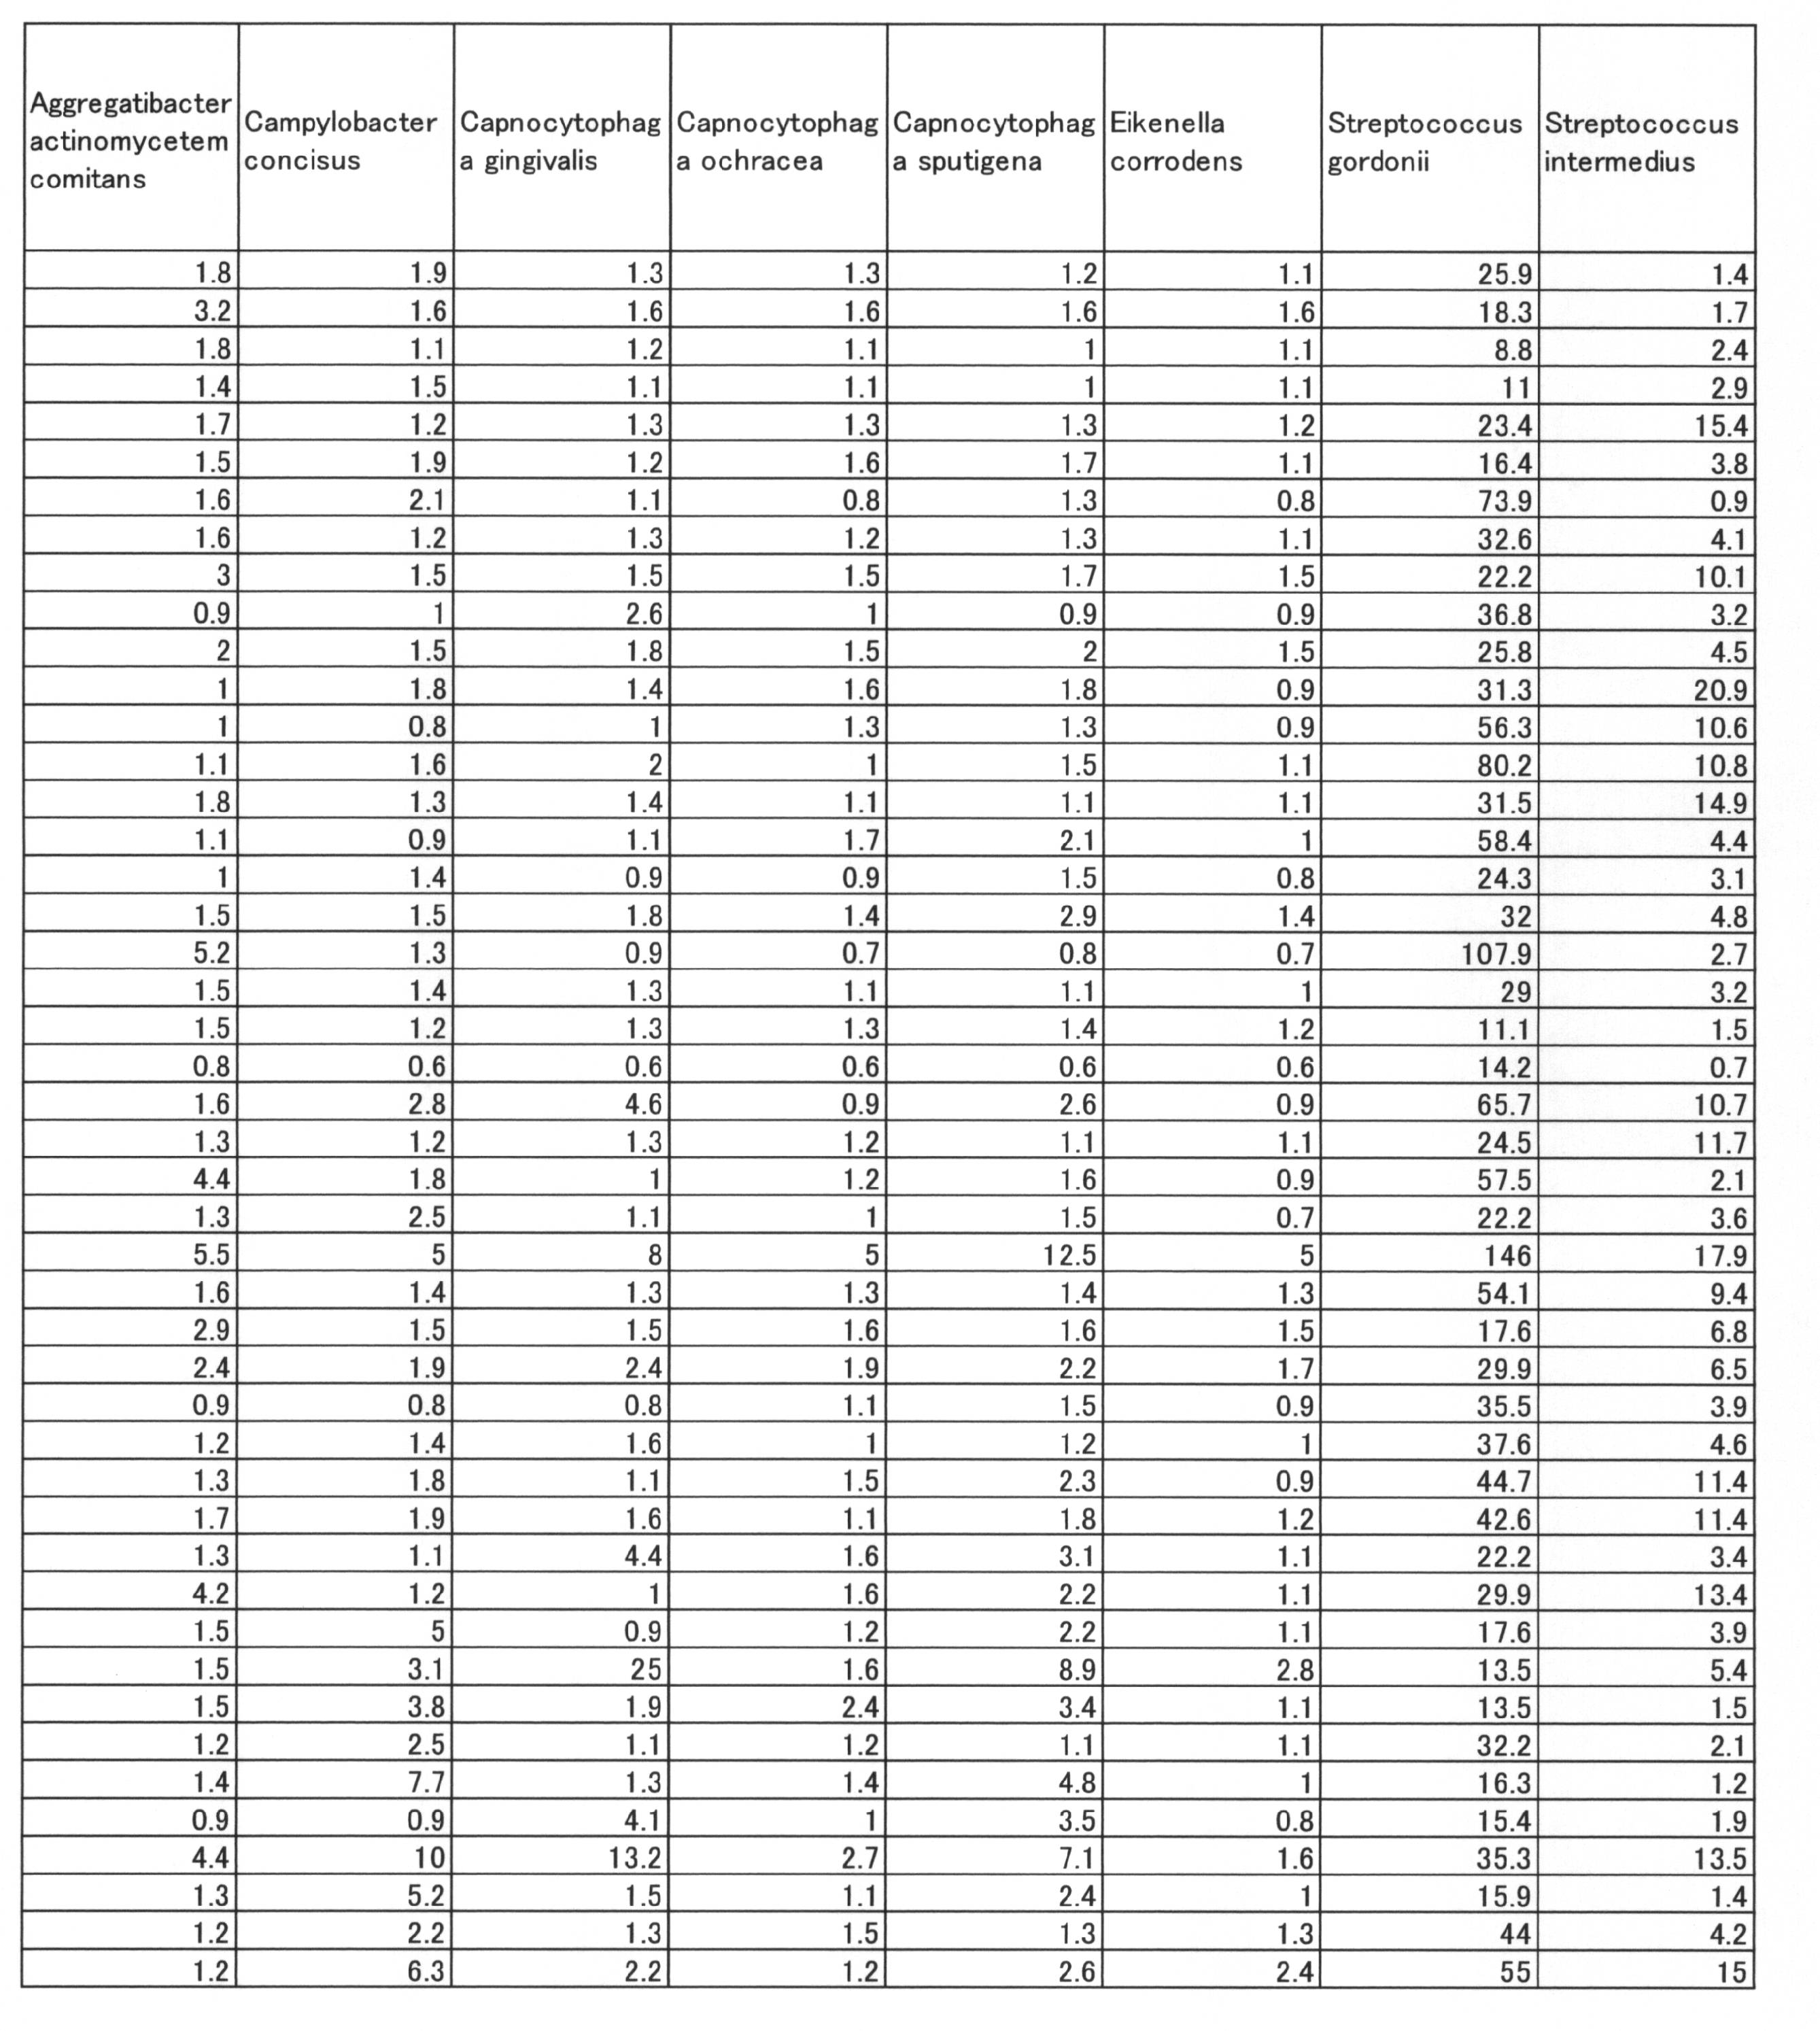
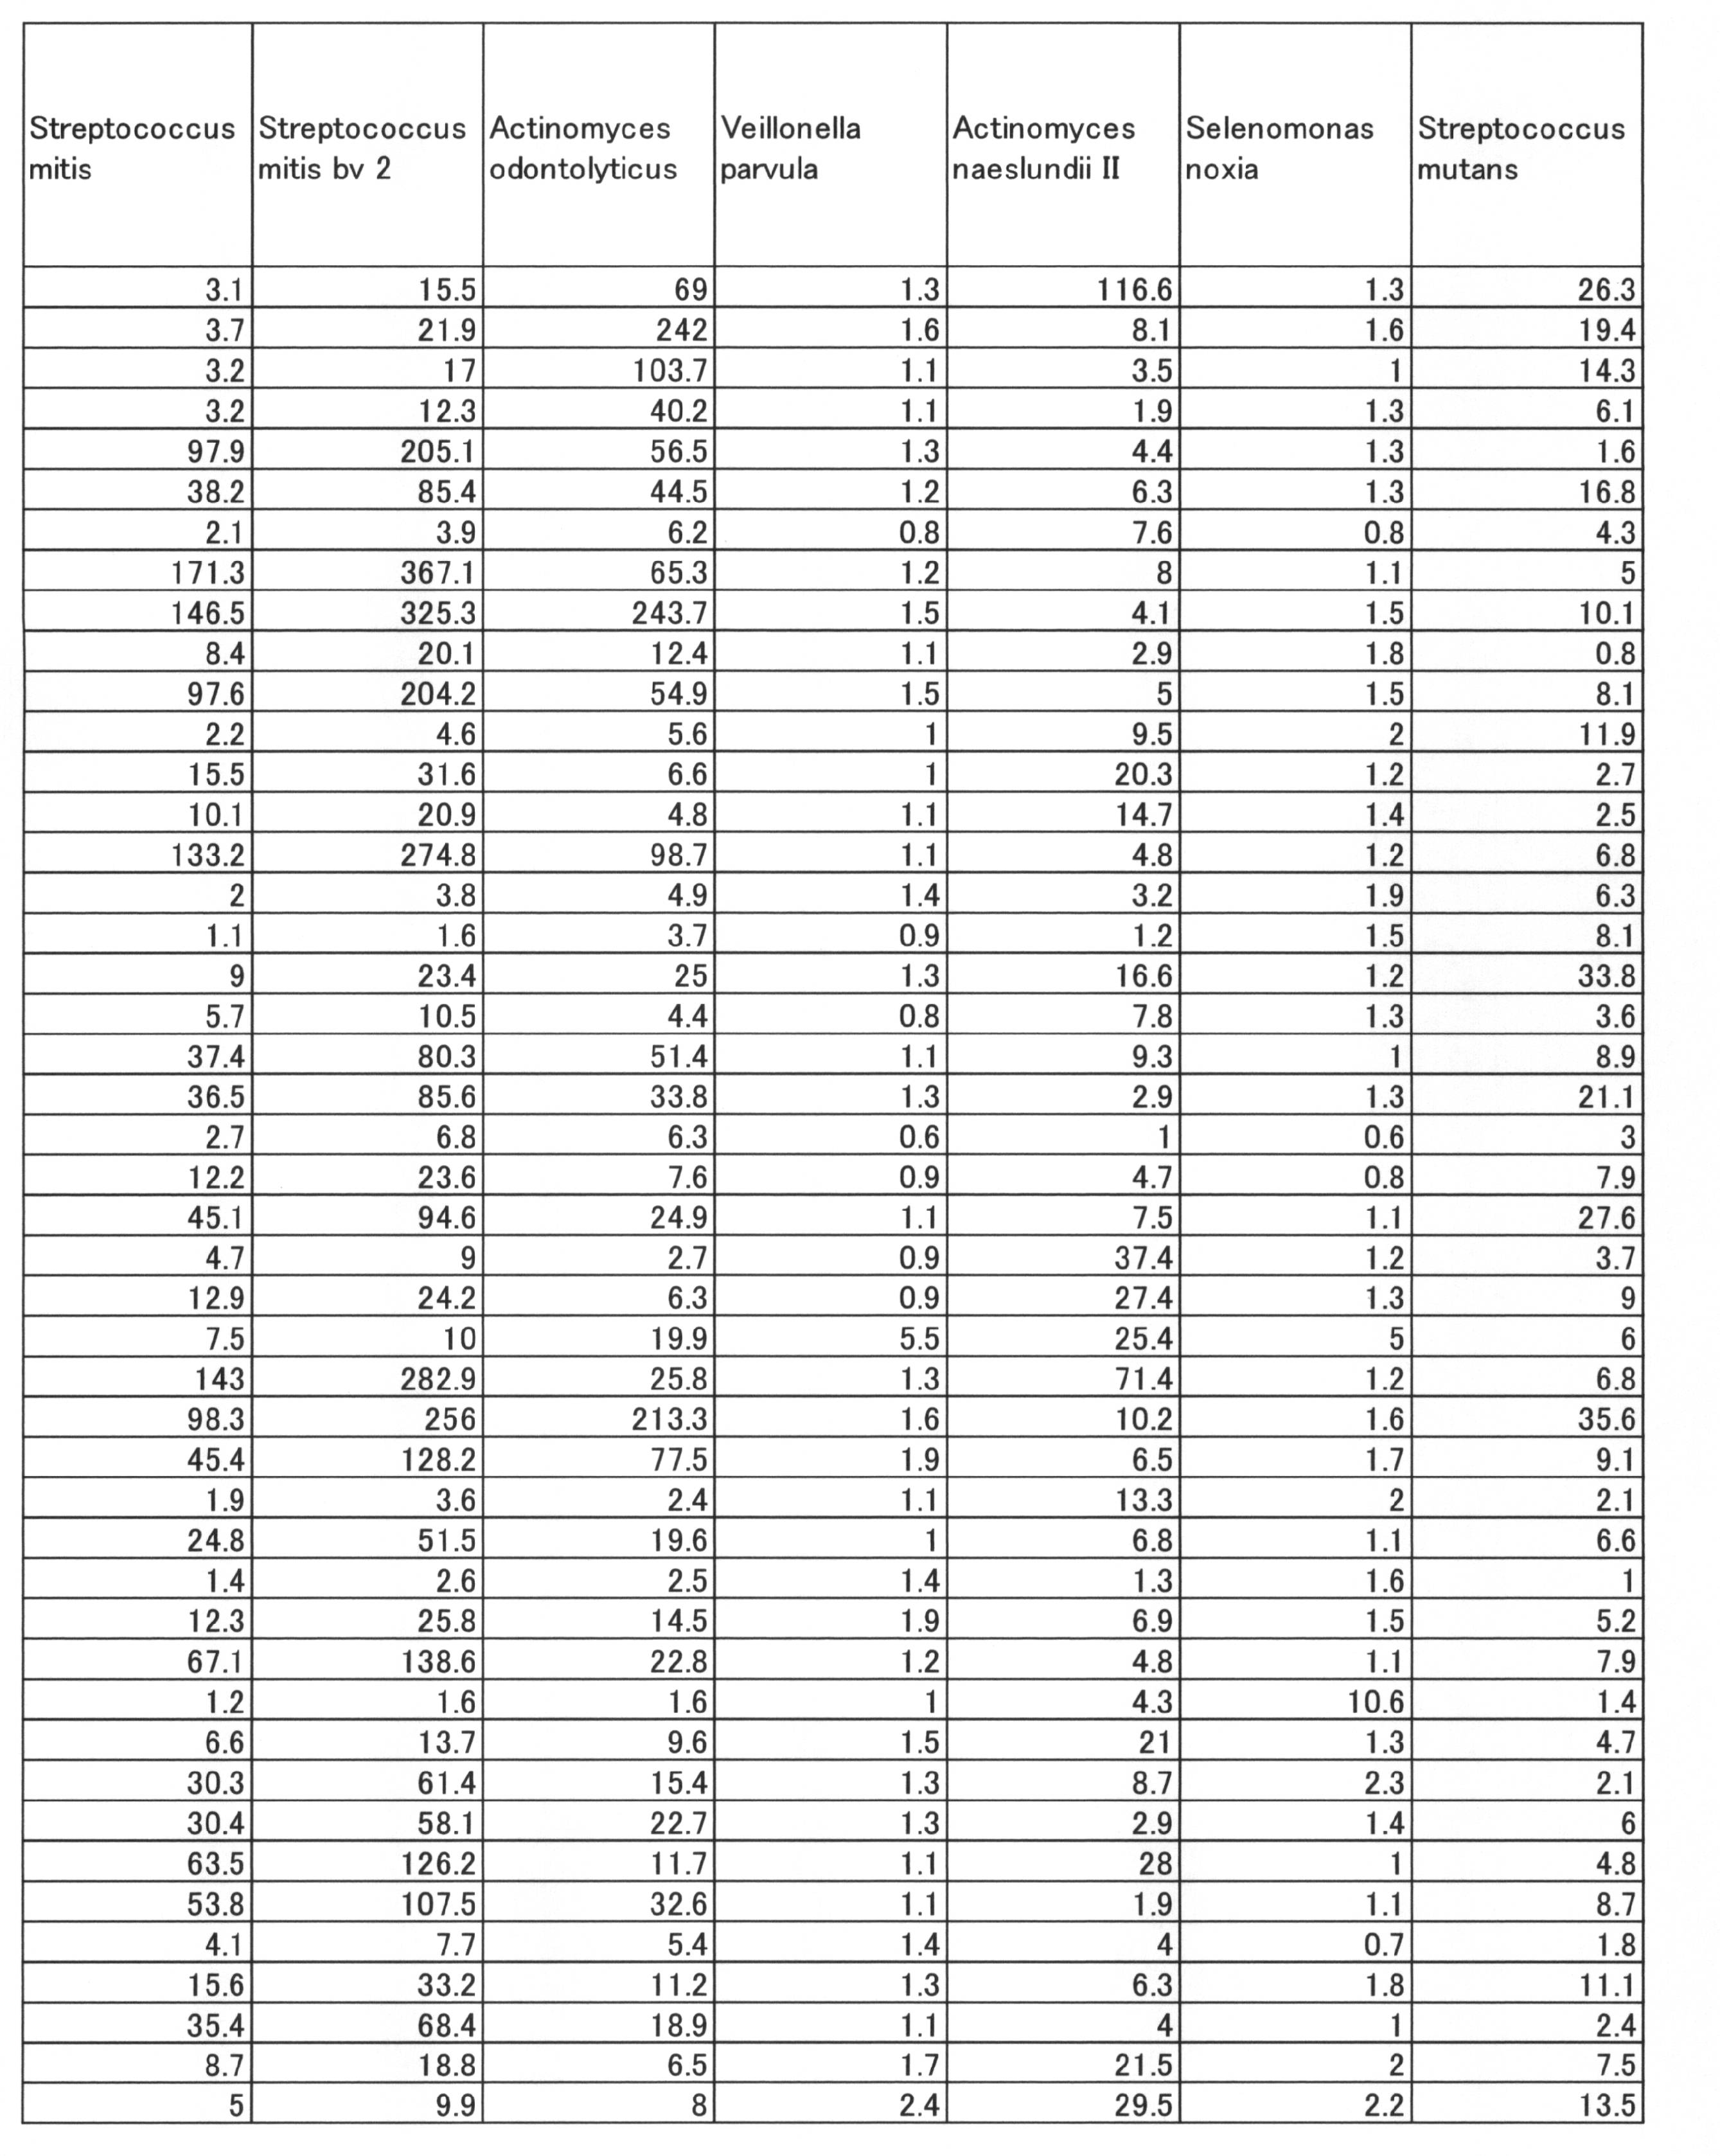
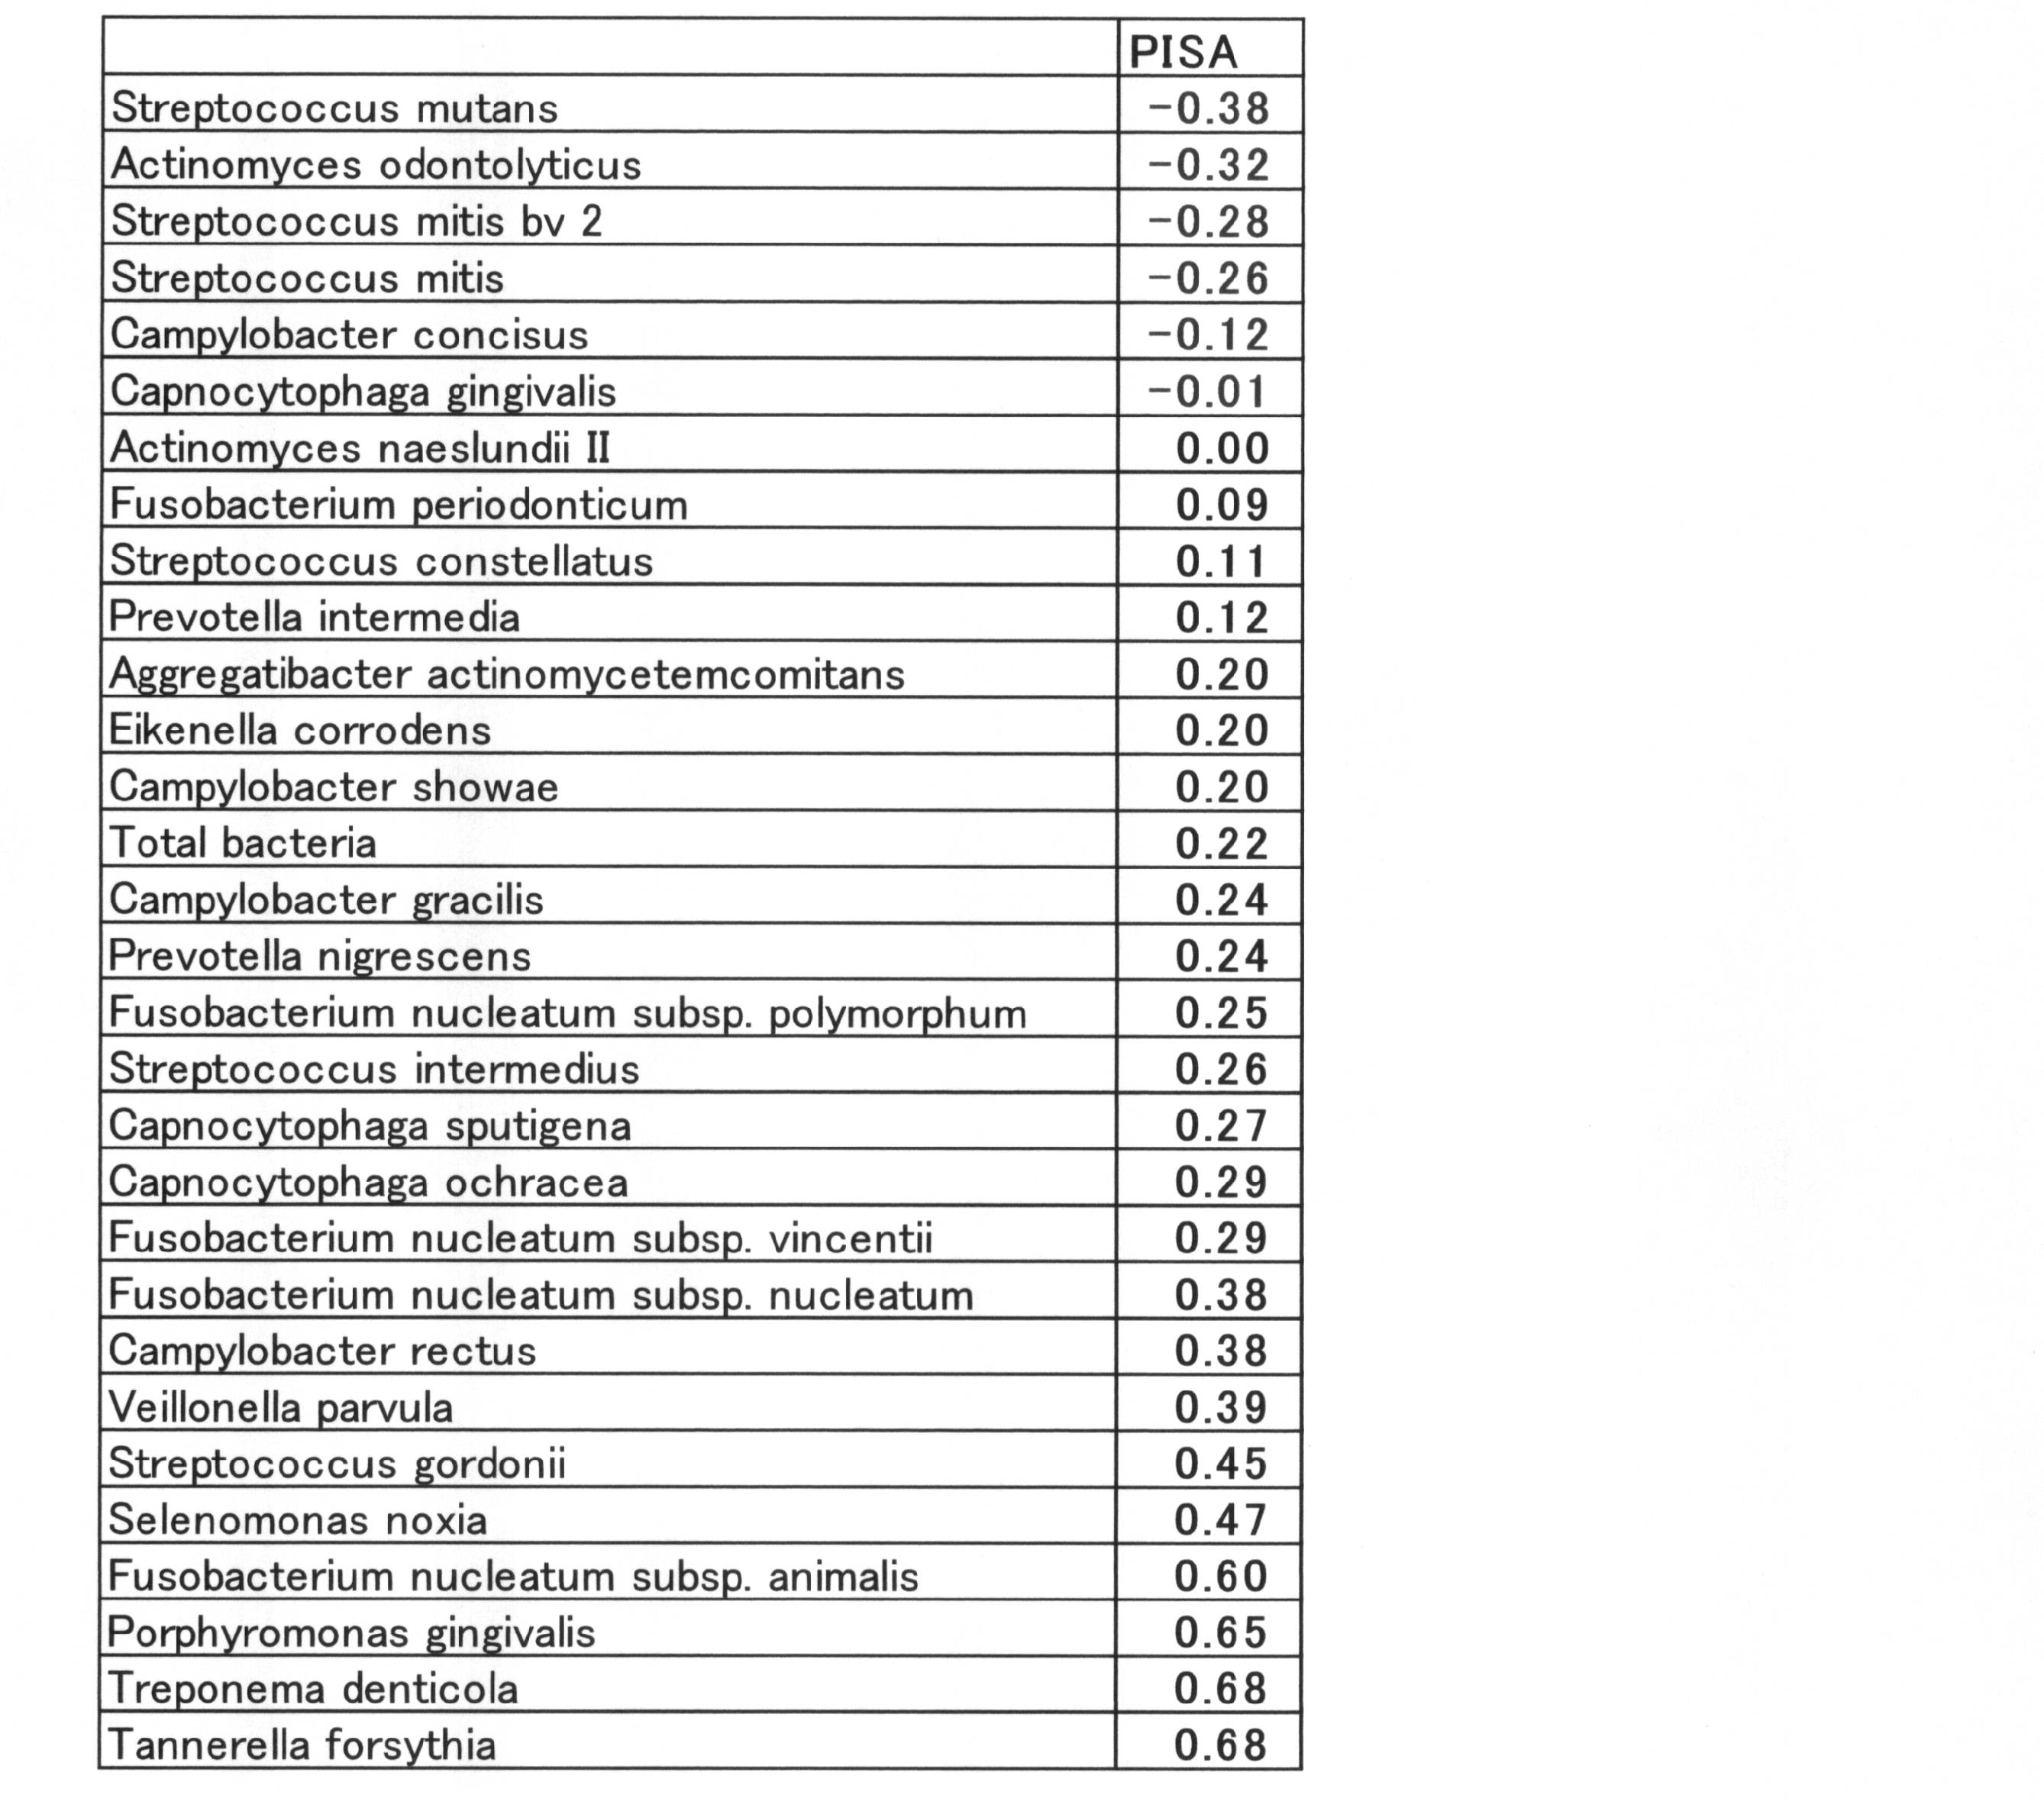
m <- train(PISA~.,data=bacteria ,method="M5")
PISAを目的変数とし、説明変数を表7の細菌全種類としてモデル木を生成させるコマンドである。46サンプルデータすべてを使用した。
(using smoothed linear models)
Treponema.denticola <= 6.1 :
| Campylobacter.concisus <= 1.45 :
| | Actinomyces.odontolyticus <= 53.95 :
| | | Streptococcus.mutans <= 15 :
| | | | Tannerella.forsythia <= 4.9 :
| | | | | Porphyromonas.gingivalis <= 1.45 : LM1 (2/25.547%)
| | | | | Porphyromonas.gingivalis > 1.45 : LM2 (2/24.859%)
| | | | Tannerella.forsythia > 4.9 : LM3 (3/3.438%)
| | | Streptococcus.mutans > 15 : LM4 (2/7.664%)
| | Actinomyces.odontolyticus > 53.95 :
| | | Fusobacterium.nucleatum.subsp..animalis <= 2.2 : LM5 (2/3.144%)
| | | Fusobacterium.nucleatum.subsp..animalis > 2.2 : LM6 (2/2.358%)
| Campylobacter.concisus > 1.45 :
| | Capnocytophaga.ochracea <= 1.15 :
| | | Fusobacterium.periodonticum <= 2.35 : LM7 (2/4.372%)
| | | Fusobacterium.periodonticum > 2.35 : LM8 (2/1.326%)
| | Capnocytophaga.ochracea > 1.15 :
| | | Total.bacteria <= 2252.6 : LM9 (4/4.488%)
| | | Total.bacteria > 2252.6 :
| | | | Capnocytophaga.ochracea <= 1.55 : LM10 (4/2.777%)
| | | | Capnocytophaga.ochracea > 1.55 :
| | | | | Tannerella.forsythia <= 2.9 :
| | | | | | Tannerella.forsythia <= 2.35 : LM11 (2/11.398%)
| | | | | | Tannerella.forsythia > 2.35 : LM12 (2/1.572%)
| | | | | Tannerella.forsythia > 2.9 : LM13 (3/17.057%)
Treponema.denticola > 6.1 :
| Campylobacter.rectus <= 6.4 :
| | Veillonella.parvula <= 1.25 :
| | | Streptococcus.gordonii <= 36.15 : LM14 (3/12.485%)
| | | Streptococcus.gordonii > 36.15 :
| | | | Tannerella.forsythia <= 11.5 : LM15 (2/8.205%)
| | | | Tannerella.forsythia > 11.5 : LM16 (2/1.572%)
| | Veillonella.parvula > 1.25 : LM17 (3/55.578%)
| Campylobacter.rectus > 6.4 :
| | Total.bacteria <= 1916.55 : LM18 (2/4.176%)
| | Total.bacteria > 1916.55 : LM19 (2/1.965%)
LM num: 1
.outcome =
0.1154 * Total.bacteria
- 87.6234 * Porphyromonas.gingivalis
+ 32.2177 * Tannerella.forsythia
+ 3.4246 * Treponema.denticola
+ 10.3816 * Fusobacterium.nucleatum.subsp..animalis
+ 4.5488 * Streptococcus.gordonii
- 2.8479 * Actinomyces.odontolyticus
- 4.1907 * Streptococcus.mutans
+ 353.0028
LM num: 2
.outcome =
0.1154 * Total.bacteria
- 87.6234 * Porphyromonas.gingivalis
+ 32.2177 * Tannerella.forsythia
+ 3.4246 * Treponema.denticola
+ 10.3816 * Fusobacterium.nucleatum.subsp..animalis
+ 4.5488 * Streptococcus.gordonii
- 2.8479 * Actinomyces.odontolyticus
- 4.1907 * Streptococcus.mutans
+ 354.0939
LM num: 3
.outcome =
0.1154 * Total.bacteria
- 87.6234 * Porphyromonas.gingivalis
+ 32.2177 * Tannerella.forsythia
+ 3.4246 * Treponema.denticola
+ 10.3816 * Fusobacterium.nucleatum.subsp..animalis
+ 4.5488 * Streptococcus.gordonii
- 2.8479 * Actinomyces.odontolyticus
- 4.1907 * Streptococcus.mutans
+ 353.0353
LM num: 4
.outcome =
0.1154 * Total.bacteria
- 87.6234 * Porphyromonas.gingivalis
+ 32.2177 * Tannerella.forsythia
+ 3.4246 * Treponema.denticola
+ 10.3816 * Fusobacterium.nucleatum.subsp..animalis
+ 4.5488 * Streptococcus.gordonii
- 2.8479 * Actinomyces.odontolyticus
- 5.4232 * Streptococcus.mutans
+ 347.5507
LM num: 5
.outcome =
0.1154 * Total.bacteria
- 87.6234 * Porphyromonas.gingivalis
+ 32.2177 * Tannerella.forsythia
+ 3.4246 * Treponema.denticola
+ 10.3816 * Fusobacterium.nucleatum.subsp..animalis
+ 4.5488 * Streptococcus.gordonii
- 3.3806 * Actinomyces.odontolyticus
+ 263.7849
LM num: 6
.outcome =
0.1154 * Total.bacteria
- 87.6234 * Porphyromonas.gingivalis
+ 32.2177 * Tannerella.forsythia
+ 3.4246 * Treponema.denticola
+ 10.3816 * Fusobacterium.nucleatum.subsp..animalis
+ 4.5488 * Streptococcus.gordonii
- 3.3806 * Actinomyces.odontolyticus
+ 262.54
LM num: 7
.outcome =
0.1154 * Total.bacteria
- 87.6234 * Porphyromonas.gingivalis
+ 27.5903 * Tannerella.forsythia
+ 3.4246 * Treponema.denticola
+ 10.3816 * Fusobacterium.nucleatum.subsp..animalis
+ 4.5488 * Streptococcus.gordonii
- 0.6784 * Actinomyces.odontolyticus
+ 33.5894
LM num: 8
.outcome =
0.1154 * Total.bacteria
- 87.6234 * Porphyromonas.gingivalis
+ 27.5903 * Tannerella.forsythia
+ 3.4246 * Treponema.denticola
+ 10.3816 * Fusobacterium.nucleatum.subsp..animalis
+ 4.5488 * Streptococcus.gordonii
- 0.6784 * Actinomyces.odontolyticus
+ 32.468
LM num: 9
.outcome =
0.0649 * Total.bacteria
- 87.6234 * Porphyromonas.gingivalis
+ 43.8294 * Tannerella.forsythia
+ 3.4246 * Treponema.denticola
+ 10.3816 * Fusobacterium.nucleatum.subsp..animalis
+ 4.5488 * Streptococcus.gordonii
- 0.6784 * Actinomyces.odontolyticus
+ 146.6484
LM num: 10
.outcome =
0.0785 * Total.bacteria
- 87.6234 * Porphyromonas.gingivalis
+ 44.0191 * Tannerella.forsythia
+ 3.4246 * Treponema.denticola
+ 10.3816 * Fusobacterium.nucleatum.subsp..animalis
+ 4.5488 * Streptococcus.gordonii
- 0.6784 * Actinomyces.odontolyticus
+ 93.2371
LM num: 11
.outcome =
0.0785 * Total.bacteria
- 87.6234 * Porphyromonas.gingivalis
+ 45.0694 * Tannerella.forsythia
+ 3.4246 * Treponema.denticola
+ 10.3816 * Fusobacterium.nucleatum.subsp..animalis
+ 4.5488 * Streptococcus.gordonii
- 0.6784 * Actinomyces.odontolyticus
+ 91.1073
LM num: 12
.outcome =
0.0785 * Total.bacteria
- 87.6234 * Porphyromonas.gingivalis
+ 45.0694 * Tannerella.forsythia
+ 3.4246 * Treponema.denticola
+ 10.3816 * Fusobacterium.nucleatum.subsp..animalis
+ 4.5488 * Streptococcus.gordonii
- 0.6784 * Actinomyces.odontolyticus
+ 91.0077
LM num: 13
.outcome =
0.0785 * Total.bacteria
- 87.6234 * Porphyromonas.gingivalis
+ 45.1623 * Tannerella.forsythia
+ 3.4246 * Treponema.denticola
+ 10.3816 * Fusobacterium.nucleatum.subsp..animalis
+ 4.5488 * Streptococcus.gordonii
- 0.6784 * Actinomyces.odontolyticus
+ 93.4098
LM num: 14
.outcome =
-0.0279 * Total.bacteria
- 142.0103 * Porphyromonas.gingivalis
+ 9.7177 * Tannerella.forsythia
+ 5.5503 * Treponema.denticola
+ 24.5588 * Campylobacter.rectus
+ 16.8253 * Fusobacterium.nucleatum.subsp..animalis
+ 10.5169 * Streptococcus.gordonii
+ 793.003 * Veillonella.parvula
- 497.9287
LM num: 15
.outcome =
-0.0279 * Total.bacteria
- 142.0103 * Porphyromonas.gingivalis
+ 9.7177 * Tannerella.forsythia
+ 5.5503 * Treponema.denticola
+ 24.5588 * Campylobacter.rectus
+ 16.8253 * Fusobacterium.nucleatum.subsp..animalis
+ 10.4819 * Streptococcus.gordonii
+ 793.003 * Veillonella.parvula
- 489.1573
LM num: 16
.outcome =
-0.0279 * Total.bacteria
- 142.0103 * Porphyromonas.gingivalis
+ 9.7177 * Tannerella.forsythia
+ 5.5503 * Treponema.denticola
+ 24.5588 * Campylobacter.rectus
+ 16.8253 * Fusobacterium.nucleatum.subsp..animalis
+ 10.4819 * Streptococcus.gordonii
+ 793.003 * Veillonella.parvula
- 489.4669
LM num: 17
.outcome =
-0.0279 * Total.bacteria
- 142.0103 * Porphyromonas.gingivalis
+ 9.7177 * Tannerella.forsythia
+ 5.5503 * Treponema.denticola
+ 24.5588 * Campylobacter.rectus
+ 16.8253 * Fusobacterium.nucleatum.subsp..animalis
+ 10.4024 * Streptococcus.gordonii
+ 853.2173 * Veillonella.parvula
- 506.1734
LM num: 18
.outcome =
-0.0958 * Total.bacteria
- 142.0103 * Porphyromonas.gingivalis
+ 9.7177 * Tannerella.forsythia
+ 5.5503 * Treponema.denticola
+ 32.3143 * Campylobacter.rectus
+ 16.8253 * Fusobacterium.nucleatum.subsp..animalis
+ 7.3721 * Streptococcus.gordonii
+ 686.8925 * Veillonella.parvula
+ 139.0553
LM num: 19
.outcome =
-0.0958 * Total.bacteria
- 142.0103 * Porphyromonas.gingivalis
+ 9.7177 * Tannerella.forsythia
+ 5.5503 * Treponema.denticola
+ 32.3143 * Campylobacter.rectus
+ 16.8253 * Fusobacterium.nucleatum.subsp..animalis
+ 7.3721 * Streptococcus.gordonii
+ 686.8925 * Veillonella.parvula
+ 143.569
Number of Rules : 19
実際のPISA値と予測PISA値の相関係数を算出するためcor(p,bacteria$PISA)をコマンドを実行し、予測PISA値「p」と実測のPISA値の相関係数を計算させたところ、相関係数0.9291664を得た。予測PISA値「p」と実測のPISA値の散布図を、図3に示す。このモデルに示すようにDNAチップのSN比からPISA値を予測可能であることが示された。
予測モデルの構築では46サンプルのうち、ランダムに34サンプルを抽出してクロスバリデーション法に用いた。クロスバリデーション法におけるモデル構築訓練データと検証データの比率は75:25とし学習回数は10回とした。
モデル構築後、モデル構築には全く使用していない残りの12サンプルのデータを将来の未知データとして用い、検証に使用した。
より具体的には、表7の表をデータフレーム名「bacteria」とした後、以下のコマンドにより実行した。
train.index <- sample(nrow(bacteria),nrow(bacteria)*0.75)
#モデル作成用データのセット
data.train <- bacteria[train.index,]
#テスト用データのセット
data.test <- bacteria[-train.index,]
data.m5 <- train(data.train[,-1],data.train$PISA,method="M5",trControl=fitControl)
(クロスバリデーション法におけるモデル構築訓練データと検証データの比率は75:25とし学習回数は10回とした。)
data.m5$results #構築モデルの表示
#未知データでの検証結果
PISA.pred <- predict(data.m5,newdata=data.test[,-1])
#相関係数の計算
cor(PISA.pred,data.test$PISA)
#散布図の出力
plot(PISA.pred,data.test$PISA)
#トレーニングデータでの結果
PISA.predtr <- predict(data.m5,newdata=data.train[,-1])
#相関係数の計算
cor(PISA.predtr,data.train$PISA)
#散布図の出力
plot(PISA.predtr,data.train$PISA)
M5 unpruned model tree:
(using smoothed linear models)
Tannerella.forsythia <= 3.589 :
| Capnocytophaga.ochracea <= 1.085 : LM1 (3/3.579%)
| Capnocytophaga.ochracea > 1.085 :
| | Prevotella.intermedia <= 1.135 :
| | | Total.bacteria <= 2072.974 : LM2 (2/2.188%)
| | | Total.bacteria > 2072.974 : LM3 (3/2.889%)
| | Prevotella.intermedia > 1.135 :
| | | Treponema.denticola <= 2.289 : LM4 (3/0.856%)
| | | Treponema.denticola > 2.289 : LM5 (2/4.57%)
Tannerella.forsythia > 3.589 :
| Capnocytophaga.sputigena <= 1.786 :
| | Eikenella.corrodens <= 1.067 :
| | | Fusobacterium.periodonticum <= 1.502 : LM6 (3/2.054%)
| | | Fusobacterium.periodonticum > 1.502 :
| | | | Streptococcus.mitis <= 3.972 : LM7 (2/7.05%)
| | | | Streptococcus.mitis > 3.972 :
| | | | | Aggregatibacter.actinomycetemcomitans <= 1.334 : LM8 (3/5.601%)
| | | | | Aggregatibacter.actinomycetemcomitans > 1.334 : LM9 (2/21.879%)
| | Eikenella.corrodens > 1.067 : LM10 (3/7.804%)
| Capnocytophaga.sputigena > 1.786 :
| | Tannerella.forsythia <= 12.803 :
| | | Total.bacteria <= 2244.721 : LM11 (2/6.126%)
| | | Total.bacteria > 2244.721 : LM12 (2/103.221%)
| | Tannerella.forsythia > 12.803 :
| | | Total.bacteria <= 1907.395 : LM13 (2/25.331%)
| | | Total.bacteria > 1907.395 : LM14 (2/1.945%)
LM num: 1
.outcome =
0.1964 * Total.bacteria
+ 8.473 * Treponema.denticola
- 3.7524 * Streptococcus.mitis
+ 136.0844
LM num: 2
.outcome =
0.1872 * Total.bacteria
+ 8.473 * Treponema.denticola
- 102.9193 * Prevotella.intermedia
- 3.7524 * Streptococcus.mitis
+ 297.6459
LM num: 3
.outcome =
0.1877 * Total.bacteria
+ 8.473 * Treponema.denticola
- 102.9193 * Prevotella.intermedia
- 3.7524 * Streptococcus.mitis
+ 295.2116
LM num: 4
.outcome =
0.1964 * Total.bacteria
+ 10.9568 * Treponema.denticola
- 102.9193 * Prevotella.intermedia
- 3.7524 * Streptococcus.mitis
+ 261.0986
LM num: 5
.outcome =
0.1964 * Total.bacteria
+ 11.1029 * Treponema.denticola
- 102.9193 * Prevotella.intermedia
- 3.7524 * Streptococcus.mitis
+ 261.4416
LM num: 6
.outcome =
0.1528 * Total.bacteria
+ 6.7947 * Tannerella.forsythia
+ 6.5901 * Treponema.denticola
+ 29.1856 * Aggregatibacter.actinomycetemcomitans
+ 74.536 * Capnocytophaga.sputigena
- 197.1112 * Eikenella.corrodens
- 5.6233 * Streptococcus.mitis
+ 637.0725
LM num: 7
.outcome =
0.1528 * Total.bacteria
+ 6.7947 * Tannerella.forsythia
+ 6.5901 * Treponema.denticola
+ 32.1268 * Aggregatibacter.actinomycetemcomitans
+ 74.536 * Capnocytophaga.sputigena
- 197.1112 * Eikenella.corrodens
- 5.6233 * Streptococcus.mitis
+ 625.658
LM num: 8
.outcome =
0.1528 * Total.bacteria
+ 6.7947 * Tannerella.forsythia
+ 6.5901 * Treponema.denticola
+ 32.301 * Aggregatibacter.actinomycetemcomitans
+ 74.536 * Capnocytophaga.sputigena
- 197.1112 * Eikenella.corrodens
- 5.6233 * Streptococcus.mitis
+ 627.695
LM num: 9
.outcome =
0.1528 * Total.bacteria
+ 6.7947 * Tannerella.forsythia
+ 6.5901 * Treponema.denticola
+ 32.3574 * Aggregatibacter.actinomycetemcomitans
+ 74.536 * Capnocytophaga.sputigena
- 197.1112 * Eikenella.corrodens
- 5.6233 * Streptococcus.mitis
+ 627.9978
LM num: 10
.outcome =
0.1528 * Total.bacteria
+ 6.7947 * Tannerella.forsythia
+ 6.5901 * Treponema.denticola
+ 22.9812 * Aggregatibacter.actinomycetemcomitans
+ 74.536 * Capnocytophaga.sputigena
- 273.7656 * Eikenella.corrodens
- 5.6233 * Streptococcus.mitis
+ 673.9955
LM num: 11
.outcome =
0.1989 * Total.bacteria
+ 14.1331 * Tannerella.forsythia
+ 6.5901 * Treponema.denticola
+ 90.7394 * Capnocytophaga.sputigena
- 6.2112 * Streptococcus.mitis
+ 410.322
LM num: 12
.outcome =
0.1989 * Total.bacteria
+ 14.1331 * Tannerella.forsythia
+ 6.5901 * Treponema.denticola
+ 90.7394 * Capnocytophaga.sputigena
- 6.2112 * Streptococcus.mitis
+ 409.7214
LM num: 13
.outcome =
0.1989 * Total.bacteria
+ 14.1331 * Tannerella.forsythia
+ 6.5901 * Treponema.denticola
+ 90.7394 * Capnocytophaga.sputigena
- 6.2112 * Streptococcus.mitis
+ 497.6085
LM num: 14
.outcome =
0.1989 * Total.bacteria
+ 14.1331 * Tannerella.forsythia
+ 6.5901 * Treponema.denticola
+ 90.7394 * Capnocytophaga.sputigena
- 6.2112 * Streptococcus.mitis
+ 501.0283
Number of Rules : 14
この結果より、未知のデータに対してもPISAの値を予測できることが示された。
特に、表8に示した各細菌量を示すSN比と口腔内全体のPISA値との比較において、負の相関係数をもつ、Streptococcus mitisと、正の相関係数をもつTannerella forsythia、 Treponema denticola、Capnocytophaga ochracea、 Capnocytophaga sputigena、Eikenella corrodens 、Aggregatibacter actinomycetemcomitans、Prevotella intermedia、Fusobacterium periodonticumの細菌群のSN比からPISA値を予測可能であることが示された。
唾液を検体とした歯周病の状態の判定については、歯周疾患者における抗菌療法の診療ガイドライン(日本歯周病学会編集)によると、Porphyromonas gingivalis、Tannerella forsythensis及びTreponema denticolaの3種類の細菌数の合計が、総菌数に対して0.05%未満の場合を「軽度」、総菌数に対して0.05%以上0.5%未満の場合を「中程度」、総菌数に対して0.5%以上の場合を「重度」であると判定することができる。
そこで、表7に示したSN比の内、レッドコンプレックスであるPorphyromonas gingivalis、Tannerella forsythia、Treponema denticolaの3菌種のSN比の合計値と、総菌量を示すTotal bacteriaのSN比の比率を算出して既存の指標とした。この指標により、前述の「軽度」、「中程度」、「重度」を判定した。
判定した結果とPISA実測値、実施例3の結果に基づくPISA予測値、3菌のSN比、Total bacteriaのSN比を、表9にまとめた。

算出した値(X軸)とPISA値(Y軸)との散布図を、図8に示した。その結果、XとY関係について、決定係数0.41程度の関係性があることが分かった。すなわち、バランス指標を用いた場合においてもPISAを推定できることが分かった。
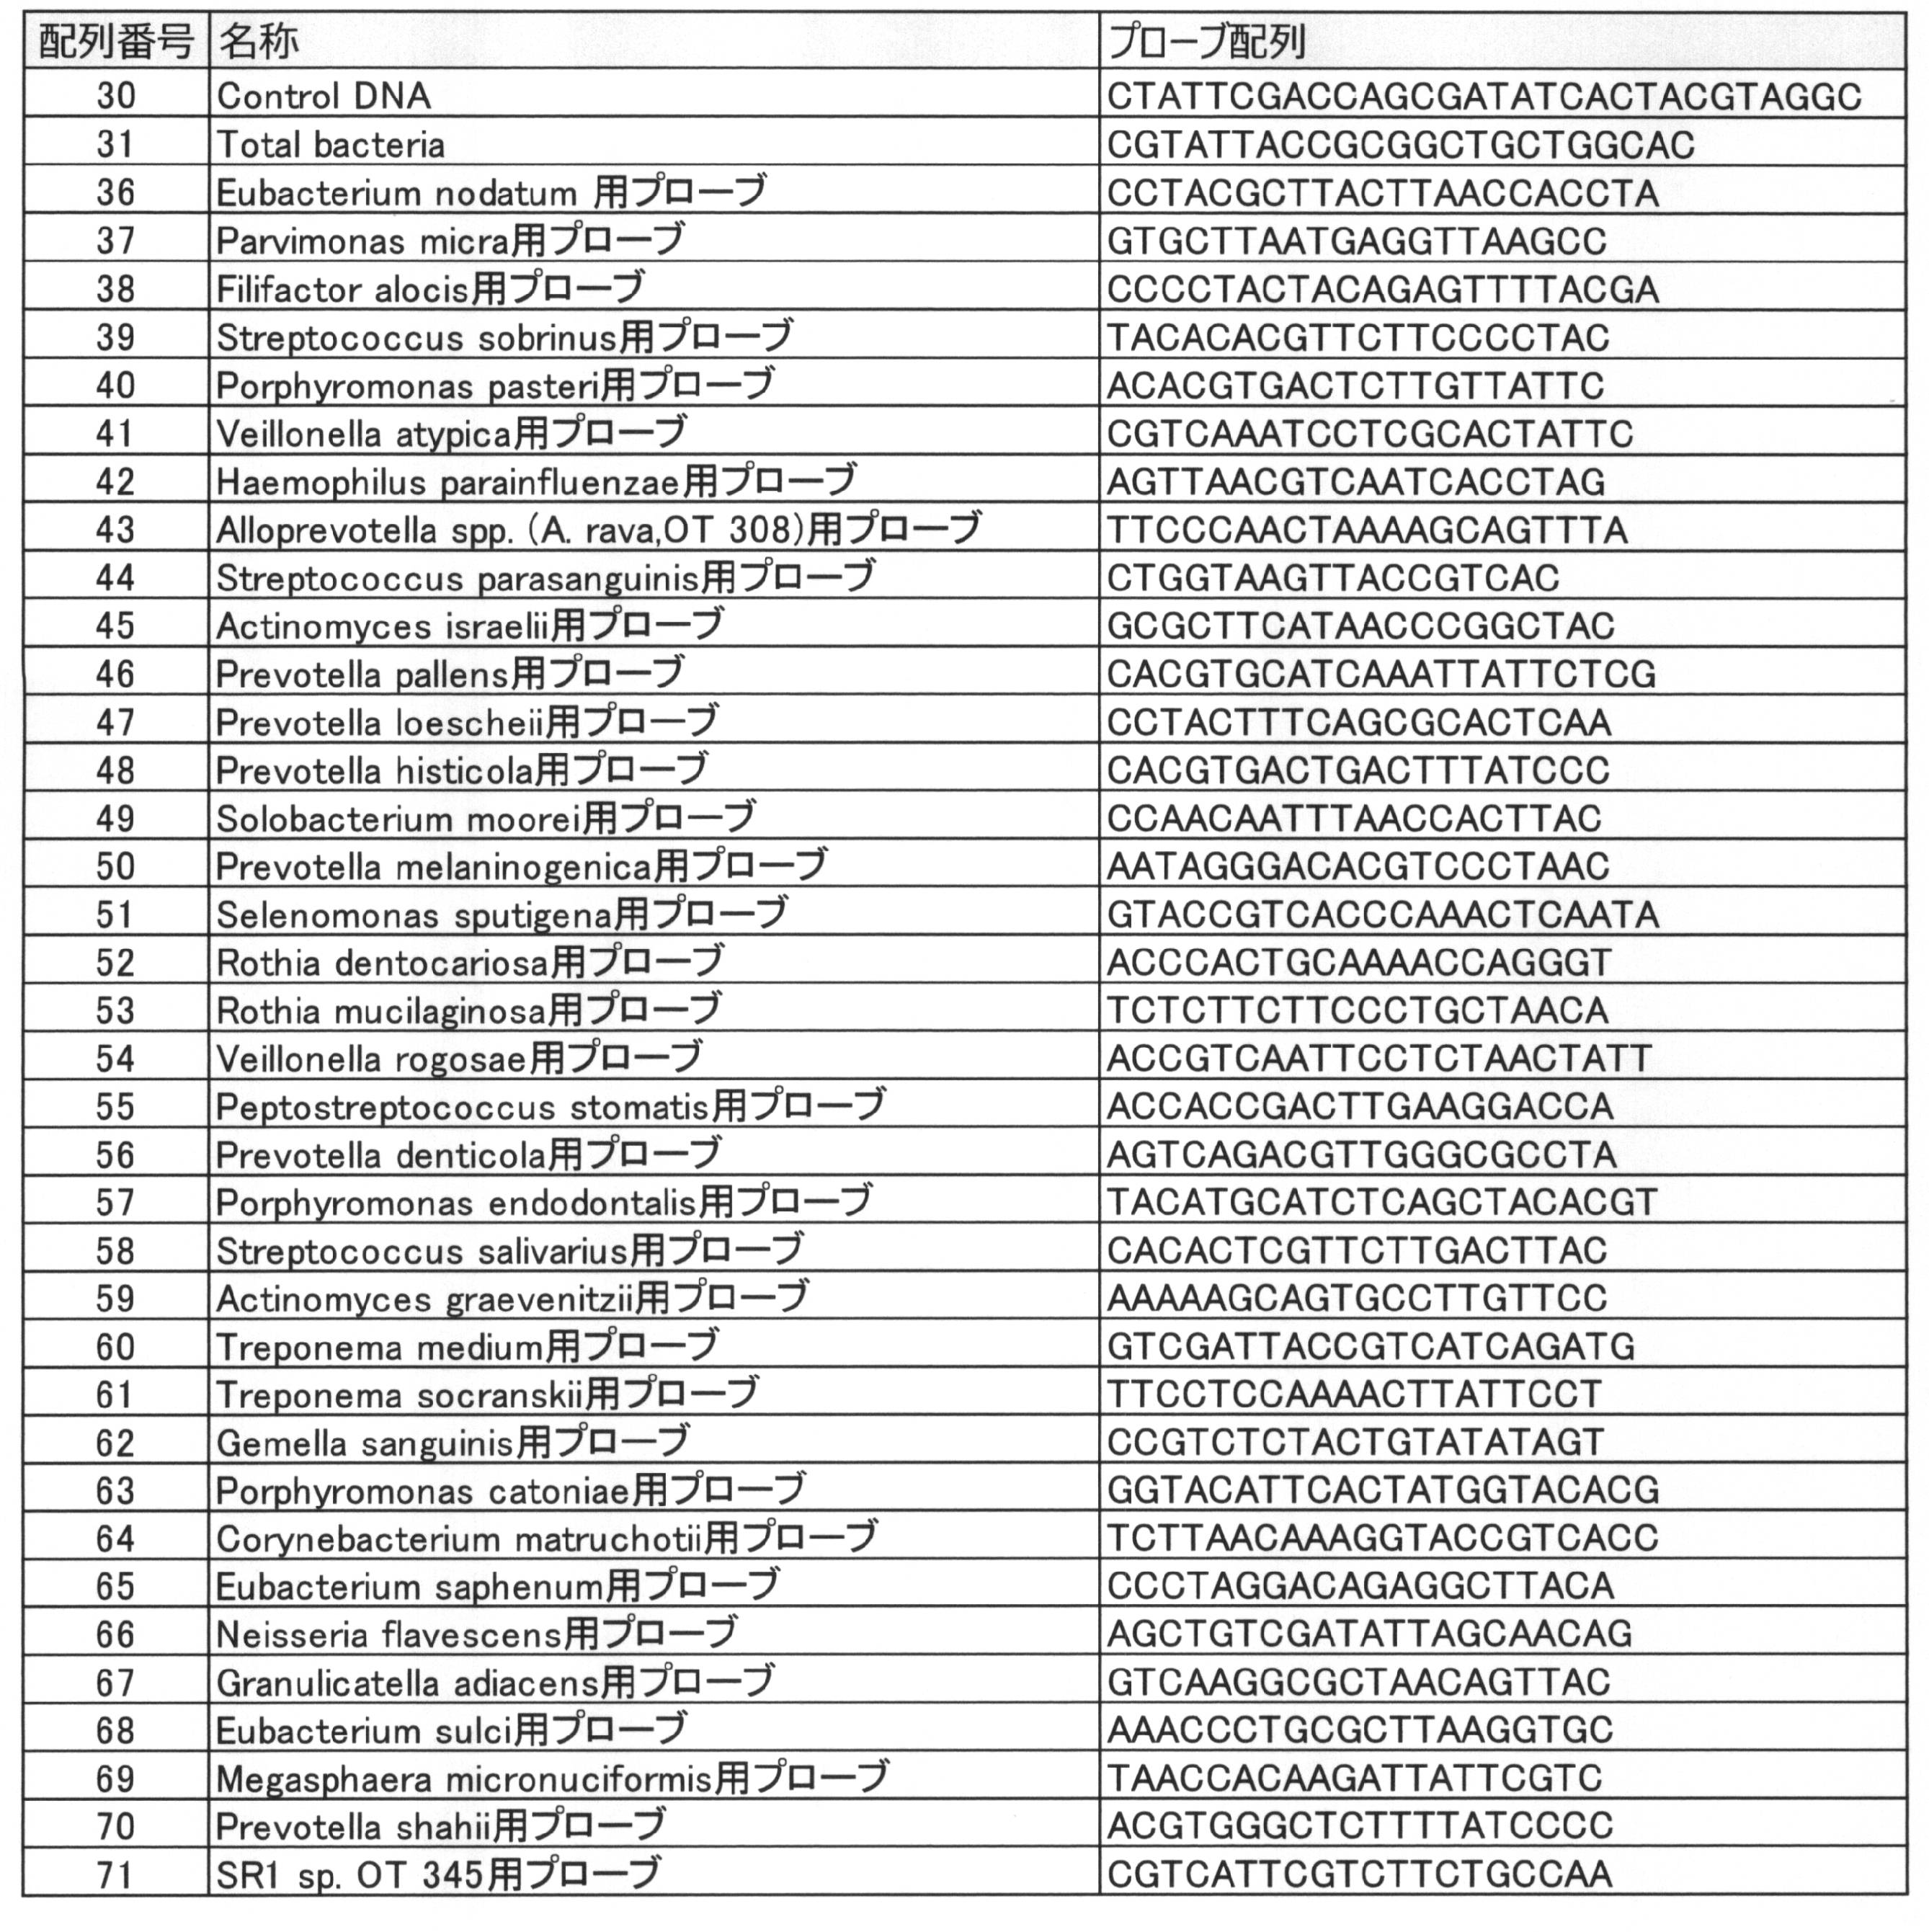
PCRに使用したプライマーを以下のように変更して実施した。
R、Yは混合塩基を示しており、RはAとG、YはCとTを示す。
5’-Cy5-TACGGGAGGCAGCAG-3’(配列番号72)
リバースプライマー(細菌増幅用):
5’-CRGGGTATCTAATCCYGTT-3’(配列番号73)
フォワードプライマー(絶対量指標増幅用):
5’-Cy5-GAGAAGCCTACACAAACGTAACGTC-3’(配列番号34)
リバースプライマー(絶対量指標増幅用):
5’-CTCTAAAGACCGCTCTATCTCGG-3’(配列番号35)
ひきつづき得られた蛍光強度を以下のように処理した。
検出対象細菌用プローブを搭載したスポットの蛍光強度を、バックグラウンド値(プローブを搭載していないスポットの蛍光強度の中央値)で減算し、ハイブリダイゼーションに由来するシグナル強度を算出した。このとき、シグナル強度がある閾値を下回るものについては、ノイズと判断し「0」とする。ここでは閾値として、プローブを搭載していないスポット30個の傾向強度のうち上下位5つを除いた20個の値の標準偏差の3倍の値を用いた。

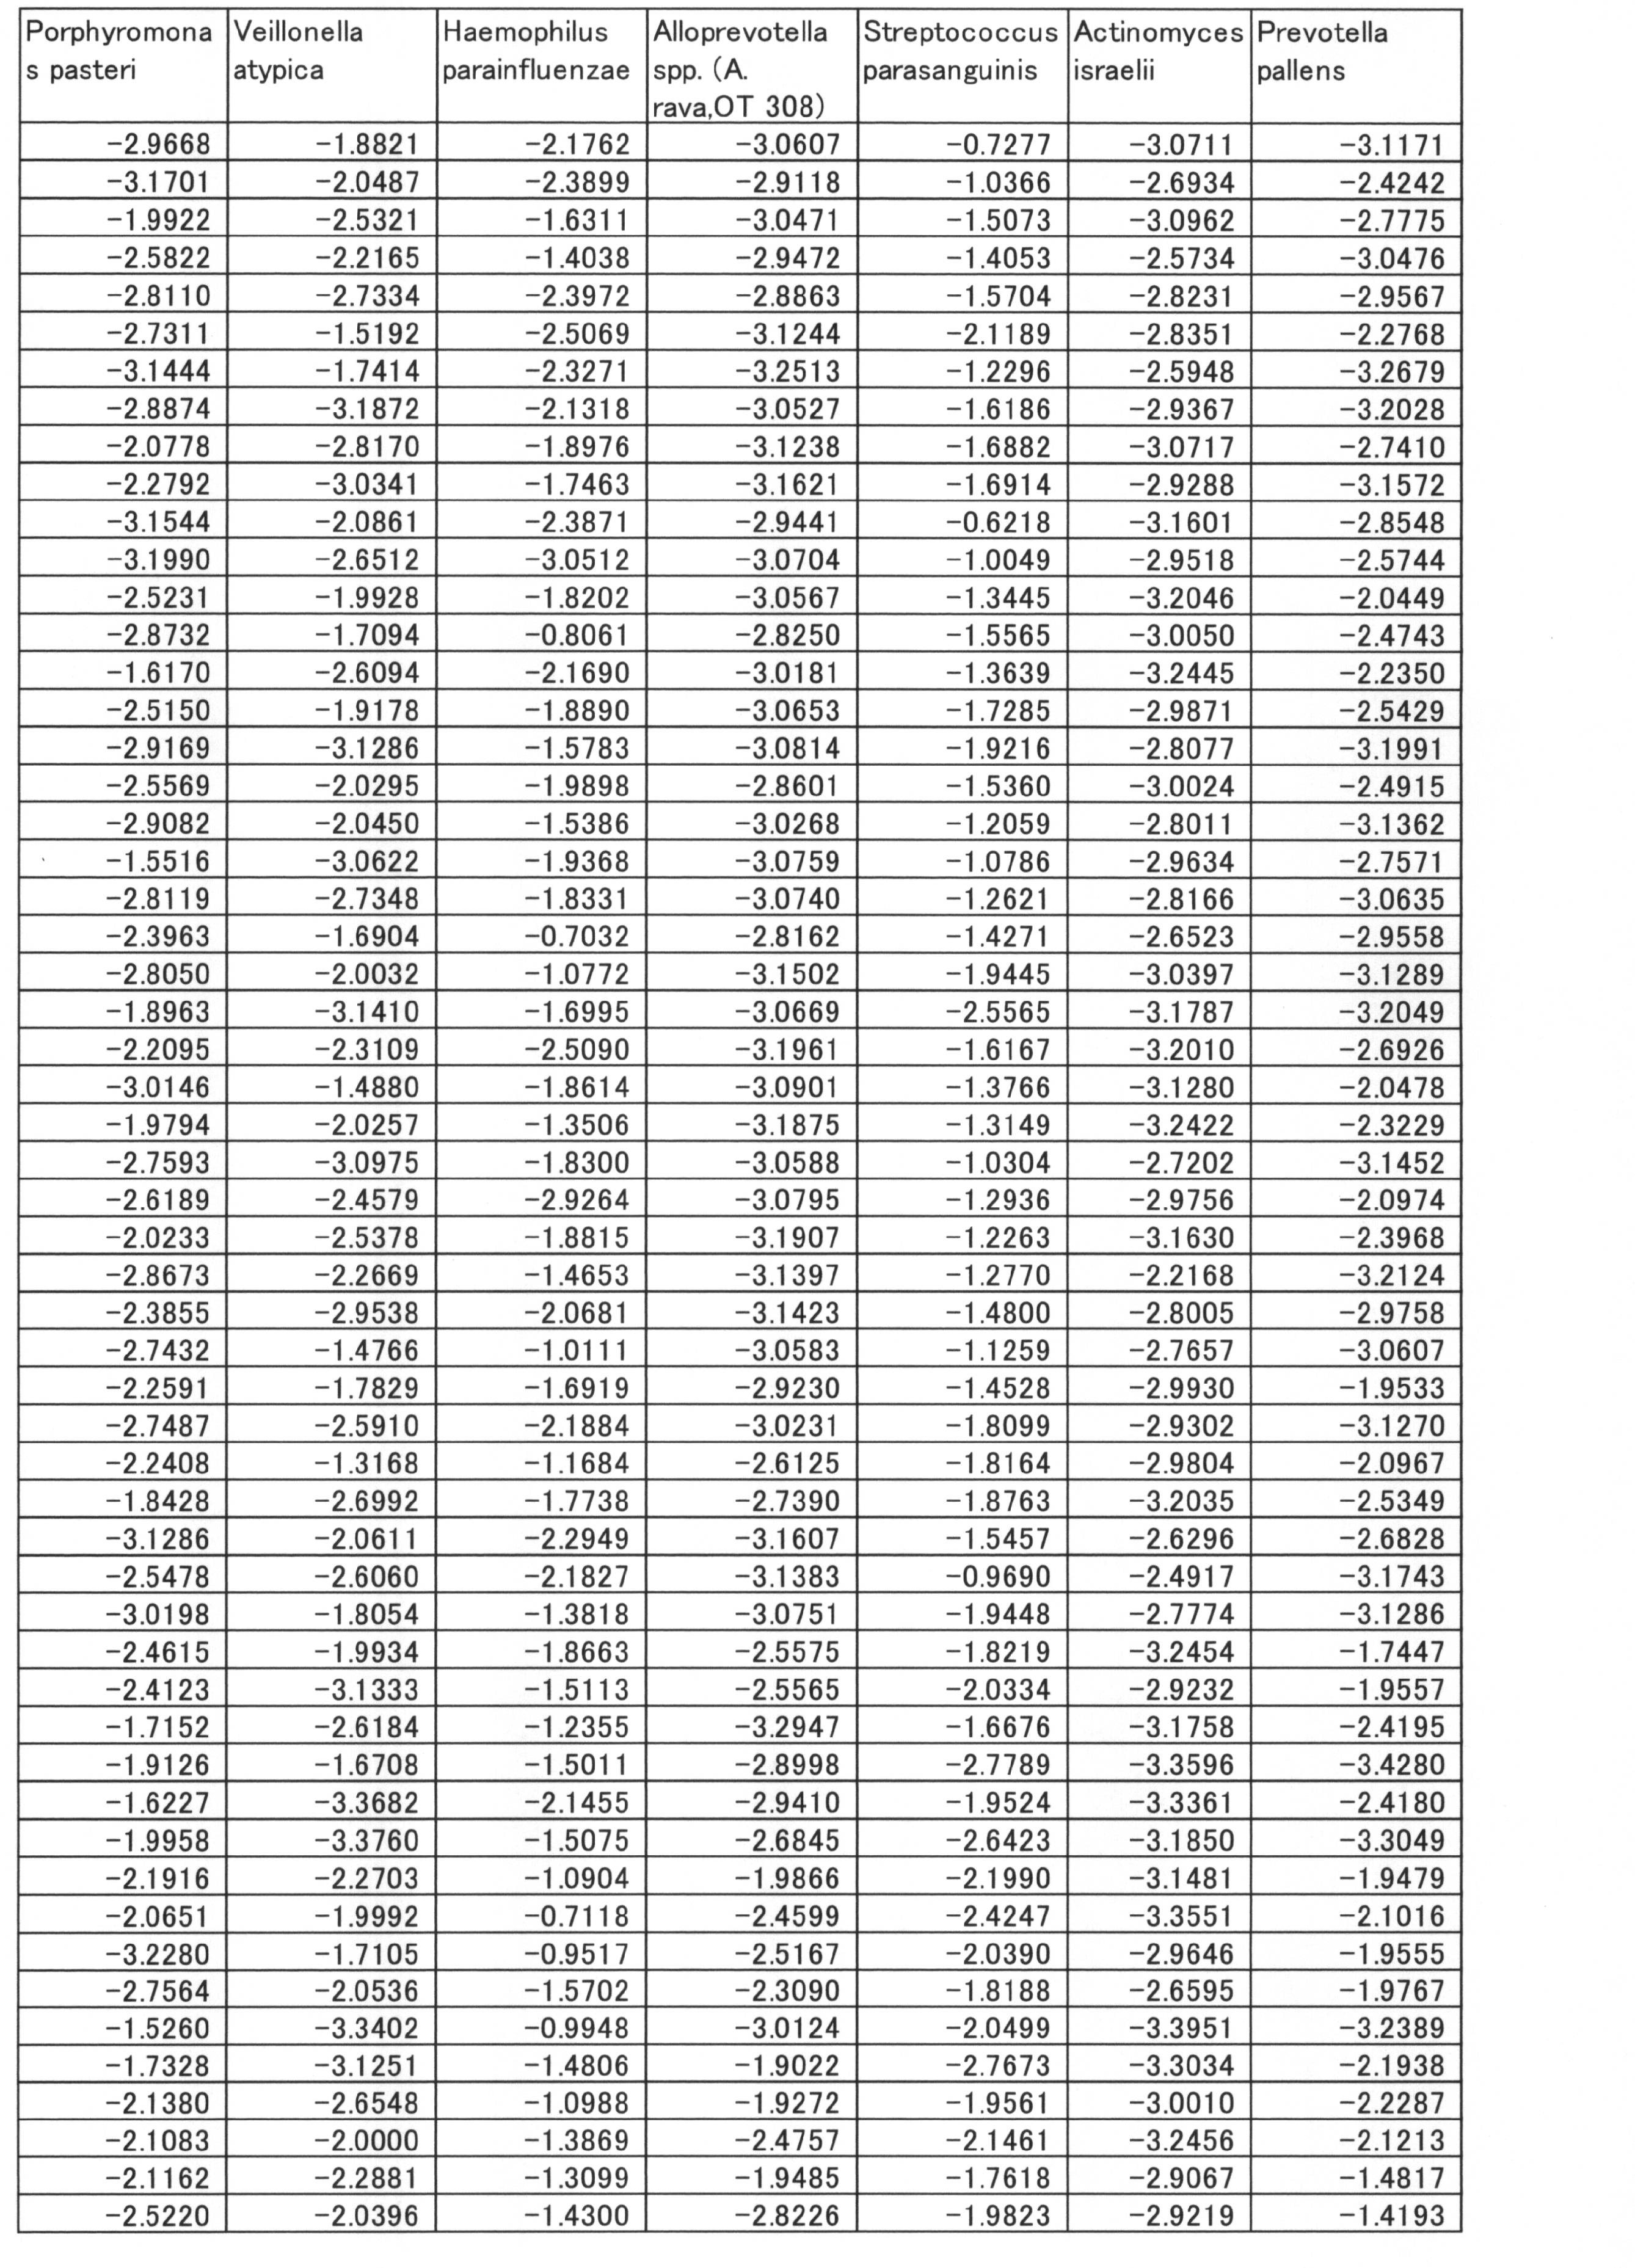


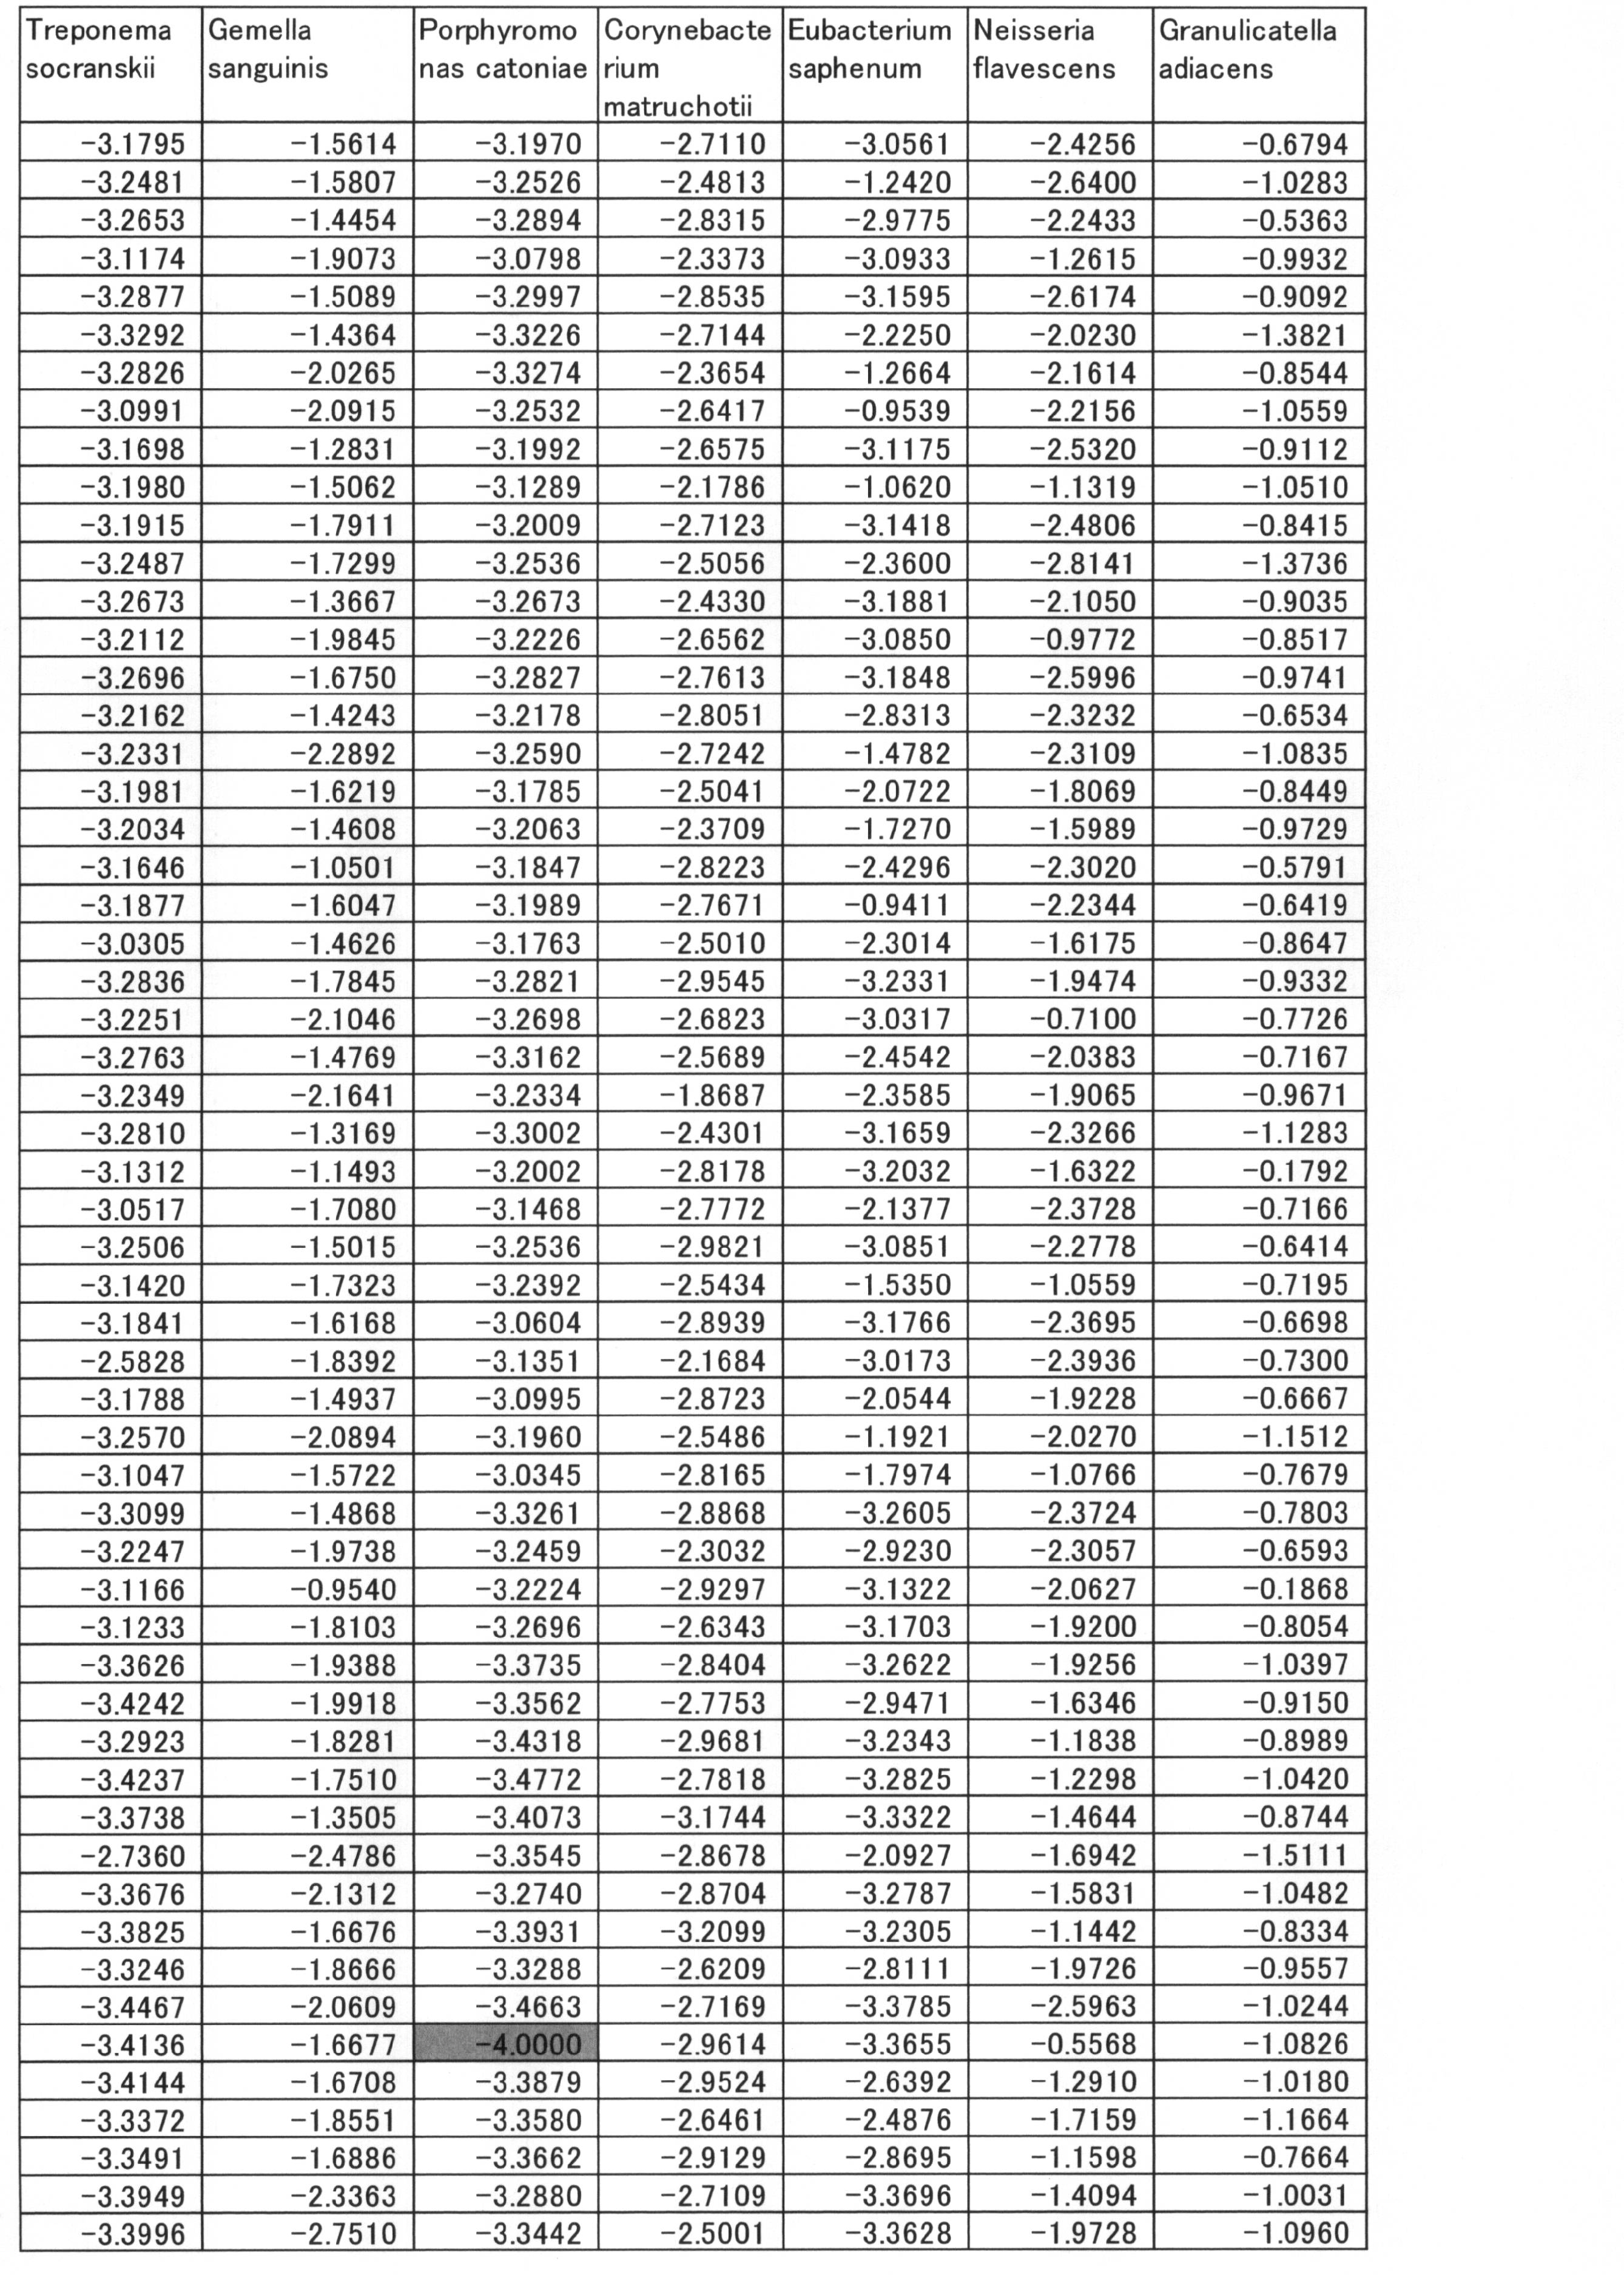

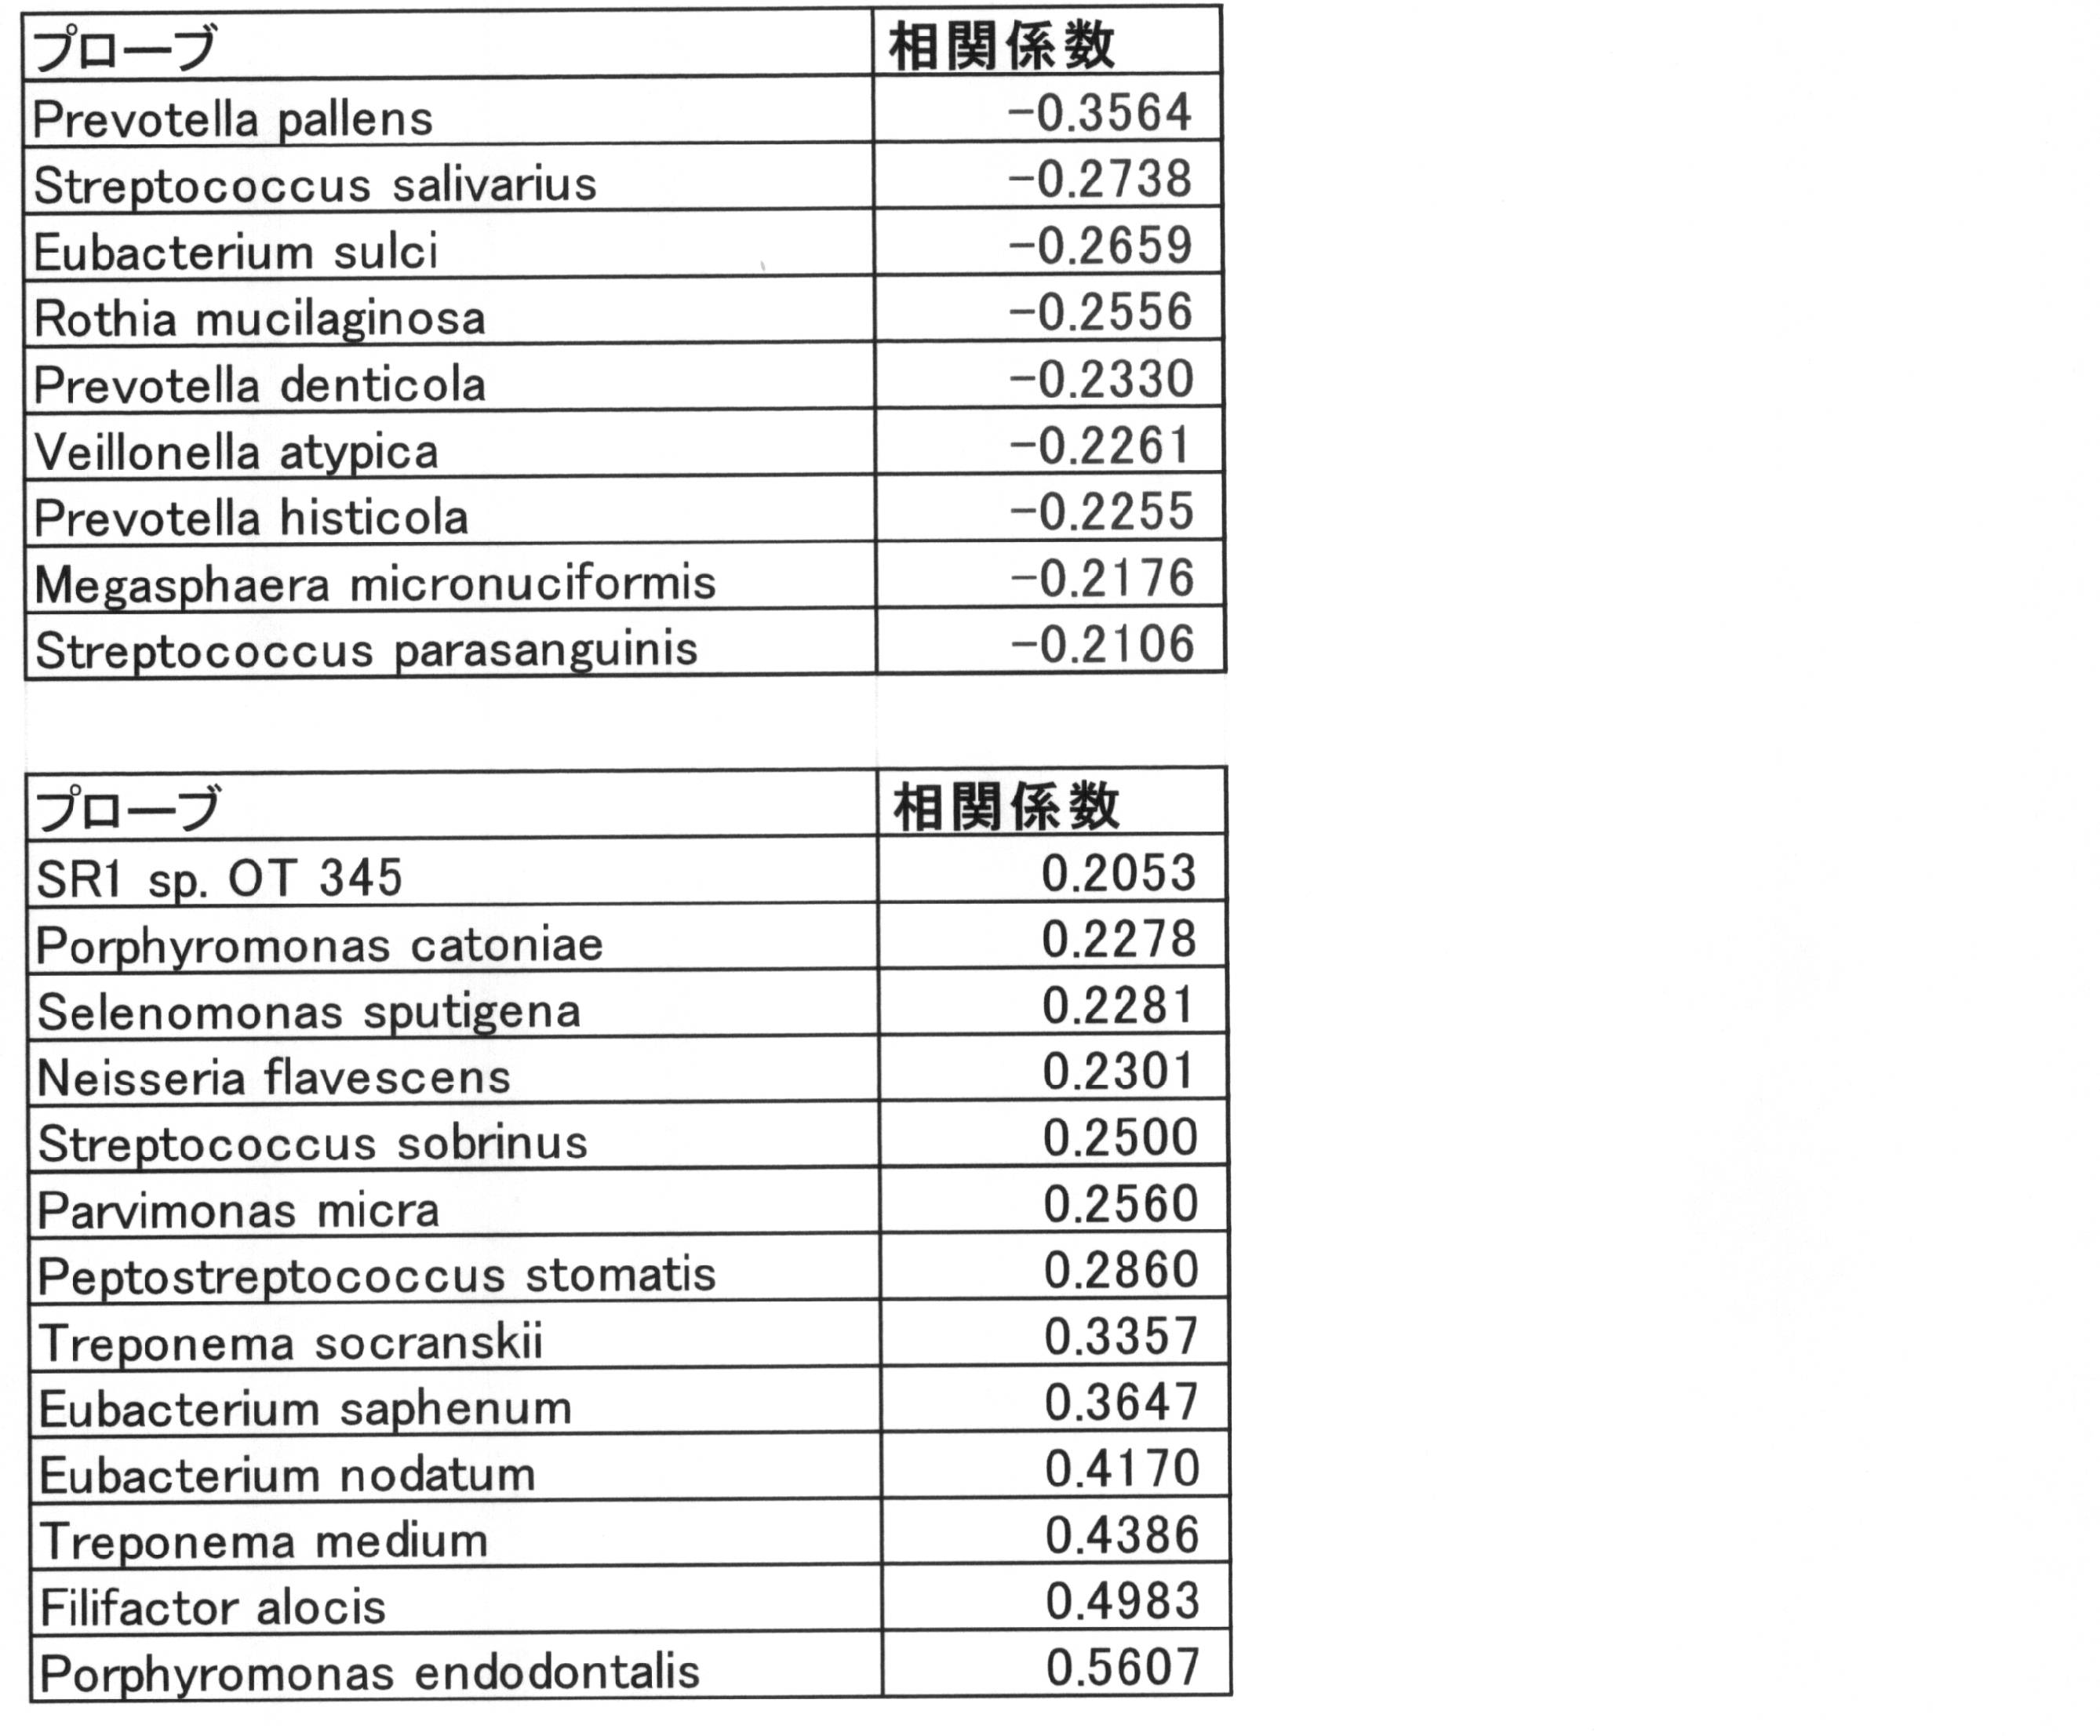
の13菌種とした。
res1 <- lm(PISA~.,data=data01)
(PISAを目的変数として、22種類の細菌を説明変数として、56サンプルのデータで重回帰分析を実施するコマンド)
Claims (6)
- 唾液中の2種以上の細菌の細菌量を検出し、得られた検出結果を指標として歯周ポケット炎症面積を推定する方法であって、検出される細菌は、
該細菌の細菌量と歯周ポケット炎症面積とが正の相関関係を示す細菌と、
該細菌の細菌量と歯周ポケット炎症面積とが負の相関関係を示す細菌とを含む、方法。 - 前記歯周ポケット炎症面積がPISA、又はCAPRSの値で表されるものである、請求項1に記載の方法。
- 正の相関関係を示す細菌が、Treponema denticola、Tannerella forsythia、Fusobacterium nucleatum subsp. animalis、Porphyromonas gingivalis、Campylobacter rectus、Fusobacterium nucleatum subsp. nucleatum、Selenomonas noxia、Veillonella parvula、Streptococcus gordonii、Fusobacterium nucleatum subsp. vincentii、Streptococcus intermedius、Capnocytophaga ochracea、Capnocytophaga sputigena、Aggregatibacter actinomycetemcomitans、Fusobacterium nucleatum subsp. polymorphum、Fusobacterium periodonticum、SR1 sp. OT 345、Porphyromonas catoniae、Selenomonas sputigena、Neisseria flavescens、Streptococcus sobrinus、Parvimonas micra、Peptostreptococcus stomatis、Treponema socranskii、Eubacterium saphenum、Eubacterium nodatum、Treponema medium、Filifactor alocis、及びPorphyromonas endodontalisからなる群から選ばれる少なくとも1種である、請求項1に記載の方法。
- 負の相関関係を示す細菌が、Streptococcus mutans、Actinomyces odontolyticus、Streptococcus mitis bv 2、Streptococcus mitis、Campylobacter concisus、Capnocytophaga gingivalis、Prevotella pallens、Streptococcus salivarius、Eubacterium sulci、Rothia mucilaginosa、Prevotella denticola、Veillonella atypica、Prevotella histicola、Megasphaera micronuciformis、及びStreptococcus parasanguinisからなる群から選ばれる少なくとも1種である、請求項1に記載の方法。
- 以下の(1)~(4)工程を有する、請求項1に記載の方法。
(1)歯周ポケット炎症面積が既知の被験者の唾液サンプルから、唾液中の各種細菌の細菌量を検出する工程
(2)当該各種細菌の細菌量について、菌ごとに固有の歯周ポケット炎症面積との相関係数を求め、各種細菌の細菌量と歯周ポケット炎症面積との関係式を構築して予測モデルを作成する工程
(3)歯周ポケット炎症面積が未知の被験者の唾液サンプルから、唾液中の各種細菌の細菌量を検出する工程
(4)(3)で得られた各種細菌量を(2)で得られた関係式に入れて歯周ポケット炎症面積を推定する工程 - 前記予測モデルの作成方法が、線形回帰、回帰木、モデル木、ニューラルネットワーク、サポートベクターマシン、バギング、ブースティング、ランダムフォレストの機械学習アルゴリズムから選ばれる1種を使用する方法である、請求項5に記載の方法。
Priority Applications (7)
| Application Number | Priority Date | Filing Date | Title |
|---|---|---|---|
| BR112020008566-9A BR112020008566A2 (pt) | 2017-11-02 | 2018-11-02 | método para estimar área de inflamação de bolsas periodontais |
| CA3084010A CA3084010A1 (en) | 2017-11-02 | 2018-11-02 | Method for estimating periodontal pocket inflammation area |
| EP18872517.0A EP3705583A4 (en) | 2017-11-02 | 2018-11-02 | METHOD OF EVALUATING THE INFLAMMATION AREA OF GENTLE VEAL POCKETS |
| AU2018361590A AU2018361590A1 (en) | 2017-11-02 | 2018-11-02 | Method for estimating periodontal pocket inflammation area |
| CN201880084885.4A CN111542617B (zh) | 2017-11-02 | 2018-11-02 | 牙周袋炎症面积的推定方法 |
| JP2019550508A JP7224297B2 (ja) | 2017-11-02 | 2018-11-02 | 歯周ポケット炎症面積の推定方法 |
| US16/760,199 US20210164028A1 (en) | 2017-11-02 | 2018-11-02 | Method for estimating inflammation area of periodontal pockets |
Applications Claiming Priority (2)
| Application Number | Priority Date | Filing Date | Title |
|---|---|---|---|
| JP2017212403 | 2017-11-02 | ||
| JP2017-212403 | 2017-11-02 |
Publications (1)
| Publication Number | Publication Date |
|---|---|
| WO2019088271A1 true WO2019088271A1 (ja) | 2019-05-09 |
Family
ID=66332003
Family Applications (1)
| Application Number | Title | Priority Date | Filing Date |
|---|---|---|---|
| PCT/JP2018/040916 WO2019088271A1 (ja) | 2017-11-02 | 2018-11-02 | 歯周ポケット炎症面積の推定方法 |
Country Status (8)
| Country | Link |
|---|---|
| US (1) | US20210164028A1 (ja) |
| EP (1) | EP3705583A4 (ja) |
| JP (1) | JP7224297B2 (ja) |
| CN (1) | CN111542617B (ja) |
| AU (1) | AU2018361590A1 (ja) |
| BR (1) | BR112020008566A2 (ja) |
| CA (1) | CA3084010A1 (ja) |
| WO (1) | WO2019088271A1 (ja) |
Cited By (2)
| Publication number | Priority date | Publication date | Assignee | Title |
|---|---|---|---|---|
| JP2021009040A (ja) * | 2019-06-28 | 2021-01-28 | サンスター スイス エスエー | 歯周病進行リスク測定方法及びキット |
| JP2021129531A (ja) * | 2020-02-20 | 2021-09-09 | 三井化学株式会社 | 歯周病検査方法、歯周病検査システム、歯周病検査キット、機械学習装置、及びデータ構造 |
Families Citing this family (2)
| Publication number | Priority date | Publication date | Assignee | Title |
|---|---|---|---|---|
| WO2023133084A1 (en) * | 2022-01-07 | 2023-07-13 | CellectGen, Inc. | System and methods for performing saliva-based diagnostic screenings |
| CN116994070B (zh) * | 2023-09-25 | 2023-12-01 | 四川大学 | 基于可度量子空间动态分类器的牙齿图像处理方法及设备 |
Citations (12)
| Publication number | Priority date | Publication date | Assignee | Title |
|---|---|---|---|---|
| JPS4917815B1 (ja) | 1970-11-17 | 1974-05-04 | ||
| JPS51882B1 (ja) | 1970-12-30 | 1976-01-12 | ||
| JPH11108928A (ja) | 1997-10-01 | 1999-04-23 | Dainakomu:Kk | 生体高分子配列シートの製造方法 |
| JP2001133453A (ja) | 1999-08-26 | 2001-05-18 | Mitsubishi Rayon Co Ltd | 生体高分子配列薄片の製造方法 |
| JP2004051536A (ja) | 2002-07-19 | 2004-02-19 | Univ Nihon | 歯周病疾患マーカー蛋白質及びそれを利用した歯周病診断方法 |
| JP2004163211A (ja) | 2002-11-12 | 2004-06-10 | Mitsubishi Rayon Co Ltd | 中空繊維へのゲル充填方法、ゲル充填中空繊維及びそれを用いた生体関連物質マイクロアレイ |
| JP2007074950A (ja) | 2005-09-13 | 2007-03-29 | Mitsubishi Rayon Co Ltd | メチル化dna及び/又は非メチル化dnaの検出方法 |
| US20070269813A1 (en) * | 2005-11-03 | 2007-11-22 | Dewhirst Floyd E | Methods and arrays for identifying human microflora |
| JP5869323B2 (ja) | 2011-12-01 | 2016-02-24 | 花王株式会社 | 歯周病マーカー |
| JP2017023093A (ja) * | 2015-07-27 | 2017-02-02 | 三菱レイヨン株式会社 | 歯周病及び齲蝕のリスクの判定方法 |
| JP2017085944A (ja) * | 2015-11-06 | 2017-05-25 | ライオン商事株式会社 | イヌの歯周病の評価方法 |
| WO2018012011A1 (ja) * | 2016-07-11 | 2018-01-18 | 三菱ケミカル株式会社 | 口腔内検査方法 |
Family Cites Families (2)
| Publication number | Priority date | Publication date | Assignee | Title |
|---|---|---|---|---|
| JP5683804B2 (ja) * | 2009-11-26 | 2015-03-11 | 花王株式会社 | 歯周炎モデル作製方法及び歯周炎モデル非ヒト動物 |
| US20170211131A1 (en) * | 2015-11-02 | 2017-07-27 | General Biologicals Corporation | Method for evaluating oral health |
-
2018
- 2018-11-02 JP JP2019550508A patent/JP7224297B2/ja active Active
- 2018-11-02 CN CN201880084885.4A patent/CN111542617B/zh active Active
- 2018-11-02 EP EP18872517.0A patent/EP3705583A4/en active Pending
- 2018-11-02 WO PCT/JP2018/040916 patent/WO2019088271A1/ja unknown
- 2018-11-02 AU AU2018361590A patent/AU2018361590A1/en active Pending
- 2018-11-02 US US16/760,199 patent/US20210164028A1/en active Pending
- 2018-11-02 CA CA3084010A patent/CA3084010A1/en active Pending
- 2018-11-02 BR BR112020008566-9A patent/BR112020008566A2/pt unknown
Patent Citations (12)
| Publication number | Priority date | Publication date | Assignee | Title |
|---|---|---|---|---|
| JPS4917815B1 (ja) | 1970-11-17 | 1974-05-04 | ||
| JPS51882B1 (ja) | 1970-12-30 | 1976-01-12 | ||
| JPH11108928A (ja) | 1997-10-01 | 1999-04-23 | Dainakomu:Kk | 生体高分子配列シートの製造方法 |
| JP2001133453A (ja) | 1999-08-26 | 2001-05-18 | Mitsubishi Rayon Co Ltd | 生体高分子配列薄片の製造方法 |
| JP2004051536A (ja) | 2002-07-19 | 2004-02-19 | Univ Nihon | 歯周病疾患マーカー蛋白質及びそれを利用した歯周病診断方法 |
| JP2004163211A (ja) | 2002-11-12 | 2004-06-10 | Mitsubishi Rayon Co Ltd | 中空繊維へのゲル充填方法、ゲル充填中空繊維及びそれを用いた生体関連物質マイクロアレイ |
| JP2007074950A (ja) | 2005-09-13 | 2007-03-29 | Mitsubishi Rayon Co Ltd | メチル化dna及び/又は非メチル化dnaの検出方法 |
| US20070269813A1 (en) * | 2005-11-03 | 2007-11-22 | Dewhirst Floyd E | Methods and arrays for identifying human microflora |
| JP5869323B2 (ja) | 2011-12-01 | 2016-02-24 | 花王株式会社 | 歯周病マーカー |
| JP2017023093A (ja) * | 2015-07-27 | 2017-02-02 | 三菱レイヨン株式会社 | 歯周病及び齲蝕のリスクの判定方法 |
| JP2017085944A (ja) * | 2015-11-06 | 2017-05-25 | ライオン商事株式会社 | イヌの歯周病の評価方法 |
| WO2018012011A1 (ja) * | 2016-07-11 | 2018-01-18 | 三菱ケミカル株式会社 | 口腔内検査方法 |
Non-Patent Citations (11)
| Title |
|---|
| "Clinical Significance of Periodontal Pocket Inflammation Area Evaluation Method as Systemic Disease-Related Test Marker for Periodontal Disease (in Japanese", JOURNAL OF JAPANESE SOCIETY FOR EVIDENCE AND THE DENTAL PROFESSIONAL: JJSEDP, vol. 1, 2009, pages 7 - 12 |
| "Current Protocols in Molecular Biology", 1987, JOHN WILEY & SONS |
| "Molecular Cloning, A Laboratory Manual", 2012, COLD SPRING HARBOR PRESS |
| "Periodontal inflamed surface area: quantifying inflammatory burden", J CLIN PERIODONTOL., vol. 35, no. 8, August 2008 (2008-08-01), pages 668 - 73 |
| MIKIBE, MASATO: "Clinical significance of periodontal pocket area assessment method as a systemic disease", JOURNAL OF JAPANESE SOCIETY OF ORAL EXAMINATION, vol. 1, 2009, pages 7 - 12, XP009520769, ISSN: 1883-3888 * |
| NESSE, W. ET AL.: "Periodontal inflamed surface area: quantifying inflammatory burden", J. CLIN. PERIODONTOL ., vol. 35, 2008, pages 668 - 673, XP55612985 * |
| NESSE, W.ABBAS, F.VAN DER PLOEG, I.SPIJKERVET, F. K.DIJKSTRA, P.U.VISSINK, A.: "Periodontal inflamed surface area: quantifying inflammatory burden", JOURNAL OF CLINICAL PERIODONTOLOGY, vol. 35, 2008, pages 668 - 673, XP055612985, DOI: 10.1111/j.1600-051X.2008.01249.x |
| PARK, SHIN-YOUNG ET AL.: "Periodontal inflamed surface area as a novel numerical variable describing periodontal conditions", J. PERIODONTAL IMPLANT SCI., vol. 47, 30 October 2017 (2017-10-30), pages 328 - 338, XP55612988 * |
| SCIENCE, vol. 251, 1991, pages 767 - 773 |
| SCIENCE, vol. 270, 1995, pages 467 - 470 |
| See also references of EP3705583A4 |
Cited By (4)
| Publication number | Priority date | Publication date | Assignee | Title |
|---|---|---|---|---|
| JP2021009040A (ja) * | 2019-06-28 | 2021-01-28 | サンスター スイス エスエー | 歯周病進行リスク測定方法及びキット |
| JP7271341B2 (ja) | 2019-06-28 | 2023-05-11 | サンスター スイス エスエー | 歯周病進行リスク測定方法及びキット |
| JP2021129531A (ja) * | 2020-02-20 | 2021-09-09 | 三井化学株式会社 | 歯周病検査方法、歯周病検査システム、歯周病検査キット、機械学習装置、及びデータ構造 |
| JP7527807B2 (ja) | 2020-02-20 | 2024-08-05 | 三井化学株式会社 | 歯周病検査方法、歯周病検査システム、歯周病検査キット、機械学習装置、及びデータ構造 |
Also Published As
| Publication number | Publication date |
|---|---|
| CN111542617A (zh) | 2020-08-14 |
| CA3084010A1 (en) | 2019-05-09 |
| AU2018361590A1 (en) | 2020-06-18 |
| JP7224297B2 (ja) | 2023-02-17 |
| US20210164028A1 (en) | 2021-06-03 |
| JPWO2019088271A1 (ja) | 2020-11-26 |
| CN111542617B (zh) | 2024-05-28 |
| EP3705583A4 (en) | 2021-01-20 |
| EP3705583A1 (en) | 2020-09-09 |
| BR112020008566A2 (pt) | 2020-10-06 |
Similar Documents
| Publication | Publication Date | Title |
|---|---|---|
| JP7122337B2 (ja) | 口腔内検査方法 | |
| WO2019088271A1 (ja) | 歯周ポケット炎症面積の推定方法 | |
| KR101706070B1 (ko) | 멀티플렉스 실시간 pcr을 이용한 다수의 구강질환 원인 세균의 동시 검출용 조성물 및 이를 이용한 검출 방법 | |
| US20070269813A1 (en) | Methods and arrays for identifying human microflora | |
| JP2017023093A (ja) | 歯周病及び齲蝕のリスクの判定方法 | |
| CN108690881A (zh) | 用于诊断皮肤癣菌病的测定法 | |
| JP7307683B2 (ja) | 臨床的指標と関連性のある細菌群の情報を利用した口腔内検査方法 | |
| JP2021010343A (ja) | 口腔内細菌による健康状態の予測方法 | |
| US11732310B2 (en) | DNA chip for detecting dental caries bacteria | |
| KR20220141658A (ko) | 피부색 판단용 유전자 다형성 마커 및 이의 용도 | |
| KR102432475B1 (ko) | 형광표지법 기반 병원균 신속 검출용 조성물, 이를 포함하는 키트 및 검출방법 | |
| US20130005593A1 (en) | RNA-Oligonucleotide Quantification Technique for the Enumeration of Uncultivated Bacterial Species | |
| US20230265527A1 (en) | Polynucleotide, polynucleotide set, method for detecting porphyromonas gingivalis, method for assessing periodontal disease susceptibility, porphyromonas gingivalis detection kit, and periodontal disease susceptibility assessment kit | |
| KR101497977B1 (ko) | 총세균 검출용 dna 탐침자 | |
| Orrù et al. | Clinical Practice & Epidemiology in Mental Health | |
| KR20220141659A (ko) | 피부색 판단용 유전자 다형성 마커 및 이의 용도 |
Legal Events
| Date | Code | Title | Description |
|---|---|---|---|
| 121 | Ep: the epo has been informed by wipo that ep was designated in this application |
Ref document number: 18872517 Country of ref document: EP Kind code of ref document: A1 |
|
| ENP | Entry into the national phase |
Ref document number: 2019550508 Country of ref document: JP Kind code of ref document: A |
|
| NENP | Non-entry into the national phase |
Ref country code: DE |
|
| ENP | Entry into the national phase |
Ref document number: 3084010 Country of ref document: CA |
|
| ENP | Entry into the national phase |
Ref document number: 2018872517 Country of ref document: EP Effective date: 20200602 |
|
| ENP | Entry into the national phase |
Ref document number: 2018361590 Country of ref document: AU Date of ref document: 20181102 Kind code of ref document: A |
|
| REG | Reference to national code |
Ref country code: BR Ref legal event code: B01A Ref document number: 112020008566 Country of ref document: BR |
|
| ENP | Entry into the national phase |
Ref document number: 112020008566 Country of ref document: BR Kind code of ref document: A2 Effective date: 20200429 |