WO2017115443A1 - クロマトグラフ - Google Patents
クロマトグラフ Download PDFInfo
- Publication number
- WO2017115443A1 WO2017115443A1 PCT/JP2015/086570 JP2015086570W WO2017115443A1 WO 2017115443 A1 WO2017115443 A1 WO 2017115443A1 JP 2015086570 W JP2015086570 W JP 2015086570W WO 2017115443 A1 WO2017115443 A1 WO 2017115443A1
- Authority
- WO
- WIPO (PCT)
- Prior art keywords
- display
- chromatogram
- graph
- display screen
- graph area
- Prior art date
- Legal status (The legal status is an assumption and is not a legal conclusion. Google has not performed a legal analysis and makes no representation as to the accuracy of the status listed.)
- Ceased
Links
Images





Classifications
-
- G—PHYSICS
- G01—MEASURING; TESTING
- G01N—INVESTIGATING OR ANALYSING MATERIALS BY DETERMINING THEIR CHEMICAL OR PHYSICAL PROPERTIES
- G01N30/00—Investigating or analysing materials by separation into components using adsorption, absorption or similar phenomena or using ion-exchange, e.g. chromatography or field flow fractionation
- G01N30/02—Column chromatography
- G01N30/86—Signal analysis
- G01N30/8651—Recording, data aquisition, archiving and storage
-
- G—PHYSICS
- G06—COMPUTING OR CALCULATING; COUNTING
- G06F—ELECTRIC DIGITAL DATA PROCESSING
- G06F3/00—Input arrangements for transferring data to be processed into a form capable of being handled by the computer; Output arrangements for transferring data from processing unit to output unit, e.g. interface arrangements
- G06F3/01—Input arrangements or combined input and output arrangements for interaction between user and computer
- G06F3/048—Interaction techniques based on graphical user interfaces [GUI]
- G06F3/0487—Interaction techniques based on graphical user interfaces [GUI] using specific features provided by the input device, e.g. functions controlled by the rotation of a mouse with dual sensing arrangements, or of the nature of the input device, e.g. tap gestures based on pressure sensed by a digitiser
- G06F3/0488—Interaction techniques based on graphical user interfaces [GUI] using specific features provided by the input device, e.g. functions controlled by the rotation of a mouse with dual sensing arrangements, or of the nature of the input device, e.g. tap gestures based on pressure sensed by a digitiser using a touch-screen or digitiser, e.g. input of commands through traced gestures
-
- G—PHYSICS
- G01—MEASURING; TESTING
- G01N—INVESTIGATING OR ANALYSING MATERIALS BY DETERMINING THEIR CHEMICAL OR PHYSICAL PROPERTIES
- G01N30/00—Investigating or analysing materials by separation into components using adsorption, absorption or similar phenomena or using ion-exchange, e.g. chromatography or field flow fractionation
- G01N30/02—Column chromatography
- G01N30/86—Signal analysis
- G01N30/8658—Optimising operation parameters
-
- G—PHYSICS
- G06—COMPUTING OR CALCULATING; COUNTING
- G06F—ELECTRIC DIGITAL DATA PROCESSING
- G06F3/00—Input arrangements for transferring data to be processed into a form capable of being handled by the computer; Output arrangements for transferring data from processing unit to output unit, e.g. interface arrangements
- G06F3/01—Input arrangements or combined input and output arrangements for interaction between user and computer
- G06F3/048—Interaction techniques based on graphical user interfaces [GUI]
- G06F3/0484—Interaction techniques based on graphical user interfaces [GUI] for the control of specific functions or operations, e.g. selecting or manipulating an object, an image or a displayed text element, setting a parameter value or selecting a range
- G06F3/04845—Interaction techniques based on graphical user interfaces [GUI] for the control of specific functions or operations, e.g. selecting or manipulating an object, an image or a displayed text element, setting a parameter value or selecting a range for image manipulation, e.g. dragging, rotation, expansion or change of colour
Definitions
- the present invention relates to a chromatograph that displays a chromatogram obtained on the basis of a detection signal from a detector on a display screen.
- a data processing device composed of a personal computer is connected to the chromatograph.
- a detection signal from a detector provided in the chromatograph is input to the data processing device, and a chromatogram is obtained by the data processing device performing an operation based on the detection signal (for example, Patent Document 1 below). reference).
- the chromatogram thus obtained is displayed on a display provided separately from the chromatograph.
- the display has a relatively large display screen so that the operator can easily confirm the data.
- the operator cannot confirm the data unless the data processing apparatus is activated. Therefore, it is necessary to always start the data processing device during analysis, and when the analysis time is long, there is a problem that power consumption increases. In addition, it may be more convenient for an operator who works on a chromatograph to check data on the main body of the chromatograph.
- the present invention has been made in view of the above circumstances, and provides a chromatograph capable of easily performing detailed confirmation work of a chromatogram displayed based on a detection signal from a detector in a main body.
- the chromatograph according to the present invention includes a main body, a detector, a display, and a display processing unit.
- the detector is provided in the main body, detects a sample, and outputs a detection signal.
- the display is provided on the main body and has a touch panel display screen.
- the display processing unit displays a chromatogram in a graph area on the display screen based on a detection signal from the detector, and in the graph area based on a touch operation on the graph area on the display screen. Change the display.
- the operator can change the display on the display screen while changing the display in the graph area on the display screen only by performing a touch operation on the touch panel type display screen provided on the main body. You can check the graph area later. Therefore, detailed confirmation work of the chromatogram displayed in the graph area can be easily performed in the main body.
- the display processing unit may enlarge or reduce the chromatogram displayed in the graph area based on a touch operation on the graph area on the display screen.
- the display processing unit may display a chromatogram displayed in the graph area and another chromatogram on the basis of a touch operation on the graph area on the display screen. . According to such a configuration, the main body can easily compare the chromatogram displayed in the graph area with another chromatogram.
- the display processing unit displays a chromatogram in the graph area on the display screen while changing in real time based on a detection signal from the detector, and the graph area on the display screen.
- the change in the chromatogram may be stopped based on the touch operation on and the display in the graph area may be changed based on the subsequent touch operation on the graph area.
- the chromatogram changing in the graph area can be displayed in real time, and by touching the graph area, the change in the chromatogram is stopped and the display in the graph area is displayed. Can change.
- the stopped chromatogram can be prevented from being displayed for a long time in the graph area. Further, since it is not necessary to perform an operation for resuming the change in the chromatogram, the confirmation work is further facilitated.
- the display in the graph area can be changed only by touching the display screen. Further, the changed graph area can be confirmed on the display screen. Therefore, detailed confirmation of the chromatogram displayed based on the detection signal from the detector can be easily performed on the main body.
- a display mode of a display screen in the state of comparison mode is a schematic diagram showing a state immediately after the display screen enters comparison mode. It is an example of the display mode of the display screen of the state in comparison mode, and is a schematic diagram showing a state in which the chromatogram at the previous analysis is superimposed and displayed on the chromatogram being analyzed in the first graph region. It is an example of a display mode of a display screen of a state of comparison mode, and is a schematic diagram showing a state where a part of a chromatogram is selected in a second graph region. Schematic diagram showing an example of the display mode of the comparison mode state display screen, showing a state in which a portion of the chromatogram at the previous analysis is displayed superimposed on the chromatogram being analyzed in the first graph region. It is.
- FIG. 1 is a schematic diagram showing a configuration example of a gas chromatograph according to an embodiment of the present invention.
- This gas chromatograph is for performing an analysis by supplying a sample gas together with a carrier gas into the column 1.
- the column oven 2 the sample introduction unit 3, the detector 4, and these A hollow main body 10 or the like is provided.
- the column 1 is composed of, for example, a capillary column.
- the column 1 is accommodated in a column oven 2 together with a heater and a fan (both not shown).
- the column oven 2 is for heating the column 1 and appropriately drives a heater and a fan during analysis.
- the sample introduction unit 3 is for introducing a carrier gas and a sample gas into the column 1, and a sample vaporizing chamber (not shown) is formed therein. A liquid sample is injected into the sample vaporizing chamber, and the sample vaporized in the sample vaporizing chamber is introduced into the column 1 together with the carrier gas. Further, a gas supply channel 5 and a split channel 6 communicate with the sample vaporizing chamber.
- the gas supply channel 5 is a channel for supplying a carrier gas into the sample vaporization chamber of the sample introduction unit 3.
- the split flow path 6 is configured so that a part of the gas in the sample vaporization chamber (mixed gas of the carrier gas and the sample gas) is externally supplied at a predetermined split ratio. This is a flow path for discharging the water.
- the detector 4 is composed of various detectors such as a flame ionization detector (FID).
- FID flame ionization detector
- the sample to be analyzed is injected into the sample introduction unit 3.
- the sample is vaporized in the sample vaporization chamber.
- a carrier gas is supplied to the sample vaporization chamber of the sample introduction unit 3 through the gas supply channel 5.
- the sample vaporized in the sample vaporization chamber is introduced into the column 1 together with the carrier gas.
- Each sample component contained in the sample is separated in the process of passing through the column 1 and sequentially introduced into the detector 4.
- the detector 4 sequentially detects each sample component contained in the carrier gas introduced from the column 1. A chromatogram is generated based on the detection result in the detector 4.
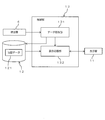
- FIG. 2 is a block diagram showing a specific configuration of the control unit of the gas chromatograph of FIG. 1 and its peripheral members.
- the gas chromatograph includes a display 11, a storage unit 12, and a control unit 13 in addition to the detector 4 described above.
- the display 11 is provided on the main body 1 (see FIG. 1). As will be described in detail later, the display 11 includes a touch panel. That is, in the gas chromatograph, the display 11 is used so that an operator can confirm and input information while performing analysis.
- the storage unit 12 includes, for example, a ROM (Read Only Memory) and a RAM (Random Access Memory).
- the storage unit 12 stores the previous data 121.
- the previous data 121 is chromatogram data generated by a data processing unit 131 described later, and is data generated during the previous analysis.
- the control unit 13 includes, for example, a CPU (Central Processing Unit).
- the control unit 13 can input or output an electrical signal between the detector 4 and the display 11.
- the control unit 13 inputs / outputs data to / from the storage unit 12 as necessary.
- the control unit 13 functions as a data processing unit 131, a display processing unit 132, and the like when the CPU executes a program.
- the data processing unit 131 obtains a chromatogram based on the detection signal from the detector 4.
- the chromatogram data generated by the data processing unit 131 is stored in the storage unit 12 as the previous data 121 so as to rewrite the existing data.
- the display processing unit 132 performs processing for displaying the chromatogram on the display device 11 based on the chromatogram data generated by the data processing unit 131. Further, the display processing unit 13 performs a process of changing the chromatogram displayed on the display unit 11 based on the input signal from the display unit 11 by the operation of the touch panel and the previous data 121 of the storage unit 12.
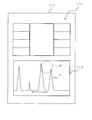
- FIG. 3 is a schematic diagram illustrating an example of a display form of the display screen 111 in the state of the basic screen.
- the display 11 described above includes a touch panel display screen 111.
- the display 11 is provided in the main body 10 (see FIG. 1), and the operator can check the display screen 111 on the main body 10.
- the display device 11 is provided on the front surface of the main body 10 so that an operator can easily operate the display device 11.
- the front surface of the main body 10 is usually provided with a door that can be opened and closed. That is, the display 11 is disposed in a relatively small space on the front surface of the main body 10 so as to secure a space in which a door or the like is disposed.
- the display screen 111 is formed in a substantially rectangular shape.
- the display screen 111 includes an operation display area 112 and a first graph area 113.
- the operation display area 112 is arranged on the upper side in the display screen 111.
- the operation display area 112 is an area for displaying operation states of various components in the gas chromatograph.
- the operation display area 112 displays operation states such as the temperature of the column 1, the temperature and pressure in the sample introduction unit 3, the flow rate of the carrier gas supplied into the sample introduction unit 3, and the temperature of the detector 4.
- the first graph area 113 is arranged on the lower side in the display screen 111.
- the first graph region 113 is a region for displaying the data processing result by the data processing unit 131 as a graph, and specifically, a region for displaying the chromatogram generated by the data processing unit 131 in real time. It is.
- the chromatogram is displayed with time on the horizontal axis and signal intensity on the vertical axis.
- Such a screen configuration of the display screen 111 is a basic screen of the display screen 111.
- the display process part 132 changes the display content of the display screen 111 based on the touch operation to the display screen 111 by an operator so that it may mention later.
- FIG. 4 is a flowchart illustrating an example of processing by the control unit 13. Normally, the basic screen described above is displayed on the display screen 111 of the display 11 as shown in FIG.
- the display processing unit 132 displays the chromatogram in the first graph region 113 in real time (step S101).
- the graph A which is a chromatogram generated by the data processing unit 131, is displayed in the first graph area 113 so as to move from right to left.
- the In the graph A the content displayed on the right end side corresponds to a chromatogram generated in real time. Then, the content displayed on the right end side in the graph A moves to the left as time passes, and is not displayed in the first graph area 113 as time passes.
- the display processing unit 132 first stops the movement of the graph A in the first graph area 113. Then, the display screen 111 is set to the edit mode (step S103). In a state where the display screen 111 is in the edit mode, the display processing unit 132 changes the display content of the first graph area 113 based on a touch operation on the first graph area 113 as described later.
- the display processing unit 132 passes a certain time without performing a touch operation on the first graph area 113 (YES in step S104), and the analysis is not finished yet. If not (NO in step S105), the display screen 111 is returned to the basic screen by restarting the real-time display of the chromatogram in the first graph region 113. And the display process part 132 complete
- the display processing unit 132 selects a comparison mode on the display screen 111 without touching the data processing unit 131 from the state in which the basic screen is displayed on the display screen 111 (NO in step S102).
- the display screen 111 is set to the comparison mode (step S107). In the state where the display screen 111 is in the comparison mode, two regions representing chromatograms are displayed (two screens are displayed), as will be described later.
- the display processing unit 132 is a case where a predetermined touch operation for releasing the comparison mode is performed on the display screen 111 from the state where the display screen 111 is in the comparison mode (YES in step S108), If the analysis is not yet completed (NO in step S105), the chromatogram is returned to the one-screen display, and the real-time display of the chromatogram in the first graph region 113 is resumed, so that the display screen 111 is basically displayed. Return to the screen. Moreover, the display process part 132 complete
- the predetermined touch operation on the display screen 111 is, for example, an operation of touching a button (not shown) displayed on the display screen 111.
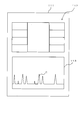
- FIG. 5 is an example of a display mode of the display screen 111 in the edit mode, and is a schematic diagram illustrating an example in which an enlarged screen 114 is displayed.
- FIG. 6 is an example of a display mode of the display screen 111, and is a schematic diagram illustrating an example in which a chromatogram is reduced and displayed.
- the display mode of the display screen 111 in the edit mode state will be described with reference to FIGS. 3, 5, and 6.
- the display processing unit 132 changes the display content of the first graph area 113 as follows based on the touch operation on the first graph area 113 and setting the display screen 111 to the edit mode. To do.
- the display processing unit 132 when the display screen 111 is in the edit mode, is touched to a predetermined part of the first graph region 113 by the operator for a certain period of time (for the first graph region 113).
- a certain period of time for the first graph region 113.
- the enlarged screen 114 is displayed so as to overlap the first graph area 113.
- a certain area of the first graph area 113 centered on a portion touched continuously for a certain time is displayed in an enlarged manner.
- FIG. 5 shows the display screen 111 when the edit mode is entered by continuing to touch the area B shown in FIG. That is, in FIG. 5, the region B shown in FIG. 3 is enlarged and displayed on the enlarged screen 114.
- the display processing unit 132 changes the display content in the enlarged screen 114 based on the touch operation.
- the display processing unit 132 moves the display in the enlarged screen 114 in the sliding direction.
- the display processing unit 132 displays the display on the enlarged screen 114.
- the display processing unit 132 changes the display content of the first graph area 113 as follows based on the touch operation on the first graph area 113 and setting the display screen 111 to the edit mode. To do.
- the display processing unit 132 narrows the touched portion from a state where any two locations in the first graph area 113 are touched by the operator while the display screen 111 is in the edit mode.
- the reduced graph C is displayed in the first graph area 113 as shown in FIG.
- a graph C represents the entire chromatogram generated by the data processing unit 131 until the display screen 111 enters the edit mode.
- the display processing unit 132 expands the touched portion from a state in which any two locations in the first graph area 113 are touched by the operator while the display screen 111 is in the edit mode.
- a slide operation pinch out
- a graph further enlarged from the graph A shown in FIG. 3 is displayed in the first graph region 113.
- the display processing unit 132 ends the editing mode of the display screen 111 when a predetermined time has passed without performing such a touch operation on the first graph region 113. If the analysis has not been completed, the display screen 111 is returned to the basic screen by restarting the real-time display of the chromatogram in the first graph region 113 as shown in FIG.
- FIG. 7 to 10 are schematic diagrams showing examples of display modes on the display screen 111 in the comparison mode. Specifically, FIG. 7 shows a state immediately after the display screen 111 enters the comparison mode.
- FIG. 8 shows a state in which the chromatogram at the time of the previous analysis is displayed superimposed on the chromatogram being analyzed in the first graph region 113.
- FIG. 9 shows a state in which a part of the chromatogram is selected in the second graph region 115.
- FIG. 10 shows a state in which a part of the chromatogram at the previous analysis is overlapped and displayed on the chromatogram being analyzed in the first graph region 113.
- a display mode of the display screen 111 in the comparison mode will be described with reference to FIGS.
- the display processing unit 132 changes the display content of the display screen 111 as follows based on the touch operation on the display screen 111, setting the display screen 111 to the comparison mode.
- the first graph area 113 described above is displayed on the lower side, and the second graph area 115 is displayed on the upper side.
- the graph A that is a chromatogram generated by the data processing unit 131 is displayed so as to move from right to left. That is, in the first graph area 113, the chromatogram is displayed in real time.
- the second graph area 115 is an area for displaying a chromatogram generated during the previous analysis, and displays a graph D corresponding to the previous data 121 stored in the storage unit 12.
- the graph D is displayed so as to move from right to left so as to correspond to the graph A displayed in the first graph area 113. That is, immediately after the display screen 111 enters the comparison mode, two areas representing the chromatogram are displayed on the display screen 111, and the chromatogram is displayed so as to move in each area.
- the worker checks the display screen 111 in this state, and compares the chromatogram generated in real time by the data processing unit 131 with the chromatogram generated during the previous analysis.
- the display processing unit 132 changes the display content based on the touch operation. Specifically, when the operator performs a touch operation on the first graph area 113 or the second graph area 115 in a state where the display screen 111 is in the comparison mode, first, The movement of the graph A in the first graph area 113 and the movement of the graph D in the second graph area 115 are stopped.
- the display processing unit 132 When the operator performs a slide operation (drag) by touching a part of the second graph area 115 and moving the touched part downward, the display processing unit 132, as shown in FIG.
- the graph E is overlaid on the graph A in the first graph region 113.
- the graph E is a graph obtained by copying the graph D displayed in the second graph area 115.
- the graph A that is the chromatogram being analyzed and the graph E that is the chromatogram at the time of the previous analysis are displayed in a state of being associated with the horizontal axis (time axis).
- time axis it is preferable to distinguish the graph A and the graph E from each other by displaying them in different colors.
- the operator evaluates the reproducibility by checking the correspondence between the peak in the chromatogram being analyzed and the peak in the chromatogram at the previous analysis from the first graph region 113 in this state.
- the display processing unit 132 When the operator touches two predetermined areas in the second graph area 115 from the state in which the display screen 111 is in the comparison mode, the display processing unit 132 is touched as shown in FIG. A region F having a time range of two locations is selected. Further, the display processing unit 132 superimposes the graph G on the graph A in the first graph region 113 as shown in FIG.
- the graph G is a graph obtained by selecting and copying the portion of the graph D displayed in the region F in the second graph region 115.
- the graph A that is the chromatogram being analyzed and the graph G that is a part of the chromatogram at the previous analysis are overlapped with the horizontal axis (time axis) associated with each other. Is displayed. At this time, it is preferable that the graph A and the graph G are distinguished from each other by displaying them in different colors.
- the operator evaluates the reproducibility by checking the correspondence between the peak in the chromatogram being analyzed and the peak in the chromatogram at the previous analysis from the first graph region 113 in this state.
- the data processing unit 131 stores the generated chromatogram in the storage unit 12 so as to rewrite the existing previous data 121 as new previous data 121. .
- the display 11 is provided in the main body 10 in the gas chromatograph.
- the display device 11 includes a touch panel display screen 111.
- the display processing unit 132 displays a chromatogram in the first graph region 113 on the display screen 111 based on the detection signal from the detector 4, and based on the touch operation on the first graph region 113, The display in one graph area 113 is changed.
- the operator only performs a touch operation on the touch panel display screen 111 provided in the main body 10, and changes the display screen 111 while changing the display in the first graph area 113. A later first graph region 113 can be confirmed. Therefore, detailed confirmation work of the chromatogram displayed in the first graph area 113 can be easily performed in the main body 10.
- the display processing unit 132 displays the enlarged screen 114 based on a touch operation on the first graph region 113 on the display screen 111.
- the display processing unit 132 reduces and displays the chromatogram displayed in the first graph region 113 based on a touch operation on the first graph region 113 on the display screen 111.
- the main part 10 can easily confirm the details of the portion of the chromatogram displayed in the first graph region 113 by displaying the portion to be noted in an enlarged manner.
- the entire chromatogram can be easily confirmed in the main body 10 by displaying the chromatogram displayed in the first graph region 113 in a reduced size.
- the display processing unit 132 is displayed in the first graph region 113 based on a touch operation on the second graph region 115 on the display screen 111. Overlay the chromatogram from the previous analysis with the current chromatogram.
- the display processing unit 132 performs a touch operation on the first graph area 113 on the display screen 111 from a state in which the display screen 111 becomes the basic screen. Based on this (YES in step S102), the change of the chromatogram is stopped and the display screen 111 is set to the edit mode (step S103). Then, the display in the first graph region 113 is changed based on the touch operation performed on the first graph region 113 on the display screen 111 from the state in which the display screen 111 is in the edit mode.
- the display screen 111 the basic screen, the chromatogram can be displayed in real time. Can be stopped for easy confirmation.
- the display processing unit 132 is in a state where there is no touch operation on the first graph area 113 when the display screen 111 is in the edit mode.
- the time has elapsed YES in step S104
- the analysis has not yet been completed NO in step S105
- the real-time display of the chromatogram in the first graph region 113 is resumed (step S101). Return the screen 111 to the basic screen.
- the stopped chromatogram can be prevented from being displayed in the first graph region 113 for a long time. Further, since it is not necessary to perform an operation for resuming the change in the chromatogram, the confirmation work is further facilitated.
- the chromatograph of the present invention has been described as being applied to a gas chromatograph, but the chromatograph of the present invention may be applied to a liquid chromatograph.
- the display screen 111 when the display screen 111 is in the comparison mode, it has been described that the chromatogram at the time of the previous analysis is displayed in the second graph region 115.
- One chromatogram selected from a plurality of chromatograms generated during past analysis may be displayed.
- a plurality of chromatogram data generated at the time of past analysis is stored in the storage unit 12, and the display processing unit 132 displays in the second graph region 115 when the display screen 111 is in the comparison mode.
- a chromatogram based on one data selected from the plurality of data may be displayed.
- the display change in the graph area has been described as being performed based on a specific touch operation on the graph area.
- the display of may be changed. That is, the touch operation for displaying the chromatogram displayed in the graph area in an enlarged display, a reduced display, or overlapping with another chromatogram is not limited to long press, pinch out, pinch in, and drag.
- the display in the graph area can be changed based on various other touch operations such as an operation (tap) of touching the same position on the display screen twice in succession.
Landscapes
- Engineering & Computer Science (AREA)
- Physics & Mathematics (AREA)
- General Physics & Mathematics (AREA)
- Theoretical Computer Science (AREA)
- General Engineering & Computer Science (AREA)
- Health & Medical Sciences (AREA)
- Life Sciences & Earth Sciences (AREA)
- Chemical & Material Sciences (AREA)
- Analytical Chemistry (AREA)
- Biochemistry (AREA)
- General Health & Medical Sciences (AREA)
- Immunology (AREA)
- Pathology (AREA)
- Human Computer Interaction (AREA)
- Other Investigation Or Analysis Of Materials By Electrical Means (AREA)
Abstract
ガスクロマトグラフは、本体と、検出器4と、表示器11と、表示処理部132とを備えている。表示器11は、本体に設けられている。また、表示器11には、タッチパネル式の表示画面が含まれている。そして、表示処理部132は、検出器4からの検出信号に基づいて、表示画面における第1グラフ領域内にクロマトグラムを表示させるとともに、作業者による第1グラフ領域に対するタッチ操作に基づいて、第1グラフ領域内の表示を変更する。
Description
本発明は、検出器からの検出信号に基づいて得られるクロマトグラムを表示画面に表示させるクロマトグラフに関するものである。
通常、クロマトグラフには、パーソナルコンピュータにより構成されるデータ処理装置が接続されている。データ処理装置には、クロマトグラフに備えられた検出器からの検出信号が入力され、その検出信号に基づいてデータ処理装置が演算を行うことにより、クロマトグラムが得られる(例えば、下記特許文献1参照)。
このようにして得られたクロマトグラムは、クロマトグラフとは別個に設けられた表示器に表示される。表示器は、作業者がデータを確認しやすいように、比較的大きい表示画面を有している。
上記のような従来のクロマトグラフでは、データ処理装置を起動した状態でなければ、作業者がデータを確認することができない。そのため、分析中はデータ処理装置を常時起動させておく必要があり、分析時間が長時間になる場合には、消費電力が大きくなってしまうという不具合が生じる。また、クロマトグラフに対する作業を行う作業者にとっては、クロマトグラフの本体においてデータの確認を行うことができる方が便利な場合もある。
そこで、データ処理するためのデータ処理部、及び、表示器をクロマトグラフの本体に設けることが検討される。しかし、クロマトグラフの本体には、大きな表示画面を有する表示器を設けるだけのスペースを確保することが困難である。そのため、クロマトグラフの本体においてクロマトグラムの詳細を確認したり、複数回の分析結果を比較しながら確認したりすることは困難であった。
本発明は、上記実情に鑑みてなされたものであり、検出器からの検出信号に基づいて表示されるクロマトグラムの詳細な確認作業を本体において容易に行うことができるクロマトグラフを提供する。
(1)本発明に係るクロマトグラフは、本体と、検出器と、表示器と、表示処理部とを備える。前記検出器は、前記本体に設けられ、試料を検出して検出信号を出力する。前記表示器は、前記本体に設けられ、タッチパネル式の表示画面を有する。前記表示処理部は、前記検出器からの検出信号に基づいて、前記表示画面におけるグラフ領域内にクロマトグラムを表示させるとともに、前記表示画面における前記グラフ領域に対するタッチ操作に基づいて、当該グラフ領域内の表示を変更する。
このような構成によれば、作業者は、本体に設けられたタッチパネル式の表示画面に対してタッチ操作を行うのみで、表示画面におけるグラフ領域内の表示を変更しながら、その表示画面において変更後のグラフ領域を確認できる。
そのため、グラフ領域内に表示されるクロマトグラムの詳細な確認作業を、本体において容易に行うことができる。
そのため、グラフ領域内に表示されるクロマトグラムの詳細な確認作業を、本体において容易に行うことができる。
(2)また、前記表示処理部は、前記表示画面における前記グラフ領域に対するタッチ操作に基づいて、当該グラフ領域内に表示されているクロマトグラムを拡大表示又は縮小表示させてもよい。
このような構成によれば、グラフ領域内に表示されるクロマトグラムにおける注目すべき部分を拡大表示させることで、その部分の詳細を本体において容易に確認できる。また、グラフ領域内に表示されるクロマトグラムを縮小表示させることで、クロマトグラムの全体を本体において容易に確認できる。
(3)また、前記表示処理部は、前記表示画面における前記グラフ領域に対するタッチ操作に基づいて、当該グラフ領域内に表示されているクロマトグラムと別のクロマトグラムとを重ねて表示させてもよい。
このような構成によれば、グラフ領域内に表示されているクロマトグラムと、別のクロマトグラムとの比較を本体において容易に行うことができる。
このような構成によれば、グラフ領域内に表示されているクロマトグラムと、別のクロマトグラムとの比較を本体において容易に行うことができる。
(4)また、前記表示処理部は、前記検出器からの検出信号に基づいて、前記表示画面における前記グラフ領域内にクロマトグラムをリアルタイムで変化させながら表示させるとともに、前記表示画面における前記グラフ領域に対するタッチ操作に基づいて、クロマトグラムの変化を停止させ、その後の当該グラフ領域に対するタッチ操作に基づいて、当該グラフ領域内の表示を変更してもよい。
このような構成によれば、グラフ領域内において変化するクロマトグラムをリアルタイムで表示できるとともに、グラフ領域に対してタッチ操作を行うことにより、クロマトグラムの変化を停止させて、グラフ領域内の表示を変更できる。
そのため、リアルタイムでクロマトグラムを表示できながら、クロマトグラムの詳細な確認作業を行う際には、クロマトグラムの変化を停止させて確認しやすくすることができる。
(5)また、前記表示処理部は、前記表示画面における前記グラフ領域内のクロマトグラムの表示を停止させた後、当該グラフ領域に対するタッチ操作が一定時間行われない場合に、クロマトグラムの変化を再開させてもよい。
このような構成によれば、グラフ領域内において、停止したクロマトグラムが長時間表示されることを抑制できる。また、クロマトグラムの変化を再開させるための操作を行わなくてもよいため、確認作業がさらに容易になる。
本発明によれば、表示画面に対するタッチ操作のみでグラフ領域内の表示を変更できる。また、その表示画面において変更後のグラフ領域を確認できる。そのため、検出器からの検出信号に基づいて表示されるクロマトグラムの詳細な確認作業を本体において容易に行うことができる。
1.ガスクロマトグラフの全体構成
図1は、本発明の一実施形態に係るガスクロマトグラフの構成例を示した概略図である。このガスクロマトグラフは、キャリアガスとともに試料ガスをカラム1内に供給することにより分析を行うためのものであり、上記カラム1以外に、カラムオーブン2、試料導入部3、検出器4、及び、これらを収容する中空状の本体10などを備えている。
カラム1は、例えば、キャピラリカラムからなる。カラム1は、ヒータ及びファンなど(いずれも図示せず)とともにカラムオーブン2内に収容されている。
カラムオーブン2は、カラム1を加熱するためのものであり、分析時にはヒータ及びファンを適宜駆動させる。
図1は、本発明の一実施形態に係るガスクロマトグラフの構成例を示した概略図である。このガスクロマトグラフは、キャリアガスとともに試料ガスをカラム1内に供給することにより分析を行うためのものであり、上記カラム1以外に、カラムオーブン2、試料導入部3、検出器4、及び、これらを収容する中空状の本体10などを備えている。
カラム1は、例えば、キャピラリカラムからなる。カラム1は、ヒータ及びファンなど(いずれも図示せず)とともにカラムオーブン2内に収容されている。
カラムオーブン2は、カラム1を加熱するためのものであり、分析時にはヒータ及びファンを適宜駆動させる。
試料導入部3は、カラム1内にキャリアガス及び試料ガスを導入するためのものであり、その内部に試料気化室(図示せず)が形成されている。この試料気化室には、液体試料が注入され、試料気化室内で気化された試料が、キャリアガスとともにカラム1内に導入される。また、試料気化室には、ガス供給流路5及びスプリット流路6が連通している。
ガス供給流路5は、試料導入部3の試料気化室内にキャリアガスを供給するための流路である。
ガス供給流路5は、試料導入部3の試料気化室内にキャリアガスを供給するための流路である。
スプリット流路6は、スプリット導入法によりカラム1内にキャリアガス及び試料ガスを導入する際に、試料気化室内のガス(キャリアガス及び試料ガスの混合ガス)の一部を所定のスプリット比で外部に排出するための流路である。
検出器4は、例えば、水素炎イオン化検出器(FID)などの各種検出器により構成される。検出器4は、カラム1から導入されるキャリアガスに含まれる各試料成分を順次検出する。
このガスクロマトグラフにおいて試料を測定する際は、分析対象となる試料が試料導入部3に注入される。そして、試料は、試料気化室において気化される。また、試料導入部3の試料気化室には、ガス供給流路5を介してキャリアガスが供給される。
試料気化室内で気化された試料は、キャリアガスとともにカラム1内に導入される。試料に含まれる各試料成分は、カラム1内を通過する過程で分離されて、検出器4に順次導入される。
そして、検出器4において、カラム1から導入されるキャリアガスに含まれる各試料成分が順次検出される。また、検出器4における検出結果に基づいて、クロマトグラムが生成される。
2.制御部及び周辺の部材の具体的構成
図2は、図1のガスクロマトグラフの制御部、及び、その周辺の部材の具体的構成を示したブロック図である。
ガスクロマトグラフは、上記した検出器4に加えて、表示器11と、記憶部12と、制御部13とを備えている。
図2は、図1のガスクロマトグラフの制御部、及び、その周辺の部材の具体的構成を示したブロック図である。
ガスクロマトグラフは、上記した検出器4に加えて、表示器11と、記憶部12と、制御部13とを備えている。
表示器11は、本体1(図1参照)に設けられている。詳しくは後述するが、表示器11は、タッチパネルを含んでいる。すなわち、ガスクロマトグラフでは、表示器11を用いることにより、作業者が分析を行いながら情報の確認及び入力操作を行うことができるようになっている。
記憶部12は、例えば、ROM(Read Only Memory)及びRAM(Random Access Memory)などにより構成されている。記憶部12は、前回データ121を記憶している。前回データ121は、後述するデータ処理部131によって生成されたクロマトグラムのデータであって、前回の分析時に生成されたデータである。
制御部13は、例えば、CPU(Central Processing Unit)を含む構成である。制御部13は、検出器4及び表示器11との間で、電気信号の入力又は出力が可能である。制御部13は、必要に応じて記憶部12に対するデータの入出力を行う。制御部13は、CPUがプログラムを実行することにより、データ処理部131及び表示処理部132などとして機能する。
データ処理部131は、検出器4からの検出信号に基づいて、クロマトグラムを得る。また、ガスクロマトグラフにおいて分析が終了すると、データ処理部131で生成されたクロマトグラムのデータは、既存のデータを書き換えるようにして、前回データ121として記憶部12に格納される。
表示処理部132は、データ処理部131が生成したクロマトグラムのデータに基づいて、表示器11にクロマトグラムを表示させる処理を行う。また、表示処理部13は、タッチパネルの操作による表示器11からの入力信号、及び、記憶部12の前回データ121に基づいて、表示器11に表示するクロマトグラムを変更する処理を行う。
3.表示画面の画面構成
図3は、基本画面の状態の表示画面111の表示態様の一例を示した概略図である。
上記した表示器11には、タッチパネル式の表示画面111が含まれている。表示器11は、本体10(図1参照)に備えられており、作業者は、本体10上で表示画面111を確認できる。具体的には、表示器11は、作業者が操作しやすいように、本体10の前面に設けられている。また、本体10の前面には、通常、開閉可能な扉などが設けられている。すなわち、表示器11は、本体10の前面において、扉などが配置されるスペースを確保するように、比較的小さなスペースに配置されている。
表示画面111は、略矩形状に形成されている。表示画面111には、動作表示領域112と、第1グラフ領域113とが含まれている。
図3は、基本画面の状態の表示画面111の表示態様の一例を示した概略図である。
上記した表示器11には、タッチパネル式の表示画面111が含まれている。表示器11は、本体10(図1参照)に備えられており、作業者は、本体10上で表示画面111を確認できる。具体的には、表示器11は、作業者が操作しやすいように、本体10の前面に設けられている。また、本体10の前面には、通常、開閉可能な扉などが設けられている。すなわち、表示器11は、本体10の前面において、扉などが配置されるスペースを確保するように、比較的小さなスペースに配置されている。
表示画面111は、略矩形状に形成されている。表示画面111には、動作表示領域112と、第1グラフ領域113とが含まれている。
動作表示領域112は、表示画面111内における上方側に配置されている。動作表示領域112は、ガスクロマトグラフにおける各種部品の動作状態を表示するための領域である。例えば、動作表示領域112には、カラム1の温度、試料導入部3内の温度及び圧力、試料導入部3内に供給されるキャリアガスの流量、検出器4の温度などの動作状態が表示される。
第1グラフ領域113は、表示画面111内における下方側に配置されている。第1グラフ領域113は、データ処理部131によるデータ処理結果をグラフとして表示するための領域であって、具体的には、データ処理部131によって生成されたクロマトグラムをリアルタイムで表示するための領域である。クロマトグラムは、横軸を時間、縦軸を信号強度として表示される。
このような表示画面111の画面構成が、表示画面111の基本画面である。そして、表示処理部132は、後述するように、作業者による表示画面111へのタッチ操作に基づいて、表示画面111の表示内容を変更する。
4.制御部による制御動作、及び、表示画面の表示態様
図4は、制御部13による処理の一例を示したフローチャートである。
通常、表示器11の表示画面111では、図3に示すように、上記した基本画面が表示されている。そして、データ処理部131によって検出器4からの検出信号に基づいてクロマトグラムが生成されると、表示処理部132は、第1グラフ領域113にそのクロマトグラムをリアルタイムで表示させる(ステップS101)。
図4は、制御部13による処理の一例を示したフローチャートである。
通常、表示器11の表示画面111では、図3に示すように、上記した基本画面が表示されている。そして、データ処理部131によって検出器4からの検出信号に基づいてクロマトグラムが生成されると、表示処理部132は、第1グラフ領域113にそのクロマトグラムをリアルタイムで表示させる(ステップS101)。
具体的には、表示画面111に基本画面が表示された状態では、第1グラフ領域113において、データ処理部131によって生成されたクロマトグラムであるグラフAが右から左に移動するように表示される。グラフAでは、右端側に表示される内容がリアルタイムで生成されるクロマトグラムに対応している。そして、グラフAにおける右端側に表示された内容は、時間が経つにつれて左方に移動し、さらに時間が経つと第1グラフ領域113に表示されなくなる。
このように、表示器11の表示画面111に基本画面が表示されている間は、第1グラフ領域113では、データ処理部131で生成されるクロマトグラムがグラフAとしてリアルタイムで表示される。そして、作業者は、このグラフAを確認することにより、各種分析を行う。
また、表示処理部132は、この状態から、第1グラフ領域113に対してタッチ操作が行われた場合には(ステップS102でYES)、まず、第1グラフ領域113におけるグラフAの移動を停止して、表示画面111を編集モードにする(ステップS103)。表示画面111が編集モードとなった状態では、表示処理部132は、後述するように、第1グラフ領域113に対するタッチ操作に基づいて、第1グラフ領域113の表示内容を変更する。
また、表示処理部132は、表示画面111が編集モードとなってから、第1グラフ領域113に対するタッチ操作が行われずに一定時間が経過し(ステップS104でYES)、かつ、分析がまだ終了していない場合には(ステップS105でNO)、第1グラフ領域113におけるクロマトグラムのリアルタイム表示を再開することにより、表示画面111を基本画面に戻す。そして、表示処理部132は、ガスクロマトグラフにおける分析が終了した場合には(ステップS105でYES)、表示画面111に対する制御動作を終了する。
一方、表示処理部132は、表示画面111に基本画面が表示された状態から、データ処理部131に対するタッチ操作が行われずに(ステップS102でNO)、表示画面111において比較モードを選択するための所定のタッチ操作が行われた場合には(ステップS106でYES)、表示画面111を比較モードにする(ステップS107)。表示画面111が比較モードとなった状態では、後述するように、クロマトグラムを表す領域が2つ表示される(2画面表示される)。
そして、表示処理部132は、表示画面111が比較モードとなった状態から、表示画面111において比較モードを解除するための所定のタッチ操作が行われた場合であって(ステップS108でYES)、かつ、分析がまだ終了していない場合には(ステップS105でNO)、クロマトグラムを1画面表示に戻し、第1グラフ領域113におけるクロマトグラムのリアルタイム表示を再開することにより、表示画面111を基本画面に戻す。また、表示処理部132は、ガスクロマトグラフにおける分析が終了した場合には(ステップS105でYES)、表示画面111に対する制御動作を終了する。
なお、表示画面111における所定のタッチ操作とは、例えば、表示画面111に表示される図示しないボタンをタッチする操作などである。
なお、表示画面111における所定のタッチ操作とは、例えば、表示画面111に表示される図示しないボタンをタッチする操作などである。
図5は、編集モードの状態の表示画面111の表示態様の一例であって、拡大画面114を表示する例を示した概略図である。また、図6は、表示画面111の表示態様の一例であって、クロマトグラムを縮小表示する例を示した概略図である。
図3、図5及び図6を用いて、編集モードの状態の表示画面111の表示態様について説明する。
図3、図5及び図6を用いて、編集モードの状態の表示画面111の表示態様について説明する。
例えば、図3に示すように、表示画面111において基本画面が表示される状態において、グラフAの表示内容によっては、その詳細をさらに確認しなければ、精度の高い分析を行うことができない場合がある。このような場合に対応するため、表示処理部132は、第1グラフ領域113に対するタッチ操作に基づいて、表示画面111を編集モードにして、以下のように第1グラフ領域113の表示内容を変更する。
具体的には、表示処理部132は、表示画面111を編集モードにした状態において、作業者によって、第1グラフ領域113の所定部分に対するタッチが一定時間続けられると(第1グラフ領域113に対して長押しされると)、図5に示すように、表示画面111に拡大画面114を表示させる。
拡大画面114は、第1グラフ領域113に重ねて表示されている。拡大画面114では、一定時間続けてタッチされた部分を中心とする第1グラフ領域113の一定領域が拡大表示される。
なお、図5では、図3に示す領域Bに対するタッチが続けられることにより、編集モードとなった場合の表示画面111を示している。すなわち、図5では、図3に示す領域Bが拡大画面114において拡大表示されている。
なお、図5では、図3に示す領域Bに対するタッチが続けられることにより、編集モードとなった場合の表示画面111を示している。すなわち、図5では、図3に示す領域Bが拡大画面114において拡大表示されている。
さらに、表示処理部132は、この状態から、拡大画面114に対してタッチ操作が行われた場合には、そのタッチ操作に基づいて、拡大画面114内の表示内容を変更する。
例えば、表示処理部132は、作業者によって、拡大画面114の一部分をタッチした状態から、そのタッチ部分をずらすようにしてスライド操作が行われると、そのスライド方向に拡大画面114内の表示を移動させる。また、表示処理部132は、作業者によって、拡大画面114における任意の2箇所をタッチした状態から、そのタッチ部分を拡げるようにしてスライド操作(ピンチアウト)が行われると、拡大画面114内の表示をさらに拡大させる。また、表示処理部132は、作業者によって、拡大画面114における任意の2箇所をタッチした状態から、そのタッチ部分を狭めるようにしてスライド操作(ピンチイン)が行われると、拡大画面114内の表示を縮小させる。
また、例えば、図3に示すように、表示画面111において基本画面が表示される状態において、クロマトグラムの全体を確認したい場合がある。このような場合に対応するため、表示処理部132は、第1グラフ領域113に対するタッチ操作に基づいて、表示画面111を編集モードにして、以下のように第1グラフ領域113の表示内容を変更する。
具体的には、表示処理部132は、表示画面111を編集モードにした状態において、作業者によって、第1グラフ領域113における任意の2箇所をタッチした状態から、そのタッチ部分を狭めるようにしてスライド操作(ピンチイン)が行われると、図6に示すように、縮小したグラフCを第1グラフ領域113内に表示する。グラフCは、表示画面111が編集モードになるまでの間において、データ処理部131によって生成されたクロマトグラムの全体を表している。
また、図示しないが、表示処理部132は、表示画面111を編集モードにした状態において、作業者によって、第1グラフ領域113における任意の2箇所をタッチした状態から、そのタッチ部分を拡げるようにしてスライド操作(ピンチアウト)が行われた場合には、図3に示すグラフAからさらに拡大したグラフを第1グラフ領域113に表示させる。
そして、表示処理部132は、このような第1グラフ領域113に対するタッチ操作が行われずに一定時間が経過した場合には、表示画面111の編集モードを終了する。そして、分析がまだ終了していない場合には、図3に示すように、第1グラフ領域113におけるクロマトグラムのリアルタイム表示を再開することにより、表示画面111を基本画面に戻す。
図7~図10は、比較モードの状態の表示画面111の表示態様の一例を示した概略図である。具体的には、図7は、表示画面111が比較モードとなった直後の状態を示している。また、図8は、第1グラフ領域113において、分析中のクロマトグラムに対して前回分析時のクロマトグラムを重ねて表示する状態を示している。また、図9は、第2グラフ領域115において、クロマトフラムの一部が選択される状態を示している。また、図10は、第1グラフ領域113において、分析中のクロマトグラムに対して前回分析時のクロマトグラムの一部を重ねて表示する状態を示している。
図7~図10を用いて、比較モードの場合の表示画面111の表示態様について説明する。
図7~図10を用いて、比較モードの場合の表示画面111の表示態様について説明する。
例えば、表示画面111において基本画面が表示される状態において、グラフAの表示内容によっては、前回分析時のデータと比較することにより、精度の高い分析を行うことができる場合がある。このような場合に対応するため、表示処理部132は、表示画面111に対するタッチ操作に基づいて、表示画面111を比較モードにして、以下のように表示画面111の表示内容を変更する。
図7に示すように、比較モードとなった表示画面111では、下方側に上記した第1グラフ領域113が表示されており、上方側に第2グラフ領域115が表示される。
第1グラフ領域113では、上記したように、データ処理部131によって生成されたクロマトグラムであるグラフAが右から左に移動するように表示される。すなわち、第1グラフ領域113では、クロマトグラムがリアルタイム表示されている。
第1グラフ領域113では、上記したように、データ処理部131によって生成されたクロマトグラムであるグラフAが右から左に移動するように表示される。すなわち、第1グラフ領域113では、クロマトグラムがリアルタイム表示されている。
第2グラフ領域115は、前回分析時に生成されたクロマトグラムを表示させるための領域であって、記憶部12に格納されている前回データ121に対応するグラフDが表示される。また、第2グラフ領域115では、第1グラフ領域113に表示されるグラフAに対応するように、グラフDが右から左に移動するように表示される。すなわち、表示画面111が比較モードとなった直後は、表示画面111では、クロマトグラムを表す領域が2つ表示されており、各領域において、クロマトグラムが移動するように表示されている。
作業者は、この状態の表示画面111を確認することにより、データ処理部131によってリアルタイムで生成されるクロマトグラムと、前回分析時に生成されたクロマトグラムとを比較する。
そして、この状態から、表示処理部132は、表示画面111に対するタッチ操作がさらに行われると、そのタッチ操作に基づいて表示内容を変更する。
具体的には、表示処理部132は、表示画面111を比較モードにした状態において、作業者によって、第1グラフ領域113又は第2グラフ領域115に対してタッチ操作が行われると、まず、第1グラフ領域113におけるグラフAの移動、及び、第2グラフ領域115におけるグラフDの移動を停止する。
具体的には、表示処理部132は、表示画面111を比較モードにした状態において、作業者によって、第1グラフ領域113又は第2グラフ領域115に対してタッチ操作が行われると、まず、第1グラフ領域113におけるグラフAの移動、及び、第2グラフ領域115におけるグラフDの移動を停止する。
そして、表示処理部132は、作業者によって、第2グラフ領域115の一部分をタッチした状態から、そのタッチ部分を下方にずらすようにしてスライド操作(ドラッグ)が行われると、図8に示すように、第1グラフ領域113において、グラフAにグラフEを重ねる。グラフEは、第2グラフ領域115に表示されるグラフDをコピーしたグラフである。
すなわち、第1グラフ領域113において、分析中のクロマトグラムであるグラフAと、前回分析時のクロマトグラムであるグラフEとが、横軸(時間軸)を対応付けた状態で、重ねて表示される。
このとき、グラフAとグラフEとを異なる色で表示させるなどして、互いに区別させることが好ましい。
このとき、グラフAとグラフEとを異なる色で表示させるなどして、互いに区別させることが好ましい。
そして、作業者は、この状態の第1グラフ領域113から、分析中であるクロマトグラムにおけるピークと、前回分析時のクロマトグラムにおけるピークとの対応関係を確認することにより、再現性を評価する。
また、表示処理部132は、表示画面111が比較モードになった状態から、作業者によって、第2グラフ領域115における所定の2箇所がタッチされると、図9に示すように、そのタッチされた2箇所を時間範囲とする領域Fを選択する。さらに、表示処理部132は、図10に示すように、第1グラフ領域113において、グラフAにグラフGを重ねる。グラフGは、第2グラフ領域115において領域F内に表示されるグラフDの部分を選択してコピーしたグラフである。
すなわち、第1グラフ領域113において、分析中のクロマトグラムであるグラフAと、前回分析時のクロマトグラムの一部分であるグラフGとが、横軸(時間軸)を対応付けた状態で、重ねて表示される。
このとき、グラフAとグラフGとを異なる色で表示させるなどして、互いに区別させることが好ましい。
このとき、グラフAとグラフGとを異なる色で表示させるなどして、互いに区別させることが好ましい。
そして、作業者は、この状態の第1グラフ領域113から、分析中であるクロマトグラムにおけるピークと、前回分析時のクロマトグラムにおけるピークとの対応関係を確認することにより、再現性を評価する。
また、ガスクロマトグラフにおける分析が終了すると、図2に示すように、データ処理部131は、生成したクロマトグラムを新しい前回データ121として、既存の前回データ121を書き換えるようにして記憶部12に格納する。
5.作用効果
(1)本実施形態では、ガスクロマトグラフにおいて、表示器11は、本体10に設けられている。また、表示器11には、タッチパネル式の表示画面111が含まれている。そして、表示処理部132は、検出器4からの検出信号に基づいて、表示画面111における第1グラフ領域113内にクロマトグラムを表示させるとともに、第1グラフ領域113に対するタッチ操作に基づいて、第1グラフ領域113内の表示を変更する。
(1)本実施形態では、ガスクロマトグラフにおいて、表示器11は、本体10に設けられている。また、表示器11には、タッチパネル式の表示画面111が含まれている。そして、表示処理部132は、検出器4からの検出信号に基づいて、表示画面111における第1グラフ領域113内にクロマトグラムを表示させるとともに、第1グラフ領域113に対するタッチ操作に基づいて、第1グラフ領域113内の表示を変更する。
そのため、作業者は、本体10に設けられたタッチパネル式の表示画面111に対してタッチ操作を行うのみで、表示画面111における第1グラフ領域113内の表示を変更しながら、その表示画面において変更後の第1グラフ領域113を確認できる。
そのため、第1グラフ領域113内に表示されるクロマトグラムの詳細な確認作業を、本体10において容易に行うことができる。
そのため、第1グラフ領域113内に表示されるクロマトグラムの詳細な確認作業を、本体10において容易に行うことができる。
(2)また、本実施形態では、図5に示すように、表示処理部132は、表示画面111における第1グラフ領域113に対するタッチ操作に基づいて、拡大画面114を表示させる。同様に、図6に示すように、表示処理部132は、表示画面111における第1グラフ領域113に対するタッチ操作に基づいて、第1グラフ領域113に表示されるクロマトグラムを縮小表示させる。
そのため、第1グラフ領域113内に表示されるクロマトグラムにおける注目すべき部分を拡大表示させることで、その部分の詳細を本体10において容易に確認できる。また、第1グラフ領域113内に表示されるクロマトグラムを縮小表示させることで、クロマトグラムの全体を本体10において容易に確認できる。
(3)また、本実施形態では、図8及び図10に示すように、表示処理部132は、表示画面111における第2グラフ領域115に対するタッチ操作に基づいて、第1グラフ領域113に表示されているクロマトグラムに対して、前回分析時のクロマトグラムを重ねて表示させる。
そのため、第1グラフ領域113に表示されている分析中のクロマトグラムと、前回分析時のクロマトグラムとの比較を、本体10において容易に行うことができる。
(4)また、本実施形態では、図4に示すように、表示処理部132は、表示画面111が基本画面となる状態から、表示画面111における第1グラフ領域113に対するタッチ操作が行われたことに基づいて(ステップS102でYES)、クロマトグラムの変化を停止させて、表示画面111を編集モードにする(ステップS103)。そして、表示画面111が編集モードとなった状態から、表示画面111における第1グラフ領域113に対するタッチ操作が行われたことに基づいて、第1グラフ領域113内の表示を変更させる。
そのため、表示画面111を基本画面にすることで、リアルタイムでクロマトグラムを表示できながら、クロマトグラムの詳細な確認作業を行う際には、表示画面111を編集モードにすることで、クロマトグラムの変化を停止させて確認しやすくすることができる。
(5)また、本実施形態では、図4に示すように、表示処理部132は、表示画面111が編集モードとなった状態において、第1グラフ領域113に対するタッチ操作がない状態で一定時間が経過し(ステップS104でYES)、かつ、分析がまだ終了していない場合には(ステップS105でNO)、第1グラフ領域113におけるクロマトグラムのリアルタイム表示を再開することにより(ステップS101)、表示画面111を基本画面に戻す。
そのため、第1グラフ領域113内において、停止したクロマトグラムが長時間表示されることを抑制できる。また、クロマトグラムの変化を再開させるための操作を行わなくてもよいため、確認作業がさらに容易になる。
6.変形例
以上の説明では、本発明のクロマトグラフは、ガスクロマトグラフに適用されるとして説明したが、本発明のクロマトグラフは、液体クロマトグラフに適用されてもよい。
以上の説明では、本発明のクロマトグラフは、ガスクロマトグラフに適用されるとして説明したが、本発明のクロマトグラフは、液体クロマトグラフに適用されてもよい。
また、以上の説明では、表示画面111が比較モードとなった場合に、第2グラフ領域115には、前回分析時のクロマトグラムが表示されるとして説明したが、第2グラフ領域115には、複数の過去の分析時に生成されたクロマトグラムから選択された一のクロマトグラムが表示されてもよい。具体的には、記憶部12に、過去の分析時に生成されたクロマトグラムのデータが複数記憶され、表示処理部132は、表示画面111が比較モードとなった場合に、第2グラフ領域115において、これらの複数のデータから選択された一のデータに基づくクロマトグラムを表示させてもよい。
また、以上の説明では、グラフ領域内の表示の変更は、グラフ領域に対する特定のタッチ操作に基づいて行われるとして説明したが、上記した特定のタッチ操作以外のタッチ操作に基づいて、グラフ領域内の表示が変更されてもよい。すなわち、グラフ領域内に表示されるクロマトグラムを拡大表示、縮小表示、又は、別のクロマトグラムと重ねて表示させる際のタッチ操作は、長押し、ピンチアウト、ピンチイン、ドラッグなどに限られない。例えば、表示画面の同じ位置を続けて2回タッチする操作(タップ)などの他の各種タッチ操作に基づいて、グラフ領域内の表示を変更することが可能である。
4 検出器
10 本体
11 表示器
13 制御部
111 表示画面
113 第1グラフ領域
115 第2グラフ領域
132 表示処理部
10 本体
11 表示器
13 制御部
111 表示画面
113 第1グラフ領域
115 第2グラフ領域
132 表示処理部
Claims (5)
- 本体と、
前記本体に設けられ、試料を検出して検出信号を出力する検出器と、
前記本体に設けられ、タッチパネル式の表示画面を有する表示器と、
前記検出器からの検出信号に基づいて、前記表示画面におけるグラフ領域内にクロマトグラムを表示させるとともに、前記表示画面における前記グラフ領域に対するタッチ操作に基づいて、当該グラフ領域内の表示を変更する表示処理部とを備えることを特徴とするクロマトグラフ。 - 前記表示処理部は、前記表示画面における前記グラフ領域に対するタッチ操作に基づいて、当該グラフ領域内に表示されているクロマトグラムを拡大表示又は縮小表示させることを特徴とする請求項1に記載のクロマトグラフ。
- 前記表示処理部は、前記表示画面における前記グラフ領域に対するタッチ操作に基づいて、当該グラフ領域内に表示されているクロマトグラムと別のクロマトグラムとを重ねて表示させることを特徴とする請求項1に記載のクロマトグラフ。
- 前記表示処理部は、前記検出器からの検出信号に基づいて、前記表示画面における前記グラフ領域内にクロマトグラムをリアルタイムで変化させながら表示させるとともに、前記表示画面における前記グラフ領域に対するタッチ操作に基づいて、クロマトグラムの変化を停止させ、その後の当該グラフ領域に対するタッチ操作に基づいて、当該グラフ領域内の表示を変更することを特徴とする請求項1に記載のクロマトグラフ。
- 前記表示処理部は、前記表示画面における前記グラフ領域内のクロマトグラムの表示を停止させた後、当該グラフ領域に対するタッチ操作が一定時間行われない場合に、クロマトグラムの変化を再開させることを特徴とする請求項4に記載のクロマトグラフ。
Priority Applications (4)
| Application Number | Priority Date | Filing Date | Title |
|---|---|---|---|
| US16/066,528 US10845345B2 (en) | 2015-12-28 | 2015-12-28 | Chromatograph with integrated display unit |
| CN201580085551.5A CN108474771B (zh) | 2015-12-28 | 2015-12-28 | 色谱仪 |
| JP2017558836A JP6512308B2 (ja) | 2015-12-28 | 2015-12-28 | クロマトグラフ |
| PCT/JP2015/086570 WO2017115443A1 (ja) | 2015-12-28 | 2015-12-28 | クロマトグラフ |
Applications Claiming Priority (1)
| Application Number | Priority Date | Filing Date | Title |
|---|---|---|---|
| PCT/JP2015/086570 WO2017115443A1 (ja) | 2015-12-28 | 2015-12-28 | クロマトグラフ |
Publications (1)
| Publication Number | Publication Date |
|---|---|
| WO2017115443A1 true WO2017115443A1 (ja) | 2017-07-06 |
Family
ID=59224885
Family Applications (1)
| Application Number | Title | Priority Date | Filing Date |
|---|---|---|---|
| PCT/JP2015/086570 Ceased WO2017115443A1 (ja) | 2015-12-28 | 2015-12-28 | クロマトグラフ |
Country Status (4)
| Country | Link |
|---|---|
| US (1) | US10845345B2 (ja) |
| JP (1) | JP6512308B2 (ja) |
| CN (1) | CN108474771B (ja) |
| WO (1) | WO2017115443A1 (ja) |
Citations (3)
| Publication number | Priority date | Publication date | Assignee | Title |
|---|---|---|---|---|
| JPH0720559U (ja) * | 1993-09-20 | 1995-04-11 | 有限会社ラボシステム機器 | クロマトグラフィー用検出装置 |
| JP2008058156A (ja) * | 2006-08-31 | 2008-03-13 | Hitachi High-Technologies Corp | クロマトグラフ分析装置 |
| JP2014032093A (ja) * | 2012-08-03 | 2014-02-20 | Hitachi High-Technologies Corp | 分析装置 |
Family Cites Families (16)
| Publication number | Priority date | Publication date | Assignee | Title |
|---|---|---|---|---|
| US4900446A (en) * | 1987-06-23 | 1990-02-13 | Large Scale Biology | Centrifugal fast chromatograph |
| JP3040178B2 (ja) * | 1990-12-20 | 2000-05-08 | ウエスト電気株式会社 | フィルム移動状態検出装置 |
| JP4782278B2 (ja) * | 2000-12-19 | 2011-09-28 | 株式会社島津製作所 | 液体クロマトグラフ質量分析計 |
| US7254469B2 (en) * | 2004-11-18 | 2007-08-07 | Snap-On Incorporated | Superimposing current or previous graphing data for anomaly detection |
| JP5206504B2 (ja) | 2009-03-04 | 2013-06-12 | 株式会社島津製作所 | ガスクロマトグラフ装置 |
| US20120210804A1 (en) * | 2009-04-18 | 2012-08-23 | Mosesman Neil H | Solid aliquots of multiresidue method salts for solid phase extraction applictions |
| EP2556158B1 (en) * | 2010-04-08 | 2019-12-18 | Qiagen GmbH | Chromatographic device and method for isolating and purifying nucleic acids |
| CN103269762B (zh) * | 2010-12-20 | 2016-01-27 | 通用电气健康护理生物科学股份公司 | 亲和色谱基质 |
| CN105022540B (zh) * | 2011-09-07 | 2018-11-09 | 辛纳普蒂克斯公司 | 非显示更新时间期间的电容性感测 |
| JP5987969B2 (ja) * | 2013-02-15 | 2016-09-07 | 株式会社島津製作所 | 放電イオン化電流検出器 |
| CN105026926A (zh) * | 2013-03-04 | 2015-11-04 | 株式会社岛津制作所 | 色谱数据处理装置以及处理方法 |
| JP2014174009A (ja) * | 2013-03-08 | 2014-09-22 | Shindengen Electric Mfg Co Ltd | 絶縁耐圧試験装置及び半導体装置 |
| CN203441717U (zh) * | 2013-05-29 | 2014-02-19 | 福建百宏聚纤科技实业有限公司 | 纺丝生产线计量泵开关监控系统 |
| CN104424025B (zh) * | 2013-08-20 | 2018-11-06 | 北京三星通信技术研究有限公司 | 一种终端设备及其应用程序的切换方法 |
| JP6379463B2 (ja) * | 2013-09-18 | 2018-08-29 | 株式会社島津製作所 | 波形処理支援方法および波形処理支援装置 |
| US9592458B2 (en) * | 2013-12-26 | 2017-03-14 | Dionex Corporation | Ion exchange foams to remove ions from samples |
-
2015
- 2015-12-28 WO PCT/JP2015/086570 patent/WO2017115443A1/ja not_active Ceased
- 2015-12-28 US US16/066,528 patent/US10845345B2/en active Active
- 2015-12-28 JP JP2017558836A patent/JP6512308B2/ja active Active
- 2015-12-28 CN CN201580085551.5A patent/CN108474771B/zh active Active
Patent Citations (3)
| Publication number | Priority date | Publication date | Assignee | Title |
|---|---|---|---|---|
| JPH0720559U (ja) * | 1993-09-20 | 1995-04-11 | 有限会社ラボシステム機器 | クロマトグラフィー用検出装置 |
| JP2008058156A (ja) * | 2006-08-31 | 2008-03-13 | Hitachi High-Technologies Corp | クロマトグラフ分析装置 |
| JP2014032093A (ja) * | 2012-08-03 | 2014-02-20 | Hitachi High-Technologies Corp | 分析装置 |
Also Published As
| Publication number | Publication date |
|---|---|
| CN108474771B (zh) | 2020-08-28 |
| CN108474771A (zh) | 2018-08-31 |
| JPWO2017115443A1 (ja) | 2018-08-30 |
| US10845345B2 (en) | 2020-11-24 |
| JP6512308B2 (ja) | 2019-05-15 |
| US20190011409A1 (en) | 2019-01-10 |
Similar Documents
| Publication | Publication Date | Title |
|---|---|---|
| US20190179847A1 (en) | Slide show control method and apparatus | |
| US9524040B2 (en) | Image editing apparatus and method for selecting area of interest | |
| CN103150095A (zh) | 终端和终端操控方法 | |
| JP6508334B2 (ja) | クロマトグラムデータ処理装置及びプログラム | |
| JP6593528B2 (ja) | データ処理装置及びデータ処理方法 | |
| JP6512308B2 (ja) | クロマトグラフ | |
| JP2006226678A (ja) | マルチディメンジョナルガスクロマトグラフ装置 | |
| JP2008052580A (ja) | 画像表示方法 | |
| JPWO2014141314A1 (ja) | 表示器及びプログラマブル表示器 | |
| JP6589641B2 (ja) | 分析装置 | |
| US20200013202A1 (en) | Analyzer | |
| WO2018025366A1 (ja) | クロマトグラフ用入力装置及びクロマトグラフ | |
| JP2007148589A (ja) | 文字入力装置および文字入力方法 | |
| TWI540496B (zh) | The control interface of the testing machine | |
| JP6593223B2 (ja) | 分析装置 | |
| KR20080000892A (ko) | 입력동작 처리방법 및 장치 | |
| JP2015025779A (ja) | におい測定装置及びにおい測定用プログラム | |
| JP2006244106A (ja) | 情報処理装置及びその処理方法 | |
| JP2018165852A (ja) | 制御器及びその操作制御方法 | |
| US20200116682A1 (en) | Pretreatment apparatus and analysis system comprising the same | |
| JPH06202828A (ja) | 印刷設定方式 | |
| JPWO2024241496A5 (ja) | ||
| JP2007132672A (ja) | 記録計 | |
| JP2010271335A (ja) | マルチディメンジョナルガスクロマトグラフ装置 | |
| TW201322109A (zh) | 電子裝置及其控制方法 |
Legal Events
| Date | Code | Title | Description |
|---|---|---|---|
| 121 | Ep: the epo has been informed by wipo that ep was designated in this application |
Ref document number: 15912109 Country of ref document: EP Kind code of ref document: A1 |
|
| ENP | Entry into the national phase |
Ref document number: 2017558836 Country of ref document: JP Kind code of ref document: A |
|
| NENP | Non-entry into the national phase |
Ref country code: DE |
|
| 122 | Ep: pct application non-entry in european phase |
Ref document number: 15912109 Country of ref document: EP Kind code of ref document: A1 |