WO2012165024A1 - 解析装置、解析方法、及び記憶媒体 - Google Patents
解析装置、解析方法、及び記憶媒体 Download PDFInfo
- Publication number
- WO2012165024A1 WO2012165024A1 PCT/JP2012/058476 JP2012058476W WO2012165024A1 WO 2012165024 A1 WO2012165024 A1 WO 2012165024A1 JP 2012058476 W JP2012058476 W JP 2012058476W WO 2012165024 A1 WO2012165024 A1 WO 2012165024A1
- Authority
- WO
- WIPO (PCT)
- Prior art keywords
- carbon atom
- sample
- carbon atoms
- peak
- estimation
- Prior art date
- Legal status (The legal status is an assumption and is not a legal conclusion. Google has not performed a legal analysis and makes no representation as to the accuracy of the status listed.)
- Ceased
Links
Images








Classifications
-
- H—ELECTRICITY
- H01—ELECTRIC ELEMENTS
- H01J—ELECTRIC DISCHARGE TUBES OR DISCHARGE LAMPS
- H01J49/00—Particle spectrometers or separator tubes
- H01J49/0027—Methods for using particle spectrometers
- H01J49/0036—Step by step routines describing the handling of the data generated during a measurement
-
- G—PHYSICS
- G01—MEASURING; TESTING
- G01N—INVESTIGATING OR ANALYSING MATERIALS BY DETERMINING THEIR CHEMICAL OR PHYSICAL PROPERTIES
- G01N27/00—Investigating or analysing materials by the use of electric, electrochemical, or magnetic means
- G01N27/62—Investigating or analysing materials by the use of electric, electrochemical, or magnetic means by investigating the ionisation of gases, e.g. aerosols; by investigating electric discharges, e.g. emission of cathode
- G01N27/622—Ion mobility spectrometry
- G01N27/623—Ion mobility spectrometry combined with mass spectrometry
-
- H—ELECTRICITY
- H01—ELECTRIC ELEMENTS
- H01J—ELECTRIC DISCHARGE TUBES OR DISCHARGE LAMPS
- H01J49/00—Particle spectrometers or separator tubes
- H01J49/004—Combinations of spectrometers, tandem spectrometers, e.g. MS/MS, MSn
Definitions
- the present invention relates to an analysis apparatus, an analysis method, and a storage medium.
- an ionized sample (Precursor Ion; hereinafter referred to as “precursor ion”) and fragment ions obtained by dissociating the sample are mass-mass ratio (m / Z)
- m / Z mass-mass ratio
- the precursor ion containing the isotope 13 C of carbon atom 12 C and the precursor ion not containing it are separated by electrical and magnetic action, etc., and the respective intensities are obtained. Output. From these intensity ratios, the number of carbon atoms contained in the sample is estimated.
- the mass spectrometer dissociates each separated precursor ion to generate fragment ions, and obtains spectrum data for each fragment ion.
- a step of causing collision of the target gas (for example, Xe) with the precursor ions a plurality of times to cause collision-induced dissociation (CID: Collision-Induced Dissociation) is employed.
- each fragment ion is identified from the mass-to-charge ratio distribution in each fragment ion and the estimated number of carbon atoms, and by comprehensively judging the estimated number of carbon atoms and the identified fragment ion, the original The molecular structure of the sample is estimated.
- Non-Patent Document 1 includes an algorithm that can automate the data analysis of the isotope selection MS / MS method, and software that can calculate the estimated number of carbon atoms of fragment ions in the MS / MS spectrum by a simple operation. An overview is provided.
- spectral data may fluctuate due to the presence of isotopes of elements other than carbon.
- the estimation is based on the estimation principle based on the height ratio of adjacent peaks, so the isotopes of elements other than carbon cannot be taken into account, and the number of carbon atoms cannot be analyzed accurately was there.
- the present invention is for solving such problems, and an object of the present invention is to provide an analysis apparatus and the like that can estimate the number of carbon atoms more accurately.
- An analyzer that analyzes data acquired from a mass spectrometer and estimates the number of carbon atoms of fragment ions dissociated from an ionized sample.
- First carbon atom number estimating means for estimating the number of carbon atoms of the fragment ion based on the height ratio of adjacent peaks having different mass to charge ratios in the MS / MS spectrum obtained from the sample; A mass ratio in the MS / MS spectrum obtained from the sample is different from the adjacent peak height ratio and a substance having a known number of carbon atoms is given to the sample, or a substance having a known number of carbon atoms is given to the sample.
- Second carbon atom for estimating the number of carbon atoms of the fragment ion based on the difference between the height ratio of adjacent peaks having different mass-to-charge ratios in the MS / MS spectrum obtained from the desorbed labeled sample Number estimation means; Is provided.
- FIG. 1 is a system configuration example of an analysis apparatus 1 according to an embodiment of the present invention. It is the other system configuration example of the analyzer 1 which concerns on one Example of this invention.
- 2 is a diagram schematically illustrating a functional configuration of a tandem mass spectrometer 100.
- FIG. It is an example of a functional structure of the analyzer 1 of a present Example. It is a figure which shows the spectrum data acquired by ionizing the said sample. It is a figure which shows the spectrum data of the precursor ion produced
- Pindolol containing isotope 13 C (the position of the isotope 13 C is not available) in fragment ions or a leaving group is generated from a diagram that lists the location of the isotope 13 C can exist. Shows methyl, and the spectral data obtained with those obtained by adding ethyl when a sample with respect to arginine [C 6 H 15 O 2 N 4]. It is a figure which shows typically the case where the m / z of a fragment ion increases and does not increase in "A + 1" of labeled data. It is explanatory drawing for demonstrating the normalization in case a fragment ion is non-shift, and a carbon atom number estimation principle.
- FIG. It is an example of the 2nd result output screen 24F displayed by the display apparatus 24.
- FIG. It is another example of the display content of the comparison display part 24Fa. It is a figure which shows the relationship between the value of FIT1, FIT2 and the cause of its dissociation
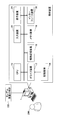
- FIG. 1 is a system configuration example of an analysis apparatus 1 according to an embodiment of the present invention.
- the analysis apparatus 1 is a computer that is connected to, for example, a tandem mass spectrometer 100 and that allows a user 200 to input various settings.
- the analysis device 1 includes, for example, a CPU (Central Processing Unit) 10, a drive device 12, an auxiliary storage device 16, a memory device 18, an interface device 20, an input device 22, and a display device 24. Prepare. These components are connected via a bus, a serial line, or the like.
- the CPU 10 is, for example, a processor having a program counter, an instruction decoder, various arithmetic units, an LSU (Load Store Unit), a general-purpose register, and the like.
- the drive device 12 is a device that can read a program and data from the storage medium 14. When the recording medium 14 on which the program is recorded is mounted on the drive device 12, the program is installed from the recording medium 14 to the auxiliary storage device 16 via the drive device 12.
- the recording medium 14 is a portable recording medium such as a CD-ROM, a DVD disk, or a USB memory.
- the auxiliary storage device 16 is, for example, an HDD (Hard Disk Drive) or a flash memory.
- the program can be installed by the interface device 20 being downloaded from another computer via a network and installed in the auxiliary storage device 16. Further, at the time of shipment of the information processing apparatus, it may be stored in advance in the auxiliary storage device 16, ROM (Read Only Memory) or the like.
- the CPU 10 executes the program installed or stored in advance as described above, whereby the information processing apparatus shown in FIG. 1 can function as the analysis apparatus 1 of the present embodiment.
- the memory device 18 is, for example, a RAM (Random Access Memory) or an EEPROM (Electrically Erasable and Programmable Read Only Memory).
- the interface device 20 controls connection with the network.
- the input device 22 is, for example, a keyboard, a mouse, a touch pad, a touch panel, a microphone, or the like.
- the display device 24 is a display device such as an LCD (Liquid Crystal Display) or a CRT (Cathode Ray Tube).
- FIG. 2 shows another system configuration example of the analysis apparatus 1 according to an embodiment of the present invention.
- the analysis device 1 may be a server device connected to one or more client computers 50 to which setting input is performed by the user 200.
- FIG. 3 is a diagram schematically showing a functional configuration of the tandem mass spectrometer 100.
- the tandem mass spectrometer 100 includes, for example, a sample introduction / ionization chamber 101, a first measurement unit / filter unit 102, a collision chamber 103, a filter unit / second measurement unit 104, and a recording unit 105.
- a sample to be analyzed for the molecular structure is introduced into a vacuum or gas, and the EI (Electron Ionization), chemical ionization (CI) method, field desorption (FD) method, fast atom It is ionized by a technique such as collision (FAB) method, matrix-assisted laser desorption ionization (MALDI) method, electrospray ionization (ESI) method, atmospheric pressure chemical ionization (APCI) method or the like.
- EI Electro Ion Ionization
- CI chemical ionization
- FD field desorption
- FAB collision
- MALDI matrix-assisted laser desorption ionization
- ESI electrospray ionization
- APCI atmospheric pressure chemical ionization
- the first measurement unit 102 detects an ionized sample, that is, a precursor ion in association with the mass-to-charge ratio (m / z), and selectively separates the precursor ion for each m / z and selectively collides with the collision chamber 103. To release. The detected result is provided to the recording unit 105.
- separating the precursor ion mainly separates a precursor ion that does not include an isotope and a precursor ion that includes the isotope and has a larger m / z by 1 or more by an electric / magnetic action or the like. Means that. Release of precursor ions not containing isotopes and release of precursor ions containing isotopes are repeated alternately, for example.
- each precursor ion separated according to m / z is collided with a target gas (for example, Xe) a plurality of times to cause collision-induced dissociation to generate fragment ions (CID: Collision-Induced Dissociation).
- a target gas for example, Xe
- the second measuring unit 104 detects fragment ions generated in the collision chamber 103 for each m / z and provides them to the recording unit 105.
- the recording unit 105 stores the precursor ion detection data provided from the first measurement unit 102 and the fragment ion detection data provided from the second measurement unit 104 in time series.
- Each detection data is data in which the detected intensity and m / z are associated with each other, that is, spectral data that can detect an intensity distribution with m / z as an axis.
- the detection data of the precursor ions provided from the first measurement unit 102 is referred to as a mass spectrum
- the detection data of the fragment ions provided from the second measurement unit 104 is referred to as an MS / MS spectrum.
- the operation of the recording unit 105 includes, for example, (1) storing detection data of precursor ions, (2) storing detection data of fragment ions generated from precursor ions not including isotopes, and (3) including isotopes.
- the detection is performed repeatedly for a certain period in the order of storing the detection data of the fragment ions generated from the precursor ions.
- the MS / MS spectrum of a fragment ion generated from a precursor ion not containing an isotope is “A”
- the MS / MS spectrum of a fragment ion generated from a precursor ion containing an isotope is “A + 1”.
- the recording unit 105 outputs the spectrum data thus stored for a certain period to the analysis device 1.
- the input spectrum data is stored in the memory device 18 or the auxiliary storage device 16.
- mass spectrometers may be used in addition to the tandem mass spectrometer as long as the spectral data of the precursor ions and fragment ions can be acquired in the application of the present invention.
- FIG. 4 is a functional configuration example of the analysis apparatus 1 of the present embodiment.
- the analysis apparatus 1 includes a master control unit 30, a first carbon atom number estimation unit 32, a second carbon atom number estimation unit 34, and an evaluation unit 36.
- These functional blocks function when the CPU 10 executes program software stored in the auxiliary storage device 16 or the like.
- Each functional block does not necessarily need to be realized by a separate program, and any functional block may be called by another functional block in a subroutine or the like.
- the functional blocks are not limited to such software blocks, but may be realized by hardware such as an IC (Integrated Circuit) or an FPGA (Field Programmable Gate Array). The function of each functional block will be described later.
- the molecular formula of the precursor ion of the target sample is mainly represented by [ 12 C x H y O z + ]. It is known that the carbon atom 12 C includes an isotope 13 C having one neutron at a certain ratio and the ratio is 1.1 [%]. Therefore, when the sample is ionized, a precursor ion represented by a molecular formula [ 12 C x ⁇ 1 13 C 1 H y O z + ] appears at a ratio of “the number of carbon atoms ⁇ 1.1 [%]”. In either case, the number of carbon atoms is counted as x.
- FIG. 5 is a diagram showing spectral data obtained by ionizing the sample.
- the maximum height (intensity) is normalized to 100.
- the m / z of the precursor ion [ 12 C x H y O z + ] is 249
- the m / z of the precursor ion [ 12 C x-1 13 C 1 H y O z + ] is 250. It shall be.
- “h” is the intensity ratio ([%]) between the ion [ 12 C x H y O z + ] and the ion [ 12 C x ⁇ 1 13 C 1 H y O z + ].
- the following equation (1) is established. In this way, an estimated value x e of the number of carbon atoms of the sample is obtained.
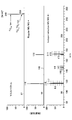
- FIG. 6 is a diagram showing spectral data of precursor ions and fragment ions generated from pindolol.
- the upper part of FIG. 6 shows the mass spectrum of the precursor ion generated from pindolol as already shown in FIG.
- the middle part of FIG. 6 shows the MS / MS spectrum (indicated as Regular MS / MS) “A” of the fragment ion generated from pindolol that does not contain the isotope 13 C.
- the lower part of FIG. Shows the MS / MS spectrum (indicated as Isotope-selective MS / MS in the figure) “A + 1” of the fragment ion generated from pindolol containing the isotope 13 C.
- the relative intensity on the vertical axis is a relative value when the maximum value of the spectrum data of the precursor ion is 100.
- the peak in the MS / MS spectrum “A” is a single peak.
- the peak in the MS / MS spectrum “A + 1” is basically bimodal (or multimodal). Fragment ions generated from pindolol containing isotope 13 C is because divided and those containing isotopes 13 C, to be free.
- the peaks of adjacent bimodal fragment ions appear with intensity ratios of [8: 6], [5: 9], [3:11], and the like.
- This intensity ratio is a distribution ratio indicating whether the isotope 13 C is contained in a fragment ion or a neutral leaving group.
- 11/14 is a fragment ion containing the isotope 13 C. 7 pindolol including isotopes 13 C (the position of the isotope 13 C is not available) in fragment ions or a leaving group is generated from a diagram that lists the location of the isotope 13 C can exist.
- the pattern in which the isotope 13 C exists on the fragment ion side is 11 patterns out of a total of 14 patterns.
- the fragment ion peak intensity ratio is [3:11].
- the ratio when the fragment ion [C 11 H 10 NO] contains 13 C and the leaving group 2-aminopropane [C 3 H 9 N] contains 13 C is proportional to the number of carbon atoms. Because it does.
- the intensity ratio of the peak having an m / z of 172 or 173 is measured as [3:11]. The same principle holds for other intensity ratios.
- the estimated value of the number of carbon atoms x of the original sample is added to the intensity ratio.
- the number of carbon atoms of the fragment ion corresponding to the peak can be estimated as 6, 9, and 11.
- the number of carbon atoms (theoretical value) x f of the fragment ion when the intensity ratio is [ ⁇ , ⁇ ] can be estimated based on the following equation (2), for example.
- x f x e ⁇ ⁇ / ( ⁇ + ⁇ ) ⁇ (2)
- those that do not contain a carbon atom isotope and those that contain a carbon atom isotope are fragment ions.
- a known substance appearing at a ratio of [8: 6], [5: 9], [3:11] or the like may be searched. This known in the identification of agents, and the estimated value x e of the number of carbon atoms as described above, the number of carbon atoms of the fragment ions (theoretical value) x f are considered comprehensively.
- a known substance (hereinafter referred to as a label substance) having a known number of carbon atoms such as methyl [CH 3 ] or ethyl [CH 3 CH 2 ] is given to the same sample by some technique.
- a mass spectrum and MS / MS spectra “A” and “A + 1” relating to a substance (labeled sample) from which a known substance with known number of carbon atoms is desorbed (labeled sample) is acquired from the tandem mass spectrometer 100 , Referred to as labeled data).
- non-label data data obtained from the original sample to which the label substance described above is not applied or desorbed.
- desorbing the label substance from the sample includes a case where the ester is decomposed into an acid and an alcohol.
- the non-label data and the labeled data are first obtained when a certain sample is selected, and then the labeled data is obtained. It is assumed that it is acquired together with the procedure.
- FIG. 8 is a diagram showing a mass spectrum obtained from a sample in which methyl and ethyl are added to arginine [C 6 H 15 O 2 N 4 ] represented by the chemical formula (2).
- the upper part of FIG. 8 is a mass spectrum when arginine is used as a sample
- the middle part of FIG. 8 is a mass spectrum when methyl is added to arginine
- the lower part of FIG. It is a mass spectrum at the time of giving.
- the label substance when mass analysis is performed by applying a label substance to a sample, when collision-induced dissociation occurs, the label substance is associated with the fragment ion side and when it is associated with the leaving group side.
- the label substance (methyl) is attached to the fragment ion side, the m / z of the fragment ion increases by 14 in the labeling data “A + 1”.
- the label substance (methyl) is attached to the leaving group side, the m / z of the fragment ion does not change in the labeling data “A + 1”.
- FIG. 9 is a diagram schematically illustrating a case where the fragment ion m / z increases and does not increase in “A + 1” of the labeled data.
- the right peak is one carbon atom higher
- the peak when the label substance (methyl) is attached to the leaving group side the left side The peak becomes higher by one carbon atom.
- the number of carbon atoms of the fragment ion is estimated using the change in the height ratio generated between the non-label data and the labeled data. Specifically, for example, normalization is performed so that the heights of either the left and right peaks of the non-label data and the labeled data are aligned, and C n obtained thereon is recognized as the intensity of one carbon atom. . Then, by dividing one of the peak heights of the left and right C n, to estimate the number of carbon atoms of the fragment ions.
- the left peak height of the adjacent peaks is set as the left peak height of the non-label data. Normalize to align.
- FIG. 10 is an explanatory diagram for explaining the normalization when the fragment ions are non-shifted and the principle of estimating the number of carbon atoms.
- the left peak of the non-label data is h1
- the right peak is h2
- the left peak of the labeled data is h1 *
- the right peak is h2 *.
- the difference between the peak h1 ** on the left side of the normalized labeled data and the peak h1 on the left side of the non-label data is an absolute intensity corresponding to the number of carbon atoms of the label substance, that is, C n It becomes.
- an estimated value y e of the number of nitrogen atoms is calculated from the sum of the left and right peaks of the non-label data by the following equation (5) using the estimated value x e of the number of carbon atoms of the original sample.
- “0.327” represents the ratio of the isotope 15 N appearing in the nitrogen atom (0.37 [%]), and the ratio of the isotope appearing in the carbon atom (1.1 [%]). The value divided by.
- Equation (7) After calculating the estimated value y e nitrogen atoms, the following equation (6), as shown in (7), and if the estimated value y e of nitrogen atoms is 2 or less, is divided in the case of 3 or more, fragments estimating the number of carbon atoms x f ions. Which value is used in Equation (7) is comprehensively determined by taking into account other conditions (such as the number of carbon atoms of fragment ions having different peaks), so here, two or more solutions are used. Shall be output. This is because it is difficult to determine whether the number of nitrogen atoms is three or the number of carbon atoms is one unless the accuracy of the mass spectrometer is sufficient.
- FIG. 11 is an explanatory diagram for explaining the normalization when the fragment ions are shifted and the principle of estimating the number of carbon atoms.
- the left peak of the non-label data is h1
- the right peak is h2
- the left peak of the labeled data is h1 *
- the right peak is h2 *.
- “b” is a value shifted from “a” by m / z of the label substance. It is each peak of the labeled data that is subject to normalization, and the peaks h1 ** and h2 ** of the normalized labeled data are expressed by the following equations (8) and (9).
- the difference between the peak h2 ** on the right side of the normalized labeled data and the peak h2 on the right side of the non-label data is an absolute intensity corresponding to the number of carbon atoms of the label substance, that is, C n It becomes.
- an estimated value y e of the number of nitrogen atoms is calculated from the sum of the left and right peaks of the non-label data by the above formula (5) using the estimated value x e of the number of carbon atoms of the original sample. .
- the remainder of the division is estimated to be the height corresponding to the nitrogen atom. More accurate estimation than the “estimation principle based on the height ratio of adjacent peaks” can be performed.
- the first carbon atom number estimation unit 32 performs estimation based on the above-described “estimation principle based on the height ratio of adjacent peaks”, and the second carbon atom number estimation unit. 34 performs estimation based on the above-described “estimation principle using labeled data”.
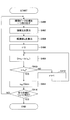
- FIG. 12 is a flowchart showing the flow of processing executed by the analysis apparatus 1 of this embodiment.
- the master control unit 30 of the analysis apparatus 1 acquires measurement data regarding a plurality of samples from the tandem mass spectrometer 100 (S300).
- the acquired data is non-label data (mass spectrum and MS / MS spectrum “A”, “A + 1”), and labeled data (same as above).
- the master control unit 30 displays the setting input screen 24A shown in FIG. 13 on the display device 24 (S302).
- FIG. 13 is an example of a setting input screen 24 ⁇ / b> A displayed by the display device 24.
- the user 200 operates the first selection unit 24Aa on the setting input screen 24A with a mouse or the like to select measurement data.
- the user 200 operates the second selection unit 24Ab of the setting input screen 24A with a mouse or a keyboard to designate the peak range Ar1.
- the user 200 operates the third selection unit 24Ac on the setting input screen 24A with a mouse or a keyboard to designate the difference area Ar2.
- the difference area Ar2 is designated in order to exclude low-frequency values that are steadily measured. For example, an area after a sufficient amount of time has elapsed since the peak range Ar1 has ended. The When the user 200 clicks the “Next” button, the setting input is completed.
- the change in measured intensity is displayed in time series on the display unit 24Ad. Further, a mass spectrum in the peak range Ar1 is displayed on the display unit 24Ae.
- the master control unit 30 displays the peak selection screen 24B on the display device 24 (S306).
- FIG. 14 is an example of the peak selection screen 24 ⁇ / b> B displayed by the display device 24.
- the user 200 designates a mass spectrum / MS / MS spectrum by operating the spectrum designation sections 24Ba to 24Bc of the peak selection screen 24B with a mouse or the like.
- the master control unit 30 instructs the display unit 24Bd to display the mass spectrum / MS / MS spectrum (“A”, “A + 1”) in order from the top (S308).
- the user 200 designates how many peaks are listed with respect to the maximum peak by inputting a numerical value (peak threshold P1) to the peak threshold selection unit 24Be. These designations are completed when the user 200 clicks the “Get [A] Peak List” button.
- the master control unit 30 creates a peak list and instructs it to be displayed on the peak list display unit 24Bf (S312).
- the peak list is created in the following procedure.
- A First, a peak indicating an intensity of (Pmax ⁇ P1) or more is extracted from the MS / MS spectrum “A” with reference to the peak (Pmax) indicating the maximum intensity in the MS / MS spectrum “A”.
- B Next, among the extracted peaks, the same m / z in the MS / MS spectrum “A + 1” and m / z + 1 (m / z is 1 than m / z corresponding to the peak in “A”).
- a position on a large horizontal axis is extracted on both sides.
- the peak * here can be defined, for example, as “showing an intensity of about 0.01% to several percent or more with respect to the Pmax”.
- peaks having peaks in all of m / z in the MS / MS spectrum “A” and m / z and m / z + 1 in the MS / MS spectrum “A + 1” are selected and displayed on the peak list display unit 24Bf. Is done. The user can select a desired peak by checking a part or all of the check list in the peak list display unit 24Bf.
- the user 200 can further input the carbon atom number x to the carbon atom number input unit 24Bg.
- the master control unit 30 calculates the initial value of the carbon atom number x, and sets the calculated value in the carbon atom number input unit 24Bf (S314).
- the initial value of the number of carbon atoms x is an estimated value x e of the number of carbon atoms calculated based on the above formula (2).
- the master control unit 30 further calculates an estimate of the number of nitrogen from the estimated value x e of m / z and the number of carbon atoms of the peak of the mass spectrum is displayed on the display unit 24Bh together this. Peak is selected by the user 200, the user 200 clicks the "Next" button in the state of being set estimated value x e of the number of carbon atoms, the process proceeds to the first result output screen 24C.
- the master control unit 30 causes the first carbon atom number estimation unit 32 to estimate the number of carbon atoms (S318; S400 to S416 in FIG. 15).
- FIG. 15 is a flowchart relating to the carbon atom number estimation by the first carbon atom number estimation unit 32.
- the first carbon atom number estimation unit 32 first takes out one set of adjacent peaks selected on the peak selection screen 24B (S400), and calculates the intensity ratio (S402).
- the variable t when the difference D becomes the smallest is determined as the number of carbon atoms (estimated value) x fe of the fragment ions (S414).
- a routine for overwriting and storing the variables D when a smaller value is calculated may be used.
- the master control unit 30 further dissociates the calculated fragment atom carbon atom number (estimated value) x fe from the theoretical value. Is calculated by the evaluation unit 36 (described later), and the first result output screen 24C is displayed on the display device 24 (S320).
- FIG. 16 is an example of a first result output screen 24 ⁇ / b> C displayed by the display device 24.
- the mass spectrum / MS / MS spectrum (“A”, “A + 1”) is displayed on the display unit 24Ca (the same data as the peak selection screen 24B).
- “Fit Rate”, which is the evaluation value calculated by the evaluation unit 36, is displayed for each peak selected on the peak selection screen 24B.
- “Target Mass” corresponds to m / z of the selected peak.
- a trend line of “Fit Rate” for each assumed number of carbon atoms of the precursor ion is further displayed on the display unit 24Cc.
- the “Fit Rate”, that is, the dissociation from the theoretical value calculated by the evaluation unit 36 is based on, for example, the following equation (10). Each parameter is used in the flow of FIG. If the “Fit Rate” is close to 100, the reliability of the number of carbon atoms (estimated value) x fe of the fragment ion is high, and the reliability is low as the distance from 100 is far. The user can determine whether or not estimation using the “estimation principle using labeled data” is necessary by visually checking these “Fit Rate”.
- the master control unit 30 displays the setting input screen 24D shown in FIG. 17 on the display device 24 (S330).
- FIG. 17 is an example of a setting input screen 24 ⁇ / b> D displayed by the display device 24.
- the user 200 operates the first selection unit 24Da on the setting input screen 24D with a mouse or the like, and selects the measurement data labeled.
- the user 200 operates the second selection unit 24Db of the setting input screen 24D with a mouse or a keyboard, and specifies the labeling content (shift value, number of carbon atoms, etc.).
- the user 200 operates the third selection unit 24Dc and the fourth selection unit 24Dd of the setting input screen 24D with a mouse or a keyboard to specify the peak range Ar3 and the difference region Ar4. .
- the user 200 operates the spectrum designation sections 24Da to 24Bc on the setting input screen 24D with a mouse or the like to designate a mass spectrum / MS / MS spectrum.
- the master control unit 30 displays the peak selection screen 24E on the display device 24 (S334).
- FIG. 18 is an example of a peak selection screen 24E displayed by the display device 24.
- the master control unit 30 creates a peak list and displays it on the peak list display unit 24Ea. (S338).
- the peak list is created according to the following procedure.
- the “peak” here is defined as having a height equal to or higher than the ratio (%) input to the threshold value input unit 24Eb with respect to the height of the maximum peak of the non-label data.
- the MS / MS spectrum “A + 1” of the non-label data (upper) and the labeled data (lower) is displayed on the display 24Ec.
- a peak (m / z) on non-label data that satisfies the following conditions (c) and (d) is extracted. Those satisfying the conditions (c) and (d) indicate the fragment ions (non-shift; NS) in which the m / z does not increase in the labeled data described with reference to FIG. (C) There is a peak (m / z + 1) in the non-label data.
- a peak (m / z) on the non-label data that satisfies the following conditions (e) and (f) is extracted. Those satisfying the conditions (e) and (f) indicate fragment ions (shift; S) in which m / z increases in the labeled data, as described in FIG. (E) There is a peak (m / z + 1) in the non-label data. (F) A peak (m / z + shift) and a peak (m / z + shift + 1) exist in the labeled data.
- the master control unit 30 publishes what satisfies the above (c), (d) or (e), (f) in the peak list. Then, an identifier of “NS” is assigned to those satisfying (c) and (d), and an identifier of “S” is assigned to those satisfying (e) and (f), and displayed on the peak list display unit 24Ea. .
- the user 200 can select a desired peak by checking a part or all of the check list in the peak list display unit 24Ea.
- the identifiers “NS” and “S” are displayed, it is possible to select to estimate the number of carbon atoms using any one (or both) of non-shift and shift.
- the master control unit 30 causes the second carbon atom number estimation unit 34 to estimate the number of carbon atoms (S342).
- the second carbon atom number estimation unit 34 estimates the number of carbon atoms of the fragment ion based on the above-described “estimation principle using labeled data”.
- the master control unit 30 displays the second result output screen 24F on the display device 24 (S344).
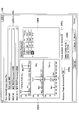
- FIG. 19 is an example of a second result output screen 24F displayed by the display device 24.
- the MS / MS spectrum “A + 1” of the non-label data and the MS / MS spectrum “A + 1” of the labeled data are compared and displayed on the comparison display unit 24Fa of the second result output screen 24F.
- the MS / MS spectrum “A + 1” of the labeled data is normalized by multiplying the correction coefficient as a whole so that any of the adjacent peaks coincides with the peak of the non-label data.
- the m / z of the peak in the original data (“Base Mass” in the figure) and the estimated value of the number of carbon atoms of the fragment ion corresponding to the peak (in the figure) , “Carbon”) and the evaluation value (“Fit Rate” in the figure) by the evaluation unit 36 of the estimated value are displayed side by side.
- the evaluation value on the second result output screen 24F is calculated by the following equation (11), for example.
- y is the known number of nitrogen atoms or the number of nitrogen atoms estimated from the A + 1 ion intensity of the mass spectrum
- ye is an estimated value of the number of nitrogen atoms.
- “Fit Rate” ⁇ 1+ (y ⁇ e e ) / y ⁇ ⁇ 100 (11)
- the display content of the comparison display unit 24Fa reflects the content of the peak described in the row selected by the user 200 in the estimation result display unit 24Fb.
- FIG. 19 shows a display screen when non-shift data is selected, but the comparison display section 24Fa when shift data is selected is as shown in FIG.
- FIG. 20 is another example of the display contents of the comparison display unit 24Fa.
- the first carbon atom number estimation unit 32 and the second carbon atom number estimation unit 34 are provided, and “the estimation principle based on the height ratio of adjacent peaks”, Since the number of carbon atoms can be estimated based on both of the “estimation principle using labeled data”, the number of carbon atoms can be estimated more accurately.
- the master control unit 30 of the analysis apparatus 1 replaces the processing of S322 in FIG. 12 with evaluation values FIT1 and FIT2 that comprehensively evaluate the number of carbon atoms (estimated value) x fe of all fragment ions in the evaluation unit 36.
- evaluation values FIT1 and FIT2 that comprehensively evaluate the number of carbon atoms (estimated value) x fe of all fragment ions in the evaluation unit 36.
- FIT1 or FIT2 exceeds a predetermined value (ie, when the degree of coincidence between the theoretical value and the actual measurement value is low)
- the process automatically proceeds to S330. May be.
- r n is the dissociation of the estimated value ( "Fit Rate" -100) That theory, n represents the number of carbon atoms identifier (estimated value) x fe is calculated fragment ions (number).
- FIG. 21 is a diagram showing the relationship between the values of FIT1 and FIT2 and the causes of their dissociation.
- the shaded portion indicates a case where estimation by the second carbon atom number estimation unit 34 is necessary.
- FIT1 ⁇ (r n ) / n
- FIT2 ⁇ (r n ) 2 / n
- FIG. 21 is a diagram showing the relationship between the values of FIT1 and FIT2 and the causes of their dissociation.
- the shaded portion indicates a case where estimation by the second carbon atom number estimation unit 34 is necessary.
- FIT1 is small but FIT2 is large, nitrogen is localized and contained, or the estimated value is dissociated due to peak overlap, and the second carbon atom number estimating unit 34 It is thought that estimation by is necessary.
- the evaluation unit 36 notifies the master control unit 30 that estimation by the second carbon atom number estimation unit 34 is necessary in the middle and lower stages in FIG. Upon receiving this, the master control unit 30 activates the second carbon atom number estimation unit 34, and automatically executes the processing from S330 onward in FIG.
- control is performed so that the “Extended Analysis” checkbox appears (or can be checked), and FIT1
- the second carbon atom number estimation unit 34 may be activated.
Landscapes
- Physics & Mathematics (AREA)
- Chemical & Material Sciences (AREA)
- Health & Medical Sciences (AREA)
- Life Sciences & Earth Sciences (AREA)
- Analytical Chemistry (AREA)
- Spectroscopy & Molecular Physics (AREA)
- Chemical Kinetics & Catalysis (AREA)
- Electrochemistry (AREA)
- Molecular Biology (AREA)
- Biochemistry (AREA)
- General Health & Medical Sciences (AREA)
- General Physics & Mathematics (AREA)
- Immunology (AREA)
- Pathology (AREA)
- Other Investigation Or Analysis Of Materials By Electrical Means (AREA)
Abstract
質量分析計から取得されたデータを解析して、イオン化された試料から解離したフラグメントイオンの炭素原子数を推定する解析装置であって、前記試料から得られるMS/MSスペクトルにおける質量電荷比が1異なる隣接ピークの高さ比に基づいて前記フラグメントイオンの炭素原子数を推定する第1の炭素原子数推定手段と、前記試料から得られるMS/MSスペクトルにおける質量電荷比が1異なる隣接ピークの高さ比と、前記試料に炭素原子数が既知の物質を付与し、又は前記試料から炭素原子数が既知の物質を脱離させたラベル化試料から得られるMS/MSスペクトルにおける質量電荷比が1異なる隣接ピークの高さ比と、の相違量に基づいて前記フラグメントイオンの炭素原子数を推定する第2の炭素原子数推定手段と、を備える解析装置。
Description
本発明は、解析装置、解析方法、及び記憶媒体に関する。
従来、タンデム質量分析計等の質量分析計を用いて、イオン化された試料(Precursor Ion;以下、プリカーサイオンと表記する)、及びこれを解離させて得られるフラグメントイオンについて、質量電価比(m/z)毎に検出された強度(Intensity)を検知可能なスペクトルデータを取得し、これを解析することにより試料やフラグメントイオンの炭素原子数を推定する技術が知られている。
この種の質量分析計では、炭素原子12Cの同位体(Isotope)13Cを含むプリカーサイオンと、含まないプリカーサイオンとを電気的・磁気的な作用等により分離し、それぞれの強度を取得して出力する。これらの強度比から、試料に含まれる炭素原子数が推定される。
更に、質量分析計は、分離したそれぞれのプリカーサイオンを解離させてフラグメントイオンを生成し、各フラグメントイオンについてのスペクトルデータを取得する。プリカーサイオンを解離させる際には、例えば、ターゲットガス(例えばXe)をプリカーサイオンに複数回衝突させ、衝突誘起解離を生じさせる工程が採用される(CID:Collision-Induced Dissociation)。
そして、各フラグメントイオンにおける質量電荷比の分布、及び上記推定された炭素原子数から各フラグメントイオンが同定され、推定された炭素原子数と同定されたフラグメントイオンを総合的に判断することによって、元の試料の分子構造が推定される。
質量分析計の構造や機能については、例えば特許文献1及び2に記載されている。
また、非特許文献1には、同位体選択MS/MS法のデータ解析を自動化できるアルゴリズムを含み,MS/MSスペクトル中のフラグメントイオンの推定炭素原子数を、簡便な操作で算出できるソフトウエアの概要について記載されている。
「金子恒顕・本山晃、『API(Application Programming Interface)を利用した質量分析・データ解析支援ツールの開発』、株式会社資生堂フロンティアサイエンス事業部、同リサーチセンター」、第58回質量分析総合討論会(日本質量分析学会主催)、2010/6/15-18、つくば
しかしながら、スペクトルデータは、炭素以外の元素の同位体の存在により変動する場合もある。従来の解析手法では、隣接ピークの高さ比に基づく推定原理によって推定を行っていたため、炭素以外の元素の同位体を考慮することができず、炭素原子数を正確に解析することができない場合があった。
本発明はこのような課題を解決するためのものであり、より正確に炭素原子数を推定することが可能な解析装置等を提供することを目的の1つとする。
本発明の実施の形態の一側面によれば、
質量分析計から取得されたデータを解析して、イオン化された試料から解離したフラグメントイオンの炭素原子数を推定する解析装置であって、
前記試料から得られるMS/MSスペクトルにおける質量電荷比が1異なる隣接ピークの高さ比に基づいて前記フラグメントイオンの炭素原子数を推定する第1の炭素原子数推定手段と、
前記試料から得られるMS/MSスペクトルにおける質量電荷比が1異なる隣接ピークの高さ比と、前記試料に炭素原子数が既知の物質を付与し、又は前記試料から炭素原子数が既知の物質を脱離させたラベル化試料から得られるMS/MSスペクトルにおける質量電荷比が1異なる隣接ピークの高さ比と、の相違量に基づいて前記フラグメントイオンの炭素原子数を推定する第2の炭素原子数推定手段と、
を備える解析装置が提供される。
質量分析計から取得されたデータを解析して、イオン化された試料から解離したフラグメントイオンの炭素原子数を推定する解析装置であって、
前記試料から得られるMS/MSスペクトルにおける質量電荷比が1異なる隣接ピークの高さ比に基づいて前記フラグメントイオンの炭素原子数を推定する第1の炭素原子数推定手段と、
前記試料から得られるMS/MSスペクトルにおける質量電荷比が1異なる隣接ピークの高さ比と、前記試料に炭素原子数が既知の物質を付与し、又は前記試料から炭素原子数が既知の物質を脱離させたラベル化試料から得られるMS/MSスペクトルにおける質量電荷比が1異なる隣接ピークの高さ比と、の相違量に基づいて前記フラグメントイオンの炭素原子数を推定する第2の炭素原子数推定手段と、
を備える解析装置が提供される。
本発明によれば、より正確に炭素原子数を推定することが可能な解析装置等を提供することができる。
以下、本発明を実施するための形態について、添付図面を参照しながら実施例を挙げて説明する。
以下、図面を参照し、本発明の一実施例に係る解析装置1について説明する。
[基本構成]
図1は、本発明の一実施例に係る解析装置1のシステム構成例である。図示するように、解析装置1は、例えばタンデム質量分析計100に接続され、ユーザ200によって種々の設定入力等が行われるコンピュータである。
図1は、本発明の一実施例に係る解析装置1のシステム構成例である。図示するように、解析装置1は、例えばタンデム質量分析計100に接続され、ユーザ200によって種々の設定入力等が行われるコンピュータである。
また、解析装置1は、例えば、CPU(Central Processing Unit)10と、ドライブ装置12と、補助記憶装置16と、メモリ装置18と、インタフェース装置20と、入力装置22と、表示装置24と、を備える。これらの構成要素は、バスやシリアル回線等を介して接続されている。
CPU10は、例えば、プログラムカウンタや命令デコーダ、各種演算器、LSU(Load Store Unit)、汎用レジスタ等を有するプロセッサである。ドライブ装置12は、記憶媒体14からプログラムやデータを読み込み可能な装置である。プログラムを記録した記録媒体14がドライブ装置12に装着されると、プログラムが記録媒体14からドライブ装置12を介して補助記憶装置16にインストールされる。記録媒体14は、例えば、CD-ROM、DVDディスク、USBメモリ等の可搬型の記録媒体である。また、補助記憶装置16は、例えば、HDD(Hard Disk Drive)やフラッシュメモリである。
プログラムのインストールは、上記のように記憶媒体14を用いる他、インタフェース装置20がネットワークを介して他のコンピュータよりダウンロードし、補助記憶装置16にインストールすることによって行うこともできる。また、情報処理装置の出荷時に、予め補助記憶装置16やROM(Read Only Memory)等に格納されていてもよい。このようにしてインストール又は予め格納されたプログラムをCPU10が実行することにより、図1に示す態様の情報処理装置が、本実施例の解析装置1として機能することができる。
メモリ装置18は、例えば、RAM(Random Access Memory)やEEPROM(Electrically Erasable and Programmable Read Only Memory)である。インタフェース装置20は、上記ネットワークとの接続等を制御する。入力装置22は、例えば、キーボードやマウス、タッチパッド、タッチパネル、マイク等である。また、表示装置24は、例えば、LCD(Liquid Crystal Display)やCRT(Cathode Ray Tube)等の表示装置である。
なお、図2は、本発明の一実施例に係る解析装置1の他のシステム構成例である。図示するように、解析装置1は、ユーザ200によって設定入力が行われる一以上のクライアントコンピュータ50に接続されたサーバ装置であってもよい。
図3は、タンデム質量分析計100の機能構成を模式的に示す図である。タンデム質量分析計100は、例えば、試料導入・イオン化室101と、第1計測部・フィルター部102と、衝突室103と、フィルター部・第2計測部104と、記録部105と、を有する。
試料導入・イオン化室101では、分子構造を解析する対象となる試料が真空中又は気体中に導入され、EI(Electron Ionization)、化学イオン化(CI)法、電界脱離(FD)法、高速原子衝突(FAB)法、マトリックス支援レーザー脱離イオン化(MALDI)法、エレクトロスプレーイオン化(ESI)法、大気圧化学イオン化(APCI)法等の手法によりイオン化される。
第1計測部102では、イオン化された試料、すなわちプリカーサイオンを質量電価比(m/z)に対応付けて検出すると共に、プリカーサイオンをm/z毎に分離して選択的に衝突室103に放出する。検出した結果は、記録部105に提供される。ここで、プリカーサイオンを分離するとは、主に、同位体を含まないプリカーサイオンと、同位体を含むことによりm/zが1以上大きいプリカーサイオンとを電気的・磁気的な作用等により分離することを意味する。同位体を含まないプリカーサイオンの放出と、同位体を含むプリカーサイオンの放出は、例えば交互に繰り返し行われる。
衝突室103では、m/zに応じて分離されたそれぞれのプリカーサイオンにターゲットガス(例えばXe)を複数回衝突させ、衝突誘起解離を生じさせてフラグメントイオンとする(CID:Collision-Induced Dissociation)。
第2計測部104では、衝突室103で発生したフラグメントイオンをm/z毎に検出して記録部105に提供する。
記録部105では、第1計測部102から提供されるプリカーサイオンの検出データ、及び第2計測部104から提供されるフラグメントイオンの検出データを時系列で格納する。各検出データは、検出された強度とm/zが対応付けられたデータ、すなわちm/zを軸とした強度の分布を検知可能なスペクトルデータである。以下、第1計測部102から提供されるプリカーサイオンの検出データをマススペクトルと称し、第2計測部104から提供されるフラグメントイオンの検出データをMS/MSスペクトルと称する。
なお、記録部105の動作は、例えば、(1)プリカーサイオンの検出データを格納、(2)同位体を含まないプリカーサイオンから生じたフラグメントイオンの検出データを格納、(3)同位体を含むプリカーサイオンから生じたフラグメントイオンの検出データを格納という順で、一定期間繰り返し行われる。
以下、必要に応じて、同位体を含まないプリカーサイオンから生じたフラグメントイオンのMS/MSスペクトルを「A」、同位体を含むプリカーサイオンから生じたフラグメントイオンのMS/MSスペクトルを「A+1」と模式的に表現する。
記録部105は、このように一定期間の間に格納されたスペクトルデータを、解析装置1に出力する。解析装置1では、入力されたスペクトルデータをメモリ装置18や補助記憶装置16に格納する。
なお、本発明の適用上、プリカーサイオンとフラグメントイオンのスペクトルデータを取得可能なものであれば、タンデム質量分析計に限らず、他の種類の質量分析計が用いられても構わない。
[解析原理、及び解析装置の機能構成]
図4は、本実施例の解析装置1の機能構成例である。解析装置1は、マスター制御部30と、第1の炭素原子数推定部32と、第2の炭素原子数推定部34と、評価部36と、を備える。これらの機能ブロックは、補助記憶装置16等に格納されたプログラム・ソフトウエアをCPU10が実行することにより機能する。なお、各機能ブロックが明確に別のプログラムにより実現される必要はなく、いずれかの機能ブロックが、サブルーチン等で他の機能ブロックにより呼び出されるものであっても構わない。また、このようなソフトウエアブロックに限らず、IC(Integrated Circuit)やFPGA(Field Programmable Gate Array)等のハードウエアによってこれらの機能ブロックが実現されてもよい。各機能ブロックの機能については、後述する。
図4は、本実施例の解析装置1の機能構成例である。解析装置1は、マスター制御部30と、第1の炭素原子数推定部32と、第2の炭素原子数推定部34と、評価部36と、を備える。これらの機能ブロックは、補助記憶装置16等に格納されたプログラム・ソフトウエアをCPU10が実行することにより機能する。なお、各機能ブロックが明確に別のプログラムにより実現される必要はなく、いずれかの機能ブロックが、サブルーチン等で他の機能ブロックにより呼び出されるものであっても構わない。また、このようなソフトウエアブロックに限らず、IC(Integrated Circuit)やFPGA(Field Programmable Gate Array)等のハードウエアによってこれらの機能ブロックが実現されてもよい。各機能ブロックの機能については、後述する。
ここで、解析装置1による炭素原子数の推定原理について説明する。
-隣接ピークの高さ比に基づく推定原理-
まず、隣接ピークの高さ比に基づく推定原理について説明する。
まず、隣接ピークの高さ比に基づく推定原理について説明する。
ここでは、対象となる試料のプリカーサイオンの分子式が主に[12CxHyOz
+]で表されるものとする。炭素原子12Cには一定割合で中性子の数が1多い同位体13Cが含まれ、その割合は1.1[%]であることが知られている。従って、当該試料をイオン化すると、「炭素原子数×1.1[%]」の割合で、分子式が[12Cx-1
13C1HyOz
+]で表されるプリカーサイオンが現れる。なお、いずれの場合も、炭素原子の数はxとカウントする。
図5は、当該試料をイオン化して取得されるスペクトルデータを示す図である。なお、本図は最大高さ(強度)を100に正規化している。図示するように、プリカーサイオン[12CxHyOz
+]のm/zは249であり、プリカーサイオン[12Cx-1
13C1HyOz
+]のm/zは250であるものとする。図中、「h」は、イオン[12CxHyOz
+]とイオン[12Cx-1
13C1HyOz
+]の強度比([%])であり、上記より、次式(1)が成立する。このようにして当該試料の炭素原子数の推定値xeが得られる。
xe=h/1.1 …(1)
次に、フラグメントイオンのスペクトルデータについて説明する。ここでは、試料として化学式(1)で表されるピンドロール[12C14H20N2O2]を例にとって説明する。
次に、フラグメントイオンのスペクトルデータについて説明する。ここでは、試料として化学式(1)で表されるピンドロール[12C14H20N2O2]を例にとって説明する。

図6は、ピンドロールから生成されるプリカーサイオン及びフラグメントイオンのスペクトルデータを示す図である。図6の上段は、既に図5で示した通り、ピンドロールから生成されるプリカーサイオンのマススペクトルを示している。また、図6の中段は、同位体13Cを含まないピンドロールから生成されるフラグメントイオンのMS/MSスペクトル(図中、Regular MS/MSと表記)「A」を示しており、図6の下段は、同位体13Cを含むピンドロールから生成されるフラグメントイオンのMS/MSスペクトル(図中、Isotope-selective MS/MSと表記)「A+1」を示している。縦軸の相対強度は、プリカーサイオンのスペクトルデータの最大値を100とした場合の相対値である。これらのMS/MSスペクトルは、前述のようにタンデム質量分析計100の機能によって取得可能である。
図6の中段に示すように、MS/MSスペクトル「A」におけるピークは単峰状となる。一方、図6の下段に示すように、MS/MSスペクトル「A+1」におけるピークは基本的に双峰状(又は多峰状)となる。同位体13Cを含むピンドロールから生成されるフラグメントイオンは、同位体13Cを含むものと、含まないものに分かれるからである。
隣接する双峰状のフラグメントイオンのピークは、その強度比が、[8:6]、[5:9]、[3:11]等となって現れる。この強度比は、同位体13Cが、フラグメントイオンと中性の脱離基とのいずれに含まれるかを示す分配比である。例えば、強度比が[3:11]であるm/zが172又は173のピークに相当するフラグメントイオンのうち、11/14は、同位体13Cを含むフラグメントイオンである。図7は、同位体13Cを含むピンドロール(同位体13Cの位置は不明)から生成されるフラグメントイオン又は脱離基において、同位体13Cが存在しうる位置を列挙した図である。図示するように、同位体13Cがフラグメントイオン側に存在するパターンは、全14パターンのうち11パターンとなる。この結果、フラグメントイオンのピークの強度比が[3:11]となる。フラグメントイオン[C11H10NO]に13Cが含まれる場合と、脱離基2-アミノプロパン[C3H9N]に13Cが含まれる場合の比は、それぞれの炭素原子数に比例するからである。
このような原理により、ピンドロールから生成されるフラグメントイオンにおいて、m/zが172又は173のピークの強度比は、[3:11]と計測されることになる。他の強度比についても、同様の原理が成立する。
係る原理に基づき、強度比が[8:6]、[5:9]、[3:11]と得られると、これに元の試料の炭素原子数xの推定値を加味して、それぞれのピークに相当するフラグメントイオンの炭素原子数を、6、9、11と推定することができる。強度比が[α、β]である場合のフラグメントイオンの炭素原子数(理論値)xfは、例えば次式(2)に基づいて推定することができる。
xf=xe×{β/(α+β)} …(2)
なお、試料やフラグメントイオンの炭素原子数を取得するだけでなく、試料の分子構成を推定する際には、炭素原子の同位体を含まないものと炭素原子の同位体を含むものとがフラグメントイオンにおいて[8:6]、[5:9]、[3:11]等の割合で現れる既知の物質を探せばよい。この既知の物質の同定には、前述した炭素原子数の推定値xeと、フラグメントイオンの炭素原子数(理論値)xfが総合的に考慮される。
なお、試料やフラグメントイオンの炭素原子数を取得するだけでなく、試料の分子構成を推定する際には、炭素原子の同位体を含まないものと炭素原子の同位体を含むものとがフラグメントイオンにおいて[8:6]、[5:9]、[3:11]等の割合で現れる既知の物質を探せばよい。この既知の物質の同定には、前述した炭素原子数の推定値xeと、フラグメントイオンの炭素原子数(理論値)xfが総合的に考慮される。
以上が、「隣接ピークの高さ比に基づく推定原理」の概要である。
-ラベル化データを用いた推定原理-
ところで、同位体が存在する可能性が比較的高く、且つ多くの物質に含まれる元素としては、炭素の他に窒素が挙げられる。炭素原子中に出現する同位体の割合は1.1[%]であるのに対し、窒素原子中に出現する同位体15Nの割合は0.37[%]であることが知られており、無視できない割合となっている。この結果、窒素原子の同位体が存在することによって、専ら炭素原子に着目した推定原理のみでは、炭素原子数の推定を正確に行うことができない場合がある。
ところで、同位体が存在する可能性が比較的高く、且つ多くの物質に含まれる元素としては、炭素の他に窒素が挙げられる。炭素原子中に出現する同位体の割合は1.1[%]であるのに対し、窒素原子中に出現する同位体15Nの割合は0.37[%]であることが知られており、無視できない割合となっている。この結果、窒素原子の同位体が存在することによって、専ら炭素原子に着目した推定原理のみでは、炭素原子数の推定を正確に行うことができない場合がある。
これを解決するために、以下の推定原理を採用する。まず、同一の試料に対して、メチル[CH3]やエチル[CH3CH2]等の炭素原子数が判明している既知の物質(以下、ラベル物質と称する)を何らかの手法により付与したもの、又は炭素原子数が判明している既知の物質を脱離させたもの(ラベル化試料)に関するマススペクトル及びMS/MSスペクトル「A」・「A+1」をタンデム質量分析計100から取得する(以下、ラベル化データと称する)。また、上記説明したラベル物質を付与し又は脱離させていない元の試料から得られるデータ(以下、ノンラベルデータと称する)を併せて利用する。ここで、試料からラベル物質を脱離させる例としては、エステルを酸とアルコールに分解するケースが挙げられる。
なお、タンデム質量分析計100の説明においては言及しなかったが、ノンラベルデータとラベル化データは、ある試料が選択された際に、まずノンラベルデータが取得され、次にラベル化データが取得されるという手順で、併せて取得されるものとする。
図8は、化学式(2)で表されるアルギニン[C6H15O2N4]に対してメチル、及びエチルを付与した試料から得られるマススペクトルを示す図である。図8の上段は、アルギニンを試料とした場合のマススペクトルであり、図8の中段は、アルギニンに対してメチルを付与した場合のマススペクトルであり、図8の下段は、アルギニンに対してエチルを付与した場合のマススペクトルである。
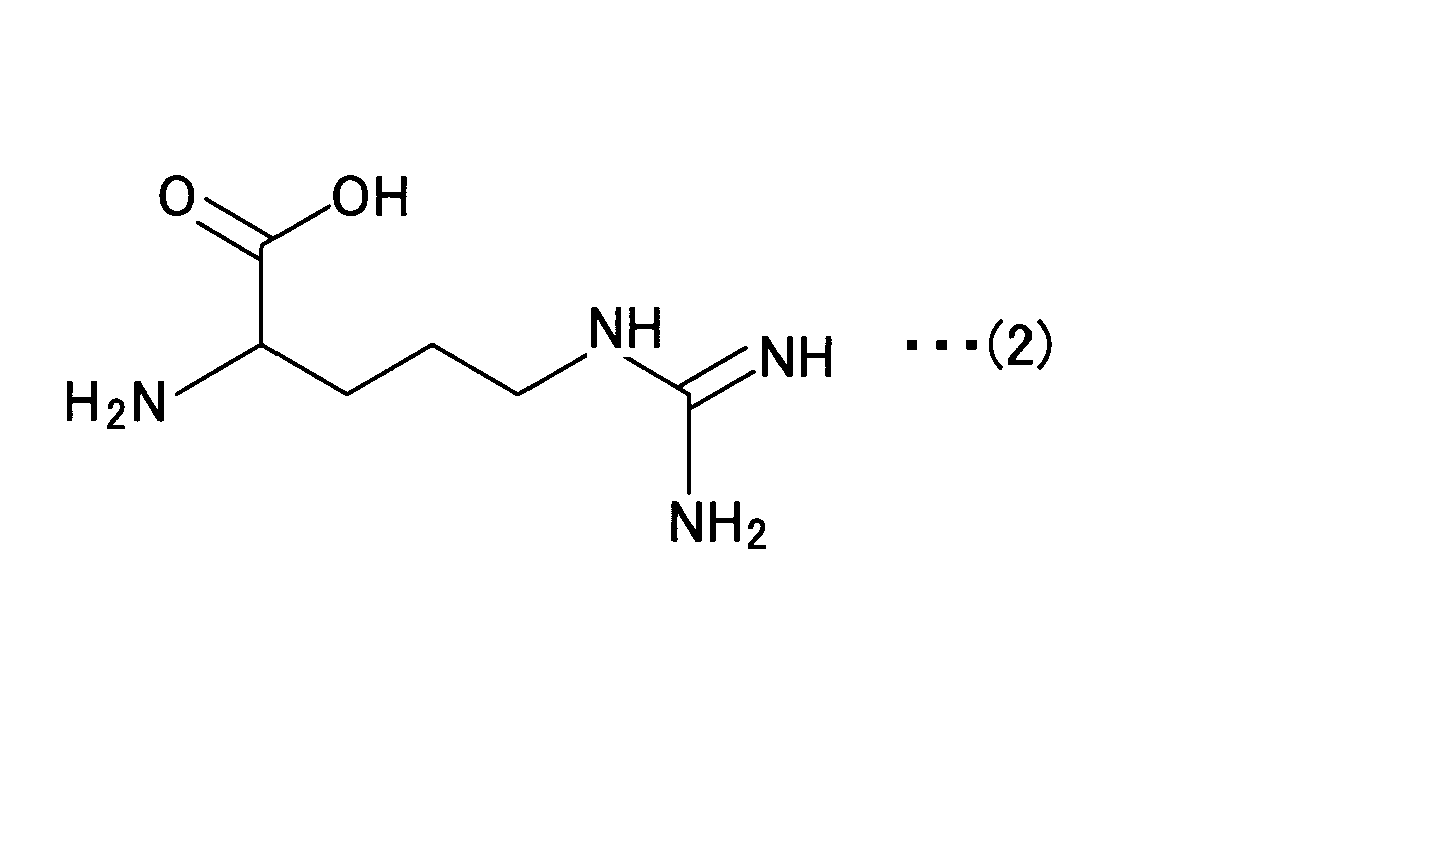
アルギニンに対してメチルを付与した場合、元々の[H]が[CH3]に置き換わるため、m/zが14増加することになる。また、アルギニンに対してメチルを付与した場合、元々の[H]が[CH3CH2]に置き換わるため、m/zが28増加することになる。
また、ラベル物質を試料に付与して質量分析を行うと、衝突誘起解離を生じさせた際に、ラベル物質がフラグメントイオン側に付随する場合と、脱離基側に付随する場合に分かれる。ラベル物質(メチル)がフラグメントイオン側に付随する場合、ラベル化データの「A+1」において、フラグメントイオンのm/zは14増加する。一方、ラベル物質(メチル)が脱離基側に付随する場合、ラベル化データの「A+1」において、フラグメントイオンのm/zは変化しない。
図9は、ラベル化データの「A+1」においてフラグメントイオンのm/zが増加する場合としない場合を模式的に示す図である。
図9に示すように、フラグメントイオンのm/zが増加する場合としない場合のいずれにおいても、隣接するm/zが1異なるピークの高さ比をノンラベルデータとラベル化データで正規化した上で比較すると、炭素原子1個分に相当する変化が生じる。正規化とは、隣接するピークのうち左側又は右側がノンラベルデータとラベル化データで同じ高さとなるように、ノンラベルデータとラベル化データの一方に係数を乗じることをいう。図中、係る高さの変化分をCnと表記した。なお、ラベル物質がエチルであれば、Cnは炭素原子2個分に相当する高さとなり、ラベル物質が更に炭素原子数の多いものであれば、Cnは更に高いものとなる。
ラベル物質(メチル)がフラグメントイオン側に付随する場合のピークに関しては、右側のピークが炭素原子1個分高くなり、ラベル物質(メチル)が脱離基側に付随する場合のピークに関しては、左側のピークが炭素原子1個分高くなる。
本推定原理では、このノンラベルデータとラベル化データの間で生じた高さ比の変化を利用して、フラグメントイオンの炭素原子数を推定する。具体的には、例えばノンラベルデータとラベル化データの左右のピークのいずれかの高さを揃えるように正規化し、その上で得られたCnが炭素原子1個分の強度であると認識する。そして、左右のいずれかのピークの高さをCnで除算することにより、フラグメントイオンの炭素原子数を推定する。
より具体的には、ラベル化データにおいてm/zが増加しないフラグメントイオン(以下、ノンシフトと称する)の場合は、隣接ピークのうち左側のピークの高さを、ノンラベルデータの左側のピークの高さに揃えるように正規化する。図10は、フラグメントイオンがノンシフトの場合の正規化、及び炭素原子数推定原理を説明するための説明図である。ここでは、ノンラベルデータの左側のピークをh1、右側のピークをh2、ラベル化データの左側のピークをh1*、右側のピークをh2*とする。正規化の対象となるのはラベル化データの各ピークであり、正規化されたラベル化データのピークh1**、h2**は、次式(3)、(4)で表される。なお、本図では、プリカーサイオンが[C6N3]、フラグメントイオンが[C1N3]である。
h1**=h1*×(h2/h2*) …(3)
h2**=h2*×(h2/h2*)=h2 …(4)
こうして正規化が行われると、正規化されたラベル化データの左側のピークh1**と、ノンラベルデータの左側のピークh1の差分が、ラベル物質の炭素原子数に相当する絶対強度、すなわちCnとなる。
h2**=h2*×(h2/h2*)=h2 …(4)
こうして正規化が行われると、正規化されたラベル化データの左側のピークh1**と、ノンラベルデータの左側のピークh1の差分が、ラベル物質の炭素原子数に相当する絶対強度、すなわちCnとなる。
Cnが算出されると、元の試料の炭素原子数の推定値xeを用いて、次式(5)によりノンラベルデータの左右のピークの合計から窒素原子数の推定値yeを算出する。式中、「0.327」は、窒素原子中に出現する同位体15Nの割合(0.37[%])を、炭素原子中に出現する同位体の割合(1.1[%])で除した値である。このような値を用いるのは、ノンラベルデータの右側のピークでは、炭素原子の同位体13Cと窒素原子の同位体15Nが混在しており、左右のピークの和から(Cn×xe)を差し引いた残差に影響を与えた同位体の比は、[炭素:窒素]で[1:0.327]となるからである。
ye={(h1+h2)-(Cn×xe)}/(0.327×Cn) …(5)
窒素原子数の推定値yeを算出すると、次式(6)、(7)に示すように、窒素原子数の推定値yeが2以下の場合と、3以上の場合に分けて、フラグメントイオンの炭素原子数xfを推定する。式(7)においていずれの値を採用するかは、他の条件(ピークが異なるフラグメントイオンの炭素原子数等)を加味して総合的に判断されるので、ここでは、二通り以上の解を出力するものとする。窒素原子数が三個であるか、炭素原子数が一個であるかは質量分析計の精度が十分でなければ判別が困難だからである。
窒素原子数の推定値yeを算出すると、次式(6)、(7)に示すように、窒素原子数の推定値yeが2以下の場合と、3以上の場合に分けて、フラグメントイオンの炭素原子数xfを推定する。式(7)においていずれの値を採用するかは、他の条件(ピークが異なるフラグメントイオンの炭素原子数等)を加味して総合的に判断されるので、ここでは、二通り以上の解を出力するものとする。窒素原子数が三個であるか、炭素原子数が一個であるかは質量分析計の精度が十分でなければ判別が困難だからである。
xf=h2/Cn(余りを切り捨て) …(6)
=h2/Cn(余りを切り捨て) or h2/Cn(余りを切り捨て)-n* …(7) 但し、n*は、yeを3で除した値(余りを切り捨て)。
=h2/Cn(余りを切り捨て) or h2/Cn(余りを切り捨て)-n* …(7) 但し、n*は、yeを3で除した値(余りを切り捨て)。
図11は、フラグメントイオンがシフトの場合の正規化、及び炭素原子数推定原理を説明するための説明図である。ここでも、図10と同様に、ノンラベルデータの左側のピークをh1、右側のピークをh2、ラベル化データの左側のピークをh1*、右側のピークをh2*とする。図中、「b」は、「a」からラベル物質のm/z分シフトさせた値である。正規化の対象となるのはラベル化データの各ピークであり、正規化されたラベル化データのピークh1**、h2**は、次式(8)、(9)で表される。
h1**=h1*×(h1/h1*)=h1 …(8)
h2**=h2*×(h1/h1*) …(9)
こうして正規化が行われると、正規化されたラベル化データの右側のピークh2**と、ノンラベルデータの右側のピークh2の差分が、ラベル物質の炭素原子数に相当する絶対強度、すなわちCnとなる。
h2**=h2*×(h1/h1*) …(9)
こうして正規化が行われると、正規化されたラベル化データの右側のピークh2**と、ノンラベルデータの右側のピークh2の差分が、ラベル物質の炭素原子数に相当する絶対強度、すなわちCnとなる。
Cnが算出されると、元の試料の炭素原子数の推定値xeを用いて、上式(5)によりノンラベルデータの左右のピークの合計から窒素原子数の推定値yeを算出する。窒素原子数の推定値yeを算出すると、上式(6)、(7)に示すように、窒素原子数の推定値yeが2以下の場合と、3以上の場合に分けて、フラグメントイオンの炭素原子数xfを推定する。
このように、ラベル化物質の炭素原子数に相当する高さを絶対値Cnとして把握し、これを用いて、除算を行った余りを窒素原子に相当する高さであると推定することにより、「隣接ピークの高さ比に基づく推定原理」よりも精緻な推定を行うことができる。
以上が、「ラベル化データを用いた推定原理」の概要である。
本実施例の解析装置1では、第1の炭素原子数推定部32は、上記説明した「隣接ピークの高さ比に基づく推定原理」に基づいて推定を行い、第2の炭素原子数推定部34は、上記説明した「ラベル化データを用いた推定原理」に基づいて推定を行う。
(処理の流れ)
以下、ユーザによる設定入力や表示画面の推移等と併せて、本実施例の解析装置1による処理の流れについて説明する。
以下、ユーザによる設定入力や表示画面の推移等と併せて、本実施例の解析装置1による処理の流れについて説明する。
図12は、本実施例の解析装置1により実行される処理の流れを示すフローチャートである。
解析装置1のマスター制御部30は、まず、タンデム質量分析計100から複数の試料に関する測定データを取得する(S300)。取得されるデータは、ノンラベルデータ(マススペクトル及びMS/MSスペクトル「A」、「A+1」)、及びラベル化データ(同)である。
次に、マスター制御部30は、図13で示す設定入力画面24Aを表示装置24に表示させる(S302)。図13は、表示装置24により表示される設定入力画面24Aの一例である。
ユーザ200は、設定入力画面24Aの第1選択部24Aaをマウス等により操作して、測定データを選択する。また、ユーザ200は、設定入力画面24Aの第2選択部24Abをマウスやキーボードにより操作して、ピーク範囲Ar1を指定する。
また、ユーザ200は、設定入力画面24Aの第3選択部24Acをマウスやキーボードにより操作して、差分領域Ar2の指定を行う。ここで、差分領域Ar2は、定常的に測定される低周波値を除外するために指定されるものであり、例えばピーク範囲Ar1が終了してから十分に時間が経過した後の領域が指定される。ユーザ200が「Next」ボタンをクリックすると、設定入力が完了する。
設定入力が完了するまでの間、設定入力画面24Aでは、表示部24Adにおいて測定強度の変化が時系列で表示される。また、表示部24Aeにおいてピーク範囲Ar1におけるマススペクトルが表示される。
マスター制御部30は、ユーザ200が「Next」ボタンをクリックすると(S304)、ピーク選択画面24Bを表示装置24に表示させる(S306)。図14は、表示装置24により表示されるピーク選択画面24Bの一例である。
ユーザ200は、ピーク選択画面24Bのスペクトル指定部24Ba~24Bcをマウス等により操作して、マススペクトル・MS/MSスペクトルを指定する。マスター制御部30は、表示部24Bdにおいてマススペクトル・MS/MSスペクトル(「A」、「A+1」)を上から順に表示するように指示する(S308)。
また、ユーザ200は、ピーク閾値選択部24Beに数値(ピーク閾値P1)を入力することによって、最大ピークに対して何パーセントまでのピークをリストアップするかを指定する。これらの指定は、ユーザ200が「Get [A] Peak List」ボタンをクリックすると完了する。
ユーザ200が「Get [A] Peak List」ボタンをクリックすると(S310)、マスター制御部30は、ピークリストを作成すると共に、これをピークリスト表示部24Bfに表示するように指示する(S312)。
ピークリストの作成は、以下の手順で行われる。
(a)まず、MS/MSスペクトル「A」における最大強度を示すピーク(Pmax)を基準として、(Pmax×P1)以上の強度を示すピークを、MS/MSスペクトル「A」から抽出する。
(b)次に、抽出したピークのうち、MS/MSスペクトル「A+1」において同一m/z、及びm/z+1(「A」における当該ピークに相当するm/zよりも、m/zが1大きい横軸上の位置を意味する)の双方にピーク*が存在するものを抽出する。ここでのピーク*とは、例えば、「上記Pmaxに対して0.01%~数%程度以上の強度を示すもの」と定義できる。
(a)まず、MS/MSスペクトル「A」における最大強度を示すピーク(Pmax)を基準として、(Pmax×P1)以上の強度を示すピークを、MS/MSスペクトル「A」から抽出する。
(b)次に、抽出したピークのうち、MS/MSスペクトル「A+1」において同一m/z、及びm/z+1(「A」における当該ピークに相当するm/zよりも、m/zが1大きい横軸上の位置を意味する)の双方にピーク*が存在するものを抽出する。ここでのピーク*とは、例えば、「上記Pmaxに対して0.01%~数%程度以上の強度を示すもの」と定義できる。
係る手順によって、MS/MSスペクトル「A」におけるm/z、MS/MSスペクトル「A+1」におけるm/z、m/z+1の全てにピークが存在するピークが選択され、ピークリスト表示部24Bfに表示される。ユーザは、ピークリスト表示部24Bf内のチェックリストの一部又は全部をチェックすることにより、所望のピークを選択することができる。
ユーザ200は、更に、炭素原子数xを炭素原子数入力部24Bgに入力することができる。マスター制御部30は、炭素原子数xの初期値を算出し、算出した値を炭素原子数入力部24Bfにセットする(S314)。炭素原子数xの初期値は、上式(2)に基づいて算出される炭素原子数の推定値xeである。なお、マスター制御部30は、更に、マススペクトルのピークのm/zと炭素原子数の推定値xeから窒素の推定数を算出し、これを併せて表示部24Bhに表示する。ユーザ200によりピークが選択され、炭素原子数の推定値xeがセットされた状態でユーザ200が「Next」ボタンをクリックすると、第1の結果出力画面24Cに移行する。
マスター制御部30は、ユーザ200が「Next」ボタンをクリックすると(S316)、第1の炭素原子数推定部32による炭素原子数推定を行わせる(S318;図15のS400~S416)。
図15は、第1の炭素原子数推定部32による炭素原子数推定に係るフローチャートである。第1の炭素原子数推定部32は、まず、ピーク選択画面24Bにおいて選択された隣接ピークの組を一つ取り出し(S400)、強度比を算出する(S402)。
次に、上式(2)に基づいて、当該隣接ピークの組に相当するフラグメントイオンの炭素原子数(理論値)xfを算出する(S404)。
次に、変数tに0を設定する(S406)。そして、(t/炭素原子数の推定値xe)とxfの差分Dを算出してメモリ装置18等に格納する処理を、変数tを1ずつ増加させながら、t=xeとなるまで実行し(S408~S412)、最も差分Dが小さくなったときの変数tを、フラグメントイオンの炭素原子数(推定値)xfeに決定する(S414)。なお、全ての変数Dをメモリ装置18等に格納するのではなく、より小さい値が算出されたときに変数Dを上書き記憶するルーチンであってもよい。
そして、S402~S414の処理を、全ての隣接ピークの組について行う(S416)。
マスター制御部30は、第1の炭素原子数推定部32による炭素原子数推定が終了すると、更に、算出されたフラグメントイオンの炭素原子数(推定値)xfeのそれぞれについて、理論値との解離を評価部36に算出させ(後述)、第1の結果出力画面24Cを表示装置24に表示させる(S320)。
図16は、表示装置24により表示される第1の結果出力画面24Cの一例である。第1の結果出力画面24Cでは、表示部24Caにおいてマススペクトル・MS/MSスペクトル(「A」、「A+1」)が表示される(ピーク選択画面24Bと同じデータ)。また、表示部24Cbにおいて、評価部36の算出した評価値である「Fit Rate」が、ピーク選択画面24Bにおいて選択されたピーク毎に表示される。図中、「Target Mass」が、選択されたピークのm/zに相当する。
第1の結果出力画面24Cでは、更に、表示部24Ccにおいて、仮定となったプリカーサイオンの炭素原子数毎の「Fit Rate」のトレンドラインが表示される。「Fit Rate」すなわち評価部36により算出される理論値との解離は、例えば次式(10)に基づく。各パラメータは、図15のフローにおいて用いられたものである。「Fit Rate」が100に近ければ、フラグメントイオンの炭素原子数(推定値)xfeの信頼性は高く、100から遠くなるほど、信頼性は低くなる。ユーザは、これらの「Fit Rate」を視認することにより、「ラベル化データを用いた推定原理」を用いた推定が必要かどうかを判断することができる。
「Fit Rate」={1+(差分D/フラグメントイオンの炭素原子数(推定値)xfe)}×100 …(10)
マスター制御部30は、ユーザがチェックボックス「Extended Analysis」にチェックを入れ、更に「Next」ボタンをクリックすると(S322)、「ラベル化データを用いた推定原理」を用いた推定モードに移行する(S330~S344)。なお、S330以下で扱うデータは、ノンラベルデータ、ラベル化データ共に、MS/MSスペクトル「A+1」のみである。
マスター制御部30は、ユーザがチェックボックス「Extended Analysis」にチェックを入れ、更に「Next」ボタンをクリックすると(S322)、「ラベル化データを用いた推定原理」を用いた推定モードに移行する(S330~S344)。なお、S330以下で扱うデータは、ノンラベルデータ、ラベル化データ共に、MS/MSスペクトル「A+1」のみである。
マスター制御部30は、まず、図17で示す設定入力画面24Dを表示装置24に表示させる(S330)。図17は、表示装置24により表示される設定入力画面24Dの一例である。
ユーザ200は、設定入力画面24Dの第1選択部24Daをマウス等により操作して、ラベル化した測定データを選択する。また、ユーザ200は、設定入力画面24Dの第2選択部24Dbをマウスやキーボードにより操作して、ラベル化内容(シフト値、炭素原子数等)を指定する。また、ユーザ200は、設定入力画面24Aと同様に、設定入力画面24Dの第3選択部24Dc及び第4選択部24Ddをマウスやキーボードにより操作して、ピーク範囲Ar3及び差分領域Ar4の指定を行う。
設定入力が完了するまでの間、設定入力画面24Dでは、表示部24Deにおいて測定強度の変化が時系列で表示される。
更に、ユーザ200は、設定入力画面24Dのスペクトル指定部24Da~24Bcをマウス等により操作して、マススペクトル・MS/MSスペクトルを指定する。
マスター制御部30は、ユーザ200が「Next」ボタンをクリックすると(S332)、ピーク選択画面24Eを表示装置24に表示させる(S334)。図18は、表示装置24により表示されるピーク選択画面24Eの一例である。
ピーク選択画面24Eにおいて、ユーザ200が「Get [A+1] Peak List」ボタンをクリックすると(S336)、マスター制御部30は、ピークリストを作成すると共に、これをピークリスト表示部24Eaに表示するように指示する(S338)。
ピークリストの作成は、以下の手順で行われる。なお、ここでの「ピーク」とは、ノンラベルデータの最大ピークの高さに対して閾値入力部24Ebに入力された割合(%)以上の高さを有するものと定義する。また、ピーク選択画面24Eでは、表示部24Ecにおいてノンラベルデータ(上段)とラベル化データ(下段)のMS/MSスペクトル「A+1」が表示されている。
まず、以下の条件(c)、(d)を満たすノンラベルデータ上のピーク(m/z)を抽出する。条件(c)、(d)を満たすものは、図9で説明した、ラベル化データにおいてm/zが増加しないフラグメントイオン(ノンシフト;NS)を示している。
(c)ノンラベルデータにおいてピーク(m/z+1)が存在する。
(d)ラベル化データにおいてピーク(m/z)、及びピーク(m/z+1)が存在する。
(c)ノンラベルデータにおいてピーク(m/z+1)が存在する。
(d)ラベル化データにおいてピーク(m/z)、及びピーク(m/z+1)が存在する。
次に、以下の条件(e)、(f)を満たすノンラベルデータ上のピーク(m/z)を抽出する。条件(e)、(f)を満たすものは、図9で説明した、ラベル化データにおいてm/zが増加するフラグメントイオン(シフト;S)を示している。
(e)ノンラベルデータにおいてピーク(m/z+1)が存在する。
(f)ラベル化データにおいてピーク(m/z+shift)、及びピーク(m/z+shift+1)が存在する。
(e)ノンラベルデータにおいてピーク(m/z+1)が存在する。
(f)ラベル化データにおいてピーク(m/z+shift)、及びピーク(m/z+shift+1)が存在する。
マスター制御部30は、上記(c)、(d)又は(e)、(f)を満たすものをピークリストに掲載する。そして、(c)、(d)を満たすものに「NS」の識別子を、(e)、(f)を満たすものに「S」の識別子を、それぞれ付与してピークリスト表示部24Eaに表示する。
ユーザ200は、ピークリスト表示部24Ea内のチェックリストの一部又は全部をチェックすることにより、所望のピークを選択することができる。また、「NS」、「S」の識別子が表示されているため、ノンシフトとシフトのいずれか所望のもの(又は双方)を用いて炭素原子数の推定をするように、選択することができる。
ユーザ200がピークリスト表示部24Ea内のチェックリストの一部又は全部をチェックし、更にプリカーサイオンの炭素原子数を炭素原子数入力部24Edに入力した上で、「Next」ボタンをクリックすると、第2の結果出力画面24Fに移行する。
マスター制御部30は、ユーザ200が「Next」ボタンをクリックすると(S340)、第2の炭素原子数推定部34による炭素原子数推定を行わせる(S342)。第2の炭素原子数推定部34は、前述した「ラベル化データを用いた推定原理」に基づき、フラグメントイオンの炭素原子数を推定する。
マスター制御部30は、第2の炭素原子数推定部34による炭素原子数推定が終了すると、第2の結果出力画面24Fを表示装置24に表示させる(S344)。
図19は、表示装置24により表示される第2の結果出力画面24Fの一例である。図示するように、第2の結果出力画面24Fの比較表示部24Faでは、ノンラベルデータのMS/MSスペクトル「A+1」と、ラベル化データのMS/MSスペクトル「A+1」が比較表示される。ラベル化データのMS/MSスペクトル「A+1」は、隣接ピークのうちいずれかが、ノンラベルデータのピークと一致するように、全体に補正係数が乗算されて正規化されている。
第2の結果出力画面24Fの推定結果表示部24Fbでは、元データにおけるピークのm/z(図中、「Base Mass」)、そのピークに該当するフラグメントイオンの炭素原子数の推定値(図中、「Carbon」)、及びその推定値の評価部36による評価値(図中、「Fit Rate」)が並べて表示される。
ここで、第2の結果出力画面24Fにおける評価値は、例えば次式(11)により算出される。式中、yは既知の窒素原子数、又はマススペクトルのA+1のイオン強度から推定される窒素原子数であり、yeは窒素原子数の推定値である。
「Fit Rate」={1+(y-ye)/y}×100 …(11)
比較表示部24Faの表示内容は、推定結果表示部24Fbのうちユーザ200が選択した行に記述されたピークの内容を反映したものとなる。
「Fit Rate」={1+(y-ye)/y}×100 …(11)
比較表示部24Faの表示内容は、推定結果表示部24Fbのうちユーザ200が選択した行に記述されたピークの内容を反映したものとなる。
なお、図19は、ノンシフトのデータが選択された場合の表示画面を示しているが、シフトのデータが選択された場合の比較表示部24Faは、図20のようになる。図20は、比較表示部24Faの表示内容の他の例である。
以上説明した本実施例の解析装置1によれば、第1の炭素原子数推定部32と第2の炭素原子数推定部34を備え、「隣接ピークの高さ比に基づく推定原理」と、「ラベル化データを用いた推定原理」の双方に基づいて炭素原子数の推定を行うことができるため、より正確に炭素原子数を推定することができる。
[自動進行(半自動進行)について]
解析装置1のマスター制御部30は、図12におけるS322の処理に代えて、評価部36に全てのフラグメントイオンの炭素原子数(推定値)xfeを総合的に評価した評価値FIT1、FIT2を、例えば次式(12)(13)により算出させ、FIT1又はFIT2が所定値を超える場合に(すなわち理論値と実測値との一致程度が低い場合に)、自動的にS330に進む処理を行ってもよい。式中、rnは(「Fit Rate」-100)すなわち理論値と推定値の解離であり、nは炭素原子数(推定値)xfeが算出されたフラグメントイオンの識別子(ナンバー)である。
解析装置1のマスター制御部30は、図12におけるS322の処理に代えて、評価部36に全てのフラグメントイオンの炭素原子数(推定値)xfeを総合的に評価した評価値FIT1、FIT2を、例えば次式(12)(13)により算出させ、FIT1又はFIT2が所定値を超える場合に(すなわち理論値と実測値との一致程度が低い場合に)、自動的にS330に進む処理を行ってもよい。式中、rnは(「Fit Rate」-100)すなわち理論値と推定値の解離であり、nは炭素原子数(推定値)xfeが算出されたフラグメントイオンの識別子(ナンバー)である。
FIT1=Σ(rn)/n …(12)
FIT2=Σ(rn)2/n …(13)
図21は、FIT1、FIT2の値と、その解離の原因の関係等を示す図である。図中、斜線部分は、第2の炭素原子数推定部34による推定が必要な場合である。図示するように、FIT1は小さいがFIT2が大きい場合は、窒素が局在して含まれる場合、或いはピークの重なりが原因で推定値が解離した場合であり、第2の炭素原子数推定部34による推定が必要であると考えられる。又、FIT1とFIT2の双方が大きい場合は、推定炭素数が誤っていた場合、或いは窒素が局在せずに含まれる場合であり、第2の炭素原子数推定部34による推定が必要であると考えられる。評価部36は、図21における中段及び下段の場合に、第2の炭素原子数推定部34による推定が必要である旨をマスター制御部30に通知する。マスター制御部30は、これを受信すると、第2の炭素原子数推定部34を起動させ、図12におけるS330以下の処理を自動的に実行する。
FIT2=Σ(rn)2/n …(13)
図21は、FIT1、FIT2の値と、その解離の原因の関係等を示す図である。図中、斜線部分は、第2の炭素原子数推定部34による推定が必要な場合である。図示するように、FIT1は小さいがFIT2が大きい場合は、窒素が局在して含まれる場合、或いはピークの重なりが原因で推定値が解離した場合であり、第2の炭素原子数推定部34による推定が必要であると考えられる。又、FIT1とFIT2の双方が大きい場合は、推定炭素数が誤っていた場合、或いは窒素が局在せずに含まれる場合であり、第2の炭素原子数推定部34による推定が必要であると考えられる。評価部36は、図21における中段及び下段の場合に、第2の炭素原子数推定部34による推定が必要である旨をマスター制御部30に通知する。マスター制御部30は、これを受信すると、第2の炭素原子数推定部34を起動させ、図12におけるS330以下の処理を自動的に実行する。
また、このように自動的に進行するのではなく、例えばFIT1及び/又はFIT2が所定値を超える場合に「Extended Analysis」のチェックボックスが出現する(或いはチェック可能となる)ように制御し、FIT1及び/又はFIT2が所定値を超える場合に「第2の炭素原子数推定部34を起動可能とする」ものであってもよい。
以上、本発明を実施するための最良の形態について実施例を用いて説明したが、本発明はこうした実施例に何等限定されるものではなく、本発明の要旨を逸脱しない範囲内において種々の変形及び置換を加えることができる。
本願は2011年5月31日に出願した日本国特許出願第2011-122511号に基づきその優先権を主張するものであり、同日本国出願の全内容を参照することにより本願に援用する。
1 解析装置
10 CPU
12 ドライブ装置
16 補助記憶装置
18 メモリ装置
20 インタフェース装置
22 入力装置
24 表示装置
24A 設定入力画面
24B ピーク選択画面
24C 第1の結果出力画面
24D 設定入力画面
24E ピーク選択画面
24F 第2の結果出力画面
30 マスター制御部
32 第1の炭素原子数推定部
34 第2の炭素原子数推定部
36 評価部
100 タンデム質量分析計
200 ユーザ
10 CPU
12 ドライブ装置
16 補助記憶装置
18 メモリ装置
20 インタフェース装置
22 入力装置
24 表示装置
24A 設定入力画面
24B ピーク選択画面
24C 第1の結果出力画面
24D 設定入力画面
24E ピーク選択画面
24F 第2の結果出力画面
30 マスター制御部
32 第1の炭素原子数推定部
34 第2の炭素原子数推定部
36 評価部
100 タンデム質量分析計
200 ユーザ
Claims (8)
- 質量分析計から取得されたデータを解析して、イオン化された試料から解離したフラグメントイオンの炭素原子数を推定する解析装置であって、
前記試料から得られるMS/MSスペクトルにおける質量電荷比が1異なる隣接ピークの高さ比に基づいて前記フラグメントイオンの炭素原子数を推定する第1の炭素原子数推定手段と、
前記試料から得られるMS/MSスペクトルにおける質量電荷比が1異なる隣接ピークの高さ比と、前記試料に炭素原子数が既知の物質を付与し、又は前記試料から炭素原子数が既知の物質を脱離させたラベル化試料から得られるMS/MSスペクトルにおける質量電荷比が1異なる隣接ピークの高さ比と、の相違量に基づいて前記フラグメントイオンの炭素原子数を推定する第2の炭素原子数推定手段と、
を備える解析装置。 - 請求項1に記載の解析装置であって、
前記第2の炭素原子数推定手段は、
前記試料から得られるMS/MSスペクトルにおける質量電荷比が1異なる隣接ピークと、前記ラベル化試料から得られるMS/MSスペクトルにおける質量電荷比が1異なる隣接ピークとの間で、左右いずれかのピークの高さが一致するように、前記試料から得られるMS/MSスペクトル又は前記ラベル化試料から得られるMS/MSスペクトルに補正係数を乗算し、
該乗算の結果、ピークの高さが一致しなかった左右いずれかのピーク間の高さの差を、前記既知の物質に含まれる炭素原子に相当する高さと推定し、
該推定した炭素原子に相当する高さで前記試料から得られるMS/MSスペクトルにおけるピークの高さを除算することによって、前記フラグメントイオンの炭素原子数を推定する手段である、
解析装置。 - 請求項1に記載の解析装置であって、
ユーザ操作を受け付ける受付手段と、
前記第1の炭素原子数推定手段による推定結果を評価した評価値を出力する評価手段と、を備え、
先ず前記第1の炭素原子数推定手段が起動され、前記第1の炭素原子数推定手段による推定結果が前記評価値と共にユーザに提示され、
その後、前記受付手段に対して所定のユーザ操作がなされたときに、前記第2の炭素原子数推定手段が起動され、前記第2の炭素原子数推定手段による推定結果がユーザに提示される、
解析装置。 - 請求項1に記載の解析装置であって、
前記第1の推定手段による推定結果を評価した評価値を出力する評価手段を備え、
先ず前記第1の炭素原子数推定手段が起動され、前記第1の炭素原子数推定手段による推定結果が前記評価値と共にユーザに提示され、
その後、前記評価値が、前記第1の炭素原子数推定手段による推定結果から導出される隣接ピークの高さ比の理論値と実測値の一致程度が低いことを示す所定条件を満たす場合に、前記第2の炭素原子数推定手段が自動的に起動され、前記第2の炭素原子数推定手段による推定結果がユーザに提示される、
解析装置。 - 請求項1に記載の解析装置であって、
ユーザ操作を受け付ける受付手段と、
前記第1の炭素原子数推定手段による推定結果を評価した評価値を出力する評価手段と、を備え、
先ず前記第1の炭素原子数推定手段が起動され、前記第1の炭素原子数推定手段による推定結果が前記評価値と共にユーザに提示され、
その後、前記評価値が、前記第1の炭素原子数推定手段による推定結果から導出される隣接ピークの高さ比の理論値と実測値の一致程度が低いことを示す所定条件を満たす場合に、前記第2の炭素原子数推定手段を起動するためのユーザ操作を前記受付手段が受け付け可能となる、
解析装置。 - 請求項1に記載の解析装置であって、
前記第1の炭素原子数推定手段、及び/又は前記第2の炭素原子数推定手段は、ピークの高さと質量電荷比に関する所定条件を満たす前記隣接ピークをユーザに提示し、該提示した隣接ピークのうちユーザが選択した隣接ピークに基づいて前記フラグメントイオンの炭素原子数を推定する手段である、
解析装置。 - 質量分析計から取得されたデータを解析して、イオン化された試料から解離したフラグメントイオンの炭素原子数を推定する解析方法であって、
前記試料から得られるMS/MSスペクトルにおける質量電荷比が1異なる隣接ピークの高さ比に基づいて前記フラグメントイオンの炭素原子数を推定する第1の炭素原子数推定処理と、
前記試料から得られるMS/MSスペクトルにおける質量電荷比が1異なる隣接ピークの高さ比と、前記試料に炭素原子数が既知の物質を付与し、又は前記試料から炭素原子数が既知の物質を脱離させたラベル化試料から得られるMS/MSスペクトルにおける質量電荷比が1異なる隣接ピークの高さ比と、の変化量に基づいて前記フラグメントイオンの炭素原子数を推定する第2の炭素原子数推定処理と、
をコンピュータが実行する解析方法。 - 質量分析計から取得されたデータを解析して、イオン化された試料から解離したフラグメントイオンの炭素原子数を推定する解析方法であって、
前記試料から得られるMS/MSスペクトルにおける質量電荷比が1異なる隣接ピークの高さ比に基づいて前記フラグメントイオンの炭素原子数を推定する第1の炭素原子数推定処理と、
前記試料から得られるMS/MSスペクトルにおける質量電荷比が1異なる隣接ピークの高さ比と、前記試料に炭素原子数が既知の物質を付与し、又は前記試料から炭素原子数が既知の物質を脱離させたラベル化試料から得られるMS/MSスペクトルにおける質量電荷比が1異なる隣接ピークの高さ比と、の変化量に基づいて前記フラグメントイオンの炭素原子数を推定する第2の炭素原子数推定処理と、
をコンピュータに実行させるプログラムを記録したコンピュータ読み取り可能な記録媒体。
Applications Claiming Priority (2)
| Application Number | Priority Date | Filing Date | Title |
|---|---|---|---|
| JP2011122511A JP4999995B1 (ja) | 2011-05-31 | 2011-05-31 | 解析装置、解析方法、及びプログラム |
| JP2011-122511 | 2011-05-31 |
Publications (1)
| Publication Number | Publication Date |
|---|---|
| WO2012165024A1 true WO2012165024A1 (ja) | 2012-12-06 |
Family
ID=46793946
Family Applications (1)
| Application Number | Title | Priority Date | Filing Date |
|---|---|---|---|
| PCT/JP2012/058476 Ceased WO2012165024A1 (ja) | 2011-05-31 | 2012-03-29 | 解析装置、解析方法、及び記憶媒体 |
Country Status (3)
| Country | Link |
|---|---|
| JP (1) | JP4999995B1 (ja) |
| TW (1) | TW201307837A (ja) |
| WO (1) | WO2012165024A1 (ja) |
Families Citing this family (1)
| Publication number | Priority date | Publication date | Assignee | Title |
|---|---|---|---|---|
| WO2026028554A1 (ja) * | 2024-08-01 | 2026-02-05 | 株式会社島津製作所 | 代謝物解析用データ処理装置及び代謝物解析用データ処理方法 |
Citations (3)
| Publication number | Priority date | Publication date | Assignee | Title |
|---|---|---|---|---|
| JPH10274640A (ja) * | 1997-03-31 | 1998-10-13 | Hitachi Ltd | 質量分析方法及び装置 |
| JP2005283593A (ja) * | 2005-04-26 | 2005-10-13 | Hitachi Ltd | イオントラップ質量分析方法 |
| JP2011028926A (ja) * | 2009-07-23 | 2011-02-10 | Hitachi High-Technologies Corp | 質量分析装置、および質量分析方法 |
-
2011
- 2011-05-31 JP JP2011122511A patent/JP4999995B1/ja not_active Expired - Fee Related
-
2012
- 2012-03-29 WO PCT/JP2012/058476 patent/WO2012165024A1/ja not_active Ceased
- 2012-05-30 TW TW101119422A patent/TW201307837A/zh unknown
Patent Citations (3)
| Publication number | Priority date | Publication date | Assignee | Title |
|---|---|---|---|---|
| JPH10274640A (ja) * | 1997-03-31 | 1998-10-13 | Hitachi Ltd | 質量分析方法及び装置 |
| JP2005283593A (ja) * | 2005-04-26 | 2005-10-13 | Hitachi Ltd | イオントラップ質量分析方法 |
| JP2011028926A (ja) * | 2009-07-23 | 2011-02-10 | Hitachi High-Technologies Corp | 質量分析装置、および質量分析方法 |
Non-Patent Citations (2)
| Title |
|---|
| AKIRA MOTOYAMA: "Doitai Sentaku MS/MS-ho o Katsuyo shita Fragmentation Kaiseki to sono Yuyosei", DAI 57 KAI ANNUAL CONFERENCE ON MASS SPECTROMETRY, BOOK OF ABSTRACTS, 2009, pages 506 - 507 * |
| WOLF D. LEHMANN: "Isotope-selective Tandem Mass Spectrometry: a New Tool for Elucidation of Fragmentation Pathways", JOURNAL OF MASS SPECTROMETRY, vol. 33, 1998, pages 164 - 172 * |
Also Published As
| Publication number | Publication date |
|---|---|
| JP4999995B1 (ja) | 2012-08-15 |
| TW201307837A (zh) | 2013-02-16 |
| JP2012251787A (ja) | 2012-12-20 |
Similar Documents
| Publication | Publication Date | Title |
|---|---|---|
| US11145498B2 (en) | Tandem mass spectrometry data processing system | |
| JP4973628B2 (ja) | クロマトグラフ質量分析データ解析方法及び装置 | |
| JP6791373B2 (ja) | クロマトグラフ質量分析データ処理装置及びクロマトグラフ質量分析データ処理用プログラム | |
| EP2765414A1 (en) | Analysis device, analysis method, and storage medium | |
| JP6642125B2 (ja) | 質量分析方法及び誘導結合プラズマ質量分析装置 | |
| JPWO2012073322A1 (ja) | 質量分析データ処理装置 | |
| JPWO2012104956A1 (ja) | 質量分析方法及び装置 | |
| CN111830112A (zh) | 用于非目标数据的稳定同位素标记示踪 | |
| JP2013224858A (ja) | クロマトグラフタンデム四重極型質量分析装置 | |
| JPWO2018109895A1 (ja) | 質量分析装置 | |
| CN107209151A (zh) | 干扰检测及所关注峰值解卷积 | |
| JP5757264B2 (ja) | クロマトグラフ質量分析データ処理装置 | |
| JP5510011B2 (ja) | 質量分析方法及び質量分析装置 | |
| JP4849128B2 (ja) | 質量分析方法 | |
| JP6222277B2 (ja) | タンデム質量分析データ処理装置 | |
| CN107209156B (zh) | 经由曲线减法检测基于质谱的相似性 | |
| JP4999995B1 (ja) | 解析装置、解析方法、及びプログラム | |
| JP4678439B2 (ja) | 質量分析装置用データ処理装置 | |
| JP4921302B2 (ja) | 質量分析システム | |
| CN109073592B (zh) | 质谱分析装置及质谱分析方法 | |
| JP5747839B2 (ja) | クロマトグラフ質量分析用データ処理装置 | |
| JP5627338B2 (ja) | 質量分析方法 | |
| US10453663B2 (en) | Mass spectrometry device and ion detection method therefor | |
| CN118872025A (zh) | 用于改进电荷系列谱的分析的系统和方法 | |
| JP2016033458A (ja) | 質量分析データ処理方法及び装置 |
Legal Events
| Date | Code | Title | Description |
|---|---|---|---|
| 121 | Ep: the epo has been informed by wipo that ep was designated in this application |
Ref document number: 12792429 Country of ref document: EP Kind code of ref document: A1 |
|
| NENP | Non-entry into the national phase |
Ref country code: DE |
|
| 122 | Ep: pct application non-entry in european phase |
Ref document number: 12792429 Country of ref document: EP Kind code of ref document: A1 |