EP3602001B1 - Partikelcharakterisierung - Google Patents
Partikelcharakterisierung Download PDFInfo
- Publication number
- EP3602001B1 EP3602001B1 EP18710904.6A EP18710904A EP3602001B1 EP 3602001 B1 EP3602001 B1 EP 3602001B1 EP 18710904 A EP18710904 A EP 18710904A EP 3602001 B1 EP3602001 B1 EP 3602001B1
- Authority
- EP
- European Patent Office
- Prior art keywords
- scattering
- measurement
- bin
- photon
- intensity
- Prior art date
- Legal status (The legal status is an assumption and is not a legal conclusion. Google has not performed a legal analysis and makes no representation as to the accuracy of the status listed.)
- Active
Links
Images


Classifications
-
- G—PHYSICS
- G01—MEASURING; TESTING
- G01N—INVESTIGATING OR ANALYSING MATERIALS BY DETERMINING THEIR CHEMICAL OR PHYSICAL PROPERTIES
- G01N15/00—Investigating characteristics of particles; Investigating permeability, pore-volume or surface-area of porous materials
- G01N15/02—Investigating particle size or size distribution
- G01N15/0205—Investigating particle size or size distribution by optical means
- G01N15/0211—Investigating a scatter or diffraction pattern
-
- G—PHYSICS
- G01—MEASURING; TESTING
- G01N—INVESTIGATING OR ANALYSING MATERIALS BY DETERMINING THEIR CHEMICAL OR PHYSICAL PROPERTIES
- G01N15/00—Investigating characteristics of particles; Investigating permeability, pore-volume or surface-area of porous materials
- G01N2015/0042—Investigating dispersion of solids
- G01N2015/0053—Investigating dispersion of solids in liquids, e.g. trouble
-
- G—PHYSICS
- G01—MEASURING; TESTING
- G01N—INVESTIGATING OR ANALYSING MATERIALS BY DETERMINING THEIR CHEMICAL OR PHYSICAL PROPERTIES
- G01N15/00—Investigating characteristics of particles; Investigating permeability, pore-volume or surface-area of porous materials
- G01N15/02—Investigating particle size or size distribution
- G01N15/0205—Investigating particle size or size distribution by optical means
- G01N15/0211—Investigating a scatter or diffraction pattern
- G01N2015/0222—Investigating a scatter or diffraction pattern from dynamic light scattering, e.g. photon correlation spectroscopy
Definitions
- the invention relates to a particle characterisation instrument, and to a method of particle characterisation, which may include adaptive photon correlation spectroscopy.
- Photon correlation spectroscopy (also termed dynamic light scattering, or DLS) is a technique for characterising particles by the temporal variation in the intensity of light scattered from a region of the sample. A time series of measurements of scattered light is used to determine a size or size distribution of particles dispersed in the sample.
- the intensity of light scattered by particles smaller than the wavelength of the illuminating light is a strong function of particle size.
- the intensity of scattered light is proportional to the sixth power of the particle radius.
- the light scattered from such small particles is also substantially isotropic. Therefore in a dispersion of proteins, typically of size 0.3nm-20nm, an aggregate or filter spoil particle , e.g. >100nm in size, may dominate the signal until it has diffused away from the optical detection volume within the sample.
- the output of Z average and polydispersity index (Pdi) may be badly skewed by the larger fraction.
- a light scattering measurement on a sample containing primarily small particles and also larger particles can be very sensitive to the larger particles, or even to individual large particles.
- the larger particles can degrade the quality with which the smaller particles can be characterised.
- Such larger particles may be unwanted contaminants: they may be aggregates of the primary particles, or some other material.
- the light source is generally a laser, and this type of analysis may sometimes be referred to as laser diffraction analysis or Static Light Scattering (SLS).
- SLS Static Light Scattering
- Large particles may also be a problem in static light scattering and laser diffraction measurements: scattering from larger particles may obscure relatively small amounts of light scattered from smaller particles.
- US2014/0226158 discloses performing light scattering measurements by taking a plurality of data sets of light scattering, each data set corresponding with a certain time (e.g. 1 second). Trainer discloses using an algorithm to sort out data sets into groups with similar characteristics (e.g. those containing large particles). Each group is to be inverted separately to produce multiple size distributions, which are then weighted by total signal time and summed over each channel size to form the total particle size distribution.
- the algorithm proposed for categorising data sets is based on measurement of spectral power in certain bands, determined using a Fourier transform or by using analog electronic bandpass filters.
- Trainer proposes categorising data sets using their autocorrelation function, using different bands of time delay in place of different frequency bands.
- US8854621 discloses a method of determining the dimensions of nanoparticles by focusing light on a sample of nanoparticles suspended in a solution, collecting light scattering by the nanoparticles, measuring translational and rotational decay rates of the collected light, calculating a ratio of the rotational decay rate to translational decay rate, and estimating a first dimension of the nanoparticles based upon the decay rate ratio.
- US2014/226158 discloses apparatus and methods for determining information about at least one particle by measuring light scattered from the particles. Scattered light is detected from a region of a particle dispersion or from a larger region in a generally collimated illumination beam. Scattered light is also detected from a plurality of regions for improvement of repeatability.
- US6052184 discloses a submersible light scattering probe for the absolute characterization of polymer and colloid solutions includes a ring member made of a preferably dark, opaque material, having embedded therein a plurality of optical fibers which can be connected to optical detectors remote from the probe. Individual large scattering particles can also be detected, counted, and characterized at the same time absolutes characterization of the polymer or colloid solution is performed.
- the use of a dynamic criteria for categorising scattering measurements as unusual or contaminated means that the method can be robust enough to include scattering data from large particles when this is appropriate, for example in the case of a highly polydisperse and variable sample, and to exclude or correct for scattering from large particles when it is appropriate, for example to reject contaminants or aggregates in a less polydisperse sample.
- the model may comprise a fit to the scattering measurement. There may be instances where a fit may be more suitable than application of smoothing, for example when the count rate trace contains spikes.
- Spikes in the scattering measurement may be fitted using peak functions (Gaussian, Lorentz, Voight etc.). Fits may be applied over regions where peaks are identified with reference to an intensity exceeding a threshold value, or other peak detection techniques such as finding when the derivative of the smoothed scattering signal crosses zero.
- Reducing the scattering intensity may comprise determining a parameter from the scattering measurement, wherein the step of reducing the scattering intensity is responsive to the parameter (so that the parameter affects at least one of an amount of reduction in scattering intensity and a time period of reducing scattering intensity).
- the parameter could comprise, for example, a cut-off frequency of the high-pass or low-pass filter described above.
- the parameter could, alternatively or additionally, comprise a threshold intensity (e.g. count rate) corresponding with contaminant scattering.
- Determining the parameter from the scattering data means that the reduction of contaminant scattering is a dynamic process that responds to the type of data. The result of this is a more robust method that is appropriate for analysis of both highly polydisperse samples and monodisperse samples.
- Determining the parameter from the scattering measurement may comprise finding statistical outliers in spectral content of the scattering measurement.
- Determining the parameter may comprise determining a spectral content of each of a plurality of time periods of the scattering measurement.
- the time series of measurements may comprise a series of shorter scattering measurements, and the spectral content of each scattering measurement may be determined.
- a Fourier transform may be used to determine the spectral content of each time period.
- Determining the parameter may comprise determining a statistical property of the spectral power at each of a range of frequencies.
- the statistical property may comprise an average and/or a standard deviation.
- the range of frequencies may comprise a range of frequencies within which it is expected that transient contaminants may make a significant contribution.
- the range of frequencies may comprise up to 10Hz, 20Hz, 30Hz, 40Hz, 50Hz or 100Hz.
- a cut-off frequency may be determined by finding, within the range of frequencies, a lowest frequency at which none of the time periods comprise spectral powers that are outliers.
- a measurement (e.g. a spectral power) may be considered an outlier when it deviates from an average value by more than a threshold deviation.
- the threshold deviation may be determined with reference to a standard deviation (e.g. two or three standard deviations).
- Reducing a scattering intensity in at least one time period of the scattering measurement may produce an adjusted scattering measurement.
- Deleting photon arrival times has the advantage of allowing temporal resolution to be preserved in the corrected scattering measurement, without the need for combining raw data with corrected data.
- Deleting photon pulses from the sequence may be considered analogous to a software optical attenuator.
- Deleting events from the sequence may comprise selecting bins (comprising photon pulses for deletion) based on scattering intensity (e.g. determined as described above, by binning).
- a threshold scattering intensity for selecting bins may be determined from the scattering measurement (e.g. based on a distribution of the scattering measurement).
- the threshold scattering intensity may be determined from an average intensity of the scattering measurement.
- the threshold scattering intensity may, for example, comprise the average intensity (of the scattering measurement) plus the difference between the average and minimum count rate, or may comprise the average intensity plus three standard deviations, or may comprise the minimum count rate plus two times the square root of the minimum count rate.
- Selected bins may each be corrected by deleting a number of photon pulses from the selected bin.
- the appropriate number of photons may be the excess number of photon pulses above the threshold.
- the photon pulses may be selected at random from those within the selected bin.
- Reducing the scattering intensity may comprise directly correcting a scattering measurement comprising a sequence of photon pulses by subtracting a model of scattering contributions from the sequence of photon pulses.
- the model of the scattering contributions from contaminants may be determined as described above (for example by binning the photon pulses and low-pass filtering or smoothing).
- the model of the scattering contributions may comprise an estimate of the number of photon pulses in each bin due to scattering from a contaminant. Correcting each bin therefore may comprise deleting the number of photon pulses from each bin (e.g. by selecting them at random) that is indicated by the model.
- This direct correction (e.g. before binning) of a sequence of photon pulses avoids compromising the temporal resolution of the scattering signal, and results in a corrected autocorrelation function that can resolve very short delay times.
- Reducing the scattering intensity may comprise modifying a recorded scattering measurement. Reducing the scattering intensity may comprise attenuating a scattering signal in the optical domain.
- the method may comprise illuminating the sample in a sample cell with the light beam, so as to produce the scattered light by the interaction of the light beam with the sample.
- Obtaining scattering measurements may comprise receiving the measurements from the detector, retrieving the scattering measurements from a non-volatile machine readable medium (e.g. a hard disk, SSD, optical medium, etc.), or receiving the measurements via a communication channel (e.g. network, serial connection, USB, SATA, IDE, PCIE).
- a non-volatile machine readable medium e.g. a hard disk, SSD, optical medium, etc.
- a communication channel e.g. network, serial connection, USB, SATA, IDE, PCIE.
- Determining a particle characteristic may comprise determining at least one of: a particle size, a particle size distribution, a zeta potential, a protein mobility, and a rheological property.
- the method may further comprise determining a further particle characteristic from scattering measurements that have been identified as those in which a contaminant was contributing to the scattered light.
- the method may further comprise determining an average particle characteristic from all the scattering measurements.
- the method may comprise determining an autocorrelation function for each scattering measurement.
- each (or the) scattering measurement may comprise a time series of measurements of the scattered light from a plurality of detectors. At least some of the plurality of detectors may be arranged to receive light scattered at different scattering angles to the illuminating light beam. At least some of the plurality of detectors may be arranged to receive light scattered at the same scattering angle to the illuminating light beam. A reference to a scattering angle may refer to a centroid of the detector.
- Determining a particle size distribution may comprise performing a dynamic light scattering measurement from the processed time series of measurements.
- Determining a particle size distribution may comprise performing a light diffraction particle characterisation analysis (for example using Fraunhofer or Mie scattering theory) on the time series of measurements.
- the methods disclosed herein may be applied to Static Light Scattering (SLS), Dynamic Light Scattering (DLS), Electrophoretic Light Scattering (ELS), Magnetophoretic Light Scattering (MLS) and related methodologies, for instance to measure protein mobility, surface zeta, microrheology etc. Correlated light scattering data could be processed for microrheology measurements, with transient effects removed in a manner to the other embodiments described herein.
- contaminant includes large particles or otherwise unusual particles.
- large particle does not exclude a plurality of large particles.
- large particle may mean a particle with a diameter larger than a predetermined threshold size.
- it is simply unusual (or transient) scattering data that is identified/corrected for, for instance based on an analysis (e.g. statistical analysis) of a parameter determined with reference to the data.
- a combination of the above methods may be used to correct for light scattered by contaminants.
- the duration of each scattering measurement may be: 5 seconds or less; 2 seconds or less; 1 second or less; 0.5 seconds or less; or 0.1 seconds or less. At least 10, 20, 50 or 100 scattering measurements may be used to characterise a sample.
- the detector may comprise a photon counting detector, and/or may be configured to detect back scattered, forward scattered and/or side scattered light.
- the apparatus may comprise a plurality of detectors configured to detect scattered light. At least some of the detectors may be configured to detect light scattered at different scattering angles, and/or at least some of the detectors may be configured to detect light scattered at the same scattering angle.
- the apparatus may further comprise at least one optical fibre that provides an optical path between the detector(s) and a scattering volume that is illuminated by the light source.
- Figure 1 shows a particle characterisation apparatus comprising a light source 102, sample cell 104, backward scatter detector 114, forward scatter detector 124, and light trap 108.
- the light source 102 may be a coherent light source, such as a laser, and may output mono-chromatic light. Alternatively, the light source 102 may be an LED. The light source 102 is configured to illuminate a sample 106 within the sample cell 104 with a light beam 103 along a light beam axis.
- Forward scattered light 121 may be defined as light that is scattered at angles of less than 90 degrees to the direction of the illuminating light beam axis.
- Backward scattered light 111 may be defined as light that is scattered at angles of more than 90 degrees to the direction of the light beam axis (i.e. having a component in the opposite direction to the illuminating light beam).
- the forward scatter detector 124 is configured to detect forward scattered light 121.
- the forward scattered light 121 is directed to the detector 124 via a collecting lens 120, which couples the scattered light 121 to an optical fibre 122.
- the optical fibre 122 provides an optical path to the forward scatter detector 124.
- the collecting lens 120 may be a graded refractive index lens, or any other suitable lens. Further, or fewer optical components may be included in the optical path between the illuminated region of the sample 106 and the forward scattering detector 124. For instance, in some embodiments, the optical fibre 122 may be omitted, and free space optics used instead.
- the backward scatter detector 114 is configured to detect backward scattered light 111.
- the backward scattered light 111 is directed to the sensor via a collecting lens 110, which couples the scattered light 111 to an optical fibre 112.
- the optical fibre 112 provides an optical path to the backward scatter detector 114.
- the collecting lens 110 may be a graded refractive index lens, or any other suitable lens. Further, or fewer optical components may be included in the optical path between the illuminated region of the sample 106 and the backward scattering detector 114. For instance, in some embodiments, the optical fibre 112 may be omitted, and free space optics used instead.
- only a single detector may be provided, for instance only a side scattering detector (detecting light scattered at 90 degrees), or only a forward scattering detector, or only a backward scattering detector may be present.
- the apparatus of Figure 1 may be configured to perform a dynamic light scattering analysis, for instance using the output from a single detector (such as the backward scattering detector 114).
- Figure 2 shows detector 114, processor 130 and output device 132.
- the processor 130 is configured to receive a time series of light intensity measurements from the detector 114, and to perform a correlation operation on the measurements to characterise particles of a sample by dynamic light scattering.
- the processor 130 may store the measurements in a machine readable storage medium, for example in memory, on a solid state storage drive, a hard disk, in the cloud etc.
- the processor 130 may then output the results of the analysis to the output device 132, which may comprise a display screen.
- the processor 130 is configured to determine, from a time series of measurements from a detector 114, which measurements were taken at times when a contaminant (e.g. a large particle) was contributing to the scattered light.
- a contaminant e.g. a large particle
- Apparatus according to an embodiment may combine the features shown in Figures 1 and 2 (and described with reference to these Figures), and may be configured to perform the method which is shown in outline form in Figure 3 .
- Step 201 comprises illuminating a sample 106 in a sample cell 104 with a light beam 103, so as to produce scattered light 111 by the interaction of the light beam 103 with the sample 106.
- Step 202 comprises obtaining a time series of measurements of the scattered light 111 from detector 114, which may be a single detector.
- detector 114 may include a plurality of detectors (e.g. a 1D or 2D detector element array) corresponding with a specific light scattering angle (or narrow range of light scattering angles, such as 5 degrees or less).
- Step 203 comprises determining, from the time series of measurements from the detector 114, which measurements were taken at times when a contaminant (e.g. large particle) was contributing to the scattered light.
- a contaminant e.g. large particle
- Step 204 comprises determining a particle characteristic (e.g. a particle size distribution), either from the measurements which are not taken at times when a contaminant was contributing to the scattered light, or from measurements which have been corrected to mitigate the effect of scattering from contaminants.
- Step 204 may comprise performing a dynamic light scattering measurement using the time series of measurements. Correcting for scattered light from a contaminant may improve the quality and/or accuracy of the characterisation of the particles, because the relatively intense scattering from the contaminants (e.g. larger particles) will thereby be prevented from corrupting the characterisation of smaller particles within the sample (which may be the particles of most interest).
- Figure 4 illustrates a time series of measurement results from a detector 320, along with a plot of a correlation function 310 obtained from the measurement results 320.
- PSD particle size distribution
- a threshold intensity value of 600 counts per second could be used to identify light scattering from a large particle.
- the precise values of intensity threshold and time window may depend on the instrument configuration and the specific measurement setup.
- the threshold may be 2, 3, 4, or 5 standard deviations of the intensity values (which may be determined after a complete measurement has been taken, or dynamically, as the measurement is taken).
- the frequency of features within the time series of measurements may be used to identify light scattering from a large particle: a low frequency feature is likely to correspond with a large particle.
- the combination of low frequency and large amplitude fluctuations in light intensity may be particularly characteristic of large particles, and may be used to identify times when a large particle is scattering.
- a frequency of less than 10, 5, 4, 3, 2, 1, or 0.5 Hz or less may be associated with a large particle.
- One way to identify that a large particle is present within a particular time window is to partition the full time series of data (or run) into a plurality of scattering measurements (or sub-runs) with shorter periods runs, and then to analyse each of the sub-runs to determine whether it includes scattering from a contaminant. For example, if the data 320 were partitioned into a plurality of sub-runs of duration 1 second, and a DLS correlation analysis performed on the data of each sub-run, it would be straightforward to identify in which sub-run a significant amount of light scattering is contributed by a large particle or particles (e.g. more than 1%, 5% or 10% of the total scattered light, or when the intensity PSD exceeds 1, 5 or 10% at a particle size over a specific threshold).
- a significant amount of light scattering is contributed by a large particle or particles (e.g. more than 1%, 5% or 10% of the total scattered light, or when the intensity PSD exceeds 1, 5 or 10% at a particle size over a specific threshold).
- the sub-runs with a significant amount of scattering from contaminants may then be excluded from the measurement series.
- the remaining measurement data may then be combined, and a DLS measurement performed based on the combined remaining data.
- a model of scattering due to the contaminant may be fitted to the data within each sub-run with a significant amount of scattering from contaminants.
- the estimate of the scattering signal due to the contaminant, as calculated by the fitted model, may then be removed from the data within the sub-run.
- the remaining corrected data may then be combined with the data from the other sub-runs in the measurement series, and a DLS measurement performed on the combined corrected data series.
- Embodiments of the invention may provide significantly improved DLS characterisation fidelity in cases where large particles are problematic.
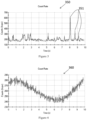
- Figure 5 shows a graph 350 of photon count rate over time obtained from a scattered light detector.
- Spikes 351 are present in the data (not all of which are labelled in Figure 5 ), corresponding with periods of time when a highly scattering particle (i.e. a contaminant) is within the measurement volume of the instrument.
- a highly scattering particle i.e. a contaminant
- One way to deal with this contribution from contaminants is to correct the data to remove the scattering contributions from the contaminants - this may be advantageous when compared with simply discarding the contaminated data, because potentially valuable measurement data is retained.
- Figure 6 shows a graph 360 of photon count rate over time obtained from a scattering detector.
- the contaminant for the data of Figure 6 is a large particle that slowly impinges on the measurement volume, resulting in a low frequency variation in detected intensity. This type of contribution to scattering from a larger particle may be dealt with by removing the low frequency component of the data.
- contaminated scattering measurements e.g. sub-runs in which larger particles contributed to scattering.
- One way to do this is by determining intensity of each sub-run, and using an average intensity value (e.g. mean, median value etc) as a rejection criteria. Larger particles are associated with stronger scattering, so higher intensity sub-runs may be associated with larger particles.
- the threshold for rejection of sub-runs may be determined from the ensemble characteristics of all the sub-runs. For instance the threshold average intensity could be derived from an average intensity taken across all sub-runs (e.g. two or three standard deviations from an average intensity for all sub-runs).
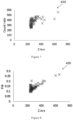
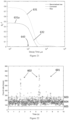
- Figure 7 shows a graph 410 of the mean count rate (intensity) as a function of the Z average particle size for a plurality of scattering measurements (or sub-runs) obtained from a measurement performed on a sample comprising 220nm latex spheres and some filter spoil (larger size particulate contaminants).
- the Z average may be determined for each sub-run as defined in ISO 13321 and/or ISO 22412.
- One drawback of a rejection criteria based on average intensity is that it may result in the rejection of many sub-runs that the Z average indicates are associated with small particles.
- FIG. 8 shows a graph 420 of the polydispersity index Pdi against the Z average for the same sub-run data as shown in Figure 7 .
- a further alternative is to use the Z average particle size as a rejection criteria, rejecting sub-runs with a Z average particle size that exceeds a threshold value.
- the threshold value may be determined with reference to a Z average value that is calculated from the ensemble of all sub-runs (e.g. rejecting values more than three standard deviations from a Z average for all sub-runs).
- Figure 9 is a set of Pdi histograms 430 illustrating how threshold rejection criteria may be calculated for a measurement
- a first, second and third histogram of Pdi values is shown, corresponding with lysozyme, 220nm latex spheres and 60nm latex spheres respectively.
- a first, second and third normal distribution 431, 432, 433 is respectively fitted to each histogram (for example, using a least squares penalty function).
- An average value of Pdi for each measurement and a standard deviation ⁇ may be determined from the normal distribution 431, 432, 433 that best fits the histogram obtained from the sub-runs of each measurement, The use of a best fit normal distribution helps to avoid skewing of the average by outlier sub-runs, which can be seen in Figure 9 (e.g. with Pdi values greater than 0.15).
- the threshold rejection criteria may comprise an average obtained from a best fit to a histogram of sub-runs (e.g. Z average, Pdi or intensity), plus a multiple of standard deviations, for example three (or 2, 4, 5 6, etc).
- Figure 10 illustrates an example rejection approach in which the rejection criteria is based on Pdi, and the threshold is three standard deviations from the average value determined from best fit normal distribution.
- Figure 10 shows a graph 440 with the best fit normal distribution 441, the average Pdi 442 (derived from the best fit 441), the threshold rejection criteria 443 (the average + 3 ⁇ ).
- the retained 445 and rejected/segregated 444 sub-runs are also plotted on the same graph. Sub-runs with Pdi greater than the threshold value are rejected/segregated, and sub-runs with Pdi less than or equal to the threshold value are retained for separate analysis.
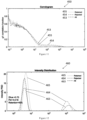
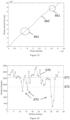
- Figure 11 is a graph 450 showing the g1 correlation function obtained for each of: the retained sub-runs 455, the rejected/segregated sub-runs 454 and all sub-runs 453.
- Figure 12 is a graph showing the intensity particle size distribution for each of: the retained sub-runs 465, the rejected/segregated sub-runs 464 and all sub-runs 463. It is clear that the retained sub-runs do not include data from the contaminant particles. The average particle size for the smaller particles (i.e. the particles of interest, excluding the contaminants) that is reported when all the sub-runs are used is different than that obtained from the retained sub-runs.
- the data from the retained sub-runs is more accurate, because it is not distorted by the scattering from the larger particles/contaminants.
- the rejected/segregated sub-runs can be used to identify characteristics of the larger (e.g. contaminant) particles.
- the approach of separately analysing and presenting information about the retained and rejected/segregated sub-runs provides more information to users, and removes ambiguity that may be associated with processing of light scattering data.
- a rejection/segregation criteria based on the distribution of a parameter means that only outlying data is rejected, and that the rejection/segregation is dynamic and responsive to the sample being measured.
- a highly mono-disperse sample with an occasional contaminant will result in a fairly narrow distribution Pdi, with the result that scattering data from contaminants will be rejected with a relatively high degree of sensitivity.
- a highly polydisperse and variable sample may have a high standard deviation in Pdi between successive sub-runs, meaning that very little data will be rejected/segregated - the result will be a multi-modal particle size distribution, reflecting the diversity of particle sizes in the sample.
- This approach of determining a rejection/segregation criteria that is dynamically responsive to the analysis means that the measurement is robust enough to be able to accommodate a broad range of samples, and does not require the user to specify, a priori, an expected range of particles.
- Figure 13 illustrates the rejection/segregation approach shown in Figure 11 , applied to a highly polydisperse and variable sample of Copper Oxide nanoparticles.
- Figure 13 shows a graph 470 with the best fit normal distribution 441, the average Pdi 442 (derived from the best fit 441), the threshold rejection criteria 443 (the average + 3 ⁇ ).
- the retained 445 and rejected/segregated 444 sub-runs are also plotted on the same graph. Only a single sub-run (with an unusually high Pdi) is rejected/segregated from the data set.
- rejection could still be applied by quantifying and comparing the measured scattering of each sub run, with a mean value, a drift or a spread (or some other value) being used as a rejection parameter.
- Figure 15 illustrates simulated count rate data showing light intensity at a scattering detector 512, a moving average 511 calculated from the light intensity data 512 (e.g. with a 20 point window).
- the moving average acts as a low-pass filter, tracking the low frequency variation, while filtering out the higher frequency information of interested. Subtracting the moving average 511 from the data 512 results in the data shown in Figure 16 , in which the slow variation in intensity has been removed.
- a moving average is one type of low-pass filter that may be used to process the data, other types of filtering or smoothing operation may be used in a similar way (e.g. a digital IIR or FIR filter, or a Savitzky-Golay filter).
- Electrophoretic light scattering uses an external electric field applied to a sample to induce motion in dispersed particles dependent on their charge, with this motion detected through Doppler analysis of scattered light.
- parameters upon which rejection could be based include parameters describing the Doppler signal including spectral width.
- Figure 14 illustrates how spectral width can be used to identify and discard outlier data.
- the graph 500 of Figure 14 shows a number of curves of normalised intensity vs frequency shift of scattered light. Each curve corresponds with a different measurement run (or sub-runs) of an electrophoretic measurement on samples comprising Lysozyme.
- the measurement runs with narrow spectral width 502 correspond with samples in which aggregates are present.
- the measurement runs with a broader spectral width 501 correspond with samples that do not comprise aggregates.
- a sample with some aggregates may be therefore analysed by taking a plurality of sub-runs and discarding those with an unusually narrow spectral width (compared with the other measurements), for example based on the distribution of measured spectral widths (e.g. a mean plus or minus a number of standard deviations).
- Figure 17 is a graph 550 illustrating how the results of an analysis may converge with increasing numbers of scattering measurements. Successive scattering measurements were performed, and the reported Z average obtained (updated every five scattering measurements) from the accumulated retained data is plotted 532 in Figure 16 on the primary y-axis (against the number of scattering measurements on the x-axis). The data retention percentage, defined as the percentage of rejected/segregated scattering measurements compared with the total number of scattering measurements, is plotted 531 with respect to the first secondary y-axis (also determined every five scattering measurements). The change in Z average at each data point is plotted 533 with respect to the second secondary y-axis.
- the initial scattering measurements include larger particles, while a significant amount of data is excluded from the first 5 scattering measurements, the reported Z average is still realtively large. Even more data is excluded in scattering measurements 6 to 10, and the reported Z average is lower. A more mono-modal distribution of particle sizes is detected after scattering measurement 10, with the result that less data is rejected, and the Z average begins to converge on the Z average for the mono-modal particle (which is likely to be the particle of interest). The Z average is converged to less than 1% within 45 scattering measurements.
- the user may be able to set a convergence criteria for triggering the end of a measurement.
- a less reliable measurement can be obtained by setting a Z average convergence tolerance of 10%, which may result in the measurement ending after around 30 scattering measurements (rather than 45 scattering measurements).
- the use of a series of separately analysed, relatively short, scattering measurements mean that the analysis can be faster, because it can be stopped early when a convergence criteria is met, at the same time as being more reliable, since transient large particles will not be allowed to impact the measurement, and the measurement may continue until sufficient reliable scattering data is obtained.
- the improved ability to reject inconsistent data may also allow less stringent sample preparation, or enable the analysis of samples that were previously regarded as unsuitable for analysis.
- scattered light is detected with an avalanche photodiode or similar photon counting device, from which a precise time of arrival of each photon pulse can be recorded.
- the result is a series of time measurements, each associated with a photon arrival at the detector.
- it is necessary to process the raw time series of photon arrivals, by binning the arrival times in bins corresponding with time intervals, with count rate determined from the number of photons in the bin (divided by the bin width).
- the bin size determines the temporal resolution of the count rate signal - there is a trade-off between the resolution of quantisation within each bin and the temporal resolution. A smaller bin size will provide a greater temporal resolution, but will include a relatively small number of photons, limiting quantisation resolution. A larger bin will include more photons, but will lead to fine temporal structure being discarded.
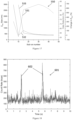
- Figure 18 show a count rate trace 601, showing thousands of counts per second (kcps) against time (s) for a 220nm latex suspension containing filter spoil. Peaks 602 are visible in the trace, which correspond with scattering from contaminants (filter spoil in this case). The peaks 602 have a relatively low frequency, and a high scattering intensity.
- One way to correct the count rate trace to correct scattering measurement is to high-pass filter the count rate. This will have the effect of removing low frequency components, so will tend to remove a scattering contribution from contaminants.
- Any suitable filter may be used, and the filter may be implemented electronically or digitally. Examples of suitable filters include FTIR and IIR digital filters, and Butterworth, Chebyshev and Hanning window filters.
- Determining an arbitrary cut-off frequency for the filter that fits all measurement circumstances may be difficult, because the size range of particles that can be measured with typical light scattering techniques may be very broad.
- a fixed cut-off frequency that is too low may adversely affect the ability of the method to analyse large particles, and a fixed cut-off frequency that is too high may limit the accuracy of the method in characterising monomodal small particles.
- a solution to this problem is to dynamically determine a cut-off frequency for a filtering operation on the scattering measurement.
- One way to do this is to divide the scattering measurement into a series of shorter sub-runs (or to put it another way, to take a plurality of scattering measurements), and analyse the power (or amplitude) at a number of different frequencies for each sub-run (e.g. by performing a Fourier transform on a count rate for each sub-run).
- Frequencies that include a scattering contribution from contaminants may be defined as those which include sub-runs with powers that are outliers from the distribution of the powers of the rest of the sub-runs. For example for each frequency, an average power level, and a standard deviation may be determined from the power levels in each sub-run. If a particular frequency includes a power level that is more than a predetermined multiple of standard deviations from the average value (e.g. two or three standard deviations), that frequency may be identified as including a scattering contribution from a contaminant. The lowest frequency that does not include a scattering contribution from a contaminant may be used as the cut-off frequency for a filtering operation on the scattering measurement.
- Figure 19 illustrates this, showing Fourier transforms 611 obtained by splitting the scattering measurement shown in Figure 18 into 10 runs of 1 second each. Two of the runs 623 are obvious statistical outliers at frequencies below 10 Hz (i.e. 2-3 seconds and 5-6 seconds). Accordingly, the dynamic cut-off frequency may be determined as 10 Hz, and the scattering measurement filtered appropriately.
- An alternative method of correcting the scattering data is to subtract a low-pass or smoothed version of the data (as already discussed with reference to Figures 15 and 16 ).
- the method described above for determining a dynamic cut-off frequency may be applied to determine appropriate smoothing or low-pass filtering characteristics for this purpose.
- a plot 630 of autocorrelation functions obtained from raw scattering measurements 631 and corrected scattering measurements 632 is shown.
- the raw data in this case comprises a series of photon arrival times
- the corrected scattering measurement from which the corrected autocorrelation function was determined comprises a binned count rate which has been corrected (e.g. by filtering or subtracting a filtered/smoothed version of the count rate).
- the bin size 633 was 10 micro-seconds, with the result that delay times less than (and near to) 10 microseconds cannot be resolved.
- the correction has successfully removed the noise on the baseline of the autocorrelation function (at long delay times), it results in an autocorrelation function that is not resolved at short delay times.
- a composite autocorrelation function may be determined by combining a portion of the raw autocorrelation function 631a (corresponding with short delay times) with a portion of the corrected autocorrelation function 632 (corresponding with longer delay times), as shown in Figure 21
- the cut-off delay time that marks the boundary between the raw and corrected portions of the corrected autocorrelation function may be selected from the range of 50-250 micro-seconds.
- the raw autocorrelation function may be re-normalised so that the value of the raw autocorrelation function matches that of the corrected autocorrelation function at the cut-off delay time, as shown in Figure 21 .
- a cut-off delay time may be selected that minimises a gradient change at the transition between the raw and corrected portion of the composite autocorrelation function.
- An iterative method may be used to determine an optimal cut-off delay time for the transition between the raw and corrected autocorrelation function.
- a scattering measurement is corrected when it is in the form of a series of photon arrivals times by deleting photon arrivals to reduce the effective scattering intensity at relevant times.
- Figure 22 is a graph showing the same scattering count rate 601 previously illustrated in Figure 18 , but further including an average count rate 604 (in this case a median, but a mean or mode could also be used).
- the lowest count rate 605 is also indicated, and an upper limit 603 for non-contaminated scattering is indicated.
- the upper limit 603 is calculated from the scattering count rate, in this case being the average 604 plus the difference between the average 604 and the minimum count rate 605.
- a different criteria may be used to define an upper limit 603 for the normal count rate (e.g. average plus n standard deviations).
- Bins 602 that are outside the upper limit 603 are indicated. These bins have been identified as contaminated bins (i.e. including a scattering contribution from contaminants).
- an excess number of counts may be determined by subtracting the count rate in the contaminated bin from the upper limit 603.
- a number of photon arrival events equal to the excess number of counts can subsequently be deleted from each contaminated bin, for example by selecting recorded photon pulses for deletion from that bin at random.
- Figure 23 illustrates the resulting corrected count rate trace 655, which has been limited not to exceed the upper limit of intensity 603 in each bin.
- the amount of counts to be deleted from each bin may be selected with a degree of randomness, to avoid the hard limit on the photon count per bin that is visible in Figure 23 .
- a number of photons may be selected for deletion based on a random number between the excess number of photons in each bin and a maximum number of photons to be deleted.
- an additional random photons above the excess number of photons may be deleted iteratively until the statistics of the spread of counts per bin meets some quality metric (e.g. a Poisson distribution test).
- Figure 24 shows the autocorrelation function of the raw scattering measurement 651 and the autocorrelation function of the corrected scattering measurement 652.
- the corrected autocorrelation function has a much lower baseline, but retains information at low delay times that would be adversely affected by correcting a scattering measurement after binning.
- Performing a cumulants analysis on the raw autocorrelation function 651 results in a reported Z average of 451nm.
- Performing a cumulants analysis on the corrected autocorrelation function 652 results in a reported Z average of 247nm. The latter figure is in excellent agreement with an cumulants analysis performed on a rigorously filtered sample, which gave a Z average of 242nm.
- This technique of discarding photon arrival times can be adapted to correct the scattering data based on more complex criteria than a simple upper limit to scattering intensity.
- a model of a scattering contribution may be subtracted from the raw count rate timing data: e.g. the smoothed count rate 511 from Figure 15 could be used to define a number of counts for removal from each bin of the raw photon arrival time scattering measurement.
- This sort of correction enables a corrected scattering measurement to be produced directly from the raw scattering measurement without first binning the scattering measurement.
- the raw sequence of photon arrival times may also be directly processed to identify scattering contributions from contaminants.
- the gradient of photon count against photon arrival time can be used to identify high intensity portions of the scattering measurement.
- Figure 25 shows a plot of photon number against photon arrival time 660 for 500nm latex spheres dispersed in water.
- the circled regions 661 indicate changes in gradient that correspond with a scattering contribution from contaminants. Such regions may be identified by comparing the local gradient of the count rate trace with an average gradient for the whole measurement.
- Figure 26 illustrates this process, showing an average gradient 671 and the calculated gradient 670 for each of a plurality of windows.
- the windows may be defined based on a fixed number of photon arrivals, or based on a fixed time.
- a gradient threshold 672 is defined as a percentage of the average gradient (in this case 70%). This results in 5 windows 673 being identified as contaminated.
- This process may be used to identify portions of the raw count rate trace that do not include a scattering contribution from contaminants.
- a central portion of the scattering measurement (between the first and second circled regions 661 in Figure 25 ) is the longest continuous portion of the scattering measurement that is not contaminated.
- the longest uncontaminated portion may be used as a basis for determining a characteristic of a particle (e.g. a particle size or particle size distribution).
- a smaller window size will result in more sensitive identification of scattering contributions from contaminants, and a larger window size will tend to be less sensitive.
- the window size may be adjusted to suit the properties of the sample (e.g. based on statistical properties of the scattering measurement).
- modifying the count rate may be considered analogous to attenuating the optical signal (e.g. with an attenuator, in the optical domain).
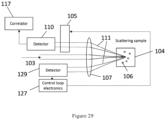
- Figures 27 to 29 illustrate examples implemented in the optical domain.
- an apparatus for particle characterisation comprising a variable attenuator 105, focussing lens 107, sample cell 104, detector 110, correlator 117 and control electronics 127.
- a sample 106 comprising particles suspended in a diluent fluid is within the sample cell 104.
- An illuminating light beam 103 from a light source illuminates the sample 106, so as to produced scattered light 111.
- the light beam 103 is focussed within the sample cell 104 by a focussing lens 107 (which may be moveable, so as to alter the detection region within the cell).
- the scattered light 111 is received by the detector 111 via a detection optical path with passes through the focussing lens 107.
- the detector 110 may be a photo counting detector, such as an avalanche photodiode or similar.
- the output from the detector 110 is provided to a correlator, for example for performing a DLS analysis or similar.
- any appropriate optical arrangement may be used to direct the detection optical path to overlap with the light beam.
- the light beam and/or detector optical path may be collimated or diverging.
- the output from the detector 110 is provided to control electronics 127, which is configured to detect a scattering contribution from contaminants in the scattered light at the detector.
- the control electronics may embody any of the methods described herein to detect scattering contributions from contaminants.
- the control electronics may comprise a low pass filter.
- the control electronics may provide a control signal that is proportional to a scattering contribution from contaminants to the variable attenuator, which attenuates the illumination beam to compensate for the scattering from contaminants.
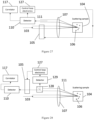
- Figure 28 illustrates an alternative apparatus for particle characterisation, further comprising a beam splitter 128 and further detector 129.
- the beam splitter is arranged to provide a portion of the scattered light 111 to the further detector 129.
- the control electronics 127 is configured to detect a scattering contribution from contaminants in the scattered light at the further detector 129.
- the control electronics may embody any of the methods described herein to detect scattering contributions from contaminants.
- the control electronics may comprise a low pass filter.
- the control electronics may provide a control signal that is proportional to a scattering contribution from contaminants to the variable attenuator, which attenuates the scattering light received by the detector 110, to compensate for the scattering from contaminants.
- Figure 29 illustrates a further alternative apparatus, which is similar to that of Figure 28 (in that a further detector 129 is used to provide the signal to the control electronics), but which omits the beam splitter.
- the scattered light 111 detected by the further detector 129 is scattered in a different direction to the scattered light that is ultimately received at the detector 110.
- the scattering angle for the detector 110 and the further detector 129 may preferably be substantially the same, but this is not essential.
- the further detector 129 may be at a different scattering angle (e.g. detecting forward scatter, with a back scatter detector 110 ).
- the variable attenuator 105 may comprise a variable neutral density filter, mounted on a translation stage (e.g. comprising a stepper motor or piezoelectric transducer. Alternatively, the attenuation may be varied using the polarisation of the light within the system (the illumination light beam may be polarised, and the scattered light may retain this polarisation, to at least some degree).
- a variable attenuator on these principles may comprise tuneable crossed polarisers, a single polariser and a Pockels cell, a Faraday rotor, a combination of a fixed and fibre polariser, a variable wave plate and/or liquid crystal elements.
- any other relevant data sets may be shown before and after processing e.g. presentation of raw and corrected autocorrelation functions for DLS (e.g. as in Figure 24 ) and phase or frequency plots for ELS and MLS, and traces used in the processing of the data (e.g. the spectra of Figure 19 or the windowed gradient in Figure 26 ).
- a light scattering measurement may be based on heterodyne detection, with a modulated reference (or scattering) beam.
- the amplitude of the envelope of the modulated detector signal may be the measurement parameter (rather than the intensity of scattered light), and the methods described herein may be modified accordingly.
- the method described herein can readily be adapted to process PALS (phase angle light scattering) to reduce the effect of contaminants on zeta potential measurements.
Landscapes
- Chemical & Material Sciences (AREA)
- Dispersion Chemistry (AREA)
- Physics & Mathematics (AREA)
- Health & Medical Sciences (AREA)
- Life Sciences & Earth Sciences (AREA)
- Analytical Chemistry (AREA)
- Biochemistry (AREA)
- General Health & Medical Sciences (AREA)
- General Physics & Mathematics (AREA)
- Immunology (AREA)
- Pathology (AREA)
- Investigating Or Analysing Materials By Optical Means (AREA)
- Analysing Materials By The Use Of Radiation (AREA)
Claims (7)
- Verfahren zum Charakterisieren von Partikeln in einer Probe (106), das umfasst:Erhalten einer Streumessung (320, 512, 601), die eine Zeitreihe von Messungen von Streulicht von einem Detektor (114) umfasst, wobei das Streulicht durch die Interaktion eines Beleuchtungslichtstrahls (103) mit der Probe (106) erzeugt wird;Erstellen einer korrigierten Streumessung, die das Kompensieren von Streubeiträgen von Verunreinigungen umfasst, die anhand ihrer größeren Größe von den Partikeln unterschieden werden können, indem eine Streuintensität in zumindest einigen Zeiträumen der Streumessung (320, 512, 601) verringert wird;Bestimmen eines Partikelcharakteristikums anhand der korrigierten Streumessung;wobei die Streumessung eine Sequenz von Photoneneinfallszeiten umfasst, und dadurch gekennzeichnet, dass das Verringern der Streuintensität das Löschen von Photoneneinfallszeiten aus der Sequenz durch Auswählen einer zeitlichen Weite für ein Binnen und das Binnen der Sequenz von Photoneneinfallszeiten, wobei jedes Bin einem Zeitraum mit der zeitlichen Weite entspricht, so dass eine Zählung von Photoneneinfallszeiten in jedem Bin die Streuintensität über den entsprechenden Zeitraum anzeigt, und das Korrigieren ausgewählter Bins durch Löschen einer Anzahl von Photoneneinfallszeiten aus jedem ausgewählten Bin umfasst, um eine korrigierte Streumessung zu erstellen, die ein gebinnter zeitlicher Verlauf einer Streuintensität mit einer zeitlichen Auflösung ist, die durch die zeitliche Weite definiert wird; unddas Verringern der Streuintensität das Bestimmen eines Modells zu Streubeiträgen aus Verunreinigungen umfasst, wobei das Modell einen Schätzwert zu der Anzahl von Photoneneinfallszeiten in jedem Bin durch die Streuung von einer Verunreinigung umfasst, und das Korrigieren der ausgewählten Bins das Löschen einer Anzahl von Photoneneinfallszeiten auf der Grundlage des Schätzwerts für jedes ausgewählte Bin umfasst.
- Verfahren nach einem vorstehenden Anspruch, wobei das Verringern der Streuintensität das Modifizieren einer aufgezeichneten Streumessung umfasst.
- Verfahren nach Anspruch 1 oder 2, wobei das Verringern der Streuintensität das Hochpassfiltern der Streumessung umfasst.
- Verfahren nach einem der Ansprüche 1 bis 3, wobei das Verringern der Streuintensität das Bestimmen eines Parameters anhand der Streumessung umfasst, wobei der Schritt des Verringerns der Streuintensität unter Berücksichtigung des Parameters erfolgt.
- Verfahren nach Anspruch 4, wobei der Parameter eine Cutoff-Frequenz für einen Filtervorgang umfasst.
- Verfahren nach Anspruch 4 oder 5, wobei das Bestimmen des Parameters das Identifizieren von statistischen Ausreißern in dem Spektralgehalt der Streumessung umfasst.
- Vorrichtung zum Charakterisieren von Partikeln, die umfasst: eine Lichtquelle (102), eine Probenzelle (104), einen Detektor (114) und einen Prozessor (130); wobeidie Lichtquelle (102) so betreibbar ist, dass sie eine Probe (106) innerhalb der Probenzelle (104) mit einem Lichtstrahl (103) beleuchtet, um Streulicht durch Interaktionen des Lichtstrahls (103) mit der Probe (106) zu erzeugen;der Detektor (114) dazu ausgestaltet ist, das Streulicht zu detektieren und eine Zeitreihe von Messungen zu erstellen; undder Prozessor (130) dazu ausgestaltet ist:Erhalten einer Streumessung, die eine Zeitreihe von Messungen des Streulichts von dem Detektor (114) umfasst;Erstellen einer korrigierten Streumessung, die das Kompensieren von Streubeiträgen von Verunreinigungen umfasst, die anhand ihrer größeren Größe von den Partikeln unterschieden werden können, indem eine Streuintensität in zumindest einigen Zeiträumen der Streumessung verringert wird;Bestimmen eines Partikelcharakteristikums anhand der korrigierten Streumessung;wobei die Streumessung eine Sequenz von Photonenimpulsen umfasst, und wobei das Verringern der Streuintensität das Löschen von Photonenimpulsen aus der Sequenz durch Auswählen einer zeitlichen Bin-Weite zum Binnen der Sequenz von Photonenimpulsen, wobei jedes Bin einem Zeitraum mit der zeitlichen Weite entspricht, so dass eine Zählung von Photoneneinfallszeiten in jedem Bin die Streuintensität über den entsprechenden Zeitraum anzeigt, und das Korrigieren ausgewählter Bins durch Löschen einer Anzahl von Photonenimpulsen aus jedem ausgewählten Bin umfasst, um eine korrigierte Streumessung zu erstellen, die ein gebinnter zeitlicher Verlauf einer Streuintensität mit einer zeitlichen Auflösung ist, die durch die zeitliche Weite definiert wird; und
das Verringern der Streuintensität das Bestimmen eines Modells zu Streubeiträgen aus Verunreinigungen umfasst, wobei das Modell einen Schätzwert zu der Anzahl von Photonenimpulsen in jedem Bin durch die Streuung von einer Verunreinigung umfasst, und das Korrigieren der ausgewählten Bins das Löschen einer Anzahl von Photonenimpulsen auf der Grundlage des Schätzwerts für jedes ausgewählte Bin umfasst.
Priority Applications (1)
| Application Number | Priority Date | Filing Date | Title |
|---|---|---|---|
| EP25157268.1A EP4563972A3 (de) | 2017-03-23 | 2018-03-20 | Partikelcharakterisierung |
Applications Claiming Priority (2)
| Application Number | Priority Date | Filing Date | Title |
|---|---|---|---|
| EP17162676.5A EP3379232A1 (de) | 2017-03-23 | 2017-03-23 | Partikelcharakterisierung |
| PCT/EP2018/057033 WO2018172362A1 (en) | 2017-03-23 | 2018-03-20 | Particle characterisation |
Related Child Applications (1)
| Application Number | Title | Priority Date | Filing Date |
|---|---|---|---|
| EP25157268.1A Division EP4563972A3 (de) | 2017-03-23 | 2018-03-20 | Partikelcharakterisierung |
Publications (2)
| Publication Number | Publication Date |
|---|---|
| EP3602001A1 EP3602001A1 (de) | 2020-02-05 |
| EP3602001B1 true EP3602001B1 (de) | 2025-02-12 |
Family
ID=58412957
Family Applications (3)
| Application Number | Title | Priority Date | Filing Date |
|---|---|---|---|
| EP17162676.5A Withdrawn EP3379232A1 (de) | 2017-03-23 | 2017-03-23 | Partikelcharakterisierung |
| EP18710904.6A Active EP3602001B1 (de) | 2017-03-23 | 2018-03-20 | Partikelcharakterisierung |
| EP25157268.1A Pending EP4563972A3 (de) | 2017-03-23 | 2018-03-20 | Partikelcharakterisierung |
Family Applications Before (1)
| Application Number | Title | Priority Date | Filing Date |
|---|---|---|---|
| EP17162676.5A Withdrawn EP3379232A1 (de) | 2017-03-23 | 2017-03-23 | Partikelcharakterisierung |
Family Applications After (1)
| Application Number | Title | Priority Date | Filing Date |
|---|---|---|---|
| EP25157268.1A Pending EP4563972A3 (de) | 2017-03-23 | 2018-03-20 | Partikelcharakterisierung |
Country Status (5)
| Country | Link |
|---|---|
| US (3) | US11199486B2 (de) |
| EP (3) | EP3379232A1 (de) |
| JP (1) | JP7281409B2 (de) |
| CN (1) | CN110431398B (de) |
| WO (1) | WO2018172362A1 (de) |
Families Citing this family (15)
| Publication number | Priority date | Publication date | Assignee | Title |
|---|---|---|---|---|
| EP4215900A1 (de) | 2015-09-23 | 2023-07-26 | Malvern Panalytical Limited | Partikelcharakterisierung |
| US11002655B2 (en) | 2015-09-23 | 2021-05-11 | Malvern Panalytical Limited | Cuvette carrier |
| GB201604460D0 (en) | 2016-03-16 | 2016-04-27 | Malvern Instr Ltd | Dynamic light scattering |
| EP3379232A1 (de) | 2017-03-23 | 2018-09-26 | Malvern Panalytical Limited | Partikelcharakterisierung |
| EP3739321B1 (de) * | 2019-05-17 | 2023-03-08 | Xtal Concepts GmbH | Qualifizierungsverfahren für kryoelektronenmikroskopie-proben sowie dazugehöriger probenhalter |
| EP3922977B1 (de) * | 2020-06-08 | 2024-08-07 | Universität für Bodenkultur Wien | Verfahren zur bestimmung einer eigenschaft eines partikels in einem medium |
| JP7473200B2 (ja) * | 2020-11-12 | 2024-04-23 | 国立研究開発法人物質・材料研究機構 | 動的光散乱測定装置、動的光散乱測定・解析方法、および、測定・解析プログラム |
| JP7504460B2 (ja) * | 2021-01-07 | 2024-06-24 | 国立研究開発法人物質・材料研究機構 | 動的光散乱測定装置、動的光散乱測定・解析方法、および、測定・解析プログラム |
| KR20240063136A (ko) * | 2021-09-09 | 2024-05-10 | 토소 바이오사이언스 엘엘씨 | 광 산란 검출기 및 이를 위한 방법 |
| KR102544474B1 (ko) * | 2021-10-19 | 2023-06-20 | 관악아날로그 주식회사 | 먼지 센서 |
| JP7363984B1 (ja) * | 2022-07-22 | 2023-10-18 | 栗田工業株式会社 | 凝集状態の判断方法及び凝集処理方法 |
| JP7452583B2 (ja) * | 2022-07-22 | 2024-03-19 | 栗田工業株式会社 | 凝集状態の判断方法及び凝集処理方法 |
| CN115791539B (zh) * | 2022-12-20 | 2025-06-24 | 北京航空航天大学杭州创新研究院 | 激光检测纳米颗粒的信号补偿方法、系统、设备及介质 |
| GB202302879D0 (en) * | 2023-02-27 | 2023-04-12 | Malvern Panalytical Ltd | Particle characterisation |
| AT527029B1 (de) | 2023-04-21 | 2024-10-15 | Anton Paar Gmbh | Vorrichtung und Verfahren zur Charakterisierung einer Probe und insbesondere zur Charakterisierung eines Probenbehälters |
Family Cites Families (90)
| Publication number | Priority date | Publication date | Assignee | Title |
|---|---|---|---|---|
| US3621220A (en) | 1969-08-29 | 1971-11-16 | Norman C Ford Jr | Scattered light measurement providing autocorrelation function |
| US4074939A (en) | 1973-12-19 | 1978-02-21 | Max-Planck-Gesellschaft Zur Foerderung Der Wissenschaften E.V. | Apparatus for investigating fast chemical reactions by optical detection |
| US4473296A (en) | 1978-05-03 | 1984-09-25 | Ppm, Inc. | System and method and apparatus for a continuous aerosol monitor (CAM) using electro-optical weighing for general aerosols |
| US4178917A (en) | 1979-01-03 | 1979-12-18 | Shapiro Howard M | Method and system for non-invasive detection of zinc protoporphyrin in erythrocytes |
| US4710025A (en) | 1982-06-22 | 1987-12-01 | Wyatt Technology Company | Process for characterizing suspensions of small particles |
| US4537861A (en) | 1983-02-03 | 1985-08-27 | Elings Virgil B | Apparatus and method for homogeneous immunoassay |
| US4690561A (en) | 1985-01-18 | 1987-09-01 | Canon Kabushiki Kaisha | Particle analyzing apparatus |
| US4676641A (en) | 1986-01-08 | 1987-06-30 | Coulter Electronics Of New England, Inc. | System for measuring the size distribution of particles dispersed in a fluid |
| US4781460A (en) | 1986-01-08 | 1988-11-01 | Coulter Electronics Of New England, Inc. | System for measuring the size distribution of particles dispersed in a fluid |
| US5166052A (en) | 1986-05-27 | 1992-11-24 | Boris Cercek | Method for measuring polarization of bathochromically shifted fluorescence |
| GB8705844D0 (en) | 1987-03-12 | 1987-04-15 | Secr Defence | Dynamic light scattering apparatus |
| DE68924749T2 (de) * | 1988-09-15 | 1996-07-04 | The Board Of Trustees Of The University Of Arkansas, Little Rock, Ark. | Kennzeichnung von Teilchen durch modulierte dynamische Lichtstreuung. |
| JPH02228069A (ja) | 1989-02-28 | 1990-09-11 | Omron Tateisi Electron Co | 受光素子アレイ |
| JPH05172730A (ja) | 1991-12-25 | 1993-07-09 | Shimadzu Corp | 粒度分布測定装置 |
| JP3294668B2 (ja) * | 1993-04-30 | 2002-06-24 | 花王株式会社 | 粒子群の粒度検出方法および装置 |
| US5576827A (en) | 1994-04-15 | 1996-11-19 | Micromeritics Instrument Corporation | Apparatus and method for determining the size distribution of particles by light scattering |
| FI98765C (fi) | 1995-01-16 | 1997-08-11 | Erkki Soini | Virtaussytometrinen menetelmä ja laite |
| US6052184A (en) * | 1996-11-13 | 2000-04-18 | The Administrators Of The Tulane Educational Fund | Miniature, submersible, versatile, light scattering probe for absolute equilibrium and non-equilibrium characterization of macromolecular and colloidal solutions |
| DE19725211C1 (de) | 1997-06-15 | 1998-06-04 | Alv Laser Vertriebsgesellschaf | Faserdetektor zur Detektion des Streulichtes oder des Fluoreszenzlichtes einer flüssigen Suspension |
| US5956139A (en) | 1997-08-04 | 1999-09-21 | Ohio Aerospace Institute | Cross-correlation method and apparatus for suppressing the effects of multiple scattering |
| US6016193A (en) | 1998-06-23 | 2000-01-18 | Awareness Technology, Inc. | Cuvette holder for coagulation assay test |
| US6100976A (en) | 1998-09-21 | 2000-08-08 | The Board Of Regents For Oklahoma State University | Method and apparatus for fiber optic multiple scattering suppression |
| US6509161B1 (en) | 2000-02-29 | 2003-01-21 | Gentronix Limited | Green fluorescent protein |
| US6603546B1 (en) | 2000-07-21 | 2003-08-05 | I.S.S. (Usa) Inc. | Rapid high throughput spectrometer and method |
| JP2002196222A (ja) | 2000-12-25 | 2002-07-12 | Nikon Corp | 面位置検出装置、露光装置 |
| JP2002341173A (ja) | 2001-05-15 | 2002-11-27 | Namiki Precision Jewel Co Ltd | 微小レンズ付光ファイバアレイ及びその製造方法 |
| EP1291642A1 (de) | 2001-09-05 | 2003-03-12 | Linde Medical Sensors AG | Sensorsystem mit einem integrierten optischen Wellenleiter zur Detektion von chemischen Substanzen |
| GB0122219D0 (en) | 2001-09-13 | 2001-11-07 | Gentronix Ltd | Toxicity monitoring |
| US6794671B2 (en) * | 2002-07-17 | 2004-09-21 | Particle Sizing Systems, Inc. | Sensors and methods for high-sensitivity optical particle counting and sizing |
| JP3720799B2 (ja) * | 2002-10-02 | 2005-11-30 | 神栄株式会社 | 花粉センサ |
| CN1502981A (zh) | 2002-11-20 | 2004-06-09 | 上海理工大学 | 基于动态光散射信号分形的颗粒测量方法及装置 |
| US7138091B2 (en) | 2003-07-18 | 2006-11-21 | Dade Behring Inc. | Reaction cuvette having anti-wicking features for use in an automatic clinical analyzer |
| ZA200601273B (en) | 2003-08-14 | 2007-09-26 | Cytonome Inc | Optical detector for a particle sorting system |
| US7268881B2 (en) | 2004-02-17 | 2007-09-11 | The Curators Of The University Of Missouri | Light scattering detector |
| US10386283B2 (en) | 2004-03-06 | 2019-08-20 | Michael Trainer | Methods and apparatus for determining particle characteristics by utilizing force on particles |
| US7471393B2 (en) | 2004-03-06 | 2008-12-30 | Michael Trainer | Methods and apparatus for determining the size and shape of particles |
| US20140226158A1 (en) | 2004-03-06 | 2014-08-14 | Michael Trainer | Methods and apparatus for determining particle characteristics |
| US20070242269A1 (en) * | 2004-03-06 | 2007-10-18 | Michael Trainer | Methods and apparatus for determining characteristics of particles |
| US10620105B2 (en) * | 2004-03-06 | 2020-04-14 | Michael Trainer | Methods and apparatus for determining characteristics of particles from scattered light |
| US20080221814A1 (en) | 2004-04-10 | 2008-09-11 | Michael Trainer | Methods and apparatus for determining particle characteristics by measuring scattered light |
| US9297737B2 (en) * | 2004-03-06 | 2016-03-29 | Michael Trainer | Methods and apparatus for determining characteristics of particles |
| US10955327B2 (en) | 2004-03-06 | 2021-03-23 | Michael Trainer | Method and apparatus for determining particle characteristics utilizing a plurality of beam splitting functions and correction of scattered light |
| WO2005099408A2 (en) * | 2004-04-10 | 2005-10-27 | Michael Trainer | Methods and apparatus for determining particle characterics by measuring scattered light |
| JP4517145B2 (ja) * | 2004-09-02 | 2010-08-04 | 国立大学法人北海道大学 | 光散乱装置、光散乱測定法、光散乱解析装置および光散乱測定解析法 |
| ITMI20050964A1 (it) | 2005-05-25 | 2006-11-26 | Tenax Spa | Confezione particolarmente per prodotti ortofrutticoli ed alimentari in genere realizzabile con macchine confezionatrici automatiche |
| US20070229823A1 (en) | 2006-03-31 | 2007-10-04 | Intel Corporation | Determination of the number concentration and particle size distribution of nanoparticles using dark-field microscopy |
| WO2007126389A1 (en) | 2006-05-02 | 2007-11-08 | Asensor Pte Ltd | Optical detector system for sample analysis having at least two different optical pathlengths |
| JP2008039539A (ja) * | 2006-08-04 | 2008-02-21 | Shimadzu Corp | 光散乱検出装置 |
| EP1906252A1 (de) | 2006-09-28 | 2008-04-02 | Carl Zeiss SMT AG | Instrument zum Messen der Winkelverteilung von mittels Beleuchtungssystem eines mikrolithografischen Projektionsbelichtungsgeräts erzeugtem Licht |
| WO2008092272A1 (en) | 2007-02-02 | 2008-08-07 | Canadian Blood Services | Method of detecting bacterial contamination using dynamic light scattering |
| WO2009036418A1 (en) | 2007-09-13 | 2009-03-19 | Duke University | Apparatuses, systems, and methods for low-coherence interferometry (lci) |
| CN101477023A (zh) | 2008-01-02 | 2009-07-08 | 杨晖 | 基于动态光散射信号时间相干度的超细颗粒测量装置及方法 |
| WO2009090562A2 (en) | 2008-01-15 | 2009-07-23 | Malvern Instruments Ltd | Light scattering measurements using simultaneous detection |
| WO2009151610A2 (en) | 2008-06-12 | 2009-12-17 | East Carolina University | Flow cytometer apparatus for three dimensional diffraction imaging and related methods |
| JP5172730B2 (ja) | 2009-02-05 | 2013-03-27 | 株式会社ジェイアール西日本ビルト | 外装材用取付部材、外装構造、及びその施工方法 |
| US8493559B2 (en) | 2009-03-17 | 2013-07-23 | Trevor Harvard | Cuvette |
| DE102009014080B4 (de) | 2009-03-23 | 2011-12-15 | Baumer Innotec Ag | Vorrichtung zum Bestimmen von Partikelgrössen |
| EP2430465B1 (de) * | 2009-05-12 | 2016-03-16 | Thermo Fisher Scientific Inc. | Partikelerkennung und kalibrierung von sensoren |
| JP5366728B2 (ja) | 2009-09-14 | 2013-12-11 | 北斗電子工業株式会社 | 液体中の粒子のサイズの検出方法および装置 |
| DE102010005962B4 (de) * | 2010-01-21 | 2012-01-26 | Alv-Laser Vertriebsgesellschaft Mbh | Verfahren zur Bestimmung der statischen und/oder dynamischen Lichtstreuung |
| EP2365313B1 (de) | 2010-03-12 | 2015-08-26 | LS Instruments AG | Verfahren und System zur dynamischen Kreuzkorrelations-Lichtstreuung |
| US8717562B2 (en) * | 2010-08-23 | 2014-05-06 | Scattering Solutions, Inc. | Dynamic and depolarized dynamic light scattering colloid analyzer |
| JP5662742B2 (ja) | 2010-08-27 | 2015-02-04 | アイステーシス株式会社 | 粒径計測装置及び粒径計測方法 |
| US8729502B1 (en) | 2010-10-28 | 2014-05-20 | The Research Foundation For The State University Of New York | Simultaneous, single-detector fluorescence detection of multiple analytes with frequency-specific lock-in detection |
| US9164042B2 (en) * | 2011-02-10 | 2015-10-20 | Hitachi High-Technologies Corporation | Device for detecting foreign matter and method for detecting foreign matter |
| US10359361B2 (en) | 2011-02-18 | 2019-07-23 | The General Hospital Corporation | Laser speckle micro-rheology in characterization of biomechanical properties of tissues |
| CN202275041U (zh) | 2011-03-17 | 2012-06-13 | 上海理工大学 | 同时测量多颗粒的动态光散射纳米颗粒粒度的装置 |
| EP2721399B1 (de) | 2011-06-15 | 2017-04-19 | Malvern Instruments Limited | Oberflächenladungsmessung |
| GB2493391B (en) | 2011-08-05 | 2015-09-16 | Malvern Instr Ltd | Optical detection and analysis of particles |
| CN202453283U (zh) | 2011-12-27 | 2012-09-26 | 江西科技师范学院 | 一种比色皿支撑架 |
| JP5442052B2 (ja) | 2012-02-16 | 2014-03-12 | 株式会社堀場製作所 | 粒子分析装置 |
| EP2864759A2 (de) | 2012-06-22 | 2015-04-29 | Malvern Instruments Ltd | Teilchencharakterisierung |
| EP2698624A1 (de) | 2012-08-16 | 2014-02-19 | Siemens Healthcare Diagnostics Products GmbH | Reaktionsgefäß |
| US8854621B1 (en) * | 2012-08-29 | 2014-10-07 | University Of South Florida | Systems and methods for determining nanoparticle dimensions |
| RU2525605C2 (ru) | 2012-10-26 | 2014-08-20 | Вячеслав Геннадьевич Певгов | Способ и устройство для оптического измерения распределения размеров и концентраций дисперсных частиц в жидкостях и газах с использованием одноэлементных и матричных фотоприемников лазерного излучения |
| EP2869054A1 (de) | 2013-11-05 | 2015-05-06 | Malvern Instruments Limited | Verbesserungen in Zusammenhang mit Partikelcharakterisierung |
| CN105705932B (zh) | 2013-11-05 | 2019-05-14 | 马尔文仪器有限公司 | 与颗粒表征有关的改善 |
| US11002655B2 (en) | 2015-09-23 | 2021-05-11 | Malvern Panalytical Limited | Cuvette carrier |
| EP4215900A1 (de) | 2015-09-23 | 2023-07-26 | Malvern Panalytical Limited | Partikelcharakterisierung |
| GB201516851D0 (en) | 2015-09-23 | 2015-11-04 | Malvern Instr Ltd | Cuvette carrier |
| CA3000000C (en) | 2015-10-02 | 2021-08-03 | Institut National D'optique | System and method for individual particle sizing using light scattering techniques |
| US10119910B2 (en) | 2015-10-09 | 2018-11-06 | Malvern Panalytical Limited | Particle characterisation instrument |
| FR3048240B1 (fr) | 2016-02-29 | 2018-04-13 | Cordouan Tech | Dispositif de caracterisation de particules dispersees dans un milieu liquide |
| GB201604460D0 (en) | 2016-03-16 | 2016-04-27 | Malvern Instr Ltd | Dynamic light scattering |
| US10365198B2 (en) | 2016-04-21 | 2019-07-30 | Malvern Panalytical Limited | Particle characterization |
| US10113945B2 (en) | 2016-05-10 | 2018-10-30 | Microtrac Inc. | Method and apparatus for combining measurements of particle characteristics using light scattering and optical imaging |
| EP3309536A1 (de) | 2016-10-11 | 2018-04-18 | Malvern Panalytical Limited | Partikelcharakterisierungsinstrument |
| DE102017001439A1 (de) | 2017-02-15 | 2018-08-16 | Paragon Ag | Partikelmessvorrichtung zur Bestimmung der Partikelmassenkonzentration in Aerosolen mit unterschiedlichen Eigenschaften und Verfahren zur Bestimmung der Partikelmassenkonzentration in Aerosolen mit unterschiedlichen Eigenschaften |
| EP3379232A1 (de) | 2017-03-23 | 2018-09-26 | Malvern Panalytical Limited | Partikelcharakterisierung |
| FR3090874B1 (fr) | 2018-12-21 | 2022-05-27 | Commissariat Energie Atomique | Détecteur optique de particules |
-
2017
- 2017-03-23 EP EP17162676.5A patent/EP3379232A1/de not_active Withdrawn
-
2018
- 2018-03-20 CN CN201880018559.3A patent/CN110431398B/zh active Active
- 2018-03-20 EP EP18710904.6A patent/EP3602001B1/de active Active
- 2018-03-20 US US16/496,027 patent/US11199486B2/en active Active
- 2018-03-20 EP EP25157268.1A patent/EP4563972A3/de active Pending
- 2018-03-20 JP JP2019552113A patent/JP7281409B2/ja active Active
- 2018-03-20 WO PCT/EP2018/057033 patent/WO2018172362A1/en not_active Ceased
-
2021
- 2021-11-19 US US17/531,021 patent/US11906412B2/en active Active
-
2023
- 2023-10-20 US US18/491,034 patent/US12399099B2/en active Active
Also Published As
| Publication number | Publication date |
|---|---|
| EP4563972A3 (de) | 2025-08-27 |
| US12399099B2 (en) | 2025-08-26 |
| JP7281409B2 (ja) | 2023-05-25 |
| WO2018172362A1 (en) | 2018-09-27 |
| US20220326128A1 (en) | 2022-10-13 |
| CN110431398B (zh) | 2023-03-21 |
| US11906412B2 (en) | 2024-02-20 |
| US20240192108A1 (en) | 2024-06-13 |
| US20200033245A1 (en) | 2020-01-30 |
| EP3602001A1 (de) | 2020-02-05 |
| US11199486B2 (en) | 2021-12-14 |
| EP3379232A1 (de) | 2018-09-26 |
| JP2020514762A (ja) | 2020-05-21 |
| EP4563972A2 (de) | 2025-06-04 |
| CN110431398A (zh) | 2019-11-08 |
Similar Documents
| Publication | Publication Date | Title |
|---|---|---|
| US12399099B2 (en) | Particle characterization | |
| US11435275B2 (en) | Particle characterisation | |
| JP2020514762A5 (de) | ||
| JP2019502915A (ja) | 粒子検出方法及びそれを実施するためのシステム | |
| US11187639B2 (en) | Thermal compensation | |
| Gong et al. | Signal simplification and cloud detection with an improved Douglas-Peucker algorithm for single-channel lidar | |
| Hayman et al. | Response time characteristics of the Fast-2D optical array probe detector board | |
| Ehrl et al. | Sizing polydisperse dispersions by focused beam reflectance and small angle static light scattering | |
| CN112362172B (zh) | 受散斑效应影响的自混合干涉信号的处理与条纹计数方法 | |
| FR3110709A1 (fr) | Procédé et système de surveillance en continu de la contamination radioactive atmosphérique | |
| Romadhon | The Bias in SPARCLE Measurements | |
| Broadwell | B. Signal-to-Noise Ratio | |
| EP3797280B1 (de) | Vorrichtung zur charakterisierung von objekten durch analyse von streustrahlung | |
| Agagliate | A Mie-based flow cytometric size and real refractive index determination method for natural marine particle populations | |
| Gu et al. | Information entropy characteristic of the light scattering signal amplitude distribution of aerosols | |
| Labanca | Study of monitoring system of a calibration laser for the iTOP detector at Belle II |
Legal Events
| Date | Code | Title | Description |
|---|---|---|---|
| STAA | Information on the status of an ep patent application or granted ep patent |
Free format text: STATUS: UNKNOWN |
|
| STAA | Information on the status of an ep patent application or granted ep patent |
Free format text: STATUS: THE INTERNATIONAL PUBLICATION HAS BEEN MADE |
|
| PUAI | Public reference made under article 153(3) epc to a published international application that has entered the european phase |
Free format text: ORIGINAL CODE: 0009012 |
|
| STAA | Information on the status of an ep patent application or granted ep patent |
Free format text: STATUS: REQUEST FOR EXAMINATION WAS MADE |
|
| 17P | Request for examination filed |
Effective date: 20190719 |
|
| AK | Designated contracting states |
Kind code of ref document: A1 Designated state(s): AL AT BE BG CH CY CZ DE DK EE ES FI FR GB GR HR HU IE IS IT LI LT LU LV MC MK MT NL NO PL PT RO RS SE SI SK SM TR |
|
| AX | Request for extension of the european patent |
Extension state: BA ME |
|
| DAV | Request for validation of the european patent (deleted) | ||
| DAX | Request for extension of the european patent (deleted) | ||
| STAA | Information on the status of an ep patent application or granted ep patent |
Free format text: STATUS: EXAMINATION IS IN PROGRESS |
|
| 17Q | First examination report despatched |
Effective date: 20210311 |
|
| P01 | Opt-out of the competence of the unified patent court (upc) registered |
Effective date: 20230727 |
|
| TPAC | Observations filed by third parties |
Free format text: ORIGINAL CODE: EPIDOSNTIPA |
|
| GRAP | Despatch of communication of intention to grant a patent |
Free format text: ORIGINAL CODE: EPIDOSNIGR1 |
|
| STAA | Information on the status of an ep patent application or granted ep patent |
Free format text: STATUS: GRANT OF PATENT IS INTENDED |
|
| INTG | Intention to grant announced |
Effective date: 20240612 |
|
| GRAJ | Information related to disapproval of communication of intention to grant by the applicant or resumption of examination proceedings by the epo deleted |
Free format text: ORIGINAL CODE: EPIDOSDIGR1 |
|
| STAA | Information on the status of an ep patent application or granted ep patent |
Free format text: STATUS: EXAMINATION IS IN PROGRESS |
|
| GRAJ | Information related to disapproval of communication of intention to grant by the applicant or resumption of examination proceedings by the epo deleted |
Free format text: ORIGINAL CODE: EPIDOSDIGR1 |
|
| STAA | Information on the status of an ep patent application or granted ep patent |
Free format text: STATUS: GRANT OF PATENT IS INTENDED |
|
| GRAP | Despatch of communication of intention to grant a patent |
Free format text: ORIGINAL CODE: EPIDOSNIGR1 |
|
| INTC | Intention to grant announced (deleted) | ||
| INTG | Intention to grant announced |
Effective date: 20241008 |
|
| GRAS | Grant fee paid |
Free format text: ORIGINAL CODE: EPIDOSNIGR3 |
|
| GRAA | (expected) grant |
Free format text: ORIGINAL CODE: 0009210 |
|
| STAA | Information on the status of an ep patent application or granted ep patent |
Free format text: STATUS: THE PATENT HAS BEEN GRANTED |
|
| AK | Designated contracting states |
Kind code of ref document: B1 Designated state(s): AL AT BE BG CH CY CZ DE DK EE ES FI FR GB GR HR HU IE IS IT LI LT LU LV MC MK MT NL NO PL PT RO RS SE SI SK SM TR |
|
| REG | Reference to a national code |
Ref country code: GB Ref legal event code: FG4D |
|
| REG | Reference to a national code |
Ref country code: CH Ref legal event code: EP |
|
| REG | Reference to a national code |
Ref country code: DE Ref legal event code: R096 Ref document number: 602018079047 Country of ref document: DE |
|
| REG | Reference to a national code |
Ref country code: IE Ref legal event code: FG4D |
|
| PGFP | Annual fee paid to national office [announced via postgrant information from national office to epo] |
Ref country code: DE Payment date: 20250218 Year of fee payment: 8 |
|
| PGFP | Annual fee paid to national office [announced via postgrant information from national office to epo] |
Ref country code: FR Payment date: 20250319 Year of fee payment: 8 |
|
| PGFP | Annual fee paid to national office [announced via postgrant information from national office to epo] |
Ref country code: GB Payment date: 20250319 Year of fee payment: 8 |
|
| REG | Reference to a national code |
Ref country code: NL Ref legal event code: MP Effective date: 20250212 |
|
| PG25 | Lapsed in a contracting state [announced via postgrant information from national office to epo] |
Ref country code: RS Free format text: LAPSE BECAUSE OF FAILURE TO SUBMIT A TRANSLATION OF THE DESCRIPTION OR TO PAY THE FEE WITHIN THE PRESCRIBED TIME-LIMIT Effective date: 20250512 |
|
| PG25 | Lapsed in a contracting state [announced via postgrant information from national office to epo] |
Ref country code: FI Free format text: LAPSE BECAUSE OF FAILURE TO SUBMIT A TRANSLATION OF THE DESCRIPTION OR TO PAY THE FEE WITHIN THE PRESCRIBED TIME-LIMIT Effective date: 20250212 |
|
| PG25 | Lapsed in a contracting state [announced via postgrant information from national office to epo] |
Ref country code: PL Free format text: LAPSE BECAUSE OF FAILURE TO SUBMIT A TRANSLATION OF THE DESCRIPTION OR TO PAY THE FEE WITHIN THE PRESCRIBED TIME-LIMIT Effective date: 20250212 |
|
| PG25 | Lapsed in a contracting state [announced via postgrant information from national office to epo] |
Ref country code: ES Free format text: LAPSE BECAUSE OF FAILURE TO SUBMIT A TRANSLATION OF THE DESCRIPTION OR TO PAY THE FEE WITHIN THE PRESCRIBED TIME-LIMIT Effective date: 20250212 |
|
| REG | Reference to a national code |
Ref country code: LT Ref legal event code: MG9D |
|
| PG25 | Lapsed in a contracting state [announced via postgrant information from national office to epo] |
Ref country code: IS Free format text: LAPSE BECAUSE OF FAILURE TO SUBMIT A TRANSLATION OF THE DESCRIPTION OR TO PAY THE FEE WITHIN THE PRESCRIBED TIME-LIMIT Effective date: 20250612 Ref country code: NO Free format text: LAPSE BECAUSE OF FAILURE TO SUBMIT A TRANSLATION OF THE DESCRIPTION OR TO PAY THE FEE WITHIN THE PRESCRIBED TIME-LIMIT Effective date: 20250512 |
|
| PG25 | Lapsed in a contracting state [announced via postgrant information from national office to epo] |
Ref country code: NL Free format text: LAPSE BECAUSE OF FAILURE TO SUBMIT A TRANSLATION OF THE DESCRIPTION OR TO PAY THE FEE WITHIN THE PRESCRIBED TIME-LIMIT Effective date: 20250212 |
|
| PG25 | Lapsed in a contracting state [announced via postgrant information from national office to epo] |
Ref country code: HR Free format text: LAPSE BECAUSE OF FAILURE TO SUBMIT A TRANSLATION OF THE DESCRIPTION OR TO PAY THE FEE WITHIN THE PRESCRIBED TIME-LIMIT Effective date: 20250212 |
|
| PG25 | Lapsed in a contracting state [announced via postgrant information from national office to epo] |
Ref country code: PT Free format text: LAPSE BECAUSE OF FAILURE TO SUBMIT A TRANSLATION OF THE DESCRIPTION OR TO PAY THE FEE WITHIN THE PRESCRIBED TIME-LIMIT Effective date: 20250612 Ref country code: LV Free format text: LAPSE BECAUSE OF FAILURE TO SUBMIT A TRANSLATION OF THE DESCRIPTION OR TO PAY THE FEE WITHIN THE PRESCRIBED TIME-LIMIT Effective date: 20250212 |
|
| PG25 | Lapsed in a contracting state [announced via postgrant information from national office to epo] |
Ref country code: GR Free format text: LAPSE BECAUSE OF FAILURE TO SUBMIT A TRANSLATION OF THE DESCRIPTION OR TO PAY THE FEE WITHIN THE PRESCRIBED TIME-LIMIT Effective date: 20250513 Ref country code: BG Free format text: LAPSE BECAUSE OF FAILURE TO SUBMIT A TRANSLATION OF THE DESCRIPTION OR TO PAY THE FEE WITHIN THE PRESCRIBED TIME-LIMIT Effective date: 20250212 |
|
| REG | Reference to a national code |
Ref country code: AT Ref legal event code: MK05 Ref document number: 1766440 Country of ref document: AT Kind code of ref document: T Effective date: 20250212 |
|
| PG25 | Lapsed in a contracting state [announced via postgrant information from national office to epo] |
Ref country code: SE Free format text: LAPSE BECAUSE OF FAILURE TO SUBMIT A TRANSLATION OF THE DESCRIPTION OR TO PAY THE FEE WITHIN THE PRESCRIBED TIME-LIMIT Effective date: 20250212 |
|
| PG25 | Lapsed in a contracting state [announced via postgrant information from national office to epo] |
Ref country code: SM Free format text: LAPSE BECAUSE OF FAILURE TO SUBMIT A TRANSLATION OF THE DESCRIPTION OR TO PAY THE FEE WITHIN THE PRESCRIBED TIME-LIMIT Effective date: 20250212 |
|
| PG25 | Lapsed in a contracting state [announced via postgrant information from national office to epo] |
Ref country code: DK Free format text: LAPSE BECAUSE OF FAILURE TO SUBMIT A TRANSLATION OF THE DESCRIPTION OR TO PAY THE FEE WITHIN THE PRESCRIBED TIME-LIMIT Effective date: 20250212 |
|
| PG25 | Lapsed in a contracting state [announced via postgrant information from national office to epo] |
Ref country code: IT Free format text: LAPSE BECAUSE OF FAILURE TO SUBMIT A TRANSLATION OF THE DESCRIPTION OR TO PAY THE FEE WITHIN THE PRESCRIBED TIME-LIMIT Effective date: 20250212 |
|
| PG25 | Lapsed in a contracting state [announced via postgrant information from national office to epo] |
Ref country code: AT Free format text: LAPSE BECAUSE OF FAILURE TO SUBMIT A TRANSLATION OF THE DESCRIPTION OR TO PAY THE FEE WITHIN THE PRESCRIBED TIME-LIMIT Effective date: 20250212 |
|
| PG25 | Lapsed in a contracting state [announced via postgrant information from national office to epo] |
Ref country code: EE Free format text: LAPSE BECAUSE OF FAILURE TO SUBMIT A TRANSLATION OF THE DESCRIPTION OR TO PAY THE FEE WITHIN THE PRESCRIBED TIME-LIMIT Effective date: 20250212 Ref country code: CZ Free format text: LAPSE BECAUSE OF FAILURE TO SUBMIT A TRANSLATION OF THE DESCRIPTION OR TO PAY THE FEE WITHIN THE PRESCRIBED TIME-LIMIT Effective date: 20250212 |
|
| PG25 | Lapsed in a contracting state [announced via postgrant information from national office to epo] |
Ref country code: RO Free format text: LAPSE BECAUSE OF FAILURE TO SUBMIT A TRANSLATION OF THE DESCRIPTION OR TO PAY THE FEE WITHIN THE PRESCRIBED TIME-LIMIT Effective date: 20250212 |
|
| REG | Reference to a national code |
Ref country code: CH Ref legal event code: H13 Free format text: ST27 STATUS EVENT CODE: U-0-0-H10-H13 (AS PROVIDED BY THE NATIONAL OFFICE) Effective date: 20251024 |
|
| PG25 | Lapsed in a contracting state [announced via postgrant information from national office to epo] |
Ref country code: SK Free format text: LAPSE BECAUSE OF FAILURE TO SUBMIT A TRANSLATION OF THE DESCRIPTION OR TO PAY THE FEE WITHIN THE PRESCRIBED TIME-LIMIT Effective date: 20250212 |
|
| PG25 | Lapsed in a contracting state [announced via postgrant information from national office to epo] |
Ref country code: LU Free format text: LAPSE BECAUSE OF NON-PAYMENT OF DUE FEES Effective date: 20250320 |