EP1203214B1 - Optical system analysis of cells - Google Patents
Optical system analysis of cells Download PDFInfo
- Publication number
- EP1203214B1 EP1203214B1 EP00952549A EP00952549A EP1203214B1 EP 1203214 B1 EP1203214 B1 EP 1203214B1 EP 00952549 A EP00952549 A EP 00952549A EP 00952549 A EP00952549 A EP 00952549A EP 1203214 B1 EP1203214 B1 EP 1203214B1
- Authority
- EP
- European Patent Office
- Prior art keywords
- cells
- cell
- image
- neurite
- protein
- Prior art date
- Legal status (The legal status is an assumption and is not a legal conclusion. Google has not performed a legal analysis and makes no representation as to the accuracy of the status listed.)
- Expired - Lifetime
Links
- 238000004458 analytical method Methods 0.000 title abstract description 46
- 230000003287 optical effect Effects 0.000 title abstract description 41
- 210000004027 cell Anatomy 0.000 claims abstract description 777
- 238000000034 method Methods 0.000 claims abstract description 193
- 150000001875 compounds Chemical class 0.000 claims abstract description 116
- 238000012216 screening Methods 0.000 claims abstract description 101
- 230000014511 neuron projection development Effects 0.000 claims abstract description 71
- 210000002569 neuron Anatomy 0.000 claims description 123
- 210000002241 neurite Anatomy 0.000 claims description 109
- 108090000623 proteins and genes Proteins 0.000 claims description 97
- 102000004169 proteins and genes Human genes 0.000 claims description 77
- 210000000805 cytoplasm Anatomy 0.000 claims description 68
- 238000012360 testing method Methods 0.000 claims description 51
- 230000001413 cellular effect Effects 0.000 claims description 43
- 238000005259 measurement Methods 0.000 claims description 38
- 210000005056 cell body Anatomy 0.000 claims description 35
- 230000010339 dilation Effects 0.000 claims description 28
- 230000004044 response Effects 0.000 claims description 27
- 239000012528 membrane Substances 0.000 claims description 25
- 210000004379 membrane Anatomy 0.000 claims description 22
- 238000003384 imaging method Methods 0.000 claims description 15
- 238000003860 storage Methods 0.000 claims description 14
- -1 βIII-tubulin Proteins 0.000 claims description 12
- 108010005939 Ciliary Neurotrophic Factor Proteins 0.000 claims description 5
- 102100031614 Ciliary neurotrophic factor Human genes 0.000 claims description 5
- 230000004568 DNA-binding Effects 0.000 claims description 4
- 231100000331 toxic Toxicity 0.000 claims description 4
- 230000002588 toxic effect Effects 0.000 claims description 4
- 210000003850 cellular structure Anatomy 0.000 claims description 3
- 230000001939 inductive effect Effects 0.000 claims description 2
- 239000002581 neurotoxin Substances 0.000 claims description 2
- 231100000618 neurotoxin Toxicity 0.000 claims description 2
- 102000008763 Neurofilament Proteins Human genes 0.000 claims 2
- 108010088373 Neurofilament Proteins Proteins 0.000 claims 2
- 101710138657 Neurotoxin Proteins 0.000 claims 1
- 239000003153 chemical reaction reagent Substances 0.000 abstract description 56
- 230000000694 effects Effects 0.000 abstract description 52
- 238000009826 distribution Methods 0.000 abstract description 46
- 210000004940 nucleus Anatomy 0.000 description 116
- 235000018102 proteins Nutrition 0.000 description 76
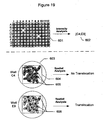
- 230000005945 translocation Effects 0.000 description 73
- 230000001086 cytosolic effect Effects 0.000 description 68
- 102000001253 Protein Kinase Human genes 0.000 description 52
- 239000005090 green fluorescent protein Substances 0.000 description 52
- 108060006633 protein kinase Proteins 0.000 description 52
- 239000000523 sample Substances 0.000 description 51
- 108010043121 Green Fluorescent Proteins Proteins 0.000 description 48
- 102000004144 Green Fluorescent Proteins Human genes 0.000 description 48
- 238000012545 processing Methods 0.000 description 40
- 238000002372 labelling Methods 0.000 description 39
- 102000040945 Transcription factor Human genes 0.000 description 37
- 108091023040 Transcription factor Proteins 0.000 description 37
- 239000003068 molecular probe Substances 0.000 description 37
- 102000029749 Microtubule Human genes 0.000 description 36
- 108091022875 Microtubule Proteins 0.000 description 36
- 230000004913 activation Effects 0.000 description 36
- 210000004688 microtubule Anatomy 0.000 description 36
- 238000003556 assay Methods 0.000 description 35
- 238000002952 image-based readout Methods 0.000 description 35
- 210000000170 cell membrane Anatomy 0.000 description 33
- 230000008569 process Effects 0.000 description 33
- 239000000758 substrate Substances 0.000 description 33
- 229940079593 drug Drugs 0.000 description 30
- 239000003814 drug Substances 0.000 description 30
- 239000000975 dye Substances 0.000 description 26
- 239000006144 Dulbecco’s modified Eagle's medium Substances 0.000 description 25
- WSFSSNUMVMOOMR-UHFFFAOYSA-N Formaldehyde Chemical compound O=C WSFSSNUMVMOOMR-UHFFFAOYSA-N 0.000 description 25
- 238000013537 high throughput screening Methods 0.000 description 25
- 239000012530 fluid Substances 0.000 description 23
- 238000001890 transfection Methods 0.000 description 22
- PRDFBSVERLRRMY-UHFFFAOYSA-N 2'-(4-ethoxyphenyl)-5-(4-methylpiperazin-1-yl)-2,5'-bibenzimidazole Chemical compound C1=CC(OCC)=CC=C1C1=NC2=CC=C(C=3NC4=CC(=CC=C4N=3)N3CCN(C)CC3)C=C2N1 PRDFBSVERLRRMY-UHFFFAOYSA-N 0.000 description 20
- 108010025020 Nerve Growth Factor Proteins 0.000 description 20
- 230000014509 gene expression Effects 0.000 description 20
- NOESYZHRGYRDHS-UHFFFAOYSA-N insulin Chemical compound N1C(=O)C(NC(=O)C(CCC(N)=O)NC(=O)C(CCC(O)=O)NC(=O)C(C(C)C)NC(=O)C(NC(=O)CN)C(C)CC)CSSCC(C(NC(CO)C(=O)NC(CC(C)C)C(=O)NC(CC=2C=CC(O)=CC=2)C(=O)NC(CCC(N)=O)C(=O)NC(CC(C)C)C(=O)NC(CCC(O)=O)C(=O)NC(CC(N)=O)C(=O)NC(CC=2C=CC(O)=CC=2)C(=O)NC(CSSCC(NC(=O)C(C(C)C)NC(=O)C(CC(C)C)NC(=O)C(CC=2C=CC(O)=CC=2)NC(=O)C(CC(C)C)NC(=O)C(C)NC(=O)C(CCC(O)=O)NC(=O)C(C(C)C)NC(=O)C(CC(C)C)NC(=O)C(CC=2NC=NC=2)NC(=O)C(CO)NC(=O)CNC2=O)C(=O)NCC(=O)NC(CCC(O)=O)C(=O)NC(CCCNC(N)=N)C(=O)NCC(=O)NC(CC=3C=CC=CC=3)C(=O)NC(CC=3C=CC=CC=3)C(=O)NC(CC=3C=CC(O)=CC=3)C(=O)NC(C(C)O)C(=O)N3C(CCC3)C(=O)NC(CCCCN)C(=O)NC(C)C(O)=O)C(=O)NC(CC(N)=O)C(O)=O)=O)NC(=O)C(C(C)CC)NC(=O)C(CO)NC(=O)C(C(C)O)NC(=O)C1CSSCC2NC(=O)C(CC(C)C)NC(=O)C(NC(=O)C(CCC(N)=O)NC(=O)C(CC(N)=O)NC(=O)C(NC(=O)C(N)CC=1C=CC=CC=1)C(C)C)CC1=CN=CN1 NOESYZHRGYRDHS-UHFFFAOYSA-N 0.000 description 20
- 230000009977 dual effect Effects 0.000 description 19
- 230000003834 intracellular effect Effects 0.000 description 19
- 239000003446 ligand Substances 0.000 description 19
- 229920002521 macromolecule Polymers 0.000 description 19
- 102000005962 receptors Human genes 0.000 description 19
- 108020003175 receptors Proteins 0.000 description 19
- CURLTUGMZLYLDI-UHFFFAOYSA-N Carbon dioxide Chemical compound O=C=O CURLTUGMZLYLDI-UHFFFAOYSA-N 0.000 description 18
- 102000015336 Nerve Growth Factor Human genes 0.000 description 18
- 229930012538 Paclitaxel Natural products 0.000 description 18
- 238000007792 addition Methods 0.000 description 18
- 238000001514 detection method Methods 0.000 description 18
- 229940053128 nerve growth factor Drugs 0.000 description 18
- 229960001592 paclitaxel Drugs 0.000 description 18
- RCINICONZNJXQF-MZXODVADSA-N taxol Chemical compound O([C@@H]1[C@@]2(C[C@@H](C(C)=C(C2(C)C)[C@H](C([C@]2(C)[C@@H](O)C[C@H]3OC[C@]3([C@H]21)OC(C)=O)=O)OC(=O)C)OC(=O)[C@H](O)[C@@H](NC(=O)C=1C=CC=CC=1)C=1C=CC=CC=1)O)C(=O)C1=CC=CC=C1 RCINICONZNJXQF-MZXODVADSA-N 0.000 description 18
- 229910002092 carbon dioxide Inorganic materials 0.000 description 17
- 210000002472 endoplasmic reticulum Anatomy 0.000 description 17
- 239000007850 fluorescent dye Substances 0.000 description 17
- 102000007469 Actins Human genes 0.000 description 16
- 108010085238 Actins Proteins 0.000 description 16
- 102000008130 Cyclic AMP-Dependent Protein Kinases Human genes 0.000 description 16
- 108010049894 Cyclic AMP-Dependent Protein Kinases Proteins 0.000 description 16
- 230000006907 apoptotic process Effects 0.000 description 16
- 210000003855 cell nucleus Anatomy 0.000 description 16
- 238000011068 loading method Methods 0.000 description 16
- 230000000877 morphologic effect Effects 0.000 description 16
- 230000026731 phosphorylation Effects 0.000 description 16
- 238000006366 phosphorylation reaction Methods 0.000 description 16
- 238000005070 sampling Methods 0.000 description 16
- 108020004414 DNA Proteins 0.000 description 15
- 102000034287 fluorescent proteins Human genes 0.000 description 15
- 108091006047 fluorescent proteins Proteins 0.000 description 15
- 230000006870 function Effects 0.000 description 15
- 102000003688 G-Protein-Coupled Receptors Human genes 0.000 description 14
- 108090000045 G-Protein-Coupled Receptors Proteins 0.000 description 14
- 102000006830 Luminescent Proteins Human genes 0.000 description 14
- 108010047357 Luminescent Proteins Proteins 0.000 description 14
- KPKZJLCSROULON-QKGLWVMZSA-N Phalloidin Chemical compound N1C(=O)[C@@H]([C@@H](O)C)NC(=O)[C@H](C)NC(=O)[C@H](C[C@@](C)(O)CO)NC(=O)[C@H](C2)NC(=O)[C@H](C)NC(=O)[C@@H]3C[C@H](O)CN3C(=O)[C@@H]1CSC1=C2C2=CC=CC=C2N1 KPKZJLCSROULON-QKGLWVMZSA-N 0.000 description 14
- 102000004243 Tubulin Human genes 0.000 description 14
- 108090000704 Tubulin Proteins 0.000 description 14
- 238000003491 array Methods 0.000 description 14
- 230000033001 locomotion Effects 0.000 description 14
- 230000002438 mitochondrial effect Effects 0.000 description 14
- 102000004190 Enzymes Human genes 0.000 description 13
- 108090000790 Enzymes Proteins 0.000 description 13
- UREBDLICKHMUKA-CXSFZGCWSA-N dexamethasone Chemical compound C1CC2=CC(=O)C=C[C@]2(C)[C@]2(F)[C@@H]1[C@@H]1C[C@@H](C)[C@@](C(=O)CO)(O)[C@@]1(C)C[C@@H]2O UREBDLICKHMUKA-CXSFZGCWSA-N 0.000 description 13
- 229960003957 dexamethasone Drugs 0.000 description 13
- 239000013604 expression vector Substances 0.000 description 13
- 230000004807 localization Effects 0.000 description 13
- 108091007433 antigens Proteins 0.000 description 12
- 102000036639 antigens Human genes 0.000 description 12
- 230000001965 increasing effect Effects 0.000 description 12
- 239000003550 marker Substances 0.000 description 12
- 239000002609 medium Substances 0.000 description 12
- 238000012552 review Methods 0.000 description 12
- 230000002123 temporal effect Effects 0.000 description 12
- 102100021794 Microtubule-associated protein 4 Human genes 0.000 description 11
- 101710093519 Microtubule-associated protein 4 Proteins 0.000 description 11
- 239000000427 antigen Substances 0.000 description 11
- 230000005284 excitation Effects 0.000 description 11
- 108020001507 fusion proteins Proteins 0.000 description 11
- 102000037865 fusion proteins Human genes 0.000 description 11
- 238000010166 immunofluorescence Methods 0.000 description 11
- 150000007523 nucleic acids Chemical group 0.000 description 11
- 239000000126 substance Substances 0.000 description 11
- 206010020880 Hypertrophy Diseases 0.000 description 10
- 102000004877 Insulin Human genes 0.000 description 10
- 108090001061 Insulin Proteins 0.000 description 10
- 239000003086 colorant Substances 0.000 description 10
- 201000010099 disease Diseases 0.000 description 10
- 208000037265 diseases, disorders, signs and symptoms Diseases 0.000 description 10
- VYFYYTLLBUKUHU-UHFFFAOYSA-N dopamine Chemical compound NCCC1=CC=C(O)C(O)=C1 VYFYYTLLBUKUHU-UHFFFAOYSA-N 0.000 description 10
- 230000007613 environmental effect Effects 0.000 description 10
- 238000002474 experimental method Methods 0.000 description 10
- 229940125396 insulin Drugs 0.000 description 10
- 230000005937 nuclear translocation Effects 0.000 description 10
- 102000039446 nucleic acids Human genes 0.000 description 10
- 108020004707 nucleic acids Proteins 0.000 description 10
- 238000010200 validation analysis Methods 0.000 description 10
- 108091005804 Peptidases Proteins 0.000 description 9
- 239000004365 Protease Substances 0.000 description 9
- 239000000470 constituent Substances 0.000 description 9
- 238000007876 drug discovery Methods 0.000 description 9
- 230000002452 interceptive effect Effects 0.000 description 9
- 239000000463 material Substances 0.000 description 9
- 238000002360 preparation method Methods 0.000 description 9
- 239000000243 solution Substances 0.000 description 9
- 230000007480 spreading Effects 0.000 description 9
- 238000003892 spreading Methods 0.000 description 9
- 108091003079 Bovine Serum Albumin Proteins 0.000 description 8
- 102000000844 Cell Surface Receptors Human genes 0.000 description 8
- 108010001857 Cell Surface Receptors Proteins 0.000 description 8
- 230000027455 binding Effects 0.000 description 8
- 230000033077 cellular process Effects 0.000 description 8
- 239000012091 fetal bovine serum Substances 0.000 description 8
- 238000002073 fluorescence micrograph Methods 0.000 description 8
- 239000003112 inhibitor Substances 0.000 description 8
- 239000010410 layer Substances 0.000 description 8
- 230000019491 signal transduction Effects 0.000 description 8
- 210000001519 tissue Anatomy 0.000 description 8
- OYPRJOBELJOOCE-UHFFFAOYSA-N Calcium Chemical compound [Ca] OYPRJOBELJOOCE-UHFFFAOYSA-N 0.000 description 7
- 229920002307 Dextran Polymers 0.000 description 7
- 102000018697 Membrane Proteins Human genes 0.000 description 7
- 108010052285 Membrane Proteins Proteins 0.000 description 7
- 108010009711 Phalloidine Proteins 0.000 description 7
- 230000003044 adaptive effect Effects 0.000 description 7
- 239000011575 calcium Substances 0.000 description 7
- 229910052791 calcium Inorganic materials 0.000 description 7
- 238000004364 calculation method Methods 0.000 description 7
- 210000004292 cytoskeleton Anatomy 0.000 description 7
- 238000013480 data collection Methods 0.000 description 7
- 238000005516 engineering process Methods 0.000 description 7
- 238000009396 hybridization Methods 0.000 description 7
- 238000005286 illumination Methods 0.000 description 7
- 238000004020 luminiscence type Methods 0.000 description 7
- 230000002132 lysosomal effect Effects 0.000 description 7
- 230000001404 mediated effect Effects 0.000 description 7
- 239000000203 mixture Substances 0.000 description 7
- 230000001537 neural effect Effects 0.000 description 7
- 238000010186 staining Methods 0.000 description 7
- 230000000638 stimulation Effects 0.000 description 7
- BHPQYMZQTOCNFJ-UHFFFAOYSA-N Calcium cation Chemical compound [Ca+2] BHPQYMZQTOCNFJ-UHFFFAOYSA-N 0.000 description 6
- 108010035532 Collagen Proteins 0.000 description 6
- 102000008186 Collagen Human genes 0.000 description 6
- IAZDPXIOMUYVGZ-UHFFFAOYSA-N Dimethylsulphoxide Chemical compound CS(C)=O IAZDPXIOMUYVGZ-UHFFFAOYSA-N 0.000 description 6
- 101000926939 Homo sapiens Glucocorticoid receptor Proteins 0.000 description 6
- 102000007568 Proto-Oncogene Proteins c-fos Human genes 0.000 description 6
- 108010071563 Proto-Oncogene Proteins c-fos Proteins 0.000 description 6
- 102100037486 Reverse transcriptase/ribonuclease H Human genes 0.000 description 6
- 238000013459 approach Methods 0.000 description 6
- 230000008901 benefit Effects 0.000 description 6
- 239000001506 calcium phosphate Substances 0.000 description 6
- 229910000389 calcium phosphate Inorganic materials 0.000 description 6
- 235000011010 calcium phosphates Nutrition 0.000 description 6
- 238000004113 cell culture Methods 0.000 description 6
- 239000003610 charcoal Substances 0.000 description 6
- 238000004163 cytometry Methods 0.000 description 6
- 239000012634 fragment Substances 0.000 description 6
- 230000012010 growth Effects 0.000 description 6
- 230000005764 inhibitory process Effects 0.000 description 6
- 150000002611 lead compounds Chemical class 0.000 description 6
- 230000003562 morphometric effect Effects 0.000 description 6
- 238000013425 morphometry Methods 0.000 description 6
- 210000003463 organelle Anatomy 0.000 description 6
- 239000002244 precipitate Substances 0.000 description 6
- 230000001105 regulatory effect Effects 0.000 description 6
- 238000012546 transfer Methods 0.000 description 6
- QORWJWZARLRLPR-UHFFFAOYSA-H tricalcium bis(phosphate) Chemical compound [Ca+2].[Ca+2].[Ca+2].[O-]P([O-])([O-])=O.[O-]P([O-])([O-])=O QORWJWZARLRLPR-UHFFFAOYSA-H 0.000 description 6
- 108091026890 Coding region Proteins 0.000 description 5
- 108010038512 Platelet-Derived Growth Factor Proteins 0.000 description 5
- 102000010780 Platelet-Derived Growth Factor Human genes 0.000 description 5
- 102000011195 Profilin Human genes 0.000 description 5
- 108050001408 Profilin Proteins 0.000 description 5
- 206010060862 Prostate cancer Diseases 0.000 description 5
- 208000036815 beta tubulin Diseases 0.000 description 5
- 230000008827 biological function Effects 0.000 description 5
- 229920001436 collagen Polymers 0.000 description 5
- 229960003638 dopamine Drugs 0.000 description 5
- GNBHRKFJIUUOQI-UHFFFAOYSA-N fluorescein Chemical compound O1C(=O)C2=CC=CC=C2C21C1=CC=C(O)C=C1OC1=CC(O)=CC=C21 GNBHRKFJIUUOQI-UHFFFAOYSA-N 0.000 description 5
- 230000003993 interaction Effects 0.000 description 5
- 238000005457 optimization Methods 0.000 description 5
- 108010068338 p38 Mitogen-Activated Protein Kinases Proteins 0.000 description 5
- 102000002574 p38 Mitogen-Activated Protein Kinases Human genes 0.000 description 5
- 230000037361 pathway Effects 0.000 description 5
- 230000006461 physiological response Effects 0.000 description 5
- 201000001514 prostate carcinoma Diseases 0.000 description 5
- 230000033300 receptor internalization Effects 0.000 description 5
- 230000011664 signaling Effects 0.000 description 5
- 238000013518 transcription Methods 0.000 description 5
- 230000032258 transport Effects 0.000 description 5
- FWBHETKCLVMNFS-UHFFFAOYSA-N 4',6-Diamino-2-phenylindol Chemical compound C1=CC(C(=N)N)=CC=C1C1=CC2=CC=C(C(N)=N)C=C2N1 FWBHETKCLVMNFS-UHFFFAOYSA-N 0.000 description 4
- 108010014303 DNA-directed DNA polymerase Proteins 0.000 description 4
- 102000016928 DNA-directed DNA polymerase Human genes 0.000 description 4
- 108090000626 DNA-directed RNA polymerases Proteins 0.000 description 4
- 102000004163 DNA-directed RNA polymerases Human genes 0.000 description 4
- 108010033040 Histones Proteins 0.000 description 4
- 102000006947 Histones Human genes 0.000 description 4
- 102000000589 Interleukin-1 Human genes 0.000 description 4
- 108010002352 Interleukin-1 Proteins 0.000 description 4
- 108090001090 Lectins Proteins 0.000 description 4
- 102000004856 Lectins Human genes 0.000 description 4
- 239000000232 Lipid Bilayer Substances 0.000 description 4
- 206010028980 Neoplasm Diseases 0.000 description 4
- 108091028043 Nucleic acid sequence Proteins 0.000 description 4
- 101800000891 Phallacidin Proteins 0.000 description 4
- 108010076504 Protein Sorting Signals Proteins 0.000 description 4
- 108010085012 Steroid Receptors Proteins 0.000 description 4
- 102000007451 Steroid Receptors Human genes 0.000 description 4
- 230000004075 alteration Effects 0.000 description 4
- 102000000072 beta-Arrestins Human genes 0.000 description 4
- 108010080367 beta-Arrestins Proteins 0.000 description 4
- 238000000423 cell based assay Methods 0.000 description 4
- 230000009087 cell motility Effects 0.000 description 4
- 230000036755 cellular response Effects 0.000 description 4
- 239000003795 chemical substances by application Substances 0.000 description 4
- 238000000975 co-precipitation Methods 0.000 description 4
- 230000002596 correlated effect Effects 0.000 description 4
- SDZRWUKZFQQKKV-JHADDHBZSA-N cytochalasin D Chemical compound C([C@H]1[C@@H]2[C@@H](C([C@@H](O)[C@H]\3[C@]2([C@@H](/C=C/[C@@](C)(O)C(=O)[C@@H](C)C/C=C/3)OC(C)=O)C(=O)N1)=C)C)C1=CC=CC=C1 SDZRWUKZFQQKKV-JHADDHBZSA-N 0.000 description 4
- 230000003436 cytoskeletal effect Effects 0.000 description 4
- 238000007405 data analysis Methods 0.000 description 4
- 238000011161 development Methods 0.000 description 4
- 230000018109 developmental process Effects 0.000 description 4
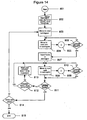
- 238000010586 diagram Methods 0.000 description 4
- 238000007877 drug screening Methods 0.000 description 4
- 238000000295 emission spectrum Methods 0.000 description 4
- 238000000695 excitation spectrum Methods 0.000 description 4
- 239000000834 fixative Substances 0.000 description 4
- 238000001215 fluorescent labelling Methods 0.000 description 4
- 238000011534 incubation Methods 0.000 description 4
- 230000006698 induction Effects 0.000 description 4
- 150000002500 ions Chemical class 0.000 description 4
- 239000002523 lectin Substances 0.000 description 4
- 239000002502 liposome Substances 0.000 description 4
- 210000003470 mitochondria Anatomy 0.000 description 4
- KUBDTFZQCYLLGC-VZORSVKHSA-N phallacidin Chemical compound N1C(=O)[C@@H]([C@@H](O)C(O)=O)NC(=O)[C@H](C(C)C)NC(=O)[C@H](C[C@@](C)(O)CO)NC(=O)[C@H](C2)NC(=O)[C@H](C)NC(=O)[C@@H]3C[C@H](O)CN3C(=O)[C@@H]1CSC1=C2C2=CC=CC=C2N1 KUBDTFZQCYLLGC-VZORSVKHSA-N 0.000 description 4
- 239000013612 plasmid Substances 0.000 description 4
- 238000006116 polymerization reaction Methods 0.000 description 4
- 230000002441 reversible effect Effects 0.000 description 4
- 230000011218 segmentation Effects 0.000 description 4
- 238000010561 standard procedure Methods 0.000 description 4
- 150000003431 steroids Chemical class 0.000 description 4
- 230000035897 transcription Effects 0.000 description 4
- 108091032973 (ribonucleotides)n+m Proteins 0.000 description 3
- 241000283707 Capra Species 0.000 description 3
- 238000001712 DNA sequencing Methods 0.000 description 3
- 239000012981 Hank's balanced salt solution Substances 0.000 description 3
- 101000979001 Homo sapiens Methionine aminopeptidase 2 Proteins 0.000 description 3
- 101000969087 Homo sapiens Microtubule-associated protein 2 Proteins 0.000 description 3
- 108010055717 JNK Mitogen-Activated Protein Kinases Proteins 0.000 description 3
- 102100023174 Methionine aminopeptidase 2 Human genes 0.000 description 3
- KYRVNWMVYQXFEU-UHFFFAOYSA-N Nocodazole Chemical compound C1=C2NC(NC(=O)OC)=NC2=CC=C1C(=O)C1=CC=CS1 KYRVNWMVYQXFEU-UHFFFAOYSA-N 0.000 description 3
- 108091034117 Oligonucleotide Proteins 0.000 description 3
- 241000283973 Oryctolagus cuniculus Species 0.000 description 3
- 102000035195 Peptidases Human genes 0.000 description 3
- 108010029485 Protein Isoforms Proteins 0.000 description 3
- 102000001708 Protein Isoforms Human genes 0.000 description 3
- 108060008682 Tumor Necrosis Factor Proteins 0.000 description 3
- 230000009471 action Effects 0.000 description 3
- 230000001464 adherent effect Effects 0.000 description 3
- 239000003242 anti bacterial agent Substances 0.000 description 3
- 229940088710 antibiotic agent Drugs 0.000 description 3
- 238000003782 apoptosis assay Methods 0.000 description 3
- 210000001130 astrocyte Anatomy 0.000 description 3
- 210000003050 axon Anatomy 0.000 description 3
- 230000031018 biological processes and functions Effects 0.000 description 3
- 210000004556 brain Anatomy 0.000 description 3
- 201000011510 cancer Diseases 0.000 description 3
- 230000003197 catalytic effect Effects 0.000 description 3
- 230000022131 cell cycle Effects 0.000 description 3
- 238000004624 confocal microscopy Methods 0.000 description 3
- 230000001276 controlling effect Effects 0.000 description 3
- 230000000875 corresponding effect Effects 0.000 description 3
- 230000007423 decrease Effects 0.000 description 3
- 230000001419 dependent effect Effects 0.000 description 3
- 235000014113 dietary fatty acids Nutrition 0.000 description 3
- 230000001747 exhibiting effect Effects 0.000 description 3
- 239000013613 expression plasmid Substances 0.000 description 3
- 229930195729 fatty acid Natural products 0.000 description 3
- 239000000194 fatty acid Substances 0.000 description 3
- 150000004665 fatty acids Chemical class 0.000 description 3
- 230000004927 fusion Effects 0.000 description 3
- 230000002209 hydrophobic effect Effects 0.000 description 3
- 238000010191 image analysis Methods 0.000 description 3
- 238000012933 kinetic analysis Methods 0.000 description 3
- 210000003712 lysosome Anatomy 0.000 description 3
- 230000001868 lysosomic effect Effects 0.000 description 3
- 210000000274 microglia Anatomy 0.000 description 3
- 238000000386 microscopy Methods 0.000 description 3
- 230000008880 microtubule cytoskeleton organization Effects 0.000 description 3
- 238000012544 monitoring process Methods 0.000 description 3
- 229950006344 nocodazole Drugs 0.000 description 3
- 210000004248 oligodendroglia Anatomy 0.000 description 3
- 230000029279 positive regulation of transcription, DNA-dependent Effects 0.000 description 3
- 235000004252 protein component Nutrition 0.000 description 3
- 238000011002 quantification Methods 0.000 description 3
- 230000002829 reductive effect Effects 0.000 description 3
- 238000011160 research Methods 0.000 description 3
- 230000000284 resting effect Effects 0.000 description 3
- PYWVYCXTNDRMGF-UHFFFAOYSA-N rhodamine B Chemical compound [Cl-].C=12C=CC(=[N+](CC)CC)C=C2OC2=CC(N(CC)CC)=CC=C2C=1C1=CC=CC=C1C(O)=O PYWVYCXTNDRMGF-UHFFFAOYSA-N 0.000 description 3
- 230000003595 spectral effect Effects 0.000 description 3
- 238000004448 titration Methods 0.000 description 3
- 231100000419 toxicity Toxicity 0.000 description 3
- 230000001988 toxicity Effects 0.000 description 3
- 102000003390 tumor necrosis factor Human genes 0.000 description 3
- YDNKGFDKKRUKPY-JHOUSYSJSA-N C16 ceramide Natural products CCCCCCCCCCCCCCCC(=O)N[C@@H](CO)[C@H](O)C=CCCCCCCCCCCCCC YDNKGFDKKRUKPY-JHOUSYSJSA-N 0.000 description 2
- 108010062580 Concanavalin A Proteins 0.000 description 2
- 102100030497 Cytochrome c Human genes 0.000 description 2
- 102000000634 Cytochrome c oxidase subunit IV Human genes 0.000 description 2
- 108090000365 Cytochrome-c oxidases Proteins 0.000 description 2
- 108010075031 Cytochromes c Proteins 0.000 description 2
- 102000010831 Cytoskeletal Proteins Human genes 0.000 description 2
- 108010037414 Cytoskeletal Proteins Proteins 0.000 description 2
- 241000196324 Embryophyta Species 0.000 description 2
- QTANTQQOYSUMLC-UHFFFAOYSA-O Ethidium cation Chemical class C12=CC(N)=CC=C2C2=CC=C(N)C=C2[N+](CC)=C1C1=CC=CC=C1 QTANTQQOYSUMLC-UHFFFAOYSA-O 0.000 description 2
- OHCQJHSOBUTRHG-KGGHGJDLSA-N FORSKOLIN Chemical compound O=C([C@@]12O)C[C@](C)(C=C)O[C@]1(C)[C@@H](OC(=O)C)[C@@H](O)[C@@H]1[C@]2(C)[C@@H](O)CCC1(C)C OHCQJHSOBUTRHG-KGGHGJDLSA-N 0.000 description 2
- OZLGRUXZXMRXGP-UHFFFAOYSA-N Fluo-3 Chemical compound CC1=CC=C(N(CC(O)=O)CC(O)=O)C(OCCOC=2C(=CC=C(C=2)C2=C3C=C(Cl)C(=O)C=C3OC3=CC(O)=C(Cl)C=C32)N(CC(O)=O)CC(O)=O)=C1 OZLGRUXZXMRXGP-UHFFFAOYSA-N 0.000 description 2
- 108091006027 G proteins Proteins 0.000 description 2
- 102000030782 GTP binding Human genes 0.000 description 2
- 108091000058 GTP-Binding Proteins 0.000 description 2
- 102000003638 Glucose-6-Phosphatase Human genes 0.000 description 2
- 108010086800 Glucose-6-Phosphatase Proteins 0.000 description 2
- NTYJJOPFIAHURM-UHFFFAOYSA-N Histamine Chemical compound NCCC1=CN=CN1 NTYJJOPFIAHURM-UHFFFAOYSA-N 0.000 description 2
- 101001092197 Homo sapiens RNA binding protein fox-1 homolog 3 Proteins 0.000 description 2
- 102000004286 Hydroxymethylglutaryl CoA Reductases Human genes 0.000 description 2
- 108090000895 Hydroxymethylglutaryl CoA Reductases Proteins 0.000 description 2
- 108010031792 IGF Type 2 Receptor Proteins 0.000 description 2
- 102000011782 Keratins Human genes 0.000 description 2
- 108010076876 Keratins Proteins 0.000 description 2
- 108010047294 Lamins Proteins 0.000 description 2
- 102000006835 Lamins Human genes 0.000 description 2
- 102000019218 Mannose-6-phosphate receptors Human genes 0.000 description 2
- 206010027476 Metastases Diseases 0.000 description 2
- 102000009664 Microtubule-Associated Proteins Human genes 0.000 description 2
- 108020005196 Mitochondrial DNA Proteins 0.000 description 2
- 102000004232 Mitogen-Activated Protein Kinase Kinases Human genes 0.000 description 2
- 108090000744 Mitogen-Activated Protein Kinase Kinases Proteins 0.000 description 2
- 108060008487 Myosin Proteins 0.000 description 2
- 102000003505 Myosin Human genes 0.000 description 2
- OVRNDRQMDRJTHS-UHFFFAOYSA-N N-acelyl-D-glucosamine Natural products CC(=O)NC1C(O)OC(CO)C(O)C1O OVRNDRQMDRJTHS-UHFFFAOYSA-N 0.000 description 2
- OVRNDRQMDRJTHS-FMDGEEDCSA-N N-acetyl-beta-D-glucosamine Chemical compound CC(=O)N[C@H]1[C@H](O)O[C@H](CO)[C@@H](O)[C@@H]1O OVRNDRQMDRJTHS-FMDGEEDCSA-N 0.000 description 2
- MBLBDJOUHNCFQT-LXGUWJNJSA-N N-acetylglucosamine Natural products CC(=O)N[C@@H](C=O)[C@@H](O)[C@H](O)[C@H](O)CO MBLBDJOUHNCFQT-LXGUWJNJSA-N 0.000 description 2
- CRJGESKKUOMBCT-VQTJNVASSA-N N-acetylsphinganine Chemical compound CCCCCCCCCCCCCCC[C@@H](O)[C@H](CO)NC(C)=O CRJGESKKUOMBCT-VQTJNVASSA-N 0.000 description 2
- 102000007072 Nerve Growth Factors Human genes 0.000 description 2
- 102000019040 Nuclear Antigens Human genes 0.000 description 2
- 108010051791 Nuclear Antigens Proteins 0.000 description 2
- 102000007999 Nuclear Proteins Human genes 0.000 description 2
- 108010089610 Nuclear Proteins Proteins 0.000 description 2
- 101710163270 Nuclease Proteins 0.000 description 2
- 102000016979 Other receptors Human genes 0.000 description 2
- 108010022678 Phosphofructokinase-2 Proteins 0.000 description 2
- 102000012288 Phosphopyruvate Hydratase Human genes 0.000 description 2
- 108010022181 Phosphopyruvate Hydratase Proteins 0.000 description 2
- 102000004861 Phosphoric Diester Hydrolases Human genes 0.000 description 2
- 108090001050 Phosphoric Diester Hydrolases Proteins 0.000 description 2
- 108091000080 Phosphotransferase Proteins 0.000 description 2
- RJKFOVLPORLFTN-LEKSSAKUSA-N Progesterone Chemical compound C1CC2=CC(=O)CC[C@]2(C)[C@@H]2[C@@H]1[C@@H]1CC[C@H](C(=O)C)[C@@]1(C)CC2 RJKFOVLPORLFTN-LEKSSAKUSA-N 0.000 description 2
- 102000006270 Proton Pumps Human genes 0.000 description 2
- 108010083204 Proton Pumps Proteins 0.000 description 2
- 102100035530 RNA binding protein fox-1 homolog 3 Human genes 0.000 description 2
- 108700008625 Reporter Genes Proteins 0.000 description 2
- 102100027609 Rho-related GTP-binding protein RhoD Human genes 0.000 description 2
- 102000019259 Succinate Dehydrogenase Human genes 0.000 description 2
- 108010012901 Succinate Dehydrogenase Proteins 0.000 description 2
- MZZINWWGSYUHGU-UHFFFAOYSA-J ToTo-1 Chemical compound [I-].[I-].[I-].[I-].C12=CC=CC=C2C(C=C2N(C3=CC=CC=C3S2)C)=CC=[N+]1CCC[N+](C)(C)CCC[N+](C)(C)CCC[N+](C1=CC=CC=C11)=CC=C1C=C1N(C)C2=CC=CC=C2S1 MZZINWWGSYUHGU-UHFFFAOYSA-J 0.000 description 2
- 229920004890 Triton X-100 Polymers 0.000 description 2
- 239000013504 Triton X-100 Substances 0.000 description 2
- JXLYSJRDGCGARV-WWYNWVTFSA-N Vinblastine Natural products O=C(O[C@H]1[C@](O)(C(=O)OC)[C@@H]2N(C)c3c(cc(c(OC)c3)[C@]3(C(=O)OC)c4[nH]c5c(c4CCN4C[C@](O)(CC)C[C@H](C3)C4)cccc5)[C@@]32[C@H]2[C@@]1(CC)C=CCN2CC3)C JXLYSJRDGCGARV-WWYNWVTFSA-N 0.000 description 2
- GRRMZXFOOGQMFA-UHFFFAOYSA-J YoYo-1 Chemical compound [I-].[I-].[I-].[I-].C12=CC=CC=C2C(C=C2N(C3=CC=CC=C3O2)C)=CC=[N+]1CCC[N+](C)(C)CCC[N+](C)(C)CCC[N+](C1=CC=CC=C11)=CC=C1C=C1N(C)C2=CC=CC=C2O1 GRRMZXFOOGQMFA-UHFFFAOYSA-J 0.000 description 2
- MMWCIQZXVOZEGG-HOZKJCLWSA-N [(1S,2R,3S,4S,5R,6S)-2,3,5-trihydroxy-4,6-diphosphonooxycyclohexyl] dihydrogen phosphate Chemical compound O[C@H]1[C@@H](O)[C@H](OP(O)(O)=O)[C@@H](OP(O)(O)=O)[C@H](O)[C@H]1OP(O)(O)=O MMWCIQZXVOZEGG-HOZKJCLWSA-N 0.000 description 2
- ZSLZBFCDCINBPY-ZSJPKINUSA-N acetyl-CoA Chemical compound O[C@@H]1[C@H](OP(O)(O)=O)[C@@H](COP(O)(=O)OP(O)(=O)OCC(C)(C)[C@@H](O)C(=O)NCCC(=O)NCCSC(=O)C)O[C@H]1N1C2=NC=NC(N)=C2N=C1 ZSLZBFCDCINBPY-ZSJPKINUSA-N 0.000 description 2
- 239000000980 acid dye Substances 0.000 description 2
- 239000012190 activator Substances 0.000 description 2
- 230000002776 aggregation Effects 0.000 description 2
- 238000004220 aggregation Methods 0.000 description 2
- 239000005557 antagonist Substances 0.000 description 2
- 230000033228 biological regulation Effects 0.000 description 2
- 108091005948 blue fluorescent proteins Proteins 0.000 description 2
- 210000004958 brain cell Anatomy 0.000 description 2
- 239000000298 carbocyanine Substances 0.000 description 2
- 230000004107 carbohydrate anabolism Effects 0.000 description 2
- 230000004106 carbohydrate catabolism Effects 0.000 description 2
- 230000021164 cell adhesion Effects 0.000 description 2
- 230000008568 cell cell communication Effects 0.000 description 2
- 230000032823 cell division Effects 0.000 description 2
- 239000013553 cell monolayer Substances 0.000 description 2
- 229940106189 ceramide Drugs 0.000 description 2
- ZVEQCJWYRWKARO-UHFFFAOYSA-N ceramide Natural products CCCCCCCCCCCCCCC(O)C(=O)NC(CO)C(O)C=CCCC=C(C)CCCCCCCCC ZVEQCJWYRWKARO-UHFFFAOYSA-N 0.000 description 2
- 230000008859 change Effects 0.000 description 2
- 150000001840 cholesterol esters Chemical class 0.000 description 2
- 239000002299 complementary DNA Substances 0.000 description 2
- 238000010226 confocal imaging Methods 0.000 description 2
- 230000008878 coupling Effects 0.000 description 2
- 238000010168 coupling process Methods 0.000 description 2
- 238000005859 coupling reaction Methods 0.000 description 2
- 238000012303 cytoplasmic staining Methods 0.000 description 2
- 238000013500 data storage Methods 0.000 description 2
- 230000003247 decreasing effect Effects 0.000 description 2
- 230000003413 degradative effect Effects 0.000 description 2
- 210000001787 dendrite Anatomy 0.000 description 2
- 238000010790 dilution Methods 0.000 description 2
- 239000012895 dilution Substances 0.000 description 2
- BFMYDTVEBKDAKJ-UHFFFAOYSA-L disodium;(2',7'-dibromo-3',6'-dioxido-3-oxospiro[2-benzofuran-1,9'-xanthene]-4'-yl)mercury;hydrate Chemical compound O.[Na+].[Na+].O1C(=O)C2=CC=CC=C2C21C1=CC(Br)=C([O-])C([Hg])=C1OC1=C2C=C(Br)C([O-])=C1 BFMYDTVEBKDAKJ-UHFFFAOYSA-L 0.000 description 2
- 238000010494 dissociation reaction Methods 0.000 description 2
- 230000005593 dissociations Effects 0.000 description 2
- 229940000406 drug candidate Drugs 0.000 description 2
- 238000004520 electroporation Methods 0.000 description 2
- 230000003628 erosive effect Effects 0.000 description 2
- 238000010931 ester hydrolysis Methods 0.000 description 2
- 229960005542 ethidium bromide Drugs 0.000 description 2
- ZMMJGEGLRURXTF-UHFFFAOYSA-N ethidium bromide Chemical compound [Br-].C12=CC(N)=CC=C2C2=CC=C(N)C=C2[N+](CC)=C1C1=CC=CC=C1 ZMMJGEGLRURXTF-UHFFFAOYSA-N 0.000 description 2
- 238000000605 extraction Methods 0.000 description 2
- 210000002950 fibroblast Anatomy 0.000 description 2
- 239000012737 fresh medium Substances 0.000 description 2
- 230000023266 generation of precursor metabolites and energy Effects 0.000 description 2
- 238000011331 genomic analysis Methods 0.000 description 2
- 230000002414 glycolytic effect Effects 0.000 description 2
- 210000000020 growth cone Anatomy 0.000 description 2
- 239000001963 growth medium Substances 0.000 description 2
- 230000001969 hypertrophic effect Effects 0.000 description 2
- 238000000338 in vitro Methods 0.000 description 2
- 238000001727 in vivo Methods 0.000 description 2
- 230000002401 inhibitory effect Effects 0.000 description 2
- 238000002955 isolation Methods 0.000 description 2
- 238000005304 joining Methods 0.000 description 2
- 210000005053 lamin Anatomy 0.000 description 2
- 150000002632 lipids Chemical class 0.000 description 2
- 210000004962 mammalian cell Anatomy 0.000 description 2
- 238000004519 manufacturing process Methods 0.000 description 2
- 230000007246 mechanism Effects 0.000 description 2
- 108020004999 messenger RNA Proteins 0.000 description 2
- 239000002207 metabolite Substances 0.000 description 2
- 230000009401 metastasis Effects 0.000 description 2
- IKEOZQLIVHGQLJ-UHFFFAOYSA-M mitoTracker Red Chemical compound [Cl-].C1=CC(CCl)=CC=C1C(C1=CC=2CCCN3CCCC(C=23)=C1O1)=C2C1=C(CCC1)C3=[N+]1CCCC3=C2 IKEOZQLIVHGQLJ-UHFFFAOYSA-M 0.000 description 2
- 230000004899 motility Effects 0.000 description 2
- 210000000107 myocyte Anatomy 0.000 description 2
- 229950006780 n-acetylglucosamine Drugs 0.000 description 2
- 210000005044 neurofilament Anatomy 0.000 description 2
- 201000001119 neuropathy Diseases 0.000 description 2
- 230000007823 neuropathy Effects 0.000 description 2
- 239000002858 neurotransmitter agent Substances 0.000 description 2
- 239000003900 neurotrophic factor Substances 0.000 description 2
- VVGIYYKRAMHVLU-UHFFFAOYSA-N newbouldiamide Natural products CCCCCCCCCCCCCCCCCCCC(O)C(O)C(O)C(CO)NC(=O)CCCCCCCCCCCCCCCCC VVGIYYKRAMHVLU-UHFFFAOYSA-N 0.000 description 2
- 238000007899 nucleic acid hybridization Methods 0.000 description 2
- 230000008520 organization Effects 0.000 description 2
- 230000002018 overexpression Effects 0.000 description 2
- 230000010627 oxidative phosphorylation Effects 0.000 description 2
- 208000033808 peripheral neuropathy Diseases 0.000 description 2
- 239000002935 phosphatidylinositol 3 kinase inhibitor Substances 0.000 description 2
- 150000003904 phospholipids Chemical class 0.000 description 2
- 102000020233 phosphotransferase Human genes 0.000 description 2
- 230000035790 physiological processes and functions Effects 0.000 description 2
- INAAIJLSXJJHOZ-UHFFFAOYSA-N pibenzimol Chemical compound C1CN(C)CCN1C1=CC=C(N=C(N2)C=3C=C4NC(=NC4=CC=3)C=3C=CC(O)=CC=3)C2=C1 INAAIJLSXJJHOZ-UHFFFAOYSA-N 0.000 description 2
- 229920003023 plastic Polymers 0.000 description 2
- 239000004033 plastic Substances 0.000 description 2
- 125000002924 primary amino group Chemical group [H]N([H])* 0.000 description 2
- 230000005522 programmed cell death Effects 0.000 description 2
- XJMOSONTPMZWPB-UHFFFAOYSA-M propidium iodide Chemical compound [I-].[I-].C12=CC(N)=CC=C2C2=CC=C(N)C=C2[N+](CCC[N+](C)(CC)CC)=C1C1=CC=CC=C1 XJMOSONTPMZWPB-UHFFFAOYSA-M 0.000 description 2
- 230000004952 protein activity Effects 0.000 description 2
- 238000000575 proteomic method Methods 0.000 description 2
- RXWNCPJZOCPEPQ-NVWDDTSBSA-N puromycin Chemical compound C1=CC(OC)=CC=C1C[C@H](N)C(=O)N[C@H]1[C@@H](O)[C@H](N2C3=NC=NC(=C3N=C2)N(C)C)O[C@@H]1CO RXWNCPJZOCPEPQ-NVWDDTSBSA-N 0.000 description 2
- 239000000985 reactive dye Substances 0.000 description 2
- 230000037425 regulation of transcription Effects 0.000 description 2
- 108091006091 regulatory enzymes Proteins 0.000 description 2
- 230000008521 reorganization Effects 0.000 description 2
- 210000004739 secretory vesicle Anatomy 0.000 description 2
- 230000035945 sensitivity Effects 0.000 description 2
- QZAYGJVTTNCVMB-UHFFFAOYSA-N serotonin Chemical compound C1=C(O)C=C2C(CCN)=CNC2=C1 QZAYGJVTTNCVMB-UHFFFAOYSA-N 0.000 description 2
- 239000012679 serum free medium Substances 0.000 description 2
- 150000003384 small molecules Chemical class 0.000 description 2
- 229960005322 streptomycin Drugs 0.000 description 2
- 108020001568 subdomains Proteins 0.000 description 2
- 230000001360 synchronised effect Effects 0.000 description 2
- WGTODYJZXSJIAG-UHFFFAOYSA-N tetramethylrhodamine chloride Chemical compound [Cl-].C=12C=CC(N(C)C)=CC2=[O+]C2=CC(N(C)C)=CC=C2C=1C1=CC=CC=C1C(O)=O WGTODYJZXSJIAG-UHFFFAOYSA-N 0.000 description 2
- ANRHNWWPFJCPAZ-UHFFFAOYSA-M thionine Chemical class [Cl-].C1=CC(N)=CC2=[S+]C3=CC(N)=CC=C3N=C21 ANRHNWWPFJCPAZ-UHFFFAOYSA-M 0.000 description 2
- 238000002179 total cell area Methods 0.000 description 2
- 108091006106 transcriptional activators Proteins 0.000 description 2
- 230000001052 transient effect Effects 0.000 description 2
- 239000013598 vector Substances 0.000 description 2
- 229960003048 vinblastine Drugs 0.000 description 2
- JXLYSJRDGCGARV-XQKSVPLYSA-N vincaleukoblastine Chemical compound C([C@@H](C[C@]1(C(=O)OC)C=2C(=CC3=C([C@]45[C@H]([C@@]([C@H](OC(C)=O)[C@]6(CC)C=CCN([C@H]56)CC4)(O)C(=O)OC)N3C)C=2)OC)C[C@@](C2)(O)CC)N2CCC2=C1NC1=CC=CC=C21 JXLYSJRDGCGARV-XQKSVPLYSA-N 0.000 description 2
- 229960004528 vincristine Drugs 0.000 description 2
- OGWKCGZFUXNPDA-XQKSVPLYSA-N vincristine Chemical compound C([N@]1C[C@@H](C[C@]2(C(=O)OC)C=3C(=CC4=C([C@]56[C@H]([C@@]([C@H](OC(C)=O)[C@]7(CC)C=CCN([C@H]67)CC5)(O)C(=O)OC)N4C=O)C=3)OC)C[C@@](C1)(O)CC)CC1=C2NC2=CC=CC=C12 OGWKCGZFUXNPDA-XQKSVPLYSA-N 0.000 description 2
- OGWKCGZFUXNPDA-UHFFFAOYSA-N vincristine Natural products C1C(CC)(O)CC(CC2(C(=O)OC)C=3C(=CC4=C(C56C(C(C(OC(C)=O)C7(CC)C=CCN(C67)CC5)(O)C(=O)OC)N4C=O)C=3)OC)CN1CCC1=C2NC2=CC=CC=C12 OGWKCGZFUXNPDA-UHFFFAOYSA-N 0.000 description 2
- 238000012800 visualization Methods 0.000 description 2
- AADVCYNFEREWOS-UHFFFAOYSA-N (+)-DDM Natural products C=CC=CC(C)C(OC(N)=O)C(C)C(O)C(C)CC(C)=CC(C)C(O)C(C)C=CC(O)CC1OC(=O)C(C)C(O)C1C AADVCYNFEREWOS-UHFFFAOYSA-N 0.000 description 1
- YKJYKKNCCRKFSL-RDBSUJKOSA-N (-)-anisomycin Chemical compound C1=CC(OC)=CC=C1C[C@@H]1[C@H](OC(C)=O)[C@@H](O)CN1 YKJYKKNCCRKFSL-RDBSUJKOSA-N 0.000 description 1
- CHADEQDQBURGHL-UHFFFAOYSA-N (6'-acetyloxy-3-oxospiro[2-benzofuran-1,9'-xanthene]-3'-yl) acetate Chemical compound O1C(=O)C2=CC=CC=C2C21C1=CC=C(OC(C)=O)C=C1OC1=CC(OC(=O)C)=CC=C21 CHADEQDQBURGHL-UHFFFAOYSA-N 0.000 description 1
- FYNNIUVBDKICAX-UHFFFAOYSA-M 1,1',3,3'-tetraethyl-5,5',6,6'-tetrachloroimidacarbocyanine iodide Chemical compound [I-].CCN1C2=CC(Cl)=C(Cl)C=C2N(CC)C1=CC=CC1=[N+](CC)C2=CC(Cl)=C(Cl)C=C2N1CC FYNNIUVBDKICAX-UHFFFAOYSA-M 0.000 description 1
- PIMKEUIWMFJVNB-UHFFFAOYSA-N 10-pyren-1-yldecanoic acid Chemical compound C1=C2C(CCCCCCCCCC(=O)O)=CC=C(C=C3)C2=C2C3=CC=CC2=C1 PIMKEUIWMFJVNB-UHFFFAOYSA-N 0.000 description 1
- BTGGHNHGPURMEO-UHFFFAOYSA-N 2-chloro-3,5-dimethylpyrazine Chemical compound CC1=CN=C(Cl)C(C)=N1 BTGGHNHGPURMEO-UHFFFAOYSA-N 0.000 description 1
- BFSVOASYOCHEOV-UHFFFAOYSA-N 2-diethylaminoethanol Chemical compound CCN(CC)CCO BFSVOASYOCHEOV-UHFFFAOYSA-N 0.000 description 1
- NKDFYOWSKOHCCO-YPVLXUMRSA-N 20-hydroxyecdysone Chemical compound C1[C@@H](O)[C@@H](O)C[C@]2(C)[C@@H](CC[C@@]3([C@@H]([C@@](C)(O)[C@H](O)CCC(C)(O)C)CC[C@]33O)C)C3=CC(=O)[C@@H]21 NKDFYOWSKOHCCO-YPVLXUMRSA-N 0.000 description 1
- OALHHIHQOFIMEF-UHFFFAOYSA-N 3',6'-dihydroxy-2',4',5',7'-tetraiodo-3h-spiro[2-benzofuran-1,9'-xanthene]-3-one Chemical compound O1C(=O)C2=CC=CC=C2C21C1=CC(I)=C(O)C(I)=C1OC1=C(I)C(O)=C(I)C=C21 OALHHIHQOFIMEF-UHFFFAOYSA-N 0.000 description 1
- GZFVOFMKXXTWQE-UHFFFAOYSA-N 3,8-diazido-5-ethyl-6-phenylphenanthridin-5-ium Chemical compound C12=CC(N=[N+]=[N-])=CC=C2C2=CC=C(N=[N+]=[N-])C=C2[N+](CC)=C1C1=CC=CC=C1 GZFVOFMKXXTWQE-UHFFFAOYSA-N 0.000 description 1
- MJKVTPMWOKAVMS-UHFFFAOYSA-N 3-hydroxy-1-benzopyran-2-one Chemical class C1=CC=C2OC(=O)C(O)=CC2=C1 MJKVTPMWOKAVMS-UHFFFAOYSA-N 0.000 description 1
- UWAUSMGZOHPBJJ-UHFFFAOYSA-N 4-nitro-1,2,3-benzoxadiazole Chemical compound [O-][N+](=O)C1=CC=CC2=C1N=NO2 UWAUSMGZOHPBJJ-UHFFFAOYSA-N 0.000 description 1
- IPJDHSYCSQAODE-UHFFFAOYSA-N 5-chloromethylfluorescein diacetate Chemical compound O1C(=O)C2=CC(CCl)=CC=C2C21C1=CC=C(OC(C)=O)C=C1OC1=CC(OC(=O)C)=CC=C21 IPJDHSYCSQAODE-UHFFFAOYSA-N 0.000 description 1
- XYJODUBPWNZLML-UHFFFAOYSA-N 5-ethyl-6-phenyl-6h-phenanthridine-3,8-diamine Chemical compound C12=CC(N)=CC=C2C2=CC=C(N)C=C2N(CC)C1C1=CC=CC=C1 XYJODUBPWNZLML-UHFFFAOYSA-N 0.000 description 1
- DBMJYWPMRSOUGB-UHFFFAOYSA-N 5-hexyl-6-phenylphenanthridin-5-ium-3,8-diamine;iodide Chemical compound [I-].C12=CC(N)=CC=C2C2=CC=C(N)C=C2[N+](CCCCCC)=C1C1=CC=CC=C1 DBMJYWPMRSOUGB-UHFFFAOYSA-N 0.000 description 1
- YXHLJMWYDTXDHS-IRFLANFNSA-N 7-aminoactinomycin D Chemical compound C[C@H]1OC(=O)[C@H](C(C)C)N(C)C(=O)CN(C)C(=O)[C@@H]2CCCN2C(=O)[C@@H](C(C)C)NC(=O)[C@H]1NC(=O)C1=C(N)C(=O)C(C)=C2OC(C(C)=C(N)C=C3C(=O)N[C@@H]4C(=O)N[C@@H](C(N5CCC[C@H]5C(=O)N(C)CC(=O)N(C)[C@@H](C(C)C)C(=O)O[C@@H]4C)=O)C(C)C)=C3N=C21 YXHLJMWYDTXDHS-IRFLANFNSA-N 0.000 description 1
- 108700012813 7-aminoactinomycin D Proteins 0.000 description 1
- 102000010825 Actinin Human genes 0.000 description 1
- 108010063503 Actinin Proteins 0.000 description 1
- 241000242764 Aequorea victoria Species 0.000 description 1
- 101000997963 Aequorea victoria Green fluorescent protein Proteins 0.000 description 1
- 235000001674 Agaricus brunnescens Nutrition 0.000 description 1
- 208000024827 Alzheimer disease Diseases 0.000 description 1
- YKJYKKNCCRKFSL-UHFFFAOYSA-N Anisomycin Natural products C1=CC(OC)=CC=C1CC1C(OC(C)=O)C(O)CN1 YKJYKKNCCRKFSL-UHFFFAOYSA-N 0.000 description 1
- 108090000672 Annexin A5 Proteins 0.000 description 1
- 102000004121 Annexin A5 Human genes 0.000 description 1
- 238000012935 Averaging Methods 0.000 description 1
- 108010081589 Becaplermin Proteins 0.000 description 1
- 244000045232 Canavalia ensiformis Species 0.000 description 1
- 235000010520 Canavalia ensiformis Nutrition 0.000 description 1
- 102000014914 Carrier Proteins Human genes 0.000 description 1
- 108010078791 Carrier Proteins Proteins 0.000 description 1
- 102000011727 Caspases Human genes 0.000 description 1
- 108010076667 Caspases Proteins 0.000 description 1
- 102100023441 Centromere protein J Human genes 0.000 description 1
- IVOMOUWHDPKRLL-KQYNXXCUSA-N Cyclic adenosine monophosphate Chemical compound C([C@H]1O2)OP(O)(=O)O[C@H]1[C@@H](O)[C@@H]2N1C(N=CN=C2N)=C2N=C1 IVOMOUWHDPKRLL-KQYNXXCUSA-N 0.000 description 1
- 239000003298 DNA probe Substances 0.000 description 1
- 101710088194 Dehydrogenase Proteins 0.000 description 1
- 206010012289 Dementia Diseases 0.000 description 1
- SUZLHDUTVMZSEV-UHFFFAOYSA-N Deoxycoleonol Natural products C12C(=O)CC(C)(C=C)OC2(C)C(OC(=O)C)C(O)C2C1(C)C(O)CCC2(C)C SUZLHDUTVMZSEV-UHFFFAOYSA-N 0.000 description 1
- AADVCYNFEREWOS-OBRABYBLSA-N Discodermolide Chemical compound C=C\C=C/[C@H](C)[C@H](OC(N)=O)[C@@H](C)[C@H](O)[C@@H](C)C\C(C)=C/[C@H](C)[C@@H](O)[C@@H](C)\C=C/[C@@H](O)C[C@@H]1OC(=O)[C@H](C)[C@@H](O)[C@H]1C AADVCYNFEREWOS-OBRABYBLSA-N 0.000 description 1
- 241000255581 Drosophila <fruit fly, genus> Species 0.000 description 1
- 206010013710 Drug interaction Diseases 0.000 description 1
- 102100021238 Dynamin-2 Human genes 0.000 description 1
- 102000009024 Epidermal Growth Factor Human genes 0.000 description 1
- 101800003838 Epidermal growth factor Proteins 0.000 description 1
- YQYJSBFKSSDGFO-UHFFFAOYSA-N Epihygromycin Natural products OC1C(O)C(C(=O)C)OC1OC(C(=C1)O)=CC=C1C=C(C)C(=O)NC1C(O)C(O)C2OCOC2C1O YQYJSBFKSSDGFO-UHFFFAOYSA-N 0.000 description 1
- 102000015929 Fructose-2,6-bisphosphatases Human genes 0.000 description 1
- 229940125633 GPCR agonist Drugs 0.000 description 1
- 229940125499 GPCR antagonist Drugs 0.000 description 1
- JZNWSCPGTDBMEW-UHFFFAOYSA-N Glycerophosphorylethanolamin Natural products NCCOP(O)(=O)OCC(O)CO JZNWSCPGTDBMEW-UHFFFAOYSA-N 0.000 description 1
- 102100021181 Golgi phosphoprotein 3 Human genes 0.000 description 1
- HTTJABKRGRZYRN-UHFFFAOYSA-N Heparin Chemical compound OC1C(NC(=O)C)C(O)OC(COS(O)(=O)=O)C1OC1C(OS(O)(=O)=O)C(O)C(OC2C(C(OS(O)(=O)=O)C(OC3C(C(O)C(O)C(O3)C(O)=O)OS(O)(=O)=O)C(CO)O2)NS(O)(=O)=O)C(C(O)=O)O1 HTTJABKRGRZYRN-UHFFFAOYSA-N 0.000 description 1
- 102000005548 Hexokinase Human genes 0.000 description 1
- 108700040460 Hexokinases Proteins 0.000 description 1
- 101000907924 Homo sapiens Centromere protein J Proteins 0.000 description 1
- 101000817607 Homo sapiens Dynamin-2 Proteins 0.000 description 1
- 101001040734 Homo sapiens Golgi phosphoprotein 3 Proteins 0.000 description 1
- 101000693082 Homo sapiens Serine/threonine-protein kinase 11-interacting protein Proteins 0.000 description 1
- 101001050288 Homo sapiens Transcription factor Jun Proteins 0.000 description 1
- 108010021625 Immunoglobulin Fragments Proteins 0.000 description 1
- 102000008394 Immunoglobulin Fragments Human genes 0.000 description 1
- 102000004310 Ion Channels Human genes 0.000 description 1
- 102000003855 L-lactate dehydrogenase Human genes 0.000 description 1
- 108700023483 L-lactate dehydrogenases Proteins 0.000 description 1
- 102000007330 LDL Lipoproteins Human genes 0.000 description 1
- 108010007622 LDL Lipoproteins Proteins 0.000 description 1
- 108091077621 MAPRE family Proteins 0.000 description 1
- 108010020004 Microtubule-Associated Proteins Proteins 0.000 description 1
- 102000006404 Mitochondrial Proteins Human genes 0.000 description 1
- 108010058682 Mitochondrial Proteins Proteins 0.000 description 1
- 101100456048 Mus musculus Map4 gene Proteins 0.000 description 1
- 229930193140 Neomycin Natural products 0.000 description 1
- 208000028389 Nerve injury Diseases 0.000 description 1
- 206010029350 Neurotoxicity Diseases 0.000 description 1
- 108010077850 Nuclear Localization Signals Proteins 0.000 description 1
- 208000018737 Parkinson disease Diseases 0.000 description 1
- 244000046052 Phaseolus vulgaris Species 0.000 description 1
- 102000012434 Phosphofructokinase-2 Human genes 0.000 description 1
- 102000001105 Phosphofructokinases Human genes 0.000 description 1
- 108010069341 Phosphofructokinases Proteins 0.000 description 1
- 102100027384 Proto-oncogene tyrosine-protein kinase Src Human genes 0.000 description 1
- 101710122944 Proto-oncogene tyrosine-protein kinase Src Proteins 0.000 description 1
- 108010005730 R-SNARE Proteins Proteins 0.000 description 1
- 108020004518 RNA Probes Proteins 0.000 description 1
- 239000003391 RNA probe Substances 0.000 description 1
- 102000007056 Recombinant Fusion Proteins Human genes 0.000 description 1
- 108010008281 Recombinant Fusion Proteins Proteins 0.000 description 1
- 102000038012 SFKs Human genes 0.000 description 1
- 108091008118 SFKs Proteins 0.000 description 1
- 241000242583 Scyphozoa Species 0.000 description 1
- XUIMIQQOPSSXEZ-UHFFFAOYSA-N Silicon Chemical compound [Si] XUIMIQQOPSSXEZ-UHFFFAOYSA-N 0.000 description 1
- FAPWRFPIFSIZLT-UHFFFAOYSA-M Sodium chloride Chemical compound [Na+].[Cl-] FAPWRFPIFSIZLT-UHFFFAOYSA-M 0.000 description 1
- 229930182558 Sterol Natural products 0.000 description 1
- 208000006011 Stroke Diseases 0.000 description 1
- 101710172711 Structural protein Proteins 0.000 description 1
- 102000002215 Synaptobrevin Human genes 0.000 description 1
- 210000001744 T-lymphocyte Anatomy 0.000 description 1
- 206010044221 Toxic encephalopathy Diseases 0.000 description 1
- 230000010632 Transcription Factor Activity Effects 0.000 description 1
- 102100023132 Transcription factor Jun Human genes 0.000 description 1
- 108700029229 Transcriptional Regulatory Elements Proteins 0.000 description 1
- 102000004338 Transferrin Human genes 0.000 description 1
- 108090000901 Transferrin Proteins 0.000 description 1
- 241000209140 Triticum Species 0.000 description 1
- 235000021307 Triticum Nutrition 0.000 description 1
- IVOMOUWHDPKRLL-UHFFFAOYSA-N UNPD107823 Natural products O1C2COP(O)(=O)OC2C(O)C1N1C(N=CN=C2N)=C2N=C1 IVOMOUWHDPKRLL-UHFFFAOYSA-N 0.000 description 1
- 241000711975 Vesicular stomatitis virus Species 0.000 description 1
- 108010046516 Wheat Germ Agglutinins Proteins 0.000 description 1
- 108091005971 Wild-type GFP Proteins 0.000 description 1
- 108010084455 Zeocin Proteins 0.000 description 1
- DPKHZNPWBDQZCN-UHFFFAOYSA-N acridine orange free base Chemical compound C1=CC(N(C)C)=CC2=NC3=CC(N(C)C)=CC=C3C=C21 DPKHZNPWBDQZCN-UHFFFAOYSA-N 0.000 description 1
- 150000001251 acridines Chemical class 0.000 description 1
- 239000013543 active substance Substances 0.000 description 1
- 230000009056 active transport Effects 0.000 description 1
- 108060000200 adenylate cyclase Proteins 0.000 description 1
- 102000030621 adenylate cyclase Human genes 0.000 description 1
- 239000000556 agonist Substances 0.000 description 1
- WYTGDNHDOZPMIW-RCBQFDQVSA-N alstonine Natural products C1=CC2=C3C=CC=CC3=NC2=C2N1C[C@H]1[C@H](C)OC=C(C(=O)OC)[C@H]1C2 WYTGDNHDOZPMIW-RCBQFDQVSA-N 0.000 description 1
- 230000003321 amplification Effects 0.000 description 1
- 230000019552 anatomical structure morphogenesis Effects 0.000 description 1
- 239000003098 androgen Substances 0.000 description 1
- 229940030486 androgens Drugs 0.000 description 1
- 230000033115 angiogenesis Effects 0.000 description 1
- 230000001946 anti-microtubular Effects 0.000 description 1
- 230000001640 apoptogenic effect Effects 0.000 description 1
- 230000005775 apoptotic pathway Effects 0.000 description 1
- 238000011948 assay development Methods 0.000 description 1
- 239000012298 atmosphere Substances 0.000 description 1
- 210000003719 b-lymphocyte Anatomy 0.000 description 1
- DZBUGLKDJFMEHC-UHFFFAOYSA-N benzoquinolinylidene Natural products C1=CC=CC2=CC3=CC=CC=C3N=C21 DZBUGLKDJFMEHC-UHFFFAOYSA-N 0.000 description 1
- 230000002902 bimodal effect Effects 0.000 description 1
- 230000000975 bioactive effect Effects 0.000 description 1
- 238000010256 biochemical assay Methods 0.000 description 1
- 230000003851 biochemical process Effects 0.000 description 1
- 230000004071 biological effect Effects 0.000 description 1
- 230000015572 biosynthetic process Effects 0.000 description 1
- 238000004061 bleaching Methods 0.000 description 1
- 108010083912 bleomycin N-acetyltransferase Proteins 0.000 description 1
- 210000000988 bone and bone Anatomy 0.000 description 1
- KQNZDYYTLMIZCT-KQPMLPITSA-N brefeldin A Chemical compound O[C@@H]1\C=C\C(=O)O[C@@H](C)CCC\C=C\[C@@H]2C[C@H](O)C[C@H]21 KQNZDYYTLMIZCT-KQPMLPITSA-N 0.000 description 1
- JUMGSHROWPPKFX-UHFFFAOYSA-N brefeldin-A Natural products CC1CCCC=CC2(C)CC(O)CC2(C)C(O)C=CC(=O)O1 JUMGSHROWPPKFX-UHFFFAOYSA-N 0.000 description 1
- CJGYSWNGNKCJSB-YVLZZHOMSA-N bucladesine Chemical compound C([C@H]1O2)OP(O)(=O)O[C@H]1[C@@H](OC(=O)CCC)[C@@H]2N1C(N=CN=C2NC(=O)CCC)=C2N=C1 CJGYSWNGNKCJSB-YVLZZHOMSA-N 0.000 description 1
- 229960005263 bucladesine Drugs 0.000 description 1
- 239000007975 buffered saline Substances 0.000 description 1
- 229910001424 calcium ion Inorganic materials 0.000 description 1
- 150000001720 carbohydrates Chemical class 0.000 description 1
- 235000014633 carbohydrates Nutrition 0.000 description 1
- 239000001569 carbon dioxide Substances 0.000 description 1
- 125000003178 carboxy group Chemical group [H]OC(*)=O 0.000 description 1
- JGPOSNWWINVNFV-UHFFFAOYSA-N carboxyfluorescein diacetate succinimidyl ester Chemical compound C=1C(OC(=O)C)=CC=C2C=1OC1=CC(OC(C)=O)=CC=C1C2(C1=C2)OC(=O)C1=CC=C2C(=O)ON1C(=O)CCC1=O JGPOSNWWINVNFV-UHFFFAOYSA-N 0.000 description 1
- CZPLANDPABRVHX-UHFFFAOYSA-N cascade blue Chemical compound C=1C2=CC=CC=C2C(NCC)=CC=1C(C=1C=CC(=CC=1)N(CC)CC)=C1C=CC(=[N+](CC)CC)C=C1 CZPLANDPABRVHX-UHFFFAOYSA-N 0.000 description 1
- 230000015556 catabolic process Effects 0.000 description 1
- 230000030833 cell death Effects 0.000 description 1
- 230000003915 cell function Effects 0.000 description 1
- 238000002782 cell morphology assay Methods 0.000 description 1
- 230000015861 cell surface binding Effects 0.000 description 1
- 239000002458 cell surface marker Substances 0.000 description 1
- 230000003833 cell viability Effects 0.000 description 1
- 238000003570 cell viability assay Methods 0.000 description 1
- 230000017455 cell-cell adhesion Effects 0.000 description 1
- 230000025611 cell-substrate adhesion Effects 0.000 description 1
- 230000005955 cellular translocation Effects 0.000 description 1
- 235000013339 cereals Nutrition 0.000 description 1
- 208000019065 cervical carcinoma Diseases 0.000 description 1
- 238000012512 characterization method Methods 0.000 description 1
- TUESWZZJYCLFNL-DAFODLJHSA-N chembl1301 Chemical compound C1=CC(C(=N)N)=CC=C1\C=C\C1=CC=C(C(N)=N)C=C1O TUESWZZJYCLFNL-DAFODLJHSA-N 0.000 description 1
- 125000004218 chloromethyl group Chemical group [H]C([H])(Cl)* 0.000 description 1
- HVYWMOMLDIMFJA-DPAQBDIFSA-N cholesterol group Chemical group [C@@H]1(CC[C@H]2[C@@H]3CC=C4C[C@@H](O)CC[C@]4(C)[C@H]3CC[C@]12C)[C@H](C)CCCC(C)C HVYWMOMLDIMFJA-DPAQBDIFSA-N 0.000 description 1
- 210000002932 cholinergic neuron Anatomy 0.000 description 1
- 210000000349 chromosome Anatomy 0.000 description 1
- 238000010367 cloning Methods 0.000 description 1
- OHCQJHSOBUTRHG-UHFFFAOYSA-N colforsin Natural products OC12C(=O)CC(C)(C=C)OC1(C)C(OC(=O)C)C(O)C1C2(C)C(O)CCC1(C)C OHCQJHSOBUTRHG-UHFFFAOYSA-N 0.000 description 1
- 230000005757 colony formation Effects 0.000 description 1
- 230000001447 compensatory effect Effects 0.000 description 1
- 210000002808 connective tissue Anatomy 0.000 description 1
- 238000010276 construction Methods 0.000 description 1
- WDVVHMWJSQRNBU-QBNOLPMJSA-N curacin Chemical compound COC1=C(Cl)C(O)=C(Cl)C(C)=C1C(=O)O[C@H]1[C@H](O)C[C@H](O)O[C@@H]1C WDVVHMWJSQRNBU-QBNOLPMJSA-N 0.000 description 1
- 229930194832 curacin Natural products 0.000 description 1
- 229940095074 cyclic amp Drugs 0.000 description 1
- 231100000135 cytotoxicity Toxicity 0.000 description 1
- 230000003013 cytotoxicity Effects 0.000 description 1
- 238000006731 degradation reaction Methods 0.000 description 1
- 238000013461 design Methods 0.000 description 1
- 239000003599 detergent Substances 0.000 description 1
- 206010012601 diabetes mellitus Diseases 0.000 description 1
- 230000004069 differentiation Effects 0.000 description 1
- 238000009792 diffusion process Methods 0.000 description 1
- 230000003292 diminished effect Effects 0.000 description 1
- XVLXYDXJEKLXHN-UHFFFAOYSA-M dioc6 Chemical compound [I-].O1C2=CC=CC=C2[N+](CCCCCC)=C1C=CC=C1N(CCCCCC)C2=CC=CC=C2O1 XVLXYDXJEKLXHN-UHFFFAOYSA-M 0.000 description 1
- 238000012912 drug discovery process Methods 0.000 description 1
- 239000003596 drug target Substances 0.000 description 1
- 238000003708 edge detection Methods 0.000 description 1
- 210000002257 embryonic structure Anatomy 0.000 description 1
- 230000001159 endocytotic effect Effects 0.000 description 1
- 210000001163 endosome Anatomy 0.000 description 1
- 210000002889 endothelial cell Anatomy 0.000 description 1
- 108010048367 enhanced green fluorescent protein Proteins 0.000 description 1
- 239000003623 enhancer Substances 0.000 description 1
- HKSZLNNOFSGOKW-UHFFFAOYSA-N ent-staurosporine Natural products C12=C3N4C5=CC=CC=C5C3=C3CNC(=O)C3=C2C2=CC=CC=C2N1C1CC(NC)C(OC)C4(C)O1 HKSZLNNOFSGOKW-UHFFFAOYSA-N 0.000 description 1
- 229940116977 epidermal growth factor Drugs 0.000 description 1
- 210000002919 epithelial cell Anatomy 0.000 description 1
- 108010014507 erythroagglutinating phytohemagglutinin Proteins 0.000 description 1
- 150000002148 esters Chemical class 0.000 description 1
- 229940011871 estrogen Drugs 0.000 description 1
- 239000000262 estrogen Substances 0.000 description 1
- 210000003527 eukaryotic cell Anatomy 0.000 description 1
- 238000011156 evaluation Methods 0.000 description 1
- 230000028023 exocytosis Effects 0.000 description 1
- 210000002744 extracellular matrix Anatomy 0.000 description 1
- 238000013213 extrapolation Methods 0.000 description 1
- 230000003328 fibroblastic effect Effects 0.000 description 1
- MHMNJMPURVTYEJ-UHFFFAOYSA-N fluorescein-5-isothiocyanate Chemical compound O1C(=O)C2=CC(N=C=S)=CC=C2C21C1=CC=C(O)C=C1OC1=CC(O)=CC=C21 MHMNJMPURVTYEJ-UHFFFAOYSA-N 0.000 description 1
- 238000000198 fluorescence anisotropy Methods 0.000 description 1
- 238000001917 fluorescence detection Methods 0.000 description 1
- 239000003269 fluorescent indicator Substances 0.000 description 1
- 230000004907 flux Effects 0.000 description 1
- 239000008098 formaldehyde solution Substances 0.000 description 1
- 238000013467 fragmentation Methods 0.000 description 1
- 238000006062 fragmentation reaction Methods 0.000 description 1
- 238000010230 functional analysis Methods 0.000 description 1
- 230000006650 fundamental cellular process Effects 0.000 description 1
- 230000003371 gabaergic effect Effects 0.000 description 1
- 102000034356 gene-regulatory proteins Human genes 0.000 description 1
- 108091006104 gene-regulatory proteins Proteins 0.000 description 1
- 238000010353 genetic engineering Methods 0.000 description 1
- 239000011521 glass Substances 0.000 description 1
- 208000005017 glioblastoma Diseases 0.000 description 1
- 239000008187 granular material Substances 0.000 description 1
- 239000003102 growth factor Substances 0.000 description 1
- 230000036541 health Effects 0.000 description 1
- 229960002897 heparin Drugs 0.000 description 1
- 229920000669 heparin Polymers 0.000 description 1
- 239000000833 heterodimer Substances 0.000 description 1
- 238000012203 high throughput assay Methods 0.000 description 1
- 229960001340 histamine Drugs 0.000 description 1
- 108091008039 hormone receptors Proteins 0.000 description 1
- 210000005260 human cell Anatomy 0.000 description 1
- 230000007062 hydrolysis Effects 0.000 description 1
- 238000006460 hydrolysis reaction Methods 0.000 description 1
- 229950005911 hydroxystilbamidine Drugs 0.000 description 1
- 238000003711 image thresholding Methods 0.000 description 1
- 150000002460 imidazoles Chemical class 0.000 description 1
- 230000001900 immune effect Effects 0.000 description 1
- 238000003125 immunofluorescent labeling Methods 0.000 description 1
- 238000011065 in-situ storage Methods 0.000 description 1
- 238000010348 incorporation Methods 0.000 description 1
- 150000002475 indoles Chemical class 0.000 description 1
- 239000000411 inducer Substances 0.000 description 1
- 230000028709 inflammatory response Effects 0.000 description 1
- 208000014674 injury Diseases 0.000 description 1
- 238000003780 insertion Methods 0.000 description 1
- 230000037431 insertion Effects 0.000 description 1
- 230000009878 intermolecular interaction Effects 0.000 description 1
- 230000016507 interphase Effects 0.000 description 1
- 230000006525 intracellular process Effects 0.000 description 1
- 230000031146 intracellular signal transduction Effects 0.000 description 1
- 230000008863 intramolecular interaction Effects 0.000 description 1
- 210000002510 keratinocyte Anatomy 0.000 description 1
- 210000000265 leukocyte Anatomy 0.000 description 1
- 108020001756 ligand binding domains Proteins 0.000 description 1
- 238000001638 lipofection Methods 0.000 description 1
- YAFQFNOUYXZVPZ-UHFFFAOYSA-N liproxstatin-1 Chemical compound ClC1=CC=CC(CNC=2C3(CCNCC3)NC3=CC=CC=C3N=2)=C1 YAFQFNOUYXZVPZ-UHFFFAOYSA-N 0.000 description 1
- 230000007774 longterm Effects 0.000 description 1
- DLBFLQKQABVKGT-UHFFFAOYSA-L lucifer yellow dye Chemical compound [Li+].[Li+].[O-]S(=O)(=O)C1=CC(C(N(C(=O)NN)C2=O)=O)=C3C2=CC(S([O-])(=O)=O)=CC3=C1N DLBFLQKQABVKGT-UHFFFAOYSA-L 0.000 description 1
- 108010045758 lysosomal proteins Proteins 0.000 description 1
- 238000012423 maintenance Methods 0.000 description 1
- 238000007726 management method Methods 0.000 description 1
- 230000000873 masking effect Effects 0.000 description 1
- 238000010297 mechanical methods and process Methods 0.000 description 1
- 230000002503 metabolic effect Effects 0.000 description 1
- 230000004060 metabolic process Effects 0.000 description 1
- 230000001394 metastastic effect Effects 0.000 description 1
- 206010061289 metastatic neoplasm Diseases 0.000 description 1
- 238000000520 microinjection Methods 0.000 description 1
- 102000021160 microtubule binding proteins Human genes 0.000 description 1
- 108091011150 microtubule binding proteins Proteins 0.000 description 1
- 230000025090 microtubule depolymerization Effects 0.000 description 1
- 230000011278 mitosis Effects 0.000 description 1
- 230000000394 mitotic effect Effects 0.000 description 1
- 230000004048 modification Effects 0.000 description 1
- 238000012986 modification Methods 0.000 description 1
- 239000003607 modifier Substances 0.000 description 1
- 238000010369 molecular cloning Methods 0.000 description 1
- 230000004001 molecular interaction Effects 0.000 description 1
- AHEWZZJEDQVLOP-UHFFFAOYSA-N monobromobimane Chemical compound BrCC1=C(C)C(=O)N2N1C(C)=C(C)C2=O AHEWZZJEDQVLOP-UHFFFAOYSA-N 0.000 description 1
- 230000004660 morphological change Effects 0.000 description 1
- 238000010235 multi-parametric assay Methods 0.000 description 1
- 230000003387 muscular Effects 0.000 description 1
- 238000002703 mutagenesis Methods 0.000 description 1
- 231100000350 mutagenesis Toxicity 0.000 description 1
- VVEKAPJMXBKPAP-UHFFFAOYSA-N n'-[3-(2,4-dinitroanilino)propyl]-n'-methylpropane-1,3-diamine Chemical compound NCCCN(C)CCCNC1=CC=C([N+]([O-])=O)C=C1[N+]([O-])=O VVEKAPJMXBKPAP-UHFFFAOYSA-N 0.000 description 1
- 230000017074 necrotic cell death Effects 0.000 description 1
- 239000013642 negative control Substances 0.000 description 1
- 229960004927 neomycin Drugs 0.000 description 1
- 230000001613 neoplastic effect Effects 0.000 description 1
- 210000005036 nerve Anatomy 0.000 description 1
- 230000008764 nerve damage Effects 0.000 description 1
- 238000003522 neurite outgrowth assay Methods 0.000 description 1
- 239000000712 neurohormone Substances 0.000 description 1
- 230000005015 neuronal process Effects 0.000 description 1
- 230000007135 neurotoxicity Effects 0.000 description 1
- 231100000228 neurotoxicity Toxicity 0.000 description 1
- PGSADBUBUOPOJS-UHFFFAOYSA-N neutral red Chemical compound Cl.C1=C(C)C(N)=CC2=NC3=CC(N(C)C)=CC=C3N=C21 PGSADBUBUOPOJS-UHFFFAOYSA-N 0.000 description 1
- 239000002547 new drug Substances 0.000 description 1
- 238000003199 nucleic acid amplification method Methods 0.000 description 1
- 239000002773 nucleotide Substances 0.000 description 1
- 125000003729 nucleotide group Chemical group 0.000 description 1
- 238000012634 optical imaging Methods 0.000 description 1
- 238000000399 optical microscopy Methods 0.000 description 1
- 210000000056 organ Anatomy 0.000 description 1
- 238000005192 partition Methods 0.000 description 1
- 208000028591 pheochromocytoma Diseases 0.000 description 1
- CWCMIVBLVUHDHK-ZSNHEYEWSA-N phleomycin D1 Chemical compound N([C@H](C(=O)N[C@H](C)[C@@H](O)[C@H](C)C(=O)N[C@@H]([C@H](O)C)C(=O)NCCC=1SC[C@@H](N=1)C=1SC=C(N=1)C(=O)NCCCCNC(N)=N)[C@@H](O[C@H]1[C@H]([C@@H](O)[C@H](O)[C@H](CO)O1)O[C@@H]1[C@H]([C@@H](OC(N)=O)[C@H](O)[C@@H](CO)O1)O)C=1N=CNC=1)C(=O)C1=NC([C@H](CC(N)=O)NC[C@H](N)C(N)=O)=NC(N)=C1C CWCMIVBLVUHDHK-ZSNHEYEWSA-N 0.000 description 1
- 230000003114 pinocytic effect Effects 0.000 description 1
- 239000013641 positive control Substances 0.000 description 1
- 239000002243 precursor Substances 0.000 description 1
- 238000007639 printing Methods 0.000 description 1
- 239000000047 product Substances 0.000 description 1
- 108010087325 profilactin Proteins 0.000 description 1
- 239000000186 progesterone Substances 0.000 description 1
- 229960003387 progesterone Drugs 0.000 description 1
- 230000026447 protein localization Effects 0.000 description 1
- 229950010131 puromycin Drugs 0.000 description 1
- 238000004445 quantitative analysis Methods 0.000 description 1
- 238000010791 quenching Methods 0.000 description 1
- 230000000171 quenching effect Effects 0.000 description 1
- 239000000700 radioactive tracer Substances 0.000 description 1
- 230000009257 reactivity Effects 0.000 description 1
- 230000008707 rearrangement Effects 0.000 description 1
- 239000002464 receptor antagonist Substances 0.000 description 1
- 229940044551 receptor antagonist Drugs 0.000 description 1
- 238000001525 receptor binding assay Methods 0.000 description 1
- 230000010837 receptor-mediated endocytosis Effects 0.000 description 1
- 238000003259 recombinant expression Methods 0.000 description 1
- 230000022983 regulation of cell cycle Effects 0.000 description 1
- 230000003252 repetitive effect Effects 0.000 description 1
- 238000002165 resonance energy transfer Methods 0.000 description 1
- TUFFYSFVSYUHPA-UHFFFAOYSA-M rhodamine 123 Chemical compound [Cl-].COC(=O)C1=CC=CC=C1C1=C(C=CC(N)=C2)C2=[O+]C2=C1C=CC(N)=C2 TUFFYSFVSYUHPA-UHFFFAOYSA-M 0.000 description 1
- 108700038288 rhodamine-phalloidin Proteins 0.000 description 1
- 210000001908 sarcoplasmic reticulum Anatomy 0.000 description 1
- 238000007423 screening assay Methods 0.000 description 1
- 230000003248 secreting effect Effects 0.000 description 1
- 238000000926 separation method Methods 0.000 description 1
- 238000012163 sequencing technique Methods 0.000 description 1
- 229940076279 serotonin Drugs 0.000 description 1
- 210000002966 serum Anatomy 0.000 description 1
- 239000010703 silicon Substances 0.000 description 1
- 229910052710 silicon Inorganic materials 0.000 description 1
- JZNWSCPGTDBMEW-YFKPBYRVSA-N sn-glycero-3-phosphoethanolamine Chemical compound NCCO[P@@](O)(=O)OC[C@@H](O)CO JZNWSCPGTDBMEW-YFKPBYRVSA-N 0.000 description 1
- 238000001228 spectrum Methods 0.000 description 1
- 208000020431 spinal cord injury Diseases 0.000 description 1
- 230000000087 stabilizing effect Effects 0.000 description 1
- 238000007619 statistical method Methods 0.000 description 1
- HKSZLNNOFSGOKW-FYTWVXJKSA-N staurosporine Chemical compound C12=C3N4C5=CC=CC=C5C3=C3CNC(=O)C3=C2C2=CC=CC=C2N1[C@H]1C[C@@H](NC)[C@@H](OC)[C@]4(C)O1 HKSZLNNOFSGOKW-FYTWVXJKSA-N 0.000 description 1
- CGPUWJWCVCFERF-UHFFFAOYSA-N staurosporine Natural products C12=C3N4C5=CC=CC=C5C3=C3CNC(=O)C3=C2C2=CC=CC=C2N1C1CC(NC)C(OC)C4(OC)O1 CGPUWJWCVCFERF-UHFFFAOYSA-N 0.000 description 1
- 235000003702 sterols Nutrition 0.000 description 1
- 150000003432 sterols Chemical class 0.000 description 1
- 239000000021 stimulant Substances 0.000 description 1
- 239000011550 stock solution Substances 0.000 description 1
- 210000002504 synaptic vesicle Anatomy 0.000 description 1
- 230000026676 system process Effects 0.000 description 1
- 230000008685 targeting Effects 0.000 description 1
- XUDZMIGAJMGETI-UHFFFAOYSA-N tetramethylchloromethylrosamine Chemical compound C=12C=CC(=[N+](C)C)C=C2OC2=CC(N(C)C)=CC=C2C=1C1=CC=C(CCl)C=C1 XUDZMIGAJMGETI-UHFFFAOYSA-N 0.000 description 1
- 230000001225 therapeutic effect Effects 0.000 description 1
- 125000003396 thiol group Chemical group [H]S* 0.000 description 1
- 230000036964 tight binding Effects 0.000 description 1
- 231100000167 toxic agent Toxicity 0.000 description 1
- 239000003440 toxic substance Substances 0.000 description 1
- 239000003053 toxin Substances 0.000 description 1
- 231100000765 toxin Toxicity 0.000 description 1
- 238000012549 training Methods 0.000 description 1
- 238000010361 transduction Methods 0.000 description 1
- 230000026683 transduction Effects 0.000 description 1
- 239000012581 transferrin Substances 0.000 description 1
- 230000010474 transient expression Effects 0.000 description 1
- 238000003146 transient transfection Methods 0.000 description 1
- 238000013519 translation Methods 0.000 description 1
- 230000008733 trauma Effects 0.000 description 1
- 238000000539 two dimensional gel electrophoresis Methods 0.000 description 1
- 238000009827 uniform distribution Methods 0.000 description 1
- VBEQCZHXXJYVRD-GACYYNSASA-N uroanthelone Chemical compound C([C@@H](C(=O)N[C@H](C(=O)N[C@@H](CS)C(=O)N[C@@H](CC(N)=O)C(=O)N[C@@H](CS)C(=O)N[C@H](C(=O)N[C@@H]([C@@H](C)CC)C(=O)NCC(=O)N[C@@H](CC=1C=CC(O)=CC=1)C(=O)N[C@@H](CO)C(=O)NCC(=O)N[C@@H](CC(O)=O)C(=O)N[C@@H](CCCNC(N)=N)C(=O)N[C@@H](CS)C(=O)N[C@@H](CCC(N)=O)C(=O)N[C@@H]([C@@H](C)O)C(=O)N[C@@H](CCCNC(N)=N)C(=O)N[C@@H](CC(O)=O)C(=O)N[C@@H](CC(C)C)C(=O)N[C@@H](CCCNC(N)=N)C(=O)N[C@@H](CC=1C2=CC=CC=C2NC=1)C(=O)N[C@@H](CC=1C2=CC=CC=C2NC=1)C(=O)N[C@@H](CCC(O)=O)C(=O)N[C@@H](CC(C)C)C(=O)N[C@@H](CCCNC(N)=N)C(O)=O)C(C)C)[C@@H](C)O)NC(=O)[C@H](CO)NC(=O)[C@H](CC(O)=O)NC(=O)[C@H](CC(C)C)NC(=O)[C@H](CO)NC(=O)[C@H](CCC(O)=O)NC(=O)[C@@H](NC(=O)[C@H](CC=1NC=NC=1)NC(=O)[C@H](CCSC)NC(=O)[C@H](CS)NC(=O)[C@@H](NC(=O)CNC(=O)CNC(=O)[C@H](CC(N)=O)NC(=O)[C@H](CC(C)C)NC(=O)[C@H](CS)NC(=O)[C@H](CC=1C=CC(O)=CC=1)NC(=O)CNC(=O)[C@H](CC(O)=O)NC(=O)[C@H](CC=1C=CC(O)=CC=1)NC(=O)[C@H](CO)NC(=O)[C@H](CO)NC(=O)[C@H]1N(CCC1)C(=O)[C@H](CS)NC(=O)CNC(=O)[C@H]1N(CCC1)C(=O)[C@H](CC=1C=CC(O)=CC=1)NC(=O)[C@H](CO)NC(=O)[C@@H](N)CC(N)=O)C(C)C)[C@@H](C)CC)C1=CC=C(O)C=C1 VBEQCZHXXJYVRD-GACYYNSASA-N 0.000 description 1
- 230000003612 virological effect Effects 0.000 description 1
- 230000029663 wound healing Effects 0.000 description 1
- 229910052724 xenon Inorganic materials 0.000 description 1
- FHNFHKCVQCLJFQ-UHFFFAOYSA-N xenon atom Chemical compound [Xe] FHNFHKCVQCLJFQ-UHFFFAOYSA-N 0.000 description 1
Images


Classifications
-
- C—CHEMISTRY; METALLURGY
- C12—BIOCHEMISTRY; BEER; SPIRITS; WINE; VINEGAR; MICROBIOLOGY; ENZYMOLOGY; MUTATION OR GENETIC ENGINEERING
- C12N—MICROORGANISMS OR ENZYMES; COMPOSITIONS THEREOF; PROPAGATING, PRESERVING, OR MAINTAINING MICROORGANISMS; MUTATION OR GENETIC ENGINEERING; CULTURE MEDIA
- C12N15/00—Mutation or genetic engineering; DNA or RNA concerning genetic engineering, vectors, e.g. plasmids, or their isolation, preparation or purification; Use of hosts therefor
- C12N15/09—Recombinant DNA-technology
- C12N15/10—Processes for the isolation, preparation or purification of DNA or RNA
- C12N15/1034—Isolating an individual clone by screening libraries
- C12N15/1089—Design, preparation, screening or analysis of libraries using computer algorithms
-
- G—PHYSICS
- G01—MEASURING; TESTING
- G01N—INVESTIGATING OR ANALYSING MATERIALS BY DETERMINING THEIR CHEMICAL OR PHYSICAL PROPERTIES
- G01N33/00—Investigating or analysing materials by specific methods not covered by groups G01N1/00 - G01N31/00
- G01N33/48—Biological material, e.g. blood, urine; Haemocytometers
- G01N33/50—Chemical analysis of biological material, e.g. blood, urine; Testing involving biospecific ligand binding methods; Immunological testing
- G01N33/5005—Chemical analysis of biological material, e.g. blood, urine; Testing involving biospecific ligand binding methods; Immunological testing involving human or animal cells
- G01N33/5008—Chemical analysis of biological material, e.g. blood, urine; Testing involving biospecific ligand binding methods; Immunological testing involving human or animal cells for testing or evaluating the effect of chemical or biological compounds, e.g. drugs, cosmetics
- G01N33/5082—Supracellular entities, e.g. tissue, organisms
-
- G—PHYSICS
- G01—MEASURING; TESTING
- G01N—INVESTIGATING OR ANALYSING MATERIALS BY DETERMINING THEIR CHEMICAL OR PHYSICAL PROPERTIES
- G01N15/00—Investigating characteristics of particles; Investigating permeability, pore-volume or surface-area of porous materials
- G01N15/10—Investigating individual particles
- G01N15/14—Optical investigation techniques, e.g. flow cytometry
- G01N15/1429—Signal processing
- G01N15/1433—Signal processing using image recognition
Definitions
- Another preferred embodiment comprises a program consisting of a set of instructions for causing a cell screening system to execute procedures for detecting the distribution and activity of specific cellular constituents and processes.
- the cellular processes include, but are not limited to, nuclear translocation of a protein, cellular hypertrophy, apoptosis, and protease-induced translocation of a protein.
- FIG. 1 is a schematic diagram of a preferred embodiment of the cell scanning system.
- An inverted fluorescence microscope is used 1 , such as a Zeiss Axiovert inverted fluorescence microscope which uses standard objectives with magnification of 1-100x to the camera, and a white light source (e.g. 100W mercury-arc lamp or 75W xenon lamp) with power supply 2 .
- a white light source e.g. 100W mercury-arc lamp or 75W xenon lamp
- a Z-axis focus drive 5 moves the objective in the Z direction for focusing.
- a joystick 6 provides for manual movement of the stage in the XYZ direction.
- a high resolution digital camera 7 acquires images from each well or location on the plate.
- the PC 11 provides a display 12 and has associated software.
- the output of a standard confocal imaging attachment for a microscope is a digital image that can be converted to the same format as the images produced by the other cell screening system embodiments described above, and can therefore be processed in exactly the same way as those images.
- the overall control, acquisition and analysis in this embodiment is essentially the same.
- the optical configuration of the confocal microscope system is essentially the same as that described above, except for the illuminator and detectors. Illumination and detection systems required for confocal microscopy have been designed as accessories to be attached to standard microscope optical systems such as that of the present invention (Zeiss, Germany). These alternative optical systems therefore can be easily integrated into the system as described above.
- a two platform architecture in which high throughput acquisition occurs on one platform and high content acquisition occurs on a second platform is provided ( Figure 6). Processing occurs on each platform independently, with results passed over a network interface, or a single controller is used to process the data from both platforms.
- the dual mode optical system utilizes a single platform system ( Figure 7). It consists of two separate optical modules, an HCS module 203 and an HTS module 209 that can be independently or collectively moved so that only one at a time is used to collect data from the microtiter plate 201 .
- the microtiter plate 201 is mounted in a motorized X,Y stage so it can be positioned for imaging in either HTS or HCS mode. After collecting and analyzing the HTS image data as described below, the HTS optical module 209 is moved out of the optical path and the HCS optical module 203 is moved into place.
- the optical module for HCS 203 consists of a projection lens 208 , excitation wavelength filter 207 and dichroic mirror 204 which are used to illuminate the back aperture of the microscope objective 202 , and thereby the field of that objective, from a standard microscope illumination system (not shown).
- the fluorescence emission is collected by the microscope objective 202 , passes through the dichroic mirror 204 and emission wavelength filter 205 and is focused by a tube lens 206 which forms an image on the same camera 216 with sensor 215 .
- the cell screening system further comprises a fluid delivery device for use with the live cell embodiment of the method of cell screening (see below).
- Figure 8 exemplifies a fluid delivery device for use with the system of the invention. It consists of a bank of 12 syringe pumps 701 driven by a single motor drive. Each syringe 702 is sized according to the volume to be delivered to each well, typically between 1 and 100 ⁇ L. Each syringe is attached via flexible tubing 703 to a similar bank of connectors which accept standard pipette tips 705 . The bank of pipette tips are attached to a drive system so they can be lowered and raised relative to the microtiter plate 706 to deliver fluid to each well.
- the plate is mounted on an X,Y stage, allowing movement relative to the optical system 707 for data collection purposes.
- This set-up allows one set of pipette tips, or even a single pipette tip, to deliver reagent to all the wells on the plate:
- the bank of syringe pumps can be used to deliver fluid to 12 wells simultaneously, or to fewer wells by removing some of the tips.
- Standard 96 well microtiter plates which are 86 mm by 129 mm, with 6mm diameter wells on a 9mm pitch, are used for compatibility with current automated loading and robotic handling systems.
- the microplate is typically 20 mm by 30 mm, with cell locations that are 100-200 microns in dimension on a pitch of about 500 microns. Methods for making microplates are described in U.S. Patent Application Serial No. 08/865,341, incorporated by reference herein in its entirety.
- Microplates may consist of coplanar layers of materials to which cells adhere, patterned with materials to which cells will not adhere, or etched 3-dimensional surfaces of similarly pattered materials.
- the terms 'well' and 'microwell' refer to a location in an array of any construction to which cells adhere and within which the cells are imaged.
- Microplates may also include fluid delivery channels in the spaces between the wells. The smaller format of a microplate increases the overall efficiency of the system by minimizing the quantities of the reagents, storage and handling during preparation and the overall movement required for the scanning operation. In addition, the whole area of the microplate can be imaged more efficiently, allowing a second mode of operation for the microplate reader as described later in this document.
- the method of the present invention is based on the high affinity of fluorescent or luminescent molecules for specific cellular components.
- the affinity for specific components is governed by physical forces such as ionic interactions, covalent bonding (which includes chimeric fusion with protein-based chromophores, fluorophores, and lumiphores), as well as hydrophobic interactions, electrical potential, and, in some cases, simple entrapment within a cellular component.
- the luminescent probes can be small molecules, labeled macromolecules, or genetically engineered proteins, including, but not limited to green fluorescent protein chimeras.
- the luminescent probes can be synthesized within the living cell or can be transported into the cell via several non-mechanical modes including diffusion, facilitated or active transport, signal-sequence-mediated transport, and endocytotic or pinocytotic uptake.
- Mechanical bulk loading methods which are well known in the art, can also be used to load luminescent probes into living cells (Barber et al. (1996), Neuroscience Letters 207:17-20; Bright et al. (1996), Cytometry 24:226-233; McNeil (1989) in Methods in Cell Biology, Vol. 29, Taylor and Wang (eds.), pp. 153-173).
- cells can be genetically engineered to express reporter molecules, such as GFP, coupled to a protein of interest as previously described (Chalfie and Prasher U.S. Patent No. 5,491,084; Cubitt et al. (1995), Trends in Biochemical Science 20:448-455).
- the luminescent probes accumulate at their target domain as a result of specific and high affinity interactions with the target domain or other modes of molecular targeting such as signal-sequence-mediated transport.
- Fluorescently labeled reporter molecules are useful for determining the location, amount and chemical environment of the reporter. For example, whether the reporter is in a lipophilic membrane environment or in a more aqueous environment can be determined (Giuliano et al. (1995), Ann. Rev. of Biophysics and Biomolecular Structure 24:405-434; Giuliano and Taylor (1995), Methods in Neuroscience 27:1-16). The pH environment of the reporter can be determined (Bright et al. (1989), J.
- a preferred embodiment is provided to analyze cells that comprises operator-directed parameters being selected based on the assay being conducted, data acquisition by the cell screening system on the distribution of fluorescent signals within a sample, and interactive data review and analysis.
- the operator enters information 100 that describes the sample, specifies the filter settings and fluorescent channels to match the biological labels being used and the information sought, and then adjusts the camera settings to match the sample brightness.
- the software allows selection of various parameter settings used to identify nuclei and cytoplasm, and selection of different fluorescent reagents, identification of cells of interest based on morphology or brightness, and cell numbers to be analyzed per well. These parameters are stored in the system's for easy retrieval for each automated run.
- the system's interactive cell identification mode simplifies the selection of morphological parameter limits such as the range of size, shape, and intensity of cells to be analyzed.
- the user specifies which wells of the plate the system will scan and how many fields or how many cells to analyze in each well.
- the system either automatically pre-focuses the region of the plate to be scanned using an autofocus procedure to "find focus" of the plate 102 or the user interactively pre-focuses 103 the scanning region by selecting three "tag" points which define the rectangular area to be scanned.
- a least-squares fit "focal plane model” is then calculated from these tag points to estimate the focus of each well during an automated scan.
- the focus of each well is estimated by interpolating from the focal plane model during a scan.
- the software dynamically displays the scan status, including the number of cells analyzed, the current well being analyzed, images of each independent wavelength as they are acquired, and the result of the screen for each well as it is determined.
- the plate 4 ( Figure 1) is scanned in a serpentine style as the software automatically moves the motorized microscope XY stage 3 from well to well and field to field within each well of a 96-well plate.
- Those skilled in the programming art will recognize how to adapt software for scanning of other microplate formats such as 24, 48, and 384 well plates.
- the scan pattern of the entire plate as well as the scan pattern of fields within each well are programmed.
- the system adjusts sample focus with an autofocus procedure 104 ( Figure 9) through the Z axis focus drive 5 , controls filter selection via a motorized filter wheel 19 , and acquires and analyzes images of up to four different colors ("channels" or "wavelengths").
- the autofocus procedure is called at a user selected frequency, typically for the first field in each well and then once every 4 to 5 fields within each well.
- the autofocus procedure calculates the starting Z-axis point by interpolating from the pre-calculated plane focal model. Starting a programmable distance above or below this set point, the procedure moves the mechanical Z-axis through a number of different positions, acquires an image at each position, and finds the maximum of a calculated focus score that estimates the contrast of each image. The Z position of the image with the maximum focus score determines the best focus for a particular field.
- Those skilled in the art will recognize this as a variant of automatic focusing methods as described in Harms et al. in Cytometry 5 (1984), 236-243, Groen et al. in Cytometry 6 (1985), 81-91, and Firestone et al. in Cytometry 12 (1991), 195-206.
- the camera's exposure time is separately adjusted for each dye to ensure a high-quality image from each channel.
- Software procedures can be called, at the user's option, to correct for registration shifts between wavelengths by accounting for linear (X and Y) shifts between wavelengths before making any further measurements.
- the electronic shutter 18 is controlled so that sample photo-bleaching is kept to a minimum. Background shading and uneven illumination can be corrected by the software using methods known in the art (Bright et al. (1987), J. Cell Biol . 104:1019-1033).
- images are acquired of a primary marker 105 ( Figure 9) (typically cell nuclei counterstained with DAPI or PI fluorescent dyes) which are segmented ("identified") using an adaptive thresholding procedure.
- the adaptive thresholding procedure 106 is used to dynamically select the threshold of an image for separating cells from the background.
- the staining of cells with fluorescent dyes can vary to an unknown degree across cells in a microtiter plate sample as well as within images of a field of cells within each well of a microtiter plate. This variation can occur as a result of sample preparation and/or the dynamic nature of cells.
- a global threshold is calculated for the complete image to separate the cells from background and account for field to field variation.
- An alternative adaptive thresholding method utilizes local region thresholding in contrast to global image thresholding.
- Image analysis of local regions leads to better overall segmentation since staining of cell nuclei (as well as other labeled components) can vary across an image.
- a reduced resolution image (reduced in size by a factor of 2 to 4) is first globally segmented (using adaptive thresholding) to find regions of interest in the image. These regions then serve as guides to more fully analyze the same regions at full resolution. A more localized threshold is then calculated (again using adaptive thresholding) for each region of interest.
- Each object of interest is located in the image for further analysis 110 .
- the software determines if the object meets the criteria for a valid cell nucleus 111 by measuring its morphological features (size and shape). For each valid cell, the XYZ stage location is recorded, a small image of the cell is stored, and features are measured 112 .
- the cell scanning method of the present invention can be used to perform many different assays on cellular samples by applying a number of analytical methods simultaneously to measure features at multiple wavelengths.
- An example of one such assay provides for the following measurements:
- Features 1 through 4 are general features of the different cell screening assays of the invention. These steps are commonly used in a variety of image analysis applications and are well known in art (Russ (1992) The Image Processing Handbook, CRC Press Inc.; Gonzales et al. (1987), Digital Image Processing. Addison-Wesley Publishing Co. pp. 391-448).
- Features 5-9 have been developed specifically to provide measurements of a cell's fluorescent molecules within the local cytoplasmic region of the cell and the translocation (i.e. movement) of fluorescent molecules from the cytoplasm to the nucleus. These features (steps 5-9) are used for analyzing cells in microplates for the inhibition of nuclear translocation.
- Graphical plotting capabilities are provided in which data can be analyzed via interactive graphs such as histograms and scatter plots. Users can review summary data that are accumulated and summarized for all cells within each well of a plate with an interactive well-by-well data review procedure 119 . Hard copies of graphs and images can be printed on a wide range of standard printers.
- reports can be generated on one or more statistics of the measured features.
- Users can generate a graphical report of data summarized on a well-by-well basis for the scanned region of the plate using an interactive report generation procedure 120 .
- This report includes a summary of the statistics by well in tabular and graphical format and identification information on the sample.
- the report window allows the operator to enter comments about the scan for later retrieval.
- Multiple reports can be generated on many statistics and be printed with the touch of one button. Reports can be previewed for placement and data before being printed.
- the above-recited embodiment of the method operates in a single high resolution mode referred to as the high content screening (HCS) mode.
- HCS high content screening
- the HCS mode provides sufficient spatial resolution within a well (on the order of 1 ⁇ m) to define the distribution of material within the well, as well as within individual cells in the well.
- the high degree of information content accessible in that mode comes at the expense of speed and complexity of the required signal processing.
- a high throughput system is directly coupled with the HCS either on the same platform or on two separate platforms connected electronically (e.g. via a local area network).
- This embodiment of the invention referred to as a dual mode optical system, has the advantage of increasing the throughput of an HCS by coupling it with an HTS and thereby requiring slower high resolution data acquisition and analysis only on the small subset of wells that show a response in the coupled HTS.
- High throughput 'whole plate' reader systems are well known in the art and are commonly used as a component of an HTS system used to screen large numbers of compounds (Beggs et al. (1997), supra; McCaffrey et al. (1996), supra ).
- the HTS of the present invention is carried out on the microtiter plate or microwell array by reading many or all wells in the plate simultaneously with sufficient resolution to make determinations on a well-by-well basis. That is, calculations are made by averaging the total signal output of many or all the cells or the bulk of the material in each well. Wells that exhibit some defined response in the HTS (the 'hits') are flagged by the system. Then on the same microtiter plate or microwell array, each well identified as a hit is measured via HCS as described above.
- the dual mode process involves:
- the operator enters information 302 that describes the plate and its contents, specifies the filter settings and fluorescent channels to match the biological labels being used, the information sought and the camera settings to match the sample brightness. These parameters are stored in the system's database for easy retrieval for each automated run.
- the microtiter plate or microwell array is loaded into the cell screening system 303 either manually or automatically by controlling a robotic loading device.
- An optional environmental chamber 304 is controlled by the system to maintain the temperature, humidity and CO 2 levels in the air surrounding live cells in the microtiter plate or microwell array.
- An optional fluid delivery device 305 (see Figure 8) is controlled by the system to dispense fluids into the wells during the scan.
- High throughput processing 306 is first performed on the microtiter plate or microwell array by acquiring and analyzing the signal from each of the wells in the plate.
- the processing performed in high throughput mode 307 is illustrated in Figure 12 and described below.
- Wells that exhibit some selected intensity response in this high throughput mode (“hits") are identified by the system.
- the system performs a conditional operation 308 that tests for hits. If hits are found, those specific hit wells are further analyzed in high content (micro level) mode 309 .
- the processing performed in high content mode 312 is illustrated in Figure 13.
- the system updates 310 the informatics database 311 with results of the measurements on the plate. If there are more plates to be analyzed 313 the system loads the next plate 303 ; otherwise the analysis of the plates terminates 314 .
- the system starts the high content mode processing 501 defined in Figure 13.
- the system selects the HCS optical module 502 by controlling the motorized positioning system.
- the XY stage location of the well is retrieved from memory or disk and the stage is then moved to the selected stage location 503 .
- the autofocus procedure 504 is called for the first field in each hit well and then once every 5 to 8 fields within each well.
- images are acquired of the primary marker 505 (typically cell nuclei counterstained with DAPI, Hoechst or PI fluorescent dye). The images are then segmented (separated into regions of nuclei and non-nuclei) using an adaptive thresholding procedure 506 .
- the primary marker 505 typically cell nuclei counterstained with DAPI, Hoechst or PI fluorescent dye
- the output of the segmentation procedure is a binary mask wherein the objects are white and the background is black.
- This binary image also called a mask in the art, is used to determine if the field contains objects 507 .
- the mask is labeled with a blob labeling method whereby each object (or blob) has a unique number assigned to it. If objects are found in the field, images are acquired for all other active channels 508 , otherwise the stage is advanced to the next field 514 in the current well. Each object is located in the image for further analysis 509 . Morphological features, such as area and shape of the objects, are used to select objects likely to be cell nuclei 510 , and discard (do no further processing on) those that are considered artifacts.
- the XYZ stage location is recorded, a small image of the cell is stored, and assay specific features are measured 511 .
- the system then performs multiple tests on the cells by applying several analytical methods to measure features at each of several wavelengths. After measuring the cell features, the systems checks if there are any unprocessed objects in the current field 512 . If there are any unprocessed objects, it locates the next object 509 and determines whether it meets the criteria for a valid cell nucleus 510 , and measures its features. After processing all the objects in the current field, the system deteremines whether it needs to find more cells or fields in the current well 513 .
- the system checks whether it has any remaining hit wells to measure 515 . If so, it advances to the next hit well 503 and proceeds through another cycle of acquisition and analysis, otherwise the HCS mode is finished 516 .
- a method of kinetic live cell screening is provided.
- the previously described embodiments of the invention are used to characterize the spatial distribution of cellular components at a specific point in time, the time of chemical fixation.
- these embodiments have limited utility for implementing kinetic based screens, due to the sequential nature of the image acquisition, and the amount of time required to read all the wells on a plate. For example, since a plate can require 30 - 60 minutes to read through all the wells, only very slow kinetic processes can be measured by simply preparing a plate of live cells and then reading through all the wells more than once. Faster kinetic processes can be measured by taking multiple readings of each well before proceeding to the next well, but the elapsed time between the first and last well would be too long, and fast kinetic processes would likely be complete before reaching the last well.
- the kinetic live cell extension of the invention enables the design and use of screens in which a biological process is characterized by its kinetics instead of, or in addition to, its spatial characteristics.
- a response in live cells can be measured by adding a reagent to a specific well and making multiple measurements on that well with the appropriate timing.
- This dynamic live cell embodiment of the invention therefore includes apparatus for fluid delivery to individual wells of the system in order to deliver reagents to each well at a specific time in advance of reading the well. This embodiment thereby allows kinetic measurements to be made with temporal resolution of seconds to minutes on each well of the plate.
- the acquisition control program is modified to allow repetitive data collection from sub-regions of the plate, allowing the system to read other wells between the time points required for an individual well.
- Figure 8 describes an example of a fluid delivery device for use with the live cell embodiment of the invention and is described above.
- This set-up allows one set of pipette tips 705 , or even a single pipette tip, to deliver reagent to all the wells on the plate.
- the bank of syringe pumps 701 can be used to deliver fluid to 12 wells simultaneously, or to fewer wells by removing some of the tips 705 .
- the temporal resolution of the system can therefore be adjusted, without sacrificing data collection efficiency, by changing the number of tips and the scan pattern as follows.
- the data collection and analysis from a single well takes about 5 seconds. Moving from well to well and focusing in a well requires about 5 seconds, so the overall cycle time for a well is about 10 seconds.
- Figure 14 shows the acquisition sequence used for kinetic analysis.
- the start of processing 801 is configuration of the system, much of which is identical to the standard HCS configuration.
- the operator must enter information specific to the kinetic analysis being performed 802 , such as the sub-region size, the number of time points required, and the required time increment.
- a sub-region is a group of wells that will be scanned repetitively in order to accumulate kinetic data.
- the size of the sub-region is adjusted so that the system can scan a whole sub-region once during a single time increment, thus minimizing wait times.
- the optimum sub-region size is calculated from the setup parameters, and adjusted if necessary by the operator.
- the acquisition sequence performed in each well is exactly the same as that required for the specific HCS being run in kinetic mode.
- Figure 15 details a flow chart for that processing. All of the steps between the start 901 and the return 902 are identical to those described as steps 504 - 514 in Figure 13.
- the system After each pass through the sub-region, the system checks whether all the time points have been collected 811 and if not, pauses 813 if necessary 812 to stay synchronized with the requested time increment. Otherwise, the system checks for additional sub-regions on the plate 814 and either moves to the next sub-region 803 or finishes 815 .
- the kinetic analysis mode comprises operator identification of sub-regions of the microtiter plate or microwells to be screened, based on the kinetic response to be investigated, with data acquisitions within a sub-region prior to data acquisition in subsequent sub-regions.
- cell screening methods and machine readable storage medium comprising a program containing a set of instructions for causing a cell screening system to execute procedures for defining the distribution and activity of specific cellular constituents and processes.
- the cell screening system comprises a high magnification fluorescence optical system with a stage adapted for holding cells and a means for moving the stage, a digital camera, a light source for receiving and processing the digital data from the digital camera, and a computer means for receiving and processing the digital data from the digital camera.
- This aspect of the invention comprises programs that instruct the cell screening system to define the distribution and activity of specific cellular constituents and processes, using the luminescent probes, the optical imaging system, and the pattern recognition software of the invention.
- the cell screening methods are used to identify compounds that modify the various cellular processes.
- the cells can be contacted with a test compound, and the effect of the test compound on a particular cellular process can be analyzed.
- the cells can be contacted with a test compound and a known agent that modifies the particular cellular process, to determine whether the test compound can inhibit or enhance the effect of the known agent.
- the methods can be used to identify test compounds that increase or decrease a particular cellular response, as well as to identify test compounds that affects the ability of other agents to increase or decrease a particular cellular response.
- the locations containing cells are analyzed using the above methods at low resolution in a high throughput mode, and only a subset of the locations containing cells are analyzed in a high content mode to obtain luminescent signals from the luminescently labeled reporter molecules in subcellular compartments of the cells being analyzed.
- Regulation of transcription of some genes involves activation of a transcription factor in the cytoplasm, resulting in that factor being transported into the nucleus where it can initiate transcription of a particular gene or genes.
- This change in transcription factor distribution is the basis of a screen for the cell-based screening system to detect compounds that inhibit or induce transcription of a particular gene or group of genes. A general description of the screen is given followed by a specific example.
- Figure 10F illustrates a stimulated cell with its nucleus 206 labeled with a blue fluorophore and a transcription factor in the cytoplasm 207 labeled with a green fluorophore.
- the nuclear mask 208 in Figure 10G is derived by the cell based screening system.
- Figure 10H illustrates the cytoplasm 209 of a stimulated cell imaged at a green wavelength.
- Figure 10I illustrates the nuclear sampling region 211 and cytoplasmic sampling region 212 of the stimulated cell.
- Figure 10J further illustrates a side view which shows the nuclear sampling region 211 and the cytoplasmic sampling region 212 .
- NucCyt Difference gives consistent results over a wide range of cell densities and reagent concentrations, and can therefore be routinely used to screen compound libraries for specific nuclear translocation activity.
- the same method can be used with antibodies to other transcription factors, or GFP-transcription factor chimeras, or fluorescently labeled transcription factors introduced into living or fixed cells, to screen for effects on the regulation of transcription factor activity.
- Figure 18 is a representative display on a PC screen of data which was obtained in accordance with Example 1.
- Graph 1 180 plots the difference between the average antibody fluorescence in the nuclear sampling region and cytoplasmic sampling region, NucCyt Difference verses Well #.
- Graph 2 181 plots the average fluorescence of the antibody in the nuclear sampling region, NP1 average, versus the Well #.
- Graph 3 182 plots the average antibody fluorescence in the cytoplasmic sampling region, LIP1 average, versus Well #.
- the software permits displaying data from each cell.
- Figure 18 shows a screen display 183 , the nuclear image 184 , and the fluorescent antibody image 185 for cell #26.
- this aspect of the invention can be performed using other transcription factors that translocate from the cytoplasm to the nucleus upon activation.
- activation of the c-fos transcription factor was assessed by defining its spatial position within cells. Activated c-fos is found only within the nucleus, while inactivated c-fos resides within the cytoplasm.
- 3T3 cells were plated at 5000-10000 cells per well in a Polyfiltronics 96-well plate. The cells were allowed to attach and grow overnight.
- the cells were rinsed twice with 100 ⁇ l serum-free medium, incubated for 24-30 hours in serum-free MEM culture medium, and then stimulated with platelet derived growth factor (PDGF-BB) (Sigma Chemical Co., St. Louis, MO) diluted directly into serum free medium at concentrations ranging from 1-50 ng/ml for an average time of 20 minutes.
- PDGF-BB platelet derived growth factor
- HBSS Hanks buffered saline solution
- c-Fos rabbit polyclonal antibody (Calbiochem, PC05) was diluted 1:50 in HBSS, and 50 ⁇ l of the dilution was applied to each well.
- Cells were incubated in the presence of primary antibody for one hour at room temperature, and then incubated for one hour at room temperature in a light tight container with goat anti-rabbit secondary antibody conjugated to ALEXATM 488 (Molecular Probes), diluted 1:500 from a 100 ⁇ g/ml stock in HBSS.
- Hoechst DNA dye (Molecular Probes) was then added at a 1:1000 dilution of the manufacturer's stock solution (10 mg/ml).
- transcription factors include, but are not limited to fos and jun homologs, NF-KB (nuclear factor kappa from B cells), NFAT (nuclear factor of activated T-lymphocytes), and STATs (signal transducer and activator of transcription) factors (For example, see Strehlow, I., and Schindler, C. 1998. J. Biol. Chem. 273:28049-28056; Chow, et al. 1997 Science.
- indicator cells are treated with test compounds and the distribution of luminescently labeled transcription factor is measured in space and time using a cell screening system, such as the one disclosed above.
- the luminescently labeled transcription factor may be expressed by or added to the cells either before, together with, or after contacting the cells with a test compound.
- the transcription factor may be expressed as a luminescently labeled protein chimera by transfected indicator cells.
- the luminescently labeled transcription factor may be expressed, isolated, and bulk-loaded into the indicator cells as described above, or the transcription factor may be luminescently labeled after isolation.
- the transcription factor is expressed by the indicator cell, which is subsequently contacted with a luminescent label, such as an antibody, that detects the transcription factor.
- kits for analyzing transcription factor activation, comprising an antibody that specifically recognizes a transcription factor of interest, and instructions for using the antibody for carrying out the methods described above.
- the transcription factor-specific antibody, or a secondary antibody that detects the transcription factor antibody is luminescently labeled.
- the kit contains cells that express the transcription factor of interest, and/or the kit contains a compound that is known to modify activation of the transcription factor of interest, including but not limited to platelet derived growth factor (PDGF) and serum, which both modify fos activation; and interleukin 1(IL-1) and tumor necrosis factor (TNF), which both modify NF-KB activation.
- PDGF platelet derived growth factor
- IL-1 interleukin 1(IL-1) and tumor necrosis factor
- the cytoplasm to nucleus screening methods can also be used to analyze the activation of any protein kinase that is present in an inactive state in the cytoplasm and is transported to the nucleus upon activation, or that phosphorylates a substrate that translocates from the cytoplasm to the nucleus upon phosphorylation.
- protein kinases include, but are not limited to extracellular signal-regulated protein kinases (ERKs), c-Jun amino-terminal kinases (JNKs), Fos regulating protein kinases (FRKs), p38 mitogen activated protein kinase (p38MAPK), protein kinase A (PKA), and mitogen activated protein kinase kinases (MAPKKs).
- ERKs extracellular signal-regulated protein kinases
- JNKs c-Jun amino-terminal kinases
- FRKs Fos regulating protein kinases
- p38MAPK p38 mitogen activated protein kinase
- PKA protein kinase A
- MAPKKs mitogen activated protein kinase kinases
- protein kinase activity is assayed by monitoring translocation of a luminescently labeled protein kinase substrate from the cytoplasm to the nucleus after being phosphorylated by the protein kinase of interest.
- the substrate is non-phosphorylated and cytoplasmic prior to phosphorylation, and is translocated to the nucleus upon phosphorylation by the protein kinase.
- the protein kinase itself translocates from the cytoplasm to the nucleus in this embodiment.
- substrates and the corresponding protein kinase
- indicator cells are treated with test compounds and the distribution of luminescently labeled protein kinase or protein kinase substrate is measured in space and time using a cell screening system, such as the one disclosed above.
- the luminescently labeled protein kinase or protein kinase substrate may be expressed by or added to the cells either before, together with, or after contacting the cells with a test compound.
- the protein kinase or protein kinase substrate may be expressed as a luminescently labeled protein chimera by transfected indicator cells.
- the luminescently labeled protein kinase or protein kinase substrate may be expressed, isolated, and bulk-loaded into the indicator cells as described above, or the protein kinase or protein kinase substrate may be luminescently labeled after isolation.
- the protein kinase or protein kinase substrate is expressed by the indicator cell, which is subsequently contacted with a luminescent label, such as a labeled antibody, that detects the protein kinase or protein kinase substrate.
- protein kinase activity is assayed by monitoring the phosphorylation state (ie: phosphorylated or not phosphorylated) of a protein kinase substrate.
- phosphorylation state ie: phosphorylated or not phosphorylated
- phosphorylation state is monitored by contacting the cells with an antibody that binds only to the phosphorylated form of the protein kinase substrate of interest (For example, as disclosed in U.S. Patent No. 5,599,681).
- a biosensor of phosphorylation is used.
- a luminescently labeled protein or fragment thereof can be fused to a protein that has been engineered to contain (a) a phosphorylation site that is recognized by a protein kinase of interest; and (b) a nuclear localization signal that is unmasked by the phosphorylation.
- a biosensor will thus be translocated to the nucleus upon phosphorylation, and its translocation can be used as a measure of protein kinase activation.
- kits for analyzing protein kinase activation, comprising a primary antibody that specifically binds to a protein kinase, a protein kinase substrate, or a phosphorylated form of the protein kinase substrate of interest and instructions for using the primary antibody to identify compounds that modify protein kinase activation in a cell of interest.
- the primary antibody, or a secondary antibody that detects the primary antibody is luminescently labeled.
- the kit further comprises cells that express the protein kinase of interest, and/or a compound that is known to modify activation of the protein kinase of interest, including but not limited to dibutyryl cAMP (modifies PKA), forskolin (PKA), and anisomycin (p38MAPK).
- a compound that is known to modify activation of the protein kinase of interest including but not limited to dibutyryl cAMP (modifies PKA), forskolin (PKA), and anisomycin (p38MAPK).
- kits comprise an expression vector encoding a protein kinase or a protein kinase substrate of interest that translocates from the cytoplasm to the nucleus upon activation and instructions for using the expression vector to identify compounds that modify protein kinase activation in a cell of interest.
- the kits contain a purified, luminescently labeled protein kinase or protein kinase substrate.
- the protein kinase or protein kinase substrate of interest is expressed as a fusion protein with a luminescent protein.
- the kit further comprises cells that are transfected with the expression vector, an antibody or fragment thereof that specifically binds to the protein kinase or protein kinase substrate of interest, and/or a compound that is known to modify activation of the protein kinase of interest. (as above)
- the present invention comprises a machine readable storage medium comprising a program containing a set of instructions for causing a cell screening system to execute the methods disclosed for analyzing transcription factor or protein kinase activation, wherein the cell screening system comprises an optical system with a stage adapted for holding a plate containing cells, a digital camera, a means for directing fluorescence or luminescence emitted from the cells to the digital camera, and a computer means for receiving and processing the digital data from the digital camera.
- Changes in cell size are associated with a number of cellular conditions, such as hypertrophy, cell attachment and spreading, differentiation, growth and division, necrotic and programmed cell death, cell motility, morphogenesis, tube formation, and colony formation.
- cellular hypertrophy has been associated with a cascade of alterations in gene expression and can be characterized in cell culture by an alteration in cell size, that is clearly visible in adherent cells growing on a coverslip.
- Cell size can also be measured to determine the attachment and spreading of adherent cells.
- Cell spreading is the result of selective binding of cell surface receptors to substrate ligands and subsequent activation of signaling pathways to the cytoskeleton.
- Cell attachment and spreading to substrate molecules is an important step for the metastasis of cancer cells, leukocyte activation during the inflammatory response, keratinocyte movement during wound healing, and endothelial cell movement during angiogenesis.
- Compounds that affect these surface receptors, signaling pathways, or the cytoskeleton will affect cell spreading and can be screened by measuring cell size.
- Total cellular area can be monitored by labeling the entire cell body or the cell cytoplasm using cytoskeletal markers, cytosolic volume markers, or cell surface markers, in conjunction with a DNA label.
- cytoskeletal markers include cytoskeletal markers, cytosolic volume markers, or cell surface markers, in conjunction with a DNA label.
- cytosolic volume markers include the following:
- Cells are stained live or after fixation and the cell area can be measured.
- live cells stained with DiIC16 have homogeneously labeled plasma membranes, and the projected cross-sectional area of the cell is uniformly discriminated from background by fluorescence intensity of the dye.
- Live cells stained with cytosolic stains such as CMFDA produce a fluorescence intensity that is proportional to cell thickness.
- cell labeling is dimmer in thin regions of the cell, total cell area can be discriminated from background.
- Fixed cells can be stained with cytoskeletal markers such as ALEXATM 488 phalloidin that label polymerized actin. Phalloidin does not homogeneously stain the cytoplasm, but still permits discrimination of the total cell area from background.
- this translocation ratio was calculated from data obtained from at least 200 cells at each concentration of dexamethasone tested. Drug-induced translocation of GFP-hGR from the cytoplasm to the nucleus was therefore correlated with an increase in the translocation ratio.
- fibroblastic cells showed a maximal response in many parameters at 5 ⁇ M paclitaxel, a 500-fold higher dose than SNB-19 cells. Furthermore, the L-929 cells did not show a sharp decrease in mitochondrial potential 295 at any of the paclitaxel concentrations tested. This result is consistent with the presence of unique apoptosis pathways between a normal and cancer cell line. Therefore, these results indicate that a relatively simple fluorescence labeling protocol can be coupled with the cell screening system of the present invention to produce a high-content screen of key events involved in programmed cell death.
- this translocation ratio is calculated from data obtained from at least 200 cells at each concentration of compound tested. Drug-induced translocation of Caspase-GFP from the cytoplasm to the nucleus is therefore correlated with an increase in the translocation ratio.
- Molecular interaction libraries including, but not limited to those comprising putative activators or inhibitors of apoptosis-activated enzymes are use to screen the indicator cell lines and identify a specific ligand for the DAS, and a pathway activated by compound activity.
- Cells are incubated with the calcium phosphate-DNA precipitate for 4-5 hours at 37°C and 5% CO 2 , and washed 3-4 times with DMEM to remove the precipitate, followed by the addition of C-DMEM.
- Lipofectamine transfections are performed in serum-free DMEM without antibiotics according to the manufacturer's instructions. Following a 2-3 hour incubation with the DNA-liposome complexes, the medium is removed and replaced with C-DMEM. All transfected cells in 96-well microtiter plates are incubated at 33°C and 5% CO 2 for 24-48 hours prior to drug treatment. Experiments are performed with the receptor expressed transiently in HeLa cells.
- MAP4 is fused to a modified version of the Aequorea victoria green fluorescent protein (GFP).
- GFP Aequorea victoria green fluorescent protein
- a DNA construct has been made which consists of a fusion between the EGFP coding sequence (available from Clontech) and the coding sequence for mouse MAP4. (Olson et al., (1995), J. Cell Biol. 130(3): 639-650).
- MAP4 is a ubiquitous microtubule-associated protein that is known to interact with microtubules in interphase as well as mitotic cells (Olmsted and Murofushi, (1993), MAP4. In "Guidebook to the Cytoskeleton and Motor Proteins.” Oxford University Press. T. Kreis and R.
- the luminescently labeled protein biosensor of microtubule dynamics is expressed, isolated, and added to the cells to be analyzed via bulk loading techniques, such as microinjection, scrape loading, and impact-mediated loading.
- bulk loading techniques such as microinjection, scrape loading, and impact-mediated loading.
- ⁇ and ⁇ tubulin isoforms, MAP4, MAP2 and/or tau can all be used.
- the protein biosensor is expressed by the cell, and the cell is subsequently contacted with a luminescent label, such as a labeled antibody, that detects the protein biosensor, endogenous levels of a protein antigen, or both.
- a luminescent label that detects ⁇ and ⁇ tubulin isoforms, MAP4, MAP2 and/or tau, can be used.
- microtubule drugs such as paclitaxel, nocodazole, vincristine, or vinblastine.
- the present method provides high-content and combined high throughput-high content cell-based screens for anti-microtubule drugs, particularly as one parameter in a multi-parametric cancer target screen.
- the EGFP-MAP4 construct used herein can also be used as one of the components of a high-content screen that measures multiple signaling pathways or physiological events.
- a combined high throughput and high content screen is employed, wherein multiple cells in each of the locations containing cells are analyzed in a high throughput mode, and only a subset of the locations containing cells are analyzed in a high content mode.
- the high throughput screen can be any screen that would be useful to identify those locations containing cells that should be further analyzed, including, but not limited to, identifying locations with increased luminescence intensity, those exhibiting expression of a reporter gene, those undergoing calcium changes, and those undergoing pH changes.
- Image data can be obtained from either fixed or living indicator cells.
- To extract morphometric data from each of the images obtained the following method of analysis is used:
- kits for analyzing microtubule stability, comprising an expression vector comprising a nucleic acid that encodes a microtubule labeling protein and instructions for using the expression vector for carrying out the methods described above.
- the expression vector further comprises a nucleic acid that encodes a luminescent protein, wherein the microtubule binding protein and the luminescent protein thereof are expressed as a fusion protein.
- the kit may contain an antibody that specifically binds to the microtubule-labeling protein.
- the kit includes cells that express the microtubule labeling protein.
- the cells are transfected with the expression vector.
- the present invention provides automated methods, kits, and computer readable media for analyzing neurite outgrowth.
- the methods of this embodiment comprise
- neuronal cells includes any cell population that includes neurons of any type, including, but not limited to, primary cultures of brain cells that contain neurons, isolated cell cultures comprising primary neuronal cells, neuronal precursor cells, tissue culture cells that are used as models of neurons (such as PC12 cells, which are a neoplastic neuronal cell line cloned from rat pheochromocytoma), or mixtures thereof.
- neuron refers to any processes and/or structures that grow from a neuron's cell body including but not limited to axons, dendrites, neurites, intermediate segments, terminal segments, filopodia and growth cones.
- This embodiment of the invention can be used to discover compounds that affect (positively or negatively) neurite outgrowth from neuronal cells, as well to identify conditions that are toxic to neurons and affect their neurites' morphology, including without limitation neurite length, number, and branching.
- the method would comprise identifying compounds that degrade neurites, or identifying test compounds that inhibit the activity of known neurotoxins.
- the method further comprises contacting the cells with a control compound known to modify neurite outgrowth, and utilizing the calculated changes to determine whether the test stimulus inhibited the control compound from modifying neurite outgrowth in the neurons.
- a control compound known to modify neurite outgrowth known to modify neurite outgrowth
- the calculated changes to determine whether the test stimulus inhibited the control compound from modifying neurite outgrowth in the neurons.
- no test stimulus is added, and the measurements and calculated changes are made after removal of the control compound, to determine the effects of such removal on neurite outgrowth.
- sub-regions of the array of locations are sampled multiple times at intervals to provide kinetic measurement changes in the distribution, environment or activity of the luminescent reporter molecules on or within the cells
- high content or high throughput assays can be used in combination with the present assay, to measure the physiological state of the same neurons upon compound treatment.
- Preferred assays for use in a multiparametric assay with the present method are cell viability assays, apoptosis assays, and G-protein coupled receptor (GPCR) and other receptor internalization assays.
- This aspect of the invention provides a way to automatically scan arrays of cell populations treated with different compounds and automatically quantify the neurite outgrowth of the neuronal cells both collectively and individually.
- the neurons do not have to be isolated from a mixture of different cell types or different neuronal cell types to be used in this embodiment, and thus the method can be applied to primary brain cultures.
- the present invention further provides computer readable storage media comprising a program containing a set of instructions for causing a cell screening system to execute the methods of this aspect of the invention, wherein the cell screening system comprises an optical system with a stage adapted for holding a plate containing cells, a means for moving the stage or the optical system, a digital camera, a means for directing light emitted from the cells to the digital camera, and a computer means for receiving and processing the digital data from the digital camera.
- the cell screening system is that disclosed above.
- kits for analyzing neurite outgrowth, or for identifying compounds that modify neurite outgrowth comprising at least one neuron-specific luminescent reporter molecule; at least one nucleus-specific luminescent reporter molecule; and instructions for using the neuron-specific luminescent reporter molecule and the nucleus-specific luminescent reporter molecule to analyze neurite outgrowth, or to identify compounds that modify neurite outgrowth.
- all cells in the sample are labeled with a luminescent reporter molecule marker to identify their locations. Once the cell locations are identified, a cell count can be made.
- the nucleic acid dye Hoechst 33342 is used as a luminescent reporter molecule to identify the nuclei of all the cells.
- other nuclear labels can also be used.
- Nucleic acid fluorescent stains are of two kinds: those that can cross the plasma membrane of live cells, and those that are membrane impermeant. Examples of membrane permeant nucleic acid stains include DAPI, dihydroethidium, hexidium iodide, Hoechst 33258, and the SYTO® dye series (Molecular Probes).
- membrane-impermeant nucleic acid dyes include cyanine nucleic acid labels such as TOTO®, YOYO®, BOBOTM, POPOTM, TO-PRO®, YO-PRO®, BO-PROTM and PO-PROTM (Molecular Probes), ethidium analogs such as ethidium-acridine heterodimer, ethidium bromide, ethidium diazide and ethidium homodimers 1 and 2, propidium iodide, and the green nucleic acid stain SYTOX® (Molecular Probes).
- cyanine nucleic acid labels such as TOTO®, YOYO®, BOBOTM, POPOTM, TO-PRO®, YO-PRO®, BO-PROTM and PO-PROTM (Molecular Probes)
- ethidium analogs such as ethidium-acridine heterodimer, ethidium bromide, ethidium diazide and ethidium homodimers 1 and
- cytoplasm other components of the cells, such as the cytoplasm, can be labeled to identify all of the cells in the culture if the neurons are sparsely plated.
- a nuclear label is used. Examples of some cytoplasmic stains are given below.
- the luminescently labeled nuclei that belong to neurons are identified.
- the neurons are distinguished from the other cells by a neuronal specific luminescent reporter molecule with luminescence of a different wavelength from the nuclei marker and any other cell markers or other luminescent reporter molecules that are being used.
- the nuclei that coincide with the neuron-specific marker are identified as those nuclei in the mixed cell population that belong to neurons. There are many different neuron-specific labeling markers that can be used.
- neuron specific labeling strategies include, but are not limited to: indirect immunofluorescence against neurofilaments, indirect immunofluorescence against ⁇ III-tubulin, and indirect immunofluorescence against neurotrophic factors such as the ciliary neurotrophic factor (CNTF), all being neuron-specific antigens and proteins.
- CNTF ciliary neurotrophic factor
- the cells are luminescently labeled so all of their processes can be visualized, whether the culture consists only of neurons or neuronal-like cells, or neurons in a mixed cell culture. There are several targets on neurons that can be luminescently labeled to allow visualization of the processes:
- a substrate which can be made of any optically clear material, including but not limited to glass, plastic, or silicon wafer, such as a conventional light microscope coverslip.
- a plastic substrate is sufficient for good attachment of the cells.
- the substrate needs to be coated with specific extracellular matrices for good attachment and growth.
- PC12 cells need to be grown on a collagen substrate.
- the compound(s) to be tested are then added to the cells.
- the neuronal cells are luminescently labeled (if they were not previously labeled) and then images are acquired and analyzed automatically to quantify neurite outgrowth, as described below.
- NGF Nerve Growth Factor
- the neuronal cells are first plated onto a substrate as above.
- the cells are treated with the compound to be tested and with a control compound (such as Nerve Growth Factor (NGF)) that is known to stimulate neurite outgrowth, wherein treatment with the control compound is done either before, after, or simultaneously with test compound treatment.
- NGF Nerve Growth Factor
- the neuronal cells are first plated onto a substrate as above, and treated to allow neurite outgrowth.
- the cells could be contacted with NGF, as described above.
- the cells are treated with the condition to be tested for toxicity towards neurons and neurites. Examples of such conditions could be addition of a concentration range of a potentially toxic compound, alteration of a physical parameter critical to the cells' growth, or in some cases, withdrawal of the factor that stimulates neurite outgrowth, such as NGF.
- images are acquired and analyzed automatically, as described below, to quantify the neurite outgrowth.
- neuronal cells When neuronal cells are sparse or do not have a large degree of neurite outgrowth, individual cells can be easily identified. However, as neurites start to grow and the cells start putting out numerous processes, these processes may intersect and the neuronal cells become part of a large cluster of cells. Thus, the entire cell cluster becomes a single connected luminescent entity.
- the different processes and structures that grow from a neuron's cell body include axons, dendrites, neurites, intermediate segments, terminal segments, filopodia and growth cones. For image acquisition and analysis, all of the processes and structures are classified into two groups: (1) the cell body (also known as soma), and (2) the neurites.
- the cell body is the central part of the neuron that contains the nucleus and has a roughly compact, round morphology. All of the outgrowths and processes emerging from the cell body are classified as neurites. A neurite may branch, intersect other neurites or have smaller processes growing from it, all of which are considered as part of their parent neurite for the purpose of image analyses. Thus, a neurite has one origin, which is in the cell body, but may have multiple end points if it branches. The results obtained from applying the present method allow the user to define and classify the neurites according to their classification guidelines.
- axons are defined as the longest continuous neurite from the cell body, neurite segments between 0.7 ⁇ m and 5.1 ⁇ m in length are defined as filopodia, and those longer than 5.1 ⁇ m are called neurites if emerging from the cell body or terminal segments if an end is attached to a neurite (Ramakers et al, 1998, Developmental Brain Research, 108:205-216.
- the neurite outgrowth methods of the present invention perform the following types of analyses:
- the following features of the cells, neurons and neurites are measured and reported: List Of Output Features Reported By The Current Version Of The Neurite Outgrowth Method. Parameter Units Description Neurite Outgrowth Index % Percentage of neurons that are positive for neurite outgrowth (i.e. percentage of neurons whose summed neurite lengths are greater than a user entered minimum length threshold). Degree of Outgrowth Number
- the neuron's form factor is used as a measure of the degree of neurite outgrowth.
- the form factor is the square of the cell's perimeter divided by 4 ⁇ times its area. It is 1 for a circle, a little larger than 1 for cells without outgrowth, and much larger for cells with significant outgrowth and branching.
- This parameter is influenced by the number of neurites, their lengths, as well as their branching.
- the reported parameter is the mean form factor for all identified neurons and unresolved neuronal clusters.
- a cell is identified as a neuron if the intensity of the neuronal stain colocalized with a dilated nuclear mask is greater than a user entered minimum intensity threshold.
- Number of Positive Neurons Number Number of positive neurons. Positive neurons are neurons whose summed neurite lengths are greater than a user entered minimum length threshold.
- Neurite Length per Positive Neuron Number of neurites from positive neurons normalized by the number of positive neurons.
- Neurite Length per Positive Neuron ⁇ m Neurite length per positive neuron. Sum of neurite lengths from positive neurons normalized by the number of positive neurons.
- Neurite Length per Neurite ⁇ m Neurite length per neurite. Sum of neurite lengths from positive neurons normalized by the number of neurites from positive neurons
- the above features can be combined (such as to normalize one feature with the other, or to correlate two or more features) to be reported as new features.
- pixels may be divided into separate groups where the separate groups satisfy certain properties: 1) no group contains a pixel that is 8-connected to any pixel of any other group. 2) any two pixels within a group contain a path connecting them that passes through only pixels of that group.
- the groups satisfying these properties are termed connected components of the image.
- the Form Factor will be close to 1. As neurite outgrowth occurs and the cell or cell cluster becomes more branched, the value of this FF measure increases. The average FF over the entire imaged field can be computed to give the degree of neurite outgrowth over the whole well. In addition, the degree of neurite outgrowth for individual neurons or neuronal-cell clusters can also be determined by their individual FF.
- a background compensation filter can be applied to the image. This stage removes low spatial frequency variations from the image.
- One strategy of doing this is to subtract the background intensity from a neighborhood around each pixel.
- Branch Identification A branch is a point when a neurite growing from the main cell body splits into more than one (usually two) neurite segments growing from the neurites.
- the branch-point or triple-point is the junction where a single branch splits into two or multiple branches. The image is analyzed to find and count branch points.
- a nuclear channel image Two images are provided as input to the method: a nuclear channel image and a neurite channel image.
- the nuclear channel image the cells' nuclei are labeled with Hoechst 33342 or some other fluorescent or luminescent nuclear stain.
- the neurite channel image the neuronal cell body, and its attached neurites are fluorescently or luminescently labeled.
- the initialization phase commences with an optional background compensation on both the nucleus and neuron images.
- the background compensation stage is applied in order to reduce the effect of uneven illumination and to improve detection.
- a binary image is generated for both the nuclear channel image and the neurite channel image by application of a threshold; auto-thresholding is the preferred method as it does not require user input.
- a binary image is generated from the nuclear channel image by the application of an auto-threshold.
- One connected component is present in this kernel image per neuronal nucleus or nuclear clump.
- the location coordinate of each nucleus is determined by first applying the binary kernel image as a mask over the background-compensated nuclear image, and then using a peak-detection routine to select the pixel which has the peak maximum intensity. This pixel is tagged as the position coordinate for each nucleus.
- a binary reservoir image is generated from the neurite channel image by the application of an auto-threshold.
- the pixels in this reservoir image will generally be a superset of the pixels in the nuclear kernel image.
- Nfront is the number of pixels that would be added to the connected component by a simple (unconditional) dilation, which is just dilation by an additional pixel. Nfront can be thought of as the new perimeter, measured in number of pixels, of the object due to the latest dilation. Nadded is the number of pixels that are actually added by the conditional dilation - conditional because after a one pixel dilation, only those pixels in the new perimeter which are positive in the reservoir image are counted.
- the next step is to identify the neurites extending from each cell body. For this, one conditional dilation is performed on the kernel image in order to identify each neurite stub.
- the term dilation image describes the image containing only the positive binary pixels added by a dilation.
- Each connected component in the dilation image is termed a node.
- Each node is used to initialize a one-node neurite data structure.
- a neurite data structure is intended to represent the physical neurite as it extends outward from the neuronal cell body, potentially containing multiple branches and potentially joining with other neurites.
- PC6-3 cells (a sub-clone of PC12 cells) were grown on 96-well microplates whose wells had been coated with collagen. The wells contained different concentrations of NGF (nerve growth factor) (0-1000 ng/ml) to stimulate neurite outgrowth. A control population did not contain NGF. After two days, the cells were fixed and indirect immunofluorescence was performed against ⁇ III-tubulin, using a rabbit anti- ⁇ III-tubulin primary antibody and an ALEXAFLUORTM 488 conjugated goat anti-rabbit secondary antibody (Molecular Probes). The cells were then fixed in 3.7% formaldehyde for 20 minutes, and the fixative solution also contained 10 ⁇ g/ml Hoechst 33342 to label their nuclei.
- NGF nerve growth factor
- PC12 cells were grown for 7 days in the presence of 1 ⁇ g/ml NGF on 96 well microplates with collagen-IV coated wells. Varying concentrations of dopamine were added for 3 hours before the cells were fixed in 3.7% formaldehyde for 20 minutes; the fixative solution also contained 10 ⁇ g/ml Hoechst 33342. The cells were stained by indirect immunofluorescence using a rabbit primary antibody against ⁇ III-tubulin, and an ALEXAFLUORTM 488 conjugated goat anti-rabbit secondary antibody. The cells were imaged on the cell screening system of the present invention, and then analyzed with the prototype method described above. Results given below are for the Neurite Outgrowth Index (see Table 2) as a function of dopamine concentration.
- the method measures the percentage of cells in a field that are in a particular state, in this case, those that are neurons in a culture containing a mixed population of cell types.
- a Positive State means that the cell is brightly fluorescent, and a Negative State means that the cell has little or no fluorescence.
- a neuron-specific reporter molecule When a neuron-specific reporter molecule is used, a Positive State occurs for every neuronal cell, and a Negative State for all other cells.
- two images are captured per field as discussed above. The number of cells in a Positive State is compared to the total number of all cells to obtain the percentage of Positive State cells in a field.
- Two control wells are used: a sample where all the cells are in the Positive State, and a sample where all cells are in the Negative State.
- the Positive State cells are brightly labeled and the Negative State cells are not.
- all images can be background compensated by subtracting the' local average intensity over a user determined area.
- a threshold is set to minimize the variance of the intensity distributions of the non-cell background and the cells.
- a threshold is set to minimize the variance of the intensity distributions of the non-cell background and the cells.
- the Positive State detection threshold is set as a weighted sum of the thresholds computed from the control images.
- the nuclear image is background compensated by subtraction of local average.
- a threshold is applied to the image.
- the image has a bimodal intensity distribution due to the dim pixels from the non-cell background and the brighter pixels associated with cells.
- the threshold is set to minimize the variance of these two distributions. 8-Connected components are labeled and counted. This identifies the area covered by each nucleus, and sets each individual nucleus's mask.
- the 8-connected components of the nucleus mask image are labeled.
- the image where Positive State cells are luminescently labeled is background compensated by subtraction of the local average. Positive State cells are then selected by means of a fixed or autothreshold (selection of pixels above Positive State detection threshold).
- the positive cells are then identified by either the "Morphological" or "Blob Analysis” method:
- the number of detected nuclei and the number of nuclei in the Positive State are saved and reported.
- the total integrated intensity and the average intensity per pixel can also be reported.
- the neurite outgrowth methods are applied to the Positive State neuronal cells to quantify and characterize their neurite outgrowth.
- the Positive State nuclei are used to index and track the Positive State cells.
- FF Form Factor
- Triple Point Characterization Image acquisition can be expanded to include a feature that further characterizes the triple points.
- the triple points may be places where neurites from different cells intersect. If a connection is made between these different neurites, certain proteins that are characteristic of these connections may be expressed. Examples may be synaptic vesicle proteins such as synaptobrevin. Immunofluorescence against these proteins using a fluorophore with a spectra distinguishable from other used in the assay allows determination of whether a connection has been made. Comparison with the neuronal luminescent label to determine whether a triple point is indeed co-localized with the immunofluorescence against the protein characterizes the triple point and measures and quantifies whether inter-neurite connections are being made.
- PC12 cells were grown on 96-well microplates whose wells had been coated with collagen. Some of the wells contained NGF (nerve growth factor) (0.5-1 ⁇ g/ml) to stimulate neurite outgrowth. A control population did not contain NGF. After two days, the cells were labeled with CMFDA according to the manufacturer's instructions. The cells were then fixed in 3.7% formaldehyde for 10 minutes, and the fixative solution also contained 10 ⁇ g/ml Hoechst 33342 to label their nuclei. The cells were imaged on the cell screening system of the present invention and then analyzed with a prototype method described above. First, the cells From Factors were calculated. Condition Mean form factor +/- sem + NGF 18.43 +/1 4.57 -NGF 1.33 +/- 0.05
- the images of the probes used to mark the plasma membrane and cytoplasm are used to mask the image of the immunological probe marking the location of intracellular Rho protein.
- the integrated brightness per unit area under each mask is used to form a translocation quotient by dividing the plasma membrane integrated brightness/area by the cytoplasmic integrated brightness/area. By comparing the translocation quotient values from control and experimental wells, the percent translocation is calculated for each potential lead compound.
- the translocation of ⁇ -arrestin protein from the cytoplasm to the plasma membrane is measured in response to cell treatment.
- living indicator cells containing luminescent domain markers are treated with test compounds and the movement of the ⁇ -arrestin marker is measured in time and space using the cell screening system of the present invention.
- the indicator cells contain luminescent markers consisting of a green fluorescent protein ⁇ -arrestin (GFP- ⁇ -arrestin) protein chimera (Barak et al. (1997), J. Biol. Chem. 272:27497-27500; Daaka et al. (1998), J. Biol. Chem.
- the indicator cells that is expressed by the indicator cells through the use of transient or stable cell transfection and other reporters used to mark cytoplasmic and membrane domains.
- the domain marker molecules partition predominately in the plasma membrane or in the cytoplasm. In the high-content screen, these markers are used to delineate the cell cytoplasm and plasma membrane in distinct channels of fluorescence.
- the indicator cells are treated with a test compound, the dynamic redistribution of the GFP- ⁇ -arrestin is recorded as a series of images over a time scale ranging from 0.1 s to 10 h. In a preferred embodiment, the time scale is 1 h.
- an endoplasmic reticulum to Golgi translocation high-content screen the translocation of a VSVG protein from the ts045 mutant strain of vesicular stomatitis virus (Ellenberg et al. (1997), J. Cell Biol . 138:1193-1206; Presley et al. (1997) Nature 389:81-85) from the endoplasmic reticulum to the Golgi domain is measured in response to cell treatment.
- indicator cells containing luminescent reporters are treated with test compounds and the movement of the reporters is measured in space and time using the cell screening system of the present invention.
- the indicator cells contain luminescent reporters consisting of a GFP-VSVG protein chimera that is expressed by the indicator cell through the use of transient or stable cell transfection and other domain markers used to measure the localization of the endoplasmic reticulum and Golgi domains.
- the GFP-VSVG protein chimera molecules are partitioned predominately in the endoplasmic reticulum.
- domain markers of distinct colors used to delineate the endoplasmic reticulum and the Golgi domains in distinct channels of fluorescence.
- the reporter of intracellular enzyme activity is fructose-6-phosphate, 2-kinase/fructose-2,6-bisphosphatase (PFK-2), a regulatory enzyme whose phosphorylation state indicates intracellular carbohydrate anabolism or catabolism (Deprez et al. (1997) J. Biol. Chem. 272:17269-17275; Kealer et al. (1996) FEBS Letters 395:225-227; Lee et al. (1996), Biochemistry 35:6010-6019).
- the indicator cells contain luminescent reporters consisting of a fluorescent protein biosensor of PFK-2 phosphorylation.
- the fluorescent protein biosensor is constructed by introducing an environmentally sensitive fluorescent dye near to the known phosphorylation site of the enzyme (Deprez et al. (1997), supra; Giuliano et al. (1995), supra ).
- the dye can be of the ketocyanine class (Kessler and Wolfbeis (1991), Spectrochimica Acta 47A:187-192) or any class that contains a protein reactive moiety and a fluorochrome whose excitation or emission spectrum is sensitive to solution polarity.
- the fluorescent protein biosensor is introduced into the indicator cells using bulk loading methodology.
- Living indicator cells are treated with test compounds, at final concentrations ranging from 10 -12 M to 10 -3 M for times ranging from 0.1 s to 10 h.
- ratio image data are obtained from living treated indicator cells by collecting a spectral pair of fluorescence images at each time point. To extract morphometric data from each time point, a ratio is made between each pair of images by numerically dividing the two spectral images at each time point, pixel by pixel. Each pixel value is then used to calculate the fractional phosphorylation of PFK-2. At small fractional values of phosphorylation, PFK-2 stimulates carbohydrate catabolism. At high fractional values of phosphorylation, PFK-2 stimulates carbohydrate anabolism.
- Protein kinase A activity and localization of subunits are measured in response to treatment with test compounds.
- PKA protein kinase A
- the indicator cells contain luminescent reporters including a fluorescent protein biosensor of PKA activation.
- the fluorescent protein biosensor is constructed by introducing an environmentally sensitive fluorescent dye into the catalytic subunit of PKA near the site known to interact with the regulatory subunit of PKA (Harootunian et al. (1993), Mol. Biol. of the Cell 4:993-1002; Johnson et al. (1996), Cell 85:149-158; Giuliano et al. (1995), supra ) .
- the dye can be of the ketocyanine class (Kessler, and Wolfbeis (1991), Spectrochimica Acta 47A:187-192) or any class that contains a protein reactive moiety and a fluorochrome whose excitation or emission spectrum is sensitive to solution polarity.
- the fluorescent protein biosensor of PKA activation is introduced into the indicator cells using bulk loading methodology.
- living indicator cells are treated with test compounds, at final concentrations ranging from 10 -12 M to 10 -3 M for times ranging from 0.1 s to 10 h.
- ratio image data are obtained from living treated indicator cells. To extract biosensor data from each time point, a ratio is made between each pair of images, and each pixel value is then used to calculate the fractional activation of PKA (e.g. , separation of the catalytic and regulatory subunits after cAMP binding). At high fractional values of activity, PFK-2 stimulates biochemical cascades within the living cell.
- indicator cells containing luminescent reporters are treated with test compounds and the movement of the reporters is measured in space and time using the cell screening system.
- the indicator cells contain luminescent reporters consisting of domain markers used to measure the localization of the cytoplasmic and nuclear domains.
- the dynamic redistribution of a PKA fluorescent protein biosensor is recorded intracellularly as a series of images over a time scale ranging from 0.1 s to 10 h. Each image is analyzed by a method that quantifies the movement of the PKA between the cytoplasmic and nuclear domains.
- the images of the probes used to mark the cytoplasmic and nuclear domains are used to mask the image of the PKA fluorescent protein biosensor.
- the integrated brightness per unit area under each mask is used to form a translocation quotient by dividing the cytoplasmic integrated brightness/area by the nuclear integrated brightness/area.
- the percent translocation is calculated for each potential lead compound.
- the output of the high-content screen relates quantitative data describing the magnitude of the translocation within a large number of individual cells that have been treated with test compound in the concentration range of 10 -12 M to 10 -3 M.
- Cytoskeletal protein transcription and message localization Regulation of the general classes of cell physiological responses including cell-substrate adhesion, cell-cell adhesion, signal transduction, cell-cycle events, intermediary and signaling molecule metabolism, cell locomotion, cell-cell communication, and cell death can involve the alteration of gene expression. High-content screens can also be designed to measure this class of physiological response.
- the reporter of intracellular gene expression is an oligonucleotide that can hybridize with the target mRNA and alter its fluorescence signal.
- the oligonucleotide is a molecular beacon (Tyagi and Kramer (1996) Nat. Biotechnol . 14:303-308), a luminescence-based reagent whose fluorescence signal is dependent on intermolecular and intramolecular interactions.
- the fluorescent biosensor is constructed by introducing a fluorescence energy transfer pair of fluorescent dyes such that there is one at each end (5' and 3') of the reagent.
- the dyes can be of any class that contains a protein reactive moiety and fluorochromes whose excitation and emission spectra overlap sufficiently to provide fluorescence energy transfer between the dyes in the resting state, including, but not limited to, fluorescein and rhodamine (Molecular Probes, Inc.).
- fluorescein and rhodamine Molecular Probes, Inc.
- a portion of the message coding for ⁇ -actin (Kislauskis et al. (1994), J. Cell Biol . 127:441-451; McCann et al. (1997), Proc. Natl. Acad. Sci.
- living indicator cells are treated with test compounds, at final concentrations ranging from 10 -12 M to 10 -3 M for times ranging from 0.1 s to 10 h.
- ratio image data are obtained from living treated indicator cells. To extract morphometric data from each time point, a ratio is made between each pair of images, and each pixel value is then used to calculate the fractional hybridization of the labeled nucleotide. At small fractional values of hybridization little expression of ⁇ -actin is indicated. At high fractional values of hybridization, maximal expression of ⁇ -actin is indicated. Furthermore, the distribution of hybridized molecules within the cytoplasm of the indicator cells is also a measure of the physiological response of the indicator cells.
- the integrated intensity from the masked insulin image is compared to a set of images containing known amounts of labeled insulin.
- the amount of insulin bound to the cell is determined from the standards and used in conjunction with the total concentration of insulin incubated with the cell to calculate a dissociation constant or insulin to its cell surface receptor.
- Whole cell labeling is accomplished by labeling cellular components such that dynamics of cell shape and motility of the cell can be measured over time by analyzing fluorescence images of cells.
- small reactive fluorescent molecules are introduced into living cells. These membrane-permeant molecules both diffuse through and react with protein components in the plasma membrane. Dye molecules react with intracellular molecules to both increase the fluorescence signal emitted from each molecule and to entrap the fluorescent dye within living cells. These molecules include reactive chloromethyl derivatives of aminocoumarins, hydroxycoumarins, eosin diacetate, fluorescein diacetate, some Bodipy dye derivatives, and tetramethylrhodamine. The reactivity of these dyes toward macromolecules includes free primary amino groups and free sulfhydryl groups.
- the cell surface is labeled by allowing the cell to interact with fluorescently labeled antibodies or lectins (Sigma Chemical Company, St. Louis, MO) that react specifically with molecules on the cell surface.
- fluorescently labeled antibodies or lectins Sigma Chemical Company, St. Louis, MO
- Cell surface protein chimeras expressed by the cell of interest that contain a green fluorescent protein, or mutant thereof, component can also be used to fluorescently label the entire cell surface.
- labeling the whole plasma membrane employs some of the same methodology described above for labeling the entire cells.
- Luminescent molecules that label the entire cell surface act to delineate the plasma membrane.
- ligands that are transported into cells by receptor-mediated endocytosis are used to trace the dynamics of endosomal organelles.
- labeled ligands include Bodipy FL-labeled low density lipoprotein complexes, tetramethylrhodamine transferrin analogs, and fluorescently labeled epidermal growth factor (Molecular Probes, Inc.)
- cell permeant fluorescent dyes (Molecular Probes, Inc.) with a reactive group are reacted with living cells.
- Reactive dyes including monobromobimane, 5-chloromethylfluorescein diacetate, carboxy fluorescein diacetate succinimidyl ester, and chloromethyl tetramethylrhodamine are examples of cell permeant fluorescent dyes that are used for long term labeling of the cytoplasm of cells.
- polar tracer molecules such as Lucifer yellow and cascade blue-based fluorescent dyes (Molecular Probes, Inc.) are introduced into cells using bulk loading methods and are also used for cytoplasmic labeling.
- antibodies against cytoplasmic components are used to fluorescently label the cytoplasm.
- cytoplasmic antigens are many of the enzymes involved in intermediary metabolism. Enolase, phosphofructokinase, and acetyl-CoA dehydrogenase are examples of uniformly distributed cytoplasmic antigens.
- protein chimeras consisting of a cytoplasmic protein genetically fused to an intrinsically luminescent protein such as the green fluorescent protein, or mutants thereof, are used to label the cytoplasm.
- fluorescent chimeras of uniformly distributed proteins are used to label the entire cytoplasmic domain. Examples of these proteins are many of the proteins involved in intermediary metabolism and include enolase, lactate dehydrogenase, and hexokinase.
- antibodies against cytoplasmic antigens are used to label cytoplasmic components that are localized in specific cytoplasmic sub-domains.
- these components are the cytoskeletal proteins actin, tubulin, and cytokeratin.
- a population of these proteins within cells is assembled into discrete structures, which in this case, are fibrous. Fluorescence labeling of these proteins with antibody-based reagents therefore labels a specific sub-domain of the cytoplasm.
- non-antibody-based fluorescently labeled molecules that interact strongly with cytoplasmic proteins are used to label specific cytoplasmic components.
- cytoplasmic components include DNAse I (Molecular Probes, Inc.) Fluorescent analogs of this enzyme bind tightly and specifically to cytoplasmic actin, thus labeling a sub-domain of the cytoplasm.
- fluorescent analogs of the mushroom toxin phalloidin or the drug paclitaxel are used to label components of the actin- and microtubule-cytoskeletons, respectively.
- protein chimeras consisting of a cytoplasmic protein genetically fused to an intrinsically luminescent protein such as the green fluorescent protein, or mutants thereof, are used to label specific domains of the cytoplasm.
- Fluorescent chimeras of highly localized proteins are used to label cytoplasmic sub-domains. Examples of these proteins are many of the proteins involved in regulating the cytoskeleton. They include the structural proteins actin, tubulin, and cytokeratin as well as the regulatory proteins microtubule associated protein 4 and ⁇ -actinin.
- antibodies against nuclear antigens are used to label nuclear components that are localized in specific nuclear domains.
- nuclear antigens are the macromolecules involved in maintaining DNA structure and function.
- DNA, RNA, histones, DNA polymerase, RNA polymerase, lamins, and nuclear variants of cytoplasmic proteins such as actin are examples of nuclear antigens.
- protein chimeras consisting of a nuclear protein genetically fused to an intrinsically luminescent protein such as the green fluorescent protein, or mutants thereof, are used to label the nuclear domain.
- these proteins are many of the proteins involved in maintaining DNA structure and function. Histones, DNA polymerase, RNA polymerase, lamins, and nuclear variants of cytoplasmic proteins such as actin are examples of nuclear proteins.
- membrane permeant mitochondrial-specific luminescent reagents are used to label the mitochondria of living and fixed cells. These reagents include rhodamine 123, tetramethyl rosamine, JC-1, and the MitoTracker reactive dyes.
- antibodies against mitochondrial antigens are used to label mitochondrial components that are localized in specific mitochondrial domains.
- these components are the macromolecules involved in maintaining mitochondrial DNA structure and function.
- DNA, RNA, histones, DNA polymerase, RNA polymerase, and mitochondrial variants of cytoplasmic macromolecules such as mitochondrial tRNA and rRNA are examples mitochondrial antigens.
- Other examples of mitochondrial antigens are the components of the oxidative phosphorylation system found in the mitochondria ( e . g ., cytochrome c, cytochrome c oxidase, and succinate dehydrogenase).
- protein chimeras consisting of a mitochondrial protein genetically fused to an intrinsically luminescent protein such as the green fluorescent protein, or mutants thereof, are used to label the mitochondrial domain.
- these components are the macromolecules involved in maintaining mitochondrial DNA structure and function. Examples include histones, DNA polymerase, RNA polymerase, and the components of the oxidative phosphorylation system found in the mitochondria ( e.g. , cytochrome c, cytochrome c oxidase, and succinate dehydrogenase).
- membrane permeant endoplasmic reticulum-specific luminescent reagents are used to label the endoplasmic reticulum of living and fixed cells.
- These reagents include short chain carbocyanine dyes ( e . g ., DiOC 6 and DiOC 3 ), long chain carbocyanine dyes ( e . g ., DiIC 16 and DiIC 18 ), and luminescently labeled lectins such as concanavalin A.
- antibodies against endoplasmic reticulum antigens are used to label endoplasmic reticulum components that are localized in specific endoplasmic reticulum domains. Examples of these components are the macromolecules involved in the fatty acid elongation systems, glucose-6-phosphatase, and HMG CoA-reductase.
Landscapes
- Health & Medical Sciences (AREA)
- Life Sciences & Earth Sciences (AREA)
- Engineering & Computer Science (AREA)
- Chemical & Material Sciences (AREA)
- Biomedical Technology (AREA)
- Genetics & Genomics (AREA)
- Molecular Biology (AREA)
- Immunology (AREA)
- General Engineering & Computer Science (AREA)
- Biotechnology (AREA)
- Bioinformatics & Cheminformatics (AREA)
- General Health & Medical Sciences (AREA)
- Zoology (AREA)
- Urology & Nephrology (AREA)
- Hematology (AREA)
- Organic Chemistry (AREA)
- Microbiology (AREA)
- Physics & Mathematics (AREA)
- Analytical Chemistry (AREA)
- Biochemistry (AREA)
- Wood Science & Technology (AREA)
- Cell Biology (AREA)
- Plant Pathology (AREA)
- Pathology (AREA)
- Tropical Medicine & Parasitology (AREA)
- Crystallography & Structural Chemistry (AREA)
- Biophysics (AREA)
- General Physics & Mathematics (AREA)
- Bioinformatics & Computational Biology (AREA)
- Toxicology (AREA)
- Investigating Or Analysing Biological Materials (AREA)
- Food Science & Technology (AREA)
- Medicinal Chemistry (AREA)
- Measuring Or Testing Involving Enzymes Or Micro-Organisms (AREA)
- Investigating, Analyzing Materials By Fluorescence Or Luminescence (AREA)
- Apparatus Associated With Microorganisms And Enzymes (AREA)
Applications Claiming Priority (9)
| Application Number | Priority Date | Filing Date | Title |
|---|---|---|---|
| US14744399P | 1999-08-05 | 1999-08-05 | |
| US147443P | 1999-08-05 | ||
| US39896599A | 1999-09-17 | 1999-09-17 | |
| US398965 | 1999-09-17 | ||
| US17658900P | 2000-01-18 | 2000-01-18 | |
| US176589P | 2000-01-18 | ||
| US20569600P | 2000-05-19 | 2000-05-19 | |
| US205696P | 2000-05-19 | ||
| PCT/US2000/021416 WO2001011340A1 (en) | 1999-08-05 | 2000-08-04 | Optical system analysis of cells |
Publications (2)
| Publication Number | Publication Date |
|---|---|
| EP1203214A1 EP1203214A1 (en) | 2002-05-08 |
| EP1203214B1 true EP1203214B1 (en) | 2005-11-09 |
Family
ID=27495764
Family Applications (1)
| Application Number | Title | Priority Date | Filing Date |
|---|---|---|---|
| EP00952549A Expired - Lifetime EP1203214B1 (en) | 1999-08-05 | 2000-08-04 | Optical system analysis of cells |
Country Status (8)
| Country | Link |
|---|---|
| EP (1) | EP1203214B1 (ja) |
| JP (2) | JP2003506711A (ja) |
| AT (1) | ATE309528T1 (ja) |
| AU (1) | AU6522300A (ja) |
| CA (1) | CA2381344C (ja) |
| DE (1) | DE60023905T2 (ja) |
| IL (1) | IL147793A0 (ja) |
| WO (1) | WO2001011340A1 (ja) |
Cited By (1)
| Publication number | Priority date | Publication date | Assignee | Title |
|---|---|---|---|---|
| US10142566B2 (en) | 2013-02-01 | 2018-11-27 | Hamamatsu Photonics K.K. | Rolling readout type camera and imaging method for using the same |
Families Citing this family (51)
| Publication number | Priority date | Publication date | Assignee | Title |
|---|---|---|---|---|
| US5989835A (en) | 1997-02-27 | 1999-11-23 | Cellomics, Inc. | System for cell-based screening |
| JP3076568B1 (ja) * | 1999-07-15 | 2000-08-14 | 株式会社鈴木 | 電子部品用フイルムの孔明け加工方法 |
| US6986993B1 (en) | 1999-08-05 | 2006-01-17 | Cellomics, Inc. | System for cell-based screening |
| AU2073801A (en) | 1999-12-09 | 2001-06-18 | Cellomics, Inc. | A system for cell-based screening |
| WO2002041064A1 (en) | 2000-11-17 | 2002-05-23 | Universal Imaging Corporation | Rapidly changing dichroic beamsplitter |
| ATE267396T1 (de) | 2000-12-22 | 2004-06-15 | Cellomics Inc | Identifizierung von zellen während kinetischer versuchsreihen |
| US6636623B2 (en) * | 2001-08-10 | 2003-10-21 | Visiongate, Inc. | Optical projection imaging system and method for automatically detecting cells with molecular marker compartmentalization associated with malignancy and disease |
| US8227240B2 (en) | 2001-08-14 | 2012-07-24 | The Washington University | Systems for screening pharmaceutical chemicals |
| JP2003093041A (ja) * | 2001-09-25 | 2003-04-02 | Hamamatsu Photonics Kk | 培養試料観察装置 |
| AU2002357791B9 (en) * | 2001-12-05 | 2008-09-25 | The J. David Gladstone Institutes | Robotic microscopy systems |
| AU2003230069B2 (en) * | 2002-05-14 | 2008-11-13 | Molecular Devices, Llc | System and methods for rapid and automated screening of cells |
| GB0211072D0 (en) * | 2002-05-15 | 2002-06-26 | Amersham Biosciences Uk Ltd | Reagent and method for the determination of changes in a cellular morphological parameter |
| JP3908135B2 (ja) * | 2002-09-09 | 2007-04-25 | オリンパス株式会社 | 生化学的検査用画像処理方法 |
| AU2003900924A0 (en) | 2003-02-28 | 2003-03-13 | Medsaic Pty Ltd | Imaging device |
| GB0317679D0 (en) * | 2003-07-29 | 2003-09-03 | Amersham Biosciences Uk Ltd | Analysing biological entities |
| WO2005039396A2 (en) * | 2003-10-22 | 2005-05-06 | Medtrain Technologies, Llc | Tissue engineered construct analytical imaging system and method of obtaining and analyzing images of tissue engineered constructs |
| CA2572390A1 (en) * | 2004-06-30 | 2006-08-31 | Chemimage Corporation | Spectroscopic methods for component particle analysis |
| CN101268355A (zh) * | 2005-09-21 | 2008-09-17 | 卢米尼克斯股份有限公司 | 图像数据处理的方法和系统 |
| US8149416B2 (en) | 2005-10-17 | 2012-04-03 | Arryx, Inc. | Apparatus and method for dynamic cellular probing and diagnostics using holographic optical forcing array |
| WO2007047761A1 (en) * | 2005-10-17 | 2007-04-26 | Arryx, Inc. | Apparatus and method for detecting deformability of cells using spatially modulated optical force microscopy |
| JPWO2007069414A1 (ja) | 2005-12-14 | 2009-05-21 | 国立大学法人 東京大学 | 線状の形態を有する細胞等を解析する方法及び神経細胞解析方法並びにそれら方法を実行する装置及びプログラム |
| JP2007248050A (ja) * | 2006-02-17 | 2007-09-27 | Olympus Corp | 生細胞の微弱光による解析を行なうための細胞の処理方法および解析方法 |
| CN101484806A (zh) | 2006-05-17 | 2009-07-15 | 协乐民公司 | 一种对组织进行自动分析的方法 |
| US7706591B2 (en) | 2006-07-13 | 2010-04-27 | Cellomics, Inc. | Neuronal profiling |
| US8326014B2 (en) * | 2007-09-28 | 2012-12-04 | Cytyc Corporation | Methods and systems for processing biological specimens utilizing multiple wavelengths |
| ITTO20070771A1 (it) * | 2007-10-29 | 2009-04-30 | Silicon Biosystems Spa | Metodo e apparato per la identificazione e manipolazione di particelle |
| CA2726979C (en) | 2008-06-05 | 2017-11-28 | Medical College Of Wisconsin, Inc. | Three dimensional tissues for high-throughput assays |
| IT1391619B1 (it) | 2008-11-04 | 2012-01-11 | Silicon Biosystems Spa | Metodo per l'individuazione, selezione e analisi di cellule tumorali |
| US10895575B2 (en) | 2008-11-04 | 2021-01-19 | Menarini Silicon Biosystems S.P.A. | Method for identification, selection and analysis of tumour cells |
| JP5478084B2 (ja) * | 2009-01-23 | 2014-04-23 | オリンパス株式会社 | 画像処理システム、画像処理装置および画像処理端末 |
| US9567560B2 (en) * | 2009-02-26 | 2017-02-14 | National University Corporation Nagoya University | Incubated state evaluating device, incubated state evaluating method, incubator, and program |
| DE102009021876A1 (de) | 2009-05-19 | 2010-11-25 | Forschungsgesellschaft für Arbeitsphysiologie und Arbeitsschutz e.V. | Verfahren zur Analyse des Neuritenwachstums |
| EP2433123A1 (de) * | 2009-05-19 | 2012-03-28 | Leibniz - Institut für Analytische Wissenschaften - ISAS - E.V. | Verfahren zur analyse des neuritenwachstums |
| DE102010035003B4 (de) * | 2010-08-20 | 2015-08-06 | PicoQuant GmbH. Unternehmen für optoelektronische Forschung und Entwicklung | Räumlich und zeitlich hochauflösende Mikroskopie |
| CA2830501C (en) | 2011-03-17 | 2023-10-17 | Cernostics, Inc. | Systems and compositions for diagnosing barrett's esophagus and methods of using the same |
| JP5720351B2 (ja) * | 2011-03-24 | 2015-05-20 | 横河電機株式会社 | 画像解析方法および画像解析装置 |
| JP5873183B2 (ja) * | 2011-10-18 | 2016-03-01 | ルミネックス コーポレーション | 画像データ処理方法及びシステム |
| CH706326A2 (de) * | 2012-03-14 | 2013-09-30 | Tecan Trading Ag | Verfahren und Mikroplatten-Reader zum Untersuchung von biologischen Zellen oder Zellkulturen. |
| WO2014093838A2 (en) | 2012-12-14 | 2014-06-19 | The J. David Gladstone Institutes | Automated robotic microscopy systems |
| JP6467813B2 (ja) | 2014-08-15 | 2019-02-13 | ソニー株式会社 | 画像処理装置、画像処理プログラム及び画像処理方法 |
| JP6684643B2 (ja) * | 2016-04-28 | 2020-04-22 | 富士フイルム株式会社 | 生体試料評価システムおよび生体試料評価方法並びに生体試料評価制御プログラム |
| JP7316745B2 (ja) * | 2016-05-20 | 2023-07-28 | 株式会社リコー | 三次元組織体 |
| JP7407107B2 (ja) * | 2017-11-10 | 2023-12-28 | ザルトリウス バイオアナリティカル インストゥルメンツ, インコーポレイテッド | 生細胞の視覚化及び分析 |
| JP6986452B2 (ja) * | 2018-01-04 | 2021-12-22 | 浜松ホトニクス株式会社 | 蛍光測定装置および蛍光測定方法 |
| WO2019245005A1 (ja) * | 2018-06-20 | 2019-12-26 | 株式会社 東芝 | 検査デバイス、この検査デバイスの製造方法、この検査デバイスを用いた細胞検出方法、この検査デバイス用セル、この検査デバイス用セルの製造方法、及び検査方法 |
| JP7158220B2 (ja) * | 2018-09-11 | 2022-10-21 | 浜松ホトニクス株式会社 | 測定装置および測定方法 |
| US10564100B1 (en) * | 2018-10-12 | 2020-02-18 | SageMedic Corporation | Analysis of viable and nonviable cells |
| DE102020202610B4 (de) | 2020-02-28 | 2021-09-23 | Gottfried Wilhelm Leibniz Universität Hannover | Verfahren und Vorrichtung zur automatisierten mikroskopischen Analyse von nervenzellhaltigen Proben |
| CN111832191B (zh) * | 2020-07-29 | 2023-06-30 | 南开大学 | 基于生长域的微管内增量式细胞质速度场评估方法 |
| DE102020122605A1 (de) | 2020-08-28 | 2022-03-03 | Abberior Instruments Gmbh | Verfahren, Bildverarbeitungseinheit und Laserscanningmikroskop zum hintergrundreduzierten Abbilden einer Struktur in einer Probe |
| JP7235027B2 (ja) * | 2020-11-16 | 2023-03-08 | 株式会社ニコン | 細胞評価装置、インキュベータおよびプログラム |
Family Cites Families (4)
| Publication number | Priority date | Publication date | Assignee | Title |
|---|---|---|---|---|
| US4998284A (en) * | 1987-11-17 | 1991-03-05 | Cell Analysis Systems, Inc. | Dual color camera microscope and methodology for cell staining and analysis |
| US6060247A (en) * | 1996-11-18 | 2000-05-09 | Mcgill University | Post-mitotic neurons containing adenovirus vectors that modulate apoptosis and growth |
| CA2282658C (en) * | 1997-02-27 | 2003-02-25 | Cellomics, Inc. | A system for cell-based screening |
| AU745911B2 (en) * | 1997-07-17 | 2002-04-11 | Myelos Corporation | Prosaposin receptor assay |
-
2000
- 2000-08-04 DE DE60023905T patent/DE60023905T2/de not_active Expired - Lifetime
- 2000-08-04 AT AT00952549T patent/ATE309528T1/de not_active IP Right Cessation
- 2000-08-04 AU AU65223/00A patent/AU6522300A/en not_active Abandoned
- 2000-08-04 EP EP00952549A patent/EP1203214B1/en not_active Expired - Lifetime
- 2000-08-04 JP JP2001515947A patent/JP2003506711A/ja active Pending
- 2000-08-04 WO PCT/US2000/021416 patent/WO2001011340A1/en active IP Right Grant
- 2000-08-04 IL IL14779300A patent/IL147793A0/xx unknown
- 2000-08-04 CA CA002381344A patent/CA2381344C/en not_active Expired - Lifetime
-
2004
- 2004-09-02 JP JP2004255895A patent/JP4693382B2/ja not_active Expired - Lifetime
Cited By (1)
| Publication number | Priority date | Publication date | Assignee | Title |
|---|---|---|---|---|
| US10142566B2 (en) | 2013-02-01 | 2018-11-27 | Hamamatsu Photonics K.K. | Rolling readout type camera and imaging method for using the same |
Also Published As
| Publication number | Publication date |
|---|---|
| JP2005095172A (ja) | 2005-04-14 |
| ATE309528T1 (de) | 2005-11-15 |
| CA2381344C (en) | 2007-01-23 |
| DE60023905T2 (de) | 2006-07-27 |
| EP1203214A1 (en) | 2002-05-08 |
| DE60023905D1 (de) | 2005-12-15 |
| AU6522300A (en) | 2001-03-05 |
| JP2003506711A (ja) | 2003-02-18 |
| JP4693382B2 (ja) | 2011-06-01 |
| CA2381344A1 (en) | 2001-02-15 |
| IL147793A0 (en) | 2002-08-14 |
| WO2001011340A1 (en) | 2001-02-15 |
Similar Documents
| Publication | Publication Date | Title |
|---|---|---|
| EP1203214B1 (en) | Optical system analysis of cells | |
| US8062856B2 (en) | System for cell-based screening | |
| US6716588B2 (en) | System for cell-based screening | |
| US6671624B1 (en) | Machine readable storage media for detecting distribution of macromolecules between nucleus and cytoplasm in cells | |
| US6727071B1 (en) | System for cell-based screening | |
| US7117098B1 (en) | Machine-readable storage medium for analyzing distribution of macromolecules between the cell membrane and the cell cytoplasm | |
| US20040063162A1 (en) | System for cell-based screening | |
| EP1131471B1 (en) | A system for cell-based screening | |
| WO2000017643A9 (en) | A system for cell-based screening | |
| WO1998038490A9 (en) | A system for cell-based screening | |
| US20040101912A1 (en) | System for cell-based screening | |
| WO2001011341A2 (en) | A system for cell-based screening | |
| WO2001035072A2 (en) | A system for cell-based screening | |
| WO2000070342A2 (en) | Optical system analysis of cells | |
| WO2000079241A2 (en) | A system for cell-based screening | |
| EP1439384B1 (en) | A system for screening biological cells | |
| AU773088B2 (en) | A system for cell-based screening | |
| MXPA01002684A (en) | A system for cell-based screening |
Legal Events
| Date | Code | Title | Description |
|---|---|---|---|
| PUAI | Public reference made under article 153(3) epc to a published international application that has entered the european phase |
Free format text: ORIGINAL CODE: 0009012 |
|
| 17P | Request for examination filed |
Effective date: 20020228 |
|
| AK | Designated contracting states |
Kind code of ref document: A1 Designated state(s): AT BE CH CY DE DK ES FI FR GB GR IE IT LI LU MC NL PT SE |
|
| AX | Request for extension of the european patent |
Free format text: AL;LT;LV;MK;RO;SI |
|
| 17Q | First examination report despatched |
Effective date: 20021128 |
|
| GRAP | Despatch of communication of intention to grant a patent |
Free format text: ORIGINAL CODE: EPIDOSNIGR1 |
|
| GRAS | Grant fee paid |
Free format text: ORIGINAL CODE: EPIDOSNIGR3 |
|
| GRAA | (expected) grant |
Free format text: ORIGINAL CODE: 0009210 |
|
| AK | Designated contracting states |
Kind code of ref document: B1 Designated state(s): AT BE CH CY DE DK ES FI FR GB GR IE IT LI LU MC NL PT SE |
|
| PG25 | Lapsed in a contracting state [announced via postgrant information from national office to epo] |
Ref country code: IT Free format text: LAPSE BECAUSE OF FAILURE TO SUBMIT A TRANSLATION OF THE DESCRIPTION OR TO PAY THE FEE WITHIN THE PRESCRIBED TIME-LIMIT;WARNING: LAPSES OF ITALIAN PATENTS WITH EFFECTIVE DATE BEFORE 2007 MAY HAVE OCCURRED AT ANY TIME BEFORE 2007. THE CORRECT EFFECTIVE DATE MAY BE DIFFERENT FROM THE ONE RECORDED. Effective date: 20051109 Ref country code: FI Free format text: LAPSE BECAUSE OF FAILURE TO SUBMIT A TRANSLATION OF THE DESCRIPTION OR TO PAY THE FEE WITHIN THE PRESCRIBED TIME-LIMIT Effective date: 20051109 Ref country code: BE Free format text: LAPSE BECAUSE OF FAILURE TO SUBMIT A TRANSLATION OF THE DESCRIPTION OR TO PAY THE FEE WITHIN THE PRESCRIBED TIME-LIMIT Effective date: 20051109 Ref country code: AT Free format text: LAPSE BECAUSE OF FAILURE TO SUBMIT A TRANSLATION OF THE DESCRIPTION OR TO PAY THE FEE WITHIN THE PRESCRIBED TIME-LIMIT Effective date: 20051109 Ref country code: NL Free format text: LAPSE BECAUSE OF FAILURE TO SUBMIT A TRANSLATION OF THE DESCRIPTION OR TO PAY THE FEE WITHIN THE PRESCRIBED TIME-LIMIT Effective date: 20051109 |
|
| REG | Reference to a national code |
Ref country code: GB Ref legal event code: FG4D |
|
| REG | Reference to a national code |
Ref country code: CH Ref legal event code: EP |
|
| REG | Reference to a national code |
Ref country code: IE Ref legal event code: FG4D |
|
| REF | Corresponds to: |
Ref document number: 60023905 Country of ref document: DE Date of ref document: 20051215 Kind code of ref document: P |
|
| PG25 | Lapsed in a contracting state [announced via postgrant information from national office to epo] |
Ref country code: GR Free format text: LAPSE BECAUSE OF FAILURE TO SUBMIT A TRANSLATION OF THE DESCRIPTION OR TO PAY THE FEE WITHIN THE PRESCRIBED TIME-LIMIT Effective date: 20060209 Ref country code: DK Free format text: LAPSE BECAUSE OF FAILURE TO SUBMIT A TRANSLATION OF THE DESCRIPTION OR TO PAY THE FEE WITHIN THE PRESCRIBED TIME-LIMIT Effective date: 20060209 |
|
| PG25 | Lapsed in a contracting state [announced via postgrant information from national office to epo] |
Ref country code: ES Free format text: LAPSE BECAUSE OF FAILURE TO SUBMIT A TRANSLATION OF THE DESCRIPTION OR TO PAY THE FEE WITHIN THE PRESCRIBED TIME-LIMIT Effective date: 20060220 |
|
| REG | Reference to a national code |
Ref country code: SE Ref legal event code: TRGR |
|
| PG25 | Lapsed in a contracting state [announced via postgrant information from national office to epo] |
Ref country code: PT Free format text: LAPSE BECAUSE OF FAILURE TO SUBMIT A TRANSLATION OF THE DESCRIPTION OR TO PAY THE FEE WITHIN THE PRESCRIBED TIME-LIMIT Effective date: 20060410 |
|
| NLV1 | Nl: lapsed or annulled due to failure to fulfill the requirements of art. 29p and 29m of the patents act | ||
| ET | Fr: translation filed | ||
| REG | Reference to a national code |
Ref country code: CH Ref legal event code: NV Representative=s name: RITSCHER & PARTNER AG |
|
| PG25 | Lapsed in a contracting state [announced via postgrant information from national office to epo] |
Ref country code: IE Free format text: LAPSE BECAUSE OF NON-PAYMENT OF DUE FEES Effective date: 20060804 |
|
| PG25 | Lapsed in a contracting state [announced via postgrant information from national office to epo] |
Ref country code: MC Free format text: LAPSE BECAUSE OF NON-PAYMENT OF DUE FEES Effective date: 20060831 |
|
| PLBE | No opposition filed within time limit |
Free format text: ORIGINAL CODE: 0009261 |
|
| STAA | Information on the status of an ep patent application or granted ep patent |
Free format text: STATUS: NO OPPOSITION FILED WITHIN TIME LIMIT |
|
| 26N | No opposition filed |
Effective date: 20060810 |
|
| REG | Reference to a national code |
Ref country code: IE Ref legal event code: MM4A |
|
| REG | Reference to a national code |
Ref country code: CH Ref legal event code: PCAR Free format text: RITSCHER & PARTNER AG;RESIRAIN 1;8125 ZOLLIKERBERG (CH) |
|
| PG25 | Lapsed in a contracting state [announced via postgrant information from national office to epo] |
Ref country code: LU Free format text: LAPSE BECAUSE OF NON-PAYMENT OF DUE FEES Effective date: 20060804 |
|
| PG25 | Lapsed in a contracting state [announced via postgrant information from national office to epo] |
Ref country code: CY Free format text: LAPSE BECAUSE OF FAILURE TO SUBMIT A TRANSLATION OF THE DESCRIPTION OR TO PAY THE FEE WITHIN THE PRESCRIBED TIME-LIMIT Effective date: 20051109 |
|
| REG | Reference to a national code |
Ref country code: CH Ref legal event code: PFA Owner name: CELLOMICS, INC., US Free format text: FORMER OWNER: CELLOMICS, INC., US |
|
| REG | Reference to a national code |
Ref country code: FR Ref legal event code: PLFP Year of fee payment: 17 |
|
| REG | Reference to a national code |
Ref country code: FR Ref legal event code: PLFP Year of fee payment: 18 |
|
| REG | Reference to a national code |
Ref country code: FR Ref legal event code: PLFP Year of fee payment: 19 |
|
| PGFP | Annual fee paid to national office [announced via postgrant information from national office to epo] |
Ref country code: SE Payment date: 20190813 Year of fee payment: 20 Ref country code: DE Payment date: 20190723 Year of fee payment: 20 Ref country code: FR Payment date: 20190711 Year of fee payment: 20 |
|
| PGFP | Annual fee paid to national office [announced via postgrant information from national office to epo] |
Ref country code: GB Payment date: 20190731 Year of fee payment: 20 |
|
| PGFP | Annual fee paid to national office [announced via postgrant information from national office to epo] |
Ref country code: CH Payment date: 20190819 Year of fee payment: 20 |
|
| REG | Reference to a national code |
Ref country code: DE Ref legal event code: R071 Ref document number: 60023905 Country of ref document: DE |
|
| REG | Reference to a national code |
Ref country code: CH Ref legal event code: PL |
|
| REG | Reference to a national code |
Ref country code: GB Ref legal event code: PE20 Expiry date: 20200803 |
|
| REG | Reference to a national code |
Ref country code: SE Ref legal event code: EUG |
|
| PG25 | Lapsed in a contracting state [announced via postgrant information from national office to epo] |
Ref country code: GB Free format text: LAPSE BECAUSE OF EXPIRATION OF PROTECTION Effective date: 20200803 |