WO2024219148A1 - 支援装置および支援方法 - Google Patents
支援装置および支援方法 Download PDFInfo
- Publication number
- WO2024219148A1 WO2024219148A1 PCT/JP2024/010995 JP2024010995W WO2024219148A1 WO 2024219148 A1 WO2024219148 A1 WO 2024219148A1 JP 2024010995 W JP2024010995 W JP 2024010995W WO 2024219148 A1 WO2024219148 A1 WO 2024219148A1
- Authority
- WO
- WIPO (PCT)
- Prior art keywords
- analysis
- simulation
- period
- streams
- conditions
- Prior art date
- Legal status (The legal status is an assumption and is not a legal conclusion. Google has not performed a legal analysis and makes no representation as to the accuracy of the status listed.)
- Ceased
Links
Images








Classifications
-
- G—PHYSICS
- G01—MEASURING; TESTING
- G01N—INVESTIGATING OR ANALYSING MATERIALS BY DETERMINING THEIR CHEMICAL OR PHYSICAL PROPERTIES
- G01N30/00—Investigating or analysing materials by separation into components using adsorption, absorption or similar phenomena or using ion-exchange, e.g. chromatography or field flow fractionation
- G01N30/02—Column chromatography
- G01N30/26—Conditioning of the fluid carrier; Flow patterns
- G01N30/38—Flow patterns
- G01N30/46—Flow patterns using more than one column
-
- G—PHYSICS
- G01—MEASURING; TESTING
- G01N—INVESTIGATING OR ANALYSING MATERIALS BY DETERMINING THEIR CHEMICAL OR PHYSICAL PROPERTIES
- G01N30/00—Investigating or analysing materials by separation into components using adsorption, absorption or similar phenomena or using ion-exchange, e.g. chromatography or field flow fractionation
- G01N30/02—Column chromatography
- G01N30/86—Signal analysis
Definitions
- This disclosure relates to an assistance device and method for assisting in setting analysis conditions for a liquid chromatography system.
- Liquid chromatography is a technique that separates the components contained in a sample by introducing the sample to be analyzed into a column together with an eluent, which is the mobile phase.
- the components of the sample separated by liquid chromatography are analyzed by a detector such as a mass spectrometer.
- Non-Patent Document 1 discloses a liquid chromatograph system that has multiple liquid chromatograph analysis systems (hereinafter referred to as streams), an injection device that injects samples into each of the multiple streams, a detector, and a valve that selectively connects one of the multiple streams to the detector.
- streams multiple liquid chromatograph analysis systems
- users may wish to set the time period during which the analyzer is not in use as short as possible in order to increase analytical efficiency. If an analysis in one stream is started immediately after an analysis in another stream in order to fulfill such a wish, a problem arises in that the timing at which the separated components reach the detector in each stream overlaps.
- the present disclosure aims to help make it easier to set analytical conditions in a liquid chromatography system that has multiple streams and is capable of separating components in a sample in parallel.
- the support device of the present disclosure supports the setting of analysis conditions for a liquid chromatograph system.
- the liquid chromatograph system includes a plurality of streams for separating components contained in a sample, an injection device for injecting a sample into each of the plurality of streams, and a detection device for detecting components separated by passing through each of the plurality of streams, and is configured to be able to perform separation of components in the sample using each of the plurality of streams in parallel.
- the support device includes a display device and a control device that simulates the usage period and usage start timing of each of the injection device, the plurality of streams, and the detection device according to the set analysis conditions, and displays the results of the simulation on the display device by indicating the usage period of each device used by the length of a range bar.
- the control device includes a first reception unit that receives input of a period condition that is an analysis condition related to the usage period of the injection device and the detection device.
- the control device displays a range bar for each analysis, and when the first reception unit receives input of a period condition for at least one of the injection device and the detection device, performs a simulation to reflect the change in the period condition in each of the multiple analyses, and reflects the results of the simulation on the display device.
- the support method disclosed herein is a support method for supporting the setting of analysis conditions for a liquid chromatograph system.
- the liquid chromatograph system includes a plurality of streams for separating components contained in a sample, an injection device for injecting a sample into each of the plurality of streams, and a detection device for detecting components separated by passing through each of the plurality of streams, and is configured to be capable of performing separation of components in the sample using each of the plurality of streams in parallel.
- the support method includes a step of simulating the usage period and usage start timing of each of the injection device, the plurality of streams, and the detection device according to the set analysis conditions, and displaying the results of the simulation on a display device by indicating the usage period of each device used by the length of a range bar, a step of accepting input of a period condition that is an analysis condition related to the usage period of the injection device and the detection device, and a step of displaying a range bar for each analysis when multiple analyses are set to be performed, and when the first reception unit accepts input of a period condition for at least one of the injection device and the detection device, performing a simulation to reflect the change in the period condition in each of the multiple analyses, and reflecting the results of the simulation on the display device.
- a range bar showing the length of the usage period is displayed for each device and each analysis, so that the user can easily grasp the flow of the analysis, and the range bar displayed for each analysis allows the user to visually easily grasp the availability between analyses.
- the first reception unit receives input of period conditions for at least one of the injection device and the detection device
- a simulation is performed to reflect the change in the period conditions in each of the multiple analyses, and the result is reflected on the display device. Therefore, the user can intuitively grasp which of the multiple period conditions is the rate limiting factor for reducing the analysis time.
- the burden on the user when optimizing the period conditions can be reduced.
- FIG. 1 is a schematic diagram of an LC system.
- FIG. 2 is a schematic diagram of a stream.
- FIG. 2 is a schematic diagram showing a hardware configuration of the support device.
- 1 is a flowchart showing the flow of a method for setting analysis conditions.
- FIG. 2 is a diagram illustrating an example of a data configuration of an analysis method DB.
- FIG. 2 is a diagram illustrating an example of a data structure of a batch file.
- FIG. 13 is a diagram showing an example of an analysis method selection screen.
- FIG. 13 is a diagram showing an example of a setting screen for analysis conditions.
- FIG. FIG. 13 is a diagram showing a simulation result.
- FIG. 13 is a diagram showing another display mode of the range bar.
- FIG. 1 is a schematic diagram of an LC system.
- FIG. 2 is a schematic diagram of a stream.
- FIG. 2 is a schematic diagram showing a hardware configuration of the support device.
- 1 is a flowchart
- 13 is a diagram showing an example of a setting screen for analysis conditions after parameters have been changed. 13 is a flowchart showing a process according to a first modified example. 13 is a flowchart showing a process according to a second modified example. FIG. 13 is a diagram showing how the length of the range bar is adjusted and displayed depending on the display range.
- LC Liquid Chromatography
- the LC system 1 separates and analyzes components contained in a sample.
- the LC system 1 comprises a sample injection device 10, multiple streams 12A-12D, a divert valve 14, and a detector 16. In the following, when there is no need to distinguish between the streams 12A-12D, they will be referred to as "stream 12.”
- the sample injection device 10 injects samples into each of the multiple streams 12A-12D.
- the sample injection device 10 is, for example, an autosampler, and includes a sample plate and a needle (not shown) that can accommodate one or more samples.
- the sample injection device 10 typically includes multiple sample plates.
- the needle aspirates the sample from the sample plate and injects the aspirated sample into a specified stream 12 according to set analysis conditions.
- Stream 12 is an analytical flow path provided for separating components contained in the sample, through which the mobile phase flows.
- Each of streams 12A to 12D is connected to a detector 16 via a divert valve 14.
- the divert valve 14 has ports 141 to 146. Streams 12A to 12D are connected to ports 141 to 144, respectively. Detector 16 is connected to port 145. A drain pipe (not shown) is connected to port 146. The divert valve 14 fluidly connects one of streams 12A to 12D to detector 16 by switching the connection destination of ports 141 to 144 to port 145 or port 146, respectively.
- Detector 16 is disposed downstream of streams 12A-12D and analyzes the components separated by passing through each of streams 12A-12D.
- detector 16 is a mass spectrometer. Note that detector 16 is not limited to a mass spectrometer, and may be an absorbance detector, a fluorescence detector, a refractive index detector, an electrical conductivity detector, an evaporative light scattering detector, or the like, and is not particularly limited.
- multiple streams 12A to 12D are connected in parallel and connected to the detector 16 via the divert valve 14, so that the components in the sample can be separated in parallel using each of the streams 12A to 12D.
- [Stream configuration] 2 is a schematic diagram of the stream 12.
- the stream 12 includes a supply device 126, a valve 124, and a column 122.
- a mobile phase is sent from the supply device 126 to the column 122, and the mobile phase is sent to the divert valve 14 through the column 122.
- the supply device 126 supplies the mobile phase flowing through the stream 12.
- the supply device 126 includes a plurality of solvent containers S1, S2, a mixer 261, and a mobile phase pump 262.
- the multiple solvent containers S1, S2 contain solvents.
- the types of solvents contained in the solvent containers S1, S2 may be different or the same. In this embodiment, the description will be given assuming that the types of solvents are different.
- the mixer 261 mixes the solvents supplied from the solvent containers S1 and S2 in a predetermined ratio.
- the mixed liquid mixed by the mixer 261 is sent as the mobile phase by the mobile phase pump 262 toward the column 122.
- the predetermined ratio includes 0:100.
- the mixing ratio may be set to be constant during the analysis of the sample, or may be set to change over time during the analysis.
- the mobile phase pump 262 pumps the mixture mixed by the mixer 261 toward the valve 124 as the mobile phase.
- the valve 124 switches the flow path connected to the supply device 126 between a flow path that passes through the sample injection device 10 and connects to the column 122, and a flow path that connects to the column 122 without passing through the sample injection device 10. If the flow path in which the supply device 126, the sample injection device 10, and the column 122 are connected in series in that order is called the "injection flow path,” and the flow path in which the supply device 126 and the column 122 are connected in series in that order without passing through the sample injection device 10 is called the "direct flow path,” then the valve 124 can be said to switch between the injection flow path and the direct flow path.
- the column 122 separates the components contained in the sample injected from the sample injection device 10.
- the column 122 is filled with a stationary phase for separating the components contained in the sample.
- stream 12 is configured to separate the components contained in the sample injected from sample injection device 10.
- stream 12 may further include a flow path for delivering a cleaning liquid.
- stream 12 may be configured to have one solvent container and deliver only one type of solvent without including a mixer 261.
- configurations of streams 12A to 12D may be the same or different. In this embodiment, the configurations of streams 12A to 12D will be described as being the same.
- streams 12A to 12D are configured to be switchable between a direct flow path and an injection flow path, and each stream only needs to be equipped with a supply device 126 and at least one column 122.
- each supply device 126 provided for streams 12A to 12D may be different from each other or may be the same.
- the type of mobile phase can be changed.
- the type of mobile phase pump 262 provided for each supply device 126 different from each other the settable range of flow rate and the type of usable column 122 can be changed for each stream 12.
- the type and/or number of each column 122 provided for streams 12A to 12D may be changed.
- streams 12A to 12D may further include a column oven for maintaining the temperature of the column 122.
- [Hardware configuration of the support device] 3 is a schematic diagram showing a hardware configuration of the support device 2.
- the support device 2 is a general-purpose personal computer (PC), a smartphone, a tablet, or the like, and supports the setting of analysis conditions in the LC system 1. A specific support method will be described later.
- the support device 2 includes a controller 201, an input device 202, and a display device 204.
- the input device 202 and the display device 204 are connected to the controller 201.
- the input device 202 is composed of, for example, a keyboard and a mouse.
- the user inputs various information to the controller 201 by operating the input device 202.
- the display device 204 displays an image corresponding to a video signal output by the controller 201.
- the display device 204 is, for example, a display.
- the controller 201 has, as its main components, a processor 21, a memory 22, a communication interface (I/F) 23, and an input/output I/F 24. These components are connected to each other via a bus 25 so that they can communicate with each other.
- the processor 21 is typically an arithmetic processing unit such as a CPU (Central Processing Unit) or an MPU (Micro Processing Unit).
- the processor 21 controls the operation of the support device 2 by reading and executing programs stored in the memory 22.
- the memory 22 is realized by a storage device such as a ROM (Read Only Memory), a RAM (Random Access Memory), and a HDD (Hard Disk Drive).
- the ROM stores the programs executed by the processor 21.
- the RAM can temporarily store data used during execution of the programs in the processor 21, and can function as a temporary data memory used as a working area.
- the HDD is a non-volatile storage device.
- a semiconductor storage device such as a flash memory may be adopted.
- the above programs and/or data may be stored in an external storage device accessible by the processor 21.
- the communication I/F 23 is a communication interface for exchanging various data with the LC system 1, and is realized by an adapter or a connector.
- the communication method may be a wireless communication method using a wireless LAN (Local Area Network) or a wired communication method using a USB (Universal Serial Bus).
- the support device 2 acquires information about the device configuration from the LC system 1 via the communication I/F 23, and also sends the analysis conditions set in the support device 2 to the LC system 1.
- a control device (not shown) of the LC system 1 controls various devices (pumps, valves, sample injection device 10, detector 16, etc.) that constitute the LC system 1 according to the sent analysis conditions.
- the support device 2 may also function as a control device for the LC system 1.
- the input/output I/F 24 is an interface for exchanging various types of data between the processor 21 and external devices connected to the input/output I/F 24.
- the external devices include an input device 202 and a display device 204.
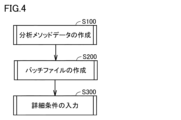
- Fig. 4 is a flow chart showing the flow of the method for setting analysis conditions. Note that the flow shown in Fig. 4 is only an example, and the method is not limited to this.
- Analysis conditions are conditions for analyzing a sample, and include conditions defined by the analysis method, sample injection amount, sample pretreatment conditions, detection conditions by detector 16, etc.
- the analysis method which is a compilation of analysis conditions that can be made common to each sample, is information that specifies the method of analyzing the sample, and includes, for example, the sample introduction ratio, total flow rate of the mobile phase, type of solvent, solvent mixing ratio, separation method (gradient separation method, isocratic elution method), washing time, etc.
- the support device 2 simulates the usage period and start timing of each device to determine the injection timing of each sample and the timing for detecting the components separated in each stream (switching timing of the divert valve 14).
- the controller 201 creates analysis method data 222 based on information input via the input device 202.
- FIG. 5 is a diagram showing an example of the data configuration of the analysis method DB.
- the analysis method DB 220 includes a plurality of analysis method data 222.
- the controller 201 stores the created analysis method data 222 in the analysis method (database) DB 220 in the memory 22.
- the analysis method data 222 is information that defines the analysis method, and includes the method name, the usage period of the stream 12 when the analysis method is selected, the measurement mode (elution method), and the like.
- the analysis method data 222 may include the total flow rate of the mobile phase, the type of solvent, the mixing ratio of the solvent, the washing time, and the like.
- the method for creating the analysis method is not particularly limited.
- the controller 201 may provide a user interface that accepts input of each analysis condition that constitutes the analysis method, and create the analysis method data 222 based on information input via the input device 202.
- FIG. 6 is a diagram showing a schematic example of the data structure of a batch file.
- the batch file 224 is a file in which the analysis conditions for each analysis are defined.
- the batch file 224 includes the plate number and sample number indicating the position where the sample is contained, as well as the sample name, analysis conditions (analysis method), etc.
- the number of analyses registered in the batch file 224 corresponds to the number of analyses, and in the example shown in FIG. 6, five analyses are registered.
- the method of creating the batch file 224 is not particularly limited.
- the controller 201 provides a user interface that accepts the selection of a plate number and a sample number, accepts the selection of one or more samples to be measured, and provides a user interface that accepts the selection of an analysis method, and assigns the analysis method to the selected one or more samples all at once.
- the controller 201 assigns an analysis number to each of the selected one or more samples, and creates the batch file 224.
- the controller 201 can also create the batch file 224 so that one sample is analyzed multiple times.
- the analytical method is selected arbitrarily depending on the sample to be analyzed.
- the method of selecting the analytical method is not particularly limited.
- the controller 201 displays one or more types of analytical methods stored in the analytical method DB 220 on the display device 204, and accepts the selection of one analytical method from the one or more types of analytical methods in response to an input operation by the user.
- the controller 201 may also accept input of the sample to be analyzed, and select an appropriate analytical method from the analytical method DB 220 based on the type of sample accepted.
- Screen 400 includes an input field 401, an OK button 402, and a cancel button 403.
- Screen 400 is displayed on display device 204 by controller 201.
- Input field 401 accepts the selection of an analysis method.
- input field 401 corresponds to a second reception unit that accepts the selection of an analysis method.
- OK button 402 is selected, controller 201 saves the analysis method input in input field 401 as an analysis condition in memory 22 and closes screen 400.
- cancel button 403 screen 400 is closed without saving the analysis method input in input field 401 as an analysis condition in memory 22.
- screen 400 is shown as an example in which a common analysis method is selected for each analysis. Note that an analysis method may be selected for each analysis. In this case, the analysis method selected for each analysis number is registered in batch file 224.
- the usage period of stream 12 is determined.
- the usage period of stream 12 is the time from when a sample is injected into stream 12 to when stream 12 is in a state where the next sample can be injected, when an analysis is performed using that analysis method. For example, the time required to clean the column and flow path is also included in the usage period of stream 12.
- the controller 201 can identify the usage period by referring to the analysis method data 222 corresponding to the analysis method registered for each analysis.
- the controller 201 accepts input of other detailed conditions.
- Detailed conditions are conditions other than the analysis method that do not affect the usage period of the stream 12, such as sample pretreatment conditions, detection conditions by the detector 16, margin time taking into account the actual analysis conditions, the number of streams to be used, etc.
- Actual analysis conditions are conditions that cannot be uniquely determined by the analysis conditions alone, such as the processing time on the controller 201 required for data processing after analysis and data storage.
- the controller 201 creates a control schedule for controlling each device according to the usage period and usage start timing of each device obtained through simulation.
- the controller 201 sends the created control schedule for each device to the LC system 1.
- the LC system 1 controls each device according to the sent control schedule, thereby performing various processes for each sample, such as pre-processing, post-processing, injection into stream 12, separation, and detection.
- the controller 201 when the input field 401 accepts the selection of an analytical method, the controller 201 refers to the analytical method data 222 to identify the usage period corresponding to the accepted analytical method, performs a simulation using the identified usage period, and displays the results of the simulation on the display device 204. The user inputs other detailed conditions via the input device 202 while checking the displayed simulation results. Since the usage period is determined in advance for each analytical method, the processing load on the controller 201 for the simulation can be reduced. Also, in this embodiment, the controller 201 accepts the selection of one analytical method, and assigns the analytical method to one or more selected samples at once. In other words, the controller 201 applies the accepted analytical method to each of the multiple analyses to perform a simulation. Therefore, when multiple specimens (samples) are processed collectively under the same analytical conditions, there is no need to input the analytical method for each analysis, and the burden on the user can be reduced.
- the LC system 1 can perform separation of components in a sample in parallel using each of the streams 12A to 12D by connecting multiple streams 12A to 12D in parallel and connecting them to the detector 16.
- the LC system 1 can perform separation of components in a sample in parallel using each of the streams 12A to 12D by shifting the timing of sample injection into the streams 12A to 12D, while switching the stream 12 connected to the detector 16 to continuously detect the components separated by the streams 12A to 12D, thereby improving analysis efficiency.
- the analysis efficiency can be improved by designing the analysis conditions so that the idle period during which no analysis is being performed in each stream 12 is shortened.
- the "idle period” includes the period from the end of one analysis in one stream 12 to the execution of the next analysis.
- “one analysis in one stream 12” refers to the period from the injection of a sample into one stream 12 to the time when that stream 12 is in a state where the next sample can be injected.
- the mobile phase is continuously flowed and the components in the mobile phase are detected by the detector 16, so the analysis conditions must be set so that the timing at which a component separated after passing through one stream 12 reaches the detector 16 does not overlap with the timing at which a component separated after passing through another stream 12 reaches the detector 16, causing interference between them.
- the controller 201 displays the results of simulating the usage period and start timing of each device according to the set analysis conditions on the display device 204 in order to assist in determining the analysis conditions.
- the controller 201 displays a range bar indicating the usage period, dividing it into sections for each analysis. This allows the user to easily grasp the idle time and the degree of interference between analyses, making it easier to set the analysis conditions.
- [Analysis condition setting screen] 8 is a diagram showing an example of a screen for setting analysis conditions.
- a screen 300 includes a parameter list 31, a simulation result 32, an OK button 33, and a cancel button .
- the parameter list 31 displays a list of parameters related to the period of use and the timing at which use begins, among the parameters set as analysis conditions.
- the parameter list 31 is provided with an input field 310 for each parameter.
- the multiple parameters displayed in the parameter list 31 include parameters that can be changed and parameters that cannot be changed.
- the input field 310A corresponding to parameters that can be changed and the input field 310B corresponding to parameters that cannot be changed are displayed in different display modes. Input into the input field 310A is accepted, while input into the input field 310B is not accepted.
- the simulation results 32 are the results of simulating the usage period and start timing of usage for each device according to the analysis conditions that were set.
- the simulation results 32 are represented for each device by a range bar 320 that indicates the length of the usage period.
- the range bar 320 is represented by dividing each analysis.
- the simulation result 32 also displays a comparison result 35 that compares the time required for all of the set analyses when the analyses are performed using only one stream 12 and when the analyses are performed according to the set analysis conditions.
- the throughput improvement rate is displayed as the comparison result 35.
- the throughput improvement rate R is calculated according to formula 1 based on the time T1 required to complete one analysis, the number of analyses N which is the number of analyses registered in the batch file 224, and the time T2 required to complete all of the analyses when the analyses are performed under the set analysis conditions.
- the controller 201 saves the analysis conditions (various parameters) entered on the screen 300 in the memory 22 and closes the screen 300.
- the screen 300 is closed without saving the analysis conditions (various parameters) entered on the screen 300 in the memory 22.
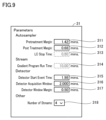
- Figure 9 shows the input fields.
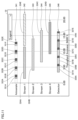
- Figure 10 shows the simulation results.
- the multiple input fields 310 provided in the parameter list 31 include input fields 311-313 for parameters related to the sample injection device 10, input field 314 for parameters related to the streams 12, input fields 315-317 for parameters related to the detector 16, and input field 318 for a parameter indicating the number of streams 12 to be used.
- input fields 311-317 input into input fields 313 and 314 is not accepted, whereas input into input fields 311, 312, and 315-318 is accepted.
- the parameters corresponding to input fields 313 and 314 are parameters that are determined by the selected analysis method. As the analysis method is changed, the numerical values displayed in input fields 313 and 314 are also changed. For example, the parameter in input field 314 indicates the period of use of stream 12.
- the parameter corresponding to input field 311 is a margin time that is set for the pre-processing time, taking into account the actual analysis conditions.
- the parameter corresponding to input field 312 is a margin time that is set for the post-processing time, taking into account the actual analysis conditions.
- the parameter corresponding to input field 315 is a parameter related to detector 16, and is the time from starting the system for one analysis to starting detection.
- the parameter corresponding to input field 316 is the detection period during which detection continues from the start of detection.
- the parameter corresponding to input field 317 is the margin time that is set for the detection period, taking into account the actual analysis conditions.
- input fields 311, 312, 315 to 317 each correspond to a first reception unit that receives input of period conditions, which are analysis conditions related to the usage period of the sample injection device 10 and the detector 16. Furthermore, while the parameter list 31 is configured not to receive input of analysis conditions determined by the analysis method, it is configured to receive input of other analysis conditions (for example, period conditions for the sample injection device 10 and the detector 16, the number of streams, etc.).
- Gantt charts 341-346 each include at least one range bar 320.
- the range bar 320 is displayed in sections for each analysis, and the length of the range bar 320 indicates the period for which the device is used for one analysis.
- a range bar showing the length of the usage period is displayed for each device and each analysis, allowing the user to easily understand the flow of the analysis, and since a range bar is displayed for each analysis, the user can easily visually understand the amount of space between analyses.
- the Gantt chart 341 showing the usage period of the sample injection device 10 includes multiple range bars 321A-321E, 322A-322E.
- the range bars 321A-321E each vary in response to the parameters entered in the input field 311, and indicate the margin time set for the pre-processing time.
- the range bars 322A-322E vary in response to the parameters entered in the input field 312, and indicate the margin time set for the post-processing time.
- Gantt charts 342-345 which indicate the usage periods of streams 1-4, each include range bars 324A-324E.
- Gantt chart 342 includes range bars 324A and 324E
- Gantt chart 343 includes range bar 324B
- Gantt chart 344 includes range bar 324C
- Gantt chart 345 includes range bar 324D.
- Range bars 324A-324E vary in response to the parameters shown in input field 314, and indicate the usage period of stream 12. Note that, because the usage period of stream 12 is set according to the analysis method, the usage period of stream 12 per analysis does not vary depending on operations on screen 300. Note that the timing at which use of stream 12 begins varies depending on the parameters entered by operations on screen 300.
- Gantt chart 346 showing the usage period of detector 16 includes multiple range bars 326A-326E, 327A-327E. Range bars 326A-326E vary in response to parameters entered in input field 316, and indicate the detection period from when detection begins until the detection continues. Range bars 327A-327E vary in response to parameters entered in input field 317, and indicate the margin time set for the detection period.
- the steps proceed in the following order: sample injection by the sample injection device 10, separation of the components in the sample by the stream 12, and detection of the components by the detector 16.
- one analysis includes at least these steps. Note that, if the sample injection device 10 performs pre-treatment and post-treatment of the sample, the pre-treatment and post-treatment steps are also included in one analysis.
- the series of processes indicated by range bars 321A, 322A, 324A, 326A, and 327A is included in one analysis.
- the series of processes indicated by range bars 321B, 322B, 324B, 326B, and 327B is included in one analysis
- the series of processes indicated by range bars 321C, 322C, 324C, 326C, and 327C is included in one analysis
- the series of processes indicated by range bars 321D, 322D, 324D, 326D, and 327D is included in one analysis
- the series of processes indicated by range bars 321E, 322E, 324E, 326E, and 327E is included in one analysis.
- the analyses corresponding to range bar 324A, range bar 324B, range bar 324C, range bar 324D, and range bar 324E may be referred to as analysis A, analysis B, analysis C, analysis D, and analysis E, respectively.
- the multiple range bars 321A-321E, 324A-324E, 326A-326E are displayed in different display modes depending on the stream used in the corresponding analysis. For example, range bars 321A, 324A, 326A, 321E, 324E, and 326E indicating the usage period of an analysis using stream 1 are each displayed in a common display mode. On the other hand, range bars 321B, 324B, and 326B indicating the usage period of an analysis using stream 2, which is different from stream 1, are each displayed in a common display mode, but in a different display mode from range bar 321A.
- FIG. 11 is a diagram showing another display mode of the range bars. As shown in FIG. 11, the range bars 321A, 322A, 324A, 326A, and 327A corresponding to analysis A are each displayed in a common display mode. On the other hand, the range bars 321E, 322E, 324E, 326E, and 327E corresponding to analysis E, which uses the same stream 1 as analysis A, are each displayed in a common display mode, but in a display mode different from that of range bar 321A.
- range bars 322A to 322E are each displayed in a common display format.
- range bars 327A to 327E are each displayed in a common display format. In this way, range bars with corresponding parameters in common may be displayed in a common display format.
- Displaying the range bar in this manner makes it possible to visually represent an analysis flow in which the steps are divided by device, allowing the user to easily understand the relationships between the devices.
- the period indicated by the parameter corresponding to input field 315 is expressed as the length from the end of range bar 324A indicating the usage period of the stream corresponding to one analysis to the end of range bar 326A indicating the detection period of detector 16.
- the controller 201 When the parameters corresponding to various analysis conditions are changed, the controller 201 performs a simulation according to the change and updates the display of the simulation results 32. At this time, when the controller 201 receives a parameter change, it performs a simulation so as to reflect the parameter change in each of the multiple analyses that have been set, and updates the display of the simulation results 32.
- the display of simulation result 32 is updated so that the lengths of all range bars 321A to 321E change.
- period conditions which are analysis conditions related to the usage period of the sample injection device 10 and the detector 16
- a simulation is performed to reflect the change in the period conditions in each of the multiple analyses, and the results are reflected on the display device. Therefore, the user can intuitively grasp which of the multiple period conditions is the rate limiting factor in reducing the analysis time. As a result, the burden on the user when optimizing the period conditions can be reduced.
- the controller 201 may accept parameter changes through operations on the range bars displayed in the simulation results 32. For example, when the pointer 328 is moved to the end of the range bar 326A via the input device 202, the controller 201 displays the adjustment keys 329 on the screen 300. The adjustment keys 329 displayed at the end of the range bar 326A may be selected with the pointer 328 and dragged to expand or contract the range bar 326A, thereby changing the parameters corresponding to the range bar 326A. In this case as well, the controller 201 updates the display of the simulation results 32 so that the changes to the range bar 326A are reflected in each of the range bars 326B to 326E. Adjustments using the adjustment keys 329 can be made to the range bars corresponding to the parameters that can be changed.
- Fig. 12 is a diagram showing an example of a setting screen for analysis conditions after the parameters are changed.
- the controller 201 when the controller 201 receives a change to the time until detection starts, it performs a simulation according to the changed "8.73 minutes". This changes the simulation results for the detector 16. Note that in the example shown in FIG. 12, the time until detection starts is 8.73 minutes, the detection period is 2 minutes, while the stream usage period is 10 minutes, and the detection end time is later than the stream usage end time, making these inappropriate analysis conditions. Therefore, the analysis conditions, the time until detection starts and the detection period, are inappropriate analysis conditions and are analysis conditions that cause the analysis to be unable to be performed.
- the controller 201 highlights the input field and range bar that correspond to the analysis condition that is causing the analysis to be unable to be performed. Specifically, the controller 201 displays a frame 354 that highlights the input field that corresponds to the causative analysis condition, and also displays a frame 352 that highlights the range bar that corresponds to the causative analysis condition.
- the controller 201 highlights some of the range bars and input fields that correspond to the causal analysis conditions, but it may also highlight all of the range bars and input fields that correspond to the causal analysis conditions.
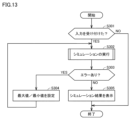
- FIG. 13 is a flowchart showing the process according to the first modified example.
- the controller 201 determines whether or not a parameter input has been received. If it is determined that no input has been received (NO in S301), the controller 201 ends the process. If it is determined that an input has been received (YES in S301), the controller 201 advances the process to S302.
- the controller 201 executes a simulation.
- the controller 201 determines whether or not there is an error in the simulation result. If it is determined that there is no error (NO in S303), the controller 201 displays the simulation result on the display device 204 in S305 and ends the process. If it is determined that there is an error (YES in S303), the controller 201 advances the process to S304.
- the controller 201 executes the process from S302 onwards again. In this case, since the numerical values have been set within the feasible range, the controller 201 determines that there is no error (NO in S303) and displays the simulation results for the re-set numerical values in S305.
- the controller 201 may reset the numerical values to the closest numerical values to the accepted input values within the range in which the simulation can be carried out.
- the controller 201 may reset the numerical values to the closest numerical values to the accepted input values within the range in which the simulation can be carried out.
- the controller 201 may cancel the input of the changed numerical values. By canceling the input, the user can easily understand that the analysis conditions they entered are not appropriate.
- the controller 201 may also adjust the length of the range bar depending on the display range of the simulation results.
- FIG. 15 is a diagram showing how the length of the range bar is adjusted depending on the display range. As shown in FIG. 15, the controller 201 may adjust the length of the range bar 320 to display the simulation results so that they fit within the display range of the simulation results 32. Note that since the length of the range bar 320 corresponds to the length of time, the ratio of the lengths of the range bars 320 does not change before and after the adjustment.
- An assistance device assists in setting analysis conditions for a liquid chromatograph system.
- the liquid chromatograph system includes a plurality of streams for separating components contained in a sample, an injection device for injecting a sample into each of the plurality of streams, and a detection device for detecting components separated by passing through each of the plurality of streams, and is configured to be able to perform separation of components in the sample using each of the plurality of streams in parallel.
- the assistance device includes a display device and a control device that simulates the usage period and usage start timing of each of the injection device, the plurality of streams, and the detection device according to the set analysis conditions, and displays the results of the simulation on the display device by indicating the usage period of each device used by the length of a range bar.
- the control device includes a first reception unit that receives input of a period condition that is an analysis condition related to the usage period of the injection device and the detection device.
- the control device displays a range bar for each analysis, and when the first reception unit receives input of a period condition for at least one of the injection device and the detection device, performs a simulation to reflect the change in the period condition in each of the multiple analyses, and reflects the results of the simulation on the display device.
- a range bar showing the duration of use is displayed for each device and each analysis, so that the user can easily grasp the flow of the analysis, and the range bar displayed for each analysis allows the user to visually grasp the availability between analyses.
- the first reception unit receives input of duration conditions for at least one of the injection device and the detection device
- a simulation is performed to reflect the change in the duration conditions in each of the multiple analyses, and the result is reflected on the display device. Therefore, the user can intuitively grasp which of the multiple duration conditions is the rate limiting factor for reducing the analysis time.
- the burden on the user when optimizing the duration conditions can be reduced.
- the support device described in clause 1 further includes a storage device in which analysis method data including an analysis method and a usage period of the stream when the analysis method is selected is stored.
- the control device further includes a second reception unit that receives a selection of an analysis method. When multiple analyses are set to be performed and the second reception unit receives a selection of an analysis method, the control device identifies the usage period corresponding to the received analysis method by referring to the analysis method data stored in the storage device, performs a simulation using the identified usage period, and displays the results of the simulation on the display device.
- the period of use is determined in advance for each analysis method, which reduces the processing load on the control device for the simulation.
- the support device described in paragraph 3 reduces the burden on the user when processing multiple specimens (samples) collectively under the same analytical conditions, as there is no need to input the analytical method for each analysis.
- control device changes the length of the range bar depending on the display range of the simulation results and displays the results of the simulation on the display device.
- the support device described in paragraph 4 displays simulation results according to the display range, allowing the user to more easily grasp the overall schedule of multiple analyses.
- the first reception unit receives a change to the period condition by a drag operation performed on the end of the range bar displayed on the display device.
- the period conditions can be changed by manipulating the range bar, so that the period conditions can be changed while checking the idle time between analyses, which is indicated by the space between the range bars.
- control device determines that an analysis cannot be realized based on the results of the simulation, it highlights a range bar indicating the usage period corresponding to the analysis conditions that cause the analysis to be unable to be realized.
- the support device described in paragraph 6 makes it easy to identify the analysis conditions that are preventing the analysis from being realized, and by highlighting the range bars, the overall schedule, the degree of interference with the analysis, etc. can be visually confirmed, allowing the user to more easily guess what modifications should be made to realize the analysis.
- control device determines that the analysis cannot be realized based on the results of the simulation, it cancels the changes accepted by the first acceptance unit.
- the support device described in paragraph 8 allows the user to easily understand that the analysis conditions he or she has entered are inappropriate, and to know the range of conditions that can be entered.
- control device compares the analysis time required to complete all of the multiple analyses when the multiple analyses are performed according to the set analysis conditions with when the multiple analyses are performed using a single stream, and displays the comparison result on the display device.
- the support device described in paragraph 9 displays the comparison results, allowing the user to check how much the analysis time has been reduced and how the comparison results change when the analysis conditions are changed, making it easier for the user to set optimal analysis conditions.
- control device displays a range bar indicating the period of use on the display device in a different manner for each analysis.
- the support device described in paragraph 10 can visually represent an analysis flow in which the steps are divided for each device, allowing the user to easily understand the relationships between the devices.
- the support device described in paragraph 11 can visually represent an analysis flow in which the steps are divided for each device, allowing the user to easily understand the relationships between the devices.
- a support method is a support method for supporting the setting of analysis conditions for a liquid chromatograph system.
- the liquid chromatograph system includes a plurality of streams for separating components contained in a sample, an injection device for injecting a sample into each of the plurality of streams, and a detection device for detecting components separated by passing through each of the plurality of streams, and is configured to be able to perform separation of components in the sample using each of the plurality of streams in parallel.
- the support method includes a step of simulating the usage period and usage start timing of each of the injection device, the plurality of streams, and the detection device according to the set analysis conditions, and displaying the results of the simulation on a display device by indicating the usage period of each device used by the length of a range bar, a step of accepting input of a period condition that is an analysis condition related to the usage period of the injection device and the detection device, and a step of displaying a range bar for each analysis when multiple analyses are set to be performed, and a step of, when the first reception unit accepts input of a period condition for at least one of the injection device and the detection device, performing a simulation to reflect the change in the period condition in each of the multiple analyses, and reflecting the results of the simulation on the display device.
- the assistance program in one embodiment is a program for causing a computer to execute the assistance method described in Clause 12.
- a computer-readable medium stores the control program described in Section 13.
- a range bar showing the length of the usage period is displayed for each device and each analysis, so that the user can easily grasp the flow of the analysis, and the range bar displayed for each analysis allows the user to visually and easily grasp the availability between analyses.
- the first reception unit receives input of period conditions for at least one of the injection device and the detection device
- a simulation is performed to reflect the change in the period conditions in each of the multiple analyses, and the result is reflected on the display device. Therefore, the user can intuitively grasp which of the multiple period conditions is the rate limiting factor for reducing the analysis time.
- the burden on the user when optimizing the period conditions can be reduced.
Landscapes
- Physics & Mathematics (AREA)
- Health & Medical Sciences (AREA)
- Life Sciences & Earth Sciences (AREA)
- Chemical & Material Sciences (AREA)
- Analytical Chemistry (AREA)
- Biochemistry (AREA)
- General Health & Medical Sciences (AREA)
- General Physics & Mathematics (AREA)
- Immunology (AREA)
- Pathology (AREA)
- Automatic Analysis And Handling Materials Therefor (AREA)
Priority Applications (2)
| Application Number | Priority Date | Filing Date | Title |
|---|---|---|---|
| JP2025515105A JPWO2024219148A1 (https=) | 2023-04-17 | 2024-03-21 | |
| CN202480016224.3A CN120813836A (zh) | 2023-04-17 | 2024-03-21 | 支持装置及支持方法 |
Applications Claiming Priority (2)
| Application Number | Priority Date | Filing Date | Title |
|---|---|---|---|
| US202363459715P | 2023-04-17 | 2023-04-17 | |
| US63/459,715 | 2023-04-17 |
Publications (1)
| Publication Number | Publication Date |
|---|---|
| WO2024219148A1 true WO2024219148A1 (ja) | 2024-10-24 |
Family
ID=93152497
Family Applications (1)
| Application Number | Title | Priority Date | Filing Date |
|---|---|---|---|
| PCT/JP2024/010995 Ceased WO2024219148A1 (ja) | 2023-04-17 | 2024-03-21 | 支援装置および支援方法 |
Country Status (3)
| Country | Link |
|---|---|
| JP (1) | JPWO2024219148A1 (https=) |
| CN (1) | CN120813836A (https=) |
| WO (1) | WO2024219148A1 (https=) |
Citations (7)
| Publication number | Priority date | Publication date | Assignee | Title |
|---|---|---|---|---|
| JPH0934731A (ja) * | 1995-07-18 | 1997-02-07 | Hitachi Ltd | 分析システム・スケジューリング方法 |
| JP2010236962A (ja) * | 2009-03-31 | 2010-10-21 | Hitachi High-Technologies Corp | 検体検査システムとその装置管理サーバの運用方法 |
| JP2011141220A (ja) * | 2010-01-08 | 2011-07-21 | Shimadzu Corp | 分析装置制御システム及び該システム用プログラム |
| WO2017216934A1 (ja) * | 2016-06-16 | 2017-12-21 | 株式会社日立ハイテクノロジーズ | クロマトグラフ質量分析装置、及び制御方法 |
| WO2019138725A1 (ja) * | 2018-01-11 | 2019-07-18 | 株式会社日立ハイテクノロジーズ | 複数のクロマトグラフを有する分析装置 |
| WO2022124187A1 (ja) * | 2020-12-11 | 2022-06-16 | 株式会社日立ハイテク | 自動分析装置の制御方法 |
| WO2022190605A1 (ja) * | 2021-03-08 | 2022-09-15 | 株式会社日立ハイテク | 自動分析装置の制御方法 |
-
2024
- 2024-03-21 CN CN202480016224.3A patent/CN120813836A/zh active Pending
- 2024-03-21 JP JP2025515105A patent/JPWO2024219148A1/ja active Pending
- 2024-03-21 WO PCT/JP2024/010995 patent/WO2024219148A1/ja not_active Ceased
Patent Citations (7)
| Publication number | Priority date | Publication date | Assignee | Title |
|---|---|---|---|---|
| JPH0934731A (ja) * | 1995-07-18 | 1997-02-07 | Hitachi Ltd | 分析システム・スケジューリング方法 |
| JP2010236962A (ja) * | 2009-03-31 | 2010-10-21 | Hitachi High-Technologies Corp | 検体検査システムとその装置管理サーバの運用方法 |
| JP2011141220A (ja) * | 2010-01-08 | 2011-07-21 | Shimadzu Corp | 分析装置制御システム及び該システム用プログラム |
| WO2017216934A1 (ja) * | 2016-06-16 | 2017-12-21 | 株式会社日立ハイテクノロジーズ | クロマトグラフ質量分析装置、及び制御方法 |
| WO2019138725A1 (ja) * | 2018-01-11 | 2019-07-18 | 株式会社日立ハイテクノロジーズ | 複数のクロマトグラフを有する分析装置 |
| WO2022124187A1 (ja) * | 2020-12-11 | 2022-06-16 | 株式会社日立ハイテク | 自動分析装置の制御方法 |
| WO2022190605A1 (ja) * | 2021-03-08 | 2022-09-15 | 株式会社日立ハイテク | 自動分析装置の制御方法 |
Also Published As
| Publication number | Publication date |
|---|---|
| JPWO2024219148A1 (https=) | 2024-10-24 |
| CN120813836A (zh) | 2025-10-17 |
Similar Documents
| Publication | Publication Date | Title |
|---|---|---|
| JP7035951B2 (ja) | 前処理装置およびこれを備えた分析システム | |
| US9880135B2 (en) | Automatically controlling a plurality of devices of a separation and detection process for quantitative sample analysis | |
| Sencar et al. | Modeling the residence time distribution of integrated continuous bioprocesses | |
| US20110302997A1 (en) | Liquid chromatograph apparatus | |
| JP2011099679A (ja) | 分析システムおよびその制御方法 | |
| US20160109473A1 (en) | Web-based interactive process facilities and systems management | |
| JP2014032093A (ja) | 分析装置 | |
| US9581573B2 (en) | Liquid chromatograph | |
| JP5157281B2 (ja) | マルチディメンジョナルガスクロマトグラフ装置 | |
| JP6508334B2 (ja) | クロマトグラムデータ処理装置及びプログラム | |
| JP7230687B2 (ja) | クロマトグラフおよびクロマトグラフのカラム選択方法 | |
| US20130013221A1 (en) | System and method for automating scientific and engineering experimentation for deriving surrogate response data | |
| WO2024219148A1 (ja) | 支援装置および支援方法 | |
| JPH1019864A (ja) | 分析システムの管理制御装置 | |
| CN112180023A (zh) | 液相色谱分析方法、装置及液相色谱工作站 | |
| CN112888942A (zh) | 色谱仪控制装置、色谱仪系统、色谱仪控制方法以及色谱仪控制程序 | |
| JP2005321200A (ja) | 機器分析用データ管理装置 | |
| JP7548178B2 (ja) | 分析法開発支援方法及び分析法開発支援プログラム | |
| JP7156401B2 (ja) | クロマトグラフィーシステム | |
| JP2009019995A (ja) | 分析データ処理装置およびファイル保存方法 | |
| JP2004028864A (ja) | 分析装置のデータ処理装置 | |
| JP7639623B2 (ja) | データ分析システム、データ分析方法及びコンピュータプログラム | |
| JP4872902B2 (ja) | マルチディメンジョナルガスクロマトグラフシステム | |
| CN112840209A (zh) | 色谱仪控制装置、色谱仪系统、色谱仪控制方法以及色谱仪控制程序 | |
| JP2016017941A (ja) | クロマトグラフ用データ処理装置及びデータ処理方法並びにクロマトグラフ分析システム |
Legal Events
| Date | Code | Title | Description |
|---|---|---|---|
| 121 | Ep: the epo has been informed by wipo that ep was designated in this application |
Ref document number: 24792424 Country of ref document: EP Kind code of ref document: A1 |
|
| ENP | Entry into the national phase |
Ref document number: 2025515105 Country of ref document: JP Kind code of ref document: A |
|
| WWE | Wipo information: entry into national phase |
Ref document number: 2025515105 Country of ref document: JP |
|
| WWE | Wipo information: entry into national phase |
Ref document number: 202480016224.3 Country of ref document: CN |
|
| WWP | Wipo information: published in national office |
Ref document number: 202480016224.3 Country of ref document: CN |
|
| NENP | Non-entry into the national phase |
Ref country code: DE |
|
| 122 | Ep: pct application non-entry in european phase |
Ref document number: 24792424 Country of ref document: EP Kind code of ref document: A1 |