WO2017119253A1 - 診断支援装置、診断支援方法、及び、診断支援プログラム - Google Patents
診断支援装置、診断支援方法、及び、診断支援プログラム Download PDFInfo
- Publication number
- WO2017119253A1 WO2017119253A1 PCT/JP2016/087286 JP2016087286W WO2017119253A1 WO 2017119253 A1 WO2017119253 A1 WO 2017119253A1 JP 2016087286 W JP2016087286 W JP 2016087286W WO 2017119253 A1 WO2017119253 A1 WO 2017119253A1
- Authority
- WO
- WIPO (PCT)
- Prior art keywords
- information
- display
- graph
- section
- state information
- Prior art date
Links
Images


Classifications
-
- A—HUMAN NECESSITIES
- A61—MEDICAL OR VETERINARY SCIENCE; HYGIENE
- A61B—DIAGNOSIS; SURGERY; IDENTIFICATION
- A61B5/00—Measuring for diagnostic purposes; Identification of persons
- A61B5/02—Detecting, measuring or recording pulse, heart rate, blood pressure or blood flow; Combined pulse/heart-rate/blood pressure determination; Evaluating a cardiovascular condition not otherwise provided for, e.g. using combinations of techniques provided for in this group with electrocardiography or electroauscultation; Heart catheters for measuring blood pressure
- A61B5/021—Measuring pressure in heart or blood vessels
- A61B5/02108—Measuring pressure in heart or blood vessels from analysis of pulse wave characteristics
-
- A—HUMAN NECESSITIES
- A61—MEDICAL OR VETERINARY SCIENCE; HYGIENE
- A61B—DIAGNOSIS; SURGERY; IDENTIFICATION
- A61B5/00—Measuring for diagnostic purposes; Identification of persons
- A61B5/68—Arrangements of detecting, measuring or recording means, e.g. sensors, in relation to patient
- A61B5/6801—Arrangements of detecting, measuring or recording means, e.g. sensors, in relation to patient specially adapted to be attached to or worn on the body surface
- A61B5/6813—Specially adapted to be attached to a specific body part
- A61B5/6824—Arm or wrist
-
- A—HUMAN NECESSITIES
- A61—MEDICAL OR VETERINARY SCIENCE; HYGIENE
- A61B—DIAGNOSIS; SURGERY; IDENTIFICATION
- A61B5/00—Measuring for diagnostic purposes; Identification of persons
- A61B5/74—Details of notification to user or communication with user or patient ; user input means
- A61B5/742—Details of notification to user or communication with user or patient ; user input means using visual displays
- A61B5/7435—Displaying user selection data, e.g. icons in a graphical user interface
Definitions
- the present invention relates to a diagnosis support apparatus, a diagnosis support method, and a diagnosis support program.
- the biological information for example, blood pressure value, pulse rate, etc.
- the biological information necessary for the diagnosis of the living body usually has a large daily change. For this reason, it is performed to continuously measure and record biological information from the measurement subject for diagnosis and the like.
- Measured data of biological information continuously measured in this way is preferably processed in a form that facilitates diagnosis and presented to a doctor.
- the pulse wave velocity measured over a predetermined period is divided into setting sections, an average value of the pulse wave propagation speed is calculated for each setting section, and the average value is calculated as the setting section.
- Patent Document 2 describes a method of outputting a transition of a diagnostic index of a biological circulatory system calculated using a blood pressure value and a pulse rate in a graph.
- 50 diagnostic indices are calculated from the measurement values obtained by measuring the blood pressure value and the pulse rate 50 times every month, and a band graph showing the variation range of the 50 diagnostic indices is obtained. Displayed for each measurement month.
- Patent Document 3 a representative value of blood pressure information (maximum blood pressure, minimum blood pressure, and average blood pressure) measured for a plurality of times per day is obtained, and an average value of representative values for one month or one week is obtained.
- a device that displays the average value of the representative values and the representative value of one day in the form of a band graph is described.
- the screen transits to a screen that displays the representative value for each day constituting the month, and the representative value for each month is displayed.
- the screen transitions to a screen on which representative values for each day constituting this week are displayed.
- the apparatus described in Patent Document 3 can easily confirm the representative value of blood pressure information for each day in an arbitrary period, and can be used for diagnosis.
- Patent Document 4 measurement data of biological information measured over a predetermined period is divided into setting sections, a representative value (for example, an average value) of biological information is calculated for each setting section, and the calculated average value and A system for displaying measurement data in an overlapping manner is described. According to this system, even when it is difficult to grasp the change tendency from the measurement data alone, the overall tendency can be easily grasped by the representative value.
- Patent Documents 1 to 4 assume that biological information is measured and recorded at long time intervals such as minutes, hours, and days. However, when the biological information is measured at such a long time interval, when there is a large change in the biological information during a period when the biological information is not measured, the doctor cannot know the change. Further, in the comparison of biological information measured at long time intervals, it is difficult to accurately know that a change in biological information itself has occurred and its cause.
- biometric information in units of beats is necessary in order to grasp changes in biological information in detail, and there are cases where it is desired to confirm not only the overall trend of measurement data but also measurement data in a specific period in detail. .
- Patent Document 4 According to the system described in Patent Document 4, it is possible to simultaneously confirm the overall trend of measurement data and the details of measurement data. However, when the amount of measurement data becomes enormous, the display of measurement data becomes finer, making it difficult to confirm details, and efficient diagnosis support cannot be realized.
- Patent Documents 1 and 3 and the method described in Patent Document 2 do not take into account the confirmation of data before processing of measurement data.
- the present invention has been made in view of the above circumstances, and provides a diagnosis support apparatus, a diagnosis support method, and a diagnosis support program capable of efficiently performing diagnosis support based on biological information measured in beat units.
- the purpose is to provide.
- the diagnosis support apparatus of the present invention acquires biological information for a predetermined period from a recording unit that records biological information measured every beat or multiple beats from the living body, and obtains a plurality of acquired biological information for the predetermined period.
- a variation state information generation unit that generates variation state information indicating a variation state of biological information in each segment, and a display control unit that displays the variation state information for each segment on a display unit.
- the display control unit selects a display range to be displayed on the display unit from the biological information for the predetermined period when any of the variation state information displayed on the display unit is selected.
- the biometric information in the section corresponding to the selected variation state information is set to a range including the biometric information, and the biometric information within the set display range is displayed on the display unit.
- the diagnosis support method of the present invention acquires biological information for a predetermined period from a recording unit that records biological information measured every beat or multiple beats from a living body, and acquires the acquired biological information for a plurality of predetermined periods.
- a variable state information generating step for dividing the section into pieces, and generating a state of variation information indicating a state of variation of biological information in each section; and a display control step for displaying the state of variation information for each section on a display unit,
- the display control step when any of the variation state information displayed on the display unit is selected, a display range to be displayed on the display unit of the biological information for the predetermined period, A range including the biological information belonging to the section corresponding to the selected variation state information is set, and the biological information within the set display range is displayed on the display unit.
- the diagnosis support program of the present invention acquires biological information for a predetermined period from a recording unit that records biological information measured every beat or multiple beats from a living body, and acquires the acquired biological information for a plurality of predetermined periods.
- a variable state information generating step for generating variable state information indicating a variable state of biological information in each section, and a display control step for causing the display unit to display the variable state information for each section are divided into sections.
- the display control step includes the display of the biological information for the predetermined period when any of the change state information displayed on the display unit is selected.
- the display range to be displayed on the part is set to a range including the biological information belonging to the section corresponding to the selected variation state information, and the biological information within the set display range The is intended to be displayed on the display unit.
- a diagnosis support apparatus it is possible to provide a diagnosis support apparatus, a diagnosis support method, and a diagnosis support program that can efficiently support diagnosis based on biological information measured in beat units.
- FIG. 1 is a diagram showing a schematic configuration of a diagnosis support system 100 for explaining an embodiment of the present invention. It is a figure which shows an example of the graph of the measurement data for a predetermined period. It is a figure which shows the example of a display of the 1st graph which shows the fluctuation state information for every area produced
- FIG. 5 is a flowchart for explaining the operation of the diagnosis support apparatus 2. It is a figure which shows the example of a display of the 2nd graph when it determines with the similarity degree of the area on the right of the display area being high. It is a figure which shows the example which made the width K2 of the display range which the display control part 26 sets wider than the width
- FIG. 1 is a diagram showing a schematic configuration of a diagnosis support system 100 for explaining an embodiment of the present invention.
- the diagnosis support system 100 includes a biological information measuring device 1 and a diagnosis support device 2.
- the living body information measuring apparatus 1 is a portable type, and is used by being worn on the wrist of a person to be measured as a living body.
- the biological information measuring apparatus 1 includes a pulse wave detection unit 10, a biological information calculation unit 11, a recording control unit 13, a recording medium 14 such as a flash memory, a ROM (Read Only Memory), a memory card, and a communication control unit 15. And a communication unit 16.
- the recording medium 14 may be removable from the apparatus.
- the biological information calculation unit 11, the recording control unit 13, and the communication control unit 15 are functional blocks configured by a processor executing a program.
- the pulse wave detection unit 10 detects a pulse wave non-invasively from the wrist of the measurement subject.
- the pulse wave detection unit 10 for example, a device that detects a pressure pulse wave as a pulse wave by a tonometry method is used.
- the pulse wave detection unit 10 may detect a volume pulse wave as a pulse wave.
- the pulse wave detection unit 10 may detect a pulse wave by reflected light from an artery obtained by applying light to the artery.
- the pulse wave detection unit 10 detects a pulse wave generated every one beat (period in which the heart beats once), and transmits the detected pulse wave to the biological information calculation unit 11.
- the biological information calculation unit 11 calculates blood pressure information as biological information for each beat or for every plurality of beats (frequency once for a plurality of beats) based on the pulse wave detected by the pulse wave detection unit 10.
- the blood pressure information includes at least one of systolic blood pressure (SBP (systemic blood pressure)), diastolic blood pressure (DBP (diastic blood pressure)), and average blood pressure (MBP (mean blood pressure)).
- SBP systemic blood pressure
- DBP diastolic blood pressure
- MBP mean blood pressure
- a known method can be used as a method for calculating blood pressure information.
- the biological information calculation unit 11 transmits measurement data in which detection date / time information indicating the detection date / time of an arbitrary pulse wave and blood pressure information calculated based on the pulse wave are associated with each other to the recording control unit 13.
- the recording control unit 13 records the measurement data transmitted from the biological information calculation unit 11 on the recording medium 14.
- the recording medium 14 has measurement data including blood pressure information calculated by the biological information calculation unit 11 and detection time information indicating a detection time of a pulse wave that is a source of the blood pressure information. Multiple records are made.
- the communication unit 16 is an interface for communicating with an external device by wire or wireless.
- the communication control unit 15 performs control to transmit a plurality of measurement data recorded on the recording medium 14 to an external device via the communication unit 16.
- the diagnosis support apparatus 2 includes a communication unit 21, a recording control unit 22, a recording medium 23 such as a flash memory, a ROM, and a memory card, a variation state information generation unit 24, an operation unit 25, a display control unit 26, A display unit 27.
- the recording medium 23 may be detachable from the diagnosis support apparatus 2.
- the recording medium 23 constitutes a recording unit.
- the recording control unit 22, the fluctuation state information generation unit 24, and the display control unit 26 are functional blocks configured by a processor executing a diagnosis support program.
- the diagnosis support apparatus 2 may be a dedicated apparatus for diagnosis support, or may be a general-purpose electronic device such as a smartphone or a tablet terminal.
- the communication unit 21 is an interface for communicating with an external device by wire or wireless.
- the display unit 27 displays various information for diagnosis support, and a display using a liquid crystal display element, an organic electroluminescence element or the like is used.
- the display unit 27 may not be built in the diagnosis support apparatus 2, but may be provided outside the diagnosis support apparatus 2 and connected to the diagnosis support apparatus 2 by wire or wirelessly.
- the operation unit 25 is an interface for operating the diagnosis support apparatus 2.
- the operation unit 25 includes, for example, a button provided in the diagnosis support apparatus 2, a keyboard or mouse connected to the diagnosis support apparatus 2, or a touch panel mounted on the display unit 27.
- the recording control unit 22 sends a measurement data transmission request to the biological information measuring device 1 via the communication unit 21 in a state where communication between the communication unit 16 and the communication unit 21 of the biological information measuring device 1 is established. Do.
- the recording control unit 22 acquires the measurement data received from the biological information measuring device 1 by the communication unit 21 in response to this transmission request, and records it in the recording medium 23.
- the recording control unit 22 compares the measurement data recorded on the recording medium 23 with the measurement data recorded on the biological information measuring device 1 and requests transmission of only new measurement data that is not recorded on the recording medium 23. I do.
- the fluctuation state information generation unit 24 acquires measurement data for a predetermined period of measurement data recorded in the recording medium 23, and divides the acquired measurement data for the predetermined period into a plurality of sections.
- the predetermined period is set by a period arbitrarily set by a doctor who operates the diagnosis support apparatus 2 by operating the operation unit 25 (for example, a specific day, a specific week, a specific time zone on a specific day, etc.) Is done.
- a graph of measurement data recorded in the recording medium 23 may be displayed on the display unit 27, and a period selected by operating the operation unit 25 in the displayed graph may be set as a predetermined period. .
- the measurement data for a predetermined period refers to measurement data to which the time based on the detection time information belongs in this predetermined period.
- the variation state information generation unit 24 selects 100 pieces of measurement data for a predetermined period in order from the oldest detection time, and is determined by the detection time information included in each of the selected 100 pieces of measurement data. Is divided into a plurality of sections for a predetermined period. Note that there may be less than 100 pieces of measurement data for the last of the plurality of sections.
- the fluctuation state information generation unit 24 sequentially selects the measurement data for a predetermined period from the oldest detection time in order of one minute, and includes the selected measurement data for each minute.
- the measurement data for a predetermined period is divided into a plurality of sections, with the period determined by the detected time information as one section.
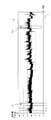
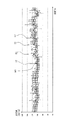
- FIG. 2 is a diagram showing an example of a graph of measurement data for a predetermined period.
- the vertical axis in FIG. 2 shows SBP as an example of blood pressure information, and the horizontal axis shows the detection time of the pulse wave used for the calculation of SBP.
- the fluctuation state information generation unit 24 records the plurality of sections thus divided in the recording medium 23 in association with the younger section numbers (numbers) in order from the oldest time.
- the fluctuation state information generation unit 24 generates fluctuation state information indicating the fluctuation state of the blood pressure information in an arbitrary section, and associates the generated fluctuation state information with the section No of the arbitrary section in the recording medium 23. Record.
- the fluctuation state information generation unit 24 repeatedly performs the process of generating the fluctuation state information for each type of blood pressure information.
- the fluctuation state information generation unit 24 generates and records the fluctuation state information for each section for the SBP for a predetermined period, generates and records the fluctuation state information for each section for the DBP for the predetermined period, Fluctuation state information is generated and recorded for each section for the MBP of minutes.
- the fluctuation state information of blood pressure information in an arbitrary section includes the maximum value of blood pressure information (SBP, DBP, or MBP) in this section, and the minimum value of blood pressure information (SBP, DBP, or MBP) in this section, It is composed of representative values of blood pressure information (SBP, DBP, or MBP) in this section.
- the representative value of blood pressure information in a certain section indicates the trend of the entire section such as the average value of blood pressure information in this section, the mode value of blood pressure information in this section, or the central value of blood pressure information in this section. Value.
- the display control unit 26 causes the display unit 27 to display a first graph indicating the variation state information for each section recorded in the recording medium 23. Under the control of the display control unit 26, the first graph illustrated in FIG. 3 is displayed on the display unit 27.
- the variation state information that can be displayed on the display unit 27 includes information generated for SBP, information generated for DBP, and information generated for MBP.
- the diagnosis support apparatus 2 may be configured to specify that a plurality of first graphs each indicating variation state information relating to a plurality of types of blood pressure information are displayed at the same time, or a blood pressure selected from the three types of blood pressure information. It may be possible to designate to display only the first graph indicating the variation state information regarding the information.
- FIG. 3 is a diagram illustrating a display example of a first graph indicating the variation state information for each section generated by the variation state information generation unit 24 from the measurement data for a predetermined period illustrated in FIG.
- the vertical axis in FIG. 3 indicates the blood pressure value [mmHg], and the horizontal axis indicates the section No.
- FIG. 3 shows a first graph showing the variation state information generated from the SBP.
- FIG. 3 shows an enlarged view of the image showing the fluctuation state information. This enlarged view is for explanation and is not displayed on the display unit 27.
- the image indicating the variation state information included in the first graph includes a horizontal bar M1 indicating the plot position of the maximum value of SBP in the section, a horizontal bar M2 indicating the plot position of the minimum value of SBP in the section, and a horizontal bar.
- 3 constitutes an image showing the difference between the representative value of the blood pressure information in each section and each of the maximum value and the minimum value.
- the first graph includes a curve M5 connecting black circles M4 included in the image indicating the variation state information corresponding to each section.
- the doctor can easily grasp the overall tendency of SBP in a predetermined period by the curve M5.
- the doctor can easily grasp the section where the fluctuation of SBP is large by the length of the vertical bar M3.
- the doctor can grasp the fluctuation state of the SBP in the section in more detail by the position of the black circle M4 on the vertical bar M3.
- the display is performed.
- the control unit 26 corresponds to the selected image D1 the display range to be displayed on the display unit 27 in the SBP for a predetermined period of FIG. 2 which is the original data of the first graph shown in FIG.
- the second graph is set on the section and the SBP within the set display range is displayed on the display unit 27 in time series.
- FIG. 2 shows a display range H set by the display control unit 26.
- the width K2 in the time direction of the display range H is set to be the same as the width in the time direction of the section K1.
- the display control unit 26 sets the display range H in the section corresponding to the image D1, and the SBP within the set display range H (that is, the SBP belonging to the section corresponding to the image D1). Is enlarged and displayed on the display unit 27.
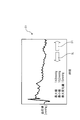
- FIG. 4 is a diagram illustrating a display example of the second graph indicating the SBP within the display range H set by the display control unit 26.
- the display control unit 26 causes the display unit 27 to display the second graph G ⁇ b> 1 in which the SBP within the display range H is expanded among the SBPs for a predetermined period shown in FIG. 2.
- the display control unit 26 displays the maximum value, the minimum value, and the maximum change amount of the SBP in the display range H together with the second graph G1.
- the maximum change amount indicates a value of the difference when the difference between adjacent SBPs among the SBPs in the display range H becomes the largest.
- the display control unit 26 displays the scroll button SL and the scroll button SR for instructing the movement of the display range H together with the second graph G1.
- the scroll button SL is a button for instructing to move the display range H set for the SBP for a predetermined period shown in FIG. 2 to the left (in the direction in which the detection time becomes older).
- the scroll button SR is a button for instructing to move the display range H set for the SBP for a predetermined period shown in FIG. 2 to the right (in the direction in which the detection time becomes new).
- the display control unit 26 may display the first graph shown in FIG. 3 and the second graph G1 shown in FIG. 4 by switching the screen, but the first graph shown in FIG. The second graph G1 shown in FIG. 4 may be displayed together on the same screen.
- the display control unit 26 instructs the display range H shown in FIG. 2 according to the movement instruction. It is moved in a predetermined direction by a predetermined amount.
- the display control unit 26 moves the display range H by a predetermined amount in the right direction in FIG.
- the display control unit 26 updates the second graph G1 sequentially following this change.
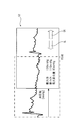
- FIG. 5 is a diagram showing a display example after the scroll button SR is pressed in a state where the second graph G1 shown in FIG. 4 is displayed.
- the graph in the rectangle indicated by the alternate long and short dash line is a second graph indicating the SBP displayed before the display range H is moved.
- the display range H moves to the right side, and the second graph G1 is updated like the second graph G2.
- the scroll display of the SBP allows the doctor to easily select the SBP before and after the section corresponding to the image D1 that is initially selected without having to select another image indicating the variation state information. Can be confirmed. This makes it possible to efficiently determine the factor of SBP fluctuation.
- the amount of movement of the display range H when the scroll button SR or the scroll button SL is pressed may be an arbitrary value, but a value smaller than the width K2 of the display range H (for example, the width K2). It is preferable that the value be equal to or less than half of the value.
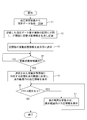
- FIG. 6 is a flowchart for explaining the operation of the diagnosis support apparatus 2.
- the recording control unit 22 is stored in the recording medium 14 of the biological information measuring device 1.
- the recorded measurement data is acquired and recorded on the recording medium 23 (step S1).
- the fluctuation state information generation unit 24 divides measurement data (measurement data group) for a predetermined period recorded on the recording medium 23 into a plurality of sections, generates fluctuation state information for each section, and generates the recording medium 23. (Step S2)
- the display control unit 26 causes the display unit 27 to display a first graph indicating the variation state information for each section recorded in the recording medium 23 (step S3).
- the display control unit 26 determines whether any variation state information included in the first graph being displayed has been selected (step S4).
- step S4 determines that the variation state information is not selected (step S4: NO)
- step S4 determines that the variation state information is selected (step S4: YES)
- step S5 the step is performed.
- step S ⁇ b> 5 the display control unit 26 sets a section corresponding to the selected fluctuation state information as a display range, and expands the second graph showing blood pressure information within the set display range in time series on the display unit 27. Display.
- the display control unit 26 determines whether or not the scroll button SR or the scroll button SL is pressed during display of the second graph (step S6).
- step S6 NO
- the process is terminated.
- step S6 When the display control unit 26 determines that the scroll button SR or the scroll button SL has been pressed (step S6: YES), the display range is moved according to the scroll instruction, and the blood pressure information within the display range is enlarged and displayed ( Step S7). After step S7, the process returns to step S6.
- the diagnosis support apparatus 2 As described above, according to the diagnosis support apparatus 2, the first graph shown in FIG. 3 displayed based on a huge amount of blood pressure information measured every one beat or every plurality of beats from the measured person, It is possible to easily grasp the overall blood pressure information tendency of the measurement subject.
- the scroll button SR and the scroll button SL are displayed together with the second graph shown in FIG. 4, and the display range of the blood pressure information can be arbitrarily moved by pressing the scroll button SR or the scroll button SL.
- diagnosis can be performed efficiently.
- the width K2 of the display range set by the display control unit 26 is assumed to be the same as each section K1 obtained by dividing blood pressure information for a predetermined period.
- the width K2 of the display range may be wider than the width of the section K1.
- the display control unit 26 sets a total of three sections, the selected section and one section before and after this section, as the display range, or selects the selected section and before or after this section. It is also possible to set a total of two sections with the display range. That is, the width K2 of the display range may be twice or three times the width of the section K1.
- the display control unit 26 of the diagnosis support apparatus 2 resembles the variation state information of the section adjacent to the section including the blood pressure information displayed as the second graph (also referred to as the currently displayed section) and the selected variation state information.
- the second graph also referred to as the currently displayed section
- the case where the image D1 is selected in the first graph shown in FIG. 3 and the second graph G1 shown in FIG. 4 is displayed is taken as an example.
- the display control unit 26 includes first change state information corresponding to the right-side section of the section (displayed section) corresponding to the image D1 shown in FIG. 3 and the change state information indicated by the image D1.
- the similarity and the second similarity between the fluctuation state information corresponding to the left adjacent section of the section corresponding to the image D1 (displayed section) shown in FIG. 3 and the fluctuation state information indicated by the image D1. judge.
- the display control unit 26 determines that the variation state information corresponding to these two sections has a similarity equal to or greater than a threshold value.
- the display control unit 26 determines that the degree of similarity of the variation state information corresponding to the two sections is less than the threshold.
- the display control unit 26 obtains a value obtained by subtracting the minimum value from the maximum value of the blood pressure information included in the fluctuation state information corresponding to one of the two sections to be determined for similarity, and the two sections.
- the variation state information corresponding to the two sections has a similarity degree. It determines with it being more than a threshold value.
- the display control unit 26 determines that the degree of similarity of the variation state information corresponding to the two sections is less than the threshold.
- the display control unit 26 resembles the variation state information corresponding to the selected section in the adjacent section adjacent to the currently displayed section including the blood pressure information displayed as the second graph. It is determined whether there is a piece that is associated with the fluctuation state information (whether there is an adjacent section having a high similarity to the selected section).
- the display control unit 26 determines that there is an adjacent section having a high degree of similarity with the selected section, the display control unit 26 combines information for notifying the direction of the adjacent section determined to have a high degree of similarity with the second graph. To display.
- FIG. 7 is a diagram illustrating a display example of the second graph in a case where it is determined that the degree of similarity of the section on the right side of the displayed section is high.
- the second graph G1a shown in FIG. 7A is obtained by changing the scroll button SR to the scroll button SRa in the second graph G2 shown in FIG.
- the scroll button SRa is highlighted by blinking the scroll button SR or changing the display color to a color different from the scroll button SL.
- the display control section 26 displays the scroll button SRa as information for notifying the right direction.
- the second graph G1b shown in FIG. 7B is obtained by adding a broken line SRb to the right end of the graph in the second graph G2 shown in FIG.
- the display control unit 26 determines that the similarity of the right adjacent segment to the currently displayed segment is high, the display control unit 26 displays the broken line SRb as information for notifying the right direction.
- diagnosis can be efficiently performed by notifying the direction of the adjacent section in which the blood pressure information shows a tendency similar to the selected section.
- the display control unit 26 selects the section having a new time among the two sections being displayed.
- the similarity between the section adjacent to the right and the section corresponding to the image D1 is determined, and if the similarity is equal to or greater than a threshold value, for example, a broken line as shown in FIG. 7B at the right end of the second graph G2. Is displayed.
- the display control unit 26 determines the similarity between the section that is adjacent to the left of the section having the oldest time (the section corresponding to the image D1) and the section corresponding to the image D1 among the two sections being displayed. If the degree of similarity is greater than or equal to the threshold value, for example, a broken line as shown in FIG. 7B is displayed at the left end of the second graph G2. Thereby, even when a scroll operation is performed, it is possible to notify the doctor of the presence and direction of a section having a high degree of similarity.
- FIG. 8 is a diagram illustrating an example in which the width K2 of the display range set by the display control unit 26 is wider than the width of the section K1.
- FIG. 9 is a diagram illustrating a display example of the second graph G3 indicating the SBP within the display range H illustrated in FIG.
- the SBP in the range indicated by reference numeral 60 is the SBP of the section corresponding to the image D1 selected by the doctor.
- the SBP in the range indicated by reference numeral 61 is a part of the SBP in the section adjacent to the left of the section corresponding to the image D1 selected by the doctor.
- the display control unit 26 includes all the SBPs of the section corresponding to the image D1 selected by the doctor, and the maximum value of the SBPs of this section is the center of the display range H.
- a display range H having a width K2 larger than the width of the section K1 is set.
- the maximum value of the SBPs in the section corresponding to the selected image D1 is displayed at the center in the horizontal axis direction.
- the doctor first confirms the point where the SBP greatly fluctuates in the selected section. For this reason, by displaying the second graph G3 centered on this point, the point portion can be confirmed smoothly and diagnosis can be performed efficiently.
- a method of changing the display form there are a method of changing the color of the SBP graph, a method of changing the type of the SBP graph (solid line, broken line, one-dot chain line, etc.), and the like.
- the SBP in the range indicated by reference numeral 61 and the SBP in the range indicated by reference numeral 60 are displayed in different colors, or the SBP in the range indicated by reference numeral 61 is displayed by a broken line.
- the SBP in the range shown is displayed with a solid line.
- the doctor can easily determine which section he / she has selected first, and can proceed with diagnosis efficiently.
- the display control unit 26 displays the first graph shown in FIG. 3 and the second graph shown in FIGS. 4, 5, and 9 together on the same screen, the second graph is displayed. It is preferable to highlight the image showing the variation state information corresponding to the section including the SBP displayed as.
- FIG. 10 is a diagram showing a first modification of the first graph.
- the display unit 27 displays the SBP of the section selected by the doctor and the SBP of the section adjacent to the right of this section.
- the display control unit 26 highlights the image D1 and the image D2 indicating the variation state information corresponding to the right adjacent section of the section corresponding to the image D1.
- the display control unit 26 displays the mark E1 in the vicinity of each of the image D1 and the image D2. Or the display control part 26 displays the image D1 and the image D2 in a different color from the image which shows other fluctuation state information.
- FIG. 11 is a diagram illustrating an example in which the first graph and the second graph are displayed on the display unit 27 together.
- the display control unit 26 displays the first graph shown in FIG. 10 and the second graph G2 shown in FIG. 5 on one screen as shown in FIG.
- the overall tendency of the blood pressure information and the details of the blood pressure information in a desired section can be confirmed on the same screen, and the diagnosis can be performed efficiently.
- FIG. 12 is a diagram showing a second modification of the first graph.
- the display control unit 26 calculates the fluctuation amount of the average value of the blood pressure information constituting the fluctuation state information (a value obtained by subtracting the average value corresponding to the section with the old time from the average value corresponding to the section with the new time), The image corresponding to the section in which the fluctuation amount is equal to or greater than the threshold is highlighted.
- the display control unit 26 displays the mark E2 in the vicinity of the image corresponding to the section where the variation amount of the average value is equal to or greater than the threshold value.
- the blood pressure information should be suspected of something abnormal when the average value suddenly increases. Since the mark E2 is displayed as shown in FIG. 12, since it is possible to instantly grasp where the fluctuation amount of the average value of the blood pressure information is large, diagnosis can be performed efficiently. It becomes.
- the image indicating the variation state information may be selected by touching the mark E2 on the touch panel or clicking with the mouse. *
- the biological information calculation unit 11 of the biological information measuring device 1 calculates and records blood pressure information as biological information.
- the biological information calculation unit 11 may calculate and record a pulse rate and a heart rate as biological information based on the pulse wave detected by the pulse wave detection unit 10.
- the biological information may be any information as long as the daily fluctuation is large and measurement at every beat or every beat is effective for diagnosis.
- the biological information measuring device 1 is an example of a device that measures biological information non-invasively
- the present invention can be similarly applied to a device that measures and records biological information invasively.
- the variation state information may be any information as long as the variation state in an arbitrary section of the biological information is known, and the representative value among the maximum value, the minimum value, and the representative value may be omitted. Further, the image indicating the variation state information is not limited to the one illustrated in FIG. 3 and may be any image that can intuitively understand the variation state.
- the second graph indicating the raw data of the blood pressure information is instantaneously displayed.
- the fluctuation state information generation unit 24 records blood pressure information belonging to the section corresponding to the selected image D1. Obtained from the medium 23, the obtained blood pressure information is divided into finer detailed sections, and fluctuation state information is again generated and recorded for each detailed section.
- blood pressure information acquired from the recording medium 23 (blood pressure information belonging to a section corresponding to the image D1) constitutes biological information for a predetermined period.
- the display control unit 26 causes the display unit 27 to display a first graph indicating the variation state information for each detailed section generated by the variation state information generation unit 24.
- the display control unit 26 converts the raw data of blood pressure information belonging to the detailed section corresponding to the arbitrary fluctuation state information to the second Display as a graph.
- the display is changed from the first graph to the first graph in which the width of the section to be divided is shortened, and the state is changed to the second graph.
- the display control unit 26 selects this arbitrary section as a detailed section of 1 minute. Display the first graph divided by.
- the diagnosis support program of this embodiment is recorded on a non-transitory recording medium that can be read by a computer.
- a non-transitory recording medium includes, for example, an optical medium such as a CD-ROM (Compact Disc-ROM), a magnetic recording medium such as a memory card, and the like.
- Such a program can also be provided by downloading via a network.
- the disclosed diagnosis support apparatus acquires biological information for a predetermined period from a recording unit that records biological information measured every beat or multiple beats from the living body, and obtains a plurality of the acquired biological information for the predetermined period.
- a display that displays a variation state information generation unit that generates variation state information that indicates a variation state of biological information in each interval and a first graph that indicates the variation state information for each interval on a display unit
- a control unit wherein the display control unit is configured to select one of the biological information for the predetermined period when any of the change state information in the first graph displayed on the display unit is selected.
- a display range to be displayed on the display unit is set to a range including biological information belonging to a section corresponding to the selected variation state information, and biological information within the set display range is shown in time series.
- the second graph It is intended to be displayed when the display unit.
- the display control unit displays the display according to the instruction when an instruction to move the display range is given while the second graph is displayed on the display unit.
- the range setting is updated, and the second graph is scroll-displayed.
- the display control unit calculates the similarity between the variation state information of the section adjacent to the section including the biological information displayed as the second graph and the selected variation state information. If there is an adjacent section where the similarity is equal to or greater than the threshold, information for notifying the direction of the section is displayed together with the second graph.
- the display control unit sets the display range so that the maximum value of the biological information belonging to the section corresponding to the selected variation state information is the center of the second graph.
- the display control unit displays the first graph and the second graph together with the display unit, and further displays the variation state information of the first graph. Among them, the process of emphasizing the variation state information of the section to which the biological information displayed as the second graph belongs is performed.
- the display control unit sets a range wider than the width of the section as the display range.
- the display control unit with respect to the biological information of the second graph, the biological information belonging to the section corresponding to the selected variation state information and the biological information belonging to a section other than the section.
- the information is displayed in different display formats.
- the change state information generation unit generates an image indicating a difference between the maximum value and the minimum value of the biological information in each section as the change state information.
- the variation state information generation unit generates an image indicating the difference between the representative value of the biological information and each of the maximum value and the minimum value as the variation state information in each section.
- the biological information includes blood pressure information.
- the disclosed diagnosis support method acquires biological information for a predetermined period from a recording unit that records biological information measured every beat or multiple beats from a living body, and acquires the acquired biological information for a plurality of periods.
- Display control that divides into sections and generates a state of change information indicating the state of change of biometric information in each section and a first graph showing the state of change information for each section on the display unit
- the display control step includes the step of selecting the variation state information in the first graph displayed on the display unit and selecting the variation information of the predetermined period.
- the display range to be displayed on the display unit is set to a range including biological information belonging to the section corresponding to the selected variation state information, and the biological information in the set display range is displayed in time series. It is intended to display the second graph on the display unit.
- the disclosed diagnosis support program acquires biological information for a predetermined period from a recording unit that records biological information measured every beat or multiple beats from a living body, and acquires the acquired biological information for a plurality of periods.
- Display control that divides into sections and generates a state of change information indicating the state of change of biometric information in each section and a first graph showing the state of change information for each section on the display unit
- a diagnostic support program for causing a computer to execute the step, wherein the display control step is performed when any of the variation state information in the first graph displayed on the display unit is selected.
- the biometric information belonging to the section corresponding to the selected variation state information includes a display range to be displayed on the display unit of the biometric information for the predetermined period.
- Set circumference is a second graph showing a time-series biometric information in the display range set as to be displayed on the display unit.
- the present invention can be used for medical treatment by supporting diagnosis.
Landscapes
- Health & Medical Sciences (AREA)
- Life Sciences & Earth Sciences (AREA)
- Engineering & Computer Science (AREA)
- Molecular Biology (AREA)
- Animal Behavior & Ethology (AREA)
- Biophysics (AREA)
- Pathology (AREA)
- Biomedical Technology (AREA)
- Heart & Thoracic Surgery (AREA)
- Medical Informatics (AREA)
- Veterinary Medicine (AREA)
- Surgery (AREA)
- Physics & Mathematics (AREA)
- General Health & Medical Sciences (AREA)
- Public Health (AREA)
- Cardiology (AREA)
- Vascular Medicine (AREA)
- Physiology (AREA)
- Human Computer Interaction (AREA)
- Measuring Pulse, Heart Rate, Blood Pressure Or Blood Flow (AREA)
- Measuring And Recording Apparatus For Diagnosis (AREA)
Abstract
拍単位で測定された生体情報に基づく診断の支援を効率的に行うことのできる診断支援装置、診断支援方法、及び、診断支援プログラムを提供する。診断支援装置2は、生体から1拍毎に測定された生体情報を記録する記録媒体23から、所定期間分の生体情報を取得して複数の区間に分割し、各区間における生体情報の変動状態を示す変動状態情報を生成し、区間毎の変動状態情報を示すグラフを表示部27に表示させる。更に、診断支援装置2は、表示部27に表示されているグラフにおいて任意の変動状態情報が選択された場合に、選択された変動状態情報に対応する区間に属する生体情報を時系列で示すグラフを表示部27に表示させる。
Description
本発明は、診断支援装置、診断支援方法、及び、診断支援プログラムに関する。
生体の診断に必要な生体情報(例えば、血圧値や脈拍数等)は、通常、日内変化が大きい。このため、診断等のために、被測定者から生体情報を継続的に測定し記録することが行われる。
このようにして継続的に測定された生体情報の測定データは、診断を行いやすい形で加工されたうえで、医師に提示することが好ましい。
例えば、特許文献1には、所定期間に渡って測定された脈波伝播速度を設定区間に分け、設定区間毎に、脈波伝播速度の平均値を算出し、この平均値を、その設定区間における脈波伝播速度の最大値及び最小値と併せて表示することで、動脈硬化の診断支援を行う装置が記載されている。
また、特許文献2には、血圧値と脈拍数を用いて算出される生体循環系の診断指標の推移をグラフ化して出力する方法が記載されている。この方法では、1か月ごとに、血圧値と脈拍数の測定を50回行って得られる測定値から50個の診断指標を算出し、この50個の診断指標のばらつき範囲を示す帯グラフを測定月毎に表示させている。
また、特許文献3には、1日に測定された複数回分の血圧情報(最高血圧、最低血圧、及び、平均血圧)の代表値を求め、1か月の代表値の平均値や、1週間の代表値の平均値や、1日の代表値をそれぞれ帯グラフ状にして表示する装置が記載されている。
この装置では、月毎の代表値が表示される画面において任意の月が指定されると、この月を構成する日毎の代表値が表示される画面に遷移し、月毎の代表値が表示される画面において任意の週が指定されると、この週を構成する日毎の代表値が表示される画面に遷移する。このように、特許文献3に記載の装置は、任意の期間における日毎の血圧情報の代表値を簡単に確認することができ、診断に役立てることができる。
また、特許文献4には、所定期間に渡って測定された生体情報の測定データを設定区間に分け、設定区間毎に生体情報の代表値(例えば平均値)を算出し、算出した平均値と測定データとを重ねて表示するシステムが記載されている。このシステムによれば、測定データだけでは変化の傾向がつかみづらい場合でも、代表値によって全体的な傾向を容易に把握することができる。
特許文献1~4は、分単位や時間単位や日単位といった長い時間間隔で生体情報を測定して記録していくことを想定している。しかし、このように長い時間間隔で生体情報を測定していると、生体情報を測定していない期間において大きな生体情報の変化があったときには、この変化を医師が知ることはできない。また、長い時間間隔で測定される生体情報の比較では、生体情報の変化そのものが発生していることやその原因を正確に知ることは難しい。
そこで、拍単位(例えば1拍や複数拍毎)で生体情報を測定する装置を用いれば、医師は患者の日常生活に起因する細かな生体情報の変化を正確に把握することが可能となる。しかし、拍単位で生体情報を測定する場合は、測定データが膨大な量となる。
このような膨大な量の測定データを用いる場合、測定期間全体の測定データの傾向を把握できることが診断において有効である。このため、測定データを特許文献1~4に例示される方法で加工して表示することが好ましい。
一方で、拍単位の生体情報は、生体情報の変化を詳細に把握するために必要であり、測定データの全体的な傾向だけでなく、特定の期間における測定データを詳細に確認したい場合もある。
特許文献4に記載のシステムによれば、測定データの全体的な傾向と、測定データの詳細とを同時に確認することができる。しかし、測定データの量が膨大になると、測定データの表示が細かくなって、詳細を確認しにくくなり、効率的な診断支援を実現できない。
特許文献1,3に記載の装置や特許文献2に記載の方法は、測定データの加工前のデータを確認することについては考慮されていない。
本発明は、上記事情に鑑みてなされたものであり、拍単位で測定された生体情報に基づく診断の支援を効率的に行うことのできる診断支援装置、診断支援方法、及び、診断支援プログラムを提供することを目的とする。
本発明の診断支援装置は、生体から1拍又は複数拍毎に測定された生体情報を記録する記録部から、所定期間分の生体情報を取得し、取得した前記所定期間分の生体情報を複数の区間に分割し、各区間における生体情報の変動状態を示す変動状態情報を生成する変動状態情報生成部と、前記区間毎の前記変動状態情報を表示部に表示させる表示制御部と、を備え、前記表示制御部は、前記表示部に表示されている任意の前記変動状態情報が選択された場合に、前記所定期間分の生体情報のうちの前記表示部への表示対象とする表示範囲を、選択された前記変動状態情報に対応する区間に属する生体情報を含む範囲に設定し、設定した前記表示範囲内の生体情報を前記表示部に表示させるものである。
本発明の診断支援方法は、生体から1拍又は複数拍毎に測定された生体情報を記録する記録部から所定期間分の生体情報を取得し、取得した前記所定期間分の生体情報を複数の区間に分割し、各区間における生体情報の変動状態を示す変動状態情報を生成する変動状態情報生成ステップと、前記区間毎の前記変動状態情報を表示部に表示させる表示制御ステップと、を備え、前記表示制御ステップは、前記表示部に表示されている任意の前記変動状態情報が選択された場合に、前記所定期間分の生体情報のうちの前記表示部への表示対象とする表示範囲を、選択された前記変動状態情報に対応する区間に属する生体情報を含む範囲に設定し、設定した前記表示範囲内の生体情報を前記表示部に表示させるものである。
本発明の診断支援プログラムは、生体から1拍又は複数拍毎に測定された生体情報を記録する記録部から所定期間分の生体情報を取得し、取得した前記所定期間分の生体情報を複数の区間に分割し、各区間における生体情報の変動状態を示す変動状態情報を生成する変動状態情報生成ステップと、前記区間毎の前記変動状態情報を表示部に表示させる表示制御ステップと、をコンピュータに実行させるための診断支援プログラムであって、前記表示制御ステップは、前記表示部に表示されている任意の前記変動状態情報が選択された場合に、前記所定期間分の生体情報のうちの前記表示部への表示対象とする表示範囲を、選択された前記変動状態情報に対応する区間に属する生体情報を含む範囲に設定し、設定した前記表示範囲内の生体情報を前記表示部に表示させるものである。
本発明によれば、拍単位で測定された生体情報に基づく診断の支援を効率的に行うことのできる診断支援装置、診断支援方法、及び、診断支援プログラムを提供することができる。
以下、本発明の実施形態について図面を参照して説明する。
図1は、本発明の一実施形態を説明するための診断支援システム100の概略構成を示す図である。診断支援システム100は、生体情報測定装置1と、診断支援装置2と、を備える。
生体情報測定装置1は、携帯型となっており、生体としての被測定者の手首に装着して用いられる。
生体情報測定装置1は、脈波検出部10と、生体情報算出部11と、記録制御部13と、フラッシュメモリやROM(Read Only Memory)やメモリカード等の記録媒体14と、通信制御部15と、通信部16と、を備える。記録媒体14は装置に着脱可能なものであってもよい。
生体情報算出部11と記録制御部13と通信制御部15は、プロセッサがプログラムを実行することによって構成される機能ブロックである。
脈波検出部10は、被測定者の手首から非侵襲で脈波を検出する。
脈波検出部10は、例えばトノメトリ法によって脈波としての圧脈波を検出するものが用いられる。脈波検出部10は、脈波として容積脈波を検出するものであってもよい。脈波検出部10は、動脈に光を当てて得られる動脈からの反射光によって脈波を検出するものであってもよい。
脈波検出部10は、1拍(心臓が1回拍動する期間)毎に発生する脈波を検出し、検出した脈波を生体情報算出部11に伝達する。
生体情報算出部11は、脈波検出部10によって検出された脈波に基づいて1拍毎又は複数拍毎(複数拍に1回の頻度)に生体情報としての血圧情報を算出する。
血圧情報には、収縮期血圧(SBP(systolic blood pressure))と、拡張期血圧(DBP(diastolic blood pressure))と、平均血圧(MBP(mean blood pressure))との少なくとも1つが含まれる。
血圧情報の算出方法は公知の手法を用いることができる。生体情報算出部11は、任意の脈波の検出日時を示す検出日時情報と、この脈波に基づいて算出した血圧情報とを対応付けた測定データを、記録制御部13に伝達する。
記録制御部13は、生体情報算出部11から伝達される測定データを記録媒体14に記録する。
記録制御部13の制御により、記録媒体14には、生体情報算出部11により算出された血圧情報と、この血圧情報の元となる脈波の検出時刻を示す検出時刻情報とを含む測定データが複数記録される。
通信部16は、有線又は無線によって外部機器との通信を行うためのインターフェースである。
通信制御部15は、記録媒体14に記録された複数の測定データを、通信部16を介して外部機器に送信する制御を行う。
診断支援装置2は、通信部21と、記録制御部22と、フラッシュメモリやROMやメモリカード等の記録媒体23と、変動状態情報生成部24と、操作部25と、表示制御部26と、表示部27と、を備える。
記録媒体23は診断支援装置2に着脱可能なものであってもよい。記録媒体23は記録部を構成する。
記録制御部22と変動状態情報生成部24と表示制御部26は、プロセッサが診断支援プログラムを実行することによって構成される機能ブロックである。
診断支援装置2は、診断支援のための専用装置であってもよいし、スマートフォンやタブレット端末等の汎用の電子機器であってもよい。
通信部21は、有線又は無線によって外部機器との通信を行うためのインターフェースである。
表示部27は、診断支援のための各種情報を表示するものであり、液晶表示素子や有機電界発光素子等を用いたものが用いられる。
表示部27は、診断支援装置2に内蔵されていなくてもよく、診断支援装置2の外部に設けられて、診断支援装置2と有線又は無線によって接続されたものであってもよい。
操作部25は、診断支援装置2を操作するためのインターフェースである。
操作部25は、例えば診断支援装置2に設けられたボタン、診断支援装置2に接続されたキーボードやマウス、又は、表示部27に搭載されたタッチパネル等により構成される。
記録制御部22は、生体情報測定装置1の通信部16と通信部21との通信が確立された状態で、通信部21を介して、生体情報測定装置1に対して測定データの送信要求を行う。
記録制御部22は、この送信要求によって通信部21が生体情報測定装置1から受信した測定データを取得し、記録媒体23に記録する。
記録制御部22は、記録媒体23に記録済みの測定データと、生体情報測定装置1に記録されている測定データとを比較して、記録媒体23に記録されていない新しい測定データのみの送信要求を行う。
変動状態情報生成部24は、記録媒体23に記録されている測定データのうちの所定期間分の測定データを取得し、取得した所定期間分の測定データを複数の区間に分割する。
この所定期間は、操作部25の操作によって診断支援装置2を操作する医師が任意に設定した期間(例えば特定の1日、特定の1週間、特定の日の特定の時間帯等)等が設定される。または、記録媒体23に記録されている測定データのグラフを表示部27に表示させ、表示されているグラフにおいて操作部25の操作によって選択された期間が所定期間として設定されるようにしてもよい。
所定期間分の測定データとは、この所定期間に検出時刻情報に基づく時刻が属する測定データのことを言う。
測定データの分割方法について説明する。
例えば、変動状態情報生成部24は、所定期間分の測定データを、検出時刻が古いものから順に100個ずつ選択していき、選択した各100個の測定データに含まれる検出時刻情報で決まる期間を1つの区間として、所定期間分の測定データを複数の区間に分割する。なお、複数の区間のうちの最後の区間に関しては測定データが100個未満となる場合がある。
または、変動状態情報生成部24は、所定期間分の測定データを、検出時刻が古いものから順に、1分間分の測定データを順次選択していき、選択した各1分間分の測定データに含まれる検出時刻情報で決まる期間を1つの区間として、所定期間分の測定データを複数の区間に分割する。
図2は、所定期間分の測定データのグラフの一例を示す図である。図2の縦軸は血圧情報の一例としてSBPを示しており、横軸はSBPの算出に用いられた脈波の検出時刻を示している。
変動状態情報生成部24は、図2に示すように、検出時刻tk-1(k=1、2、3、・・・、n)から検出時刻tkまでを1つの区間K1として、図2に示す所定期間分の測定データを複数の区間に分割する。
変動状態情報生成部24は、このようにして分割した複数の区間に対して、時刻が古いものから順に若い区間No(ナンバー)を対応付けて記録媒体23に記録する。
更に、変動状態情報生成部24は、任意の区間における血圧情報の変動状態を示す変動状態情報を生成し、生成した変動状態情報を、この任意の区間の区間Noに対応付けて記録媒体23に記録する。
変動状態情報生成部24は、変動状態情報を生成する処理を、血圧情報の種類分、繰り返し行う。
つまり、変動状態情報生成部24は、所定期間分のSBPについて区間毎に変動状態情報を生成して記録し、所定期間分のDBPについて区間毎に変動状態情報を生成して記録し、所定期間分のMBPについて区間毎に変動状態情報を生成して記録する。
任意の区間における血圧情報の変動状態情報は、この区間における血圧情報(SBP、DBP、又は、MBP)の最大値と、この区間における血圧情報(SBP、DBP、又は、MBP)の最小値と、この区間における血圧情報(SBP、DBP、又は、MBP)の代表値とから構成される。
ある区間における血圧情報の代表値とは、この区間における血圧情報の平均値、この区間における血圧情報の最頻値、又は、この区間における血圧情報の中心値等の区間全体の傾向を示している値である。
表示制御部26は、記録媒体23に記録された区間毎の変動状態情報を示す第一のグラフを表示部27に表示させる。この表示制御部26の制御によって、表示部27には、図3に例示する第一のグラフが表示される。
表示部27に表示させることのできる変動状態情報は、SBPについて生成されたもの、DBPについて生成されたもの、MBPについて生成されたものがある。
診断支援装置2では、複数種類の血圧情報に関する変動状態情報をそれぞれ示す複数の第一のグラフを同時に表示するよう指定できるようにしてもよいし、3種類の血圧情報の中から選択された血圧情報に関する変動状態情報を示す第一のグラフだけを表示するよう指定できるようにしてもよい。
図3は、図2に示す所定期間分の測定データから変動状態情報生成部24により生成された区間毎の変動状態情報を示す第一のグラフの表示例を示す図である。図3の縦軸は血圧値[mmHg]を示し、横軸は区間Noを示す。図3は、SBPから生成された変動状態情報を示す第一のグラフを示している。
図3の下側には、変動状態情報を示す画像を拡大した図を示している。この拡大図は説明のためであり、表示部27には表示されない。
第一のグラフに含まれる変動状態情報を示す画像は、区間内のSBPの最大値のプロット位置を示す横棒M1と、区間内のSBPの最小値のプロット位置を示す横棒M2と、横棒M1と横棒M2とを結ぶ縦棒M3と、縦棒M3上に重ねられた区間内のSBPの平均値のプロット位置を示す黒い丸印M4と、により構成されている。
図3に示した変動状態情報を示す画像は、各区間における血圧情報の代表値と最大値及び最小値の各々との差を示す画像を構成する。
また、第一のグラフには、各区間に対応する変動状態情報を示す画像に含まれる黒い丸印M4同士を結んだ曲線M5が含まれる。
図3に示す第一のグラフを見ることにより、医師は、曲線M5によって、所定期間におけるSBPの全体的な傾向を容易に把握することができる。
また、医師は、縦棒M3の長さによって、SBPの変動が大きくなっている区間を容易に把握することができる。
さらに、医師は、変動状態情報を示す1つの画像に着目した場合に、縦棒M3における黒い丸印M4の位置によって、その区間におけるSBPの変動状態をより詳細に把握することができる。
図3に示す第一のグラフが表示されている状態で、操作部25が操作され、変動状態情報を示す画像のうちの1つ(例えば、図3の画像D1)が選択されると、表示制御部26は、図3に示す第一のグラフの元データである図2の所定期間分のSBPのうちの表示部27への表示対象とする表示範囲を、選択された画像D1に対応する区間に設定し、設定した表示範囲内のSBPを時系列で示す第二のグラフを表示部27に表示させる。
図2には、表示制御部26によって設定される表示範囲Hが示されている。表示範囲Hの時刻方向の幅K2は、区間K1の時刻方向の幅と同じに設定される。
表示制御部26は、画像D1が選択されると、この画像D1に対応する区間に表示範囲Hを設定し、設定した表示範囲H内のSBP(すなわち、画像D1に対応する区間に属するSBP)を時系列で示す第二のグラフを表示部27に拡大表示させる。
図4は、表示制御部26によって設定された表示範囲H内のSBPを示す第二のグラフの表示例を示す図である。表示制御部26は、図4に示すように、図2に示す所定期間分のSBPのうち、表示範囲H内のSBPを拡大した第二のグラフG1を表示部27に表示させる。
また、表示制御部26は、第二のグラフG1と共に、表示範囲H内のSBPのうちの最大値と最小値と最大変化量とを表示させる。最大変化量とは、表示範囲H内のSBPのうち、隣り合うSBPの差が最も大きくなったときのその差の値を示す。
また、表示制御部26は、第二のグラフG1と共に、表示範囲Hの移動を指示するためのスクロールボタンSL及びスクロールボタンSRを表示させる。
スクロールボタンSLは、図2に示した所定期間分のSBPに対して設定される表示範囲Hを左側(検出時刻が古くなる方向)に移動させる指示を行うためのボタンである。
スクロールボタンSRは、図2に示した所定期間分のSBPに対して設定される表示範囲Hを右側(検出時刻が新しくなる方向)に移動させる指示を行うためのボタンである。
なお、表示制御部26は、図3に示す第一のグラフと図4に示す第二のグラフG1とを画面を切り替えて表示させてもよいが、図3に示す第一のグラフと、図4に示す第二のグラフG1とを同一画面上で併せて表示させるのがよい。
このようにすることで、SBPの全体的な傾向と、所望の区間における詳細なSBPとを画面切り換えなく把握することができるため、診断を効率的に行うことができる。
操作部25の操作によって、スクロールボタンSL又はスクロールボタンSRが押されて表示範囲Hの移動指示がなされると、表示制御部26は、図2に示した表示範囲Hをこの移動指示にしたがって指示された方向に予め決められた所定量だけ移動させる。
図4に示すように第二のグラフG1が表示された状態で、スクロールボタンSRが1回押されると、表示制御部26は、表示範囲Hを図2において右方向に所定量移動させる。
表示範囲Hの移動中は、表示範囲H内のSBPが逐次変化するため、この変化に追従させて、表示制御部26は、第二のグラフG1を逐次更新する。
図5は、図4に示す第二のグラフG1が表示された状態で、スクロールボタンSRが押された後の表示例を示す図である。
図5において、一点鎖線で示す矩形内のグラフは、表示範囲Hが移動される前に表示されていたSBPを示す第二のグラフである。図5に示すように、スクロールボタンSRが押されることで、表示範囲Hが右側に移動し、第二のグラフG1は第二のグラフG2のように更新される。
このように、SBPがスクロール表示されることで、医師は、最初に選択した画像D1に対応する区間の前後の区間のSBPを、変動状態情報を示す他の画像を改めて選択することなく、容易に確認することができる。これにより、SBPの変動の要因の判断を効率的に行うことができる。
スクロールボタンSR又はスクロールボタンSLが押された場合の表示範囲Hの移動量(上記の所定量)は、任意の値とすればよいが、表示範囲Hの幅K2よりは小さい値(例えば幅K2の半分以下の値)とするのが好ましい。
このようにすることで、スクロール操作がなされた場合でも、最初に選択された画像D1に対応する区間のSBPの大部分を表示させたままとすることができ、診断を効率的に行うことが可能となる。
次に、以上のように構成された診断支援装置2の動作を、フローチャートを用いて説明する。
図6は、診断支援装置2の動作を説明するためのフローチャートである。
生体情報測定装置1と診断支援装置2が通信可能な状態となり、操作部25が操作されて測定データの取得指示がなされると、記録制御部22は、生体情報測定装置1の記録媒体14に記録されている測定データを取得し、記録媒体23に記録する(ステップS1)。
次に、変動状態情報生成部24は、記録媒体23に記録された所定期間分の測定データ(測定データ群)を複数の区間に分割し、区間毎に変動状態情報を生成して記録媒体23に記録する(ステップS2)
次に、表示制御部26は、記録媒体23に記録された区間毎の変動状態情報を示す第一のグラフを表示部27に表示させる(ステップS3)。
次に、表示制御部26は、表示中の第一のグラフに含まれるいずれかの変動状態情報が選択されたか否かを判定する(ステップS4)。
表示制御部26は、変動状態情報が選択されていないと判定した場合(ステップS4:NO)はステップS4の処理を繰り返し、変動状態情報が選択されたと判定した場合(ステップS4:YES)はステップS5の処理を行う。
ステップS5において、表示制御部26は、選択された変動状態情報に対応する区間を表示範囲に設定し、設定した表示範囲内の血圧情報を時系列で示す第二のグラフを表示部27に拡大表示させる。
次に、表示制御部26は、第二のグラフの表示中にスクロールボタンSR又はスクロールボタンSLが押されたか否かを判定する(ステップS6)。
表示制御部26は、スクロールボタンSR又はスクロールボタンSLが押されていないと判定した場合(ステップS6:NO)は処理を終了する。
表示制御部26は、スクロールボタンSR又はスクロールボタンSLが押されたと判定した場合(ステップS6:YES)は、スクロール指示に応じて表示範囲を移動させ、表示範囲内の血圧情報を拡大表示させる(ステップS7)。ステップS7の後はステップS6に処理が戻る。
以上のように、診断支援装置2によれば、被測定者から1拍毎又は複数拍毎に測定された膨大な量の血圧情報に基づいて表示される図3に示す第一のグラフによって、被測定者の全体的な血圧情報の傾向を容易に把握することができる。
また、第一のグラフに含まれる変動状態情報を選択することで、この変動状態情報に対応する区間の血圧情報を拡大した第二のグラフを確認することができる。このため、変動が大きい区間における血圧情報の詳細を瞬時に把握することができ、診断を効率的に行うことができる。
また、図4に示す第二のグラフと共に、スクロールボタンSRとスクロールボタンSLが表示され、スクロールボタンSR又はスクロールボタンSLを押すことで、血圧情報の表示範囲を任意に移動させることができる。このように、変動が大きい区間の前後の区間の血圧情報の詳細も瞬時に確認できるため、診断を効率的に行うことができる。
ここまでの説明では、表示制御部26が設定する表示範囲の幅K2を、所定期間分の血圧情報を分割して得られる各区間K1と同じにするものとした。この変形例として、表示範囲の幅K2を区間K1の幅より広くしてもよい。
例えば、表示制御部26は、選択されている区間と、この区間の前後それぞれ1つの区間との計3つの区間を表示範囲に設定したり、選択されている区間と、この区間の前又は後の区間との計2つの区間を表示範囲に設定したりしてもよい。つまり、表示範囲の幅K2を、区間K1の幅の2倍や3倍にしてもよい。
このように、医師により選択されている区間だけでなく、この区間に隣接する区間の血圧情報も拡大表示させることで、血圧変動がおこったときの前後の血圧の状態を瞬時に知ることができるため、診断に役立てることができる。
診断支援装置2の表示制御部26は、第二のグラフとして表示されている血圧情報を含む区間(表示中区間ともいう)の隣接区間の変動状態情報と、選択された変動状態情報との類似度を判定し、この類似度が閾値以上となる隣接区間がある場合には、第二のグラフと併せて、当該隣接区間の方向を通知するための情報を表示させることが好ましい。
例えば、図3に示す第一のグラフにおいて画像D1が選択されて、図4に示す第二のグラフG1が表示される場合を例にする。
この場合、表示制御部26は、図3に示す画像D1に対応する区間(表示中区間)の右隣の区間に対応する変動状態情報と、画像D1で示される変動状態情報との第一の類似度と、図3に示す画像D1に対応する区間(表示中区間)の左隣の区間に対応する変動状態情報と、画像D1で示される変動状態情報との第二の類似度と、を判定する。
表示制御部26は、類似度の判定対象となる2つの区間の各々に対応する2つの変動状態情報に含まれる血圧情報の最大値同士の差が予め決められた類似閾値以下である場合に、この2つの区間に対応する変動状態情報は類似度が閾値以上であると判定する。表示制御部26は、上記の差が類似閾値を超える場合に、この2つの区間に対応する変動状態情報は類似度が閾値未満であると判定する。
または、表示制御部26は、類似度の判定対象となる2つの区間の一方の区間に対応する変動状態情報に含まれる血圧情報の最大値から最小値を引いた値と、この2つの区間の他方の区間に対応する変動状態情報に含まれる血圧情報の最大値から最小値を引いた値との差が類似閾値以下である場合に、この2つの区間に対応する変動状態情報は類似度が閾値以上であると判定する。表示制御部26は、上記の差が類似閾値を超える場合に、この2つの区間に対応する変動状態情報は類似度が閾値未満であると判定する。
このように、表示制御部26は、第二のグラフとして表示している血圧情報を含む表示中区間に隣接する隣接区間の中に、選択された区間に対応する変動状態情報と似たような変動状態情報が対応付けられているものがあるか否か(選択された区間との類似度が高い隣接区間があるか否か)を判定する。
表示制御部26は、選択された区間との類似度が高い隣接区間があると判定した場合は、類似度が高いと判定した隣接区間の方向を通知するための情報を第二のグラフと併せて表示させる。
図7は、表示中区間の右隣の区間の類似度が高いと判定された場合の第二のグラフの表示例を示す図である。
図7(a)に示す第二のグラフG1aは、図4に示す第二のグラフG2において、スクロールボタンSRをスクロールボタンSRaに変更したものである。
スクロールボタンSRaは、スクロールボタンSRを点滅させたり、表示色をスクロールボタンSLとは異なる色に変えたりすることで強調表示したものである。
このように、表示制御部26は、表示中区間の右隣の区間の類似度が高いと判定した場合には、右方向を通知するための情報として、スクロールボタンSRaを表示させる。
図7(b)に示す第二のグラフG1bは、図4に示す第二のグラフG2において、グラフの右端に破線SRbを追加したものである。
このように、表示制御部26は、表示中区間の右隣の区間の類似度が高いと判定した場合には、右方向を通知するための情報として、破線SRbを表示させる。
以上のように、選択されている区間との類似度が高い隣接区間がある場合には、この隣接区間の方向を図7に示したように通知することで、診断を効果的に支援することができる。
例えば、血圧情報の最大値が大きい変動状態情報が最初に選択された場合を考える。この場合、医師は、血圧情報が大きくなっている区間に注目していると考えられる。
このため、選択された区間と同じように血圧情報の最大値が大きくなっている区間がある場合には、医師がその区間についても血圧情報の詳細を確認したいと考える可能性が高い。したがって、血圧情報が、選択されている区間と似たような傾向を示す隣接区間の方向を通知することで、診断を効率的に行うことが可能となる。
なお、スクロール操作によって、図5に示すように2つの区間にまたがって血圧情報が表示されている場合には、表示制御部26は、この表示中の2つの区間のうち、時刻が新しい区間の右に隣接する区間と、画像D1に対応する区間との類似度を判定し、類似度が閾値以上であれば、例えば第二のグラフG2の右端に図7(b)に示したような破線を表示させる。
また、表示制御部26は、この表示中の2つの区間のうち、時刻が古い区間(画像D1に対応する区間)の左に隣接する区間と、画像D1に対応する区間との類似度を判定し、類似度が閾値以上であれば、例えば第二のグラフG2の左端に図7(b)に示したような破線を表示させる。これにより、スクロール操作が行われた場合でも、類似度の高い区間の有無とその方向を医師に知らせることができる。
図8は、表示制御部26が設定する表示範囲の幅K2を区間K1の幅よりも広くした例を示す図である。図9は、図8に示す表示範囲H内のSBPを示す第二のグラフG3の表示例を示す図である。
第二のグラフG3において、符号60で示す範囲のSBPは、医師により選択された画像D1に対応する区間のSBPである。第二のグラフG3において、符号61で示す範囲のSBPは、医師により選択された画像D1に対応する区間の左隣の区間のSBPの一部である。
この変形例では、表示制御部26は、医師により選択された画像D1に対応する区間のSBPを全て含み、かつ、この区間のSBPのうちの最大値が表示範囲Hの中心となるように、区間K1の幅よりも大きい幅K2の表示範囲Hを設定する。
したがって、第二のグラフG3は、選択された画像D1に対応する区間のSBPのうちの最大値が横軸方向の中心に表示されたものとなる。
医師は、選択した区間においてSBPが大きく変動しているポイントをまずは確認すると考えられる。このため、このポイントを中心にした第二のグラフG3を表示させることで、ポイント部分の確認をスムーズに行うことができ、診断を効率的に行うことができる。
なお、表示制御部26は、図5や図9に示すように、医師によって選択されている区間のSBPと、この区間以外の区間のSBPとを含む第二のグラフを表示させる場合には、医師によって選択されている区間のSBPと、この区間以外の区間のSBPとで、表示形態を異ならせることが好ましい。
表示形態を異ならせる方法としては、SBPのグラフの色を変える方法や、SBPのグラフの種別(実線、破線、一点鎖線等)を変える方法等がある。
例えば、図9の例では、符号61で示す範囲のSBPと、符号60で示す範囲のSBPとで色を変えて表示させたり、符号61で示す範囲のSBPは破線で表示させ、符号60で示す範囲のSBPは実線で表示させたりする。
このようにすることで、医師は、自分がどの区間を最初に選択したのかを容易に判断することができ、診断を効率的に進めることが可能となる。
また、表示制御部26が、図3に示す第一のグラフと、図4や図5や図9に示す第二のグラフとを同一画面上で併せて表示させる場合には、第二のグラフとして表示されているSBPを含む区間に対応する変動状態情報を示す画像を強調表示させることが好ましい。
図10は、第一のグラフの第一の変形例を示す図である。
図10に示す第一のグラフが表示された状態で、画像D1が選択され、例えば図5に示す第二のグラフG2が表示されている場合を例にする。この場合は、表示部27には、医師により選択されている区間のSBPと、この区間の右隣の区間のSBPとが表示されている。
このため、表示制御部26は、画像D1と、画像D1に対応する区間の右隣の区間に対応する変動状態情報を示す画像D2とを強調表示させる。
具体的には、表示制御部26は、画像D1と画像D2の各々の近傍にマークE1を表示させる。または、表示制御部26は、画像D1と画像D2を、他の変動状態情報を示す画像とは異なる色で表示させる。
このように、拡大表示中のSBPが属する区間の変動状態情報を示す画像を強調表示することで、医師は、第一のグラフにおけるどの区間の拡大画像が表示されているのかを容易に把握することができる。このため、診断を効率的に行うことができる。
図11は、第一のグラフと第二のグラフを併せて表示部27に表示させる例を示す図である。
図3に示す第一のグラフが表示された状態で画像D1が選択され、その後、スクロール操作によって、例えば図5に示す第二のグラフG2が表示される場合を例にする。この場合は、表示制御部26は、図11に示すように、図10に示した第一のグラフと、図5に示した第二のグラフG2とを1つの画面上に表示させる。これにより、血圧情報の全体的な傾向と、所望の区間における血圧情報の詳細とを同一画面上で確認することができ、診断を効率的に行うことが可能となる。
図12は、第一のグラフの第二の変形例を示す図である。
表示制御部26は、変動状態情報を構成する血圧情報の平均値の変動量(時刻が新しい区間に対応する平均値から、時刻が古い区間に対応する平均値を減算した値)を算出し、変動量が閾値以上となる区間に対応する画像については強調表示させる。
図12の例では、表示制御部26は、平均値の変動量が閾値以上となった区間に対応する画像の近傍にマークE2を表示させている。
血圧情報は、平均値が急激に大きくなった場合に、何か異常があったと疑う必要がある。図12に示すようにマークE2が表示されることで、血圧情報の平均値の変動量が大きくなった区間がどこかを瞬時に把握することができるため、診断を効率的に行うことが可能となる。
このマークE2をタッチパネル上でタッチしたり、マウスを使ってクリックしたりすることで、変動状態情報を示す画像を選択できるようにしてもよい。
ここまでの説明では、生体情報測定装置1の生体情報算出部11が、生体情報として血圧情報を算出して記録するものとした。
生体情報算出部11は、脈波検出部10により検出された脈波に基づいて、生体情報としての脈拍数や心拍数を算出し記録するものとしてもよい。
生体情報としては、日内変動が大きく、1拍毎や複数拍毎での測定が診断に有効となるものであればよい。
また、生体情報測定装置1は、非侵襲で生体情報を測定する装置を例にしたが、侵襲的に生体情報を測定し記録する装置であっても同様に本発明を適用可能である。
変動状態情報は、生体情報の任意の区間における変動状態が分かる情報であればよく、最大値、最小値、及び代表値のうち代表値に関しては省略してもよい。また、変動状態情報を示す画像は、図3に例示したものに限らず、直感的に変動状態が理解できるような画像であればよい。
以上の説明では、図3に示す第一のグラフが表示された状態から画像D1が選択されると、血圧情報の生データを示す第二のグラフが瞬時に表示される構成とした。
この変形例として、図3に示す第一のグラフが表示された状態で画像D1が選択されると、変動状態情報生成部24が、選択された画像D1に対応する区間に属する血圧情報を記録媒体23から取得し、取得した血圧情報を更に細かい詳細区間に分割し、詳細区間毎に変動状態情報を再び生成して記録する。なお、この変形例においては、記録媒体23から取得される血圧情報(画像D1に対応する区間に属する血圧情報)は、所定期間分の生体情報を構成する。
その後、表示制御部26は、変動状態情報生成部24により生成された詳細区間毎の変動状態情報を示す第一のグラフを表示部27に表示させる。この状態で、この第一のグラフ中の任意の変動状態情報が選択されると、表示制御部26は、この任意の変動状態情報に対応する詳細区間に属する血圧情報の生データを第二のグラフとして表示させる。
このように、第一のグラフから第二のグラフに一気に表示を変えるのではく、第一のグラフから分割する区間の幅を短くした第一のグラフに表示を変更し、その状態から第二のグラフに表示を変えることで、長い期間での血圧情報の確認をスムーズに行うことが可能となる。
例えば、表示制御部26は、区間の長さを1時間とした第一のグラフを表示させた状態で任意の区間の変動状態情報が選択されると、この任意の区間を1分間の詳細区間で分割した第一のグラフを表示させる。このようにすることで、膨大な量の血圧情報において確認したい区間を絞り込んで詳細に表示させていくことができ、大量の血圧情報から必要な情報を確認する作業を効率的に行うことができる。
今回開示された実施形態はすべての点で例示であって制限的なものではないと考えられるべきである。本発明の範囲は上記した説明ではなくて特許請求の範囲によって示され、特許請求の範囲と均等の意味及び範囲内でのすべての変更が含まれることが意図される。
本実施形態の診断支援プログラムは、当該プログラムをコンピュータが読取可能な一時的でない(non-transitory)記録媒体に記録される。このような「コンピュータ読取可能な記録媒体」は、たとえば、CD-ROM(Compact Disc-ROM)等の光学媒体や、メモリカード等の磁気記録媒体等を含む。また、このようなプログラムを、ネットワークを介したダウンロードによって提供することもできる。
以上説明してきたように、本明細書には以下の事項が開示されている。
開示された診断支援装置は、生体から1拍又は複数拍毎に測定された生体情報を記録する記録部から、所定期間分の生体情報を取得し、取得した前記所定期間分の生体情報を複数の区間に分割し、各区間における生体情報の変動状態を示す変動状態情報を生成する変動状態情報生成部と、前記区間毎の前記変動状態情報を示す第一のグラフを表示部に表示させる表示制御部と、を備え、前記表示制御部は、前記表示部に表示されている前記第一のグラフにおける任意の前記変動状態情報が選択された場合に、前記所定期間分の生体情報のうちの前記表示部への表示対象とする表示範囲を、選択された前記変動状態情報に対応する区間に属する生体情報を含む範囲に設定し、設定した前記表示範囲内の生体情報を時系列で示す第二のグラフを前記表示部に表示させるものである。
開示された診断支援装置は、前記表示制御部は、前記第二のグラフを前記表示部に表示させている状態で、前記表示範囲を移動させる指示がなされた場合に、前記指示にしたがって前記表示範囲の設定を更新して、前記第二のグラフをスクロール表示させるものである。
開示された診断支援装置は、前記表示制御部は、前記第二のグラフとして表示されている生体情報を含む区間の隣の区間の変動状態情報と前記選択された変動状態情報との類似度を判定し、前記類似度が閾値以上となる隣の区間がある場合には、前記第二のグラフと併せて、当該区間の方向を通知するための情報を表示させるものである。
開示された診断支援装置は、前記表示制御部は、選択された前記変動状態情報に対応する区間に属する生体情報のうちの最大値が前記第二のグラフの中心となるように前記表示範囲を設定する
開示された診断支援装置は、前記表示制御部は、前記第一のグラフと、前記第二のグラフと、を前記表示部に併せて表示させ、更に、前記第一のグラフの変動状態情報のうち、前記第二のグラフとして表示されている生体情報が属する区間の変動状態情報を強調する処理を行うものである。
開示された診断支援装置は、前記表示制御部は、前記区間の幅よりも広い範囲を前記表示範囲として設定するものである。
開示された診断支援装置は、前記表示制御部は、前記第二のグラフの生体情報については、選択された前記変動状態情報に対応する区間に属する生体情報と、当該区間以外の区間に属する生体情報とで表示形式を異ならせて表示させるものである。
開示された診断支援装置は、前記変動状態情報生成部は、各区間における生体情報の最大値と最小値との差を示す画像を前記変動状態情報として生成するものである。
開示された診断支援装置は、前記変動状態情報生成部は、各区間における生体情報の代表値と最大値及び最小値の各々との差を示す画像を前記変動状態情報として生成するものである。
開示された診断支援装置は、前記生体情報は血圧情報であるものを含む。
開示された診断支援方法は、生体から1拍又は複数拍毎に測定された生体情報を記録する記録部から所定期間分の生体情報を取得し、取得した前記所定期間分の生体情報を複数の区間に分割し、各区間における生体情報の変動状態を示す変動状態情報を生成する変動状態情報生成ステップと、前記区間毎の前記変動状態情報を示す第一のグラフを表示部に表示させる表示制御ステップと、を備え、前記表示制御ステップは、前記表示部に表示されている前記第一のグラフにおける任意の前記変動状態情報が選択された場合に、前記所定期間分の生体情報のうちの前記表示部への表示対象とする表示範囲を、選択された前記変動状態情報に対応する区間に属する生体情報を含む範囲に設定し、設定した前記表示範囲内の生体情報を時系列で示す第二のグラフを前記表示部に表示させるものである。
開示された診断支援プログラムは、生体から1拍又は複数拍毎に測定された生体情報を記録する記録部から所定期間分の生体情報を取得し、取得した前記所定期間分の生体情報を複数の区間に分割し、各区間における生体情報の変動状態を示す変動状態情報を生成する変動状態情報生成ステップと、前記区間毎の前記変動状態情報を示す第一のグラフを表示部に表示させる表示制御ステップと、をコンピュータに実行させるための診断支援プログラムであって、前記表示制御ステップは、前記表示部に表示されている前記第一のグラフにおける任意の前記変動状態情報が選択された場合に、前記所定期間分の生体情報のうちの前記表示部への表示対象とする表示範囲を、選択された前記変動状態情報に対応する区間に属する生体情報を含む範囲に設定し、設定した前記表示範囲内の生体情報を時系列で示す第二のグラフを前記表示部に表示させるものである。
本発明は、診断を支援して医療に役立てることができる。
以上、本発明を特定の実施形態によって説明したが、本発明はこの実施形態に限定されるものではなく、開示された発明の技術思想を逸脱しない範囲で種々の変更が可能である。
本出願は、2016年1月4日出願の日本特許出願(特願2016-000169)に基づくものであり、その内容はここに取り込まれる。
本出願は、2016年1月4日出願の日本特許出願(特願2016-000169)に基づくものであり、その内容はここに取り込まれる。
1 生体情報測定装置
2 診断支援装置
23 記録媒体(記録部)
24 変動状態情報生成部
26 表示制御部
27 表示部
K1 区間
H 表示範囲
D1 変動状態情報を示す画像
G1,G2,G3 第二のグラフ
SL,SR スクロールボタン
E1,E2 マーク
2 診断支援装置
23 記録媒体(記録部)
24 変動状態情報生成部
26 表示制御部
27 表示部
K1 区間
H 表示範囲
D1 変動状態情報を示す画像
G1,G2,G3 第二のグラフ
SL,SR スクロールボタン
E1,E2 マーク
Claims (12)
- 生体から1拍又は複数拍毎に測定された生体情報を記録する記録部から、所定期間分の生体情報を取得し、取得した前記所定期間分の生体情報を複数の区間に分割し、各区間における生体情報の変動状態を示す変動状態情報を生成する変動状態情報生成部と、
前記区間毎の前記変動状態情報を示す第一のグラフを表示部に表示させる表示制御部と、を備え、
前記表示制御部は、前記表示部に表示されている前記第一のグラフにおける任意の前記変動状態情報が選択された場合に、前記所定期間分の生体情報のうちの前記表示部への表示対象とする表示範囲を、選択された前記変動状態情報に対応する区間に属する生体情報を含む範囲に設定し、設定した前記表示範囲内の生体情報を時系列で示す第二のグラフを前記表示部に表示させる診断支援装置。 - 請求項1記載の診断支援装置であって、
前記表示制御部は、前記第二のグラフを前記表示部に表示させている状態で、前記表示範囲を移動させる指示がなされた場合に、前記指示にしたがって前記表示範囲の設定を更新して、前記第二のグラフをスクロール表示させる診断支援装置。 - 請求項2記載の診断支援装置であって、
前記表示制御部は、前記第二のグラフとして表示されている生体情報を含む区間の隣の区間の変動状態情報と前記選択された変動状態情報との類似度を判定し、前記類似度が閾値以上となる隣の区間がある場合には、前記第二のグラフと併せて、当該区間の方向を通知するための情報を表示させる診断支援装置。 - 請求項1~3のいずれか1項記載の診断支援装置であって、
前記表示制御部は、選択された前記変動状態情報に対応する区間に属する生体情報のうちの最大値が前記第二のグラフの中心となるように前記表示範囲を設定する診断支援装置。 - 請求項1~4のいずれか1項記載の診断支援装置であって、
前記表示制御部は、前記第一のグラフと、前記第二のグラフと、を前記表示部に併せて表示させ、更に、前記第一のグラフの変動状態情報のうち、前記第二のグラフとして表示されている生体情報が属する区間の変動状態情報を強調する処理を行う診断支援装置。 - 請求項1~5のいずれか1項記載の診断支援装置であって、
前記表示制御部は、前記区間の幅よりも広い範囲を前記表示範囲として設定する診断支援装置。 - 請求項6記載の診断支援装置であって、
前記表示制御部は、前記第二のグラフの生体情報については、選択された前記変動状態情報に対応する区間に属する生体情報と、当該区間以外の区間に属する生体情報とで表示形式を異ならせて表示させる診断支援装置。 - 請求項1~7のいずれか1項記載の診断支援装置であって、
前記変動状態情報生成部は、各区間における生体情報の最大値と最小値との差を示す画像を前記変動状態情報として生成する診断支援装置。 - 請求項1~7のいずれか1項記載の診断支援装置であって、
前記変動状態情報生成部は、各区間における生体情報の代表値と最大値及び最小値の各々との差を示す画像を前記変動状態情報として生成する診断支援装置。 - 請求項1~9のいずれか1項記載の診断支援装置であって、
前記生体情報は血圧情報である診断支援装置。 - 生体から1拍又は複数拍毎に測定された生体情報を記録する記録部から所定期間分の生体情報を取得し、取得した前記所定期間分の生体情報を複数の区間に分割し、各区間における生体情報の変動状態を示す変動状態情報を生成する変動状態情報生成ステップと、
前記区間毎の前記変動状態情報を示す第一のグラフを表示部に表示させる表示制御ステップと、を備え、
前記表示制御ステップは、前記表示部に表示されている前記第一のグラフにおける任意の前記変動状態情報が選択された場合に、前記所定期間分の生体情報のうちの前記表示部への表示対象とする表示範囲を、選択された前記変動状態情報に対応する区間に属する生体情報を含む範囲に設定し、設定した前記表示範囲内の生体情報を時系列で示す第二のグラフを前記表示部に表示させる診断支援方法。 - 生体から1拍又は複数拍毎に測定された生体情報を記録する記録部から所定期間分の生体情報を取得し、取得した前記所定期間分の生体情報を複数の区間に分割し、各区間における生体情報の変動状態を示す変動状態情報を生成する変動状態情報生成ステップと、
前記区間毎の前記変動状態情報を示す第一のグラフを表示部に表示させる表示制御ステップと、をコンピュータに実行させるための診断支援プログラムであって、
前記表示制御ステップは、前記表示部に表示されている前記第一のグラフにおける任意の前記変動状態情報が選択された場合に、前記所定期間分の生体情報のうちの前記表示部への表示対象とする表示範囲を、選択された前記変動状態情報に対応する区間に属する生体情報を含む範囲に設定し、設定した前記表示範囲内の生体情報を時系列で示す第二のグラフを前記表示部に表示させる診断支援プログラム。
Priority Applications (3)
| Application Number | Priority Date | Filing Date | Title |
|---|---|---|---|
| DE112016006150.1T DE112016006150T5 (de) | 2016-01-04 | 2016-12-14 | Diagnose-unterstützungsgerät, diagnose-unterstützungsverfahren und diagnose-untersützungsprogramm |
| CN201680077752.5A CN108471966B (zh) | 2016-01-04 | 2016-12-14 | 诊断辅助装置、诊断辅助方法、以及诊断辅助程序 |
| US16/026,086 US10791940B2 (en) | 2016-01-04 | 2018-07-03 | Diagnosis assistance apparatus, diagnosis assistance method, and diagnosis assistance program |
Applications Claiming Priority (2)
| Application Number | Priority Date | Filing Date | Title |
|---|---|---|---|
| JP2016-000169 | 2016-01-04 | ||
| JP2016000169A JP6645190B2 (ja) | 2016-01-04 | 2016-01-04 | 診断支援装置、診断支援方法、及び、診断支援プログラム |
Related Child Applications (1)
| Application Number | Title | Priority Date | Filing Date |
|---|---|---|---|
| US16/026,086 Continuation US10791940B2 (en) | 2016-01-04 | 2018-07-03 | Diagnosis assistance apparatus, diagnosis assistance method, and diagnosis assistance program |
Publications (1)
| Publication Number | Publication Date |
|---|---|
| WO2017119253A1 true WO2017119253A1 (ja) | 2017-07-13 |
Family
ID=59273569
Family Applications (1)
| Application Number | Title | Priority Date | Filing Date |
|---|---|---|---|
| PCT/JP2016/087286 WO2017119253A1 (ja) | 2016-01-04 | 2016-12-14 | 診断支援装置、診断支援方法、及び、診断支援プログラム |
Country Status (5)
| Country | Link |
|---|---|
| US (1) | US10791940B2 (ja) |
| JP (1) | JP6645190B2 (ja) |
| CN (1) | CN108471966B (ja) |
| DE (1) | DE112016006150T5 (ja) |
| WO (1) | WO2017119253A1 (ja) |
Families Citing this family (4)
| Publication number | Priority date | Publication date | Assignee | Title |
|---|---|---|---|---|
| JP7127571B2 (ja) * | 2019-02-18 | 2022-08-30 | オムロンヘルスケア株式会社 | 血圧レベル変化検出装置、血圧レベル変化検出方法、およびプログラム |
| CN113465757A (zh) * | 2021-06-30 | 2021-10-01 | 深圳市科曼医疗设备有限公司 | 参数曲线显示方法及其装置 |
| KR102630547B1 (ko) * | 2021-11-17 | 2024-01-29 | 가톨릭대학교 산학협력단 | 사용자 상태 진단을 위한 진단 정보 제공 방법 및 이를 수행하는 장치 |
| CN117296081A (zh) * | 2022-02-25 | 2023-12-26 | 株式会社爱发科 | 显示装置、显示方法以及程序 |
Citations (4)
| Publication number | Priority date | Publication date | Assignee | Title |
|---|---|---|---|---|
| JPH05184551A (ja) * | 1992-01-16 | 1993-07-27 | Sharp Corp | 携帯型心電計 |
| JPH1094528A (ja) * | 1996-09-24 | 1998-04-14 | Nippon Colin Co Ltd | 心拍出量推定装置 |
| JPH11148845A (ja) * | 1997-11-14 | 1999-06-02 | Nec Corp | データ波形表示方法および表示システム |
| JP2005000409A (ja) * | 2003-06-12 | 2005-01-06 | Omron Healthcare Co Ltd | 心電計および心電波形表示方法 |
Family Cites Families (14)
| Publication number | Priority date | Publication date | Assignee | Title |
|---|---|---|---|---|
| JPS60148543A (ja) | 1984-01-13 | 1985-08-05 | オムロン株式会社 | 電子血圧計 |
| JP2000139860A (ja) | 1998-11-13 | 2000-05-23 | Tsuurin Osada | 生体循環系のコンピュータ診断方法、コンピュータ読み取り可能な記録媒体及び診断装置 |
| JP2001245900A (ja) * | 2000-03-02 | 2001-09-11 | Arkray Inc | グラフおよびグラフの表示方法並びにグラフ表示装置 |
| JP2003265417A (ja) | 2002-03-15 | 2003-09-24 | Toto Ltd | 生体情報管理システム |
| JP4373915B2 (ja) * | 2002-08-27 | 2009-11-25 | 大日本住友製薬株式会社 | 生体情報トレンド表示装置およびその作動方法 |
| JP2004321438A (ja) | 2003-04-24 | 2004-11-18 | Colin Medical Technology Corp | 動脈硬化度評価装置 |
| JP4626250B2 (ja) | 2004-10-05 | 2011-02-02 | オムロンヘルスケア株式会社 | 脈波情報表示装置、脈波情報表示装置を制御するプログラム、および脈波情報表示方法 |
| JP2007130069A (ja) | 2005-11-08 | 2007-05-31 | Omron Healthcare Co Ltd | 電子血圧計と電子血圧計におけるデータ表示方法 |
| CN102755154B (zh) * | 2012-07-17 | 2014-12-10 | 桂林电子科技大学 | 一种从脉搏波中提取传导时间的计算方法 |
| JP5979604B2 (ja) | 2013-02-06 | 2016-08-24 | カシオ計算機株式会社 | 生体情報検出装置及び生体情報検出方法、生体情報検出プログラム |
| JP6376854B2 (ja) | 2014-06-12 | 2018-08-22 | ブリヂストンスポーツ株式会社 | ゴルフクラブヘッド |
| JP2016034482A (ja) * | 2014-07-31 | 2016-03-17 | セイコーエプソン株式会社 | 運動解析装置、運動解析方法、運動解析プログラム及び運動解析システム |
| JP6493680B2 (ja) * | 2014-10-09 | 2019-04-03 | パナソニックIpマネジメント株式会社 | 非接触血圧測定装置、及び、非接触血圧測定方法 |
| PL3117766T3 (pl) * | 2015-07-16 | 2021-09-06 | Preventicus Gmbh | Przetwarzanie danych biologicznych |
-
2016
- 2016-01-04 JP JP2016000169A patent/JP6645190B2/ja active Active
- 2016-12-14 DE DE112016006150.1T patent/DE112016006150T5/de active Pending
- 2016-12-14 CN CN201680077752.5A patent/CN108471966B/zh active Active
- 2016-12-14 WO PCT/JP2016/087286 patent/WO2017119253A1/ja active Application Filing
-
2018
- 2018-07-03 US US16/026,086 patent/US10791940B2/en active Active
Patent Citations (4)
| Publication number | Priority date | Publication date | Assignee | Title |
|---|---|---|---|---|
| JPH05184551A (ja) * | 1992-01-16 | 1993-07-27 | Sharp Corp | 携帯型心電計 |
| JPH1094528A (ja) * | 1996-09-24 | 1998-04-14 | Nippon Colin Co Ltd | 心拍出量推定装置 |
| JPH11148845A (ja) * | 1997-11-14 | 1999-06-02 | Nec Corp | データ波形表示方法および表示システム |
| JP2005000409A (ja) * | 2003-06-12 | 2005-01-06 | Omron Healthcare Co Ltd | 心電計および心電波形表示方法 |
Also Published As
| Publication number | Publication date |
|---|---|
| US10791940B2 (en) | 2020-10-06 |
| CN108471966B (zh) | 2020-12-18 |
| JP6645190B2 (ja) | 2020-02-14 |
| US20180310837A1 (en) | 2018-11-01 |
| CN108471966A (zh) | 2018-08-31 |
| DE112016006150T5 (de) | 2018-09-20 |
| JP2017121272A (ja) | 2017-07-13 |
Similar Documents
| Publication | Publication Date | Title |
|---|---|---|
| US20210145300A1 (en) | Spot check measurement system | |
| WO2017119253A1 (ja) | 診断支援装置、診断支援方法、及び、診断支援プログラム | |
| JP2018527071A (ja) | 身体組織によって低減された光に反応する識別マークを含む医学的モニタリング分析および再生 | |
| JP2014179091A (ja) | 患者に関する医療パラメーターをモニタリング及び表示するための方法、システム、及びデバイス | |
| JP2011104341A (ja) | 生体パラメータ表示装置 | |
| WO2018168301A1 (ja) | 情報処理装置および情報処理プログラム | |
| JP5719520B2 (ja) | 生体情報モニタ装置、画面表示方法および画面表示プログラム | |
| JP2015077165A (ja) | 生体情報表示装置及び生体情報表示用プログラム | |
| WO2017082107A1 (ja) | 診断支援装置、診断支援方法、診断支援プログラム | |
| US11690575B2 (en) | Apparatus and method for processing physiological information | |
| WO2017221937A1 (ja) | 生体情報測定支援装置、生体情報測定装置、生体情報測定支援方法、及び、生体情報測定支援プログラム | |
| JP5659271B2 (ja) | 生体情報処理装置、運動負荷心電図検査システム及び生体情報処理プログラム | |
| US20230089660A1 (en) | Device for displaying blood-pressure-related information, method for displaying blood-pressure-related information, and computer-readable recording medium | |
| CN110446460B (zh) | 信息处理装置和存储介质 | |
| US20150235395A1 (en) | Method And Apparatus For Displaying One Or More Waveforms | |
| JP2019072473A (ja) | 生体情報処理装置、生体情報処理方法、プログラム及び記憶媒体 | |
| JP6566746B2 (ja) | 生体情報出力装置およびその制御方法 | |
| CN112997136B (zh) | 一种应用于监护设备的界面操作方法及监护设备 | |
| KR20220117632A (ko) | 원격 상담 서비스 제공 방법 및 시스템 | |
| CN108882862B (zh) | 诊断辅助装置、生物体信息测定装置、诊断辅助方法、以及诊断辅助程序 | |
| JP7256049B2 (ja) | 血圧関連情報表示装置、血圧関連情報表示方法、およびプログラム | |
| JP6624882B2 (ja) | 生体情報計測装置およびその制御方法 | |
| US20200359999A1 (en) | Patient monitor and physiological information system |
Legal Events
| Date | Code | Title | Description |
|---|---|---|---|
| 121 | Ep: the epo has been informed by wipo that ep was designated in this application |
Ref document number: 16883753 Country of ref document: EP Kind code of ref document: A1 |
|
| DPE2 | Request for preliminary examination filed before expiration of 19th month from priority date (pct application filed from 20040101) | ||
| WWE | Wipo information: entry into national phase |
Ref document number: 112016006150 Country of ref document: DE |
|
| 122 | Ep: pct application non-entry in european phase |
Ref document number: 16883753 Country of ref document: EP Kind code of ref document: A1 |