WO2014091916A1 - 運転時生体状態判定装置及びコンピュータプログラム - Google Patents
運転時生体状態判定装置及びコンピュータプログラム Download PDFInfo
- Publication number
- WO2014091916A1 WO2014091916A1 PCT/JP2013/081693 JP2013081693W WO2014091916A1 WO 2014091916 A1 WO2014091916 A1 WO 2014091916A1 JP 2013081693 W JP2013081693 W JP 2013081693W WO 2014091916 A1 WO2014091916 A1 WO 2014091916A1
- Authority
- WO
- WIPO (PCT)
- Prior art keywords
- frequency
- state
- sleep
- procedure
- determination
- Prior art date
Links
- 238000004590 computer program Methods 0.000 title claims description 23
- 230000007958 sleep Effects 0.000 claims abstract description 282
- 206010041349 Somnolence Diseases 0.000 claims abstract description 231
- 208000032140 Sleepiness Diseases 0.000 claims abstract description 144
- 230000037321 sleepiness Effects 0.000 claims abstract description 144
- 238000000034 method Methods 0.000 claims abstract description 121
- 238000001514 detection method Methods 0.000 claims description 189
- 230000006870 function Effects 0.000 claims description 167
- 238000009826 distribution Methods 0.000 claims description 138
- 238000004364 calculation method Methods 0.000 claims description 125
- 230000008859 change Effects 0.000 claims description 92
- 230000000694 effects Effects 0.000 claims description 81
- 238000004458 analytical method Methods 0.000 claims description 67
- 230000013632 homeostatic process Effects 0.000 claims description 67
- 238000012423 maintenance Methods 0.000 claims description 63
- 208000024891 symptom Diseases 0.000 claims description 55
- 238000001228 spectrum Methods 0.000 claims description 34
- 230000035807 sensation Effects 0.000 claims description 23
- 230000007423 decrease Effects 0.000 claims description 22
- 238000009499 grossing Methods 0.000 claims description 14
- 230000036651 mood Effects 0.000 claims description 12
- 230000004069 differentiation Effects 0.000 claims description 10
- 230000033001 locomotion Effects 0.000 claims description 10
- 230000003044 adaptive effect Effects 0.000 claims description 5
- 230000003284 homeostatic effect Effects 0.000 abstract description 3
- 230000002889 sympathetic effect Effects 0.000 description 50
- 238000002474 experimental method Methods 0.000 description 45
- 230000008035 nerve activity Effects 0.000 description 38
- 238000010586 diagram Methods 0.000 description 27
- 210000005037 parasympathetic nerve Anatomy 0.000 description 23
- 210000005036 nerve Anatomy 0.000 description 19
- 230000000875 corresponding effect Effects 0.000 description 16
- 239000004744 fabric Substances 0.000 description 15
- 230000008569 process Effects 0.000 description 15
- 239000007787 solid Substances 0.000 description 10
- 125000006850 spacer group Chemical group 0.000 description 10
- 238000012545 processing Methods 0.000 description 8
- 230000004044 response Effects 0.000 description 8
- 210000003403 autonomic nervous system Anatomy 0.000 description 7
- 230000036760 body temperature Effects 0.000 description 7
- 238000000546 chi-square test Methods 0.000 description 7
- 238000011156 evaluation Methods 0.000 description 7
- 230000037007 arousal Effects 0.000 description 6
- 238000004891 communication Methods 0.000 description 6
- 238000005259 measurement Methods 0.000 description 6
- 238000012612 static experiment Methods 0.000 description 6
- 238000012360 testing method Methods 0.000 description 6
- 238000006243 chemical reaction Methods 0.000 description 5
- 230000003247 decreasing effect Effects 0.000 description 5
- 230000001734 parasympathetic effect Effects 0.000 description 5
- 230000002093 peripheral effect Effects 0.000 description 5
- 230000008667 sleep stage Effects 0.000 description 5
- 230000002567 autonomic effect Effects 0.000 description 4
- 210000000467 autonomic pathway Anatomy 0.000 description 4
- 239000011324 bead Substances 0.000 description 4
- 210000004204 blood vessel Anatomy 0.000 description 4
- 230000005281 excited state Effects 0.000 description 4
- 238000001914 filtration Methods 0.000 description 4
- 210000001002 parasympathetic nervous system Anatomy 0.000 description 4
- 230000001953 sensory effect Effects 0.000 description 4
- 230000003068 static effect Effects 0.000 description 4
- 206010062519 Poor quality sleep Diseases 0.000 description 3
- 206010039897 Sedation Diseases 0.000 description 3
- 230000033228 biological regulation Effects 0.000 description 3
- 230000027288 circadian rhythm Effects 0.000 description 3
- 230000007717 exclusion Effects 0.000 description 3
- 210000003205 muscle Anatomy 0.000 description 3
- 238000003860 storage Methods 0.000 description 3
- 210000002820 sympathetic nervous system Anatomy 0.000 description 3
- 238000012795 verification Methods 0.000 description 3
- 206010003658 Atrial Fibrillation Diseases 0.000 description 2
- 208000003443 Unconsciousness Diseases 0.000 description 2
- 238000009825 accumulation Methods 0.000 description 2
- 238000012925 biological evaluation Methods 0.000 description 2
- 210000000748 cardiovascular system Anatomy 0.000 description 2
- 230000001276 controlling effect Effects 0.000 description 2
- 210000000750 endocrine system Anatomy 0.000 description 2
- 239000006260 foam Substances 0.000 description 2
- 229940088597 hormone Drugs 0.000 description 2
- 239000005556 hormone Substances 0.000 description 2
- 230000000147 hypnotic effect Effects 0.000 description 2
- 230000003340 mental effect Effects 0.000 description 2
- 230000010363 phase shift Effects 0.000 description 2
- 230000036544 posture Effects 0.000 description 2
- 230000000644 propagated effect Effects 0.000 description 2
- 230000002040 relaxant effect Effects 0.000 description 2
- 230000000630 rising effect Effects 0.000 description 2
- 230000036280 sedation Effects 0.000 description 2
- 125000002066 L-histidyl group Chemical group [H]N1C([H])=NC(C([H])([H])[C@](C(=O)[*])([H])N([H])[H])=C1[H] 0.000 description 1
- 239000004743 Polypropylene Substances 0.000 description 1
- 241001282135 Poromitra oscitans Species 0.000 description 1
- 206010048232 Yawning Diseases 0.000 description 1
- 230000004913 activation Effects 0.000 description 1
- 230000006978 adaptation Effects 0.000 description 1
- 210000000709 aorta Anatomy 0.000 description 1
- 210000001367 artery Anatomy 0.000 description 1
- 230000008901 benefit Effects 0.000 description 1
- 230000017531 blood circulation Effects 0.000 description 1
- 230000036772 blood pressure Effects 0.000 description 1
- 210000004556 brain Anatomy 0.000 description 1
- 230000007177 brain activity Effects 0.000 description 1
- 230000015556 catabolic process Effects 0.000 description 1
- 230000004087 circulation Effects 0.000 description 1
- 230000000052 comparative effect Effects 0.000 description 1
- 239000012141 concentrate Substances 0.000 description 1
- 230000002596 correlated effect Effects 0.000 description 1
- 238000006731 degradation reaction Methods 0.000 description 1
- 230000006866 deterioration Effects 0.000 description 1
- 230000002124 endocrine Effects 0.000 description 1
- 238000005516 engineering process Methods 0.000 description 1
- 230000003203 everyday effect Effects 0.000 description 1
- 208000019622 heart disease Diseases 0.000 description 1
- 230000006872 improvement Effects 0.000 description 1
- 230000030214 innervation Effects 0.000 description 1
- 230000007246 mechanism Effects 0.000 description 1
- 239000012528 membrane Substances 0.000 description 1
- 238000012544 monitoring process Methods 0.000 description 1
- 230000001537 neural effect Effects 0.000 description 1
- 230000003287 optical effect Effects 0.000 description 1
- 230000010355 oscillation Effects 0.000 description 1
- 230000037081 physical activity Effects 0.000 description 1
- -1 polypropylene Polymers 0.000 description 1
- 229920001155 polypropylene Polymers 0.000 description 1
- 238000002360 preparation method Methods 0.000 description 1
- 238000003825 pressing Methods 0.000 description 1
- 230000002265 prevention Effects 0.000 description 1
- 238000011002 quantification Methods 0.000 description 1
- 238000011084 recovery Methods 0.000 description 1
- 230000004622 sleep time Effects 0.000 description 1
- 238000012731 temporal analysis Methods 0.000 description 1
- 238000000700 time series analysis Methods 0.000 description 1
- 230000007704 transition Effects 0.000 description 1
- 230000002861 ventricular Effects 0.000 description 1
- 230000000007 visual effect Effects 0.000 description 1
- XLYOFNOQVPJJNP-UHFFFAOYSA-N water Substances O XLYOFNOQVPJJNP-UHFFFAOYSA-N 0.000 description 1
- 230000003442 weekly effect Effects 0.000 description 1
Images


Classifications
-
- A—HUMAN NECESSITIES
- A61—MEDICAL OR VETERINARY SCIENCE; HYGIENE
- A61B—DIAGNOSIS; SURGERY; IDENTIFICATION
- A61B5/00—Measuring for diagnostic purposes; Identification of persons
- A61B5/103—Detecting, measuring or recording devices for testing the shape, pattern, colour, size or movement of the body or parts thereof, for diagnostic purposes
- A61B5/11—Measuring movement of the entire body or parts thereof, e.g. head or hand tremor, mobility of a limb
-
- A—HUMAN NECESSITIES
- A61—MEDICAL OR VETERINARY SCIENCE; HYGIENE
- A61B—DIAGNOSIS; SURGERY; IDENTIFICATION
- A61B5/00—Measuring for diagnostic purposes; Identification of persons
- A61B5/16—Devices for psychotechnics; Testing reaction times ; Devices for evaluating the psychological state
- A61B5/18—Devices for psychotechnics; Testing reaction times ; Devices for evaluating the psychological state for vehicle drivers or machine operators
-
- A—HUMAN NECESSITIES
- A61—MEDICAL OR VETERINARY SCIENCE; HYGIENE
- A61B—DIAGNOSIS; SURGERY; IDENTIFICATION
- A61B5/00—Measuring for diagnostic purposes; Identification of persons
- A61B5/48—Other medical applications
- A61B5/4806—Sleep evaluation
- A61B5/4809—Sleep detection, i.e. determining whether a subject is asleep or not
-
- A—HUMAN NECESSITIES
- A61—MEDICAL OR VETERINARY SCIENCE; HYGIENE
- A61B—DIAGNOSIS; SURGERY; IDENTIFICATION
- A61B5/00—Measuring for diagnostic purposes; Identification of persons
- A61B5/68—Arrangements of detecting, measuring or recording means, e.g. sensors, in relation to patient
- A61B5/6887—Arrangements of detecting, measuring or recording means, e.g. sensors, in relation to patient mounted on external non-worn devices, e.g. non-medical devices
- A61B5/6893—Cars
-
- B—PERFORMING OPERATIONS; TRANSPORTING
- B60—VEHICLES IN GENERAL
- B60W—CONJOINT CONTROL OF VEHICLE SUB-UNITS OF DIFFERENT TYPE OR DIFFERENT FUNCTION; CONTROL SYSTEMS SPECIALLY ADAPTED FOR HYBRID VEHICLES; ROAD VEHICLE DRIVE CONTROL SYSTEMS FOR PURPOSES NOT RELATED TO THE CONTROL OF A PARTICULAR SUB-UNIT
- B60W40/00—Estimation or calculation of non-directly measurable driving parameters for road vehicle drive control systems not related to the control of a particular sub unit, e.g. by using mathematical models
- B60W40/08—Estimation or calculation of non-directly measurable driving parameters for road vehicle drive control systems not related to the control of a particular sub unit, e.g. by using mathematical models related to drivers or passengers
- B60W2040/0818—Inactivity or incapacity of driver
- B60W2040/0827—Inactivity or incapacity of driver due to sleepiness
Definitions
- the present invention relates to a biological signal obtained from the back of a person (driver) who operates or controls (in the present specification, these are collectively referred to as “driving”) of various transportation devices such as automobiles, trains, airplanes, and ships. It is related with the technique which determines what kind of living body a driver
- Patent Document 1 a time series waveform of a frequency is obtained from a time series waveform of a biological signal that is mainly a wave of the cardiovascular system collected from a human upper body, and further, a time series waveform of a frequency gradient, a time series of frequency fluctuations.
- An apparatus having a procedure for obtaining waveforms and performing frequency analysis of these waveforms is disclosed.
- frequency analysis a power spectrum of each frequency corresponding to a function adjustment signal, a fatigue acceptance signal, and an activity adjustment signal belonging to a VLF band (very low frequency band) from a predetermined ULF band (very low frequency band) is obtained. .
- the fatigue acceptance signal indicates the degree of progress of fatigue in the normal activity state, in addition to this, by comparing the dominant degree of the power spectrum of the function adjustment signal and the activity adjustment signal, the human condition (relaxed state, fatigue) Status, sympathetic dominant state, parasympathetic dominant state, etc.).
- Patent Document 2 uses a function adjustment signal, fatigue acceptance signal, and activity adjustment signal belonging to the ULF band (very low frequency band) to the VLF band (very low frequency band) as in Patent Document 1, but in Patent Document 2, The distribution ratio of each frequency component when the sum of the power spectrum values of the frequency components corresponding to the three signals is set to 100 is obtained in a time series, and the human state is determined using the time series change of the distribution ratio. It is a technique.
- Patent Document 1 or 2 The technology of Patent Document 1 or 2 is based on the following knowledge. That is, human constancy is maintained with fluctuations, and the frequency bands are in the ULF band and the VLF band. On the other hand, in atrial fibrillation, which is one of heart diseases, the place where the characteristics of fluctuations of the heart and circulatory system are switched is said to be 0.0033 Hz. By capturing fluctuations around 0.0033 Hz, Information on sex maintenance can be obtained.
- the frequency bands below 0.0033 Hz and below 0.0053 Hz are mainly related to body temperature regulation, and the frequency band from 0.01 to 0.04 Hz is said to be related to autonomic nerve control. Yes.
- the 0.0035 Hz signal (fatigue acceptance signal) is a fluctuation for maintaining homeostasis in response to externally input stress, and is a signal indicating the progress of fatigue in a normal activity state.
- the .0053 Hz signal (activity adjustment signal) is a signal in which the degree of influence due to the control of endocrine hormones during activity appears, and the 0.0017 Hz signal (function adjustment signal) lower than 0.0033 Hz is These signals are used to control body modulation and functional degradation, and these three frequency band signals interact with each other and act as a body temperature regulation function. Therefore, the state of a person is determined using the time-series change and distribution rate of the power spectrum of these signals.
- Patent Documents 1 and 2 describe that a wide range of sleepiness-related phenomena such as light sleepiness (mild sleepiness), sleep onset symptom, instantaneous sleep, imminent sleep, etc. can be captured. Emphasizes that you can. Although it is very effective to determine the state of a person using the above three frequency components belonging to the ULF band and the VLF band, further improvement in determination accuracy is always desired. For example, when applied to a warning system for the purpose of preventing falling asleep, the symptoms of sleep onset and the phenomenon of imminent sleep often occur without the driver's own knowledge, but for example, the driver is overworked from the beginning.
- the living body determination at the time of driving is used to give some warning using the determination result, so that a predetermined warning is given as reliably as possible at the timing when the driver must be guided to an arousal state or the like. It is desirable to issue a warning, and it is desirable that there are as few unnecessary warnings as possible.
- the present invention has been made in view of the above, and can determine the biological state of the driver during driving with higher accuracy, and can prompt a warning at the required timing as reliably as possible. It is an object of the present invention to provide an operating biological state determination device and a computer program.
- the present inventor has obtained a biological signal collected from the driver's back, that is, a heart part, in a frequency-gradient time-series waveform of a fingertip volume pulse wave that captures the state of control of body temperature by a change in blood flow.
- the frequency gradient time series waveform of the oscillating wave (Aortic Pulse Wave (APW)) is highly correlated, and it is possible to grasp the state of body temperature control from the characteristics (amplitude, period) of the frequency of the APW time series waveform,
- APW Acoustic Pulse Wave
- the sleep onset symptom or imminent sleep phenomenon that occurs mainly in the unconsciousness, light sleepiness that occurs in the consciousness Or drowsiness with strong resistance to sleep, or due to a significant drop in consciousness level, dullness to drive in a state where information cannot be read or judged despite being open without being aware of sleepiness It is considered that the driving state and the like are determined in parallel so that the driver's biological state can be grasped from various aspects and the biological state can be determined with higher accuracy, and the present invention has been completed.
- the driving biological state determination device of the present invention uses the biological signal collected from the driver's back by the biological signal measurement device provided in the driver's seat, and determines the biological state during the driving in the driving environment of the driver.
- a state determination device comprising: an analysis calculation unit that performs a predetermined calculation using a time-series waveform of the biological signal; and a determination detection unit that determines or detects the biological state using a calculation result of the analysis calculation unit.
- the determination detecting means detects a sleep onset sign phenomenon detecting means which is a physical condition change phenomenon before going to sleep, and an imminent sleep phenomenon which is a physical condition change phenomenon before going into sleep that occurs after the appearance of the sleep onset sign phenomenon.
- Immediate sleep phenomenon detection means for detecting, subjective drowsiness with subjective sleepiness or conscious low sleep state detection state due to a decrease in consciousness level
- constancy maintenance Homeostasis maintenance function level determination means for determining the level of adaptive capacity of the performance, the sleep onset symptom detection means, the imminent sleep phenomenon detection means, the subjective sleepiness / low sensation running state detection means, and the homeostasis maintenance function
- the level determining means is configured to function in parallel.
- the analysis calculation means includes a frequency calculation means for obtaining a time series waveform of a frequency from the time series waveform of the biological signal, and the time calculation waveform obtained by the frequency calculation means for each predetermined time window.
- a frequency slope calculating means for performing a movement calculation for obtaining a slope of the frequency and outputting a time series change of the slope of the frequency obtained for each time window as a frequency slope time series waveform; and at the time of the frequency obtained by the frequency computing means.
- Frequency fluctuation calculation that performs a movement calculation to obtain the average value of the frequency for each predetermined time window using a series waveform and outputs the time series change of the average value of the frequency obtained for each time window as a frequency fluctuation time series waveform And a function adjustment signal, fatigue acceptance signal, and activity adjustment signal determined in advance from the frequency gradient time-series waveform obtained by the frequency gradient calculation means. Extracting a frequency component, it is preferable to have a structure having means for determining each of fluctuations in these frequency components.
- Means for obtaining fluctuations in frequency components corresponding to the function adjustment signal, fatigue acceptance signal, and activity adjustment signal are 0.01 Hz belonging to the VLF band from the ULF band, corresponding to the function adjustment signal, fatigue acceptance signal, and activity adjustment signal.
- the sleep onset symptom detection means includes means for determining a sleep onset symptom phenomenon when an amplitude divergence tendency is detected with respect to a predetermined reference in the frequency gradient time series waveform obtained by the frequency inclination calculation means. It is preferable.
- the imminent sleep phenomenon detecting means detects an imminent sleep phenomenon when a tendency of convergence of amplitude is detected with respect to a predetermined reference in the frequency gradient time series waveform obtained by the frequency inclination calculating means, and the period becomes longer. It is preferable that a means for determining is provided.
- the subjective drowsiness / low consciousness driving state detection means includes a frequency component in which a distribution ratio of a frequency component corresponding to the function adjustment signal among the three frequency components obtained by the distribution ratio calculation means corresponds to the activity adjustment signal. It is preferable to provide means for detecting light sleepiness or momentary low sensation running condition on condition that the distribution ratio is equal to or higher than the distribution rate of
- the subjective drowsiness / low consciousness driving state detecting means is a frequency in which a degree of change of a frequency component corresponding to the function adjustment signal among the three frequency components obtained by the degree of change calculating means corresponds to the activity adjustment signal. It is preferable to provide means for detecting light sleepiness or momentary low sensation driving conditions under conditions where the absolute value of each component is greater than or equal to a predetermined value together with the degree of change of the components.
- the subjective sleepiness / low consciousness driving state detection means determines whether the basic state of the driver is a relaxed state or a tension state, and the light sleepiness depends on whether the determined basic state is a relaxed state or a tension state. Alternatively, it is preferable to have means for selecting a determination criterion as to whether or not it corresponds to an instantaneous low-sense driving state.
- the subjective drowsiness / low consciousness running state detecting means further includes the peak values of the time series waveforms of the distribution ratios of the three frequency components obtained by the distribution ratio calculating means within a predetermined difference in appearance time. It is preferable to include means for detecting strong drowsiness or a continuous low sensation running state when the values appear in a predetermined order and satisfy a predetermined distribution rate condition.
- the means for determining the driving ineligibility period in the subjective drowsiness / low consciousness driving state detecting means is an appearance time of a peak value satisfying a predetermined distribution rate condition of the three frequency components obtained by the distribution rate calculation unit, When the following relationship is satisfied: activity adjustment signal ⁇ function adjustment signal ⁇ fatigue acceptance signal (however, the difference between the appearance time of the peak values of the activity adjustment signal and the fatigue acceptance signal is within a predetermined time) It is preferable to determine that the driving state is low.
- the conscious drowsiness / low consciousness running state detecting means detects conscious drowsiness or low consciousness running when an amplitude convergence tendency is detected with respect to a predetermined reference in the frequency inclination time series waveform obtained by the frequency inclination calculating means. It is preferable to provide means for determining that the state is present.
- the determination detection means further includes initial fatigue determination means for determining the presence or absence of initial fatigue at the start of operation, and the initial fatigue determination means is the same homeostasis maintenance function level in the homeostasis maintenance function level determination means. Is preferably determined to have initial fatigue when it continues for a predetermined time or more. It is preferable that the determination detection unit further includes a mood determination unit that determines a biological state in an initial stage of operation until a predetermined time has elapsed after the start of operation.
- the biological state of the driver using the history information of the determination results obtained by the sleep onset symptom detection means, the imminent sleep phenomenon detection means, the subjective drowsiness / low consciousness running state detection means, and the homeostasis maintenance function level determination means It is preferable to further include a history use biological state determination means for determining
- the frequency calculating means obtains a zero-cross point that switches from positive to negative, and uses this zero-cross point to obtain a time-series waveform of the frequency of the biological signal.
- the frequency calculating means is means for smoothing and differentiating a time series waveform of a biological signal obtained by the biological signal measuring device to obtain a local maximum value, and using this local maximum value to obtain a time series waveform of a frequency of the biological signal. It is preferable.
- the frequency of the function adjustment signal used for the distribution rate calculation means is 0.0027 Hz or less, the frequency of the fatigue acceptance signal is in the range of 0.002 to 0.0052 Hz, and the frequency of the activity adjustment signal is 0.004. It is preferable that the frequency is ⁇ 0.007 Hz.
- the computer program of the present invention is an operating biological state determining device that uses a biological signal collected from a driver's back by a biological signal measuring device provided in a driver's seat to determine a biological state in the driving environment of the driver. And an analysis calculation procedure for performing a predetermined calculation using a time-series waveform of the biological signal and a determination detection procedure for determining or detecting the biological state using a calculation result of the analysis calculation means.
- a sleep onset symptom detection procedure for detecting a sleep onset symptom phenomenon that is a physical condition change phenomenon before going to sleep, and an imminent sleep phenomenon that is a physical condition change phenomenon before sleep onset after the appearance of the sleep onset symptom phenomenon are detected.
- Imminent sleep phenomenon detection procedure and conscious sleepiness with conscious sleepiness or low consciousness driving state due to reduced consciousness level A state detection procedure and a homeostasis maintenance function level determination procedure for determining a level of adaptive capacity of the homeostasis maintenance function, and the sleep onset symptom detection procedure, the imminent sleep phenomenon detection procedure, the conscious sleepiness / sensation
- the low running state detection procedure and the homeostasis maintenance function level determination procedure are executed in parallel.
- the present invention includes, as determination detection means, a predictive sleep phenomenon detection means, an imminent sleep phenomenon detection means, a subjective sleepiness / low sensation running state detection means, and a homeostasis maintenance function level determination means, which function in parallel It is. Therefore, detection of sleep onset, imminent sleep, or light sleepiness (mild drowsiness) or resistance to strong sleepiness under the consciousness, and a low consciousness driving state due to a decrease in consciousness level momentarily occurred. In such a case, it is possible to determine and detect the case and the case of continuous occurrence for a longer time by the respective means, and it is possible to determine the biological state of the driver more accurately than in the past.
- the homeostasis maintenance function level determination means determines the change in the adaptive capacity level, and is provided with the initial fatigue determination means, so that in the initial operation, the environment changes from another environment to a new environment.
- the presence or absence of an initial fatigue state in the initial operation when transitioned can be determined. Since the living state in the initial stage of the driving affects the state after several hours due to circadian rhythm and the like, it is possible to give the driver attention to urge the driver to take a break after several hours in the initial stage of driving.
- the driver's biological state can be grasped from various angles, it is easy to prompt a break at an appropriate driving and an appropriate timing, and it is suitable as a device for grasping the biological state at the time of driving. .
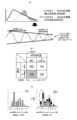
- FIG. 1 is a perspective view showing an example of a trunk biosignal measuring apparatus used in an embodiment of the present invention.
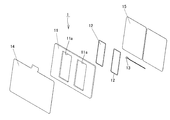
- FIG. 2 is an exploded perspective view of the trunk biological signal measuring device shown in FIG.
- FIG. 3 is a cross-sectional view of a main part of the biological signal measuring apparatus for trunk shown in FIG.
- FIG. 4 is a diagram schematically showing the configuration of the biological state analyzer according to the embodiment of the present invention.
- FIG. 5 is a diagram for explaining the frequency calculation means and the frequency inclination calculation means in the analysis calculation means.
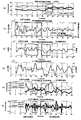
- FIG. 6 shows an example of a sleep experiment result.
- FIG. 6 is a diagram showing the degree of change in distribution rate.
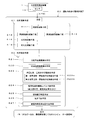
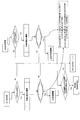
- FIG. 7 is a flowchart for explaining a process of determining a sleep onset sign phenomenon.
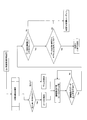
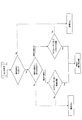
- FIG. 8 is a flowchart for explaining a process of determining an imminent sleep phenomenon.
- FIG. 9 is a flowchart for explaining a process of determining a sleep onset sign phenomenon.
- FIG. 10 is a flowchart for explaining a process of determining an imminent sleep phenomenon.
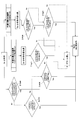
- FIG. 11 is a flowchart for explaining a determination process such as light sleepiness.
- FIG. 12 is a flowchart for explaining a determination process such as light sleepiness.
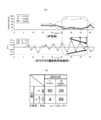
- FIG. 13 is a diagram for explaining a method for determining strong sleepiness or the like.
- FIG. 14 is a flowchart for explaining a determination process such as strong sleepiness.
- FIG. 15A is a diagram for explaining a method for detecting subjective drowsiness or the like in a frequency gradient time-series waveform.
- FIG. 15A is a diagram for explaining a method for detecting subjective drowsiness or the like in a frequency gradient time-series waveform.
- FIG. 15A is a diagram for explaining a method for detecting subjective drowsiness or the like in a frequency gradient time-
- FIG. 15B is a diagram showing the result of the chi-square test of the dynamic experiment of Experimental Example 1.
- FIG. 15C is a graph showing the difference in the number of detection cases depending on whether or not a detection method such as subjective sleepiness using a frequency gradient time series waveform is used.
- FIG. 16 is a flowchart for explaining the determination process by the mood determination means.
- FIG. 17 is a diagram for explaining a detection method of the history utilization biological state detection means.
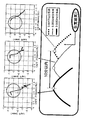
- FIG. 18A is a diagram showing the results of time series waveforms of the APW distribution rate measured in the static experiment of Experimental Example 1
- FIG. 18B is the distribution of APW measured in the dynamic experiment. It is the figure which showed the result of the time-sequential waveform of a rate.
- FIG. 18A is a diagram showing the results of time series waveforms of the APW distribution rate measured in the static experiment of Experimental Example 1
- FIG. 18B is the distribution of APW measured in the dynamic experiment. It is the figure which showed
- FIG. 19A shows an example in which subjective sleepiness and the like are detected using the frequency gradient time-series waveform in 89 dynamic experiments of Experimental Example 1, and FIG. 19B shows the detection result of subjective sleepiness based on the distribution rate. It is the figure which showed the result of the chi-square test evaluated together.
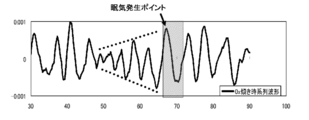
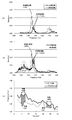
- FIGS. 20A and 20B are diagrams for explaining a method of determining a sleep onset sign phenomenon from a frequency gradient time-series waveform.
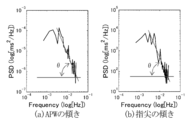
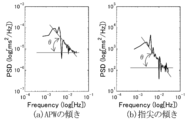
- FIGS. 21A and 21B are diagrams showing the results of frequency analysis for 25 minutes before and 25 minutes after reaching the sleepiness peak in FIGS. 20A and 20B, respectively.
- FIG. 20A and 20B are diagrams for explaining a method of determining a sleep onset sign phenomenon from a frequency gradient time-series waveform.
- FIGS. 21A and 21B are diagrams showing the results of frequency analysis for 25 minutes before and 25 minutes after reaching the sleepiness peak in FIGS. 20A and 20B, respectively.
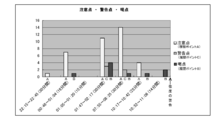
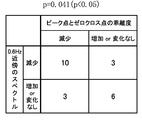
- FIG. 22 is a diagram illustrating a 2 ⁇ 2 cross table regarding fingertip volume pulse waves of ten subjects in Experimental Example 2 and arousal and sleep onset signs in APW.
- FIG. 23 is a diagram showing an example of data indicating the correlation between the APW frequency gradient time series waveform and the presence or absence of drowsiness collected during actual vehicle travel.
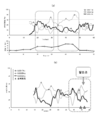
- FIG. 24 shows the result of the sleep experiment of the subject in Experimental Example 3, (a) shows the distribution rate of the electroencephalogram, and (b) shows the sympathetic nerve (LF / HF obtained from the fingertip volume pulse wave).
- FIGS. 25A and 25B are diagrams showing the frequency analysis results of the sleepiness resistance state in Experimental Example 3.
- FIG. 26A and 26B are diagrams showing the frequency analysis results of the sleep state.
- FIGS. 27A to 27D are diagrams showing the results of male subjects in their 30s in the demonstration experiment during long distance running in Experimental Example 4.
- FIG. 25A to 25D are diagrams showing the results of male subjects in their 30s in the demonstration experiment during long distance running in Experimental Example 4.
- FIGS. 28 (a) to 28 (d) are graphs showing the results of male subjects in their 40s in the demonstration experiment during long distance running in Experimental Example 4.
- FIG. 29 is a diagram showing an example of physical condition management using the result of the demonstration experiment at the time of long distance running in Experimental Example 4.
- FIGS. 30A to 30C are diagrams showing the analysis results of Experimental Example 5.
- FIG. 31 is a diagram showing an evaluation result of the accuracy of the degree of deviation between the APW peak point and the zero-cross point in Experimental Example 5.
- 32 (a) to 32 (h) are diagrams showing the results of sleep experiments in Experimental Example 6.
- FIG. 33A to 33E are diagrams illustrating waveforms of various biological signals from 374 seconds to 25 seconds in the sleep state of Experimental Example 6.
- FIGS. 34A to 34E are diagrams showing the APW analysis results in the sleep experiment of Experimental Example 6.
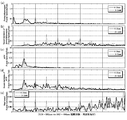
- FIGS. 35A to 35E are diagrams showing the frequency analysis results of various biological signals in the sleep experiment of Experimental Example 6.
- FIGS. 1 to 3 show biological signals collected from the back of a driver who is an analysis target of the driving state determination apparatus 60 according to an embodiment of the present invention, that is, a heart wave (Aortic Pulse Wave ( It is the figure which showed the biological signal measuring apparatus 1 which extract
- the heart oscillating wave is a pressure vibration generated from the motion of the heart and the aorta detected from the back of a human upper body, and includes information on the ventricular systole and diastole.
- the heart rocking wave (APW) includes elasticity information of the blood vessel wall and elasticity information based on blood pressure.
- the heart rocking wave (APW) is superimposed on the information near the center obtained from heart sounds and electrocardiograms, and the influence of the internal pressure fluctuation of the arterial tube and the elasticity of the blood vessel wall on the input wave starting from the heart.
- This information includes both information of the output wave (that is, information whose period characteristics are changed by peripheral information obtained from the fingertip volume pulse wave that originally has the same period and the same fluctuation).
- the signal waveform associated with heart rate variability includes sympathetic and parasympathetic nervous system activity information (parasympathetic activity information including the compensation of sympathetic nerves), and the signal waveform associated with aortic oscillation is sympathetic. Contains information on neural activity.
- the biological signal measuring apparatus 1 used in the present embodiment includes a core pad 11, a spacer pad 12, a sensor 13, a front film 14, and a rear film 15, as shown in FIGS.
- the core pad 11 is formed in, for example, a plate shape, and two vertically long through holes 11a and 11a are formed at symmetrical positions across a portion corresponding to the spinal column.
- the core pad 11 is preferably composed of a polypropylene bead foam formed in a plate shape.
- the expansion ratio is in the range of 25 to 50 times, and the thickness is less than the average diameter of the beads. For example, when the average diameter of 30 times expanded beads is about 4 to 6 mm, the thickness of the core pad 11 is sliced to about 3 to 5 mm.
- the spacer pad 12 is loaded into the through holes 11 a and 11 a of the core pad 11.
- the spacer pad 12 is preferably formed from a three-dimensional solid knitted fabric.
- the three-dimensional solid knitted fabric includes, for example, a pair of ground knitted fabrics arranged apart from each other as disclosed in JP 2002-331603 A, JP 2003-182427 A, and the like.
- the knitted fabric has a three-dimensional three-dimensional structure having a large number of connecting yarns that reciprocate between the knitted fabrics to couple them together. When the 3D solid knitted fabric is pressed by the person's back, the connecting yarn of the 3D solid knitted fabric is compressed, tension is generated in the connecting yarn, and the vibration of the body surface through the human muscle accompanying the biological signal is propagated.
- a spacer pad 12 made of a three-dimensional solid knitted fabric that is thicker than the core pad 11. Accordingly, when the peripheral portions of the front film 14 and the rear film 15 are attached to the peripheral portions of the through holes 11a and 11a, the spacer pad 12 made of a three-dimensional solid knitted fabric is pressed in the thickness direction. Tension due to the reaction force of the film 15 is generated, and solid vibration (membrane vibration) is likely to occur in the front film 14 and the rear film 15.
- the spacer pad 12 made of a three-dimensional solid knitted fabric is also pre-compressed, and the connecting yarn that holds the shape of the three-dimensional solid knitted fabric in the thickness direction is also subjected to tension due to a reaction force, and string vibration is likely to occur.
- the sensor 13 is fixedly disposed on one of the spacer pads 12 before the front film 14 and the rear film 15 are laminated.
- the three-dimensional solid knitted fabric constituting the spacer pad 12 is composed of a pair of ground knitted fabrics and connecting yarns, and the string vibration of each connecting yarn is connected to the front film 14 and the ground via the nodes of the ground knitted fabric.
- the sensor 13 is preferably fixed to the surface of the spacer pad 12 (the surface of the ground knitted fabric).
- a microphone sensor in particular, a condenser microphone sensor.
- the above-described biological signal measuring apparatus 1 is disposed, for example, at the seat back position of the driver's seat of a transport device such as an automobile. For example, it is disposed inside the skin of the seat back or disposed on the back surface of a cushion member used by being laminated on the seat back.
- the driving biological state determination device 60 includes an analysis calculation unit 61, a determination detection unit 62, and the like.
- the operating biological state determination device 60 is constituted by a computer, and a computer program is introduced which causes the computer to execute an analysis calculation procedure to function as the analysis calculation means 61 and to execute the determination detection procedure to function as the determination detection means 62. Is done.
- the computer program can be provided by being stored in a recording medium such as a flexible disk, hard disk, CD-ROM, MO (magneto-optical disk), DVD-ROM, or memory card, or transmitted through a communication line. Is possible.
- the analysis calculation means 61 analyzes and calculates the APW, which is a biological signal obtained from the biological signal measuring apparatus 1, and processes it into a predetermined form. Specifically, it comprises a frequency calculation means 611, a frequency slope calculation means 612, a frequency fluctuation calculation means 613, a distribution rate calculation means 614, and a change degree calculation means 615, each of which is a computer. It functions by executing a frequency calculation procedure, a frequency gradient calculation procedure, a frequency fluctuation calculation procedure, a distribution rate calculation procedure, and a change rate calculation procedure, which are programs.
- the frequency calculation means 611 is a predetermined time-series data of the output signal (APW) obtained from the sensor 13 of the biological signal measuring apparatus 1, preferably a filtering process (for example, a filtering process for removing frequency components such as body movement).
- a filtering process for example, a filtering process for removing frequency components such as body movement.
- the time-series waveform of the frequency in the time-series data in the frequency domain is obtained.
- the frequency calculating means 611 uses a point where the output signal (APW) obtained from the sensor of the biological signal measuring apparatus 1 switches from positive to negative (hereinafter, referred to as “zero cross point”) in a time series waveform.
- zero cross detection method captures the fundamental component of the frequency of a biological signal and indicates the level of LF / HF expression used as an index of sympathetic nerve function.
- the zero-cross point is first obtained, it is divided, for example, every 5 seconds, and the reciprocal of the time interval between the zero-cross points of the time-series waveform included in the 5 seconds is obtained as the individual frequency f.
- the average value of the individual frequencies f in the second is adopted as the value of the frequency F in the five seconds (step [1] in FIG. 5).
- a frequency time series waveform is obtained by plotting the frequency F obtained every 5 seconds (step [2] in FIG. 5).
- the frequency calculation means 611 a method for smoothing and differentiating the time series waveform of the output signal (APW) obtained from the sensor of the biological signal measuring apparatus 1 and obtaining the time series waveform using the maximum value (peak) (hereinafter, “ It is also possible to employ a “peak detection method”.
- the peak detection method is basically a time series waveform corresponding to the function of HF used as an index of parasympathetic nerve function.
- the maximum value is obtained by a smoothing differential method using Savitzky and Golay.
- the local maximum value is divided every 5 seconds, and the reciprocal of the time interval between the local maximum values of the time series waveform included in the 5 seconds (the peak on the peak side of the waveform) is obtained as the individual frequency f.
- the average value of f is adopted as the value of the frequency F for 5 seconds (step [1] in FIG. 5).
- a frequency time series waveform is obtained by plotting the frequency F obtained every 5 seconds (step [2] in FIG. 5).
- the APW is a biological signal including information on both the peripheral control state and the heart control state, that is, the state of sympathetic innervation of the artery, and the autonomic nervous system, like the fingertip plethysmogram.
- This is a biological signal that includes the appearance information of the sympathetic nervous system and parasympathetic nervous system, and the waveform obtained by processing the absolute value of the time series waveform of the inclination of the biological signal by the zero cross detection method is related to the state of control of the heart. Reflects the appearance of nerves.
- the method based on the peak detection method is related to heart rate variability, and captures the dynamics of the parasympathetic nervous system in consideration of the compensation effect of the sympathetic nerve.
- the absolute value processing of the slope time series waveform by the peak detection method is the parasympathetic nerve dynamics by wavelet analysis of the fingertip plethysmogram (the parasympathetic nerve dynamics include sympathetic compensation) Is relatively approximate. Therefore, it is considered that the zero-cross detection method can be used as an index representing a physical condition resulting from adaptation to stress that is dealt with by control of the autonomic nervous system. Since the zero-cross detection method is highly related to the state of control of the heart, it includes information on notches of heart rate variability, and is obtained by the occurrence of APW time difference and fluctuation, which cannot be obtained by fingertip volume pulse waves. Information on the frequency component of the phase delay that occurs in the vicinity of 5 Hz or in the vicinity of 1 to 2 Hz is also obtained. Therefore, it is preferable to mainly use data obtained by the zero cross detection method when determining the biological state using the APW.
- the frequency slope calculating means 612 sets a time window of a predetermined time width with a predetermined overlap time from the time series waveform of the frequency of the output signal of the sensor of the biological signal measuring device 1 obtained by the frequency calculating means 611.
- the gradient of the frequency of the output signal of the sensor is obtained by the least square method for each time window, and the time series waveform is output.
- the frequency gradient in a certain time window Tw1 is obtained by the least square method and plotted (steps [3] and [5] in FIG. 5).
- the next time window Tw2 is set at the overlap time Tl (step [6] in FIG. 5), and the frequency gradient in this time window Tw2 is similarly obtained by the least square method and plotted.
- This calculation (movement calculation) is sequentially repeated, and the time-series change in the frequency gradient of the airpack signal is output as a frequency gradient time-series waveform (step [8] in FIG. 5).
- the time width of the time window Tw is preferably set to 180 seconds
- the overlap time Tl is preferably set to 162 seconds.
- Patent Document 3 WO2005 / 092193A1 by the present applicant, this is a characteristic signal waveform from a sleep experiment in which the time width of the time window Tw and the overlap time Tl are variously changed. Is selected as the value that appears most sensitively.
- the fluctuation characteristics of atrial fibrillation are switched at 0.0033 Hz, and fluctuations for adjusting the fluctuation of 0.0033 Hz are said to exist in the vicinity of 0.0033 Hz or less. Therefore, when the fluctuation state centered at 0.0017 Hz, which is between 0 Hz and 0.0033 Hz, is considered, an outline of the fluctuation state occurring in the vicinity of 0.0033 Hz and below will appear even if variations occur. .
- 180 seconds is preferable.
- the state of change in 180 seconds and 3 minutes, the tendency of change, the differential coefficient, and the slope are captured as a time-series waveform.
- the time for 180 seconds is wrapped 90% and plotted every 18 seconds to create a time series waveform, and analysis is performed using the time series waveform of this slope. I do.
- This tilt time-series waveform captures fluctuations in homeostasis, and is used to globally evaluate the degree of control of heart rate variability as a time-series waveform.
- the frequency fluctuation calculation means 613 performs movement calculation for obtaining an average value of the frequency for each predetermined time window set with a predetermined overlap time in the time series waveform obtained by the frequency calculation means 611, and obtains it for each time window.
- a time-series change in the average value of the obtained frequencies is output as a frequency-change time-series waveform.
- the time series waveform of the frequency obtained by the peak detection method captures both information of the sympathetic nerve activity and the parasympathetic nerve activity, and the time series waveform of the frequency obtained by the zero cross detection method is the sympathetic nerve activity. Information.
- the frequency variation time-series waveform by the zero cross detection method captures the sympathetic nerve activity
- the frequency fluctuation time series waveform by the peak detection method captures both sympathetic nerve activity and parasympathetic nerve activity
- the frequency is zero-crossed because it is affected by both the decrease in sympathetic nerve activity and the increase in parasympathetic nerve activity in the sleep state. It is even lower than in the case of the detection method. Therefore, when the two frequency fluctuation time series waveforms are compared between the awake state and the sleep state, the degree of divergence between the two changes. That is, the degree of divergence between the two is smaller in the sleeping state than in the awakening state (see FIG. 30C).
- the divergence degree determination means which is a computer program for determination, by the in-vehicle driving biological state determination device 60 or the data accumulated in the in-vehicle driving biological state determination device 60. May be analyzed by a manager's management computer in which the deviation degree determination means is set, and used for state management during driving for each driver.
- the data obtained by the in-vehicle operating biological state determination device 60 may be set to be transmitted to the management computer through a communication line at all times or periodically. In this case, the management computer The degree of divergence can be determined based on the received data.
- the distribution rate calculation means 614 performs frequency analysis on the frequency slope time series waveform obtained from the frequency slope calculation means 612, and obtains a power spectrum of each frequency corresponding to the above-described function adjustment signal, fatigue acceptance signal, and activity adjustment signal. Frequency components corresponding to the above-described function adjustment signal, fatigue acceptance signal and activity adjustment signal are extracted from the time series change of the obtained power spectrum, and the sum of the power spectrum values of these three frequency components is extracted. The ratio of each of the three frequency components is calculated in time series when the value is set to 100, and the time series fluctuation waveform is obtained as a distribution rate waveform.
- 0.0017 Hz is a function adjustment signal
- 0.0035 Hz is a fatigue acceptance signal
- 0.0053 Hz is an activity adjustment signal.
- the function adjustment signal is in the range of 0.0027 Hz or less
- the fatigue acceptance signal is in the range of 0.002 to 0.0052 Hz
- the frequency of the activity adjustment signal can be adjusted in the range of 0.004 to 0.007 Hz. .
- the degree-of-change calculating means 615 applies smoothing differentiation to the time-series distribution rate obtained by the distribution rate calculating means, and adjusts the function adjustment signal, fatigue acceptance signal, and activity adjustment between arbitrary time points on the time axis.
- the degree of change in the distribution rate is obtained for at least one of the three frequency components of the signal.
- between the arbitrary time points on the time axis to which the smoothed differentiation is applied can be appropriately selected from two or more points on the time axis to be adopted as calculation points.
- the determination detection unit 62 is a unit that determines or detects a biological state using the calculation result of each calculation unit of the analysis calculation unit 61 described above, and includes a sleep symptom detection unit 621, an imminent sleep phenomenon detection unit 622, a subjective sleepiness / Consciousness low running state detection means 623, homeostasis maintenance function level determination means 624, initial fatigue determination means 625, etc., each of which includes a computerized sleep program predictive phenomenon detection procedure, an imminent sleep phenomenon detection procedure, It functions by executing a subjective drowsiness / low consciousness driving state detection procedure, a homeostasis maintenance function level determination procedure, an initial fatigue determination procedure, and the like.
- the sleep onset symptom detection means 621 detects a sleep onset symptom phenomenon.
- the sleep onset symptom is a physical condition change phenomenon that occurs 5 to 30 minutes before sleep onset, but does not involve subjective sleepiness. Therefore, it is captured by a signal of enhanced sympathetic nerve function.
- the sleep onset symptom detection means 621 makes a determination using an index related to autonomic nerve control among the calculation results of the analysis calculation means 61 described above.
- the determination is made using the frequency gradient time series waveform by the frequency gradient calculation means 612 using the zero cross detection method.
- FIG. 6 shows an example of a sleep experiment result.
- (c) shows an example of a frequency gradient time series waveform using the zero cross detection method.
- the sleep onset sign phenomenon is basically determined by the appearance of a plurality of continuous waves having large amplitudes in the frequency gradient time-series waveform. As shown in FIG.
- the frequency gradient time series waveform using the zero cross detection method is smoothed and differentiated, and the point at which the positive gradient is switched to the negative gradient is detected as a peak.
- a point at which the inclination is switched to a positive inclination is detected as a bottom, and an amplitude value between the two is calculated.
- Imminent sleep phenomenon detection means 622 detects an imminent sleep phenomenon.
- the impending sleep phenomenon is a phenomenon that occurs 1 to 5 minutes before the onset of sleep in the dominant state of the parasympathetic nerve function due to the decline of the sympathetic nerve function after the appearance of the sleep onset predictor phenomenon. Captured by signals of enhanced function.
- the impending sleep phenomenon is a physical condition change phenomenon that is unnoticeable like the sleep onset sign phenomenon, but may be accompanied by a strong subjective sleepiness depending on the person or the physical condition and surrounding environment at that time.
- the impending sleep phenomenon is a point where the waveform shows a convergence tendency after the waveform showing the sleep onset symptom described above appears in the frequency-gradient time-series waveform using the zero-crossing detection method, and then shows a fluctuation fluctuation with a longer period. It is.
- the imminent sleep phenomenon is specified from 29 to 38 minutes, and occurs several minutes before the sleep point determination by the electroencephalogram. In specifying the imminent sleep phenomenon in real time, in this embodiment, determination as shown in FIG. 8 is performed.
- the frequency gradient time-series waveform using the zero cross detection method is smoothed and differentiated, the point at which the positive gradient is switched to the negative gradient is detected as the peak, and the point at which the negative gradient is switched to the positive gradient is detected as the bottom.
- the amplitude value between the two is calculated.
- the value of the smoothed differential waveform falls within a predetermined range continuously for a predetermined calculation point or more and shows a tendency to converge, and then is determined to be an imminent sleep phenomenon when there is a larger fluctuation fluctuation with a longer period To do.
- the sleep onset sign phenomenon detection means 621 and the imminent sleep phenomenon detection means 622 of the present embodiment are on the time axis of three frequency components corresponding to the function adjustment signal, fatigue acceptance signal and activity adjustment signal obtained by the distribution rate calculation means 614. Using at least one of each distribution rate at any point in time and the degree of change of any frequency component obtained by the degree-of-change calculating means 615, a driver including a predictive sleep phenomenon or an imminent sleep phenomenon according to a predetermined criterion There is also a means for determining a biological state that is difficult to recognize.
- the function adjustment signal, fatigue acceptance signal, and activity adjustment signal are frequency components of less than 0.01 Hz belonging to the ULF band to the VLF band, and these are related to the state of body temperature control. Since the result of the control is reflected, by determining the distribution rate and the degree of change of the frequency component of this extremely low frequency / ultra low frequency according to a predetermined criterion, it is possible to capture the sleep onset phenomenon and the imminent sleep phenomenon .
- an activity adjustment signal (0.0053 Hz) or a fatigue acceptance signal (0.0035 Hz) is obtained from the time-series waveform of the distribution rate using the zero cross detection method for the sleep onset sign phenomenon. It is determined whether or not the function adjustment signal (0.0017 Hz) is lower than the predetermined value.
- the sleep onset symptom phenomenon is a temporary increase in sympathetic nerve function after fatigue has accumulated, and therefore a determination focusing on the increase in the distribution ratio of the activity adjustment signal and fatigue acceptance signal related to them It is. In order to grasp such a change more accurately, in the present embodiment, determination is performed in consideration of the degree of change obtained by the degree-of-change calculator 615.
- the degree of change of the activity adjustment signal (0.0053 Hz) is not less than a predetermined value in the positive direction
- the function adjustment signal (0.0017 Hz) is It is determined whether or not the negative direction is less than or equal to a predetermined value, that is, whether or not the change is greater than the predetermined value and simultaneously changes in the positive and negative directions.
- the imminent sleep phenomenon also occurs as a result of fatigue accumulation, and there is an increase in parasympathetic nerve function before reaching the sleep point, and the person is induced to a more relaxed state.
- the parasympathetic nerve function becomes dominant after the onset of sleep onset phenomenon, so the fluctuation controlling the heart rate variability that appears in the zero-cross detection method changes, and the parasympathetic nerve dominant that appears in the peak detection method
- the heart rate variability itself changes (the heart rate tends to decrease). Therefore, both the distribution rate using the zero cross detection method and the distribution rate using the peak detection method are used, and in particular, it is detected whether or not a change in the activity adjustment signal (0.0053 Hz) appears significantly.
- the sleep phenomenon is imminent in both the distribution rate using the zero-cross detection method and the distribution rate using the peak detection method, and both determinations are performed for a specified time. Only when it is within, it is finally determined to be an imminent sleep phenomenon and output.
- the activity adjustment signal (0.0053 Hz) in the zero cross detection method, in the distribution rate, the activity adjustment signal (0.0053 Hz) is equal to or higher than the predetermined value, and the activity adjustment signal (0.0053 Hz) or the fatigue acceptance signal.
- the degree of change of (0.0035 Hz) is larger than a predetermined value in the positive or negative direction and the degree of change of the function adjustment signal (0.0017 Hz) is larger than a predetermined value in the opposite direction of these, the immediate sleep Is determined.
- the activity adjustment signal (0.0053 Hz) or the function adjustment signal (0.0017 Hz) in the distribution rate, the activity adjustment signal (0.0053 Hz) or the function adjustment signal (0.0017 Hz) is not less than a predetermined value, and the activity adjustment signal (0.0053 Hz) or the fatigue acceptance signal (0.0035 Hz) changes.
- the sleep onset symptom detection means 621 and the imminent sleep phenomenon detection means 622 are based on the sleep onset symptom phenomenon, which is a biological state that is difficult to perceive, and in a biological state that may be perceived in some cases.
- Two determination methods a method of determining based on a predetermined standard using the distribution rate, are provided, and a sleep onset symptom phenomenon and an imminent sleep phenomenon are detected respectively.
- the sleep onset symptom detection means 621 and the imminent sleep phenomenon detection means 622 output an output (display on a monitor, generation of warning sound, It has a function of performing control such as vibration of the driver's seat.
- the sleep onset symptom detection means 621 and the imminent sleep phenomenon detection means 622 may be set such that the detection results are transmitted to the management computer constantly or periodically through a communication line.
- the data may be analyzed by the management computer after the operation is completed.
- the management computer also constitutes part of the operating biological state determination device of the present invention.
- the subjective drowsiness / low consciousness driving state detection means 623 uses the calculation result of the analysis calculation means 61, and the subjective drowsiness that is a physical condition change phenomenon before entering sleep accompanied by the driver's subjective drowsiness and the sensation caused by the decrease in the consciousness level. It is means for detecting a low running state.
- the “subjective drowsiness” here refers to signs of physical condition that can be consciously recognized. Light sleepiness (minor sleepiness) felt during driving, strong and unbearable that occurs as driving time increases This refers to strong sleepiness caused by rebound from sleepiness or overstress.
- the “slow driving state” is a good mental and physical state that is neither a lack of sleep nor an overworked state.
- the driver's own homeostasis maintenance function is a period when the consciousness of returning to the awake state from that state is potentially working.
- the response rate to sound is 0.9 to 1 before reaching sleep stage 1, so if you give some warning, you can easily raise the state of consciousness and attention. It is common in the point that it can return to the state where it can do, and also awakening.
- a sleep onset sign and an imminent sleep phenomenon can be distinguished from a subjective sleepiness or a low-slow running state in that it can be said to be a biological reaction as a preparation stage for sleep.
- “subjective drowsiness” and “subjective running state” are detected without distinction.
- “Subjective drowsiness” and “hypnotic running state” are frequency components of less than 0.01 Hz belonging to the VLF band from the ULF band reflecting the body temperature regulation function, in particular, a function adjustment signal centered on 0.0017 Hz, 0.0035 Hz Is closely related to changes in the fatigue acceptance signal centered on pp and activity adjustment signal centered on 0.0053 Hz. Therefore, the subjective drowsiness / low consciousness driving state detection means 623 has at least one of the distribution rate of each frequency component obtained by the distribution rate calculation means 614 and the degree of change of each frequency component by the change degree calculation means 615. Judgment is made using the calculation result.
- the subjective drowsiness / low consciousness running state detection means 623 is a means for determining that a light sleepiness (mild drowsiness) that awakens if yawning or an instantaneous low consciousness running state of 2 to 3 seconds or less ( Whether or not the first subjective sleepiness / hypnosis driving state detection means 623a) and the state of the strong sleepiness caused by the rebound to the long-time driving or the overstressed state as described above, Means for determining whether or not an instantaneous conscious low running state occurs continuously or intermittently within a predetermined time or falls into a longer conscious low running state (second subjective drowsiness / low conscious state detection) Means 623b).
- the first subjective drowsiness / low consciousness driving state detection means 623a is a frequency at which the distribution ratio of the frequency component corresponding to the activity adjustment signal among the three frequency components obtained by the distribution ratio calculation means 614 corresponds to the function adjustment signal. Appearance of mild drowsiness or momentary low sensation running state is determined under conditions that show a change that is less than the component distribution rate. As described above, the sleep onset symptom phenomenon and imminent sleep phenomenon are based on the detection of sudden increase in sympathetic nerve function while becoming parasympathetic dominant.
- the distribution ratio of the function adjustment signal (0.0017 Hz) for controlling the body modulation and function deterioration is relatively increased, and conversely the distribution ratio of the activity adjustment signal (0.0053 Hz) is relatively Appears at the timing when the level of consciousness declines without the user's awareness.
- the function adjustment signal and the activity adjustment signal Therefore, at that time, the degree of change of both frequency components is equal to or greater than a predetermined value in absolute value.
- the determination accuracy is further improved. I found it to increase. This is because the determination criteria are largely divided depending on whether the basic state of the driver to be determined is a relaxed state or a tensioned state (including an excited state). For example, when you are relaxed by driving on a familiar road alone, you are a professional driver accustomed to long-distance driving, and you are good at driving while relaxing. This is the case when it is balanced.
- the tension state (including the excitement state) is, for example, a case where the sympathetic nerve function is enhanced, for example, when there is a passenger and driving while talking.
- the relaxed state or the tension state changes depending on road conditions, break timing, music in the car, passengers getting on and off in a long driving environment. Accordingly, the first subjective drowsiness / low consciousness driving state detection means 623a always determines whether or not the driver is in a relaxed state, thereby changing the threshold value of the criterion for mild sleepiness or instantaneous low consciousness driving state. Let me judge. Whether the basic state is the relaxed state or the tension state (including the excited state) is determined using the distribution rate obtained from the distribution rate computing unit 614 and the degree of change obtained from the change degree computing unit 615. Specifically, as shown in FIG.
- the first subjective drowsiness / low consciousness driving state detection unit 623a of the present embodiment first uses the distribution rate obtained from the distribution rate calculation unit 614 using the zero-cross detection method, and the above exclusion condition. In the case where the condition does not enter, it is classified according to the above-described distribution condition whether the determination criterion for the relaxed state is used or the determination criterion for the tension state (including the excited state) is used. After being classified, it is determined whether or not the distribution rate of the function adjustment signal (0.0017 Hz) is equal to or higher than a predetermined value and the distribution rate of the activity adjustment signal (0.0053 Hz) is equal to or lower than a predetermined value. .
- FIG. 12 shows an example of the determination flow.
- the distribution rate of the activity adjustment signal (0.0053 Hz) when the distribution rate of the activity adjustment signal (0.0053 Hz) is equal to or lower than a predetermined value and the function adjustment signal (0.0017 Hz) is equal to or higher than a predetermined value exceeding the value (first condition). Judged as mild sleepy. Even when the first condition is not satisfied, the distribution ratios of the function adjustment signal (0.0017 Hz), the fatigue acceptance signal (0.0035 Hz), and the activity adjustment signal (0.0053 Hz) are all equal to or higher than a predetermined value (second condition) ) And the distribution rate of the function adjustment signal (0.0017 Hz) and the activity adjustment signal (0.0053 Hz) are both set to the second condition even when the first condition and the second condition are not satisfied. When the value is higher than the value (third condition), it is determined that the vehicle is mildly drowsy or momentary consciousness low driving state.
- the degree of change is obtained for each of different calculation points, for example, when a smoothing derivative at 11 points is applied and when a smoothing derivative at 2 points is applied.
- Each is determined by setting an appropriate threshold value. For example, when smoothing differentiation at 11 points is applied, the absolute value of the degree of change of the function adjustment signal (0.0017 Hz) and the activity adjustment signal (0.0053 Hz) is greater than or equal to a predetermined value (fourth condition). Judged as mild drowsiness or momentary low consciousness.
- the first subjective drowsiness / low sensation running state detection means 623a includes the function adjustment signal (0.0017 Hz), fatigue acceptance signal (0.0035 Hz) and activity adjustment signal (0.0053 Hz) related to body temperature control. Since the determination is made using the distribution rate and the degree of change, it is possible to accurately determine the mild sleepiness or instantaneous low-slow running state, which is a recognizable physical condition change, and it is suitable for determining the living state during driving.
- the second subjective drowsiness / low consciousness running state detection means 623b is in a state of strong sleepiness that is caused by rebounding for a long time driving or an over-tension state beyond the mild sleepiness range, or A means for determining whether or not the instantaneous low-tidal driving state occurs continuously within a predetermined time (including when intermittent driving occurs and when falling into a longer low-tick driving state). is there.
- Driving involves manual labor such as maintaining a predetermined sitting posture, steering wheel and pedal operations, and brain labor that repeatedly collects various information and makes instantaneous judgments while driving. For this reason, not only does long-time driving accumulate fatigue, but long-time driving on highways, etc., results in a constant speed, which reduces the frequency of both physical and brain activities, resulting in strong sleepiness. May occur, or a low driving state may repeatedly occur within a predetermined time, or a single low driving state may take a longer time (eg, 3 seconds or more). More specifically, when sleepiness requiring sleep occurs, the body prepares to resist sleepiness by increasing sympathetic nerve activity. As a result, the distribution rate of the activity adjustment signal (0.0053 Hz) increases.
- FIG. 13 is a diagram schematically showing this change, but many subjects showed such a change in the state, for example, when strong sleepiness was actually generated from a large number of experimental results.
- the second subjective drowsiness / low consciousness running state detection means 623b is configured such that each peak value of the time series waveform of the distribution ratio of the three frequency components obtained by the distribution ratio calculation means 614 is within a predetermined difference in appearance time. If the values appear in a predetermined order and satisfy the predetermined distribution rate condition, they are in a state of resistance to the strong sleepiness described above or continuously (occurs intermittently within a predetermined time) In this case, it is set so that it is determined that the driving state is low (including the case of continuing for a longer time).
- the appearance time of the peak value of the distribution ratio of the function adjustment signal (0.0017 Hz), the fatigue acceptance signal (0.0035 Hz), and the activity adjustment signal (0.0053 Hz) is
- activity adjustment signal ⁇ function adjustment signal ⁇ fatigue acceptance signal (first condition)
- the difference between the appearance time of the peak value of the activity adjustment signal and the fatigue acceptance signal is within a predetermined time (first 2)
- if any frequency component satisfies the condition that the distribution ratio is equal to or higher than a predetermined distribution rate third condition
- the state is in a state of resistance to strong sleepiness or is continuous (intermittent within a predetermined time) If this occurs, it is determined that the vehicle is in a low-sense driving state (including the case of continuing for a longer time).
- the peak value of each distribution ratio is adjusted for activity.
- the condition of signal ⁇ function adjustment signal ⁇ fatigue acceptance signal is satisfied (fourth condition), it is in a state of resistance to strong sleepiness or continuously (if it occurs intermittently within a predetermined time, it takes longer time)
- a configuration in which it is determined that the driving state is low (including the case of continuing) is preferable.
- the mechanism that causes conscious sleepiness is enhanced sympathetic nerve activity (increased distribution rate of activity adjustment signal (0.0053 Hz)), transition to tension / concentration state (function adjustment signal (0.0017 Hz)). )), Parasympathetic nerve activity is thought to be activated (fatigue acceptance signal (0.0035Hz) rise), but there are some cases in which strong subjective sleepiness occurs without going through the process. It was done. Then, considering the frequency gradient time series waveform in that case, as shown in FIG. 15A, the tendency of the amplitude to converge with respect to a predetermined reference is detected, and the period may be shortened. all right. Specifically, the amplitude was reduced and the period was shortened from about 300 seconds to about 200 seconds.
- FIG. 15B shows the result of chi-square test when subjective sleepiness is detected using only the distribution ratios of the three frequency components by the distribution ratio calculation means 614 (data of 89 dynamic experiments in Experimental Example 1 described later). ) With 23 undetected cases and a correct answer rate of 77%. Therefore, in the frequency gradient time series waveform, when the amplitude value is in a predetermined set range and the period is shortened to the predetermined set range, it is detected as strong subjective sleepiness, as shown in FIG. As can be seen, the number of undetected cases was 4, and the determination accuracy was increased.
- the second subjective drowsiness / low consciousness running state detection means 623b is preferable to use the determination based on the frequency gradient time series waveform in addition to the determination based on the distribution rate described above, and to detect strong sleepiness.
- the subjective drowsiness / low consciousness driving state detection means 623 also informs the driver of the same as the sleep onset symptom detection means 621 and the imminent sleep phenomenon detection means 622 if the subjective sleepiness or low consciousness driving state is detected. It has a function to control to perform warning (display on monitor, generation of warning sound, vibration of driver's seat, etc.).
- the subjective sleepiness and low consciousness driving states are states in which attention is reduced due to drowsiness or a decrease in consciousness level, as described above. Easy to encourage.
- the subjective drowsiness and low consciousness driving state is a stage before reaching sleep stage 1, and since the response rate to sound is 0.9 to 1, it is particularly preferable to warn with sound. .
- the subjective drowsiness / low consciousness running state detecting means 623 transmits the detection result to the management computer through a communication line constantly or periodically. It may be set, and after the operation ends, the data may be analyzed by the management computer.
- a subjective sleepiness / low sensation running state detection means 623 in addition to the sleep onset sign phenomenon detection means 621 and the imminent sleep phenomenon detection means 622, there is a subjective sleepiness / low sensation running state detection means 623.
- a living state that is difficult to recognize (including not being aware of it at all, including a state in which it is impossible to recover to awakening when you become aware), such as a predictive sleep phenomenon or an imminent sleep phenomenon.
- a perceptible biological state that is considered to be unfit for driving which is a state of resistance to mild sleepiness or strong sleepiness, and to detect a momentary low or continuous low driving state Can do.
- the subjective sleep and the low-awareness running state are repeated in combination, and the sleep onset sign phenomenon and the imminent sleep phenomenon may be detected.
- the sleep onset sign phenomenon and the impending sleep phenomenon are not necessarily detected after the detection timing of the subjective drowsiness or the low driving state, and may appear earlier.
- the subjective sleepiness / low sensation running state detection means 623 is included, so that it takes time to reach a nap.
- the biological state change can be captured in any pattern, and is suitable as a device for capturing the biological state during driving.
- the homeostasis maintenance function level determination means 624 when the biological signal measuring device 1 obtains APW time-series waveform information for a predetermined time or more after activation of the driving biological state determination device 60 of the present embodiment, It is output as it is displayed.
- the homeostasis maintenance function level determination means 624 determines the level of the homeostasis maintenance function.
- the level of homeostasis maintenance function is divided into, for example, 5 to 7 stages, from the case where the homeostasis maintenance function is excellent (when the physical condition is good or the concentration is high) to the case where the homeostasis maintenance function is poor (when the physical condition is poor)
- a determination is made as to whether the concentration is reduced due to aside driving or the like (see FIGS. 27A and 28A).
- the homeostasis maintenance function is excellent (when the physical condition is good), and when it is lower than that, it is determined collectively. If the homeostasis maintenance function is inferior (when the physical condition is poor), and a different color display is made on each monitor, the driver can easily grasp.
- the homeostasis maintenance function is excellent, it is in good physical condition, but there is a tendency to drive too hard, and it is important not to be cautious because it may fall into a conscious driving state, and when the homeostasis maintenance function is inferior, It is possible to urge the driver to be aware that subjective drowsiness is likely to occur in addition to the conscious low driving state.
- the homeostasis maintenance function level determination means 624 is based on the technique disclosed in WO2011 / 046178 previously proposed by the applicant, and uses a zero-cross detection method obtained by the frequency slope calculation means 612 of the analysis calculation means 61.
- the determination is made using at least one of the absolute values of the frequency gradient time series waveforms obtained by the absolute value processing. Based on these combinations, the level of the homeostasis maintenance function is determined.
- the constancy maintaining function level determination means 624 calculates an integral value by performing absolute value processing on the frequency gradient time series waveform as disclosed in Japanese Patent Application Laid-Open No.
- a means for obtaining the value as the fatigue level is also set, and thereby the fatigue level during driving of the driver is also output. For example, it is displayed by changing the color of the image at a predetermined position on the monitor according to the degree of fatigue.
- the determination result of the level of the homeostasis function is displayed on an on-vehicle monitor or the like, but each determination of the sleep onset symptom detecting means 621, the impending sleep phenomenon detecting means 622, and the subjective sleepiness / low consciousness running state detecting means 623 is performed. Are also performed in parallel with this. Therefore, while the determination result of the level of homeostasis function is displayed on the monitor, when the sleep onset symptom phenomenon or the imminent sleep phenomenon is determined, or the subjective sleepiness or the low driving state is determined, the monitor displays A display showing them also appears. Alternatively, a warning sound is emitted, the vibration of the driver's seat, or some other warning means operates.
- the determination result of the level of the homeostatic function by the homeostatic function level determining unit 624 may also be set to be transmitted to the management computer through the communication line constantly or periodically. Such data may be analyzed by a management computer.
- the initial fatigue determination means 625 determines whether the driver is initially fatigued at the start of driving.
- the determination result in the homeostasis maintenance function level determination means 624 is used for determination of initial fatigue.
- the homeostasis maintenance function level determination unit 624 sequentially determines the driver's homeostasis maintenance function level (general judgment of good / bad physical condition). Therefore, the determination result is used to determine whether or not the driver has already accumulated fatigue at the start of driving.
- the homeostasis maintenance function level determination unit 624 sequentially determines the driver's homeostasis maintenance function level (general judgment of good / bad physical condition). Therefore, the determination result is used to determine whether or not the driver has already accumulated fatigue at the start of driving.
- When fatigue has already accumulated at the start of driving to encourage special attention to 24-hour period sleepiness due to circadian rhythm, 12-hour period sleepiness due to circadian rhythm, and 2-hour period due to ultradylism , To output a message or warning to take a break at those times.
- the presence or absence of initial fatigue is determined as follows.
- the homeostasis maintenance function level in the homeostasis maintenance function level determination means 624 normally proceeds while the homeostasis maintenance function level fluctuates up and down with the passage of time. However, when the subject is in a fatigued state, the biological fluctuation is reduced. Accordingly, the homeostasis maintenance function level proceeds at a certain level, for example, the homeostasis maintenance function level 1 state, the homeostasis maintenance function level 4 state, etc. for a predetermined time. Therefore, when the state without such biological fluctuation continues for a predetermined time, that is, when the same determination level continues for a predetermined time or more, it is determined that the initial fatigue is “present”. (FIG.
- the initial fatigue determination means 625 is used to determine whether the driver is initially fatigued at the start of driving and to determine whether or not a break after several hours is particularly necessary. It operates in the initial stage (however, since the determination result of the homeostasis maintenance function level determination unit 624 is used, several to ten minutes after the homeostasis maintenance function level determination unit 624 operates).
- the determination detection unit 62 preferably further includes a mood determination unit 626 and a history utilization biological state determination unit 627, which function by executing a mood determination procedure and a history utilization biological state determination procedure which are computer programs. .
- the mood determination means 626 obtains the appearance balance of the sympathetic nervous system and the parasympathetic nervous system from the index related to the autonomic nervous control obtained from the analysis calculation means 61 in the initial driving period after the start of driving until the predetermined time elapses. This is a means for determining the biological state of the driver at the initial driving stage based on the above criteria.
- the sleep onset symptom detecting means 621, the imminent sleeping phenomenon detecting means 622, the subjective sleepiness / low consciousness running state detecting means 623, and the homeostasis maintenance function level determining means 624 are analyzed by the arithmetic operation means 61 with a frequency gradient time series waveform and distribution rate.
- a frequency gradient time-series waveform, distribution rate, etc. APW original waveform data of a predetermined time or more is required, and it cannot be obtained until a few minutes have elapsed after boarding. Therefore, as shown in FIG.
- the mood determination means 626 processes the frequency fluctuation time series waveform, which is the calculation result of the frequency fluctuation calculation means 613 using the peak detection method of the analysis calculation means 61, by the least square method.
- the frequency gradient is obtained, and thereby the appearance balance of the sympathetic nerve function and the parasympathetic nerve function is determined. That is, when the slope obtained by the least square method is greater than or equal to a predetermined value (X1) in the positive direction, it is determined that the sympathetic nerve function is enhanced (eg, “feeling good”), and the predetermined value ( ⁇ X2) in the negative direction.
- the mood determination means 626 has a function of notifying the driver by outputting the “feeling good”, “feeling calm” or “feeling refreshed” to the monitor.
- the ability to respond to this driving environment varies from person to person or even if the person is the same, It depends on the sleep time of the previous day, etc., and the progress of subsequent fatigue also changes depending on the ability to respond.
- the driver is aware of his / her own state in the tension state in the early stage of driving, it can be expected to improve the degree of concentration in the subsequent driving.
- the mood determination means 625 determines the driver's biological state with a simple method at the start of driving, and therefore operates only in the initial period after the start of driving until a predetermined time has elapsed. Thereafter, a change in the biological state of the driver is sequentially detected by the above-described sleep onset symptom detection means 621, imminent sleep phenomenon detection means 622, subjective sleepiness / low sensation running state detection means 623, and homeostasis maintenance function level determination means 624. Is done.
- the history utilization biological state determination means 627 is a history as a determination result of the above-described sleep onset sign phenomenon detection means 621, imminent sleep phenomenon detection means 622, subjective sleepiness / low sensation running state detection means 623, and homeostasis maintenance function level determination means 624.
- the driver's biological state is determined using the information.
- These determination results are sequentially stored in a storage unit (either a storage unit of a vehicle-mounted computer or a storage unit of a remote management computer) of the operating biological state determination device 60 according to the present embodiment that includes a computer.
- the history use biological state determination means 627 is configured to sequentially read such information.
- the history use biological state determination means 627 has a six-level display of the homeostasis maintenance function level, of which levels 1 to 3 are determined to be normal to good and levels 4 to 6 are determined to require attention.
- history points A (attention points) are given in time series according to the duration of levels 4-6.
- the homeostasis maintenance function level is set so that one point is plotted every few seconds, it can be measured by counting the number of points at that level.
- a sleep onset sign phenomenon or an imminent sleep phenomenon is detected by the sleep onset sign phenomenon detecting means 622 or the imminent sleep phenomenon detecting means 623
- a history point B (saddle point) is given in time series.
- the subjective drowsiness / low consciousness driving state detection means 623 detects the subjective drowsiness / low consciousness driving state
- the history point C (warning point) is given in time series (see FIG. 17).
- a warning or homeostasis function when the above-described sleep onset symptom, imminent sleep phenomenon, subjective drowsiness or low driving state is detected
- a warning is output separately from the warning based on the level judgment result.
- the state in which the warning is output can be arbitrarily set. For example, as shown in FIG.
- the subjective sleepiness / low consciousness running state If the history point C based on the determination result of the detection unit 623 increases more than a predetermined value, and further, the history point B based on the determination result of the sleep onset sign phenomenon detection unit 621 and the imminent sleep phenomenon detection unit 622 increases more than a predetermined value, In general, a considerable amount of fatigue has occurred due to driving for a long time, and it is considered that a break is required immediately. Therefore, a setting is made so that a warning of strength is output.
- the driver's biological state is viewed from various aspects of changes in the biological state that occurs until he / she goes to sleep (such as a predictive sleep phenomenon, imminent sleep phenomenon, conscious sleepiness, low consciousness). Driving state).
- the information is acquired as history information and this history information is used to obtain the driver's information.
- the biological state is determined. Therefore, the biological state of the driver can be captured with higher accuracy than before, which is suitable for determination of the biological state during driving.
- the determination result can be transmitted to the operation manager's computer via an appropriate communication network. It is. In that case, even if the operation manager is in a remote place, the driver's biological state can be grasped, which is useful for more appropriate operation management.
- the determination result of the driver can be further analyzed. For example, by accumulating the above-mentioned determination results every day, it is possible to determine under what conditions the driver will be aware of drowsiness, low driving state, sleep onset symptom, imminent sleep phenomenon, etc. It can also be used to make the driver aware or to manage the physical condition of the driver.
- Example 1 Detection of conscious sleepiness during driving by means of conscious sleepiness / low consciousness running state detection means 623 (second consciousness sleepiness / low consciousness running state detection means 623b)
- a biological evaluation static experiment
- a biological evaluation dynamic experiment
- the static experiment was 60 minutes
- the measurement index was subjective evaluation of APW and subjective sleepiness.
- APW was continuously measured during the experiment, and subjective evaluation was performed before the start of the experiment and every 5 minutes after the start of the experiment.
- the visual analog scale was used for the subjective evaluation. Also, subjects were instructed not to sleep during the experiment.
- the subjects were 8 healthy men in their 20s and 30s who agreed to explain the previous experiment and understand the experiment sufficiently.
- evaluation was performed on 89 examples of data with a measurement time of 30 minutes or more. Evaluation of subjective drowsiness was determined by pressing the monitor of the measuring device at the time when it occurred.
- the measuring device was installed within the reach of the driver based on the visibility standard of passengers such as passenger cars established by the Ministry of Land, Infrastructure, Transport and Tourism.
- the APW analysis was performed by frequency-analyzing the frequency gradient time series waveform by the second subjective drowsiness / low consciousness running state detection means 623b and calculating the distribution ratio of the three frequency components described above. The peak points of the distribution rate were detected using 12 points of smoothed differentiation.
- FIG. 18A shows the result of the time series waveform of the APW distribution rate measured in the static experiment. Seven of the eight subjects had excellent fatigue acceptance signals (0.0035 Hz) near the occurrence of drowsiness, all of which function adjustment signals (0.0017 Hz), fatigue acceptance signals (0.0035 Hz), and activity The appearance of the peak value of the distribution rate of the adjustment signal (0.0053 Hz) did not satisfy the following relationship: activity adjustment signal ⁇ function adjustment signal ⁇ fatigue acceptance signal (see FIGS. 13 and 14).
- FIG.18 (b) shows the result of the time series waveform of the distribution rate of APW measured by the dynamic experiment.
- the appearance of the peak values of the distribution ratio of the function adjustment signal (0.0017 Hz), the fatigue acceptance signal (0.0035 Hz) and the activity adjustment signal (0.0053 Hz) is as follows: activity adjustment Signal ⁇ function adjustment signal ⁇ fatigue acceptance signal is satisfied (see FIGS. 13 and 14).
- the detection of subjective sleepiness during driving is related to the peak superiority of the distribution ratio of the APW ultra-low frequency component and the appearance order thereof.
- the order of appearance is not the same as that in the dynamic experiment, and thus the response of the living body is different between the static state and the dynamic state. This is thought to be because the driving situation is in an environment different from the static state, such as the necessity of intensely resisting sleepiness, a lot of external stimuli, and an environment where it is easy to concentrate. It can be seen that the method is suitable for determination of the biological state during driving.
- the amplitude value of the frequency gradient time-series waveform in 89 examples of the dynamic experiment described above falls within a predetermined set range as shown in FIG. And the case where the cycle is shortened to a predetermined set range was further detected.
- Many of these are data (data that may be in a low-level driving state) in which comments such as “I was fooling around” or “I was consciously in the distance” remain as comments of each subject after running. is there.
- FIG. 19 (b) shows the result of chi-square test in which the detection result of the subjective sleepiness or low driving state by the frequency gradient time series waveform and the detection result of the subjective sleepiness by the above distribution rate are evaluated together.
- the number of undetected drowsiness or low sensation driving states was 4 (see FIG. 15C). From this, in addition to grasping the appearance order of the predetermined frequency components in the APW distribution rate, capturing the low amplitude and the short period of the frequency gradient time-series waveform is the detection of conscious sleepiness or low consciousness running state It turns out that it is effective.
- Example 2 (Detection of sleep onset symptom by sleep onset symptom detecting means 621 using frequency gradient time series waveform)
- Example 2 (Detection of sleep onset symptom by sleep onset symptom detecting means 621 using frequency gradient time series waveform)
- the experiment was conducted for both the analysis of the finger plethysmogram collected using an optical finger plethysmograph and the analysis of the APW in the present invention.
- a camera for inspecting the subject was also used.
- FIG. 20A shows a power value gradient time series waveform of the fingertip pulse wave of one subject.
- 40 minutes to 45 minutes indicate the time period when sleepiness increased most based on sensory evaluation.
- the amplitude increases (increases from a to b) before the time period when sleepiness increases, and the period becomes longer (f becomes longer), suggesting that the broken line portion is a sign of sleep onset.
- FIG. 20B shows the APW frequency gradient time series waveform.
- the broken line area in the figure tends to diverge before sleepiness increases, and the broken line part in FIG. Since the power pulse gradient time series waveform of the fingertip pulse wave and the frequency gradient time series waveform of the APW are related to sympathetic nerve activity, the sympathetic nerve activity is increased while the amplitude of the waveform is diverging. it is conceivable that. This increase in sympathetic nerve activity is thought to occur as resistance to sleepiness.
- FIGS. 21 (a) and 21 (b) show the results of frequency analysis for 25 minutes before and 25 minutes after reaching the sleepiness peak in FIGS. 20 (a) and 20 (b), respectively.
- FIG. 21A shows the frequency analysis result of the time series waveform of the fingertip pulse wave power value gradient, and shows a comparison before and after drowsiness reaches its peak. After drowsiness peaked, the spectrum tended to decline.
- FIG. 21B is a frequency analysis of the APW frequency gradient time series waveform, and shows a comparison before and after the sleepiness reaches a peak. Similar to the fingertip plethysmogram, the spectrum amplitude tended to decrease. Moreover, since the peak occurs in the vicinity of 0.0033 Hz in the frequency analysis before the sleepiness peak including the divergent waveform, it is considered that the divergent waveform includes a component in the vicinity of 0.0033 Hz. It is suggested.
- FIG. 22 shows a 2 ⁇ 2 cross table regarding fingertip volume pulse waves of 10 subjects and awakening and sleep onset signs in APW.
- the P value was 0.05 or less, which was statistically significant, suggesting that there is a relationship between the fingertip volume pulse wave and APW. From these facts, it is considered that the divergence tendency in the APW frequency gradient time-series waveform indicates the sleep onset sign phenomenon.
- FIG. 23 is an example of data showing the correlation between the frequency gradient time series waveform of the APW and the presence or absence of sleepiness collected during actual vehicle travel. Since the divergence tendency of FIG. 23 shows the same tendency as the recording performed in the above-described static state, the sleep symptom phenomenon is detected by detecting the divergence phenomenon of the APW frequency gradient time series waveform even while the vehicle is running. Can be identified.
- the experiment was conducted in two postures, sitting and lying, from the state of being resistant to sleepiness to accepting sleepiness and going to sleep equivalent to a nap.
- the test subjects were 56 healthy men (31.3 ⁇ 8.2 years old) in their 20s to 50s.
- An electroencephalogram, an electrocardiogram, and a fingertip plethysmogram were used as comparative indices, and these were compared with APW, which is a measurement index in the present invention.
- the subjects were obliged to maintain arousal for 30 minutes from the start of the experiment, after which they were released and left to their own free will.
- FIG. 24 shows the results of a sleep experiment of a 24-year-old male subject. The subject said, “I was awake for the first 10 minutes, but then barely awake while resisting sleepiness. After 30 minutes away from the obligation to maintain awakeness, I resisted sleepiness. I stopped, I moved to sleep at an early stage. "
- FIG. 24A shows the distribution rate of the ⁇ wave, ⁇ wave, and ⁇ wave of the electroencephalogram.
- the sleep point was defined as 40 minutes when the ⁇ wave increased, the ⁇ wave decreased, and both waves started to change stably.
- FIG. 24B shows the activity levels of the sympathetic nerve (LF / HF) and the parasympathetic nerve (HF) obtained by wavelet analysis of the fingertip volume pulse wave. HF remains stable and high after 40 minutes, LF / HF stably shows a low value, and the sleep point is considered to be around 40 minutes after the start of the experiment.
- FIG. 24C shows a power time gradient time series waveform and a maximum Lyapunov exponent gradient time series waveform obtained by performing a gradient time series analysis on the fingertip plethysmogram. Up to 30 minutes, a low frequency, large amplitude sleep symptom is shown, and after 30 minutes, it tends to converge with a low amplitude and a long period, and here it is considered that the sleep state is shifted to around 40 minutes.
- FIG. 24D shows a frequency gradient time series waveform and a frequency fluctuation time series waveform by the APW zero cross detection method. From the frequency variation time-series waveform, it can be seen that the APW frequency changes greatly from 1.15 Hz to 1 Hz in 30 minutes to 10 minutes.
- the experiment was awake for 30 minutes, and shifted to the sleep state about 30 to 35 minutes after the start of the experiment.
- the frequency gradient time-series waveform after 30 minutes, as with the gradient time-series waveform of the power value of the fingertip plethysmogram, the frequency tends to converge with a low amplitude and a long period. Therefore, it can be seen that the imminent sleep phenomenon immediately before the sleep point can be detected by detecting the timing of the convergence tendency of the frequency gradient time series waveform.
- FIGS. 25A and 25B show frequency analysis results in the sleepiness resistance state
- FIGS. 26A and 26B show frequency analysis results in the sleep state.
- the frequency analysis results of the fingertip plethysmogram and APW slope time series waveforms show the same tendency in both the sleepiness resistance state and the sleep state.
- the slope of the sleep state spectrum is close to 1 / f, which is considered to be a relaxed state predominantly parasympathetic.
- the slope of the sleepiness resistance state spectrum is close to 1 / f 2 , indicating an angle different from the slope of the sleep state spectrum. This is thought to be due to increased sympathetic nerve activity by resisting sleepiness.
- the state of 56 subjects was determined using the slopes of the fingertip volume pulse wave and the APW slope time-series waveform spectrum.
- the determination of the state based on the fingertip volume pulse wave and the APW spectrum inclination was performed using the spectrum inclination angle ⁇ shown in FIGS.
- the inclination of the spectrum taking into account the tendency when mechanically processed, was set at 54 degrees obtained by correcting +9 degrees to 45 degrees, which is an inclination angle of 1 / f. That is, less than 54 degrees was a sleep state, and 54 degrees or more was a sleepiness resistance state.
- the pass / fail of the judgment result was determined by comparing with the electroencephalogram, the activity level of the autonomic nervous system, and the comment of the subject.
- the state determination result using the slope of the APW spectrum showed a high accuracy rate with 82% sleepiness resistance and 79% sleep.
- the state determination result using the slope of the fingertip volume pulse wave spectrum was 74% in the sleepiness resistance state and 62% in the sleep state, which was a slightly lower correct answer rate than the determination result by APW.
- the finger plethysmogram which captures the dynamics of the peripheral circulatory system, is easily affected by external stimuli, but APW captures the dynamics of the central system and is therefore less susceptible to external stimuli. That is, since APW can stably capture fluctuations in the cardiovascular system, the correct answer rate is considered to be higher than that of fingertip volume pulse waves.
- Example 4 (Demonstration experiment during long distance driving)
- the biological signal measuring device 1 of the above embodiment was mounted on the backrest of a truck, and a demonstration experiment during long distance running by a truck driver was performed. After the operation, we conducted a questionnaire about his physical condition at the time of operation.
- the test subjects were professional drivers (9 men) in their 20s to 50s who were engaged in the transportation business, and the total number of trips by all subjects was 91 times.
- FIG. 27 shows the determination result of the male subject in the 30s
- FIG. 28 shows the determination result of the male subject B in the 40s.
- (A) of each figure shows the homeostasis maintenance function level which is the judgment result of the homeostasis maintenance function level judgment means 624, and (b) to (d) are judgment results of the history utilization biological state judgment means 627.
- (B) is a history point B (saddle point) in which a sleep onset sign phenomenon or imminent sleep phenomenon is detected by a sleep onset sign phenomenon detecting means 622 and an imminent sleep phenomenon detecting means 623; Shows the history of the history point C (warning point) in which the subjective drowsiness and the low driving state are detected.
- (C) shows the number of times when the homeostasis maintenance function level is continuously determined as a state requiring attention by the homeostasis maintenance function level determination means 624 as a history point A (attention point) according to time. is there.
- (D) shows the number of caution points, warning points, and saddle points as a vertical axis with the vertical axis as a bar graph, and the change tendency thereof as a curve.
- FIG. 29 is obtained from the APW time-series waveform of male subject C in his thirties, and the physical condition during operation is shown in the physical condition map by the quantification method proposed by the present applicant as Japanese Patent Application No. 2011-108909. And a sensory response map.
- This is a frequency analysis of the collected APW, and for the analysis section to be analyzed, the analysis waveform is shown in a logarithmic axis display, and the analysis waveform is divided into a low frequency band, a middle frequency band, and a high frequency band, and the divided analysis waveforms are divided.
- the analysis waveform is scored based on a certain standard from the slope and the shape of the entire analysis waveform, and plotted on the coordinate axes.
- the physical condition map is a state in which the state of control of the autonomic nervous system is viewed as a balance between the sympathetic nerve and the parasympathetic nerve, and the sensory response map is obtained by superimposing the state of change in heart rate variability on the physical condition map.
- 13 trains are grouped by week and by physical condition (based on questionnaire responses). The lower part shows the questionnaire results regarding the physical condition after the operation, and the subject feels that the physical condition in the first half of the implementation period is in a worsening trend and the second half is in a recovery trend.
- the physical condition map for the first week is from the distribution (sa) of the right shoulders centering on the heartbeat (concentration, uplifting, irritated), and hetohet (dull, melancholy). It has changed to a distribution with a downward slope centered on When this is classified by physical condition, the “good” and “ordinary” answer groups have a downward slope and the distribution is widening towards relaxation and relaxation (Su, Se). This suggests that both the mind and body are in a relaxed tendency and that driving is easy.
- Example 5 (Detection of wakefulness and sleep using frequency fluctuation time series waveform) Verification of whether the wakefulness state and the sleep state can be determined by comparing the degree of divergence between the frequency fluctuation time series waveform obtained by the frequency fluctuation calculation means 613 and the frequency fluctuation time series waveform obtained by the zero cross detection method. The experiment was conducted.
- a sleep introduction experiment was performed in the supine position.
- the test subjects were 11 healthy men in their 20s and 30s. Simultaneously with APW, finger plethysmogram, electroencephalogram, and gluteal muscle electromyogram were measured.
- the biological signal measuring device 1 for measuring APW was placed between the back of the subject and the bed. The measurement time was 60 minutes, and the subject was instructed not to sleep for 30 minutes from the start of measurement, and the degree of sleepiness was evaluated every 5 minutes. The sleep after 30 minutes was determined as the subject's free will.
- FIG. 30A shows the frequency spectrum of the fingertip volume pulse wave for 6 minutes each in the awake state and the sleep state. It can be seen that the dominant frequency is lower in the sleep state than in the awake state. Similar results were obtained with 11 of 11 subjects.
- FIG. 30 (b) shows the APW frequency spectrum for 6 minutes each for the awake state and the sleep state. It can be seen that the dominant frequency is lower in the sleep state than in the awake state. Similar results were obtained with 11 of 11 subjects. From the above, it can be seen that the dominant frequencies of the fingertip volume pulse wave and the frequency spectrum of the APW match each other.
- FIG. 30 (c) shows the time series waveform of the frequency fluctuation at the APW peak point and zero cross point.
- the difference in the area of the waveform at the peak point and the zero-cross point was calculated for 6 minutes in each of the awake state and the sleep state, and the difference between the waveforms was evaluated. It can be seen that the degree of divergence decreases in the sleep state compared to the awake state. Similar results were obtained with 10 of 11 subjects.
- the APW can capture heart rate variability as well as the fingertip volume pulse wave. Also, the dominant frequency of both frequency spectra and the frequency fluctuation of APW are lower in the sleep state than in the awake state, which is consistent with the decrease in heart rate in the sleep state. This shows that the volume pulse wave and the APW were correctly measured.
- the degree of divergence between the frequency fluctuation time-series waveforms at the peak point and the zero cross point decreased in the sleep state compared to the awake state. If the frequency fluctuation at the zero cross point captures the sympathetic nerve activity, it is considered that the frequency is lowered due to the influence of the decrease in the sympathetic nerve activity in the sleep state. If the frequency fluctuation at the peak point captures sympathetic nerve activity and parasympathetic nerve activity, the frequency is significantly lower than the zero-cross point due to the influence of decreased sympathetic nerve activity and increased parasympathetic nerve activity in the sleep state. It is done. As a result, it is considered that the divergence degree of the time series waveform of the frequency fluctuation between the peak point and the zero cross point has decreased.
- the wakefulness and sleep state can be set. Can be estimated. Therefore, by using this, it is possible to automatically determine whether it is an awake state or a sleep state, as described above, by acquiring a plurality of data on the degree of divergence between the awake state and the sleep state and setting a threshold value therefrom. . It is normal not to fall asleep while driving, but it can be used for detection in the event of an emergency, and the administrator will understand and analyze when and how much the driver took a nap after driving Can be used for
- the APW frequency spectrum When comparing the fingertip volume pulse wave and the frequency spectrum of APW, the APW frequency spectrum also had a spectrum peak near 0.6 Hz, indicating a higher spectrum in the awake state than in the sleep state. Thus, the APW contains information that is not present in the fingertip volume pulse wave, suggesting that it is more effective for estimating the arousal state and the sleep state than the fingertip volume pulse wave. From the above, it is considered that the degree of divergence between the APW peak point and the zero-cross point is related to the spectrum near 0.6 Hz.
- FIG. 31 shows whether the divergence between the APW peak point and the zero cross point shown in FIG.
- FIG. 32 is a diagram showing the results of a sleep experiment of a healthy male subject in his 20s.
- the experimental method of the sleep experiment is the same as in Experimental Example 5.
- FIG. 32A shows the sleep stage obtained from the electroencephalograph data shown in FIG. 32A
- FIG. 32B shows the distribution ratio of ⁇ wave, ⁇ wave, and ⁇ wave obtained from the electroencephalograph data.
- 32 (e) to 32 (h) are APW analysis results, and it can be determined that all have fallen asleep in about 40 minutes from the sleep onset symptom to the imminent sleep phenomenon.
- the tendency of the waveform to diverge is seen around 5 to 20 minutes and around 25 to 32 minutes, which indicates the sleep onset symptom phenomenon, and around 35 to 40 minutes, It can be seen that the amplitude of the waveform decreases and converges, and then the period becomes longer, and an imminent sleep phenomenon occurs. Therefore, the patient has fallen asleep after 40 minutes.
- FIG. 34A shows the original waveform of APW from 378 seconds to 30 seconds.
- 14 seconds of 378 to 392 seconds (indicated as “0 to 14 seconds” in the figure) including 6 seconds (indicated as “4 to 10 seconds” in the figure) of 382 to 388 seconds with large waveform disturbance, amplitude, and 14 seconds of 396.1 to 406.1 seconds (in the figure, “14” including 6 seconds of 396.1 to 402.1 seconds (indicated as “18.1 to 24.1 sec” in the figure)) that are stable in both periods. .1 to 28.1 sec ”) were compared by performing frequency analysis.
- (B) is a diagram in which the original waveforms of two calculation sections for frequency analysis of 14 seconds each of “0 to 14 seconds” and “14.1 to 28.1 seconds” are superimposed, of which “4 to 10 seconds” It can be seen that there is a large phase shift (difference between the two (time phase difference)) between 6 seconds of 1 and 6 seconds of “18.1 to 24.1 seconds”. Therefore, such a phase shift indicates an increase in sympathetic nerve activity.
- (C) is a diagram in which only a real number is obtained by performing Fourier transform in two frequency analysis calculation sections for 14 seconds, excluding the vicinity of 1 Hz, near 0.4 to 0.6 Hz, and 1.2 to 2 Hz. It can be seen that there is a difference in the vicinity. That is, when the increase in sympathetic nerve activity occurs, the peak is relatively small near 1 Hz, but the peak is relatively large near 0.4 to 0.6 Hz and 1.2 to 2 Hz.
- the frequency analysis of the waveform of “4 to 10 sec” was compared with the frequency analysis after filtering 0.9 to 1.1 Hz in the vicinity of 1 Hz corresponding to the frequency of the fingertip plethysmogram.
- (D) is a comparison result in the time series
- (e) is a frequency analysis result. From (d), there is a rising waveform around 3.4 seconds and 4.2 seconds after filtering, and in (e), there are peaks around 0.4 to 0.6 Hz and around 1.2 to 2 Hz, It can be seen that an increase in sympathetic nerve activity can be detected by capturing the peak of these frequency components in the APW, and conscious sleepiness (corresponding to a low sensation running state) can be detected from that timing.
- FIG. 35 shows (a) the original waveform of the fingertip volume pulse wave, (b) the second-order differential waveform of the fingertip volume pulse wave, (c) the original waveform of APW, (d) the second-order differential waveform of APW, and (e) the heart sound.
- a frequency gradient time series waveform By capturing a large waveform with a long period of time called a frequency gradient time series waveform, it functions as a filter for negative feedback that is not very effective, even if negative feedback is applied, which has a very slight effect on changes in physical condition.
- the activity of the autonomic nervous system changes one by one according to the stress, but the response of the living body to the stress does not change according to the instantaneous change of the autonomic nervous activity. Changes in the state of the living body with respect to stress are caused by accumulation of changes in autonomic nerve activity. Therefore, it is impossible to accurately predict a change in the state of the living body even if the instantaneous change in the autonomic nerve activity is tracked step by step.
- By grasping changes in autonomic nervous activity globally it is possible to accurately grasp the tendency of the living body to respond to stress.
- it is suitable to use a frequency gradient time-series waveform.
- the present invention is not limited to the case where a biological signal measuring device is arranged in a driver's seat of an automobile to determine a driver's biological state, and a biological signal is displayed in the driver's seat or cockpit of various transport devices such as trains, airplanes, and ships.
- a measuring device can be arranged and applied.
Abstract
運転者の生体状態をより正確に把握する技術を提供する。 本発明は、入眠予兆現象検出手段621、切迫睡眠現象検出手段622、自覚眠気・覚低走行状態検出手段623、恒常性維持機能レベル判定手段624を有し、これらが並列的に機能する構成である。従って、入眠予兆現象、切迫睡眠現象の検出、あるいは、自覚下で生じる軽い眠気(軽度眠気)や強い眠気への抵抗期、さらには、意識レベルの低下による覚低走行状態が瞬間的に生じた場合やより長く連続的に生じた場合等の検出をそれぞれの手段で判定・検出することができ、運転者の生体状態の判定を従来よりも正確に行うことができる。
Description
本発明は、自動車、列車、航空機、船舶等の各種輸送機器の運転ないしは操縦(本明細書では、これらを総称して「運転」という)を行う者(運転者)の背部から得られる生体信号の時系列波形を用いて、運転者がどのような生体状態であるかを判定する技術に関する。
運転中の運転者の生体状態を監視することは、近年、事故予防策等として注目されている。本出願人は、これまでにかかる技術を種々提案している。特許文献1では、人の上体から採取した主に心循環系の波動である生体信号の時系列波形から周波数の時系列波形を求め、さらに、周波数傾きの時系列波形、周波数変動の時系列波形を求めてこれらを周波数解析する手順を有する装置を開示している。周波数解析の際には、予め定めたULF帯域(極低周波帯域)からVLF帯域(超低周波帯域)に属する機能調整信号、疲労受容信号及び活動調整信号に相当する各周波数のパワースペクトルを求める。そして、各パワースペクトルの時系列変化から人の状態を判定する。疲労受容信号は、通常の活動状態における疲労の進行度合いを示すため、これに併せて、機能調整信号や活動調整信号のパワースペクトルの優性度合いを比較することにより、人の状態(リラックス状態、疲労状態、交感神経優位の状態、副交感神経優位の状態など)を判定することができるというものである。
特許文献2は、特許文献1と同様にULF帯域(極低周波帯域)からVLF帯域(超低周波帯域)に属する機能調整信号、疲労受容信号及び活動調整信号を用いるが、特許文献2ではこの3つの信号に相当する周波数成分のパワースペクトルの値の合計を100とした際の各周波成分の分布率を時系列に求め、その分布率の時系列変化を利用して人の状態を判定する手法である。
特許文献1又は2の技術はいずれも次のような知見に基づいたものである。すなわち、人の恒常性はゆらぎで維持され、その周波数帯域はULF帯域とVLF帯域にあるとされている。一方、心疾患の一つである心房細動において、心・循環系のゆらぎの特性が切り替わるところは、0.0033Hzと言われており、0.0033Hz近傍のゆらぎの変化を捉えることで、恒常性維持に関する情報が得られる。また、0.0033Hz近傍以下と0.0053Hz近傍の周波数帯は、主に体温調節に関連するもので、0.01~0.04Hzの周波数帯は自律神経の制御に関連するものと言われている。そして、実際に、生体信号に内在するこれら低周波のゆらぎを算出する周波数傾き時系列波形を求め、それを周波数解析したところ、0.0033Hzよりも低周波の0.0017Hz、0.0033Hz近傍の0.0035Hzを中心とする周波数帯のゆらぎと、さらにこれらこの2つ以外に、0.0053Hzを中心とする周波数帯のゆらぎがあることが確認できた。
0.0035Hzの信号(疲労受容信号)は、外部より入力されるストレスに適応して恒常性を維持するためのゆらぎで、これを通常の活動状態における疲労の進行度合いを示す信号であり、0.0053Hzの信号(活動調整信号)は、活動時における内分泌系ホルモンの制御による影響の度合いが出現する信号であり、0.0033Hzよりも低周波の0.0017Hzの信号(機能調整信号)は、体の変調や機能低下を制御する信号としてあり、これら3つの周波数帯の信号が、相互に関わり合って体温調節機能として作用している。そこで、これらの信号のパワースペクトルの時系列変化、分布率を用いて人の状態を判定している。
特許文献1及び2に記載のものは、軽い眠気(軽度眠気)、入眠予兆現象、瞬眠、切迫睡眠など眠気に関連する現象を広く捉えることができるとしており、なかでも入眠予兆現象を捉えることができることを強調している。ULF帯域とVLF帯域に属する上記の3つの周波数成分を用いて人の状態を判定することは非常に有効であるが、判定精度のさらなる向上は常に望まれている。例えば、居眠りの予防を目的とした警告システムに適用した場合、入眠予兆現象や切迫睡眠現象などは運転者自らがそのことを認知することなく生じることが多いが、例えば、運転者が当初より過労状態であるとすると、過労状態に抵抗するため、交感神経機能の亢進や、様々なホルモン(内分泌系)の制御が強く作用して緊張状態になり、運転者が眠気を認知(意識)していない状態がその多くを占め、換言すれば、眠気に伴う体内の変化が生じていてもそれが緊張状態によって相殺され、眠気を知覚できない状態の中で、運転当初から警告が発せられることになるため、運転者はそれを誤判定と解釈してしまう場合がある。逆に、運転者が認知(自覚)可能な眠気については、さざ波のように寄せては返す眠気の全てを警告すると警告自体がうるさがられ、疎まれる場合もある。このように、運転時の生体判定は、その判定結果を用いて何らかの警告を行うことに用いられるため、運転者を覚醒状態等に誘導しなければならないタイミングのときにできるだけ確実に所定の警告を発することが求められ、不必要な警告はできるだけ少ないことが望ましい。
本発明は上記に鑑みなされたものであり、運転時の運転者の生体状態の判定をより高い精度で行うことができ、できるだけ確実に必要とされるタイミングで警告を促すようにすることができる運転時生体状態判定装置及びコンピュータプログラムを提供することを課題とする。
上記課題を解決するため本発明者は、体温の制御の状態を血流の変化で捉える指尖容積脈波の周波数傾き時系列波形に、運転者の背部から採取される生体信号、すなわち心部揺動波(Aortic Pulse Wave(APW))の周波数傾き時系列波形が高い相関性があり、APWの時系列波形の周波数に関する特性(振幅、周期)から体温制御の状態を捉えることができこと、また、APWの周波数傾き時系列波形を絶対値処理することにより自律神経機能のバランスを捉え、さらに分布率によって得られるゆらぎの変化特性からその制御の動向を捉えることができること等に着目した。そこで、これらの分析演算手段の分析演算結果を用い、各種体調変化に合わせてそれぞれについて判定基準を設定することで、主に無自覚下で生じる入眠予兆現象や切迫睡眠現象、自覚下で生じる軽い眠気や睡眠への強い抵抗を伴う強い眠気、あるいは、意識レベルの著しい低下により、眠気を自覚せず開眼しているにも拘わらず情報の読み取りや判断が不能となった状態で走行をする覚低走行状態等を並列的に判定し、それにより、運転者の生体状態を多面的に捉え、生体状態の判定をより高精度に行うことができると考え、本発明を完成するに至った。
すなわち、本発明の運転時生体状態判定装置は、運転席に設けられる生体信号測定装置により運転者の背部から採取した生体信号を用い、運転者の運転環境下における生体状態を判定する運転時生体状態判定装置であって、前記生体信号の時系列波形を用いて所定の演算を行う分析演算手段と、前記分析演算手段の演算結果を用いて前記生体状態を判定又は検出する判定検出手段とを有し、前記判定検出手段が、入眠前の体調変化現象である入眠予兆現象を検出する入眠予兆現象検出手段と、前記入眠予兆現象の出現後に生じる入眠前の体調変化現象である切迫睡眠現象を検出する切迫睡眠現象検出手段と、自覚的な眠気を伴う自覚眠気又は意識レベルの低下による覚低走行状態を検出する自覚眠気・覚低走行状態検出手段と、恒常性維持機能の適応能力のレベルを判定する恒常性維持機能レベル判定手段とを備え、前記入眠予兆現象検出手段、前記切迫睡眠現象検出手段、前記自覚眠気・覚低走行状態検出手段及び前記恒常性維持機能レベル判定手段が並列的に機能する構成であることを特徴とする。
前記分析演算手段は、前記生体信号の時系列波形から、周波数の時系列波形を求める周波数演算手段と、前記周波数演算手段により得られる前記周波数の時系列波形を用いて所定の時間窓毎に前記周波数の傾きを求める移動計算を行い、時間窓毎に得られる前記周波数の傾きの時系列変化を周波数傾き時系列波形として出力する周波数傾き演算手段と、前記周波数演算手段により得られる前記周波数の時系列波形を用いて所定の時間窓毎に前記周波数の平均値を求める移動計算を行い、時間窓毎に得られる前記周波数の平均値の時系列変化を周波数変動時系列波形として出力する周波数変動演算手段と、前記周波数傾き演算手段により得られる周波数傾き時系列波形から、予め定めた機能調整信号、疲労受容信号及び活動調整信号に相当する周波数成分を抜き出し、これらの周波数成分のそれぞれの変動を求める手段とを有する構成とすることが好ましい。
前記機能調整信号、疲労受容信号及び活動調整信号に相当する周波数成分の変動を求める手段は、前記機能調整信号、疲労受容信号及び活動調整信号に相当する、ULF帯域からVLF帯域に属する0.01Hz未満の周波数成分を抜き出した後、この3つの周波数成分のパワースペクトルの値の合計を100とした際の前記各周波成分の分布率を時系列に求める分布率演算手段と、前記分布率演算手段により得られた時系列の分布率に平滑化微分を適用し、時間軸上の任意の時点間における前記3つの周波数成分のうちの少なくとも一つの周波数成分について分布率の変化度を求める変化度演算手段とを有する構成とすることが好ましい。
前記入眠予兆現象検出手段は、前記周波数傾き演算手段により得られる周波数傾き時系列波形において、所定の基準に対して振幅の発散傾向が検出される場合に入眠予兆現象と判定する手段を備えていることが好ましい。前記切迫睡眠現象検出手段は、前記周波数傾き演算手段により得られる周波数傾き時系列波形において、所定の基準に対して振幅の収束傾向が検出され、かつ周期が長周期化する場合に切迫睡眠現象と判定する手段を備えていることが好ましい。前記自覚眠気・覚低走行状態検出手段は、前記分布率演算手段により得られる前記3つの周波数成分のうち、前記機能調整信号に相当する周波数成分の分布率が前記活動調整信号に相当する周波数成分の分布率以上となることを条件として軽い眠気又は瞬間的な覚低走行状態を検出する手段を備えていることが好ましい。前記自覚眠気・覚低走行状態検出手段は、前記変化度演算手段により得られる前記3つの周波数成分のうち、前記機能調整信号に相当する周波数成分の変化度が、前記活動調整信号に相当する周波数成分の変化度と共に、絶対値でそれぞれ所定値以上となる条件下で軽い眠気又は瞬間的な覚低走行状態を検出する手段を備えていることが好ましい。
前記自覚眠気・覚低走行状態検出手段は、前記運転者の基本状態がリラックス状態か緊張状態であるかを判定し、判定される基本状態がリラックス状態か緊張状態であるかによって、前記軽い眠気又は瞬間的な覚低走行状態に相当するか否かの判定基準を選択する手段を有することが好ましい。前記自覚眠気・覚低走行状態検出手段は、さらに、前記分布率演算手段により得られる前記3つの周波数成分の分布率の時系列波形の各ピーク値が、所定の出現時間の差の範囲内で所定の順番で出現し、かつ、所定の分布率条件を満たす値である場合に、強い眠気又は連続的な覚低走行状態を検出する手段を備えていることが好ましい。
前記自覚眠気・覚低走行状態検出手段における前記運転不適格期と判定する手段は、前記分布率演算手段により得られる前記3つの周波数成分の所定の分布率条件を満たすピーク値の出現時刻が、次の関係:活動調整信号≦機能調整信号≦疲労受容信号(但し、活動調整信号と疲労受容信号の前記ピーク値の出現時刻の差が所定時間内)を満たす場合に、強い眠気又は連続的な覚低走行状態であると判定することが好ましい。前記自覚眠気・覚低走行状態検出手段は、前記周波数傾き演算手段により得られる周波数傾き時系列波形において、所定の基準に対して振幅の収束傾向が検出される場合に、自覚眠気又は覚低走行状態であると判定する手段を備えていることが好ましい。
前記判定検出手段は、運転開始時における初期疲労の有無を判定する初期疲労判定手段をさらに有し、前記初期疲労判定手段は、前記恒常性維持機能レベル判定手段において、同一の恒常性維持機能レベルが所定時間以上継続している場合に、初期疲労を有していると判定することが好ましい。前記判定検出手段は、運転開始後所定時間経過までの運転初期の生体状態を判定する気分判定手段をさらに有することが好ましい。前記入眠予兆現象検出手段、前記切迫睡眠現象検出手段、前記自覚眠気・覚低走行状態検出手段及び前記恒常性維持機能レベル判定手段により得られた判定結果の履歴情報を用いて運転者の生体状態を判定する履歴利用生体状態判定手段をさらに有することが好ましい。
前記周波数演算手段が、前記生体信号測定装置により得られる生体信号の時系列波形において、正から負に切り替わるゼロクロス地点を求め、このゼロクロス地点を用いて生体信号の周波数の時系列波形を求める手段であることが好ましい。前記周波数演算手段が、前記生体信号測定装置により得られる生体信号の時系列波形を平滑化微分して極大値を求め、この極大値を用いて生体信号の周波数の時系列波形を求める手段であることが好ましい。前記分布率演算手段に用いる前記機能調整信号の周波数が0.0027Hz以下であり、前記疲労受容信号の周波数が0.002~0.0052Hzの範囲であり、前記活動調整信号の周波数が0.004~0.007Hzであることが好ましい。
また、本発明のコンピュータプログラムは、運転席に設けられる生体信号測定装置により運転者の背部から採取した生体信号を用い、運転者の運転環境下における生体状態を判定する運転時生体状態判定装置としてのコンピュータに、前記生体信号の時系列波形を用いて所定の演算を行う分析演算手順と、前記分析演算手段の演算結果を用いて前記生体状態を判定又は検出する判定検出手順とを実行させると共に、前記判定検出手順として、入眠前の体調変化現象である入眠予兆現象を検出する入眠予兆現象検出手順と、前記入眠予兆現象の出現後に生じる入眠前の体調変化現象である切迫睡眠現象を検出する切迫睡眠現象検出手順と、自覚的な眠気を伴う自覚眠気又は意識レベルの低下による覚低走行状態を検出する自覚眠気・覚低走行状態検出手順と、恒常性維持機能の適応能力のレベルを判定する恒常性維持機能レベル判定手順とを実行させ、かつ、前記入眠予兆現象検出手順、前記切迫睡眠現象検出手順、前記自覚眠気・覚低走行状態検出手順及び前記恒常性維持機能レベル判定手順を並列的に実行させることを特徴とする。
本発明は、判定検出手段として、入眠予兆現象検出手段、切迫睡眠現象検出手段、自覚眠気・覚低走行状態検出手段、恒常性維持機能レベル判定手段を有し、これらが並列的に機能する構成である。従って、入眠予兆現象、切迫睡眠現象の検出、あるいは、自覚下で生じる軽い眠気(軽度眠気)や強い眠気への抵抗期、さらには、意識レベルの低下による覚低走行状態が瞬間的に生じた場合やより長く連続的に生じた場合等の検出をそれぞれの手段で判定・検出することができ、運転者の生体状態の判定を従来よりも正確に行うことができる。また、恒常性維持機能レベル判定手段により、その適応能力レベルの変化を判定すると共に、初期疲労判定手段を設けた構成とすることにより、運転初期において、他の環境から運転環境という新たな環境に移行したときの運転初期における初期疲労状態の有無を判定できる。この運転初期における生体状態は、サーカディアンリズム等によって数時間後の状態に影響するため、運転初期において、運転者に数時間後の休憩を促す注意等を与えることができる。
このように、本発明によれば、運転者の生体状態を多面的に把握できるため、適切な運転及び適切なタイミングでの休憩を促しやすく、運転時の生体状態を把握する装置として好適である。
以下、図面に示した本発明の実施形態に基づき、本発明をさらに詳細に説明する。図1~図3は、本発明の一の実施形態に係る運転時生体状態判定装置60の分析対象である運転者の背部から採取される生体信号、すなわち心部揺動波(Aortic Pulse Wave(APW))を採取する生体信号測定装置1を示した図である。心部揺動波は、人の上体の背部から検出される心臓と大動脈の運動から生じる圧力振動であり、心室の収縮期及び拡張期の情報を含んでいる。また、循環の補助ポンプとなる動脈管の内圧の高まりは波となって血管に沿って末梢へ伝播され、この伝播に伴って血管壁を拡張させる。従って、心部揺動波(APW)は、血管壁の弾性情報及び血圧による弾性情報を含んでいる。すなわち、心部揺動波(APW)は、心音や心電図から得られる中枢に近いところの情報と、心臓を起点にした入力波に動脈管の内圧変動や血管壁の弾性による影響が重畳された出力波の情報(すなわち、本来、同一周期、同一のゆらぎとなる指尖容積脈波から得られる末梢の情報によって周期特性が変化した情報)との両方を含んだ情報となっている。そして、心拍変動に伴う信号波形は交感神経系及び副交感神経系の神経活動情報(交感神経の代償作用を含んだ副交感神経系の活動情報)を含み、大動脈の揺動に伴う信号波形には交感神経活動の情報を含んでいる。
本実施形態で用いた生体信号測定装置1は、図2及び図3に示したように、コアパッド11、スペーサパッド12、センサ13、フロントフィルム14、リアフィルム15を有して構成される。
コアパッド11は、例えば板状に成形され、脊柱に対応する部位を挟んで対称位置に、縦長の貫通孔11a,11aが2つ形成されている。コアパッド11は、板状に形成されたポリプロピレンのビーズ発泡体から構成することが好ましい。コアパッド11をビーズ発泡体から構成する場合、発泡倍率は25~50倍の範囲で、厚さがビーズの平均直径以下に形成されていることが好ましい。例えば、30倍発泡のビーズの平均直径が4~6mm程度の場合では、コアパッド11の厚さは3~5mm程度にスライスカットする。
スペーサパッド12は、コアパッド11の貫通孔11a,11a内に装填される。スペーサパッド12は、三次元立体編物から形成することが好ましい。三次元立体編物は、例えば、特開2002-331603号公報、特開2003-182427号公報等に開示されているように、互いに離間して配置された一対のグランド編地と、該一対のグランド編地間を往復して両者を結合する多数の連結糸とを有する立体的な三次元構造となった編地である。三次元立体編物が人の背によって押圧されることにより、三次元立体編物の連結糸が圧縮され、連結糸に張力が生じ、生体信号に伴う人の筋肉を介した体表面の振動が伝播される。また、コアパッド11よりも、三次元立体編物からなるスペーサパッド12の方が厚いものを用いることが好ましい。これにより、フロントフィルム14及びリアフィルム15の周縁部を貫通孔11a,11aの周縁部に貼着すると、三次元立体編物からなるスペーサパッド12が厚み方向に押圧されるため、フロントフィルム14及びリアフィルム15の反力による張力が発生し、該フロントフィルム14及びリアフィルム15に固体振動(膜振動)が生じやすくなる。一方、三次元立体編物からなるスペーサパッド12にも予備圧縮が生じ、三次元立体編物の厚み方向の形態を保持する連結糸にも反力による張力が生じて弦振動が生じやすくなる。
センサ13は、上記したフロントフィルム14及びリアフィルム15を積層する前に、いずれか一方のスペーサパッド12に固着して配設される。スペーサパッド12を構成する三次元立体編物は上記したように一対のグランド編地と連結糸とから構成されるが、各連結糸の弦振動がグランド編地との節点を介してフロントフィルム14及びリアフィルム15に伝達されるため、センサ13はスペーサパッド12の表面(グランド編地の表面)に固着することが好ましい。センサ13としては、マイクロフォンセンサ、中でも、コンデンサ型マイクロフォンセンサを用いることが好ましい。
上記した生体信号測定装置1は、例えば、自動車等の輸送機器の運転席のシートバックの位置に配設される。例えば、シートバックの表皮の内側に配置したり、あるいは、シートバックに積層して用いられるクッション部材の裏面に配置したりして設けられる。
次に、本実施形態の運転時生体状態判定装置60の構成について図4に基づいて説明する。運転時生体状態判定装置60は、分析演算手段61、判定検出手段62等を有して構成される。運転時生体状態判定装置60はコンピュータから構成され、このコンピュータに、分析演算手順を実行させて分析演算手段61として機能させ、判定検出手順を実行させて判定検出手段62として機能させるコンピュータプログラムが導入される。なお、コンピュータプログラムは、フレキシブルディスク、ハードディスク、CD-ROM、MO(光磁気ディスク)、DVD-ROM、メモリカードなどの記録媒体へ記憶させて提供することもできるし、通信回線を通じて伝送することも可能である。
分析演算手段61は、生体信号測定装置1から得られる生体信号であるAPWを分析演算して所定の形態となるように加工する。具体的には、周波数演算手段611と、周波数傾き演算手段612と、周波数変動演算手段613と、分布率演算手段614と、変化度演算手段615とを有して構成され、これらは、それぞれコンピュータプログラムである周波数演算手順、周波数傾き演算手順、周波数変動演算手順、分布率演算手順、変化度演算手順を実行させることによって機能する。
周波数演算手段611は、生体信号測定装置1のセンサ13から得られる出力信号(APW)の時系列データ、好ましくは、フィルタリング処理(例えば、体動などの周波数成分除去するフィルタリング処理)された所定の周波数領域の時系列データにおける周波数の時系列波形を求める。
周波数演算手段611は、生体信号測定装置1のセンサから得られる出力信号(APW)の時系列波形において、正から負に切り替わる地点(以下、「ゼロクロス地点」という)を用いて周波数の時系列波形を求める方法(以下、「ゼロクロス検出法」という)である。このゼロクロス検出法は、生体信号の周波数の基本成分を捉えるものであり、交感神経機能の指標として用いられるLF/HFの発現の強弱レベルを示す。この方法では、まず、ゼロクロス地点を求めたならば、それを例えば5秒毎に切り分け、その5秒間に含まれる時系列波形のゼロクロス地点間の時間間隔の逆数を個別周波数fとして求め、その5秒間における個別周波数fの平均値を当該5秒間の周波数Fの値として採用する(図5の[1]のステップ)。そして、この5秒毎に得られる周波数Fをプロットすることにより、周波数の時系列波形を求める(図5の[2]のステップ)。
周波数演算手段611としては、生体信号測定装置1のセンサから得られる出力信号(APW)の時系列波形を平滑化微分して極大値(ピーク)を用いて時系列波形を求める方法(以下、「ピーク検出法」という)を採用することもできる。ピーク検出法は、基本的には副交感神経機能の指標として用いられるHFの機能に相当する時系列波形である。例えば、SavitzkyとGolayによる平滑化微分法により極大値を求める。次に、例えば5秒ごとに極大値を切り分け、その5秒間に含まれる時系列波形の極大値(波形の山側頂部)間の時間間隔の逆数を個別周波数fとして求め、その5秒間における個別周波数fの平均値を当該5秒間の周波数Fの値として採用する(図5の[1]のステップ)。そして、この5秒毎に得られる周波数Fをプロットすることにより、周波数の時系列波形を求める(図5の[2]のステップ)。
ここで、APWは、指尖容積脈波と同様に末梢系の制御の様子と心臓の制御の様子の両方の情報を含む生体信号、すなわち、動脈の交感神経支配の様子、並びに、自律神経系の交感神経系と副交感神経系の出現情報を含む生体信号であり、この生体信号のゼロクロス検出法による傾き時系列波形を絶対値処理した波形は、心臓の制御の状態により関連しており、交感神経の出現状態を反映している。ピーク検出法によるものは、心拍変動により関連しており、交感神経による代償作用が加味された副交感神経系の動態を捉えている。なお、ピーク検出法による傾き時系列波形を絶対値処理したものは、指尖容積脈波のウエーブレット解析による副交感神経の動態(この副交感神経の動態は交感代償作用が加味されたものである)に比較的近似している。そのため、ゼロクロス検出法は、自律神経系の制御で対処されるストレスへの適応の結果となる体調を表す指標に用いることができると考えられる。ゼロクロス検出法は、心臓の制御の状態への関連が高いため、心拍変動の切痕の情報も含んでおり、指尖容積脈波では得られない、APWの時相差及びゆらぎの発生による0.5Hz近傍や1~2Hz近傍において生じる位相遅れの周波数成分も情報として得られる。従って、APWを用いて生体状態を判定するに当たって、ゼロクロス検出法により得られたデータを主として用いることが好ましい。
周波数傾き演算手段612は、周波数演算手段611によって得られた生体信号測定装置1のセンサの出力信号の周波数の時系列波形から、所定のオーバーラップ時間で所定の時間幅の時間窓を設定し、時間窓毎に最小二乗法によりセンサの出力信号の周波数の傾きを求め、その時系列波形を出力する構成である。具体的には、まず、ある時間窓Tw1における周波数の傾きを最小二乗法により求めてプロットする(図5の[3],[5]のステップ)。次に、オーバーラップ時間Tl(図5の[6]のステップ)で次の時間窓Tw2を設定し、この時間窓Tw2における周波数の傾きを同様に最小二乗法により求めてプロットする。この計算(移動計算)を順次繰り返し、エアパック信号の周波数の傾きの時系列変化を周波数傾き時系列波形として出力する(図5の[8]のステップ)。なお、時間窓Twの時間幅は180秒に設定することが好ましく、オーバーラップ時間Tlは162秒に設定することが好ましい。これは、本出願人による上記特許文献3(WO2005/092193A1公報)において示したように、時間窓Twの時間幅及びオーバーラップ時間Tlを種々変更して行った睡眠実験から、特徴的な信号波形が最も感度よく出現する値として選択されたものである。
また、上記したように、心房細動のゆらぎの特性は0.0033Hzで切り替わり、0.0033Hzのゆらぎを調整するためのゆらぎが、0.0033Hz近傍以下に存在すると言われている。従って、0Hzと0.0033Hzの中間である0.0017Hzを中心としたゆらぎの状態を見ると、ばらつきが生じたとしても0.0033Hz近傍及びそれ以下に生じるゆらぎの状態の概要が現れると考えられる。0.0017Hzの波形の1/4周期にあたる時間は147秒である。90%ラップ状態で波形をスムージングするとして、前後の10%の時間を加算すると、147/0.8=約180秒となり、この点からも180秒とすることが好ましいと言える。ここに、180秒、3分間で変化していく様子、変化の傾向、微分係数、傾きを時系列波形として捉える。そして180秒間の平均値である傾きを、スムージングさせるために180秒間の時間を90%ラップさせて、18秒毎にプロットしていき時系列波形を作り、この傾きの時系列波形を使って解析を行う。この傾き時系列波形は恒常性のゆらぎを捉えるもので、心拍変動の制御の程度を時系列波形として大局的に評価するものである。
周波数変動演算手段613は、周波数演算手段611により得られた時系列波形において、所定のオーバーラップ時間で設定した所定の時間窓毎に周波数の平均値を求める移動計算を行い、時間窓毎に得られる周波数の平均値の時系列変化を周波数変動時系列波形として出力するものである。上記したように、ピーク検出法により得られる周波数の時系列波形は、交感神経活動と副交感神経活動の両方の情報を捉えており、ゼロクロス検出法により得られる周波数の時系列波形は、交感神経活動の情報を捉えている。ゼロクロス検出法による周波数変動時系列波形が交感神経活動を捉えているとすると、睡眠状態では交感神経活動の低下の影響を受けるため周波数は低下する。ピーク検出法による周波数変動時系列波形が交感神経活動と副交感神経活動の両方の捉えているとすると、睡眠状態では交感神経活動の低下と副交感神経活動の亢進の両方の影響を受けるため周波数はゼロクロス検出法の場合よりもさらに低下する。従って、2つの周波数変動時系列波形を覚醒状態と睡眠状態とで比較すると、両者の乖離度に変化が生じる。すなわち、両者の乖離度は覚醒状態よりも睡眠状態の方が小さくなる(図30(c)参照)。
従って、このことを利用し、予め覚醒状態と睡眠状態との乖離度のデータを複数取得し、それらから閾値を設定することで、覚醒状態か睡眠状態か否かを自動判定できる。運転中に睡眠に陥ることはないのが通常であるが、本実施形態の運転時生体状態判定装置60の判定検出手段62として、周波数変動時系列波形を用いた乖離度判定手段を設定しておくことで、万一、睡眠状態に至ったことを検出したならば、所定の警告を発するようにすることもできる。但し、運転中に睡眠に陥ることはないものの、運転手が休憩時に睡眠する場合はもちろんある。従って、乖離度判定手段を運転終了後に起動して、運転手がどの時間に休憩して睡眠したかを客観的に知るようにすることもできる。この場合、判定用のコンピュータプログラムである乖離度判定手段を起動させるのは、車載の運転時生体状態判定装置60であってもよいし、車載の運転時生体状態判定装置60において蓄積されたデータを用い、乖離度判定手段が設定されている管理者の管理用コンピュータによって解析し、運転手毎の運転時の状態管理に使用するようにしてもよい。もちろん、車載の運転時生体状態判定装置60によって得られるデータは、常時あるいは定期的に通信回線を通じて管理用コンピュータに送信されるように設定されていてもよく、その場合には、管理用コンピュータは、受信したデータに基づいて乖離度を判定することができる。
分布率演算手段614は、周波数傾き演算手段612から得られる周波数傾き時系列波形を周波数解析し、上記した機能調整信号、疲労受容信号及び活動調整信号に相当する各周波数のパワースペクトルを求める手段を有すると共に、得られたパワースペクトルの時系列変化から、予め定めた上記の機能調整信号、疲労受容信号及び活動調整信号に相当する周波数成分を抜き出し、この3つの周波数成分のパワースペクトルの値の合計を100とした際の3つの各周波成分の割合を時系列に算出し、その時系列変動波形を分布率波形として求める。ここで、本実施形態では、上記したように、0.0017Hzを機能調整信号とし、0.0035Hzを疲労受容信号とし、0.0053Hzを活動調整信号とした。なお、機能調整信号は0.0027Hz以下の範囲、疲労受容信号は0.002~0.0052Hzの範囲であり、活動調整信号の周波数が0.004~0.007Hzの範囲で調整することができる。
変化度演算手段615は、分布率演算手段により得られた時系列の分布率に平滑化微分を適用し、時間軸上の任意の時点間における、上記した機能調整信号、疲労受容信号及び活動調整信号の3つの周波数成分のうちの少なくとも一つの周波数成分について分布率の変化度を求める。このとき、平滑化微分を適用する時間軸上の任意の時点間とは、計算ポイントとして採用する時間軸上の2つ以上のポイントから適宜選択できる。この場合、例えば、2ポイントでの平滑化微分を適用する場合、11ポイントでの平滑化微分を適用する場合といったように、複数種類の計算手法により変化度を求めることが好ましい。それぞれに求めた変化度について、異なる閾値で判定基準を設定することにより、より正確な判定が可能となる。
判定検出手段62は、上記した分析演算手段61の各演算手段の演算結果を用いて生体状態を判定又は検出する手段であり、入眠予兆現象検出手段621、切迫睡眠現象検出手段622、自覚眠気・覚低走行状態検出手段623、恒常性維持機能レベル判定手段624、初期疲労判定手段625等を有して構成され、これらは、それぞれコンピュータプログラムである入眠予兆現象検出手順、切迫睡眠現象検出手順、自覚眠気・覚低走行状態検出手順、恒常性維持機能レベル判定手順、初期疲労判定手順等を実行させることによって機能する。
入眠予兆現象検出手段621は入眠予兆現象を検出する。入眠予兆現象は、入眠に至る5~30分前に生じる体調変化現象であるが自覚的な眠気を伴わない。そこで、交感神経機能の亢進というシグナルによって捉える。
入眠予兆現象検出手段621は、上記した分析演算手段61の演算結果のうち、自律神経制御に関連する指標を用いて判定を行う。本実施形態では、ゼロクロス検出法を用いた周波数傾き演算手段612による周波数傾き時系列波形を用いて判定している。図6は睡眠実験結果の一例を示したものであり、このうち(c)がゼロクロス検出法を用いた周波数傾き時系列波形の一例を示すものである。入眠予兆現象は周波数傾き時系列波形において、基本的には、振幅の大きな波が複数連続して出現することにより判定される。図6(a)に示したように、脳波のα波、β波、θ波の関係から、33~40分付近が、入眠に陥ったポイント(入眠点)であると判定できる。これに対し、(c)の周波数傾き時系列波形は、14~26分付近、すなわち、入眠点の7~26分前に振幅の大きな波が連続して出現しており、この波形が交感神経機能の亢進に伴う入眠予兆現象と特定できる。多数の被験者について行った試験結果から、この振幅の大きな波形が、それ以前の波形とどのような違いで現れるかを統計的に検討して得られた基準に基づき判定することにより、入眠予兆現象をリアルタイムで特定できる。
本実施形態では、図7に示したように、まず、ゼロクロス検出法を用いた周波数傾き時系列波形を平滑化微分し、正の傾きから負の傾きに切り替わるポイントをピークとして検出し、負の傾きから正の傾きに切り替わるポイントをボトムとして検出し、両者間の振幅値を計算する。次に、このような振幅値が複数存在するか否かを求め、複数存在する場合に、1データ前の振幅値との大きさを比較し、その大きさの比が所定倍数以上で、かつ、1データ前の振幅値を求めた時刻から所定時間以上経過している場合に入眠予兆現象と判定する。
以上のことから、所定の基準に対して振幅の大きな波形の出現が生じるという周波数傾き時系列波形の発散傾向が現れた場合に入眠予兆現象と判定できる。また、図20に示したように、このような振幅の増大傾向が生じているタイミングで、その周期も長周期化していることから、増大傾向に合わせて周期も長周期化する場合に入眠予兆現象と判定する構成とすることが好ましい。
切迫睡眠現象検出手段622は、切迫睡眠現象を検出する。切迫睡眠現象は、入眠予兆現象の出現後、交感神経機能の低下に伴う副交感神経機能の優位な状態で入眠に至る1~5分前に生じる現象であるため、交感神経機能の低下及び副交感神経機能の亢進というシグナルによって捉える。切迫睡眠現象は、多くの場合、入眠予兆現象と同様に自覚のない体調変化現象であるが、人により、あるいはそのときの体調や周囲環境などによって、自覚的な強い眠気を伴う場合もある。
切迫睡眠現象は、ゼロクロス検出法を用いた周波数傾き時系列波形において、上記の入眠予兆現象を示す波形が出現した後、波形が収束傾向を示し、その後、より長周期の大きな変動ゆらぎを示すポイントである。図6(c)では、切迫睡眠現象が、29~38分にかけて特定され、脳波による入眠点判定の数分前に生じている。切迫睡眠現象をリアルタイムで特定するに当たって、本実施形態では、図8に示すような判定を行っている。すなわち、ゼロクロス検出法を用いた周波数傾き時系列波形を平滑化微分し、正の傾きから負の傾きに切り替わるポイントをピークとして検出し、負の傾きから正の傾きに切り替わるポイントをボトムとして検出し、両者間の振幅値を計算する。次に、このような振幅値が複数存在するか否かを求め、複数存在する場合に、1データ前の振幅値との大きさを比較し、その大きさの比が所定数分の1以下であり、かつ、平滑化微分波形の値が所定の計算ポイント以上連続して所定の範囲に収まって収束の傾向を示し、その後、より長周期の大きな変動ゆらぎを伴う場合に切迫睡眠現象と判定する。
本実施形態の入眠予兆現象検出手段621及び切迫睡眠現象検出手段622は、分布率演算手段614による求められる機能調整信号、疲労受容信号及び活動調整信号に相当する3つの周波数成分の時間軸上の任意の時点における各分布率、及び、変化度演算手段615により求められるいずれかの周波数成分の変化度の少なくとも一方を用いて、所定の判定基準により、入眠予兆現象又は切迫睡眠現象を含む運転者の認知困難な生体状態を判定する手段も有している。機能調整信号、疲労受容信号及び活動調整信号は、ULF帯域からVLF帯域に属する0.01Hz未満の周波数成分であり、これらは体温制御の状態に関連するものであるが、この体温制御は自律神経制御の結果が反映されているため、この極低周波・超低周波の周波数成分の分布率や変化度を所定の判定基準で判定することにより、入眠予兆現象及び切迫睡眠現象を捉えることができる。
まず、入眠予兆現象については、図9に示したように、ゼロクロス検出法を用いた分布率の時系列波形の中から、活動調整信号(0.0053Hz)又は疲労受容信号(0.0035Hz)が所定以上で、機能調整信号(0.0017Hz)がそれらより低いか否かを判定する。入眠予兆現象は、疲労が蓄積してきた上で一時的な交感神経機能の上昇が生じるものであるため、それらに関連する活動調整信号、疲労受容信号の分布率の上昇が生じることに着目した判定である。このような変化をより正確に把握するために、本実施形態では、変化度演算手段615により得られた変化度を考慮して判定する。すなわち、分布率の時系列変化が上記した条件を満たすことが判定されたならば、活動調整信号(0.0053Hz)の変化度が正方向に所定以上で、機能調整信号(0.0017Hz)が負方向に所定以下であるか否か、すなわち、変化の仕方が所定よりも大きいと同時に正負逆方向に変化しているか否かを判定する。
切迫睡眠現象についても、やはり疲労の蓄積の結果として生じるものであり、入眠点に至る前に副交感神経機能の上昇があり、よりリラックスした状態に人は誘導される。切迫睡眠現象の場合、入眠予兆現象の発現後、副交感神経機能が優位な状態になるため、ゼロクロス検出法に現れる心拍変動を制御するゆらぎが変化し、かつ、ピーク検出法に現れる副交感神経優位となるために生じる心拍変動自体が変化する(心拍の周波数が低下傾向となる)。従って、ゼロクロス検出法を用いた分布率、ピーク検出法を用いた分布率の双方を用い、特に、活動調整信号(0.0053Hz)の変化が顕著に現れるか否かを検出する。また、判定精度をより高くするために、切迫睡眠現象であることが、ゼロクロス検出法を用いた分布率、ピーク検出法を用いた分布率の双方において判定され、かつ、両者の判定が規定時間内である場合に限り、最終的に切迫睡眠現象と判定して出力する。
具体的には、図10に示した通りであり、まず、ゼロクロス検出法では、分布率において、活動調整信号(0.0053Hz)が所定以上で、活動調整信号(0.0053Hz)又は疲労受容信号(0.0035Hz)の変化度が正又は負方向に所定値よりも大きく、かつ、機能調整信号(0.0017Hz)の変化度がこれらと正負の逆方向に所定値よりも大きい場合を切迫睡眠と判定する。ピーク検出法では、分布率において、活動調整信号(0.0053Hz)又は機能調整信号(0.0017Hz)が所定以上で、活動調整信号(0.0053Hz)又は疲労受容信号(0.0035Hz)の変化度が正又は負方向に所定値よりも大きく、かつ、機能調整信号(0.0017Hz)の変化度がこれらと正負の逆方向に所定値よりも大きい場合を切迫睡眠と判定する。そして、ゼロクロス検出法による分布率を用いた判定結果において切迫睡眠と判定され、ピーク検出法による分布率を用いた判定結果において切迫睡眠と判定され、かつ、それらの判定が規定時間内である場合に、すなわち、ゼロクロス検出法及びピーク検出法において同様の変化が同時期に生じた場合に最終的に切迫睡眠現象と判定して出力する。
以上のように入眠予兆現象検出手段621及び切迫睡眠現象検出手段622は、自覚困難な生体状態である入眠予兆現象、及び、自覚困難な場合を基本とするが認知し得る場合もある生体状態である切迫睡眠現象を、周波数傾き時系列波形を用いて所定の基準で判定する手法と、機能調整信号(0.0017Hz)、疲労受容信号(0.0035Hz)及び活動調整信号(0.0053Hz)の分布率を用いて所定の基準で判定する手法の2つの判定手法を備え、それぞれにより、入眠予兆現象、切迫睡眠現象を検出している。従って、これらの生体状態の検出を確実に行うことができ、信頼性が高く、運転時の生体状態の判定手法として適していると言える。なお、入眠予兆現象や切迫睡眠現象が検出されたならば、入眠予兆現象検出手段621及び切迫睡眠現象検出手段622は、運転者にそのことを知らせる出力(モニタへの表示、警告音の発生、運転席の振動など)を行うように制御する機能を有する。この場合、入眠予兆現象検出手段621及び切迫睡眠現象検出手段622は、その検出結果を常時あるいは定期的に通信回線を通じて管理用コンピュータに送信されるように設定されていてもよい。もちろん、運行終了後に、それらのデータを管理用コンピュータで解析するようにしてもよい。なお、このように設定した場合、管理用コンピュータも本発明の運転時生体状態判定装置の一部を構成することになる。
自覚眠気・覚低走行状態検出手段623は、分析演算手段61の演算結果を用い、運転者の自覚的な眠気を伴う入眠前の体調変化現象である自覚眠気と、意識レベルの低下によって生じる覚低走行状態を検出する手段である。ここでいう「自覚眠気」とは、体調変化を示す兆候の中で、自覚的に意識できる兆候を指し、運転中に感じる軽い眠気(軽度眠気)、運転時間が長くなるに従って生じる耐え難いような強いの眠けあるいは過緊張状態からのリバウンドによって生じる強いの眠気等を指す。また、「覚低走行状態」は、上記したように、睡眠不足や過労状態でもない良好な心身状態であるにも拘わらず、運転中の著しい意識レベルの低下により、眠気を自覚せず開眼しているにも拘わらず情報の読み取りや判断が不能となった状態で走行を継続している走行状態のことをいい、2~3秒、瞬間的にそのような状態に陥る。瞬間的に注意力の著しい低下を示す点で軽い眠気と共通しており、軽い自覚眠気を感じたときと同様の生体反応を示すと考えられる。また、このような瞬間的な「覚低走行状態」が連続的(ここでいう「連続的」には、瞬間的な覚低走行状態が連続する場合のほか、所定時間内に断続的に生じる場合、あるいは、3秒以上の長時間覚低走行状態に陥った場合等を含む)に生じるようになると、それは、耐え難い強い眠気を自覚しているときと同様の生体反応を示すと考えられる。また、眠気を自覚している時期及び覚低走行状態に陥っている時期は、運転者自身の恒常性維持機能は、その状態から覚醒状態に復帰しようという意識が潜在的に働いている時期であると考えられ、また、睡眠段階1に至る前までは音に対する反応率が0.9~1であることから、何らかの警告を提供すれば、容易に、意識レベルの高い状態、注意力を喚起できる状態、さらには覚醒状態に復帰できる点で共通する。これに対し、入眠予兆や切迫睡眠現象は、睡眠へのいわば準備段階としての生体反応と言える点で、自覚眠気や覚低走行状態とは区別できる。
そこで、本実施形態では、「自覚眠気」及び「覚低走行状態」を区別することなく検出するようにしている。「自覚眠気」及び「覚低走行状態」は、体温調節機能を反映するULF帯域からVLF帯域に属する0.01Hz未満の周波数成分、特に、0.0017Hzを中心とした機能調整信号、0.0035Hzを中心とした疲労受容信号及び0.0053Hzを中心とした活動調整信号の変化と密接に関連する。従って、自覚眠気・覚低走行状態検出手段623は、分布率演算手段614により得られる上記各周波数成分の分布率と、変化度演算手段615により上記各周波数成分の変化度のうちの少なくとも一方の演算結果を利用して判定する。
自覚眠気・覚低走行状態検出手段623は、あくびをすれば醒めるような軽い眠気(軽度眠気)、又は、2~3秒以下の瞬間的な覚低走行状態が生じたことを判定する手段(第1自覚眠気・覚低走行状態検出手段623a)と、軽度眠気の域を越え、上記したような長時間運転や過緊張状態に対するリバウンドによって生じる強い眠気の状態に陥っているか否か、又は、瞬間的な覚低走行状態が所定時間内に連続的ないしは断続的に生じたり、より長時間の覚低走行状態に陥っているか否かを判定する手段(第2自覚眠気・覚低走行状態検出手段623b)を備えている。
第1自覚眠気・覚低走行状態検出手段623aは、分布率演算手段614により得られる上記の3つの周波数成分のうち、活動調整信号に相当する周波数成分の分布率が機能調整信号に相当する周波数成分の分布率以下となるような変化を示す条件下で、軽度眠気又は瞬間的な覚低走行状態の出現を判定する。上記したように、入眠予兆現象や切迫睡眠現象は、副交感神経優位になっていく中での交感神経機能の突発的な亢進の検出を基本としているが、軽度眠気又は瞬間的な覚低走行状態は、疲労に伴って、体の変調や機能低下を制御する機能調整信号(0.0017Hz)の分布率が相対的に上昇し、逆に活動調整信号(0.0053Hz)の分布率が相対的に低下するという、本人の自覚のないまま意識レベルが低下していくタイミングの中で出現する。
このような機能調整信号(0.0017Hz)の分布率の相対的な上昇と活動調整信号(0.0053Hz)の分布率の相対的な低下を変化度に置き換えると、機能調整信号及び活動調整信号の分布率が相対的に大きな変化を示すタイミングであるから、その時点においては、両周波数成分の変化度が、絶対値でそれぞれ所定値以上となる。
すなわち、これらの条件を満たすタイミングの中に、軽度眠気又は瞬間的な覚低走行状態を伴う体調変化が含まれると判定する。但し、本実施形態では、この理論的な条件に加え、多数の実験結果を基にして統計的に得られた条件を組み合わせ、第1自覚眠気・覚低走行状態検出手段623aの判定条件を設定し、軽度眠気又は瞬間的な覚低走行状態をより精度よく判定できるようにしている。
その一方、軽度眠気又は瞬間的な覚低走行状態の統計的条件を設定する中で、軽度眠気又は瞬間的な覚低走行状態か否かの判定基準を大きく2つに分けるとさらに判定精度が高まることがわかった。これは、判定対象である運転者の基本状態が、リラックス状態であるか、緊張状態(興奮状態も含む)であるかによって判定基準が大きく分かれるというものである。リラックス状態は、例えば、一人で慣れた道路を運転してリラックスしている場合、長距離運転に慣れたプロのドライバーで、リラックスしながらの運転に長けている場合など、交感神経と副交感神経のバランスがとれている場合である。緊張状態(興奮状態も含む)は、例えば、同乗者がいて会話しながら運転しる場合などで交感神経機能が亢進している場合などである。
また、リラックス状態か緊張状態(興奮状態も含む)は、長時間の運転環境においては、道路状況、休憩のタイミング、車内の音楽、同乗者の乗り降りなどによって変化する。従って、第1自覚眠気・覚低走行状態検出手段623aは、常時、運転者がリラックス状態か否かを判定し、それによって、軽度眠気又は瞬間的な覚低走行状態の判定基準の閾値を変化させて判定する。基本状態がリラックス状態か緊張状態(興奮状態も含む)かの判定は、分布率演算手段614から得られた分布率及び変化度演算手段615から得られた変化度を用いて行う。具体的には、図11に示したように、多数の実験結果を統計処理し、機能調整信号(0.0017Hz)、疲労受容信号(0.0035Hz)及び活動調整信号(0.0053Hz)の分布率及び変化度と、運転者が軽度眠気又は瞬間的な覚低走行状態を生じた可能性があると考えられるタイミング(自己申告又は同乗者による観察)とを対比し、軽度眠気又は瞬間的な覚低走行状態が生じていない条件(除外条件)を設定し、軽度眠気又は瞬間的な覚低走行状態が生じたと可能性があるタイミングでは、運転者のそのときの運転環境(同乗者の有無、車内音楽の有無、交通渋滞の状況など)から緊張状態(興奮状態も含む)(振分け条件1)とリラックス状態(振分け条件2)とに区別する振分け条件を設定した。なお、除外条件に入る場合や振分け条件に当てはまらない場合には眠気無しと判定される。
これらのことから、本実施形態の第1自覚眠気・覚低走行状態検出手段623aは、まず、ゼロクロス検出法を用いた分布率演算手段614から得られた分布率を用いて、上記した除外条件に入らない場合において、上記した振り分け条件に従って、リラックス状態の判定基準を用いるか、緊張状態(興奮状態も含む)の判定基準を用いるかに区分する。区分された後、その判定対象の時間帯における機能調整信号(0.0017Hz)の分布率が所定値以上で、活動調整信号(0.0053Hz)の分布率が所定値以下か否かを判定する。図12は、判定フローの一例を示したものである。
まず、分布率の時系列波形において、活動調整信号(0.0053Hz)の分布率が所定値以下、機能調整信号(0.0017Hz)がその値を上回る所定値以上の場合(第1条件)に軽度眠気と判定する。第1条件を満たさない場合でも、機能調整信号(0.0017Hz)、疲労受容信号(0.0035Hz)及び活動調整信号(0.0053Hz)の分布率がいずれも所定値以上の場合(第2条件)に軽度眠気と判定し、さらに、第1条件及び第2条件を満たさない場合でも、機能調整信号(0.0017Hz)及び活動調整信号(0.0053Hz)の分布率が共に第2条件の設定値よりも高い値である場合(第3条件)に軽度眠気又は瞬間的な覚低走行状態と判定する。
次に、変化度を用いる場合は、異なる計算ポイント数、例えば、11ポイントでの平滑化微分を適用した場合と、2ポイントでの平滑化微分を適用した場合のそれぞれで変化度を求め、そのそれぞれで適宜の閾値を設定して判定する。例えば、11ポイントでの平滑化微分を適用した場合には、機能調整信号(0.0017Hz)及び活動調整信号(0.0053Hz)の変化度の絶対値が所定以上の場合(第4条件)に軽度眠気又は瞬間的な覚低走行状態と判定する。2ポイントの平滑化微分を用いた場合には、機能調整信号(0.0017Hz)及び疲労受容信号(0.0035Hz)の変化度の絶対値が所定以上の場合(第5条件)に軽度眠気又は瞬間的な覚低走行状態と判定し、第5条件を満たさない場合には、機能調整信号(0.0017Hz)及び活動調整信号(0.0053Hz)の変化度の絶対値が所定以上の場合(第6条件)に軽度眠気又は瞬間的な覚低走行状態と判定する。
第1自覚眠気・覚低走行状態検出手段623aは、このように、体温制御に関連する機能調整信号(0.0017Hz)、疲労受容信号(0.0035Hz)及び活動調整信号(0.0053Hz)の分布率及び変化度を用いて判定するため、認知可能な体調変化である軽度眠気又は瞬間的な覚低走行状態を正確に判定でき、運転時の生体状態判定用として適している。
第2自覚眠気・覚低走行状態検出手段623bは、上記したように、軽度眠気の域を越え、長時間運転や過緊張状態に対するリバウンドによって生じる強い眠気の状態に陥っているか否か、又は、瞬間的な覚低走行状態が所定時間内に連続的(断続的に生じる場合、及び、より長時間の覚低走行状態に陥っている場合も含む)に生じているか否かを判定する手段である。
運転は、所定の着座姿勢の維持、ハンドルやペダル操作といった肉体労働と、走行中に各種情報を収集し瞬時に判断することを繰り返すという頭脳労働とを伴う。そのため、長時間運転によって疲労が蓄積するだけでなく、高速道路等での長時間運転では一定の速度での走行となるため、肉体的活動及び頭脳活動のいずれも活動頻度が低下し、強い眠気が生じたり、覚低走行状態が所定時間内に繰り返し生じたり、あるいは、1回の覚低走行状態がより長時間(例えば3秒以上)となったりする。より詳細には、睡眠を欲するような眠気が発生すると交感神経活動を亢進させることで身体は眠気に抵抗するための準備を行う。その結果、活動調整信号(0.0053Hz)の分布率が上昇する。次に、眠気により緊張を誘発し、集中した状態になろうとするため、機能調整信号(0.0017Hz)の分布率が上昇し、さらに、眠気への抵抗が困難になってくると副交感神経活動が賦活し、身体を休息へと導こうとするため、副交感神経活動を反映する疲労受容信号(0.0035Hz)の分布率が上昇するように変化する。このような過程を経て、自覚のない身体に生じた睡眠に対する欲求(自覚の無い眠気)が、自覚のある身体に生じた睡眠に対する欲求である自覚眠気へと切り替わる。図13は、この変化を模式的に示した図であるが、実際に多数の実験結果から強い眠気を生じた場合など、多くの被験者がこのような状態の変遷を示した。
そこで、第2自覚眠気・覚低走行状態検出手段623bは、分布率演算手段614により得られる上記3つの周波数成分の分布率の時系列波形の各ピーク値が、所定の出現時間の差の範囲内で所定の順番で出現し、かつ、所定の分布率条件を満たす値である場合に、上記した強い眠気への抵抗の状態となっているか、又は連続的(所定時間内に断続的に生じる場合、より長時間継続する場合も含む)な覚低走行状態になっていると判定するように設定している。
具体的には、図14に示したように、機能調整信号(0.0017Hz)、疲労受容信号(0.0035Hz)及び活動調整信号(0.0053Hz)の分布率のピーク値の出現時刻が、次の関係:活動調整信号≦機能調整信号≦疲労受容信号を満たす場合(第1条件)であって、活動調整信号と疲労受容信号のピーク値の出現時刻の差が所定時間内であり(第2条件)、さらに、いずれの周波数成分も所定の分布率以上である条件を満たす場合(第3条件)に、強い眠気への抵抗の状態となっているか、又は連続的(所定時間内に断続的に生じる場合、より長時間継続する場合も含む)な覚低走行状態になっていると判定する。また、いずれの周波数成分も所定の分布率以上である条件を満たさない場合、すなわち第1条件及び第2条件を満たすが第3条件を満たさない場合には、各分布率のピーク値が活動調整信号≦機能調整信号≦疲労受容信号の条件を満たす場合(第4条件)に、強い眠気への抵抗の状態となっているか、又は連続的(所定時間内に断続的に生じる場合、より長時間継続する場合も含む)な覚低走行状態になっていると判定する構成が好ましい。
一方、自覚眠気の生じるメカニズムは、上記のように、交感神経活動の亢進(活動調整信号(0.0053Hz)の分布率の上昇)、緊張・集中状態への移行(機能調整信号(0.0017Hz)の分布率の上昇)、副交感神経活動が賦活(疲労受容信号(0.0035Hz)の上昇)を経ると考えられるが、実験の結果、その過程を経ずに強い自覚眠気を生じる場合が散見された。そして、その場合の周波数傾き時系列波形を考察したところ、図15(a)に示したように、所定の基準に対して振幅の収束傾向が検出され、かつ、周期が短周期化することがわかった。具体的には、振幅が小さくなると共に、周期が約300秒から約200秒と短周期化していた。これは、0.0035Hz、0.0053Hzの周波数成分に対応するものであり、0.0017Hzが卓越しにくいと考えられる。つまり、睡眠への抵抗のために交感神経活動が亢進した後、諦めのような状態となって副交感神経活動が賦活し、その後、交感神経活動が低下して強い眠気を感じするものと考えられる。
図15(b)は、分布率演算手段614による3つの周波数成分の分布率のみを用いて自覚眠気を検出した場合のカイ二乗検定の結果(後述の実験例1の動的実験89例のデータ)を示した図であり、未検出23件で正答率は77%であった。そこで、周波数傾き時系列波形において、振幅値が所定の設定した範囲になり、かつ周期が所定の設定した範囲に短周期化する場合も強い自覚眠気として検出したところ、図15(c)に示したように、未検出は4件となり、判定精度が高まった。従って、第2自覚眠気・覚低走行状態検出手段623bは、上記した分布率による判定に加えて、周波数傾き時系列波形による判定を用いること、強い眠気を検出するに当たって好ましいと言える。
自覚眠気・覚低走行状態検出手段623も、自覚眠気又は覚低走行状態が検出されたならば、入眠予兆現象検出手段621及び切迫睡眠現象検出手段622と同様に、運転者にそのことを知らせる警告(モニタへの表示、警告音の発生、運転席の振動など)を行うように制御する機能を有する。特に、自覚眠気や覚低走行状態は、上記したように、眠気又は意識レベルの低下によって注意力が低下している状態であり、これらの警告を確実に与えることにより、覚醒状態への復帰を促しやすい。また、自覚眠気や覚低走行状態は、上記したように、睡眠段階1に至る前の段階であり、音に対する反応率が0.9~1であることから、特に音で警告することが好ましい。自覚眠気・覚低走行状態検出手段623は、入眠予兆現象検出手段621や切迫睡眠現象検出手段622と同様に、その検出結果を常時あるいは定期的に通信回線を通じて管理用コンピュータに送信されるように設定されていてもよく、運行終了後に、それらのデータを管理用コンピュータで解析するようにしてもよい。
本実施形態によれば、入眠予兆現象検出手段621及び切迫睡眠現象検出手段622に加えて、自覚眠気・覚低走行状態検出手段623を有している。すなわち、入眠予兆現象や切迫睡眠現象のような認知困難(全く自覚しない場合はもとより、自覚したときには覚醒への回復が不可能になっている状態も含む)な生体状態を検出することができることに加えて、軽度眠気や強い眠気への抵抗状態である運転不適格と言える認知可能な生体状態を検出すること、並びに、瞬間的な覚低走行状態あるいは連続的な覚低走行状態を検出することができる。すなわち、一般的には、過労や睡眠不足で運転をしている場合には、自覚眠気が生じやすく、その後、入眠予兆現象が検出され、さらに切迫睡眠現象が検出され、そられの状態で警告が発生されて覚醒状態に復帰させることができない場合には、そのまま居眠り運転に至る。一方、良好な心身状態で運転をしている場合には、自覚眠気よりも覚低走行状態に陥りやすく、長時間の高速道路等における一定の走行により、覚低走行状態が瞬間的なものから連続的なものになり、それが繰り返されるうちに、この状態のなかで負のフィードバックがかかり、すなわち内分泌系の違う次元での制御がかかることにより、入眠予兆現象が現出され、その終末期の状態である切迫睡眠現象が検出され、上記と同様に居眠り運転に至る。また、自覚睡眠と覚低走行状態が組み合わさって繰り返され、やがて入眠予兆現象や切迫睡眠現象が検出される場合もある。もちろん、運転者の体調等により、入眠予兆現象や切迫睡眠現象が、自覚眠気や覚低走行状態の検出タイミングの必ず後に検出されるというものではなく、より早期に出現する場合もあり得る。
すなわち、本実施形態によれば、入眠予兆現象検出手段621及び切迫睡眠現象検出手段622に加えて、自覚眠気・覚低走行状態検出手段623を有していることにより、居眠りに至る前に経る生体状態変化がいずれのパターンであっても捉えることができ、運転時の生体状態を捉える装置として適している。
次に、恒常性維持機能レベル判定手段624について説明する。恒常性維持機能レベル判定手段624は、本実施形態の運転時生体状態判定装置60の起動後、生体信号測定装置1によってAPWの時系列波形の情報が所定時間以上得られると、車載のモニタに表示されるなどして出力される。恒常性維持機能レベル判定手段624は、恒常性維持機能のレベルを判定するものである。恒常性維持機能のレベルは、例えば、5~7段階に分け、恒常性維持機能の優れる場合(体調のよい場合や集中度合いの高い場合等)から、恒常性維持機能が劣る場合(体調の悪い場合、過緊張状態の場合、脇見運転等による集中力の低下等)を判定する(図27(a)及び図28(a)参照)。モニタに表示するに当たって、5~7段階のレベルを文字で表示しただけでは運転者は把握しにくい。そこで、例えば、中間レベル(体調が普通の状態)以上の場合には、一括して恒常性維持機能が優れる場合(体調のよい場合等)と判定し、それよりも下の場合には一括しての恒常性維持機能が劣る場合(体調の悪い場合等)判定し、それぞれについて、モニタに異なる色彩表示がなされるようにすれば、運転者に把握しやすくなる。
通常、恒常性維持機能が優れる場合、体調がよい反面、運転を頑張り過ぎる傾向があり、覚低走行状態に陥ることがあるため油断しないことが重要となり、恒常性維持機能が劣る場合には、覚低走行状態に加えて自覚眠気も生じやすいという注意を運転者に促すことができる。
恒常性維持機能レベル判定手段624は、出願人が先に提案したWO2011/046178公報に開示の技術に基づくものであり、分析演算手段61の周波数傾き演算手段612により得られるゼロクロス検出法を用いた各周波数傾き時系列波形の微分波形の正負、周波数傾き時系列波形を積分した積分波形の正負、ゼロクロス検出法を利用した周波数傾き時系列波形とピーク検出法を利用した周波数傾き時系列波形をそれぞれ絶対値処理して得られた各周波数傾き時系列波形の絶対値等のうち、少なくとも1つ以上を用いて判定する。これらの組み合わせにより、恒常性維持機能のレベルがいずれに該当するかを求める。例えば、周波数傾きと積分値を用いて、所定以上の場合に「恒常性維持機能レベル1」と判定し、あるいは、微分値が所定位置以下であって、かつ、2つの絶対値のうちの「ピーク優位」の場合に「恒常性維持機能レベル4」と判定するように設定できる。これらの組み合わせ、判定の際の閾値等は限定されるものではないが、本実施形態では多数の被験者のデータを統計処理して決定している。なお、個人毎に設定することもできる。また、恒常性維持機能レベル判定手段624では、本出願人の特開2009-22610号公報に開示されているような、周波数傾き時系列波形を絶対値処理して積分値を算出し、この積分値を疲労度として求める手段も設定されており、これにより、運転者の走行中の疲労度も出力される。例えば、疲労度に応じてモニタの所定の位置の画像の色を変色させたりして表示される。
恒常性維持機能のレベルの判定結果は車載のモニタ等に表示されていくが、上記した入眠予兆現象検出手段621、切迫睡眠現象検出手段622、自覚眠気・覚低走行状態検出手段623の各判定もこれと並列処理されて逐次行われている。従って、モニタには、恒常性維持機能のレベルの判定結果が表示されていく中で、入眠予兆現象や切迫睡眠現象の判定、自覚眠気や覚低走行状態の判定がなされると、モニタにはそれらを示す表示も現れる。あるいは、警告音が発せられたり、運転席の振動、その他の何らかの警告手段が動作する。なお、恒常性維持機能レベル判定手段624による恒常性維持機能のレベルの判定結果も、常時あるいは定期的に通信回線を通じて管理用コンピュータに送信されるように設定されていてもよく、運行終了後に、それらのデータを管理用コンピュータで解析するようにしてもよい。
初期疲労判定手段625は、運転開始時における運転者の初期疲労の有無を判定する。初期疲労の判定には、恒常性維持機能レベル判定手段624における判定結果を用いる。恒常性維持機能レベル判定手段624は、上記したように、運転者の恒常性維持機能レベル(体調の良し悪しの総合判定)を逐次判定している。そこで、この判定結果を利用して、運転者が運転開始時に既に疲労が蓄積している状態か否かを判定する。運転開始時において既に疲労が蓄積している場合、サーカディアンリズムによる24時間周期の眠気、サーカセミディアンリズムによる12時間周期の眠気、ウルトラディリズムによる2時間周期の眠気に特に注意するように促すため、それらのタイミングで休憩をするメッセージや警告を出力するようにする。初期疲労の有無は、次のように判定する。恒常性維持機能レベル判定手段624における恒常性維持機能レベルは、通常、生体ゆらぎに伴って恒常性維持機能レベルも時間経過と共に上下に変動しながら進行する。しかし、疲労状態にある場合には、この生体ゆらぎが小さくなる。従って、恒常性維持機能レベルがいずれかのレベルで、例えば、恒常性維持機能レベル1の状態、恒常性維持機能レベル4の状態等のまま所定時間進行する。そこで、このような生体ゆらぎのない状態が所定時間継続する場合、すなわち同一判定レベルが所定時間以上継続している場合に、初期疲労「有り」と判定する。(図27(a)はその一例を示したものであり、運転開始直後から同一の恒常性維持機能レベルの継続時間が長い。従って、この被験者の場合、この継続時間が設定の継続時間以上である場合には、初期疲労「有り」と判定される。
なお、初期疲労判定手段625は、運転開始時において運転者の初期疲労の有無を判定し、数時間後の休憩が特に必要な状態か否かを判定するために利用されるものであり、運転初期(但し、恒常性維持機能レベル判定手段624の判定結果を利用するため、恒常性維持機能レベル判定手段624が稼働した後から数分から十数分)に稼働する。
判定検出手段62は、さらに、気分判定手段626及び履歴利用生体状態判定手段627を有することが好ましく、これらは、コンピュータプログラムである気分判定手順及び履歴利用生体状態判定手順を実行することにより機能する。
気分判定手段626は、運転開始後所定時間経過までの運転初期における分析演算手段61から得られる自律神経制御に関連する指標から交感神経系及び副交感神経系の出現バランスを求め、この出現バランスを所定の基準により判定して、運転者の運転初期の生体状態を求める手段である。
上記した入眠予兆現象検出手段621、切迫睡眠現象検出手段622、自覚眠気・覚低走行状態検出手段623及び恒常性維持機能レベル判定手段624は、分析演算手段61により周波数傾き時系列波形や分布率等を用いるが、周波数傾き時系列波形や分布率等を求めるには、所定時間以上のAPWの原波形データが必要であり、乗車後数分程度経過しないと求めることができない。そこで、気分判定手段626は、図16に示したように、分析演算手段61の上記のピーク検出法を用いた周波数変動演算手段613の演算結果である周波数変動時系列波形を最小二乗法で処理することで周波数の傾きを求め、それにより、交感神経機能と副交感神経機能の出現バランスを判定する。すなわち、最小二乗法により得られた傾きが正方向に所定値(X1)以上の場合を交感神経機能の亢進した状態(例えば、「気分上々」)と判定し、負方向に所定値(-X2)以下の場合を交感神経機能と副交感神経機能のバランスの悪い状態(例えば、「気分鎮静」)と判定し、両者の中間(-X2とX1の間)の場合には交感神経機能と副交感神経機能の出現バランスがとれている状態(例えば、「気分爽々」)と判定する。
気分判定手段626は、この「気分上々」、「気分鎮静」あるいは「気分爽々」をモニタに出力するなどして、運転者に知らせる機能を有する。運転初期においては、運転していない状態から新たに運転環境下におかれるという状況変化を伴うが、この運転環境への対応能力が人により異なり、あるいは同一人であっても、その日の体調や前日の睡眠時間等によって異なり、対応能力によってその後の疲労の進行具合も変化する。しかし、運転初期におけるまだ緊張状態の中で、運転者がそのときの自らの状態を自覚することで、その後の運転への集中度の向上が期待できる。なお、気分判定手段625は、運転開始時において運転者の生体状態を簡易な手法で判定するものであるため、運転開始後所定時間経過までの初期においてのみ稼働する。その後は、上記した入眠予兆現象検出手段621、切迫睡眠現象検出手段622、自覚眠気・覚低走行状態検出手段623及び恒常性維持機能レベル判定手段624により、逐次運転者の生体状態の変化が検出される。
履歴利用生体状態判定手段627は、上記した入眠予兆現象検出手段621、切迫睡眠現象検出手段622、自覚眠気・覚低走行状態検出手段623及び恒常性維持機能レベル判定手段624の判定結果としての履歴情報を利用して、運転者の生体状態を判定する。これらの判定結果は、コンピュータからなる本実施形態の運転時生体状態判定装置60の記憶部(車載されているコンピュータの記憶部、遠隔地の管理コンピュータの記憶部のいずれでもよい)に逐次記憶されており、履歴利用生体状態判定手段627は、それらの情報を逐次読み込むように構成されている。履歴利用生体状態判定手段627は、例えば、恒常性維持機能レベルが6段階表示となっており、そのうち、レベル1~3が普通から良好な状態、レベル4~6が注意を要する状態と判定される場合、レベル4~6の継続時間に応じて履歴ポイントA(注意点)を時系列に付与する。恒常性維持機能レベルは、例えば、数秒に1ポイントずつプロットされるように設定されている場合、そのレベルのポイント数をカウントすることで計測できる。また、入眠予兆現象検出手段622や切迫睡眠現象検出手段623によって入眠予兆現象又は切迫睡眠現象が検出されたならば、履歴ポイントB(喝点)を時系列に付与する。さらに、自覚眠気・覚低走行状態検出手段623によって自覚眠気や覚低走行状態が検出されたならば、履歴ポイントC(警告点)を時系列に付与する(図17参照)。
そして、履歴ポイントA~Cの時系列の変化が所定の状態の場合には、上記した入眠予兆現象、切迫睡眠現象、自覚眠気や覚低走行状態が検出された場合の警告や恒常性維持機能のレベル判定結果による警告とは別途に警告を出力させる。どのような状態で警告を出力するかは任意に設定できるが、例えば、図17に示したように、恒常性維持機能のレベルでの履歴ポイントAが多い状態から、自覚眠気・覚低走行状態検出手段623の判定結果に基づく履歴ポイントCが所定以上に増加し、さらに、入眠予兆現象検出手段621や切迫睡眠現象検出手段622の判定結果に基づく履歴ポイントBも所定以上に増加したならば、一般には長時間運転によって相当の疲労の蓄積が生じており、即座に休憩を要すると考えられるため、強度の警告を出力するように設定する。
以上のように、本実施形態によれば、運転者の生体状態を、居眠りに至るまでに経る生体状態の変化を多面的に捉えている(入眠予兆現象、切迫睡眠現象、自覚眠気、覚低走行状態)。また、これらを常にチェックすると共に、従来本出願人により実施されている恒常性維持機能レベルをチェックする手段を併用し、それらの情報を履歴情報として取得してこの履歴情報を用いて運転者の生体状態を判定している。従って、運転者の生体状態を従来よりも高い精度で捉えることができ、運転時の生体状態の判定に好適である。
なお、判定結果を車載の装置に出力するように設定することも可能であるが、判定結果を運行管理者のコンピュータに適宜の通信網を介して送信する構成とすることもできることは上記した通りである。その場合、運行管理者は遠隔地であっても、運転者の生体状態を把握でき、より適切な運行管理に役立つ。また、トラック、バス、タクシーなどの運行会社において、所定の運行が完了した後に、運転者の判定結果をさらに解析することができる。例えば、上記した判定結果を日々蓄積することで、当該運転者がどのような条件で自覚眠気、覚低走行状態、入眠予兆現象、切迫睡眠現象に至るかといったことを判定でき、そのことを運転者に自覚させたり、運転者の体調管理に用いることもできる。
(実験例1)
(自覚眠気・覚低走行状態検出手段623(第2自覚眠気・覚低走行状態検出手段623b)による運転時自覚眠気の検出)
実車アイドリング状態で覚醒から自覚眠気発生に至るまでの生体評価(静的実験)と、実車走行中の自覚眠気発生時の生体評価(動的実験)を行った。
静的実験は60分間で、計測指標はAPWと自覚眠気に対する主観評価であった。APWは実験中連続して計測し、主観評価は実験開始前と実験開始以降5分経過毎に評価した。主観評価には視覚的アナログ尺度(Visual Analog Scale)を用いた。また、実験中は寝てはいけないと被験者に指示を与えた。被験者は事前の実験に対する説明と十分な実験への理解の上で合意を得た20~30歳代の健康な男性8名であった。動的実験では、分布率の計算上、計測時間が30分以上のデータ89例を対象に評価を行った。自覚眠気の評価は、それが発生したタイミングで計測装置のモニタを押すこととした。なお、計測装置は国土交通省の定める乗用車等の運転者の視界基準に基づくこと、かつ手の届く範囲に設置した。APWの解析は、第2自覚眠気・覚低走行状態検出手段623bにより、周波数傾き時系列波形を周波数解析し、上記した3つの周波成分の分布率を算出して行った。なお、分布率のピーク点の検出は、12点の平滑化微分を用いた。
・静的実験結果
図18(a)は、静的実験で計測したAPWの分布率の時系列波形の結果を示す。被験者8名の中で7例は眠気発生付近で疲労受容信号(0.0035Hz)が卓越していたが、いずれも、機能調整信号(0.0017Hz)、疲労受容信号(0.0035Hz)及び活動調整信号(0.0053Hz)の分布率のピーク値の出現が、次の関係:活動調整信号≦機能調整信号≦疲労受容信号を満たすものではなかった(図13、図14参照)。
図18(a)は、静的実験で計測したAPWの分布率の時系列波形の結果を示す。被験者8名の中で7例は眠気発生付近で疲労受容信号(0.0035Hz)が卓越していたが、いずれも、機能調整信号(0.0017Hz)、疲労受容信号(0.0035Hz)及び活動調整信号(0.0053Hz)の分布率のピーク値の出現が、次の関係:活動調整信号≦機能調整信号≦疲労受容信号を満たすものではなかった(図13、図14参照)。
・動的実験結果
図18(b)は、動的実験で計測したAPWの分布率の時系列波形の結果を示す。自覚眠気発生時の直前に、機能調整信号(0.0017Hz)、疲労受容信号(0.0035Hz)及び活動調整信号(0.0053Hz)の分布率のピーク値の出現が、次の関係:活動調整信号≦機能調整信号≦疲労受容信号を満たしている(図13、図14参照)。
図18(b)は、動的実験で計測したAPWの分布率の時系列波形の結果を示す。自覚眠気発生時の直前に、機能調整信号(0.0017Hz)、疲労受容信号(0.0035Hz)及び活動調整信号(0.0053Hz)の分布率のピーク値の出現が、次の関係:活動調整信号≦機能調整信号≦疲労受容信号を満たしている(図13、図14参照)。
なお、解析対象である89例中に自覚眠気が発生した点とその付近にAPW分布率による自覚眠気を検出した場合のカイ二乗検定の結果は、上記したように図15(b)に示したとおりであり、正答率は77%、p=2.09×10⁻⁹であった。
図18(a),(b)及び図15(b)の結果より、運転中の自覚眠気の検出が、APWの超低周波成分の分布率のピーク優位性とその出現順序に関連があることがわかる。しかし、静的実験では、動的実験のような所定の出現順序とはならなかったことから、静的な状態と動的な状態では生体の反応は異なる。これは、運転という状況が、眠気に激しく抵抗する必要があること、外的刺激が多いこと、集中しやすい環境であることといった静的状態とは異なる環境にあるためと考えられ、本発明の手法が、運転時の生体状態の判定に適していることがわかる。
また、自覚眠気・覚低走行状態検出手段623により、上記した動的実験の89例における周波数傾き時系列波形について、図19(a)に示したように、振幅値が所定の設定した範囲になり、かつ周期が所定の設定した範囲に短周期化する場合をさらに検出した。これらの多くは、走行後の各被験者のコメントとして、「ボーっとしていた」、「意識が遠くにいっていた」などのコメントが残っているデータ(覚低走行状態の可能性があるデータ)である。この周波数傾き時系列波形による自覚眠気又は覚低走行状態の検出結果と、上記した分布率による自覚眠気の検出結果とを併せて評価したカイ二乗検定の結果が図19(b)であり、自覚眠気又は覚低走行状態の未検出数が4件となった(図15(c)参照)。このことから、APWの分布率における所定周波数成分の出現順序を捉えることに加えて、周波数傾き時系列波形の低振幅かつ周期が短くなることを捉えることは、自覚眠気又は覚低走行状態の検出に有効であることがわかる。
(実験例2)
(周波数傾き時系列波形を用いた入眠予兆現象検出手段621による入眠予兆現象の検出)
周波数傾き時系列波形における発散傾向が現れるタイミングと入眠予兆現象の関係について検証実験を行った。実験は、光学式指尖容積脈波計を用いて採取した指尖容積脈波の解析と本発明におけるAPWの解析の両方について行った。なお、被験者を様子を視察するためのカメラも併用した。
(周波数傾き時系列波形を用いた入眠予兆現象検出手段621による入眠予兆現象の検出)
周波数傾き時系列波形における発散傾向が現れるタイミングと入眠予兆現象の関係について検証実験を行った。実験は、光学式指尖容積脈波計を用いて採取した指尖容積脈波の解析と本発明におけるAPWの解析の両方について行った。なお、被験者を様子を視察するためのカメラも併用した。
実験条件は静的状態とし、実験時間は60分で、実験終了まで覚醒状態を維持することを前提にした。被験者は20~30歳代の健常な男性9名、女性1名である。
図20(a)は1名の被験者の指尖脈波のパワー値傾き時系列波形を示す。図中40分~45分は官能評価に基づく最も眠気が増大した時間帯を示す。また、眠気が増大した時間帯の前に振幅が増大(aからbへと増大)、周期が長くなる(fが長周期化)ことから、破線部が入眠予兆であることが示唆された。
図20(a)は1名の被験者の指尖脈波のパワー値傾き時系列波形を示す。図中40分~45分は官能評価に基づく最も眠気が増大した時間帯を示す。また、眠気が増大した時間帯の前に振幅が増大(aからbへと増大)、周期が長くなる(fが長周期化)ことから、破線部が入眠予兆であることが示唆された。
図20(b)はAPWの周波数傾き時系列波形を示す。図中破線部領域は眠気が増大する前に発散する傾向が現れ、図2の破線部とも時間的タイミングが一致することから入眠予兆であることが示唆される。指尖脈波のパワー値傾き時系列波形とAPWの周波数傾き時系列波形は交感神経活動と関連していることから、波形の振幅が発散している間は交感神経活動の亢進が起こっていると考えられる。この交感神経活動の亢進は眠気に対する抵抗として発生していると考えられる。
図21(a),(b)は、図20(a),(b)における眠気ピーク到達前25分間、到達後25分間に対してそれぞれ周波数解析を行った結果を示す。図21(a)は指尖脈波パワー値傾き時系列波形の周波数解析結果であり、眠気がピークに達する前後の比較を示す。眠気がピークに達した後、スペクトルが低下する傾向が得られた。図21(b)はAPWの周波数傾き時系列波形の周波数解析であり、眠気がピークに達する前後の比較を示す。指尖容積脈波と同様、スペクトルの振幅が低下する傾向が得られた。また、発散波形を含んだ眠気ピーク前の周波数解析においてピークが0.0033Hz付近に発生していることから発散波形は0.0033Hz付近の成分を含んでいると考えられ、入眠予兆との関連が示唆される。
図22には被験者数10名の指尖容積脈波とAPWにおける覚醒と入眠予兆に関する2×2クロステーブルを示す。
カイ二乗検定の結果、P値が0.05以下であることから統計的に有意であり、指尖容積脈波とAPWとの間に関連性がある可能性が示唆された。これらのことからAPWの周波数傾き時系列波形における発散傾向が入眠予兆現象を示すものと考えられる。図23に実車走行中に採取したAPWの周波数傾き時系列波形と眠気の有無の相関を示したデータの一例である。図23の発散傾向は、上記した静的状態で行った記録と同様の傾向を示しているため、実車走行中においても、APWの周波数傾き時系列波形の発散現象を検出することにより入眠予兆現象を特定できることがわかる。
カイ二乗検定の結果、P値が0.05以下であることから統計的に有意であり、指尖容積脈波とAPWとの間に関連性がある可能性が示唆された。これらのことからAPWの周波数傾き時系列波形における発散傾向が入眠予兆現象を示すものと考えられる。図23に実車走行中に採取したAPWの周波数傾き時系列波形と眠気の有無の相関を示したデータの一例である。図23の発散傾向は、上記した静的状態で行った記録と同様の傾向を示しているため、実車走行中においても、APWの周波数傾き時系列波形の発散現象を検出することにより入眠予兆現象を特定できることがわかる。
(実験例3)
(周波数傾き時系列波形を用いた切迫睡眠現象検出手段622による切迫睡眠現象の検出)
周波数傾き時系列波形における収束傾向が現れるタイミングと切迫睡眠現象の関係について検証実験を行った。
(周波数傾き時系列波形を用いた切迫睡眠現象検出手段622による切迫睡眠現象の検出)
周波数傾き時系列波形における収束傾向が現れるタイミングと切迫睡眠現象の関係について検証実験を行った。
実験は、座位と臥位の2姿勢で、眠気に抵抗している状態から、眠気を受け入れ、昼寝に相当する睡眠に入るまでの睡眠実験を行った。被験者は20歳代から50歳代の健常な男性56名(31.3±8.2歳)である。比較指標として脳波、心電図、指尖容積脈波を用い、これを本発明における計測指標であるAPWと比較した。実験開始30分間は覚醒状態の維持を被験者に義務付け、その後はこの義務を解除し、各自の自由意志に任せた。
図24は24歳男性被験者の睡眠実験の結果を示す。被験者は、「最初の10分間は覚醒状態を保っていたが、以降は眠気に抵抗しながら、辛うじて覚醒状態を保っていた。覚醒状態の維持の義務から外れる30分以降は眠気への抵抗をやめ、早い段階で睡眠に移行した。」という見解を示した。
図24(a)は脳波のθ波、α波、β波の分布率を示す。θ波が増加し、α波が減少し、両波が安定的に推移し始めた40分を入眠点とした。図24(b)は指尖容積脈波をウェーブレット解析し、求めた交感神経(LF/HF)と副交感神経(HF)の活動レベルを示す。HFは40分過ぎから安定して高い状態を維持し、LF/HFは安定的に低い数値を示し、入眠点は実験開始後40分頃と考えられる。図24(c)は指尖容積脈波に傾き時系列解析を施し求めた、パワー値の傾き時系列波形と最大リアプノフ指数の傾き時系列波形を示す。30分までは低周波、大振幅の入眠予兆現象を示し、30分以降は、低振幅で長周期化する収束傾向となり、ここでも40分前後で睡眠状態に移行したと考えられる。図24(d)はAPWのゼロクロス検出法による周波数傾き時系列波形と周波数変動時系列波形を示す。周波数変動時系列波形から、30分から40分の10分間に、APWの周波数が1.15Hzから1Hzに大きく変化していることがわかる。従って、実験開始30分間は覚醒状態にあり、実験開始後30分から35分頃に、睡眠状態に移行したものと考えられる。周波数傾き時系列波形では、30分以降は、指尖容積脈波のパワー値の傾き時系列波形と同様に、低振幅で長周期化する収束傾向となっている。従って、周波数傾き時系列波形の収束傾向のタイミングを検出することで、入眠点の直前の切迫睡眠現象を検出できることがわかる。
以上の結果は、被験者の見解と一致している。
以上の結果は、被験者の見解と一致している。
ここで、実験開始30分間を眠気に抵抗しながら、覚醒を維持した状態(眠気抵抗状態)とし、後半30分間は眠気を受け入れ、睡眠に入った状態(睡眠状態)として、両者の状態の差を検証した。図25(a),(b)は、眠気抵抗状態の周波数解析結果を示し、図26(a),(b)は、睡眠状態の周波数解析結果を示す。指尖容積脈波とAPWの各傾き時系列波形の周波数解析結果は、眠気抵抗状態、睡眠状態ともに同じ傾向を示している。睡眠状態のスペクトルの傾きは1/fに近く、副交感神経優位のリラックスした状態であると考えられる。一方、眠気抵抗状態のスペクトルの傾きは、1/f2に近くなり、睡眠状態のスペクトルの傾きと異なる角度を示す。これは、眠気に抵抗することによる、交感神経活動の亢進によるものだと考えられる。
次に、指尖容積脈波とAPWの各傾き時系列波形のスペクトルの傾きを用い、被験者56名の状態を判定した。指尖容積脈波とAPWのスペクトルの傾きによる状態の判定は、図25、図26中に示す、スペクトルの傾きの角度θを用いた。スペクトルの傾きは、機械的に処理される場合の傾向を加味して、1/f の傾き角度である45度に+9度を補正した54度を基準値とした。すなわち、54度未満を睡眠状態とし、54度以上を眠気抵抗状態とした。判定結果の合否は、脳波、自律神経系の活動レベル、被験者のコメントと比較することで決定した。
APWのスペクトルの傾きを用いた状態判定結果は、眠気抵抗状態は82%、睡眠状態は79%とともに高い正答率を示した。指尖容積脈波のスペクトルの傾きを用いた状態判定結果は、眠気抵抗状態は74%、睡眠状態は62%と、APWによる判定結果と比べ、やや低い正答率となった。末梢循環系の動態を捉える指尖容積脈波は、外部刺激の影響を受けやすいが、APWは中枢系の動態を捉えているため、外部刺激の影響は受けにくい。つまり、APWは、心循環系のゆらぎを安定して捉えられるため、指尖容積脈波に比べ、正答率が高くなったと考えられる。
これらのことから、APWの周波数傾き時系列波形の振幅、周期が所定の基準値に対して発散しその後収束傾向を示すか否かは、睡眠状態に至る前の眠気抵抗状態(入眠予兆現象及び切迫睡眠現象)を示していることがわかる。従って、APWの周波数傾き時系列波形を用いて、実験例2において説明したように発散傾向から入眠予兆現象を検出すること、並びに、本実験例3のように収束傾向から切迫睡眠現象を検出することは有効であると言える。
(実験例4)
(長距離走行時の実証実験)
上記実施形態の生体信号測定装置1をトラックの背もたれに装着し、トラック運転手による長距離走行時の実証実験を行った。運行後は、運行当時の自身の体調に関するアンケートを行った。被験者は運送業に従事する20~50歳代までの職業運転手(男性9名)で、全被験者の祖運行回数は91回であった。図27は30歳代男性被験者の判定結果を示し、図28は、40歳代男性被験者Bの判定結果を示す。各図の(a)は、恒常性維持機能レベル判定手段624の判定結果である恒常性維持機能レベルを示しており、(b)~(d)は、履歴利用生体状態判定手段627の判定結果を示している。(b)は、入眠予兆現象検出手段622及び切迫睡眠現象検出手段623によって入眠予兆現象又は切迫睡眠現象が検出された履歴ポイントB(喝点)、及び、自覚眠気・覚低走行状態検出手段623によって自覚眠気や覚低走行状態が検出された履歴ポイントC(警告点)の履歴を示している。(c)は、恒常性維持機能レベル判定手段624により、恒常性維持機能レベルが注意を要する状態と連続判定された場合の回数を時間に応じて履歴ポイントA(注意点)として示したものである。(d)は、注意点、警告点及び喝点の回数を縦軸にとって時間経過と共に棒グラフで示し、かつ、その変化傾向を曲線で示したものである。
図27に示した男性本被験者Aの場合、8時に事業所を出発し、10時より12時まで別の事業所で事務作業及び屋外作業を行い、12時20分より運行を再開している。途中13時から30分間昼休憩を取っている。運行結果グラフの図中(ア)(イ)に示す12時30分から13時における注意点の連続による疲労感の増大、図中(ウ)(エ)に示す15時から16時の警告点の連続と喝点の出現があった。これは、男性被験者Aの運行後の聞き取り内容とも一致した。また、図27中の曲線(オ)(カ)は疲労度合を示し、男性被験者Aは業務が終了する15時前後が危険な状態である可能性が高い。
図28に示した男性被験者Bの場合、図中(キ)(ク)で疲労感の増大、図中(ケ)(コ)で疲労による危険な状態が出現している時間帯を捉えている。このように眠気の出現や疲労の進行度合を指標化することにより、疲労度合から危険な状態になる時間帯が推測できた。
従って、このような判定結果を管理者のコンピュータにより解析することにより、各運転者の疲労度合いや危険な状態となるタイミングを把握することができ、業務管理を行うのに適している。
従って、このような判定結果を管理者のコンピュータにより解析することにより、各運転者の疲労度合いや危険な状態となるタイミングを把握することができ、業務管理を行うのに適している。
なお、上記した分析演算手段61の各種演算結果、判定検出手段62の各種判定結果について、管理者側のコンピュータでさらに解析して業務管理を行う場合、例えば、運転者別に図27及び図28に示したようなデータを表示できるようにして管理することができる。この場合、図29に示したように、さらに詳細な体調マップも併せて表示することで、運転者の状態をより詳細に管理できる。
図29は、30歳代男性被験者CのAPWの時系列波形から求めたもので、運行中の体調の状態を、本出願人が特願2011-108909号等として提案した定量化手法により体調マップ及び感覚応答マップとして表したものである。これは、採取したAPWを周波数分析し、対象となる解析区間について、解析波形を両対数軸表示に表し、その解析波形を低周波帯域、中周波帯域、高周波帯域に分け、区分けした解析波形の傾きと、全体の解析波形の形とから一定の基準に基づいて解析波形の点数化を行い、それを座標軸にプロットしたものである。体調マップは、自律神経系の制御の様子を交感神経と副交感神経のバランスとして見たものであり、感覚応答マップは、体調マップに心拍変動の変化の様子を重畳させたものである。13運行分を週別、体調別(アンケート回答に基づく)にそれぞれまとめたものである。下段は運行後の体調に関するアンケート結果を示し、この被験者は実施期間の前半の体調は悪化傾向、後半は回復傾向であったと感じている。
週別のグラフにおいて、体調マップが1週目はハツラツ(集中・高揚・イライラ)、ヘトヘト(だるい、憂鬱)を中心とした右肩上がりの分布(サ)から、3週目のユウユウ(リラックス)を中心とした右肩下がりの分布(シ)へと変化している。これを体調別で分類すると、「好調」「普通」回答群は右肩下がりでユウユウ、リラックスに向かって分布が広がっている(ス、セ)。これは心身ともにリラックス傾向にあり、楽に運転できていることが示唆される。一方、「不調」「絶不調」回答群は、体調マップは右肩上がりでハツラツ、ヘトヘトを中心とし、ユウユウの分布が少なく(ソ)、感覚マップは「好調」「普通」群に比べて高揚の分布が多くなり、リラックス方向への広がりが小さくなり、興奮から鎮静へ急降下していることがわかる(タ)。なお、他の運転手についても同様の結果であった。
このようにして業務管理を行うことで、適切な運行管理に貢献できる。もちろん、これはあくまで一例であり、業務管理内容はこれに限られるものではない。例えば、後述の実験例5の覚醒状態及び睡眠状態の様子について併せて管理することもできるし、さらに、個人別に限らず、道路別、期間別、季節別等に区分けするなどして、様々な面から解析できる。
(実験例5)
(周波数変動時系列波形を用いた覚醒状態と睡眠状態の検出)
周波数変動演算手段613により得られたピーク検出法による周波数変動時系列波形とゼロクロス検出法による周波数変動時系列波形との乖離度を比較し、覚醒状態と睡眠状態とを判定できるか否かの検証実験を行った。
(周波数変動時系列波形を用いた覚醒状態と睡眠状態の検出)
周波数変動演算手段613により得られたピーク検出法による周波数変動時系列波形とゼロクロス検出法による周波数変動時系列波形との乖離度を比較し、覚醒状態と睡眠状態とを判定できるか否かの検証実験を行った。
覚醒状態と睡眠状態の生体信号を測定するため、仰臥位で睡眠導入実験を行った。被験者は20~30歳代の健常な男性11名である。APWと同時に指尖容積脈波、脳波、頤筋筋電図を測定した。APWを測定するための生体信号測定装置1は被験者の背部とベッドの間に配置した。測定時間は60分間とし、測定開始から30分間は、被験者に眠らないように指示し、5分経過ごとに眠さの度合いを評価した。30分経過後の睡眠は被験者の自由意志とした。
覚醒状態及び睡眠状態の判断は、被験者の観察、脳波、頤筋筋電図から行った。図30(a)に、覚醒状態及び睡眠状態それぞれ6分間の指尖容積脈波の周波数スペクトルを示す。睡眠状態では覚醒状態に比べ、卓越周波数が低いことが分かる。11人中11人の被験者で同様の結果が得られた。
図30(b)に、覚醒状態及び睡眠状態それぞれ6分間のAPWの周波数スペクトルを示す。睡眠状態では覚醒状態に比べ、卓越周波数が低いことが分かる。11人中11人の被験者で同様の結果が得られた。以上のことから、指尖容積脈波とAPWそれぞれの周波数スペクトルの卓越周波数は一致していることが分かる。
図30(c)に、APWのピーク点とゼロクロス点の周波数変動時系列波形を示す。覚醒状態及び睡眠状態それぞれの6分間において、ピーク点とゼロクロス点の波形の面積の差を算出し、波形の乖離度として評価した。睡眠状態では覚醒状態に比べ、乖離度が減少していることが分かる。11人中10人の被験者で同様の結果が得られた。
指尖容積脈波とAPWの周波数スペクトルの卓越周波数は一致することから、指尖容積脈波と同様に、APWでも心拍変動を捉えられることが示唆される。また、両者の周波数スペクトルの卓越周波数とAPWの周波数変動は、覚醒状態よりも睡眠状態のほうが低く、このことは、睡眠状態では心拍数が低下することと一致しており、本実験の指尖容積脈波及びAPWの測定が正しく行えたことを示す。
睡眠状態では覚醒状態に比べ、ピーク点とゼロクロス点の周波数変動時系列波形の乖離度が減少することが分かった。ゼロクロス点の周波数変動が交感神経活動を捉えているとすると、睡眠状態では交感神経活動の低下の影響を受け、周波数は低下したと考えられる。ピーク点の周波数変動が交感神経活動と副交感神経活動を捉えているとすると、睡眠状態では交感神経活動の低下かつ副交感神経活動の亢進の影響を受け、周波数はゼロクロス点よりも大きく低下したと考えられる。その結果、ピーク点とゼロクロス点の周波数変動時系列波形の乖離度が減少したと考えられる。
このことから、APWのピーク点とゼロクロス点の周波数変動時系列波形の乖離度を評価することにより、すなわち、所定の基準値よりも乖離しているか否かを設定することにより覚醒及び睡眠状態を推定できる。従って、これを利用し、予め覚醒状態と睡眠状態との乖離度のデータを複数取得し、それらから閾値を設定することで、上記したように、覚醒状態か睡眠状態か否かを自動判定できる。運転中に睡眠に陥ることはないのが通常であるが、万一の場合の検出に役立てることができるし、管理者が運行後、運転者がいつどの程度仮眠をとったかを把握、解析するのに利用できる。
なお、指尖容積脈波とAPWの周波数スペクトルを比較すると、APWの周波数スペクトルには0.6Hz近傍にもスペクトルのピークがあり、睡眠状態よりも覚醒状態で高いスペクトルを示した。このように、APWは指尖容積脈波にはない情報を含有しており、指尖容積脈波よりも覚醒状態及び睡眠状態の推定に有効であることが示唆される。以上のことから、APWのピーク点とゼロクロス点の乖離度と、0.6Hz近傍のスペクトルには関連があるのではないかと考えられる。図31は、図30(c)に示すAPWのピーク点とゼロクロス点の乖離度と、図30(b)に示すAPWの0.6Hz近傍のスペクトルの増加、減少傾向が同一になるかを調べた結果である。カイ二乗検定の結果は、p=0.041(p<0.05)であり、APWのピーク点とゼロクロス点の乖離度と、0.6Hz近傍のスペクトルには関連があることが示唆され、APWのデータを用いることが有効であることがわかる。
(実験例6)
(自覚眠気(覚低走行状態)、入眠予兆現象、切迫睡眠現象の過程に至る際に生じる交感神経活動の亢進に関する考察)
図32は、20歳代の健常な男性被験者の睡眠実験の結果を示した図である。睡眠実験の実験方法は実験例5と同様である。
(自覚眠気(覚低走行状態)、入眠予兆現象、切迫睡眠現象の過程に至る際に生じる交感神経活動の亢進に関する考察)
図32は、20歳代の健常な男性被験者の睡眠実験の結果を示した図である。睡眠実験の実験方法は実験例5と同様である。
図32(a)に示した脳波計のデータから求めた睡眠段階を示し、図32(b)に脳波計のデータから求めたα波、β波、θ波の分布率を示す。これらの結果から、この被験者は、試験開始後15分頃まで、25分~40分頃まで、覚醒と睡眠段階1との間を行ったり来たりしている。自己申告でも5分前後で眠気を申告し、20分では会話をして眠気が少し収まったと申告している。そして、40分頃から睡眠に入っている。
これを図32(c)の指尖容積脈波のパワー値の傾き時系列波形に照らすと、35分頃まで大振幅の波形が見られ、入眠予兆現象が生じており、40分前後から振幅が小さくなって切迫睡眠現象が出現したことがわかる。
図32(d)の心拍変動の解析結果では、374秒、1490秒のところでLF/HFのピークがあり、交感神経活動の亢進があることがわかる。その後、437秒、824秒のところでHFのピークがあり、副交感神経活動が賦活していることがわかる。従って、このグラフによっても上記時間帯において入眠予兆現象、切迫睡眠現象が発現したことがわかる。
図32(e)~(h)はAPWの解析結果であり、いずれも入眠予兆現象から切迫睡眠現象を経て40分前後で入眠していると判定できる。例えば、(e)のゼロクロス傾きの時系列波形を見ると、5~20分前後、25~32分前後において波形の発散傾向が見られ、これが入眠予兆現象を示し、35~40分前後では、波形の振幅が小さくなって収束し、その後周期が長周期化しており、切迫睡眠現象が生じていることがわかる。従って、40分過ぎには入眠に至っている。
この被験者の睡眠実験における動向は上記のとおりであるが、覚醒と睡眠段階1との間で行ったり来たりしている時間帯は、自己申告からもわかるように自覚眠気を感じている。あるいは、目は開いているものの意識レベルが低下していて運転はしていないが覚低走行状態と同様の状態にある。そこで、この時間帯の中で、交感神経活動が亢進している374秒から所定時間帯について詳細な解析を行った。
図33は、374秒から25秒間の各種生体信号の波形を示し、(a)は指尖容積脈波の原波形、(b)は指尖容積脈波の二階微分波形、(c)はAPWの原波形、(d)はAPWの二階微分波形、(e)は心音の原波形である。APWの波形は、いずれも、378秒から10秒間前後の波形の乱れが見られる。これは心音の原波形でも同様である。この間に自覚眠気(覚低走行状態に相当)を感じ、交感神経活動の亢進が生じたと推定される。但し、指尖容積脈波の波形は、それよりも数秒遅れて乱れが生じている。
そこで、APWをさらに詳細に検討した。図34(a)はAPWの378秒から30秒間の原波形を示す。このうち、波形の乱れの大きい382~388秒の6秒間(図では「4~10sec」と表示)を含む378~392秒の14秒間(図では「0~14sec」と表示)と、振幅及び周期共に安定している396.1~402.1秒の6秒間(図では「18.1~24.1sec」と表示)を含む396.1~406.1秒の14秒間(図では「14.1~28.1sec」)について周波数解析を行って比較した。
(b)は「0~14sec」と「14.1~28.1sec」の各14秒間の2つの周波数解析用計算区間の原波形を重ねて示した図であり、そのうちの「4~10sec」の6秒間と「18.1~24.1sec」の6秒間との間で位相のずれ(両者の差分(時相差))が大きいことがわかる。従って、このような位相のずれは交感神経活動の亢進を示すものである。(c)は14秒間の2つの周波数解析用計算区間においてフーリエ変換して実数だけをとって示した図であり、1Hz付近を除いて、0.4~0.6Hz付近、1.2~2Hz付近において違いがあることがわかる。すなわち、交感神経活動の亢進が生じた場合、1Hz付近ではピークが相対的に小さくなるが、0.4~0.6Hz付近、1.2~2Hz付近では逆にピークが相対的に大きくなる。
また、「4~10sec」の波形を周波数解析したものと、指尖容積脈波の周波数に対応する1Hz近傍の0.9~1.1Hzをフィルタリングしてから周波数解析したものとを比較した。(d)がその時系列での比較結果であり、(e)が周波数解析結果である。(d)から、フィルタリング後の3.4秒、4.2秒付近での上昇波形があり、(e)では、0.4~0.6Hz付近、1.2~2Hz付近においてピークがあり、APWにおいてこれらの周波数成分のピークを捉えることで交感神経活動の亢進を検出でき、そのタイミングから自覚眠気(覚低走行状態に相当)を検出できることがわかる。
図35は、(a)指尖容積脈波の原波形、(b)指尖容積脈波の二階微分波形、(c)APWの原波形、(d)APWの二階微分波形、(e)心音の原波形における378~392秒の14秒間(図では「4~18sec」と表示)と392~406秒の14秒間(図では「18~32sec」と表示)の波形同士の周波数解析結果を比較した図である。この図から、交感神経活動の亢進を示す0.4~0.6Hz付近、1.2~2Hz付近のピークは、(c)APWの原波形、(d)APWの二階微分波形において捉えられるが、指尖容積脈波では捉えられないことがわかる。従って、APWを検出波形として用いることは、交感神経活動の亢進から自覚眠気(覚低走行状態に相当)を検出するのに適している。
これらのことから、APWの検出波形を利用し、これを周波数傾き時系列波形として処理することの有効性がわかる。この点を詳述すると、まず、図32(d)から、の交感神経と副交感神経の増減の変化が約5~10分間の周期でおきていることがわかるが、この図で示される交感神経の亢進は、図33及び図34で示した指尖容積脈波やAPWの基線動揺や波形の乱れとして現れる。一方、APWのゼロクロス、ピークの傾き時系列波形の絶対値処理波形は、指尖容積脈波のウエーブレット解析による自律神経系の活動状態と一致している。しかし、APWの原波形の基線動揺や振幅、周期の増減だけを捉えようとすると、その瞬間の変動を微視的に見るだけになり、大きな傾向として、生体が覚醒に向かっているのか、あるいは睡眠に向かっているのかの判断が難しい。そこで、APWの原波形だけではなく、これを長周期化した波形であるAPWの周波数傾き時系列波形で捉えることが適切であり、それにより、指尖容積脈波やAPWの基線動揺や波形の乱れとして現れる自律神経系の活動状態をより正確に特定できる。すなわち、周波数傾き時系列波形という長周期化した大きな波形を捉えることで、負のフィードバックがかかっても体調変化に極めて僅かな作用しか及ぼさないような、あまり有効でない負のフィードバックに対するフィルターとしても機能する。換言すれば、自律神経系の活動はストレスに応じて逐一変化するが、ストレスに対する生体の対応はその自律神経活動の瞬間的な変化に応じて変わるものではない。ストレスに対する生体の状態変化は、自律神経活動の変化の蓄積によってもたらされるものである。従って、自律神経活動の瞬間的変化を逐一追跡しても生体の状態変化を正確に予測することはできない。自律神経活動の変化を大域的に捉えることで生体がストレスに対応していく傾向を精度よく捉えることができるのであり、そのためには周波数傾き時系列波形を用いることが適している。
本発明は、自動車の運転席に生体信号測定装置を配置して、運転者の生体状態を判定する場合に限らず、列車、航空機、船舶等の各種輸送機器の運転席ないしは操縦席に生体信号測定装置を配置して適用することができる。
1 生体信号測定装置
11 コアパッド
12 スペーサパッド
13 センサ
14 フロントフィルム
15 リアフィルム
60 運転時生体状態判定装置
61 分析演算手段
611 周波数演算手段
612 周波数傾き演算手段
613 周波数変動演算手段
614 分布率演算手段
615 変化度演算手段
62 判定検出手段
621 入眠予兆現象検出手段
622 切迫睡眠現象検出手段
623 自覚眠気・覚低走行状態検出手段
624 恒常性維持機能レベル判定手段
625 初期疲労判定手段
626 気分判定手段
627 履歴利用生体状態判定手段
11 コアパッド
12 スペーサパッド
13 センサ
14 フロントフィルム
15 リアフィルム
60 運転時生体状態判定装置
61 分析演算手段
611 周波数演算手段
612 周波数傾き演算手段
613 周波数変動演算手段
614 分布率演算手段
615 変化度演算手段
62 判定検出手段
621 入眠予兆現象検出手段
622 切迫睡眠現象検出手段
623 自覚眠気・覚低走行状態検出手段
624 恒常性維持機能レベル判定手段
625 初期疲労判定手段
626 気分判定手段
627 履歴利用生体状態判定手段
Claims (31)
- 運転席に設けられる生体信号測定装置により運転者の背部から採取した生体信号を用い、運転者の運転環境下における生体状態を判定する運転時生体状態判定装置であって、
前記生体信号の時系列波形を用いて所定の演算を行う分析演算手段と、
前記分析演算手段の演算結果を用いて前記生体状態を判定又は検出する判定検出手段と
を有し、
前記判定検出手段が、
入眠前の体調変化現象である入眠予兆現象を検出する入眠予兆現象検出手段と、
前記入眠予兆現象の出現後に生じる入眠前の体調変化現象である切迫睡眠現象を検出する切迫睡眠現象検出手段と、
自覚的な眠気を伴う自覚眠気又は意識レベルの低下による覚低走行状態を検出する自覚眠気・覚低走行状態検出手段と、
恒常性維持機能の適応能力のレベルを判定する恒常性維持機能レベル判定手段と
を備え、
前記入眠予兆現象検出手段、前記切迫睡眠現象検出手段、前記自覚眠気・覚低走行状態検出手段及び前記恒常性維持機能レベル判定手段が並列的に機能する構成であることを特徴とする運転時生体状態判定装置。 - 前記分析演算手段は、
前記生体信号の時系列波形から、周波数の時系列波形を求める周波数演算手段と、
前記周波数演算手段により得られる前記周波数の時系列波形を用いて所定の時間窓毎に前記周波数の傾きを求める移動計算を行い、時間窓毎に得られる前記周波数の傾きの時系列変化を周波数傾き時系列波形として出力する周波数傾き演算手段と、
前記周波数演算手段により得られる前記周波数の時系列波形を用いて所定の時間窓毎に前記周波数の平均値を求める移動計算を行い、時間窓毎に得られる前記周波数の平均値の時系列変化を周波数変動時系列波形として出力する周波数変動演算手段と、
前記周波数傾き演算手段により得られる周波数傾き時系列波形から、予め定めた機能調整信号、疲労受容信号及び活動調整信号に相当する周波数成分を抜き出し、これらの周波数成分のそれぞれの変動を求める手段と
を有する請求項1記載の運転時生体状態判定装置。 - 前記機能調整信号、疲労受容信号及び活動調整信号に相当する周波数成分の変動を求める手段は、
前記機能調整信号、疲労受容信号及び活動調整信号に相当する、ULF帯域からVLF帯域に属する0.01Hz未満の周波数成分を抜き出した後、この3つの周波数成分のパワースペクトルの値の合計を100とした際の前記各周波成分の分布率を時系列に求める分布率演算手段と、
前記分布率演算手段により得られた時系列の分布率に平滑化微分を適用し、時間軸上の任意の時点間における前記3つの周波数成分のうちの少なくとも一つの周波数成分について分布率の変化度を求める変化度演算手段と
を有する請求項2記載の運転時生体状態判定装置。 - 前記入眠予兆現象検出手段は、前記周波数傾き演算手段により得られる周波数傾き時系列波形において、所定の基準に対して振幅の発散傾向が検出される場合に入眠予兆現象と判定する手段を備えている請求項2記載の運転時生体状態判定装置。
- 前記切迫睡眠現象検出手段は、前記周波数傾き演算手段により得られる周波数傾き時系列波形において、所定の基準に対して振幅の収束傾向が検出され、かつ周期が長周期化する場合に切迫睡眠現象と判定する手段を備えている請求項2記載の運転時生体状態判定装置。
- 前記自覚眠気・覚低走行状態検出手段は、前記分布率演算手段により得られる前記3つの周波数成分のうち、前記機能調整信号に相当する周波数成分の分布率が前記活動調整信号に相当する周波数成分の分布率以上となることを条件として軽い眠気又は瞬間的な覚低走行状態を検出する手段を備えている請求項3記載の運転時生体状態判定装置。
- 前記自覚眠気・覚低走行状態検出手段は、前記変化度演算手段により得られる前記3つの周波数成分のうち、前記機能調整信号に相当する周波数成分の変化度が、前記活動調整信号に相当する周波数成分の変化度と共に、絶対値でそれぞれ所定値以上となる条件下で軽い眠気又は瞬間的な覚低走行状態を検出する手段を備えている請求項3又は6記載の運転時生体状態判定装置。
- 前記自覚眠気・覚低走行状態検出手段は、前記運転者の基本状態がリラックス状態か緊張状態であるかを判定し、判定される基本状態がリラックス状態か緊張状態であるかによって、前記軽い眠気又は瞬間的な覚低走行状態に相当するか否かの判定基準を選択する手段を有する請求項6又は7記載の運転時生体状態判定装置。
- 前記自覚眠気・覚低走行状態検出手段は、さらに、前記分布率演算手段により得られる前記3つの周波数成分の分布率の時系列波形の各ピーク値が、所定の出現時間の差の範囲内で所定の順番で出現し、かつ、所定の分布率条件を満たす値である場合に、強い眠気又は連続的な覚低走行状態を検出する手段を備えている請求項7記載の運転時生体状態判定装置。
- 前記自覚眠気・覚低走行状態検出手段における前記運転不適格期と判定する手段は、前記分布率演算手段により得られる前記3つの周波数成分の所定の分布率条件を満たすピーク値の出現時刻が、次の関係:
活動調整信号≦機能調整信号≦疲労受容信号(但し、活動調整信号と疲労受容信号の前記ピーク値の出現時刻の差が所定時間内)
を満たす場合に、強い眠気又は連続的な覚低走行状態であると判定する請求項9記載の運転時生体状態判定装置。 - 前記自覚眠気・覚低走行状態検出手段は、前記周波数傾き演算手段により得られる周波数傾き時系列波形において、所定の基準に対して振幅の収束傾向が検出される場合に、自覚眠気又は覚低走行状態であると判定する手段を備えている請求項6~10のいずれか1に記載の運転時生体状態判定装置。
- 前記判定検出手段は、運転開始時における初期疲労の有無を判定する初期疲労判定手段をさらに有し、
前記初期疲労判定手段は、前記恒常性維持機能レベル判定手段において、同一の恒常性維持機能レベルが所定時間以上継続している場合に、初期疲労を有していると判定する請求項1~11のいずれか1に記載の運転時生体状態判定装置。 - 前記判定検出手段は、運転開始後所定時間経過までの運転初期の生体状態を判定する気分判定手段をさらに有する請求項1~12のいずれか1に記載の運転時生体状態判定装置。
- 前記入眠予兆現象検出手段、前記切迫睡眠現象検出手段、前記自覚眠気・覚低走行状態検出手段及び前記恒常性維持機能レベル判定手段により得られた判定結果の履歴情報を用いて運転者の生体状態を判定する履歴利用生体状態判定手段をさらに有する請求項1~13のいずれか1に記載の運転時生体状態判定装置。
- 前記周波数演算手段が、前記生体信号測定装置により得られる生体信号の時系列波形において、正から負に切り替わるゼロクロス地点を求め、このゼロクロス地点を用いて生体信号の周波数の時系列波形を求める手段である請求項2~14のいずれか1に記載の運転時生体状態判定装置。
- 前記周波数演算手段が、前記生体信号測定装置により得られる生体信号の時系列波形を平滑化微分して極大値を求め、この極大値を用いて生体信号の周波数の時系列波形を求める手段である請求項2~14のいずれか1に記載の運転時生体状態判定装置。
- 前記分布率演算手段に用いる前記機能調整信号の周波数が0.0027Hz以下であり、前記疲労受容信号の周波数が0.002~0.0052Hzの範囲であり、前記活動調整信号の周波数が0.004~0.007Hzである請求項5~16のいずれか1に記載の運転時生体状態判定装置。
- 運転席に設けられる生体信号測定装置により運転者の背部から採取した生体信号を用い、運転者の運転環境下における生体状態を判定する運転時生体状態判定装置としてのコンピュータに、
前記生体信号の時系列波形を用いて所定の演算を行う分析演算手順と、
前記分析演算手段の演算結果を用いて前記生体状態を判定又は検出する判定検出手順と
を実行させると共に、
前記判定検出手順として、
入眠前の体調変化現象である入眠予兆現象を検出する入眠予兆現象検出手順と、
前記入眠予兆現象の出現後に生じる入眠前の体調変化現象である切迫睡眠現象を検出する切迫睡眠現象検出手順と、
自覚的な眠気を伴う自覚眠気又は意識レベルの低下による覚低走行状態を検出する自覚眠気・覚低走行状態検出手順と、
恒常性維持機能の適応能力のレベルを判定する恒常性維持機能レベル判定手順と
を実行させ、かつ、
前記入眠予兆現象検出手順、前記切迫睡眠現象検出手順、前記自覚眠気・覚低走行状態検出手順及び前記恒常性維持機能レベル判定手順を並列的に実行させるコンピュータプログラム。 - 前記分析演算手順として、
前記生体信号の時系列波形から、周波数の時系列波形を求める周波数演算手順と、
前記周波数演算手順により得られる前記周波数の時系列波形を用いて所定の時間窓毎に前記周波数の傾きを求める移動計算を行い、時間窓毎に得られる前記周波数の傾きの時系列変化を周波数傾き時系列波形として出力する周波数傾き演算手順と、
前記周波数演算手順により得られる前記周波数の時系列波形を用いて所定の時間窓毎に前記周波数の平均値を求める移動計算を行い、時間窓毎に得られる前記周波数の平均値の時系列変化を周波数変動時系列波形として出力する周波数変動演算手順と、
前記周波数傾き演算手順により得られる周波数傾き時系列波形から、予め定めた機能調整信号、疲労受容信号及び活動調整信号に相当する周波数成分を抜き出し、これらの周波数成分のそれぞれの変動を求める手順と
を実行させる請求項18記載のコンピュータプログラム。 - 前記機能調整信号、疲労受容信号及び活動調整信号に相当する周波数成分の変動を求める手順として、
前記機能調整信号、疲労受容信号及び活動調整信号に相当する、ULF帯域からVLF帯域に属する0.01Hz未満の周波数成分を抜き出した後、この3つの周波数成分のパワースペクトルの値の合計を100とした際の前記各周波成分の分布率を時系列に求める分布率演算手順と、
前記分布率演算手順により得られた時系列の分布率に平滑化微分を適用し、時間軸上の任意の時点間における前記3つの周波数成分のうちの少なくとも一つの周波数成分について分布率の変化度を求める変化度演算手順と
を実行させる請求項19記載のコンピュータプログラム。 - 前記入眠予兆現象検出手順は、前記周波数傾き演算手順により得られる周波数傾き時系列波形において、所定の基準に対して振幅の発散傾向が検出される場合に入眠予兆現象と判定する手順を実行させる請求項19記載のコンピュータプログラム。
- 前記切迫睡眠現象検出手順は、前記周波数傾き演算手順により得られる周波数傾き時系列波形において、所定の基準に対して振幅の収束傾向が検出され、かつ周期が長周期化する場合に切迫睡眠現象と判定する手順を実行させる請求項19記載のコンピュータプログラム。
- 前記自覚眠気・覚低走行状態検出手順は、前記分布率演算手順により得られる前記3つの周波数成分のうち、前記機能調整信号に相当する周波数成分の分布率が前記活動調整信号に相当する周波数成分の分布率以上となることを条件として軽い眠気又は瞬間的な覚低走行状態を検出する手順を実行させる請求項20記載のコンピュータプログラム。
- 前記自覚眠気・覚低走行状態検出手順は、前記変化度演算手順により得られる前記3つの周波数成分のうち、前記機能調整信号に相当する周波数成分の変化度が、前記活動調整信号に相当する周波数成分の変化度と共に、絶対値でそれぞれ所定値以上となる条件下で軽い眠気又は瞬間的な覚低走行状態を検出する手順を実行させる請求項20又は23記載のコンピュータプログラム。
- 前記自覚眠気・覚低走行状態検出手順は、前記運転者の基本状態がリラックス状態か緊張状態であるかを判定し、判定される基本状態がリラックス状態か緊張状態であるかによって、前記軽い眠気又は瞬間的な覚低走行状態に相当するか否かの判定基準を選択する手順を実行させる請求項23又は24記載のコンピュータプログラム。
- 前記自覚眠気・覚低走行状態検出手順は、さらに、前記分布率演算手順により得られる前記3つの周波数成分の分布率の時系列波形の各ピーク値が、所定の出現時間の差の範囲内で所定の順番で出現し、かつ、所定の分布率条件を満たす値である場合に、強い眠気又は連続的な覚低走行状態を検出する手順を実行させる請求項20記載のコンピュータプログラム。
- 前記自覚眠気・覚低走行状態検出手順における前記強い眠気又は連続的な覚低走行状態と判定する手順は、前記分布率演算手順により得られる前記3つの周波数成分の所定の分布率条件を満たすピーク値の出現時刻が、次の関係:
活動調整信号≦機能調整信号≦疲労受容信号(但し、活動調整信号と疲労受容信号の前記ピーク値の出現時刻の差が所定時間内)
を満たす場合に、強い眠気又は連続的な覚低走行状態であると判定する請求項26記載のコンピュータプログラム。 - 前記自覚眠気・覚低走行状態検出手順は、前記周波数傾き演算手順により得られる周波数傾き時系列波形において、所定の基準に対して振幅の収束傾向が検出される場合に、自覚眠気又は覚低走行状態であると判定する手順を実行させる請求項23~27のいずれか1に記載のコンピュータプログラム。
- 前記判定検出手順は、運転開始時における初期疲労の有無を判定する初期疲労判定手順をさらに有し、
前記初期疲労判定手順は、前記恒常性維持機能レベル判定手順において、同一の恒常性維持機能レベルが所定時間以上継続している場合に、初期疲労を有していると判定する請求項18~27のいずれか1に記載のコンピュータプログラム。 - 前記判定検出手順は、運転開始後所定時間経過までの運転初期の生体状態を判定する気分判定手順をさらに有する請求項18~28のいずれか1に記載のコンピュータプログラム。
- 前記入眠予兆現象検出手順、前記切迫睡眠現象検出手順、前記自覚眠気・覚低走行状態検出手順及び前記恒常性維持機能レベル判定手順により得られた判定結果の履歴情報を用いて運転者の生体状態を判定する履歴利用生体状態判定手順をさらに有する請求項18~30のいずれか1に記載のコンピュータプログラム。
Priority Applications (2)
| Application Number | Priority Date | Filing Date | Title |
|---|---|---|---|
| EP13861703.0A EP2932900B1 (en) | 2012-12-14 | 2013-11-26 | Device for determining biological state during driving, and computer program |
| US14/651,874 US9456770B2 (en) | 2012-12-14 | 2013-11-26 | Device for determining biological state during driving and computer program |
Applications Claiming Priority (2)
| Application Number | Priority Date | Filing Date | Title |
|---|---|---|---|
| JP2012-274104 | 2012-12-14 | ||
| JP2012274104A JP6118097B2 (ja) | 2012-12-14 | 2012-12-14 | 運転時生体状態判定装置及びコンピュータプログラム |
Publications (1)
| Publication Number | Publication Date |
|---|---|
| WO2014091916A1 true WO2014091916A1 (ja) | 2014-06-19 |
Family
ID=50934210
Family Applications (1)
| Application Number | Title | Priority Date | Filing Date |
|---|---|---|---|
| PCT/JP2013/081693 WO2014091916A1 (ja) | 2012-12-14 | 2013-11-26 | 運転時生体状態判定装置及びコンピュータプログラム |
Country Status (4)
| Country | Link |
|---|---|
| US (1) | US9456770B2 (ja) |
| EP (1) | EP2932900B1 (ja) |
| JP (1) | JP6118097B2 (ja) |
| WO (1) | WO2014091916A1 (ja) |
Cited By (2)
| Publication number | Priority date | Publication date | Assignee | Title |
|---|---|---|---|---|
| JP2016112144A (ja) * | 2014-12-12 | 2016-06-23 | 株式会社デルタツーリング | 生体状態分析装置及びコンピュータプログラム |
| CN107539320A (zh) * | 2016-06-24 | 2018-01-05 | 丰田自动车株式会社 | 车辆行驶控制装置 |
Families Citing this family (32)
| Publication number | Priority date | Publication date | Assignee | Title |
|---|---|---|---|---|
| KR101659027B1 (ko) * | 2014-05-15 | 2016-09-23 | 엘지전자 주식회사 | 이동 단말기 및 차량 제어 장치 |
| WO2016033587A1 (en) * | 2014-08-29 | 2016-03-03 | Ims Solutions Inc. | Driver readiness and integrated performance assessment |
| JP6588035B2 (ja) * | 2014-12-12 | 2019-10-09 | 株式会社デルタツーリング | 生体状態分析装置及びコンピュータプログラム |
| WO2016151842A1 (ja) * | 2015-03-26 | 2016-09-29 | パイオニア株式会社 | 眠気算出装置 |
| WO2017057022A1 (ja) * | 2015-09-28 | 2017-04-06 | デルタ工業株式会社 | 生体状態推定装置、生体状態推定方法及びコンピュータプログラム |
| JP6666705B2 (ja) * | 2015-09-28 | 2020-03-18 | デルタ工業株式会社 | 生体状態推定装置、生体状態推定方法及びコンピュータプログラム |
| JP6714352B2 (ja) * | 2015-11-30 | 2020-06-24 | 株式会社人間と科学の研究所 | 生体情報管理システム |
| US20180360315A1 (en) | 2015-12-12 | 2018-12-20 | Delta Kogyo Co., Ltd. | Biological state estimation device, biological state estimation method, computer program, and recording medium |
| WO2017099257A1 (ja) * | 2015-12-12 | 2017-06-15 | デルタ工業株式会社 | 生体状態推定装置、生体状態推定方法、コンピュータプログラム及び記録媒体 |
| JP6447530B2 (ja) * | 2016-01-29 | 2019-01-09 | オムロン株式会社 | 信号処理装置、信号処理装置の制御方法、制御プログラム、および記録媒体 |
| GB2539531B (en) * | 2016-03-30 | 2018-10-03 | Ford Global Tech Llc | A method of operating an environmental control system |
| CN106361276A (zh) * | 2016-08-25 | 2017-02-01 | 深圳市沃特沃德股份有限公司 | 宠物睡眠的判断方法和装置 |
| WO2018035818A1 (zh) * | 2016-08-25 | 2018-03-01 | 深圳市沃特沃德股份有限公司 | 宠物睡眠的判断方法和装置 |
| JP6394674B2 (ja) * | 2016-10-19 | 2018-09-26 | マツダ株式会社 | 運転支援装置 |
| JP6836265B2 (ja) * | 2016-12-09 | 2021-02-24 | デルタ工業株式会社 | 生体状態推定装置、生体状態推定方法、コンピュータプログラム及び記録媒体 |
| KR102287315B1 (ko) * | 2017-04-14 | 2021-08-09 | 현대자동차주식회사 | 피로도 기반 차량 제어 장치 및 방법 |
| US11478605B2 (en) * | 2017-09-28 | 2022-10-25 | Panasonic Intellectual Property Management Co., Ltd. | Autonomic nerve control device, autonomic nerve control system, and autonomic nerve control method |
| JP6885545B2 (ja) | 2018-01-13 | 2021-06-16 | 株式会社デルタツーリング | 血圧推定装置、血圧推定方法、コンピュータプログラム及び記録媒体 |
| WO2019159656A1 (ja) | 2018-02-17 | 2019-08-22 | デルタ工業株式会社 | 乗物用シートのベンチレーション機構及び乗物用シート |
| DE102018208060B3 (de) * | 2018-05-23 | 2019-07-04 | Robert Bosch Gmbh | Verfahren und Vorrichtung zum Erkennen einer Müdigkeit eines Fahrers eines Fahrzeugs in einem Mobilgerät |
| JP7401782B2 (ja) * | 2018-08-24 | 2023-12-20 | テイ・エス テック株式会社 | センサ付きシート |
| CA3117078A1 (en) * | 2018-10-18 | 2020-04-23 | Remmedy Llc | Methods and systems of pavlovian sleep induction |
| JP7278566B2 (ja) | 2018-10-25 | 2023-05-22 | 株式会社デルタツーリング | 生体状態推定装置及び生体状態推定システム |
| JP2019069207A (ja) * | 2018-12-26 | 2019-05-09 | パイオニア株式会社 | 眠気算出装置 |
| JPWO2020262563A1 (ja) | 2019-06-25 | 2020-12-30 | ||
| JP6727465B1 (ja) * | 2019-07-25 | 2020-07-22 | 三菱電機株式会社 | 運転者状態判断装置および運転者状態判断方法 |
| KR102108515B1 (ko) * | 2019-10-10 | 2020-05-08 | 국방과학연구소 | 조종사의 졸음 상태 감지 및 누적 분석을 활용한 졸음 예방 시스템 및 방법 |
| JP7473939B2 (ja) | 2019-10-22 | 2024-04-24 | 株式会社デルタツーリング | 生体信号検出装置 |
| JP2020171734A (ja) * | 2020-07-01 | 2020-10-22 | パイオニア株式会社 | 眠気算出装置 |
| WO2022092243A1 (ja) | 2020-10-28 | 2022-05-05 | 株式会社デルタツーリング | 生体信号分析装置、コンピュータプログラム及び記録媒体 |
| KR102593169B1 (ko) * | 2021-07-22 | 2023-10-24 | 한국 한의학 연구원 | 누적 스펙트럼 파워를 이용한 맥파 신호 분석 방법 및 장치 |
| CN114288520A (zh) * | 2021-12-31 | 2022-04-08 | 广州酷狗计算机科技有限公司 | 一种基于脑电波的辅助睡眠方法、装置、设备及存储介质 |
Citations (9)
| Publication number | Priority date | Publication date | Assignee | Title |
|---|---|---|---|---|
| JP2002331603A (ja) | 2001-05-10 | 2002-11-19 | Delta Tooling Co Ltd | 三次元立体編物、三次元立体編物へのパイル糸の植毛方法、及び三次元立体編物の端末部処理方法 |
| JP2003182427A (ja) | 2001-12-20 | 2003-07-03 | Delta Tooling Co Ltd | 衝撃吸収構造及び座席構造 |
| WO2005092193A1 (ja) | 2004-03-25 | 2005-10-06 | Delta Tooling Co., Ltd. | 負荷体状態判定装置、乗物用シート及びコンピュータプログラム |
| JP2009022610A (ja) | 2007-07-20 | 2009-02-05 | Delta Tooling Co Ltd | 疲労度演算装置及びコンピュータプログラム |
| WO2011046178A1 (ja) | 2009-10-14 | 2011-04-21 | 株式会社デルタツーリング | 生体状態推定装置、生体状態推定システム及びコンピュータプログラム |
| JP2011108909A (ja) | 2009-11-19 | 2011-06-02 | Hitachi High-Tech Instruments Co Ltd | 電子部品外段取り装置及び電子部品外段取り方法並びに電子部品装着装置 |
| JP2011167362A (ja) | 2010-02-18 | 2011-09-01 | Delta Tooling Co Ltd | 生体状態推定装置及びコンピュータプログラム |
| JP2012095779A (ja) | 2010-10-29 | 2012-05-24 | Delta Tooling Co Ltd | 生体状態推定装置及びコンピュータプログラム |
| JP2012239480A (ja) * | 2011-05-14 | 2012-12-10 | Delta Tooling Co Ltd | 生体状態推定装置及びコンピュータプログラム |
Family Cites Families (5)
| Publication number | Priority date | Publication date | Assignee | Title |
|---|---|---|---|---|
| JP2003118421A (ja) * | 2001-10-12 | 2003-04-23 | Pioneer Electronic Corp | 生体状態測定装置及び方法、移動体用ナビゲーションシステム及び方法、ライブラリ装置並びにコンピュータプログラム |
| JP4247055B2 (ja) * | 2003-05-21 | 2009-04-02 | 株式会社デルタツーリング | 運転席用座席システム |
| KR101078466B1 (ko) * | 2007-01-19 | 2011-10-31 | 아사히 가세이 가부시키가이샤 | 각성 상태 판정 모델 생성 장치, 각성 상태 판정 장치, 경고 장치, 차량, 각성 상태 판정 모델 생성 방법, 각성 상태 판정 방법, 각성 상태 판정 모델 생성 프로그램을 기록한 컴퓨터 판독 가능 기록매체, 및 각성 상태 판정 프로그램을 기록한 컴퓨터 판독 가능 기록매체 |
| US8603001B2 (en) * | 2009-04-25 | 2013-12-10 | Delta Tooling Co., Ltd. | Device and computer program for analyzing biological body state |
| US8698639B2 (en) * | 2011-02-18 | 2014-04-15 | Honda Motor Co., Ltd. | System and method for responding to driver behavior |
-
2012
- 2012-12-14 JP JP2012274104A patent/JP6118097B2/ja active Active
-
2013
- 2013-11-26 WO PCT/JP2013/081693 patent/WO2014091916A1/ja active Application Filing
- 2013-11-26 US US14/651,874 patent/US9456770B2/en active Active
- 2013-11-26 EP EP13861703.0A patent/EP2932900B1/en active Active
Patent Citations (9)
| Publication number | Priority date | Publication date | Assignee | Title |
|---|---|---|---|---|
| JP2002331603A (ja) | 2001-05-10 | 2002-11-19 | Delta Tooling Co Ltd | 三次元立体編物、三次元立体編物へのパイル糸の植毛方法、及び三次元立体編物の端末部処理方法 |
| JP2003182427A (ja) | 2001-12-20 | 2003-07-03 | Delta Tooling Co Ltd | 衝撃吸収構造及び座席構造 |
| WO2005092193A1 (ja) | 2004-03-25 | 2005-10-06 | Delta Tooling Co., Ltd. | 負荷体状態判定装置、乗物用シート及びコンピュータプログラム |
| JP2009022610A (ja) | 2007-07-20 | 2009-02-05 | Delta Tooling Co Ltd | 疲労度演算装置及びコンピュータプログラム |
| WO2011046178A1 (ja) | 2009-10-14 | 2011-04-21 | 株式会社デルタツーリング | 生体状態推定装置、生体状態推定システム及びコンピュータプログラム |
| JP2011108909A (ja) | 2009-11-19 | 2011-06-02 | Hitachi High-Tech Instruments Co Ltd | 電子部品外段取り装置及び電子部品外段取り方法並びに電子部品装着装置 |
| JP2011167362A (ja) | 2010-02-18 | 2011-09-01 | Delta Tooling Co Ltd | 生体状態推定装置及びコンピュータプログラム |
| JP2012095779A (ja) | 2010-10-29 | 2012-05-24 | Delta Tooling Co Ltd | 生体状態推定装置及びコンピュータプログラム |
| JP2012239480A (ja) * | 2011-05-14 | 2012-12-10 | Delta Tooling Co Ltd | 生体状態推定装置及びコンピュータプログラム |
Non-Patent Citations (1)
| Title |
|---|
| See also references of EP2932900A4 |
Cited By (3)
| Publication number | Priority date | Publication date | Assignee | Title |
|---|---|---|---|---|
| JP2016112144A (ja) * | 2014-12-12 | 2016-06-23 | 株式会社デルタツーリング | 生体状態分析装置及びコンピュータプログラム |
| CN107539320A (zh) * | 2016-06-24 | 2018-01-05 | 丰田自动车株式会社 | 车辆行驶控制装置 |
| CN107539320B (zh) * | 2016-06-24 | 2020-02-21 | 丰田自动车株式会社 | 车辆行驶控制装置 |
Also Published As
| Publication number | Publication date |
|---|---|
| JP2014117425A (ja) | 2014-06-30 |
| JP6118097B2 (ja) | 2017-04-19 |
| US9456770B2 (en) | 2016-10-04 |
| US20150327803A1 (en) | 2015-11-19 |
| EP2932900A4 (en) | 2016-08-10 |
| EP2932900A1 (en) | 2015-10-21 |
| EP2932900B1 (en) | 2019-10-30 |
Similar Documents
| Publication | Publication Date | Title |
|---|---|---|
| JP6118097B2 (ja) | 運転時生体状態判定装置及びコンピュータプログラム | |
| JP6209396B2 (ja) | 運転支援装置及びコンピュータプログラム | |
| JP5704651B2 (ja) | 生体状態推定装置、生体状態推定システム及びコンピュータプログラム | |
| JP6757532B2 (ja) | 睡眠段階判定装置、睡眠段階判定方法、睡眠段階判定プログラム | |
| US7250029B2 (en) | Human condition evaluation system, computer program, and computer-readable record medium | |
| JP5892678B2 (ja) | 生体状態推定装置及びコンピュータプログラム | |
| JP2004344613A (ja) | 運転席用座席システム及び覚醒状態復帰装置 | |
| JPWO2005039415A1 (ja) | 疲労度測定装置、疲労検出装置及びコンピュータプログラム | |
| JP2011167362A (ja) | 生体状態推定装置及びコンピュータプログラム | |
| Rodríguez-Ibáñez et al. | Drowsiness detection by thoracic effort signal analysis in real driving environments | |
| JP6666705B2 (ja) | 生体状態推定装置、生体状態推定方法及びコンピュータプログラム | |
| JP4636861B2 (ja) | 快適感評価装置 | |
| JP6836265B2 (ja) | 生体状態推定装置、生体状態推定方法、コンピュータプログラム及び記録媒体 | |
| WO2017057022A1 (ja) | 生体状態推定装置、生体状態推定方法及びコンピュータプログラム | |
| JP6209395B2 (ja) | 生体状態推定装置及びコンピュータプログラム | |
| WO2019142720A1 (ja) | バックル、覚醒状態判定システム及び覚醒状態判定方法 | |
| Widasari et al. | A new investigation of automatic sleep stage detection using decision-tree-based support vector machine and spectral features extraction of ecg signal | |
| JP6588035B2 (ja) | 生体状態分析装置及びコンピュータプログラム | |
| WO2015083787A1 (ja) | 生体状態判定装置及びコンピュータプログラム | |
| JP2016112144A (ja) | 生体状態分析装置及びコンピュータプログラム | |
| Perrotte et al. | Monitoring driver drowsiness in partially automated vehicles: added value from combining postural and physiological indicators | |
| Hong et al. | Study of adaptive assisting effect of auditory-visual alert for elderly drivers using physiological signals | |
| JP5817525B2 (ja) | 眠気検知適用性判定装置、眠気検知適用性判定方法、プログラム | |
| Perrotte et al. | Psychology and Behaviour | |
| Hong et al. | 1G-23 Adaptive Assisting Effect of DAS for Elderly Drivers |
Legal Events
| Date | Code | Title | Description |
|---|---|---|---|
| 121 | Ep: the epo has been informed by wipo that ep was designated in this application |
Ref document number: 13861703 Country of ref document: EP Kind code of ref document: A1 |
|
| WWE | Wipo information: entry into national phase |
Ref document number: 14651874 Country of ref document: US |
|
| NENP | Non-entry into the national phase |
Ref country code: DE |
|
| WWE | Wipo information: entry into national phase |
Ref document number: 2013861703 Country of ref document: EP |