WO2004052191A1 - 生体状態情報処理装置、生体状態情報処理方法、生体状態情報管理システム、プログラム、および、記録媒体 - Google Patents
生体状態情報処理装置、生体状態情報処理方法、生体状態情報管理システム、プログラム、および、記録媒体 Download PDFInfo
- Publication number
- WO2004052191A1 WO2004052191A1 PCT/JP2003/015713 JP0315713W WO2004052191A1 WO 2004052191 A1 WO2004052191 A1 WO 2004052191A1 JP 0315713 W JP0315713 W JP 0315713W WO 2004052191 A1 WO2004052191 A1 WO 2004052191A1
- Authority
- WO
- WIPO (PCT)
- Prior art keywords
- index
- blood concentration
- concentration data
- correlation
- composite
- Prior art date
Links
Classifications
-
- G—PHYSICS
- G16—INFORMATION AND COMMUNICATION TECHNOLOGY [ICT] SPECIALLY ADAPTED FOR SPECIFIC APPLICATION FIELDS
- G16B—BIOINFORMATICS, i.e. INFORMATION AND COMMUNICATION TECHNOLOGY [ICT] SPECIALLY ADAPTED FOR GENETIC OR PROTEIN-RELATED DATA PROCESSING IN COMPUTATIONAL MOLECULAR BIOLOGY
- G16B40/00—ICT specially adapted for biostatistics; ICT specially adapted for bioinformatics-related machine learning or data mining, e.g. knowledge discovery or pattern finding
-
- A—HUMAN NECESSITIES
- A61—MEDICAL OR VETERINARY SCIENCE; HYGIENE
- A61B—DIAGNOSIS; SURGERY; IDENTIFICATION
- A61B5/00—Measuring for diagnostic purposes; Identification of persons
-
- G—PHYSICS
- G16—INFORMATION AND COMMUNICATION TECHNOLOGY [ICT] SPECIALLY ADAPTED FOR SPECIFIC APPLICATION FIELDS
- G16B—BIOINFORMATICS, i.e. INFORMATION AND COMMUNICATION TECHNOLOGY [ICT] SPECIALLY ADAPTED FOR GENETIC OR PROTEIN-RELATED DATA PROCESSING IN COMPUTATIONAL MOLECULAR BIOLOGY
- G16B40/00—ICT specially adapted for biostatistics; ICT specially adapted for bioinformatics-related machine learning or data mining, e.g. knowledge discovery or pattern finding
- G16B40/20—Supervised data analysis
-
- G—PHYSICS
- G16—INFORMATION AND COMMUNICATION TECHNOLOGY [ICT] SPECIALLY ADAPTED FOR SPECIFIC APPLICATION FIELDS
- G16B—BIOINFORMATICS, i.e. INFORMATION AND COMMUNICATION TECHNOLOGY [ICT] SPECIALLY ADAPTED FOR GENETIC OR PROTEIN-RELATED DATA PROCESSING IN COMPUTATIONAL MOLECULAR BIOLOGY
- G16B5/00—ICT specially adapted for modelling or simulations in systems biology, e.g. gene-regulatory networks, protein interaction networks or metabolic networks
-
- G—PHYSICS
- G16—INFORMATION AND COMMUNICATION TECHNOLOGY [ICT] SPECIALLY ADAPTED FOR SPECIFIC APPLICATION FIELDS
- G16B—BIOINFORMATICS, i.e. INFORMATION AND COMMUNICATION TECHNOLOGY [ICT] SPECIALLY ADAPTED FOR GENETIC OR PROTEIN-RELATED DATA PROCESSING IN COMPUTATIONAL MOLECULAR BIOLOGY
- G16B50/00—ICT programming tools or database systems specially adapted for bioinformatics
- G16B50/20—Heterogeneous data integration
-
- G—PHYSICS
- G16—INFORMATION AND COMMUNICATION TECHNOLOGY [ICT] SPECIALLY ADAPTED FOR SPECIFIC APPLICATION FIELDS
- G16B—BIOINFORMATICS, i.e. INFORMATION AND COMMUNICATION TECHNOLOGY [ICT] SPECIALLY ADAPTED FOR GENETIC OR PROTEIN-RELATED DATA PROCESSING IN COMPUTATIONAL MOLECULAR BIOLOGY
- G16B50/00—ICT programming tools or database systems specially adapted for bioinformatics
Definitions
- Biological condition information processing apparatus biological condition information processing method, biological condition information management system, program, and recording medium
- the present invention relates to a biological state information processing apparatus, a biological state information processing method, a biological state information management system, a program, and a recording medium, and in particular, various specifications for defining a biological state.
- a biological state information processing apparatus a biological state information processing method, and a biological state that can provide an analysis method for deriving a combination of metabolites highly relevant to a specific biological state index based on the correlation with e).
- Information management systems, programs, and recording media are included in the system.
- the present invention relates to a liver fibrosis determination device, a liver fibrosis determination method, a liver fibrosis determination system, a program, and a recording medium, particularly, from a plurality of tf products (specific amino acids) which can be easily measured.
- a recording medium is capable of calculating a liver fibrosis disease state index value and determining a liver fibrosis disease state according to the calculated disease state index value.
- a “biological condition” is a concept including a health condition (healthy) and a disease state.
- “Indicator data on the biological state measured in each individual and body” is a concept that includes diagnostic result data of the biological state of each individual, and “indicator data” is conceptually equivalent to numerical data. (Eg, gender differences, smoking status, etc.).
- bioinformatics genomicas, transcriptomics, proteomics, metapolomics, and other analytical technologies for each step from gene expression to life phenomena are rapidly developing, and are expected to be the flower form of the bio business in the future. Have been. However, the most important step in considering the practical application of bioinformatics is to understand the life mechanisms at various levels related to the life phenomena of interest.
- pathological markers are considered to require pathological specificity, and a one-to-one or near-restrictive relationship has been required.
- many metabolites are affected by the disease, and it is not necessarily a one-to-one relationship with the disease, so it can be said that there are not many pathological markers for simple metabolites. If all changes in metabolite flow can be comprehensively understood, it is possible to derive an index that defines the metabolism of a disease state.
- metabolites' dynamics it is possible to measure metabolites, such as amino acids, which are dispersed on several metabolic maps without knowing the movements of all metabolites. May be able to catch any metabolic changes.
- the Fisher ratio ((I 1 e + Leu + V a1), which is an index created by using an aromatic amino acid that increases during cirrhosis as a denominator and a branched amino acid that decreases as a molecule, ) / (P he + T yr))
- the neural network 1 train the neural network 1, work (non-linear analysis) based on the input data
- Patent Document 1 US patents
- Patent Document 1 U.S. Pat.No. 5,687,716
- metabolites included in diagnostic indices determined by the technology disclosed in Patent Document 1 are examined by examining the relationship on a metabolic map, and combined with their chemical, physiological, and pharmacological findings. It is also conceivable to analyze the mechanism of the disease by examining the disease mechanism. (In this way, the analysis of the link between the disease state and metabolism is performed by performing the matching analysis between the known metabolic findings and the like and the diagnostic index. To obtain information that supports diagnostic indices, and to discover new metabolic findings, etc. To obtain very useful information that can be a trigger in the event of However, in the prior art, there was a problem that all such analysis work had to be performed manually by researchers.
- the present invention has been made in view of the above problems, and based on the correlation between various phenomena (Phenome) that define the state of a living body and a plurality of metabolites (Metabolome) that can be measured easily, Biological state information processing apparatus, biological state, state information processing method, biological state information management system, program, and record that can provide an analysis method for deriving a combination of metabolites highly relevant to the biological state index It is intended to provide a medium.
- the present invention can calculate a pathological index value of liver fibrosis from a plurality of metabolites (specific amino acids) that can be easily measured, and can determine the pathological state of liver fibrosis based on the calculated pathological index value. It is an object to provide a liver fibrosis determination device, a liver fibrosis determination method, a liver fibrosis determination system, a program, and a recording medium. Disclosure of the invention
- the present invention has been made based on various findings obtained by the present inventors through sincerity research. First, various experiments have confirmed that the accuracy in measuring metabolites such as amino acids is high, and that the variance due to measurement is considerably smaller than the variance due to individual differences.
- c is the postprandial blood data reflecting the state changes in gene expression, such as associated with metabolism
- blood is related to all organs, may vary in certain organs Ru are reflected in the blood is there.
- the expression of many metabolic genes may be affected in certain biological conditions (eg, liver fibrosis).
- the movement of many metabolites in the blood is linked to other metabolites, and even if the metabolite most relevant to a specific biological state cannot be measured, the metabolite linked to it is affected there is a possibility.
- the present inventor has discovered that a correlation between blood levels of metabolites (especially amino acids) in each individual can be a very effective state indicator. That is, the relationship between highly accurate measurement data of blood levels of limited metabolites such as amino acids and a specific biological state.
- the analysis can search for combinations of metabolites that are phenomenally related to a particular biological condition.
- there is an indicator that can discriminate between a healthy person and a specific biological condition it can be used as an early diagnostic indicator.
- a biological state information processing apparatus according to the present invention, a biological state information processing method according to the present invention, and a biological state information processing method according to the present invention are executed by a computer.
- the program sets a correlation equation that sets the correlation equation shown in Equation 1, which shows the correlation between the index data on the biological state measured in each individual and the blood concentration data measured for each metabolite in each individual Substituting the blood concentration data group measured for each metabolite in the individual to be simulated into the correlation formula set by the means (correlation formula setting step) and the correlation formula set by the correlation formula setting means (correlation formula setting step) And a biological state simulation means (biological state simulation) for simulating the biological state in the individual to be simulated.
- Equation 1 shows the correlation between the index data regarding the biological state measured in each individual and the blood concentration data measured for each metabolite in each individual.
- stimulation refers to calculating a numerical value based on a set model (for example, a “correlation formula” in the present invention), and determining the calculated numerical value based on a predetermined threshold value to thereby determine a specific ecological state. Is a concept that includes determining
- the present invention is applied to a disease risk diagnosis that predicts onset after a certain period of time, and data on past blood concentrations (for example, amino acid data 10 years ago) and current diseases and health
- a disease risk diagnosis that predicts onset after a certain period of time
- data on past blood concentrations for example, amino acid data 10 years ago
- current diseases and health By setting a correlation formula from the index data relating to the state of the disease and substituting the current blood concentration data into the correlation formula, it is possible to effectively simulate future diseases and health conditions.
- the setting of the correlation equation in the correlation equation setting means is performed by “applying the blood concentration of each amino acid contained in the clinical data to Equation 1 and newly obtaining each constant of Equation 1 to obtain the correlation.
- the correlation equation in which the constant is determined by the former is stored in a predetermined file of the storage device in advance, and a desired correlation equation is selected from the file and set, or the other computer apparatus is used. This includes the case where the correlation equation stored in the storage device is downloaded via the network and set.
- the biological state information processing apparatus is the biological state information processing apparatus described above, and the biological state described above.
- the correlation formula setting means includes an index data relating to a biological state measured in each individual, and a metabolite in each individual.
- the correlation determining means includes an index data relating to a biological state measured in each individual, and a metabolite in each individual.
- the correlation determining means and the correlation determining means (correlation determining step) for determining the correlation of each metabolite with the above index data based on the measured blood concentration data group.
- a correlation formula creation step for creating a correlation formula for a plurality of metabolites with respect to the above-mentioned biological state using the equation
- the correlation formula determined by the correlation formula creation means for optimizing the above-mentioned correlation formula based on a correlation coefficient with respect to the index data relating to the biological state is provided (including).
- each metabolite is determined based on the index data related to the biological state measured in each individual, and the blood concentration data group measured for each metabolite in each individual.
- the correlation with the index data is determined, and based on the determined correlation of each metabolite, a correlation formula (correlation function) of multiple metabolites for the biological state is created by a predetermined calculation method, and the determination is made. Since the correlation equation is optimized based on the correlation coefficient of the correlation equation with respect to the index data relating to the biological state, a calculation equation having a high correlation can be used as a composite index of the biological state. This makes it possible to efficiently calculate a composite index composed of measurable metabolites such as amino acids that have a high correlation with the above.
- “optimizing the correlation equation based on the correlation coefficient” means, for example, that the correlation coefficient is the highest (for example, the top 20) and the correlation coefficient is preferably the maximum. That is, adopt a correlation equation.
- this makes it possible to diagnose a biological state without a biological state index at the time of measurement by analyzing past data when the composite index becomes clear.
- each metabolite constituting the composite index for the biological state may be a factor or a result of the biological state, it is possible to develop a treatment method for the biological state using the composite index as a marker. become.
- index data relating to the biological state may use numerical data such as measured values and diagnostic results, and may be assigned to healthy and diseased states as shown in the following example. Any value may be given. In the latter case, it is possible to analyze the disease state or its level by giving an arbitrary numerical value even if the user does not have the numerical data.
- the biological state information processing apparatus includes a metabolite selecting means (metabolite selecting step) for selecting some metabolites of each metabolite.
- a correlation equation is created using a plurality of metabolites selected by the above-mentioned metabolite selection means (metabolite selection step), and a correlation coefficient is calculated with respect to index data relating to a biological state.
- the combination of metabolites is optimized based on the correlation coefficient and the number of metabolites for the index data on the biological state.
- a part of each metabolite is selected, a correlation formula is created using the selected metabolites, and an index data on a biological state is obtained.
- “optimizing the combination of metabolites based on the correlation coefficient and the number of metabolites” means, for example, that the correlation coefficient is high (for example, the top 20) and the number of metabolites is the minimum. Thus, it is preferable to adopt a combination of metabolites so that the correlation coefficient is maximum and the number of metabolites is minimum.
- a biological state information processing apparatus is the biological condition information processing apparatus described above, the biological condition information processing method described above, and the program described above.
- the method is characterized in that a correlation formula based on a plurality of metabolites with respect to the biological state is calculated, and a combination of divisions is optimized based on a correlation number with respect to index data on the biological state.
- a calculation formula is divided, a correlation formula of a plurality of metabolites with respect to a biological state is calculated using the divided calculation formula, and a phase relationship with the index data regarding the biological state is calculated. Since the combination of divisions is optimized based on the number, the division of each formula can be performed comprehensively and automatically, so that the composite index for the biological condition can be obtained efficiently. Become.
- “optimizing the combination of divisions based on the correlation coefficient” means, for example, that the correlation coefficient is preferably the highest (for example, the top 20) so that the correlation coefficient is the maximum. That is, a combination of divisions is adopted.
- the biological state information processing apparatus includes a metabolic map dividing means ′ (a metabolic map dividing step) that divides the calculation formula based on proxy map information.
- a correlation formula for a plurality of metabolites with respect to the above-mentioned biological state is calculated using the above calculation formula divided by the above metabolism map division means (metabolism map division step). I do.
- the calculation formula is divided based on the metabolic map information, and the correlation formula of a plurality of metabolites with respect to the biological state is calculated using the divided calculation formula. If the metabolic map of the relevant metabolite is known, Based on these biochemical findings, the formula can be automatically divided.
- the relationship between metabolites included in the calculated correlation formula may be numerically projected and projected on a metabolic map to estimate a metabolic flux or a metabolic rate-limiting point.
- the biological state information processing apparatus according to the next invention, the biological state information processing method according to the following invention, and the program according to the next invention are the biological state information processing apparatus described above, and the biological state described above.
- the metabolite is an amino acid.
- the present invention relates to a biological condition information management system
- the biological condition information management system includes a biological condition information processing device that processes information related to a biological condition, an information terminal device of a biological condition information provider, A biological condition information management system configured to be communicably connected via a network, wherein the biological condition information processing device comprises: index data relating to a biological condition measured in each individual; Correlation formula setting means for setting the correlation formula shown in Equation 1 showing the correlation with the blood concentration data measured for metabolites, and blood concentration data group measured for each metabolite in the individual to be simulated
- the blood concentration data group acquiring means for acquiring the blood concentration data from the information terminal device; and A biological state simulation that simulates the biological state in the simulation target individual by substituting the blood concentration data group measured for each metabolite in the simulation target individual acquired by the data group acquisition means.
- Analysis means for transmitting a simulation result of the biological state in the object to be simulated simulated by the biological state simulation means to the information terminal device which transmitted the blood concentration data group
- the information terminal device comprising: Transmitting means for transmitting the blood concentration data group to the biological condition information processing apparatus, and transmitting the simulation result corresponding to the blood concentration data group transmitted by the transmitting means to the biological condition information Receiving means for receiving from the information processing apparatus.
- Equation 1 i, j, and k are natural numbers, and Ai, ⁇ are blood concentration data of metabolites or values obtained by performing a function process on them, and C i, Di, Ej, F j, G k and H are constants.
- the biological condition information processing apparatus shows a correlation between the index data on the biological condition measured in each individual and the blood concentration data measured for each metabolite in each individual.
- the correlation equation shown in Equation 1 is set, and the blood concentration data group measured for each metabolite in the individual to be simulated is acquired from the information terminal device, and the acquired correlation equation is acquired in the set correlation equation.
- the biological state in the individual to be simulated is simulated, and the simulated biological state in the individual to be simulated is simulated.
- the information is sent to the information terminal device that transmitted the blood concentration data group, and the information terminal device transmits the blood concentration data group to the biological state information.
- the simulation result corresponding to the transmitted blood concentration data group is received from the biological condition information processing device, for example, the health condition, the progress of the disease, the treatment condition of the disease, It is possible to effectively simulate future disease risks, drug efficacy, drug side effects, etc., based on blood levels of metabolites in individuals. '
- the “simulation” refers to calculating a numerical value based on a set model (for example, “correlation formula” in the present invention) and determining the calculated numerical value based on a predetermined threshold value to thereby determine a specific ecological state. Is a concept that includes determining
- the present invention is suitable for disease risk diagnosis for predicting onset after a certain period of time.
- a correlation formula is established from past blood concentration data (for example, amino acid data 10 years ago) and index data on the current disease or health condition, and the current blood concentration data is used in the correlation formula. By substituting, it is possible to effectively simulate future diseases and health conditions.
- the biological condition of a drug in addition to simulating the effectiveness of a drug by drug administration (eg, the effective production of the drug when administering a drug such as interferon (IFN)) and side effects, the biological condition of It is also possible to effectively simulate changes (for example, changes in biological conditions when a stimulus such as eating is given).
- the biological condition information management system is the biological condition information management system according to the above, wherein the correlation formula setting means includes: index data relating to a biological condition measured in each individual; A correlation determining means for determining a correlation of each metabolite with the index data based on the blood concentration data group measured for each metabolite, and a metabolite determined by the correlation determining means A correlation formula creating means for creating a correlation formula for the biological state by a plurality of metabolites based on the above correlation based on a predetermined calculation method; and a biological state of the correlation formula determined by the correlation formula creating means.
- Optimizing means for optimizing the correlation equation based on a correlation coefficient with respect to the index data related to the index data.
- the biological condition information processing apparatus uses the index data relating to the biological condition measured in each individual, and the blood concentration data group measured for each simplex in each individual.
- the correlation between each metabolite and the index data is determined, and based on the determined correlation between each metabolite, a correlation equation (correlation function) for a plurality of metabolites with respect to the biological state is created by a predetermined calculation method. Since the correlation equation is optimized based on the correlation coefficient of the determined correlation equation with respect to the index data related to the biological state, a highly correlated calculation equation can be used as a composite index of the biological state.
- optimal the correlation equation based on the correlation coefficient means, for example, that the correlation coefficient is the highest (for example, the top 20), and preferably the correlation coefficient is the maximum. That is, adopt a correlation equation.
- this makes it possible to diagnose a biological condition without a biological condition index at the time of measurement, based on the past data when the composite index becomes clear.
- each metabolite constituting the composite index for the biological state may be a factor or a result of the biological state, it is possible to develop a treatment method for the biological state using the composite index as a marker. become.
- the ⁇ index data relating to the biological condition '' may use numerical data such as measured values, diagnostic results, etc., and, as shown in the following example, arbitrary numerical values for healthy and pathological conditions. May be given. In the latter case, it is possible to analyze the disease state or its level by giving an arbitrary numerical value even if the user does not have the numerical data.
- the biological condition information management system is the biological condition information management system according to the above, wherein the optimizing means includes a metabolite selecting means for selecting a part of metabolites among the metabolites.
- the method further comprises preparing a correlation equation using the plurality of metabolites selected by the metabolite selection means, calculating a correlation coefficient for the index data regarding the biological state, and calculating a correlation coefficient and a metabolism for the index data regarding the biological state. It is characterized by optimizing the combination of metabolites based on the number of metabolites.
- a part of each metabolite is selected, and a plurality of selected metabolites are used to calculate a correlation equation. Calculate the correlation coefficient for the index data related to the biological state, and optimize the combination of metabolites based on the correlation coefficient for the index data related to the biological state and the number of metabolites. Since the target removal can be performed comprehensively and automatically, it becomes possible to efficiently obtain a composite index for the biological state.
- “optimizing the combination of metabolites based on the correlation coefficient and the number of metabolites” means, for example, that the correlation coefficient is high (for example, the top 20) and the number of metabolites is the minimum. As described above, preferably, the combination of metabolites is used so that the correlation coefficient is maximum and the number of metabolites is minimum.
- the biological condition information management system is the biological condition information management system according to the above, wherein the optimizing means further includes a formula dividing means for dividing the calculation formula, Calculating a correlation equation for the biological state using a plurality of metabolites using the above-mentioned calculation equation, and optimizing a combination of divisions based on a correlation coefficient for index data regarding the biological state. I do.
- a calculation formula is divided, a correlation formula for a plurality of metabolites with respect to a biological state is calculated using the divided calculation formula, and a combination of divisions based on a correlation coefficient with respect to index data regarding a biological state is optimized. Therefore, the division of each formula can be performed comprehensively and automatically, so that a composite index for the biological state can be efficiently obtained.
- “optimizing the combination of divisions based on the correlation coefficient” means, for example, that the correlation coefficient is preferably the highest (for example, the top 20) so that the correlation coefficient is the maximum. That is, a combination of divisions is adopted.
- the biological condition information management system is the biological condition information management system described above, wherein the optimizing means further includes a metabolic map dividing means for dividing the calculation formula based on metabolic map information.
- the method is characterized in that a correlation formula for a plurality of metabolites with respect to the biological state is calculated using the calculation formula divided by the metabolism map dividing means.
- This shows one example of the optimizing means more specifically.
- a calculation formula is divided based on metabolic map information, and a correlation formula of a plurality of metabolites with respect to a biological state is calculated using the divided calculation formula. If the metabolic map is known, the formula can be automatically divided based on these biologic findings.
- the relationship between metabolites included in the calculated correlation formula may be quantified and projected on a metabolic map to estimate a metabolic flux or a metabolic rate-limiting point.
- a biological condition information management system is characterized in that, in the biological condition information management system described above, the metabolite is an amino acid.
- metabolites are amino acids, so they have high accuracy in metabolite measurement, and use the advantageous physical properties of amino acids, such as strength and variance due to measurement are much smaller than variance due to individual differences. As a result, a highly reliable composite index of the biological state can be obtained.
- the present invention relates to a recording medium, and the recording medium according to the present invention is characterized by recording the program described above.
- the program described above can be realized using a computer by causing a computer to read and execute the program recorded on the recording medium. The effect can be obtained.
- the present invention relates to a liver fibrosis determining apparatus, a liver fibrosis determining method, and a program, and a liver fibrosis determining apparatus according to the present invention, a liver fibrosis determining method according to the present invention, and
- a program characterized by causing a computer to execute the method for determining liver fibrosis according to the present invention is a blood concentration data acquisition means (blood concentration data acquisition unit) for acquiring a blood concentration data group measured for each substance of each individual. Concentration data acquisition step) and liver fibers from the blood concentration data group acquired by the blood concentration data acquisition means (blood concentration data acquisition step) based on at least one of the following composite indices 1 to 4.
- Index calculating means pathological index value calculating step) for calculating the index of the pathological state of transformation; composite index 1; (A sn) / (Thr) + (Gin) / (Tau + Ser + Val + Trp) composite index 2;
- a pathological condition judging means for judging a pathological condition of liver fibrosis in accordance with the pathological condition index value calculated by the pathological condition index value calculating means (pathological condition index value calculating step).
- a blood concentration data group measured for each metabolite of each individual is obtained, and the obtained blood concentration data is obtained based on at least one of the following composite indices 1 to 4. Calculating the pathological index value of liver fibrosis from the medium concentration data group, composite index 1;
- the disease state of liver fibrosis is determined according to the calculated disease state index value, one blood amino acid Using the measurement data such as concentration, it is possible to screen a lot of dystrophic fibrosis, leading to a significant reduction in examination costs.
- each metabolite that constitutes at least one of the composite indices 1 to 4 for lunar fibrosis may be a factor or result of the liver fibrosis
- the composite indices 1 to 4 It is possible to develop a treatment for hepatic fibrosis using at least one of them as a marker.
- amino acid in at least one of the composite indices 1 to 4 can be replaced with, for example, an amino acid having chemically equivalent properties.
- the composite index 1 may be replaced with, for example, the following composite indexes 111 to 110.
- the composite index 2 is, for example, the following composite index 2— :! ⁇ 2-20 may be substituted.
- composite index 3 may be replaced with, for example, the following composite indexes 3-1 to 3-20.
- the composite index 4 can be replaced with, for example, the following composite index 4 1 1 to 4—20 Yo
- the present invention relates to a liver fibrosis determination system, the liver line according to the present invention
- the fibrosis determination system is composed of a liver fibrosis determination device that processes information related to liver fibrosis and a metabolite information provider's information terminal device that is communicably connected via a network.
- a determination system wherein the liver fibrosis determination device comprises: a blood concentration data acquisition unit that acquires a blood concentration data group measured for each metabolite of each individual from the information terminal device;
- a pathological index value calculating means for calculating a pathological index value for hepatic fibrosis from the blood concentration data group obtained by the blood concentration data collecting means based on at least one of
- a pathological condition determining means for determining a pathological condition of liver fibrosis according to the pathological condition index value calculated by the pathological condition index value calculating means; and a pathological condition determining means for the information terminal device which has transmitted the blood concentration data group.
- Analysis result transmitting means for transmitting the determination result determined by the above, wherein the information terminal device transmits the blood concentration data group to the liver fibrosis determination device, and the transmission device Receiving means for receiving from the hepatic fibrosis determination device the determination result for the blood concentration data group transmitted in (1).
- the hepatic fibrosis determination device comprises: A blood concentration data group measured for each metabolite of an individual is obtained from an information terminal device, and liver fibrosis data is obtained from the obtained blood concentration data group based on at least one of the following composite indices 1 to 4. Hinoki Calculate the state index value, Composite finger 1;
- the disease state of hepatic fibrosis is determined according to the calculated disease state index value, the determination result is transmitted to the information terminal device that transmitted the blood concentration data group, and the information terminal device transmits the blood concentration data.
- the group is transmitted to the liver fibrosis determination device, and the determination result for the transmitted blood concentration data group is received from the liver fibrosis determination device, so that one measurement result data such as blood amino acid concentration can be obtained. It can be used to screen a lot of liver fibrosis, leading to a significant reduction in testing costs.
- this makes it possible to make a diagnosis by analyzing the measurement result data such as the blood amino acid concentration in the past.
- each metabolite constituting at least one of the composite indexes 1 to 4 for liver fibrosis may be a factor or a result of the liver fibrosis
- the composite indexes 1 to 4 It is possible to develop a treatment for liver fibrosis using at least one of them as a marker.
- at least one of the amino acids in the compound indexes 1 to 4 can be replaced with an amino acid having chemically equivalent properties.
- the composite index 1 may be replaced with, for example, the following composite index 11-1 to 1-20. (Compound index 1 1 1)
- composite index 2 may be replaced with, for example, the following composite indexes 2-1 to 2-20.
- the composite index 3 is, for example, the following composite index 3— :! May be replaced with ⁇ 3-20
- T au -I- G 1 y) / (G in) + (a-ABA) / (Me t + T yr) + H is) Z (L ys) + (T rp) / (A sp + Th r + A sn + C it)
- the composite index 4 may be replaced with, for example, the following composite index 4—4—20.
- the present invention relates to a recording medium, and the recording medium according to the present invention is characterized by recording the program described above.
- the program described above can be realized by using a computer by reading and executing the program recorded on the recording medium. The effect can be obtained.
- the present invention also relates to a liver fibrosis determination device, a liver fibrosis determination method, and a program, and the present invention relates to a liver fibrosis determination device according to the present invention, a liver fibrosis determination method according to the present invention, and
- a program for causing a computer to execute the method for determining hepatic fibrosis according to the present invention includes a blood concentration data acquisition unit (blood concentration data) for acquiring a blood concentration data group measured for each metabolite of each individual. Data acquisition step), a composite index setting means (composite index setting step) for setting a composite index for calculating a pathological index value of liver fibrosis, and a composite index setting means (composite index setting step).
- the blood concentration data acquisition means (blood concentration data acquisition step) A) a pathological index value calculating means (pathological index value calculating step) for calculating a pathological index value of hepatic fibrosis from the blood concentration data group obtained in step (b); and a pathological index value calculating means (pathological index value calculating step). And a pathological condition judging means (pathological condition judging step) for judging the pathological condition of liver fibrosis in accordance with the pathological index value calculated in (2).
- the composite index setting means includes A sn, A component consisting of at least one of the blood concentration data of G 1 n as the numerator and at least one of the blood concentration data of Thr, T au, Ser, Val, and T rp as the denominator.
- Compound index 1 which is a mathematical expression or a fractional expression consisting of a sum of multiple terms (Additionally, add the blood concentration data of Met to the numerator and the blood concentration data of I 1 e, a-ABA, As to the denominator. Means to create a composite index 1 And at least one of the blood concentration data of AS IT Met as the numerator and at least one of the blood concentration data of a-ABA and C it as the denominator.
- Compound index 2 which is a mathematical expression or a fractional expression consisting of a sum of multiple terms (Furthermore, Tyr, Arg blood concentration data are used as numerators, and His, Thr, Trr, Asp, G1u Create the composite index 2 (the step of creating the composite index 2) and the blood of ⁇ -ABA, His, Gly, Trp, and Ta11.
- One term that has at least one ⁇ 3 of the medium concentration data as the numerator and at least one of the blood concentration data of Asn, G1n, Cit, Lys, Thr, and Tyr as the denominator Create a compound index 3 that is a mathematical expression or a fractional expression consisting of a sum of multiple terms (furthermore, blood concentration data of Met and Asp may be arbitrarily added to the denominator).
- the compound index 4 is a fractional expression consisting of a single term or a sum of multiple terms with a denominator of 4 (in addition, the blood concentration data of ⁇ - ⁇ and T au
- a special feature is that it additionally includes (includes) at least one of the composite index 4 creation means (composite index 4 creation step) that creates the density data may be arbitrarily added to the denominator.
- a compound finger for obtaining a blood concentration data group measured for each metabolite of each individual and calculating a pathological index value of liver fibrosis is obtained.
- At least one of the blood concentration data of A sn and G 1 n is used as the numerator, and the blood concentration data of Thr, Tau, Ser, Val, and Trp are used.
- a composite index 1 that is a fractional expression consisting of one term or a sum of multiple terms with at least one in the denominator (in addition, the blood concentration data of Met is used as the numerator, and I le, a-AB A, The blood concentration data of Asp may be arbitrarily added to the denominator), and at least one of the blood concentration data of Asn and Met is used as the numerator, and the blood concentration data of a-ABA and Cit
- a composite index 2 that is a fractional expression consisting of one term or a sum of plural terms with at least one of The blood concentration data of Tyr and Arg may be added to the numerator, and the blood concentration data of His, Thr, Trp, Asp and G1u may be added to the denominator.
- At least one of ABA, His, G1y, Trp, and Tau blood concentration data is used as a molecule, and Asn, Gln, Cit, Lys, Thr, and Tyr blood concentrations
- Composite index 3 which is a
- a composite index 4 that is a fractional expression or a fractional expression consisting of the sum of multiple terms (Additionally, blood concentration data of a-ABA and T au is added to the numerator, and blood concentration data of Even Since creating at least one of a), using the measurement result data such as blood Amino acid concentration once allows the screening of a number of liver fibrosis, leading to a significant reduction in inspection costs.
- this makes it possible to make a diagnosis by analyzing the measurement result data such as the blood amino acid concentration in the past.
- each metabolite constituting the composite index for hepatic fibrosis may be a factor or a result of the hepatic fibrosis
- the development of a therapeutic method for hepatic fibrosis using this composite index as a marker has been developed. Will be possible. .
- the present invention relates to a hepatic fibrosis determination system, and a hepatic fibrosis determination system according to the present invention includes a hepatic fibrosis determination device that processes information related to hepatic fibrosis, and an information terminal of a metabolite information provider.
- a hepatic fibrosis determination system configured to be communicably connected to a device via a network, wherein the hepatic fibrosis determination device includes a blood concentration data group measured for each metabolite of each individual.
- the composite index setting means for setting a composite index for calculating the pathological index value of liver fibrosis, and the composite index set by the composite index setting means,
- a pathological index value calculating means for calculating a pathological index value of liver fibrosis from the blood concentration data group obtained by the blood concentration data obtaining means; and the pathological index calculated by the pathological index value calculating means
- Disease state determining means for determining the pathological state of hepatic fibrosis according to the value
- the composite index setting means uses at least one of the blood concentration data of As n and G 1 n as a molecule, Thr, Ta
- a composite index 1 that is a fractional expression consisting of a one-term force or a fractional expression consisting of a sum of multiple terms with at least one of the blood concentration data of u, Ser, Val, and Trp in the denominator.
- the blood concentration data may be added to the numerator, and the blood concentration data of Ile, Hi-ABA and Asp may be arbitrarily added to the denominator.
- Index 2 (Furthermore, the blood concentration data of Tyr, A1-g was used as the numerator, and the blood concentration data of His, Thr, Trp, Asp, and Glu were used.
- Data may be added to the denominator arbitrarily), and at least one of the blood concentration data of ⁇ - ⁇ , His, Gly, and TrpTau as a numerator.
- a sn, G ln, C it Ly s, Th r, T yr A compound expression that is a fractional expression consisting of a single term or a sum of multiple terms that has at least one of the blood concentration data as the denominator.
- a composite index 3 creating means for creating index 3 (further, the blood concentration data of Met and Asp may be arbitrarily added to the denominator) and at least one of blood concentration data of His and Trp
- Analysis result transmitting means for transmitting the determination result determined by the disease state determining means to the information terminal device which has transmitted the blood concentration data group, wherein the information terminal device comprises: Transmitting means for transmitting to the liver fibrosis determination device; and receiving means for receiving the determination result for the blood concentration data group transmitted by the transmission means from the liver fibrosis determination device.
- the device for determining fibrosis of the moon obtains a group of blood concentration data measured for each of the twins of each individual, and calculates a composite index for calculating a pathological index of liver fibrosis. Based on the set composite index, calculate the liver fibrosis pathological index value from the acquired blood concentration data group, determine the liver fibrosis pathological condition according to the calculated pathological index value, and In setting the index, at least one of the blood concentration data of Asn and G1n is used as the numerator, and at least one of the blood concentration data of Thr, Tau, Ser, Val, and Trp is used as the numerator.
- Compound index 1 that is a fractional expression consisting of one term or a sum of multiple terms in the denominator (In addition, the blood concentration data of I le, a-ABA, and As May be arbitrarily added to the denominator).
- A;-Compound index that is a fractional formula consisting of one term or a sum of multiple terms that has at least one of the blood concentration data of ABA and C it as the denominator.
- Compound index 4 which is a fractional expression or a fractional expression composed of the sum of multiple terms (more-the blood concentration data of ABA and Tau as the numerator, and the blood concentration of Viet and Asp)
- the concentration data may be arbitrarily added to the denominator), and transmits the determination result to the information terminal device that transmitted the blood concentration data group. Transmits the blood concentration data group to the liver fibrosis determination device, and receives the determination result for the transmitted blood concentration data group from the liver fibrosis determination device. Using the measurement result data, it is possible to screen a large amount of liver fibrosis, leading to a significant reduction in examination costs.
- this makes it possible to make a diagnosis by analyzing the measurement result data such as the blood amino acid concentration in the past.
- each metabolite constituting the composite index for liver fibrosis may be a factor or result of the liver fibrosis, a method for treating liver fibroids using this composite index as a marker is considered. Development becomes possible. ⁇
- the present invention also relates to a recording medium, and the recording medium according to the present invention is characterized by recording the program described above.
- the program described above can be realized by using a computer by reading and executing the program recorded on the recording medium. The effect can be obtained.
- FIG. 1 is a principle configuration diagram showing a basic principle of setting a correlation equation in the present invention
- FIG. 2 is a block diagram showing an example of a configuration of the present system to which the present invention is applied
- FIG. FIG. 4 is a block diagram showing an example of a configuration of a server apparatus 100 of the present system to which the present invention is applied.
- FIG. 4 is an example of a configuration of a client apparatus 200 to which the present invention is applied.
- FIG. 5 is a block diagram showing an example of the configuration of the biological condition information acquisition unit 102 g of the present system to which the present invention is applied
- FIG. 6 is a block diagram showing the present invention.
- FIG. 1 is a principle configuration diagram showing a basic principle of setting a correlation equation in the present invention
- FIG. 2 is a block diagram showing an example of a configuration of the present system to which the present invention is applied
- FIG. 4 is a block diagram showing an example of a configuration of a server apparatus 100 of the present system to which the present invention
- FIG. 4 is a block diagram showing an example of a configuration of a correlation expression creating unit 102 i of the present system used-
- FIG. 7 is a diagram showing an example of user information stored in the user information database 106a
- FIG. 8 is an example of information stored in the biological condition information database 106b.
- FIG. 9 is a diagram showing an example of information stored in the correlation information database 106 c.
- FIG. 10 is a diagram showing information stored in the correlation expression information database 106 d.
- FIG. 11 is a diagram showing an example of information stored in a metabolic map information database 106 e.
- FIG. 12 is a diagram showing a living body of the system according to the present embodiment.
- FIG. 13 is a flowchart illustrating an example of a state information analysis service process.
- FIG. 13 is a flowchart illustrating an example of a biological state information analysis process of the present system according to the present embodiment.
- FIG. Optimization processing using an exhaustive calculation method by the system Fig. 15 is a flowchart showing an example
- Fig. 15 is a flowchart showing an example of the optimization processing 1 using the best path method by the present system
- Fig. 16 is a flowchart showing the optimization processing 2 by the present system.
- FIG. 17 is a conceptual diagram showing an example of biological condition information.
- FIG. 18 is a flowchart showing biological condition index data (correlation with T) determined for each amino acid.
- FIG. 19 is a conceptual diagram showing an example.
- FIG. 19 is a diagram showing an example of a main menu screen displayed on a monitor.
- FIG. 19 is a conceptual diagram showing an example of a main menu screen displayed on a monitor.
- FIG. 20 is a diagram showing an example of a file import screen displayed on a monitor.
- FIG. 21 is a diagram showing an example of an amino acid (metabolite) input screen displayed on the monitor
- FIG. 22 is an example of a biological condition index input screen displayed on the monitor.
- Figure 23 shows the monitor
- FIG. 24 is a diagram showing an example of a calculation formula master maintenance screen shown in FIG. 24.
- FIG. 24 is a diagram showing an example of a process item selection screen displayed on the monitor.
- FIG. 25 is a diagram showing positive and negative signs displayed on the monitor. It is a figure which shows an example of a judgment confirmation screen
- FIG. 26 is a figure which shows an example of a compound index search screen displayed on a monitor
- FIG. 27 is an execution result displayed on a monitor (1)
- FIG. 28 shows an example of a sheet (“analysis” raw data) screen.
- FIG. 28 shows an example of an execution result (2) sheet (composite index search condition) screen displayed on the monitor.
- FIG. 29 shows an example of the execution result (3) sheet (best composite index) screen displayed on the monitor.
- FIG. 30 shows the execution result displayed on the monitor.
- FIG. 31 is an example of an execution result displayed on a monitor screen.
- Sheet (correlation graph) is a diagram showing an example of a screen.
- Fig. 32 shows an example of the execution result (6) sheet ("amino acid (metabolite)" raw data) screen displayed on the monitor screen.
- Fig. 33 shows the screen displayed on the monitor screen.
- FIG. 34 is a diagram showing an example of a screen, and FIG. 34 shows a correlation expression of a plurality of metabolites with respect to a biological condition using a divided calculation formula.
- FIG. 35 is a diagram for explaining the concept of the calculation method.
- FIG. 35 is a diagram for explaining the concept of the calculation method.
- FIG. 35 is a diagram showing the relationship between the composite index of liver fibrosis (composite index 5) obtained by the present system and the stage of the disease state.
- FIG. 36 is a diagram for explaining the concept of a process of dividing a calculation formula based on metabolic map information and calculating a correlation formula of a plurality of metabolites for a biological state using the divided calculation formula.
- the figure shows normal rats and
- Fig. 38 is a diagram showing the relationship between the composite index (complex index 6) and the stage of the disease state in diabetic (GK) rats.
- FIG. 38 shows normal rats, diabetic (GK) rats, and , A composite index in diabetic (GK) rats treated with nateglinide (nateg 1 inide) or glibenclamide (g 1 ibe 11c1 amide), which is a therapeutic agent for II urinary disease.
- Fig. 39 shows the relationship between normal rats and diabetic (GK) rats, and nateglinide (nateg 1 inide), a therapeutic drug for diabetes, determined by this system. ) Or a graph showing the mean (Sat SD) of each population of the composite index (Compound Index 6) in diabetic (GK) rats treated with glipenclamide (glibencl amide).
- FIG. 39 shows the relationship between normal rats and diabetic (GK) rats, and nateglinide (nateg 1 inide), a therapeutic drug for diabetes, determined by this system.
- a graph showing the mean (Sat SD) of each population of the composite index (Compound Index 6) in diabetic (GK
- FIG. 40 is a flowchart showing an example of the metabolite information analysis processing of the present system in the present embodiment.
- FIG. 41 shows an example of calculating the pathological index value of the present system in the present embodiment.
- FIG. 42 is a flowchart showing the concept of a method of calculating a correlation equation using a plurality of selected objects.
- FIG. 43 is a diagram showing an optimum method of the present system to which the present invention is applied.
- FIG. 44 is a block diagram showing an example of the configuration of the conversion unit 102j.
- FIG. 44 is a conceptual diagram illustrating the interpretation of the calculation formula.
- FIG. 45 is a liver fiber of the present system to which the present invention is applied.
- FIG. 46 is a block diagram showing an example of the configuration of the conversion judging device 400, and FIG.
- FIG. 46 is a block diagram showing an example of the configuration of the ftf object information acquiring section 402g of the present system to which the present invention is applied.
- Fig. 47 shows the usage stored in the user information database 406a.
- Affection 48 shows an example of information stored in the metabolite information database 406b.
- FIG. 49 shows an analysis of hepatic fibrosis information of the system according to the present embodiment.
- FIG. 50 is a flowchart illustrating an example of service processing.
- FIG. 50 is a diagram illustrating an example of information stored in a liver fibrosis index database 406c.
- FIG. 51 is a diagram illustrating each of composite indexes 1 to 4.
- Fig. 52 shows the rules for replacing the amino acids in the liver.
- Fig. 52 shows the composite index of liver fibrosis (composite index 1) and the pathological condition of the control group and patients with menstrual C type disease determined by this system.
- Fig. 53 shows the relationship between the composite index of hepatic fibrosis (composite index 2) obtained by this system and the stage of the disease state in the control group and patients with hepatitis C in the control group.
- Fig. 54 shows the relationship between the composite index of liver fibrosis (composite index 3) obtained by this system and the stage of the disease state in the control group and hepatitis C patients.
- FIG. 5 is a graph showing the relationship between the composite index of liver fibrosis (composite index 4) obtained by the present system and the stage of the disease state in hepatitis C patients.
- Fig. 56 shows the relationship between the control group and hepatitis C patients.
- FIG. 57 is a diagram showing the relationship between the Fisher ratio and the stage of the disease state.
- FIG. 57 is a diagram showing the principle of the present invention
- FIG. 58 is a diagram showing the apo-E knockout mouse (ApoE KO).
- FIG. 59 shows an example of discrimination between normal mice (Norma 1) and normal mice, and FIG. 59 shows the status of normal mice infected with attenuated influenza virus A / Aichi / 2Z68 (H3N2).
- FIG. 60 is a diagram showing an example of determination of a non-infected state.
- Fig. 61 shows an example in which the change in the numerical values obtained by the discriminant equation when the influenza virus was similarly infected after ingestion of cystine and theanine was compared with the normal food intake group.
- Fig. 62 shows an example of discrimination between streptozotocin-administered rats (STZ) and healthy rats (Norm1), which is a diabetes model animal.
- Fig. 62 shows GK rats (GK), which are type II monodiabetic model animals.
- FIG. 63 is a diagram showing an example of discrimination between a normal rat (Normal) and a normal rat (NoGI).
- FIG. 64 is a diagram showing an example of discrimination between liver fibrosis model rats (DMN) and normal rats (Norma 1) prepared by administration of dimethylnitrosamine, and FIG. Rats with low protein intake (Low FIG. 66 shows an example of discrimination between Protein) and a normal diet-fed rat (Normal).
- FIG. 66 shows a high-fat diet-fed mouse (HighFat) and a normal diet-fed mouse (Norma1).
- Fig. 67 shows the amount of lipid peroxide in the liver (LiVer-TBRAS) and the value calculated based on the formula optimized for the amount of lipid peroxide.
- FIG. 69 is a graph showing the correlation with the calculated value (Index-TCHO).
- FIG. 69 shows the blood insulin-like growth factor concentration (Plasma IGF-1) and the blood insulin-like growth factor concentration.
- FIG. 70 is a graph showing a correlation with a value calculated based on an equation optimized for the anatomy (Index-IGF-1).
- FIG. 71 is a diagram showing a correlation between (WAT) and a value (Index-WAT) calculated based on the formula optimized for the body fat ratio of the epididymal fat, and FIG.
- FIG. 71 shows streptozotocin-treated rats
- FIG. 72 is a diagram showing an example in which these different states are collectively discriminated based on the amino acid concentrations in blood of GK rats, rats into which human growth hormone gene has been introduced, liver fibrosis model rats, and normal rats.
- FIG. 73 is a diagram showing an example of a batch diagnosis of the results of insulin treatment in rats with type I monosaccharide urine disease.
- FIG. 73 is a diagram showing an example of the prediction results of the treatment effect of interferon and ribavirin.
- FIG. 4 is a diagram showing amino acid compound indices before and after transportation. Best mode for carrying out the explanation
- FIG. 57 is a principle configuration diagram showing the basic principle of the present invention.
- the present invention generally has the following basic features. That is, the present invention provides a mathematical formula 1 showing the correlation between the index data relating to the biological state measured in each individual and the blood concentration data (such as “clinical data”) measured for each metabolite in each individual. The correlation equation shown is set (step S1-1).
- Equation 1 i, j, and k are natural numbers, and Ai, ⁇ ) are the blood concentration data of metabolites or the values obtained by processing them, ⁇ Di, Ej, Fj, G k And H are constants.) '
- the pattern for setting the correlation equation includes “a pattern in which the blood concentration of each amino acid contained in the clinical data is applied to Equation 1, and each constant of Equation 1 is newly determined to set the correlation equation (pattern 1). ) "And" pattern (pattern 2) for setting a previously obtained correlation equation ".
- pattern 2 when a correlation equation in which a constant is determined by pattern 1 is stored in a predetermined file in a storage device in advance and a desired correlation equation is selected from the file and set, or when another computer apparatus is used. This includes the case where the correlation equation stored in advance in the storage device is downloaded and set via the network.
- the blood concentration data group (“subject data”) measured for each metabolite in the individual to be simulated is calculated using the correlation equation set in step S1-1. Substitution is performed to simulate the state of the living body in the individual to be simulated, and the diagnosis result is output (step S1-2).
- the present invention can be used to evaluate, for example, health conditions, disease progression status, disease treatment status, future disease risk, drug efficacy, drug side effects, etc., based on the blood levels of metabolites in an individual. Simulation.
- an example of the outline of the new correlation equation setting based on the above-described pattern 1 in step S1-1 will be described in detail with reference to FIG. 1 and the like.
- FIG. 1 is a principle configuration diagram showing a basic principle of setting a correlation equation in the present invention.
- the correlation equation setting in the present invention has the following basic features roughly. That is, the correlation formula setting in the present invention is performed by firstly determining biological data including index data on various biological states measured in each individual, and a blood concentration data group measured on each metabolite in each individual. Obtain information (step S-1).
- FIG. 17 is a conceptual diagram showing an example of the biological state information.
- the biological condition information includes the individual (sample) number and the index data of each biological condition.
- T blood concentration data group of each metabolite (for example, amino acid).
- the “index data relating to the biological state” is a known single state index that serves as a marker for a biological state (eg, a disease state such as cancer, cirrhosis, dementia, or obesity).
- Numerical data such as blood levels of metabolites, enzyme activities, gene expression levels, and dementia index (HDSR).
- the “blood concentration data group” for each metabolite may be a group of biochemical data such as gene expression or enzyme activity, or a mixture of these (metabolite concentration, gene expression, A plurality of numerical data sets combining enzyme activities and the like are also applicable.
- the correlation formula setting in the present invention is carried out in the following manner: index data relating to various biological conditions measured in each individual, and blood concentration data measured for each metabolite in each individual. Based on the group, determine the correlation of each metabolite with the index data (Step S-2).
- correlationcoefficien t or “Pearson's correlation coefficient (Pearsonscorrelationcoe fficient)”, which is an index to measure the strength of the linear relationship between the bivariate x and y
- “Spearman's The correlation between each index T and each amino acid is calculated by calculating the correlation coefficient, which is a known technique, such as correlation coefficient (Spearman's scorrelation coefficient) and Kendall's (Kendall's scorrelation coefficient). Sex may be determined.
- the AIC Kaike Information Criterion
- the model may be selected by evaluating the difference between the correlation equation and the actual data.
- the correlation data when comparing between different states such as healthy and pathological states as described above, the correlation data (correlationratio), the _t dagger (varianceratio) )
- a calculation formula may be obtained so that the difference between the groups is maximized by using, for example, Ma halanobis' generalized distance.
- the discriminant when a plurality of discriminants are obtained based on these criteria, the discriminant may be selected based on the discriminability between the actual states by using discriminant analysis (Discriminant tanalysis) or the like.
- FIG. 18 is a conceptual diagram showing an example of the correlation with the index data (T,) of the biological state determined for each amino acid.
- T index data
- the correlation of each amino acid with the index data of a specific biological condition (T is determined from the blood concentration data of each amino acid.
- the correlation is, for example, Pearson's If Pearson's correlation coefficient is taken, its value will be in the range of 1 to 1, and the closer the absolute value of the value is to 1, the more linearly the point will be. Indicates that they are arranged.
- the correlation equation setting in the present invention is based on the correlation of each metabolite determined in step S-2, using a predetermined calculation equation to calculate the correlation equation of a plurality of metabolites to the biological state ( (Step S_3).
- a predetermined calculation formula for example, any one of the following six calculation formulas may be used.
- the “sum of amino acids” in the above-mentioned correlation expression means “sum of blood concentration values of amino acids”.
- FIG. 44 is a conceptual diagram explaining the interpretation of the calculation formula.
- the calculation formula can be regarded as the result of projection (mapping) of the relationship between the biological indices into a theoretical system limited to addition, division, etc. It can be considered that the mapping between the formulas can be taken.
- the correlation equation setting in the present invention is performed based on the correlation coefficient between the correlation equation (R) determined in step S-3 and the index data (T) of the biological condition.
- the correlation equation (R) is optimized (step S-4) so that the correlation coefficient is higher (for example, the highest 20 ranks, and preferably, the number of correlations is maximized).
- the optimization methods include (a) a method of selecting a metabolite such as an amino acid used in the calculation,
- FIG. 42 is a diagram showing the concept of a method of calculating a correlation equation using a plurality of selected metabolites.
- T index data
- metabolites a, b, c, d, e,..., n
- negatively correlated metabolites A, B, C, D, E,..., N.
- the “sum of amino acids” in the above-mentioned correlation expression means “sum of blood concentration values of amino acids”.
- FIG. 34 is a diagram for explaining the concept of a method of calculating a correlation formula using a plurality of metabolites for a biological state using the divided calculation formulas.
- a correlation equation (R) obtained by a predetermined calculation equation and a correlation equation (R 2 , R 3 , R 4 ,. , R k ) and the correlation coefficient for the index data (T) of the biological state are calculated, and the calculation formula that maximizes the correlation coefficient is calculated. For example, a plurality of items having a large correlation coefficient may be indicated.
- the calculation formula may be divided based on the metabolic map information, and the correlation formula of a plurality of metabolites with respect to the biological state may be calculated using the divided calculation formula.
- FIG. 36 is a diagram illustrating the concept of a process of dividing a calculation formula based on metabolic map information and calculating a correlation formula of a plurality of metabolites for a biological state using the divided calculation formula. is there.
- FIG. 36 illustrates an example of the relationship between the metabolic map related to hepatitis and the calculation formula of the correlation formula.
- the calculation formula is divided using the metabolic map information to obtain actual biochemical knowledge. It is possible to divide the calculation formula based on the calculation.
- the importance of each metabolic pathway may be optimized by adding a coefficient to the formula.
- multiple regression analysis Multiple regressionanalysis
- the coefficient can be calculated as in the following equation (2).
- the correlation equation can be further optimized.
- Stage (liver fibrosis index) G 1 u / H is + Me t / H is + Cys / ll is + Orn / Pro + A sp G 1 u + A sp / A sn + ABA / Me t -I- ABA / Th r + T au / H is + G 1 u / G 1 n
- Stage (index of liver fibrosis) 0.590 kg 1 u / H is + 0.247 * Me t / H is + 0.250 * Cys / H is + 0.170 * 0 rn / Pro + 0 146 * A sp / G 1 u + 0.080! ⁇ A sp / A sn + 0.215 K AB A / M et + 0.142 * ABA / Tli r +0.123 * T au / H is + 0 . 49 3 * G lu / G l n + ERROR
- the correlation equation setting in the present invention is performed by using the calculation condition that maximizes the correlation coefficient as a result of the optimization of the correlation equation in step S-4 as a composite index of the biological state. Yes (Step S-5).
- these calculation equations can be used as a composite index of a plurality of metabolites for each biological state.
- FIG. 2 is a block diagram showing an example of a configuration of the present system to which the present invention is applied, and conceptually shows only a portion related to the present invention in the configuration.
- the system schematically includes a server 10, which is a biological condition information processing device that processes information on a biological condition, and a client device 200, which is an information terminal device of a biological condition information provider, and a network 300. It is configured to be communicably connected via a server 10, which is a biological condition information processing device that processes information on a biological condition, and a client device 200, which is an information terminal device of a biological condition information provider, and a network 300. It is configured to be communicably connected via
- This system has the following basic characteristics. That is, information on a biological state is transmitted from the server device 100 to the client device 200 or from the client device 200 to the server device 100 via the network 300. Provided.
- the information on the biological condition is information on values measured for specific items related to the biological condition of a living organism such as a human, and the server device 100, the client device 200, or another device. (For example, various measuring devices, etc.), and are mainly stored in the server device 100. Further, examples of the information on the biological state include, for example, disease state information described later. '
- the server device 100 may be realized in the same housing as various analyzers (for example, an amino acid analyzer).
- FIG. 3 is a block diagram showing an example of a configuration of a server apparatus 100 of the present system to which the present invention is applied, and conceptually shows only a portion related to the present invention in the configuration. .
- a server device 100 is a control device 102 such as a CPU that controls the entire server device 100 as a whole, and a communication device such as a router connected to a communication line. (Not shown), the communication control interface 104 connected to the input device 112 and the output device 114 connected to the input / output device 114, and various databases and tables And a storage unit 106 for storing the information. These units are communicably connected via an arbitrary communication path. Further, the server device 100 is communicably connected to a network 300 via a communication device such as a router and a wired or wireless communication line such as a dedicated line.
- the various databases and tables (user information database 6a to metabolic map information database 106e) stored in the storage unit 106 in FIG. 3 are storage means such as a fixed disk device, and are used for various processes. Stores various programs to be used, tables, file database, web file, etc.
- the user information database 106a is a user information storage unit for storing information about users (user information).
- FIG. 7 is a diagram showing an example of user information stored in the user information database 106a.
- the information stored in the user information database 106a includes a user ID for uniquely identifying each user, and whether or not each user is a valid person.
- User password to authenticate the user, the name of each user, the affiliation ID for uniquely identifying the affiliation to which each user belongs, and the identification of the department to which each user belongs.
- the department ID, department name, and e-mail address of each user are associated with each other.
- the biological state information database 106 b is a biological state information storage unit that stores biological state information and the like.
- FIG. 8 is a diagram showing an example of information stored in the biological condition information database 106b.
- the information stored in the biological state information database 106b includes an individual (sample) number, index data (T) of each biological state, and each metabolite (for example, amino acid). Etc.) and the blood concentration data group.
- the correlation information database 106 c is a correlation information storage unit that stores information related to correlation and the like.
- FIG. 9 is a diagram showing an example of information stored in the correlation information database 106c.
- the information stored in the correlation information database 106c is configured by associating the metabolites with the correlation of each metabolite with the index data (T) and the like. .
- the correlation expression information database 106 d is a correlation expression storage means for storing information related to the correlation expression and the like.
- FIG. 10 is a diagram showing an example of information stored in the correlation expression information database 106 d.
- the information stored in the correlation expression information database 106 d includes biological condition index data (T), a correlation expression (R), and a composite index (one or more). ) And are associated with each other.
- the metabolic map information database 106 e is a metabolic map information storage means for storing information on the metabolic map and the like.
- FIG. 11 is a diagram showing an example of information stored in the metabolic map information database 106 e.
- the information stored in the metabolic map information database 106 e is shown in FIG.
- information on each metabolic map for example, information on each node constituting each pathway, information on each edge, and the like are associated with each other.
- information on the metabolic map for example, information on a known metabolic map provided by KEGG or the like may be obtained, and the information may be processed and used as needed.
- various web data, a CGI program, and the like for providing a web site to the client device 200 are recorded in the storage unit 106 of the server device 100.
- the web data includes data for displaying various web pages described later, and these data are formed as, for example, a text file described in HTML or XML.
- a file for parts for creating these web data, a file for work, and other temporary files are also stored in the storage unit 106.
- audio to be transmitted to the client device 200 is stored in an audio file such as a WAVE format or an AIFF format, and still images and moving images are stored in an image file such as a JPEG format or an MPEG2 format. Can be stored.
- a communication control interface unit 104 controls communication between the server device 100 and the network 300 (or a communication device such as a router). That is, the communication control interface unit 104 has a function of communicating data with another terminal via a communication line.
- an input / output control interface unit 108 controls the input device 112 and the output device 114.
- a speaker can be used as the output device 114 (the output device 114 may be described as a monitor in the following).
- the input device 112 a keyboard, a mouse, a microphone, or the like can be used.
- the monitor also realizes the pointing device function in cooperation with the mouse.
- the control unit 102 has a control program such as an operating system (OS), a program that defines various processing procedures, and an internal memory for storing required data. , These programs, etc., Performs information processing for executing the processing.
- the control unit 102 is functionally conceptually composed of a request interpretation unit 102 a, a browsing processing unit 102 b, an authentication processing unit 102 c, an e-mail generation unit 102 web page generation unit 100 2 e, a transmission unit 102 ⁇ , a correlation formula setting unit 102 ⁇ , a biological state simulation unit 102 w, and a result output unit 102 k.
- the request interpreting unit 102a is a request interpreting unit that interprets the contents of the request from the client device 200 and transfers the processing to other units of the control unit according to the result of the interpretation.
- the browsing processing part 1 0 2 b Upon receiving browsing request for various screens from the client apparatus 2 0 0, c also a browsing processing unit for generating and transmitting the W eb data for these screens, the authentication process
- the unit 102c is an authentication processing unit that receives an authentication request from the client device 200 and makes this authentication determination.
- the e-mail generation unit 102 d is an e-mail generation unit that generates an e-mail including various types of information.
- the Web page generation unit 102 e is Web page generation means for generating a Web page to be viewed by a user.
- the transmitting unit 102 f is a transmitting unit that transmits various types of information to the client device 200 of the user.
- the transmitting unit 102 f transmits the composite index to the client device 200 that transmitted the biological state information. This is an analysis result transmitting means for transmitting the result.
- the correlation formula setting unit 102 V calculates the correlation between the index data regarding the biological state measured in each individual and the blood concentration data measured for each metabolite in each individual. Is a correlation equation setting means for setting the correlation equation shown in FIG.
- the correlation formula setting unit 102 V further includes a biological condition information acquisition unit 102 g, a correlation determination unit 102 h, a correlation formula creation unit 102 i, and an optimization unit 102 j.
- the biological condition information acquiring unit 1 0 2 g are index data on an bIOLOGICAL states of various measured in each individual, and the blood that has been measured for each metabolite in each individual
- the biological condition information acquiring unit 102g further includes a metabolite specifying unit 102m and a biological condition index data specifying unit 102n as shown in FIG.
- FIG. 5 is a block diagram showing an example of the configuration of the biological condition information acquiring unit 102g of the present system to which the present invention is applied, and conceptually shows only those parts of the configuration related to the present invention. Is shown.
- the metabolite designation section 102 m is a metabolite designation means for designating a desired metabolite.
- the biological condition index data designating unit 102 n is a biological condition index data designating unit that designates desired biological condition index data.
- the correlation determining unit 102 h divides the index data relating to various biological states measured in each individual and the blood concentration data group measured for each metabolite in each individual. It is a correlation determining means for determining the correlation between each metabolite and the index data based on the metabolites.
- the correlation formula creation unit 102 i generates a correlation formula for creating a correlation formula (correlation function) for a plurality of metabolites with respect to a biological state by a predetermined calculation method based on the determined correlation of each metabolite. Means.
- the correlation formula creating unit 102 i further includes a positive / negative setting unit 102 p and a calculation formula setting unit 102 r (see FIG. 6).
- FIG. 3 is a block diagram showing an example of the configuration of a correlation expression creating section 102 i of the present system to which the present invention is applied, and conceptually shows only a portion related to the present invention in the configuration.
- a positive / negative setting unit 102 p is positive / negative setting means for setting positive or negative for the correlation of each metabolite.
- calculation formula setting unit 102 r performs a calculation for setting a calculation formula for creating a correlation formula.
- Expression setting means
- the optimizing unit 102 j determines based on the correlation coefficient between the determined correlation equation (R) and the index data regarding the biological state (for example, the correlation coefficient is higher (for example, Optimizing means for optimizing the correlation equation (R) so that the correlation coefficient (R) is maximized (preferably the correlation coefficient is maximized).
- the optimizing unit 102 j further includes a metabolite selecting unit 102 s, a calculation formula dividing unit 102 t, and a metabolic map dividing unit 102 u. It is comprised including.
- FIG. 43 is a block diagram showing an example of a configuration of the optimizing unit 102 j of the present system to which the present invention is applied, and conceptually shows only a part related to the present invention in the configuration. I have.
- the metabolite selection unit 102 selects a part of metabolites from each metabolite, creates a correlation formula using the selected plurality of metabolites,
- the correlation coefficient for the index data is calculated, and based on the correlation coefficient and the number of metabolites for the index data related to the biological state (for example, the correlation coefficient is higher (for example, the top 20) and the number of metabolites is smaller.
- it is a metabolite selection means for optimizing the combination of metabolites (to maximize the correlation coefficient and minimize the number of metabolites).
- calculation formula dividing unit 102 t divides the calculation formula, calculates a correlation formula of a plurality of metabolites with respect to a biological state using the divided calculation formula, and calculates a phase relationship with respect to an index related to a biological state.
- the metabolic map dividing unit 102 u divides the calculation formula based on the metabolic map information, and calculates the correlation formula of a plurality of metabolites for the biological condition using the divided calculation formula. It is a dividing means.
- the biological state simulation unit 102 w performs the simulation by substituting the blood concentration data group measured for each metabolite in the individual to be simulated into the set correlation equation. This is a means for simulating the biological state of a target individual.
- the result output unit 102 k outputs the processing results of the control unit 102 such as processing. Output means for outputting to the device 114 or the like. .
- FIG. 4 is a block diagram showing an example of the configuration of the client device 200 to which the present invention is applied, and conceptually shows only those parts of the configuration relating to the present invention.
- the client device 200 generally includes a control unit 210, a ROM 220, an HD 230, a RAM 240, an input device 250, an output device 260, an input / output control IF 270, and a communication device.
- the control IF 280 is provided, and these units are connected so as to be able to perform data communication via a bus.
- the control unit 210 of the client device 200 includes a web browser 211 and an electronic mailer 212.
- the web browser 211 basically performs display control (browsing processing) for interpreting web data and displaying the web data on a monitor 261 described later.
- the web browser 211 may plug in various software such as a stream player having a function of receiving, displaying, and feeding back a stream video.
- the electronic mailer 212 transmits and receives e-mails in accordance with a predetermined communication protocol (for example, SMTP (Simle Mail Transfer Protocol) or P ⁇ P3 (Post Office Protocol Protocol 3)). I do.
- SMTP Simle Mail Transfer Protocol
- P ⁇ P3 Post Office Protocol Protocol
- a keyboard As the input device 250, a keyboard, a mouse, a microphone, and the like can be used.
- a monitor 261 to be described later also realizes a pointing device function in cooperation with a mouse.
- the output device 260 As the output device 260, a monitor (including a home television) 261 and a printer 262 are provided. In addition, as the output device 260, a speaker or the like can be used.
- the output device 26 ⁇ is an output unit that outputs information received via the communication control IF 280.
- the communication control IF 280 controls communication between the client device 200 and the network 300 (or a communication device such as a router).
- This communication control IF 280 is a receiving means for transmitting information to the server apparatus 100 and receiving information transmitted from the server apparatus 100, and for transmitting the biological state information to the server apparatus 100.
- transmitting means for transmitting a composite index corresponding to the transmitted biological condition information from the server 100.
- the client device 200 configured as described above is connected to a communication device such as a modem, a TA, a router, or the like via a telephone line or a dedicated line, and is connected to a network 300.
- the server device 100 can be accessed according to the communication protocol (for example, TCP / IP Internet protocol).
- the network 300 has a function of interconnecting the server device 100 and the client device 200, and is, for example, the Internet.
- FIG. 12 is a flowchart showing an example of the biological condition information analysis service processing of the present system in the present embodiment.
- the client device 200 inputs the address (URL, etc.) of the website provided by the server device 100 on the screen displayed by the web browser 211 by the user through the input device 250. By specifying, it connects to the server 100 via the Internet.
- the address URL, etc.
- the user activates the web browser 211 of the client device 200, and a predetermined input field of the web browser 211 corresponds to the biological condition information transmission screen of the present system. Enter the specified URL. Then, when the user instructs the web browser 211 to update the screen, the web browser 211 controls communication of this URL. The transmission is performed according to a predetermined communication protocol via 1F280, and a request for transmitting the web page for the biological condition information transmission screen to the server apparatus 100 is made by the routing based on the URL.
- the request interpreting unit 102a of the server device 100 monitors the presence or absence of transmission from the client device 200, and upon receiving the transmission, analyzes the content of the transmission, and in accordance with the result, the control unit 102a. Move the process to each part of ⁇ .
- the content of the transmission is a request for transmission of the biological condition information transmission screen Web page
- the biological condition information transmission screen Web page is displayed from the storage unit 106 mainly under the control of the browsing processing unit 102b.
- the Web data is obtained, and the Web data is transmitted to the client device 200 via the communication control interface unit 104.
- specification of the client device 200 when transmitting data from the server device 100 to the client device 200 is performed using the IP address transmitted together with the transmission request from the client device 200.
- the authentication processing unit 102c stores the user information stored in the user information database 106a. It is also possible to determine whether or not authentication is possible based on the ID and user password, and to view the web page only when authentication is possible (the same applies to the following, so the details are omitted).
- the client device 200 receives the web data from the server device 100 via the communication control IF 280, interprets the data with the web browser 211, and transmits the biological condition information transmission screen to the monitor 261. Display Web page for Hereinafter, a screen request from the client device 200 to the server device 100, transmission of web data from the server device 100 to the client device 200, and a client device
- the display of the web page at 200 is assumed to be performed in substantially the same manner, and the details thereof will be omitted below.
- the request interpreter 102a of the server 100 analyzes the content of the request from the client 200 by analyzing the identifier (from the client 200 to the server 100). Regarding the identification of the request content to 0, it is assumed that the same processing is performed in the following processing, and the details are omitted below).
- the server apparatus 100 executes analysis processing of biological state information, which will be described later with reference to FIG. 13 and the like, by processing of each section of the control section 102 (step S A-2). Then, the server apparatus 100 creates a Web page for displaying the analysis result data for the biological condition information transmitted by the user through the processing of the Web page generation unit 102 e, and stores the Web page in the storage unit. Stored in 106.
- the user displays the analysis result data stored in the storage unit 106 after the same authentication as described above by inputting a predetermined URL to the web browser 211 or the like. You can browse the web page for
- the server device 100 processes the browsing processing unit 102b. Then, when the web page of the user is read from the storage unit 106 and sent to the transmission unit 102 f, the transmission unit 102 f transmits the web page to the client device 200. (Step SA-3). As a result, the user can appropriately browse his / her own Web page (step S A-4). In addition, the user can print the display contents of this Web page with the printer 262 as needed. Further, the server apparatus 100 may notify the user of the analysis result via an electronic mail.
- the e-mail generation unit 102d of the server apparatus 100 generates e-mail data including analysis result data for the biological condition information transmitted by the user according to the transmission timing.
- the user information stored in the user information database 106a is referred to based on the user ID of the user, and the e-mail address of the user is called.
- step SA-3 an e-mail to the e-mail address is generated, and the e-mail data of the e-mail including the analysis result data for the user's name and the biological condition information transmitted by the user is generated.
- This mail data is transferred to the transmission unit 102 f.
- the transmission unit 102f transmits the mail data (step SA-3).
- the user uses the electronic mailer 212 of the client device 200 to receive the electronic mail at an arbitrary timing.
- This e-mail is displayed on the monitor 261, based on a known function of the e-mailer 212 (step SA-4).
- the user can print the display contents of the e-mail on the printer 262 as needed.
- FIG. 13 is a flowchart illustrating an example of a biological state information analysis process of the present system in the present embodiment.
- a case will be described as an example in which the calculation of a correlation coefficient and a correlation equation and the aggregation processing are performed using Microsoft (company name) Excel (product name). It is not limited, and may be executed by another program.
- the server apparatus 100 performs the processing of the correlation equation setting unit 102 V to obtain the index data relating to the biological state measured in each individual and the blood concentration measured for each metabolite in each individual.
- the correlation equation shown in Equation 1 is set to indicate the correlation with the data (correlation equation setting processing). / ⁇ ⁇ ⁇ (Formula 1)
- i, j, k are natural numbers, Ai, beta "is the blood concentration data, or a value which was function processing metabolites, Di, Ej, Fj, G k, H Is a constant.)
- the server apparatus 100 executes EX c by the processing of the biological state information acquisition unit 102 g.
- e1 a data file is created in which the index data (T) and the amino acid blood concentration data group are previously written on separate sheets (step SB-1).
- the server apparatus 100 fetches the data file created in step SB_1 into the memory of the control unit 102 by the processing of the biological state information acquiring unit 102g (step SB-2).
- FIG. 19 is a diagram showing an example of a main menu screen displayed on the monitor.
- the main menu screen includes, for example, a link button to the file import screen (file import button) MA-1, a link button to the amino acid (metabolite) input screen (amino acid (metabolite) input button) MA_2, Link button to biological condition index input screen (Biological condition index input button) MA-3, Link button to calculation master maintenance screen (Calculation formula button) MA-4, Link button to processing item selection screen ( MA-5, Link button for positive / negative judgment confirmation screen (Positive / negative judgment confirmation button) MA_6, Link button for composite index search screen (Search button for composite index) MA-7, and And an end button MA-8 for selecting the end of the processing.
- file import button file import button
- a link button to the amino acid (metabolite) input screen amino acid (metabolite) input button
- MA_2 Link button to biological condition index input screen
- MA-3 Link button to calculation master maintenance screen (Calculation formula button) MA-4
- FIG. 19 when the user selects the file import button MA-1 on the main menu screen via the input device 112, the file import screen shown in FIG. 20 is displayed.
- FIG. 20 is a diagram showing an example of a finale capture screen displayed on the monitor.
- the file import screen shows, for example, an input box group MB_1 for inputting the amino acid (metabolite) data import file path and an import file name, a biological group MB-2, and a file import screen. It includes a capture button MB-3 for performing capture and a return button MB-4 for returning to the main menu screen (Fig. 19).
- the biological condition index data specification section 1 0 2 n fetches the specified amino acid (metabolite) into the memory of the control unit 102, and the tf substance specifying unit 102 stores the specified biological condition index data in the control unit 10. Take in the memory of 2.
- the server apparatus 100 converts the individual group to be analyzed (or the individual group to be omitted) by the processing of the biological condition information acquisition unit 102 g into the amino acid shown in FIG. (Metabolite)
- the user is made to make a selection using the input screen and the biological condition index input screen shown in FIG. 22 (step SB-3).
- FIG. 21 is a diagram showing an example of an amino acid (metabolite) input screen displayed on the monitor.
- the amino acid (metabolite) input screen shows, for example, an unused F1g check area MC-1 and a data display area MC-2 to select whether or not to register as data for analysis.
- FIG. 22 is a diagram showing an example of a biological condition index input screen displayed on the monitor.
- the biological condition index input screen shows, for example, unused F 1 g check area MD-1 and data display area MD-2 to select whether or not to register as data for analysis.
- the lj user may not use the unused data, for example, for the individual whose data is lost.? 1 g check area MC-1 or unused F 1 g check area MD-1 Can be selected as “unused (check unused F1g)”. If one of the screens in Fig. 21 or Fig. 22 is set as an unused individual (set an unused Flg), that individual is automatically unused in the other screen. It is useful.
- the biological condition information acquisition section 102 g is the blood concentration data for some amino acids (metabolites) Automatically check out items that are missing and set unused F 1 g.
- the biological condition information acquiring unit 102 g when the user selects the registration button MC-4 or the registration button MD-4 via the input device 112 in FIG. 21 or FIG. 22, the biological condition information acquiring unit 102 g Then, blood amino acid data in which unused F 1 g is set is removed from the memory of the control unit 102.
- the server apparatus 100 displays the processing item selection screen shown in FIG. 24 by the processing of the metabolite specifying section 102 m and the biological condition index data specifying section 102 n.
- the information is displayed on the monitor, and the user selects the index data (T) of the biological condition to be analyzed and the amino acid (metabolite) (step SB-4 and step SB-5).
- FIG. 24 is a diagram showing an example of a process item selection screen displayed on the monitor.
- the processing item selection screen includes, for example, an input item display area MF-1, an analysis target item display area MF-2 of the biological condition index, an amino acid (metabolite) analysis item display area MF-3, It consists of a ⁇ K button MF-4 for setting processing items and a cancel button MF-5 for closing the processing item selection screen.
- the user inputs the desired item from the analysis item display area MF-2 of the biological condition index and the analysis item display area MF-3 of the amino acid (metabolite) via the input device 112 in FIG.
- the metabolite designation section The 102 m and the biological condition index data specifying unit 102 n remove data other than the analysis target data from the memory of the control unit 102.
- the server apparatus 100 obtains the index data for each metabolite based on the index data and the blood concentration data group designated as the analysis target by the processing of the correlation determining unit 102 h. Is determined (step SB-6), and the display screen shown in Fig. 25 is output to the monitor.
- the correlation is obtained by calculating a correlation coefficient using a function corre1 of Excel (or a function PEARSON).
- FIG. 25 is a diagram showing an example of a positive / negative judgment confirmation screen displayed on the monitor.
- the positive / negative judgment confirmation screen includes, for example, an analysis target item display area MG-1, a positive Negative judgment display area MG-2, analysis item display area MG-3, display area MG-4 for displaying the correlation with the analysis target item, user setting display area MG- for setting positive / negative by the user 5. It includes an OK button MG-6 for setting and a canceler MG-7 for closing the positive / negative judgment confirmation screen.
- the user confirms the correlation coefficient of each amino acid displayed in the display area MG-4, and confirms whether the correlation of each amino acid with the index data (T) is positive or negative. Even if is positive, it can be changed to negative and treated as negative depending on the user setting (and vice versa).
- the user selects positive or negative in the user setting display area MG-5 via the input device 111, and then selects the OK button MG-6 to set the positive / negative setting section 1 0 2 p updates the corresponding data in the memory of the control unit.
- the server apparatus 100 displays the display screen shown in FIG. 23 by the processing of the calculation formula setting unit 102 r to calculate the correlation formula (R). Have the user create a calculation formula (Step SB-7).
- FIG. 23 is a diagram showing an example of a calculation formula master maintenance screen displayed on the monitor. As shown in this figure, the calculation formula master maintenance screen
- the calculation formula input area ME-1 which is the input area of the calculation formula for calculating (R)
- the register button ME-2 for registering the calculation formula
- the back button is made up of ME-3.
- the user inputs a calculation formula for calculating a desired correlation formula (R) into the calculation formula input area ME-1 via the input device 112 in FIG.
- the calculation formula setting unit 102r stores the input calculation formula in a predetermined storage area of the storage unit 106.
- the calculation formula is (sum of positive) / (sum of negative), (sum of positive) based on the sign of the individual correlation coefficient of the amino acid group (metabolite group) to the biological condition index data (T). ) + (Negative sum), (positive sum) one (negative sum), (negative sum) / (positive sum), (negative sum) one (positive sum), or (positive sum) ) X (negative sum) can be specified.
- FIG. 26 is a diagram showing an example of a composite index search screen displayed on a monitor. As shown in this figure, the composite index search screen displays, for example, the output file name display and input area MH-1 and the output file name reference button MH-2.
- the server device 100 causes the correlation expression creating unit 102 i and the optimization A correlation equation is created by the processing of the unit 102j, and further, an optimization processing 1 described later is executed with reference to FIGS. 14 and 15 (step SB-10).
- FIG. 14 is a flowchart showing an example of the optimization processing 1 using the exhaustive calculation method by the present system.
- the optimizing unit 102 ⁇ calculates the composite index of the preceding stage in which the expression is not divided.
- the optimizing unit 102 j applies the specified processing item to the specified calculation formula (group), automatically calculates all the amino acid combinations, and calculates the index data ( Output the best 5 (up to 20 can be specified) of highly correlated combinations to T).
- FIG. 15 is a flowchart showing an example of the optimization processing 1 using the best path method by the present system.
- the optimization unit 102j repeats the term removal of specific amino acids one item at a time by the processing of the metabolite selection unit 102s. Calculate the optimal combination easily.
- the server device 100 outputs the analysis result (single-term index) to the monitor by the processing of the result output unit 102k, and stores the analysis result in the storage unit 106 (step SB- 1 1).
- the server apparatus 100 selects a desired one of the single term indices output in Step SB-11 by the processing of the calculation formula dividing unit 102t (Step SB-12).
- the server device 100 executes the optimization process 2 described later with reference to FIG. 16 by the processes of the correlation expression creation unit 102i and the optimization unit 102j (step SB-13).
- FIG. 16 is a flowchart showing an example of the optimization processing 2 by the present system.
- the optimization unit 102j processes the simple expression output in step SB-11 by the processing of the calculation formula division unit 102t. Select the desired one of the unary indices, calculate all two-divided patterns of the selected unary indices, and calculate the index with the highest absolute value of the correlation coefficient for the index data (T) . Further, the calculation formula may be divided based on the metabolism map information stored in the metabolism map information database 106e by the processing of the metabolism map division unit 102u.
- the server device 100 outputs the analysis result (multi-term index) to the monitor and stores the analysis result in the storage unit 106 by the processing of the result output unit 102k (step SB-14). ).
- a plurality of composite indices such as the top 20 highly correlated with the index data (T) may be output from the executed split pattern.
- FIG. 27 to FIG. 33 are diagrams showing an example of a display screen of the analysis result output to the monitor.
- FIG. 27 is a diagram showing an example of an execution result (1) sheet (“analysis” raw data) screen displayed on the monitor.
- the execution result (1) sheet (raw data for “angle analysis”) screen includes, for example, a display area MJ-1 for the analysis target item and a display area MJ-2 for the analysis item. It is configured.
- Fig. 28 shows the execution results displayed on the monitor.
- (2) Sheet (Compound index search condition) screen It is a figure showing an example of a field.
- the execution result (2) sheet (composite index search condition) screen includes, for example, the display area MK-1 for the analysis target item, the display area MK-2 for the name of the analysis item, and the analysis target item. It includes a correlation display area MK-3, an analysis item positive / negative display area MK-4, and a calculation expression display area MK-5.
- FIG. 29 is a diagram showing an example of an execution result (3) sheet (best composite index) screen displayed on the monitor.
- the execution result (3) sheet (best composite index) screen includes, for example, a display area MM-1 that displays the rank of the optimal composite index, a display area MM-2 that displays the number of correlations, and It is configured to include the composite index display area MM-3.
- FIG. 30 is a diagram showing an example of an execution result (4) sheet (best composite index—numerical) screen displayed on the monitor.
- the execution result (4) sheet (best composite index—numerical value) screen shows, for example, the display area MN-1 of the analysis target item, the calculation result display area MN-2 of the best 1 composite index, Best 2 composite index calculation result display area MN-3, Best 3 composite index calculation result display area MN-4, Best 4 composite index calculation result display area MN-5, and Best 5 composite index
- the calculation result display area MN-6 is included.
- FIG. 31 is a view showing an example of an execution result (5) sheet (correlation graph) screen displayed on the monitor screen.
- the execution result (5) sheet (correlation graph) screen includes, for example, a composite index selection area MP-1 and a correlation graph display area MP-2.
- FIG. 32 is a diagram showing an example of an execution result (6) 'sheet (“amino acid (metabolite)” raw data) screen displayed on the monitor screen.
- the execution result (6) sheet (“amino acid (metabolite tf)” raw data) screen shows, for example, the amino acid (metabolite) raw data display area MR-1 and unused F1
- the display area of g includes MR-2.
- FIG. 33 is a diagram showing an example of an execution result (7) sheet ( ⁇ biological condition index J raw data) screen displayed on the monitor screen.
- the execution result (7) sheet (“biological condition index” raw data) screen is, for example, a display region MS-1 of the biological condition index. It is configured to include the unused F 1 g display area MS-2.
- the server apparatus 100 acquires the blood concentration data group measured for each metabolite in the simulation target individual by the processing of the biological state information acquiring unit 102 g, and stores the data in the storage unit 106.
- the blood concentration data group is stored in a predetermined storage area.
- the server apparatus 100 by the processing of the biological state simulation section 102 w, converts the correlation equation set by the correlation equation setting section 102 V into each of the acquired individuals to be simulated.
- the biological state in the individual to be simulated is simulated by substituting the blood concentration data group measured for metabolites.
- the server device 100 outputs the result of the simulation of the biological state by the biological state simulation unit 102 w to the monitor by the processing of the result output unit 102 k, and stores the result of the simulation in the storage unit 106.
- the result of the simulation is stored in the storage area. This completes the biological state information analysis processing.
- FIG. 52 is a diagram showing the relationship between the composite index of liver fibrosis (composite index 1) obtained by the present system and the stage of the disease state in the control group and hepatitis C patients.
- the horizontal axis indicates the stage of the disease state
- the vertical axis indicates the control group and each stage.
- the value of the composite index (composite index 1) of hepatitis C patients is shown.
- the stage of the disease state indicates that the larger the number, the worse the disease state is, in five stages, where "0" is normal and "4" is the stage in which the disease state is most aggravated. Is shown. This figure focuses on the classification between the control group and patients with hepatitis C stage 1 liver fibrosis.
- FIG. 53 is a diagram showing the relationship between the composite index of liver fibrosis (composite index 2) obtained by the present system and the stage of the disease state in the control group and hepatitis C patients.
- the horizontal axis represents the stage of the disease state
- the vertical axis represents the value of the composite index (composite index 2) of the control group and the hepatitis C patient in each stage.
- stage of the disease state indicates that the larger the number, the worse the disease state is in five stages, where "0" is normal and "4" is the most severe disease state. Shows the stage. This figure focuses on the classification between the control group and patients with liver fibrosis stage 2 hepatitis C.
- FIG. 54 is a graph showing the relationship between the composite index of liver fibrosis (composite index 3) obtained by the present system and the stage of the disease state in the control group and hepatitis C patients.
- the horizontal axis indicates the stage of the disease state
- the vertical axis indicates the value of the composite index (composite index 3) of the control group and the hepatitis C patient in each stage.
- stage of the disease state indicates that the larger the number, the worse the disease state is, in five stages, where "0" is normal and "4" is the stage in which the disease state is most aggravated. Is shown. This figure focuses on the classification between the control group and patients with stage 3 hepatic fibrosis hepatitis C.
- FIG. 55 shows the relationship between the composite index of liver fibrosis (composite index 4) obtained by the present system and the stage of the disease state in the control group and hepatitis C patients.
- the horizontal axis indicates the stage of the disease state
- the vertical axis indicates the value of the composite index (composite index 4) of the control group and the hepatitis C patient in each stage.
- the stage of the disease state indicates that the larger the number, the worse the disease state is, in five stages, where "0" is normal and "4" is the most aggravated condition. Shows the stage.
- the control group and hepatitis C Attention is paid to the classification with the person.
- Table 1 is a table showing disease state determination information and disease state determination results in the control group and hepatitis C patients.
- the maximum value or the minimum value of each composite index (composite index 1 to 4) of the control group is set as a limit value for each composite index (complex index:! To 4), and each hepatitis C of each stage is performed.
- each composite index (composite index 1 to 4) in the patient is greater than the maximum value or smaller than the minimum value of the corresponding composite index in the control group, if the value is positive, “1” is indicated. Judgment was made, and when the value was within the limit value of the corresponding composite index value of the control group, it was judged as negative “0”. Then, the sum of the judgment values for each composite index (composite index:! ⁇ 4) is used for the comprehensive judgment of each patient (control group and hepatitis C patients), and when the sum of the judgment values is 1 or more, it is positive. 'I'm raw. '
- Fig. 56 is a graph showing the relationship between the fish ratio and the stage of the disease state in the control group and patients with type C meningitis. Calculated by the method described above using this system. When a similar determination was made using the Fisher's ratio, which has been used to determine hepatitis, 66% of hepatitis patients were positive if all controls were negative. .
- the positive I raw judgment rate in each stage is 27% in stage 1, 60% in stage 2, 60% in stage 3, and 94% in stage 4, indicating that the disease progresses
- it is clear that it is not suitable for initial diagnosis (see Table 1 and Fig. 56).
- the judgment rate was 100% even in the early stage of the disease, indicating an advantage over the conventional method (judgment using the Fisher ratio). Is obvious.
- the index that can be derived by the method described above using this system is the one for which the correlation coefficient has been optimized. However, even if it is not completely optimized, it can serve as a diagnostic index.
- the analysis of the top 20 correlation coefficients led to the following rules and formulas.
- replacing the amino acid in at least one of the composite indexes 1 to 4 with the following rule, or corresponding to at least one of the composite indexes 1 to 4 can be replaced by the following equation:
- FIG. 51 is a diagram showing rules for exchanging amino acids in each of the formulas 1 to 4.
- each of the composite indices 1 to 4 has all the factors of Darp A in the denominator, all the factors in Group B in the denominator, and sums the factors in Group A or the factors in Group A, It is calculated by an expression that takes the form of a sum of fractions with one or more terms whose form divided by the group B factors or the sum of the group B factors.
- the factor of group C may be added to the numerator
- the factor of group D may be added to the denominator.
- the composite index 1 is, for example, the following composite index 11 :! ⁇ 1—20 may be substituted.
- the control group minimum value and the control group maximum value indicate the maximum value and the minimum value for each composite index (complex index 11 1 to 1 ⁇ 20) of the control group.
- Compound index 1 1 1 (Minimum value of control group: 1.40, Maximum value of control group: 2.03)
- composite index 2 may be replaced with, for example, the following composite indexes 2-1 to 2-20.
- the minimum and maximum values of the control group indicate the maximum and minimum values for each composite index (composite index 2-1 to 2-20) of the control group.
- composite index 3 may be replaced with, for example, the following composite indexes 3-1 to 3-20.
- the control group minimum value and the control group maximum value indicate the maximum value and the minimum value for each composite index (composite index 3— :! to 3—20) of the control group.
- the composite index 4 is, for example, the following composite index 41 :! May be replaced with 44-20.
- the control group minimum value and control group maximum value indicate the maximum value and the minimum value for each composite index (composite index 4— :! to 4—20) of the control group.
- Example (Part 1) of the composite index of liver fibrosis This concludes the description of Example (Part 1) of the composite index of liver fibrosis.
- part 2 of the composite index of liver fibrosis will be described with reference to FIG.
- the following composite index 5 based on a plurality of metabolites was determined using the pathological index data on liver fibrosis.
- FIG. 35 is a diagram showing the relationship between the composite index of liver fibrosis (composite index 5) obtained by the present system and the stage of the disease state.
- the horizontal axis shows the value of the composite index (composite index 5) of each sample
- the vertical axis shows the stage of the disease state.
- the stage of the disease state indicates that the larger the number, the worse the disease state is in six stages, where "0" is normal and "5" is the worst condition. Shows the stage.
- Example (Part 2) of the composite index of liver fibrosis This concludes the description of Example (Part 2) of the composite index of liver fibrosis.
- FIG. 37 is a diagram showing the relationship between the composite index (composite index 6) and the disease state stage in normal rats and diabetic (GK) rats, obtained by the present system.
- the vertical axis shows the value of the composite index (composite index 6) of the individual data of normal (Norma 1) rats and diabetic (GK) rats
- the horizontal axis shows the stage of the disease state.
- the stage of the disease state indicates that “one 1” is normal and “1” is diabetes.
- FIG. 38 shows normal rats, diabetic (GK) rats, and administration of nateglinide (11 ateg 1 inide) or dalippenclamide (glibencl amide), a therapeutic agent for diabetes, determined by this system.
- FIG. 4 is a graph showing the relationship between the composite index (composite index 6) and the stage of the disease state in diabetic (GK) rats treated with the above method.
- the vertical axis represents normal (Norma 1) rats, diabetic (GK) rats, and treated by administering nateglinide (nateglinide) or dalibenclamide (glibencl amide), which is a therapeutic agent for diabetes.
- the value of the compound index (compound index 6) of the individual data of the diabetic (GK) rat is shown, and the horizontal axis shows the stage of the disease state.
- the stage of the disease state was treated by administering “1-1” to normal, “1” to diabetes, and administering nateglinide (nateg 1 inide) or glibenclamide (glibencl amide) which is a drug for treating diabetes. It indicates diabetes.
- FIG. 39 shows normal rats, diabetic (GK) rats, and treatment by administering nateglinide (nateg 1 inide) or dalipenclamide (glibencl amide), which is a therapeutic agent for diabetes, determined by this system.
- FIG. 9 is a bar graph showing the average value (SD) of each population of the composite index (composite index 6) in isolated diabetic (GK) rats.
- the vertical axis is normal (Norma 1) rat, diabetic (GK) rat, and treated by administering nateglinide (nateg 1 inide) or dalipenclamide (glibencl amide) which is a therapeutic agent for diabetes.
- the average value (Sat SD) of the composite index (Compound Index 6) of the individual data of isolated diabetic (GK) rats is shown, and the horizontal axis represents each individual group.
- the mean value of the composite index value of the diabetic (GK) rat was calculated by administering the normal (Norma 1) rat and nateglinide (ii ateg 1 inide) which is a therapeutic agent for diabetes.
- the mean value of the composite index value of the treated diabetic (GK) rats was significantly higher at a significance level of less than 1%, and glibencl amide, a therapeutic agent for diabetes, was significantly reduced. It is significantly higher than the mean composite index value (Compound Index 6) of diabetic (GK) rats treated by administration at a significance level of less than 5%.
- P—S er represents the phosphoserine concentration
- Cys represents the cystine concentration
- Cysthi represents the cystationin concentration
- the a p o-E knockout mouse exhibits remarkable hypolipidemia and is known as a model animal showing arteriosclerosis.
- a p o—E knockout mice and normal mice
- FIG. 58 represents an example of a discriminant calculated based on blood amino acid concentration at the age of 20 weeks when the initial symptoms of arterial sclerosis were confirmed (see FIG. 58). ).
- Figure 58 shows apo-E knockout mice (Apo E KO) and normal mice (No rma It is a figure which shows the example of determination of 1). As shown in FIG. 58, apo-E knockout mice and normal mice were effectively distinguished by the following judgment formula.
- FIG. 59 is a diagram showing an example of discriminating between a normal mouse infected state with the attenuated influenza virus AZAichi / 2/68 (H3N2) and a non-infected state.
- ⁇ shows the data of the normal diet-fed mouse (No rma ldiet (pre)) before infection
- “Hata” shows the normal diet-fed mouse (No rma ldiet (+)) after the infection. The data of) and) are shown.
- FIG. 60 is a diagram showing an example in which changes in the numerical values obtained by the discriminant equation when the influenza virus is similarly infected after ingestion of cystine and theanine are compared with those of the normal food intake group.
- “ ⁇ ” indicates the data of the normal food intake group (Norma 1 d iet), and “.” Indicates the data of the cystine and theanine intake group (Cystein & Teaninedet).
- FIGS. 61 and 62 An example of the following discriminant and a discriminant based on the discriminant are shown (see FIGS. 61 and 62).
- FIG. 61 is a diagram showing an example of discrimination between a streptozotocin-administered rat (STZ) and a healthy rat (Norm a1), which is a model animal of type I bran urinary disease.
- FIG. 62 is a diagram showing an example of discrimination between a GK rat (GK), which is a type I diabetic model animal, and a healthy rat (Normal).
- FIG. 63 is a diagram showing an example of discrimination between a human growth hormone gene-transferred rat (hGH-Tg rat) and a normal rat (Normal).
- FIGS. 65 and 66 An application example for determining the nutritional status of an individual is shown below with reference to FIGS. 65 and 66. By formulating the effects of dietary components on individuals as shown here in advance, it is possible to estimate the nutritional status of a particular individual.
- FIG. 65 is a diagram showing an example of discriminating between a low protein-ingested rat (Low protein) and a normal diet-ingested rat (Normal) (in the formula, Cys represents a cystine concentration).
- FIG. 66 is a diagram showing an example of discrimination between a high fat diet-ingested mouse (High Fat Fat) and a normal diet-ingested mouse (Norma 1).
- ⁇ -ABA represents ⁇ -aminobutyric acid concentration
- NEF ⁇ represents free fatty acid concentration
- TCHO represents total cholesterol concentration.
- indices can be used as surrogate indices for various measurement items such as blood or organ biochemical data or organ weight.
- lipid peroxide (TBARS) The blood levels of lipid peroxide (TBARS) in the liver of rats bred for 2 weeks with 6 rats in each group
- the formula optimized using the medium amino acid concentration is shown below (see FIG. 67).
- Fig. 67 shows the correlation between the amount of lipid peroxide in the liver (Liver-TBRAS) and the value calculated based on the formula optimized for the amount of lipid peroxide (Inde X-TBRAS).
- Cys represents the cystine concentration
- Cy shi represents the cystationin concentration.
- FIG. 6 is a diagram showing a correlation with a calculated value (Index x-TCHO).
- Cys indicates a cystine concentration
- Cy shi indicates a cytothionine concentration.
- FIG. 4 is a diagram showing a correlation with GF-1).
- Cys represents a cystine concentration
- Cyshi represents a cystationin concentration
- Fig. 70 shows the correlation between the body weight ratio of epididymal fat (WAT) and the value calculated based on the formula optimized for the body weight ratio of the epididymal fat (Index-WAT).
- WAT body weight ratio of epididymal fat
- Index-WAT body weight ratio of the epididymal fat
- Figure 71 shows the collective discrimination of these different states based on the blood amino acid concentration of streptozotocin-treated rats, GK rats, rats into which human growth hormone gene was introduced, liver fibrosis model rats, and normal rats. It is a figure showing an example.
- solid squares indicate data of streptozotocin-administered rats
- X indicates data of GK rats
- ⁇ indicates data of human growth hormone transgenic rats
- Ogina Indicates data of a liver fibrosis model rat
- mouth indicates data of a normal rat.
- the following formula is an example of an index calculated by comparing a specific state with all other different states as an index for specifically discriminating only a target state.
- Fig. 71 shows a correlation diagram between the indices.
- the correlation between the indices reveals the correlation between the states, and the causal relationship between the states must be verified.
- FIG. 72 is a diagram showing an example of a batch diagnosis of the results of insulin treatment in a type I monodiabetic rat.
- solid squares indicate data of type I diabetic rats (rats treated with streptozotocin)
- X indicates data of type II diabetic rats (GK rats)
- ⁇ indicates data for obese rats (rats transgenic for human growth hormone gene)
- ⁇ indicates data for liver fibrosis model rats
- ⁇ indicates data for normal rats
- the dotted line shows a plot of indices that do not distinguish between normal and type I diabetic rats.
- FIG. 72 the results obtained by applying the above formulas to individuals who have been subjected to insulin treatment for the above-mentioned type I-diabetes are newly added to FIG. 7'1.
- I-DM discrimination index
- Equation 3 is used to distinguish between virus-negative patients and virus-positive patients at the same time based on pre-dose blood amino acid levels during hepatitis C treatment with interferon and ribavirin. (See Figure 73.)
- FIG. 73 is a diagram showing an example of a prediction result of an interferon and rivapirin treatment effect.
- a patient who turned viral negative 8 or 12 weeks after the start of treatment was defined as a virus negative patient.
- alpha Arufabetaarufa is Amino acid concentration
- Cy s represents the cystine concentration.
- the blood amino acid concentration may change due to, for example, a stress response or an adaptive response to environmental changes.
- FIG. 74 is a diagram showing an amino acid composite index before and after transport of a septum.
- the biological condition of the pig before and after the transportation could be determined by substituting the plasma amino acid concentration into the following equation 4. This result suggests that increasing the plasma levels of the amino acids listed as molecules in Formula 4 below may alleviate the effects of transport stress, as well as lysine (Lys) and lysine (Lys).
- Two Chin Or According to a report that administration of arginine (Ar g), which is a precursor of n), was able to relieve transport stress in pigs (see “Srinongkoteeta 1, Nutritional Neuroscience, 6, 283–289, 2003”). Supported.
- the correlation equation setting process in the correlation equation setting unit 102 V of the server device 100 is performed by the “blood concentration of each amino acid contained in the clinical data” described above in the basic principle of the present invention. Is applied to Equation 1, and a new correlation is set by finding each constant of Equation 1 (Pattern 1)) as an example.However, in the basic principle of the present invention, it is determined in advance by Pattern 2 described above. That is, the correlation equation may be set. That is, the correlation equation previously obtained by the server apparatus 100 is stored in a predetermined storage area of the storage unit 106, and the storage unit 106 The desired correlation equation may be selected and set from. Further, the server apparatus 100 selects and downloads a desired correlation equation through the network 300 from the correlation equations stored in the storage device of another computer apparatus in advance by the processing of the correlation equation setting unit 102V. May be set.
- the server device 100 is configured to perform a process in response to a request from a client device 200 or the like that is configured separately from the server device 100, and return the processing result to the client device 200 or the like. May be.
- the transmission of the biological state information (step SA-1) and the transmission of the analysis result (step SA-3) described above may be realized by using an existing e-mail transmission technology.
- the function provided by the website provided by the server apparatus 100 may be realized by presenting a predetermined input format to allow a user or the like to input information, and transmitting the input information. Realized by existing file transfer technology such as FTP.
- all or a part of the processes described as being automatically performed can be manually performed. All or a part of the processing described as being performed in a targeted manner may be automatically performed by a known method.
- the illustrated components are functionally conceptual, and do not necessarily need to be physically configured as illustrated.
- each unit or each device of the server device 100 is transferred to the CPU (Central Processing Unit) and the CPU. It can be realized by a program interpreted and executed by the CPU, or it can be realized as hardware by wired logic. The program is recorded on a recording medium described later, and is mechanically read by the server device 100 as necessary.
- CPU Central Processing Unit
- a computer program for giving instructions to the CPU and performing various processes in cooperation with an OS is recorded in the storage unit 106 such as a ROM or an HD.
- This computer program is executed by being loaded into a RAM or the like, and forms the control unit 102 in cooperation with the CPU.
- this computer program may be recorded in an application program server connected to the server device 100 via an arbitrary network 300, and it is also possible to download all or part of the computer program as needed.
- the program according to the present invention is stored in a computer-readable recording medium. You can also pay.
- the “recording medium” is any “portable physical medium” such as a flexible disk, a magneto-optical disk, a ROM, an EPROMs EEPROM, a CD-ROM, an MO, a DVD, etc., and is built in various computer systems.
- Short-term, such as communication lines or carrier waves when transmitting programs via any fixed physical media such as ROM, RAM, HD, etc., or networks such as LAN, WAN, and the Internet Includes “communications media” that holds programs.
- a “program” is a data processing method described in an arbitrary language or description method, regardless of the format of source code or binary code. Note that the “program” is not necessarily limited to a single program, but may be distributed as multiple modules or libraries, or may be a separate program represented by an operating system (OS). Including those that achieve their functions in cooperation with. It should be noted that a known configuration and procedure should be used for a specific configuration for reading the recording medium in each apparatus described in the embodiment, a reading procedure, or an installation procedure after reading. Can be.
- various databases and the like stored in the storage unit 106 of the server device 100 include a memory device such as a RAM and a ROM and a fixed disk device such as a hard disk. It is a storage means such as a flexible disk, an optical disk, etc., and stores various programs, tables, files, databases, files for web pages, etc. used for various processes and website provision.
- the server device 100 connects a peripheral device such as a printer monitor or an image scanner to an information processing device such as a known information processing terminal such as a personal computer or a workstation, and applies the method of the present invention to the information processing device. It may be realized by implementing software (including programs, data, etc.) to be realized.
- each database can be It may be configured independently as a database device, or a part of the processing may be realized by using CGI (Communication Gateway).
- CGI Common Gateway
- the client device 200 can be connected to a known information processing device such as a personal computer, a workstation, a home game device, an Internet TV, a PHS terminal, a mobile terminal, a mobile communication terminal, or a PDA or the like.
- Peripheral devices such as image scanners as necessary, and software (including programs, data, etc.) that implements a web information browsing function and an e-mail function is implemented in the information processing device. Good.
- the control unit 210 of the client device 200 can realize the whole or any part thereof by a CPU and a program interpreted and executed by the CPU (that is, the ROM or HD includes an OS (Operating A computer program for giving instructions to the CPU and performing various processes in cooperation with the System) is recorded.This computer program is executed by being loaded into RAM, and is executed by the CPU.
- the control unit is configured in cooperation.
- this computer program may be recorded in an application program server connected to the client device 200 via an arbitrary network, and it is also possible to download all or part of the computer program as needed. .
- all or any part of each control unit can be realized as hardware using wired logic or the like.
- the network 300 has a function of interconnecting the server device 100 and the client device 200, and includes, for example, the Internet, an intranet, a LAN (including both wired and wireless), a VAN, and personal computer communication.
- Network public telephone network (both analog and digital), leased line network (both analog and digital), CATV network, IMT2000 system, GSM system or PDC / PDC-P system Mobile communication network / mobile bucket switching network, radio paging network, local radio network such as B1uetooth, PHS network, satellite communication network such as CS, BS or ISDB. May be. That is, this system can transmit and receive various data via any network regardless of wired or wireless. [Embodiment of liver fibrosis determination system, etc.]
- liver fibrosis determination apparatus a liver fibrosis determination apparatus, a liver fibrosis determination method, a liver fibrosis determination system, a program, and a recording medium according to the present invention will be described in detail with reference to the drawings.
- the present invention is not limited by the embodiment.
- FIG. 45 is a block diagram showing an example of the configuration of the liver fibrosis judging device 400 of the present system to which the present invention is applied, and conceptually shows only those parts of the configuration relating to the present invention.
- the control unit 4 0 2 such as a CPU that integrally controls the entire hepatic fibrosis determination apparatus 4 0 0, communication line Communication control interface unit 404 connected to a communication device (not shown) such as a router connected to the input / output control interface unit 4 connected to the input device 112 and the output device 114 And a storage unit 406 for storing various databases and tables, and these units are communicably connected via an arbitrary communication path.
- the liver fibrosis determination device 400 is communicably connected to a network 300 via a communication device such as a router and a wired or wireless communication line such as a dedicated line.
- Various databases and tables stored in the storage unit 406 in FIG. 45 is a storage means such as a fixed disk device, which stores various kinds of programs and files used for various kinds of processing, and files for file data base and web pages.
- the user information database 406a is a user information storage unit for storing information about users (user information).
- FIG. 47 is a diagram showing an example of the user information stored in the user information database 406a.
- the information stored in the user information database 406a includes a user ID for uniquely identifying each user, and whether each user is a valid person.
- User password, name of each user, affiliation ID to uniquely identify the affiliation to which each user belongs, and unique department to which each user belongs It is configured by associating the gateway ID, department name, and e-mail address of each user for identification.
- the metabolite information database 406 b is a metabolite information storage means for storing metabolite information and the like.
- FIG. 48 is a diagram showing an example of information stored in the metabolite information database 406b.
- the information stored in this metabolite information database 406b includes an individual (sample) number and a blood concentration data group of each metabolite (for example, amino acid). It is configured in association with each other.
- the liver fibrosis index database 406c is a liver fibrosis index storage unit that stores a liver fibrosis index and the like.
- the optimization index output by the result output unit 102 k of the server 100 described above and optimized for each stage of each disease state is used as a composite index, and the higher-level index is substituted. They are stored in association with each other as indices.
- FIG. 50 is a diagram showing an example of information stored in the liver fibrosis index database 406c. This figure is an example of the case where the indices of the above-described embodiments (embodiment of the composite index of liver fibrosis (Example 1) and embodiment of the composite index of liver fibrosis (Part 2)) are stored. As shown in FIG.
- the information stored in the liver fibrosis index database 406c is constituted by associating a number, a composite index, and an alternative index with each other. Further, as other information, the storage unit 406 of the liver fibrosis determination device 400 stores various web data and CGI programs for providing a website to the client device 200. ing.
- the Web data includes data for displaying various Web pages described later, and these data are formed as a text file described in, for example, HTML or XML.
- a file for parts for creating these Web data, a file for work, and other temporary files are also stored in the storage unit 406.
- audio for transmission to the client device 200 It can store audio files such as E format and AIFF format, and still images and moving images can be stored as image files such as J PEG format and MPEG 2 format.
- a communication control interface unit 404 performs communication control between the moon-dry fibrosis determination device 400 and the network 300 (or a communication device such as a router). That is, the communication control interface unit 404 has a function of communicating data with another terminal via a communication line.
- an input / output control interface unit 408 controls the input device 112 and the output devices 114.
- control unit 402 has a control program such as an OS (Operating System), a program that defines various processing procedures, and an internal memory for storing required data. Then, information processing for executing various processes is performed by these programs and the like.
- the control section 402 is functionally conceptually composed of a request interpretation section 402a, a browsing processing section 402b, an authentication processing section 402c, an e-mail generation section 402d, a web page generation section 402e, a transmission section 402f, 'A metabolite information acquisition unit 402g, a disease state index value calculation unit 402h, a disease state determination unit 402i, and a result output unit 402j.
- the request interpreting unit 402a is a request interpreting unit that interprets the contents of the request from the client device 200 and transfers the processing to other units of the control unit according to the result of the interpretation.
- the browsing processing unit 402b is a browsing processing unit that receives a browsing request for various screens from the client device 200, and generates and transmits web data of these screens.
- the authentication processing unit 402c is an authentication processing unit that receives an authentication request from the client device 200 and makes this authentication determination.
- the e-mail generation unit 402d is an e-mail generation unit that generates an e-mail including various types of information.
- the web page generation unit 402e is a web page generation unit that generates a web page to be viewed by a user.
- the transmitting unit 402 f transmits various information to the client device 200 of the user. It is a transmitting means for transmitting, and an analysis result transmitting means for transmitting the liver fibrosis determination result to the client device 200 that has transmitted the metabolite information.
- the metabolite information acquisition unit 402 g acquires metabolite information including a blood concentration data group measured for each animal in each individual from the client device 200 or the input device 112. It is a metabolite information acquisition means.
- the metabolite information acquisition unit 402 g further includes a metabolite designation unit 402 k as shown in FIG. 46.
- FIG. 46 is a block diagram showing an example of the configuration of the metabolite information acquiring unit 402g of the present system to which the present invention is applied, and conceptually shows only those parts of the configuration related to the present invention. .
- the metabolite designation section 402 k is a metabolite designation means for designating a desired metabolite.
- the pathological index value calculation unit 402 h calculates the hepatic condition from the metabolite information including the blood concentration data group of each metabolite in each individual obtained by the metabolite information obtaining unit 402 g.
- Liver fibrosis based on at least one of composite indices 1 to 4 stored in fibrosis index database 406c or composite index 5 stored in liver fibrosis index database 406c
- Composite index 1 which is a fractional expression or a fractional expression composed of the sum of multiple terms (and The blood concentration data of I 1 e, a-ABA, and the blood concentration data of A s may be arbitrarily added to the denominator), and A sn, Me At least one of the blood concentration data of t as the numerator and at least one of the blood concentration data of a-ABA and Cit as the denominator.
- the compound index 2 is a mathematical formula.
- the blood concentration data of Tyr, Arg is added to the numerator, and the blood concentration data of His, Thr, Trp, As, and Glu Means for creating a composite index 2 and at least one of the blood concentration data of ⁇ -ABA, His, G 1 y, T r ⁇ , and T au
- a fractional formula consisting of one term or a sum of multiple terms with at least one of the blood concentration data of As n, G ln, C it, Lys, Th r, and Tyr
- a composite index 3 creating means for creating a composite index 3 (Furthermore, the blood concentration data of Met and Asp may be arbitrarily added to the denominator), and a blood concentration data of His and Trp.
- Composite index 4 creating means for creating index 4 (furthermore, blood concentration data of ⁇ -ABA, Ta 11 may be added to a numerator, and blood concentration data of Met and As P may be arbitrarily added to a denominator) At least one of the following.
- amino acid in at least one of the compound indexes 1 to 4 can be replaced with, for example, an amino acid having chemically equivalent properties.
- the amino acid in at least one of the composite indexes 1 to 4 is replaced under the following rules, or at least one of the composite indexes 1 to 4 corresponds to It is possible to replace the following equation.
- FIG. 51 is a diagram showing rules for exchanging amino acids in the formulas of the composite indexes 1 to 4.
- each of the composite indices 1 to 4 has all the factors of group A in the denominator and all the factors in group B in the denominator, and calculates the sum of the factors in group A or the factors in group A. It is calculated by an equation that takes the form of a sum of fractions with one or more terms divided by the factor or the sum of the factors in group B.
- the factor of group C may be added to the numerator
- the factor of group D may be added to the denominator.
- the composite indices 1 to 4 are, for example, each of the alternative indices stored in the liver fibrosis index database 406c (the composite indices 11 to 1 to 11 and the composite indices 2-1 to 2 to 20). , Composite index 31-1 to composite index 3-20, composite index 411 to composite index 4-20).
- the disease state determining unit 402i is a disease state determining unit that determines a disease state of hepatic fibrosis according to the disease state index value calculated by the disease state index value calculating unit 402h.
- the result output unit 402 j is an output unit that outputs a processing result or the like of each process of the control unit 402 to the output device 114 or the like.
- the client device 200 and the network 300 have the same configuration as that described above, and a description thereof will be omitted.
- FIG. 49 is a flowchart showing an example of a liver fibrosis information analysis service process of the present system in the present embodiment.
- the client device 200 inputs the address (URL, etc.) of the website provided by the liver fibrosis determination device 400 to the user using the input device 25 on the screen displayed by the web browser 211.
- the device is connected to the liver fibrosis determination device 400 via the Internet.
- the user activates the Web browser 211 of the client device 200, and a predetermined input field of the Web browser 211 corresponds to the metabolite information transmission screen of the present system. Enter the specified URL. And the user, this Web browser 2
- the transmission is performed according to a predetermined communication protocol via F280, and a transmission request of the metabolite information transmission screen Web page to the liver fibrosis determining apparatus 400 is made by the routing based on the URL.
- the request interpreter 402 of the liver fibrosis determination device 400 is a client device 2
- the control unit 402 It monitors the presence / absence of transmission from 0 °, and upon receiving the transmission, analyzes the contents of this transmission and moves the processing to each unit in the control unit 402 according to the result.
- the content of the transmission is a request for transmission of the metabolite information transmission screen Web page
- the browsing processing section 402 Under the control of b, web data for displaying the web page for the metabolite information transmission screen is acquired from the storage unit 406, and the web data is transmitted to the client device via the communication control interface unit 404.
- the identification of the client device 200 when transmitting data from the liver fibrosis determination device 400 to the client device 200 is performed using the IP address transmitted together with the transmission request from the client device 200. Do.
- the authentication processing unit 402c is stored in the user information database 400a. It is also possible to determine whether or not authentication is possible based on the user ID and user password that are used, and to browse the web page only when authentication is possible (the same applies to the following, so details are omitted).
- the client device 200 receives the web data of the liver fibrosis determination device 400 via the communication control IF 280, and interprets this data with the web browser 211. Displays the metabolite information transmission screen Web page on the monitor 26 1.
- a screen request from the client device 200 to the liver fibrosis determination device 400, transmission of Web data from the liver fibrosis determination device 400 to the client device 200, and client device 2 It is assumed that the display of the Web page at 0 0 is performed in substantially the same manner, and the details are omitted below.
- Step SF-1 When the user inputs and selects metabolite information via the input device 250 of the client device 200, the input information and an identifier for specifying the selected item are transmitted to the liver fibrosis determination device 400. (Step SF-1).
- the request interpreting section 402a of the liver fibrosis determining apparatus 400 analyzes the identifier to analyze the contents of the request from the client apparatus 200 (from the client apparatus 200).
- the identification of the request content to the liver fibrosis determination device 400 is assumed to be performed in substantially the same manner in the following processing, and the details are omitted below).
- the liver fibrosis determination apparatus 400 executes a metabolite information analysis process, which will be described later with reference to FIG. 40 and the like, by the processes of the control unit 402 (step SF-2).
- the liver fibrosis determination device 400 uses the web page generation unit 402 e to process the data.
- a Web page for displaying the analysis result data for the metabolite information transmitted by the user is created and stored in the storage unit 406.
- the liver fibrosis determination device 400 performs the browsing process.
- the processing of the section 402 b reads the user's W e page from the storage section 406 and sends it to the transmitting section 402 f, and the transmitting section 402 f transmits the web page to the client. Is transmitted to the remote device 200 (step SF-3). This allows the user to browse his / her own Web page as needed (Step SF-4). Also, the user can print the display contents of this Web page with the printer 262 as needed.
- the liver fibrosis determination device 400 may notify the user of the analysis result via e-mail. That is, the e-mail generation unit 402 d of the liver fibrosis determination device 400 generates e-mail data including the analysis result data for the metabolite information transmitted by the user according to the transmission timing. Specifically, the user information stored in the user information database 406a is referred to based on the user ID of the user and the e-mail address of the user is called.
- an e-mail to the e-mail address is generated, and the e-mail data including the analysis result data for the user name and the metabolite information transmitted by the user is generated.
- the e-mail data is transferred to the transmission section 402 f.
- the transmitting section 402f transmits this mail data (step SF-3).
- the user receives the above e-mail at an arbitrary timing using the e-mailer 212 of the client device 200.
- This e-mail is displayed on the monitor 261, based on the known function of the e-mailer 212 (step SF-4).
- the user can print the display contents of the e-mail on the printer 262 as needed. With this, the lunar dry fiber information analysis service processing ends.
- FIG. 40 is a flowchart showing an example of a metabolite information analysis process of the present system in the present embodiment.
- an example in which aggregation processing and the like are performed using Microsoft (company name) Exce1 (product name) will be described as an example.
- the present invention is not limited to such a case. May be executed by the following program.
- the liver fibrosis determination device 400 created a data file in which the amino acid blood concentration data group was previously recorded on a separate sheet on EXce1 by processing the metabolite information acquisition unit 402 g. (Step SG-1).
- the liver fibrosis determination apparatus 400 loads the data file created in step SG-1 into the memory of the control section 402 by the processing of the metabolite information acquisition section 402 g (step SG- 2).
- the liver fibrosis determination apparatus 400 allows the user to select a population to be analyzed (or a population to be omitted) by the processing of the metabolite information acquiring unit 402 g (step SG-3). .
- the liver fibrosis determining apparatus 400 allows the user to select an amino acid to be analyzed by the processing of the metabolite specifying section 402 k (step SG-4).
- the liver fibrosis determination apparatus 400 allows the user to specify the output file of the result (step SG-5).
- the liver fibrosis determining apparatus 400 calculates a pathological index value, which will be described later with reference to FIG. 41, by the processing of the pathological index value calculating section 402h (step SG-6).
- FIG. 41 is a flow chart showing an example of calculation of a disease state index value of the present system in the present embodiment. ⁇
- the liver fibrosis determination device 400 checks metabolite information by processing of the disease state index value calculation section 402 h (step SH-1). Based on at least one of the composite indices 1 to 4 stored in the hepatic index database 406 c or stored in the liver fibrosis index database 406 c Based on the composite index 5, a disease state index value is calculated (step SH-2).
- amino acid in at least one of the formulas 1 to 5 can be replaced with, for example, an amino acid having chemically equivalent properties.
- the amino acid in at least one of the composite indices 1 to 4 is replaced under the following rules, or at least one of the composite indices 1 to 4 corresponds to the following: Can be replaced by
- FIG. 51 is a diagram showing rules for exchanging amino acids in each of the formulas 1 to 4.
- each of composite indices 1 to 4 indicates that all the factors in Group A are in the denominator and all the factors in Group B are in the denominator. Is calculated by an equation that takes the form of a sum of fractions with one or more terms divided by the sum of the factors in Group B or Group B.
- the factor of group C may be added to the numerator
- the factor of group D may be added to the denominator.
- the disease state index value calculating section 402h may create the composite indexes 1 to 4 based on the present rule.
Abstract
Description
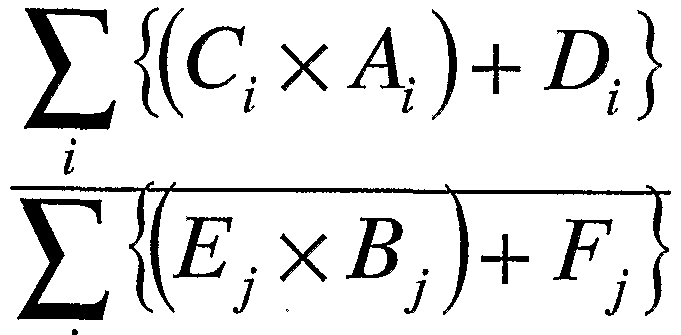

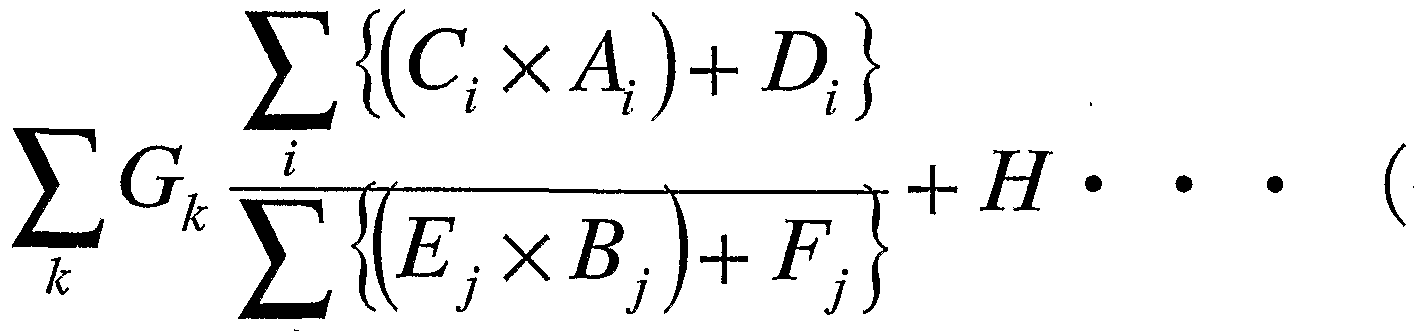


Claims


Priority Applications (7)
| Application Number | Priority Date | Filing Date | Title |
|---|---|---|---|
| AU2003289263A AU2003289263A1 (en) | 2002-12-09 | 2003-12-09 | Organism condition information processor, organism condition information processing method, organism condition information managing system, program, and recording medium |
| EP03777384A EP1570779A4 (en) | 2002-12-09 | 2003-12-09 | PROCESSOR FOR INFORMATION ON THE CONDITION OF AN ORGANISM, METHOD FOR PROCESSING INFORMATION ON THE CONDITION OF AN ORGANISM, SYSTEM FOR MANAGING INFORMATION ON THE CONDITION OF AN ORGANISM, PROGRAM AND RECORDING MEDIUM |
| JP2005502361A JP4581994B2 (ja) | 2002-12-09 | 2003-12-09 | 生体状態情報処理装置、生体状態情報処理方法、生体状態情報管理システム、プログラム、および、記録媒体 |
| CA002508136A CA2508136A1 (en) | 2002-12-09 | 2003-12-09 | Apparatus and method for processing information concerning biological condition, system, program and recording medium for managing information concerning biological condition |
| US11/148,352 US8234075B2 (en) | 2002-12-09 | 2005-06-09 | Apparatus and method for processing information concerning biological condition, system, program and recording medium for managing information concerning biological condition |
| US11/987,415 US8244476B2 (en) | 2002-12-09 | 2007-11-29 | Hepatic disease-evaluating apparatus, hepatic disease-evaluating method, hepatic disease-evaluating system, hepatic disease-evaluating program and recording medium |
| US13/483,359 US20120239366A1 (en) | 2002-12-09 | 2012-05-30 | Apparatus and method for processing information concerning biological condition, system, program and recording medium for managing information concerning biological condition |
Applications Claiming Priority (4)
| Application Number | Priority Date | Filing Date | Title |
|---|---|---|---|
| JP2002-357042 | 2002-12-09 | ||
| JP2002357042 | 2002-12-09 | ||
| JP2003205589 | 2003-08-01 | ||
| JP2003-205589 | 2003-08-01 |
Related Child Applications (1)
| Application Number | Title | Priority Date | Filing Date |
|---|---|---|---|
| US11/148,352 Continuation US8234075B2 (en) | 2002-12-09 | 2005-06-09 | Apparatus and method for processing information concerning biological condition, system, program and recording medium for managing information concerning biological condition |
Publications (1)
| Publication Number | Publication Date |
|---|---|
| WO2004052191A1 true WO2004052191A1 (ja) | 2004-06-24 |
Family
ID=32510622
Family Applications (1)
| Application Number | Title | Priority Date | Filing Date |
|---|---|---|---|
| PCT/JP2003/015713 WO2004052191A1 (ja) | 2002-12-09 | 2003-12-09 | 生体状態情報処理装置、生体状態情報処理方法、生体状態情報管理システム、プログラム、および、記録媒体 |
Country Status (7)
| Country | Link |
|---|---|
| US (2) | US8234075B2 (ja) |
| EP (2) | EP1570779A4 (ja) |
| JP (3) | JP4581994B2 (ja) |
| KR (1) | KR100686910B1 (ja) |
| AU (1) | AU2003289263A1 (ja) |
| CA (2) | CA2508136A1 (ja) |
| WO (1) | WO2004052191A1 (ja) |
Cited By (27)
| Publication number | Priority date | Publication date | Assignee | Title |
|---|---|---|---|---|
| WO2006129513A1 (ja) * | 2005-05-30 | 2006-12-07 | Ajinomoto Co., Inc. | 肝疾患評価装置、肝疾患評価方法、肝疾患評価システム、肝疾患評価プログラムおよび記録媒体 |
| EP1862797A1 (en) * | 2005-03-16 | 2007-12-05 | Ajinomoto Co., Inc. | Biocondition evaluating device, biocondition evaluating method, biocondition evaluating system, biocondition evaluating program, evaluation function generating device, evaluation function generating method, evaluation function generating program, and recording medium |
| WO2008015929A1 (fr) | 2006-08-04 | 2008-02-07 | Ajinomoto Co., Inc. | procédé d'évaluation de syndrome métabolique, appareil D'ÉVALUATION DE SYNDROME MÉTABOLIQUE, système D'ÉVALUATION DE SYNDROME MÉTABOLIQUE, programme d'évaluation de syndrome métabolique et support d'enregistrement, et proc& |
| WO2008016111A1 (en) | 2006-08-04 | 2008-02-07 | Ajinomoto Co., Inc. | Method for evaluation of lung cancer, lung cancer evaluation apparatus, lung cancer evaluation method, lung cancer evaluation system, lung cancer evaluation program, and recording medium |
| WO2008016101A1 (fr) | 2006-08-04 | 2008-02-07 | Ajinomoto Co., Inc. | Procédé d'évaluation de stress, appareil d'évaluation de stress, système d'évaluation de stress, programme d'évaluation de stress et support d'enregistrement associé |
| WO2008075662A1 (ja) | 2006-12-21 | 2008-06-26 | Ajinomoto Co., Inc. | 乳癌の評価方法、ならびに乳癌評価装置、乳癌評価方法、乳癌評価システム、乳癌評価プログラムおよび記録媒体 |
| WO2008075664A1 (ja) | 2006-12-21 | 2008-06-26 | Ajinomoto Co., Inc. | 癌の評価方法、ならびに癌評価装置、癌評価方法、癌評価システム、癌評価プログラムおよび記録媒体 |
| WO2008075663A1 (ja) | 2006-12-21 | 2008-06-26 | Ajinomoto Co., Inc. | 大腸癌の評価方法、ならびに大腸癌評価装置、大腸癌評価方法、大腸癌評価システム、大腸癌評価プログラムおよび記録媒体 |
| WO2008090941A1 (ja) | 2007-01-24 | 2008-07-31 | Ajinomoto Co., Inc. | Ibdの評価方法、ならびにアミノ酸情報処理装置、アミノ酸情報処理方法、アミノ酸情報処理システム、アミノ酸情報処理プログラムおよび記録媒体 |
| JP2008188077A (ja) * | 2007-01-31 | 2008-08-21 | Media Cross Kk | メタボリックシンドローム血管評価システム |
| WO2009001862A1 (ja) | 2007-06-25 | 2008-12-31 | Ajinomoto Co., Inc. | 内臓脂肪蓄積の評価方法 |
| WO2009054350A1 (ja) | 2007-10-25 | 2009-04-30 | Ajinomoto Co., Inc. | 耐糖能異常の評価方法 |
| WO2010064413A1 (ja) * | 2008-12-01 | 2010-06-10 | 国立大学法人山口大学 | 薬剤の作用・副作用予測システムとそのプログラム |
| JPWO2009110517A1 (ja) * | 2008-03-04 | 2011-07-14 | 味の素株式会社 | 癌種の評価方法 |
| US8234075B2 (en) | 2002-12-09 | 2012-07-31 | Ajinomoto Co., Inc. | Apparatus and method for processing information concerning biological condition, system, program and recording medium for managing information concerning biological condition |
| WO2013005790A1 (ja) * | 2011-07-07 | 2013-01-10 | 味の素株式会社 | 生体酸化の評価方法、生体酸化評価装置、生体酸化評価方法、生体酸化評価プログラム、生体酸化評価システム、情報通信端末装置、および生体酸化の予防・改善物質の探索方法 |
| JP2013178238A (ja) * | 2012-01-31 | 2013-09-09 | Ajinomoto Co Inc | 心血管イベントの評価方法、心血管イベント評価装置、心血管イベント評価方法、心血管イベント評価プログラム、心血管イベント評価システムおよび情報通信端末装置 |
| KR20150140363A (ko) | 2013-04-09 | 2015-12-15 | 아지노모토 가부시키가이샤 | 생활습관병 지표의 평가 방법, 생활습관병 지표 평가 장치, 생활습관병 지표 평가 방법, 생활습관병 지표 평가 프로그램 제품, 생활습관병 지표 평가 시스템, 및 정보통신 단말장치 |
| US9465031B2 (en) | 2008-06-20 | 2016-10-11 | Ajinomoto Co., Inc. | Method of evaluating prostatic disease |
| KR20170066409A (ko) | 2014-10-08 | 2017-06-14 | 아지노모토 가부시키가이샤 | 평가 방법, 평가 장치, 평가 프로그램, 평가 시스템, 및 단말 장치 |
| JP2017122655A (ja) * | 2016-01-07 | 2017-07-13 | 味の素株式会社 | 骨格筋面積の評価方法 |
| WO2018066620A1 (ja) * | 2016-10-04 | 2018-04-12 | 味の素株式会社 | 膵臓癌の評価方法、評価装置、評価プログラム、評価システム、及び端末装置 |
| US9971866B2 (en) | 2011-06-30 | 2018-05-15 | Ajinomoto Co., Inc. | Method of evaluating fatty liver related disease, fatty liver related disease-evaluating apparatus, fatty liver related disease-evaluating method, fatty liver related disease-evaluating program product, fatty liver related disease-evaluating system, information communication terminal apparatus, and method of searching for prophylactic/ameliorating substance for fatty liver related disease |
| WO2018101450A1 (ja) * | 2016-12-01 | 2018-06-07 | 味の素株式会社 | 癌モニタリングの方法、算出方法、評価装置、算出装置、評価プログラム、算出プログラム、評価システム、及び端末装置 |
| KR20190065263A (ko) | 2016-10-04 | 2019-06-11 | 아지노모토 가부시키가이샤 | 대장암의 평가 방법, 평가 장치, 평가 프로그램, 평가 시스템, 및 단말 장치 |
| WO2019198601A1 (ja) | 2018-04-10 | 2019-10-17 | 味の素株式会社 | 畜産動物の健康状態および/または成育状態を評価する方法、装置およびプログラム |
| WO2020067386A1 (ja) | 2018-09-26 | 2020-04-02 | 味の素株式会社 | 軽度認知障害の評価方法、算出方法、評価装置、算出装置、評価プログラム、算出プログラム、記録媒体、評価システムおよび端末装置 |
Families Citing this family (8)
| Publication number | Priority date | Publication date | Assignee | Title |
|---|---|---|---|---|
| US20070016389A1 (en) * | 2005-06-24 | 2007-01-18 | Cetin Ozgen | Method and system for accelerating and improving the history matching of a reservoir simulation model |
| EP1865431A1 (en) * | 2006-06-06 | 2007-12-12 | Waters GmbH | System for managing and analyzing metabolic pathway data |
| JPWO2009054351A1 (ja) * | 2007-10-25 | 2011-03-03 | 味の素株式会社 | 生体状態評価装置、生体状態評価方法、生体状態評価システム、生体状態評価プログラムおよび記録媒体 |
| CN104316701B (zh) * | 2008-06-20 | 2018-05-15 | 味之素株式会社 | 女性生殖器癌症的评价方法 |
| CN103082993B (zh) * | 2011-10-31 | 2016-01-20 | 国民技术股份有限公司 | 人体生物信息检测系统及其检测方法 |
| CN110133299A (zh) * | 2012-03-18 | 2019-08-16 | 株式会社资生堂 | 疾病样品分析装置、分析系统及分析方法 |
| JP6375947B2 (ja) * | 2012-05-11 | 2018-08-22 | 味の素株式会社 | 取得方法、評価装置、評価方法、評価プログラム、評価システムおよび端末装置 |
| US10235431B2 (en) | 2016-01-29 | 2019-03-19 | Splunk Inc. | Optimizing index file sizes based on indexed data storage conditions |
Citations (3)
| Publication number | Priority date | Publication date | Assignee | Title |
|---|---|---|---|---|
| JPH0620459B2 (ja) * | 1987-11-13 | 1994-03-23 | 住友電気工業株式会社 | 肝機能検査装置 |
| US5687716A (en) * | 1995-11-15 | 1997-11-18 | Kaufmann; Peter | Selective differentiating diagnostic process based on broad data bases |
| JPH11504739A (ja) * | 1995-07-25 | 1999-04-27 | ホルス ゼラピーティクス,インコーポレイテッド | コンピュータ援用疾病診断方法 |
Family Cites Families (34)
| Publication number | Priority date | Publication date | Assignee | Title |
|---|---|---|---|---|
| JPS61126472A (ja) | 1984-11-24 | 1986-06-13 | Advance Res & Dev Co Ltd | 診断方法 |
| KR910002651B1 (ko) | 1987-11-13 | 1991-04-27 | 스미또모 덴끼 고교 가부시끼가이샤 | 간 기능 검사 장치 |
| DE69214628T2 (de) | 1991-01-18 | 1997-05-22 | Esa Inc | Verfahren zur Diagnose von Störungen der Körperfunktionen unter Verwendung von biochemischen Pryfilen |
| WO1996012187A1 (en) | 1994-10-13 | 1996-04-25 | Horus Therapeutics, Inc. | Computer assisted methods for diagnosing diseases |
| US6059724A (en) * | 1997-02-14 | 2000-05-09 | Biosignal, Inc. | System for predicting future health |
| US6300136B1 (en) | 1997-09-03 | 2001-10-09 | The Trustees Of The University Of Pennsylvania | Methods for diagnosis and treatment of tumors in humans |
| US20040022827A1 (en) | 1997-09-30 | 2004-02-05 | Chugai Seiyaku Kabusiki Kaisha | Remedy for hepatopathy |
| JPH11190734A (ja) | 1997-12-26 | 1999-07-13 | Wakamoto Pharmaceut Co Ltd | クローン病の検査方法および検査用キット |
| WO2000065472A1 (en) | 1999-04-26 | 2000-11-02 | Surromed, Inc. | Phenotype and biological marker identification system |
| WO2001035316A2 (en) * | 1999-11-10 | 2001-05-17 | Structural Bioinformatics, Inc. | Computationally derived protein structures in pharmacogenomics |
| US20020009740A1 (en) | 2000-04-14 | 2002-01-24 | Rima Kaddurah-Daouk | Methods for drug discovery, disease treatment, and diagnosis using metabolomics |
| US6865415B2 (en) | 2000-04-18 | 2005-03-08 | Yamato Scale Co., Ltd. | Visceral fat determining device |
| US6925389B2 (en) | 2000-07-18 | 2005-08-02 | Correlogic Systems, Inc., | Process for discriminating between biological states based on hidden patterns from biological data |
| JP4545899B2 (ja) | 2000-07-31 | 2010-09-15 | キヤノン株式会社 | 加熱装置および画像形成装置 |
| US6631330B1 (en) | 2000-08-21 | 2003-10-07 | Assistance Publique-Hopitaux De Paris (Ap-Hp) | Diagnosis method of inflammatory, fibrotic or cancerous disease using biochemical markers |
| AU2001294644A1 (en) * | 2000-09-19 | 2002-04-02 | The Regents Of The University Of California | Methods for classifying high-dimensional biological data |
| JP4315603B2 (ja) * | 2001-01-26 | 2009-08-19 | 東京瓦斯株式会社 | 炎症性腸疾患診断剤 |
| JP3933882B2 (ja) | 2001-03-30 | 2007-06-20 | 富士通株式会社 | レーダーチャートを表示させるためのプログラムおよびレーダーチャート表示方法 |
| CA2447857A1 (en) * | 2001-05-21 | 2002-11-28 | Parteq Research And Development Innovations | Method for determination of co-occurences of attributes |
| JP2003159095A (ja) | 2001-07-12 | 2003-06-03 | Takeda Chem Ind Ltd | 結合分子予測方法およびその利用方法 |
| IL160324A0 (en) * | 2001-08-13 | 2004-07-25 | Beyond Genomics Inc | Method and system for profiling biological systems |
| CA2399169A1 (en) | 2001-09-07 | 2003-03-07 | Queen's University At Kingston | Diagnostic methods for determining susceptibility to convulsive conditions |
| ES2333181T3 (es) | 2002-03-29 | 2010-02-17 | Asahi Kasei Pharma Corporation | Metodo para la deteccion de una intolerancia ligera a la glucosa o hiposecrecion de insulina. |
| JP2004135546A (ja) | 2002-10-16 | 2004-05-13 | Sumitomo Pharmaceut Co Ltd | クローン病の疾患マーカー及びその利用 |
| AU2003272234A1 (en) | 2002-10-24 | 2004-05-13 | Warner-Lambert Company, Llc | Integrated spectral data processing, data mining, and modeling system for use in diverse screening and biomarker discovery applications |
| WO2004052191A1 (ja) | 2002-12-09 | 2004-06-24 | Ajinomoto Co., Inc. | 生体状態情報処理装置、生体状態情報処理方法、生体状態情報管理システム、プログラム、および、記録媒体 |
| JP2004321179A (ja) | 2003-04-07 | 2004-11-18 | Nitto Boseki Co Ltd | 炎症性腸疾患診断用マーカー遺伝子もしくは蛋白質およびそれを利用した炎症性腸疾患診断方法 |
| US7064104B2 (en) | 2003-06-13 | 2006-06-20 | The Procter & Gamble Company | Methods of managing the symptoms of premenstrual syndrome |
| US20060170928A1 (en) | 2003-12-24 | 2006-08-03 | Vadivel Masilamani | Masila's cancer detector based on optical analysis of body fluids |
| JP4200441B2 (ja) | 2003-08-13 | 2008-12-24 | 財団法人柏戸記念財団 | 臨床検査データの可視化表現シートの作成装置 |
| AU2004267806A1 (en) * | 2003-08-20 | 2005-03-03 | Bg Medicine, Inc. | Methods and systems for profiling biological systems |
| US8346482B2 (en) | 2003-08-22 | 2013-01-01 | Fernandez Dennis S | Integrated biosensor and simulation system for diagnosis and therapy |
| JP4774534B2 (ja) | 2003-12-11 | 2011-09-14 | アングーク ファーマシューティカル カンパニー,リミティド | 集中化適応モデル及び遠隔操作サンプルプロセッシングの使用を介した生物学的状態の診断方法 |
| US7433853B2 (en) | 2004-07-12 | 2008-10-07 | Cardiac Pacemakers, Inc. | Expert system for patient medical information analysis |
-
2003
- 2003-12-09 WO PCT/JP2003/015713 patent/WO2004052191A1/ja active Application Filing
- 2003-12-09 AU AU2003289263A patent/AU2003289263A1/en not_active Abandoned
- 2003-12-09 JP JP2005502361A patent/JP4581994B2/ja not_active Expired - Lifetime
- 2003-12-09 EP EP03777384A patent/EP1570779A4/en not_active Withdrawn
- 2003-12-09 CA CA002508136A patent/CA2508136A1/en not_active Abandoned
- 2003-12-09 CA CA002637250A patent/CA2637250A1/en not_active Abandoned
- 2003-12-09 EP EP11157821A patent/EP2357581A3/en not_active Withdrawn
- 2003-12-09 KR KR1020057010476A patent/KR100686910B1/ko active IP Right Grant
-
2005
- 2005-06-09 US US11/148,352 patent/US8234075B2/en active Active
-
2010
- 2010-07-12 JP JP2010158021A patent/JP5707757B2/ja not_active Expired - Lifetime
-
2012
- 2012-05-30 US US13/483,359 patent/US20120239366A1/en not_active Abandoned
-
2013
- 2013-07-22 JP JP2013152149A patent/JP5971209B2/ja not_active Expired - Lifetime
Patent Citations (3)
| Publication number | Priority date | Publication date | Assignee | Title |
|---|---|---|---|---|
| JPH0620459B2 (ja) * | 1987-11-13 | 1994-03-23 | 住友電気工業株式会社 | 肝機能検査装置 |
| JPH11504739A (ja) * | 1995-07-25 | 1999-04-27 | ホルス ゼラピーティクス,インコーポレイテッド | コンピュータ援用疾病診断方法 |
| US5687716A (en) * | 1995-11-15 | 1997-11-18 | Kaufmann; Peter | Selective differentiating diagnostic process based on broad data bases |
Non-Patent Citations (1)
| Title |
|---|
| See also references of EP1570779A4 * |
Cited By (48)
| Publication number | Priority date | Publication date | Assignee | Title |
|---|---|---|---|---|
| US8244476B2 (en) | 2002-12-09 | 2012-08-14 | Ajinomoto Co., Inc. | Hepatic disease-evaluating apparatus, hepatic disease-evaluating method, hepatic disease-evaluating system, hepatic disease-evaluating program and recording medium |
| US8234075B2 (en) | 2002-12-09 | 2012-07-31 | Ajinomoto Co., Inc. | Apparatus and method for processing information concerning biological condition, system, program and recording medium for managing information concerning biological condition |
| EP1862797A1 (en) * | 2005-03-16 | 2007-12-05 | Ajinomoto Co., Inc. | Biocondition evaluating device, biocondition evaluating method, biocondition evaluating system, biocondition evaluating program, evaluation function generating device, evaluation function generating method, evaluation function generating program, and recording medium |
| EP1862797A4 (en) * | 2005-03-16 | 2009-09-16 | Ajinomoto Kk | DEVICE, METHOD, SYSTEM AND PROGRAM FOR EVALUATING BIOLOGICAL STATES, DEVICE, METHOD AND PROGRAM FOR GENERATING AN EVALUATION FUNCTION AND RECORDING MEDIUM |
| JPWO2006129513A1 (ja) * | 2005-05-30 | 2008-12-25 | 味の素株式会社 | 肝疾患評価装置、肝疾患評価方法、肝疾患評価システム、肝疾患評価プログラムおよび記録媒体 |
| WO2006129513A1 (ja) * | 2005-05-30 | 2006-12-07 | Ajinomoto Co., Inc. | 肝疾患評価装置、肝疾患評価方法、肝疾患評価システム、肝疾患評価プログラムおよび記録媒体 |
| JPWO2008015929A1 (ja) * | 2006-08-04 | 2009-12-24 | 味の素株式会社 | メタボリック・シンドロームの評価方法、メタボリック・シンドローム評価装置、メタボリック・シンドローム評価方法、メタボリック・シンドローム評価システム、メタボリック・シンドローム評価プログラムおよび記録媒体、ならびにメタボリック・シンドロームの予防・改善物質の探索方法 |
| WO2008015929A1 (fr) | 2006-08-04 | 2008-02-07 | Ajinomoto Co., Inc. | procédé d'évaluation de syndrome métabolique, appareil D'ÉVALUATION DE SYNDROME MÉTABOLIQUE, système D'ÉVALUATION DE SYNDROME MÉTABOLIQUE, programme d'évaluation de syndrome métabolique et support d'enregistrement, et proc& |
| JP5470848B2 (ja) * | 2006-08-04 | 2014-04-16 | 味の素株式会社 | 肺癌の評価方法、肺癌評価装置、肺癌評価方法、肺癌評価システム、肺癌評価プログラム、記録媒体、および、情報通信端末装置 |
| US8673647B2 (en) | 2006-08-04 | 2014-03-18 | Ajinomoto Co., Inc. | Stress evaluating apparatus, method, system and program and recording medium therefor |
| JP2014038114A (ja) * | 2006-08-04 | 2014-02-27 | Ajinomoto Co Inc | 肺癌の評価方法 |
| JP5856364B2 (ja) * | 2006-08-04 | 2016-02-09 | 味の素株式会社 | 抑うつ病の評価方法、抑うつ病評価装置、抑うつ病評価方法、抑うつ病評価システム、抑うつ病評価プログラム、記録媒体および端末装置 |
| WO2008016111A1 (en) | 2006-08-04 | 2008-02-07 | Ajinomoto Co., Inc. | Method for evaluation of lung cancer, lung cancer evaluation apparatus, lung cancer evaluation method, lung cancer evaluation system, lung cancer evaluation program, and recording medium |
| WO2008016101A1 (fr) | 2006-08-04 | 2008-02-07 | Ajinomoto Co., Inc. | Procédé d'évaluation de stress, appareil d'évaluation de stress, système d'évaluation de stress, programme d'évaluation de stress et support d'enregistrement associé |
| US9664681B2 (en) | 2006-08-04 | 2017-05-30 | Ajinomoto Co., Inc. | Lung cancer evaluating apparatus, method, system, and program and recording medium therefor |
| JPWO2008016101A1 (ja) * | 2006-08-04 | 2009-12-24 | 味の素株式会社 | ストレスの評価方法、ならびにストレス評価装置、ストレス評価方法、ストレス評価システム、ストレス評価プログラムおよび記録媒体 |
| JPWO2008016111A1 (ja) * | 2006-08-04 | 2009-12-24 | 味の素株式会社 | 肺癌の評価方法、ならびに肺癌評価装置、肺癌評価方法、肺癌評価システム、肺癌評価プログラムおよび記録媒体 |
| US9599618B2 (en) | 2006-12-21 | 2017-03-21 | Ajinomoto Co., Inc. | Method, apparatus, system, program, and computer-readable recording medium for evaluating colorectal cancer |
| US9459255B2 (en) | 2006-12-21 | 2016-10-04 | Ajinomoto Co., Inc. | Method of evaluating breast cancer, breast cancer-evaluating apparatus, breast cancer-evaluating method, breast cancer-evaluating system, breast cancer-evaluating program and recording medium |
| WO2008075662A1 (ja) | 2006-12-21 | 2008-06-26 | Ajinomoto Co., Inc. | 乳癌の評価方法、ならびに乳癌評価装置、乳癌評価方法、乳癌評価システム、乳癌評価プログラムおよび記録媒体 |
| WO2008075663A1 (ja) | 2006-12-21 | 2008-06-26 | Ajinomoto Co., Inc. | 大腸癌の評価方法、ならびに大腸癌評価装置、大腸癌評価方法、大腸癌評価システム、大腸癌評価プログラムおよび記録媒体 |
| JP2014025946A (ja) * | 2006-12-21 | 2014-02-06 | Ajinomoto Co Inc | 癌の評価方法、ならびに癌評価装置、癌評価方法、癌評価システム、癌評価プログラムおよび記録媒体 |
| WO2008075664A1 (ja) | 2006-12-21 | 2008-06-26 | Ajinomoto Co., Inc. | 癌の評価方法、ならびに癌評価装置、癌評価方法、癌評価システム、癌評価プログラムおよび記録媒体 |
| WO2008090941A1 (ja) | 2007-01-24 | 2008-07-31 | Ajinomoto Co., Inc. | Ibdの評価方法、ならびにアミノ酸情報処理装置、アミノ酸情報処理方法、アミノ酸情報処理システム、アミノ酸情報処理プログラムおよび記録媒体 |
| JP2008188077A (ja) * | 2007-01-31 | 2008-08-21 | Media Cross Kk | メタボリックシンドローム血管評価システム |
| US9182407B2 (en) | 2007-06-25 | 2015-11-10 | Ajinomoto Co., Inc. | Method of evaluating visceral fat accumulation, visceral fat accumulation-evaluating apparatus, visceral fat accumulation-evaluating method, visceral fat accumulation-evaluating system, visceral fat accumulation-evaluating program, recording medium, and method of searching for prophylactic/ameliorating substance for visceral fat accumulation |
| JPWO2009001862A1 (ja) * | 2007-06-25 | 2010-08-26 | 味の素株式会社 | 内臓脂肪蓄積の評価方法 |
| JP2016029398A (ja) * | 2007-06-25 | 2016-03-03 | 味の素株式会社 | 内臓脂肪面積の評価方法、内臓脂肪面積評価装置、内臓脂肪面積評価方法、内臓脂肪面積評価プログラム、記録媒体、内臓脂肪面積評価システム、及び端末装置 |
| WO2009001862A1 (ja) | 2007-06-25 | 2008-12-31 | Ajinomoto Co., Inc. | 内臓脂肪蓄積の評価方法 |
| WO2009054350A1 (ja) | 2007-10-25 | 2009-04-30 | Ajinomoto Co., Inc. | 耐糖能異常の評価方法 |
| JPWO2009054350A1 (ja) * | 2007-10-25 | 2011-03-03 | 味の素株式会社 | 耐糖能異常の評価方法、耐糖能異常評価装置、耐糖能異常評価方法、耐糖能異常評価システム、耐糖能異常評価プログラムおよび記録媒体、ならびに耐糖能異常の予防・改善物質の探索方法 |
| JPWO2009110517A1 (ja) * | 2008-03-04 | 2011-07-14 | 味の素株式会社 | 癌種の評価方法 |
| US9465031B2 (en) | 2008-06-20 | 2016-10-11 | Ajinomoto Co., Inc. | Method of evaluating prostatic disease |
| WO2010064413A1 (ja) * | 2008-12-01 | 2010-06-10 | 国立大学法人山口大学 | 薬剤の作用・副作用予測システムとそのプログラム |
| US9971866B2 (en) | 2011-06-30 | 2018-05-15 | Ajinomoto Co., Inc. | Method of evaluating fatty liver related disease, fatty liver related disease-evaluating apparatus, fatty liver related disease-evaluating method, fatty liver related disease-evaluating program product, fatty liver related disease-evaluating system, information communication terminal apparatus, and method of searching for prophylactic/ameliorating substance for fatty liver related disease |
| WO2013005790A1 (ja) * | 2011-07-07 | 2013-01-10 | 味の素株式会社 | 生体酸化の評価方法、生体酸化評価装置、生体酸化評価方法、生体酸化評価プログラム、生体酸化評価システム、情報通信端末装置、および生体酸化の予防・改善物質の探索方法 |
| JP2013178238A (ja) * | 2012-01-31 | 2013-09-09 | Ajinomoto Co Inc | 心血管イベントの評価方法、心血管イベント評価装置、心血管イベント評価方法、心血管イベント評価プログラム、心血管イベント評価システムおよび情報通信端末装置 |
| KR20210007053A (ko) | 2013-04-09 | 2021-01-19 | 아지노모토 가부시키가이샤 | 생활습관병 지표의 평가 방법, 생활습관병 지표 평가 장치, 생활습관병 지표 평가 방법, 생활습관병 지표 평가 프로그램, 생활습관병 지표 평가 시스템, 및 정보통신 단말장치 |
| KR20150140363A (ko) | 2013-04-09 | 2015-12-15 | 아지노모토 가부시키가이샤 | 생활습관병 지표의 평가 방법, 생활습관병 지표 평가 장치, 생활습관병 지표 평가 방법, 생활습관병 지표 평가 프로그램 제품, 생활습관병 지표 평가 시스템, 및 정보통신 단말장치 |
| KR20170066409A (ko) | 2014-10-08 | 2017-06-14 | 아지노모토 가부시키가이샤 | 평가 방법, 평가 장치, 평가 프로그램, 평가 시스템, 및 단말 장치 |
| KR20230028566A (ko) | 2014-10-08 | 2023-02-28 | 아지노모토 가부시키가이샤 | 평가 방법, 평가 장치, 평가 프로그램, 평가 시스템, 및 단말 장치 |
| JP2017122655A (ja) * | 2016-01-07 | 2017-07-13 | 味の素株式会社 | 骨格筋面積の評価方法 |
| KR20190065263A (ko) | 2016-10-04 | 2019-06-11 | 아지노모토 가부시키가이샤 | 대장암의 평가 방법, 평가 장치, 평가 프로그램, 평가 시스템, 및 단말 장치 |
| WO2018066620A1 (ja) * | 2016-10-04 | 2018-04-12 | 味の素株式会社 | 膵臓癌の評価方法、評価装置、評価プログラム、評価システム、及び端末装置 |
| KR20190089895A (ko) | 2016-12-01 | 2019-07-31 | 아지노모토 가부시키가이샤 | 암 모니터링의 방법, 산출 방법, 평가 장치, 산출 장치, 평가 프로그램, 산출 프로그램, 평가 시스템, 및 단말 장치 |
| WO2018101450A1 (ja) * | 2016-12-01 | 2018-06-07 | 味の素株式会社 | 癌モニタリングの方法、算出方法、評価装置、算出装置、評価プログラム、算出プログラム、評価システム、及び端末装置 |
| WO2019198601A1 (ja) | 2018-04-10 | 2019-10-17 | 味の素株式会社 | 畜産動物の健康状態および/または成育状態を評価する方法、装置およびプログラム |
| WO2020067386A1 (ja) | 2018-09-26 | 2020-04-02 | 味の素株式会社 | 軽度認知障害の評価方法、算出方法、評価装置、算出装置、評価プログラム、算出プログラム、記録媒体、評価システムおよび端末装置 |
Also Published As
| Publication number | Publication date |
|---|---|
| JP5707757B2 (ja) | 2015-04-30 |
| CA2637250A1 (en) | 2004-06-24 |
| EP2357581A2 (en) | 2011-08-17 |
| EP1570779A4 (en) | 2008-03-12 |
| JP2013257333A (ja) | 2013-12-26 |
| KR100686910B1 (ko) | 2007-02-26 |
| US20120239366A1 (en) | 2012-09-20 |
| EP1570779A1 (en) | 2005-09-07 |
| EP2357581A3 (en) | 2012-09-12 |
| JP4581994B2 (ja) | 2010-11-17 |
| CA2508136A1 (en) | 2004-06-24 |
| JPWO2004052191A1 (ja) | 2006-04-06 |
| AU2003289263A1 (en) | 2004-06-30 |
| US20050283347A1 (en) | 2005-12-22 |
| JP2010281826A (ja) | 2010-12-16 |
| US8234075B2 (en) | 2012-07-31 |
| JP5971209B2 (ja) | 2016-08-17 |
| KR20050084227A (ko) | 2005-08-26 |
Similar Documents
| Publication | Publication Date | Title |
|---|---|---|
| WO2004052191A1 (ja) | 生体状態情報処理装置、生体状態情報処理方法、生体状態情報管理システム、プログラム、および、記録媒体 | |
| Heger et al. | Evolutionary rate analyses of orthologs and paralogs from 12 Drosophila genomes | |
| US20030139655A1 (en) | Animal healthcare, well-being and nutrition | |
| CN1751309A (zh) | 结合体外测试数据的医学数据分析方法和设备 | |
| JP7215507B2 (ja) | 取得方法、評価装置、評価プログラムおよび評価システム | |
| JP2022118027A (ja) | 取得方法、算出方法、糖尿病評価装置、算出装置、糖尿病評価プログラム、算出プログラム、糖尿病評価システム、および端末装置 | |
| US20030113756A1 (en) | Methods of providing customized gene annotation reports | |
| EP1370695A2 (en) | Network for evaluating data obtained in a biochip measurement device | |
| JP2021177196A (ja) | 大腸癌の評価方法、算出方法、評価装置、算出装置、評価プログラム、算出プログラム、評価システム、及び端末装置 | |
| KR101824937B1 (ko) | 췌장암의 평가 방법, 췌장암 평가 장치, 췌장암 평가 방법, 췌장암 평가 프로그램, 췌장암 평가 시스템 및 정보 통신 단말 장치 | |
| JP2020101571A (ja) | 評価方法、評価装置、評価プログラム、評価システム、及び端末装置 | |
| MXPA06011525A (es) | Sistema y metodos para manejo del tratamiento y datos del paciente. | |
| Rosenbaum et al. | Novel papillomavirus in a mallard duck with mesenchymal chondroid dermal tumors | |
| Estrada | A protein folding degree measure and its dependence on crystal packing, protein size, secondary structure, and domain structural class | |
| Mitchell et al. | Social disparities in thoracic surgery database research: implications and impact | |
| Ma | Tumor and pan-tumor diversity and heterogeneity of cancer tissue microbiomes: a medical ecology analysis across 32 cancer types | |
| Lollini et al. | ImmunoGrid: towards agent-based simulations of | |
| Jaakkola | EXTRACTING INFORMATION FROM HIGH-THROUGHPUT GENE EXPRESSION DATA WITH PATHWAY ANALYSIS AND DECONVOLUTION | |
| Herveg et al. | Legal approaches of the healthgrid technology | |
| AU2005202664A1 (en) | Animal Health Diagnosis |
Legal Events
| Date | Code | Title | Description |
|---|---|---|---|
| AK | Designated states |
Kind code of ref document: A1 Designated state(s): AE AG AL AM AT AU AZ BA BB BG BR BY BZ CA CH CN CO CR CU CZ DE DK DM DZ EC EE EG ES FI GB GD GE GH GM HR HU ID IL IN IS JP KE KG KP KR KZ LC LK LR LS LT LU LV MA MD MG MK MN MW MX MZ NI NO NZ OM PG PH PL PT RO RU SC SD SE SG SK SL SY TJ TM TN TR TT TZ UA UG US UZ VC VN YU ZA ZM ZW |
|
| AL | Designated countries for regional patents |
Kind code of ref document: A1 Designated state(s): BW GH GM KE LS MW MZ SD SL SZ TZ UG ZM ZW AM AZ BY KG KZ MD RU TJ TM AT BE BG CH CY CZ DE DK EE ES FI FR GB GR HU IE IT LU MC NL PT RO SE SI SK TR BF BJ CF CG CI CM GA GN GQ GW ML MR NE SN TD TG |
|
| DFPE | Request for preliminary examination filed prior to expiration of 19th month from priority date (pct application filed before 20040101) | ||
| 121 | Ep: the epo has been informed by wipo that ep was designated in this application | ||
| WWE | Wipo information: entry into national phase |
Ref document number: 2005502361 Country of ref document: JP |
|
| WWE | Wipo information: entry into national phase |
Ref document number: 2508136 Country of ref document: CA |
|
| WWE | Wipo information: entry into national phase |
Ref document number: 1020057010476 Country of ref document: KR Ref document number: 11148352 Country of ref document: US |
|
| WWE | Wipo information: entry into national phase |
Ref document number: 2003777384 Country of ref document: EP |
|
| WWE | Wipo information: entry into national phase |
Ref document number: 20038A95992 Country of ref document: CN |
|
| WWP | Wipo information: published in national office |
Ref document number: 1020057010476 Country of ref document: KR |
|
| WWP | Wipo information: published in national office |
Ref document number: 2003777384 Country of ref document: EP |