EP3385952B1 - Dispositif de traitement d'informations, procédé de traitement d'informations, et programme - Google Patents
Dispositif de traitement d'informations, procédé de traitement d'informations, et programme Download PDFInfo
- Publication number
- EP3385952B1 EP3385952B1 EP16870478.1A EP16870478A EP3385952B1 EP 3385952 B1 EP3385952 B1 EP 3385952B1 EP 16870478 A EP16870478 A EP 16870478A EP 3385952 B1 EP3385952 B1 EP 3385952B1
- Authority
- EP
- European Patent Office
- Prior art keywords
- signal
- frequency
- disk
- tpp
- record
- Prior art date
- Legal status (The legal status is an assumption and is not a legal conclusion. Google has not performed a legal analysis and makes no representation as to the accuracy of the status listed.)
- Active
Links
- 230000010365 information processing Effects 0.000 title claims description 38
- 238000003672 processing method Methods 0.000 title claims description 10
- 238000000034 method Methods 0.000 claims description 127
- 230000008569 process Effects 0.000 claims description 103
- 230000003287 optical effect Effects 0.000 claims description 73
- 238000012545 processing Methods 0.000 claims description 68
- 230000003044 adaptive effect Effects 0.000 claims description 64
- 238000001514 detection method Methods 0.000 claims description 20
- 238000007476 Maximum Likelihood Methods 0.000 claims description 16
- 230000000737 periodic effect Effects 0.000 claims description 10
- 238000000605 extraction Methods 0.000 claims description 4
- 230000004044 response Effects 0.000 claims description 4
- 238000010586 diagram Methods 0.000 description 28
- 238000003491 array Methods 0.000 description 21
- 238000004088 simulation Methods 0.000 description 17
- 239000002131 composite material Substances 0.000 description 15
- 238000011156 evaluation Methods 0.000 description 13
- 238000006243 chemical reaction Methods 0.000 description 10
- 238000001228 spectrum Methods 0.000 description 8
- 238000004364 calculation method Methods 0.000 description 5
- 230000015572 biosynthetic process Effects 0.000 description 3
- 230000000694 effects Effects 0.000 description 2
- 239000000284 extract Substances 0.000 description 2
- 230000006870 function Effects 0.000 description 2
- 239000000969 carrier Substances 0.000 description 1
- 238000004891 communication Methods 0.000 description 1
- 238000007405 data analysis Methods 0.000 description 1
- 238000002474 experimental method Methods 0.000 description 1
- 238000012986 modification Methods 0.000 description 1
- 230000004048 modification Effects 0.000 description 1
- 230000001629 suppression Effects 0.000 description 1
- 230000007704 transition Effects 0.000 description 1
Images


Classifications
-
- G—PHYSICS
- G11—INFORMATION STORAGE
- G11B—INFORMATION STORAGE BASED ON RELATIVE MOVEMENT BETWEEN RECORD CARRIER AND TRANSDUCER
- G11B7/00—Recording or reproducing by optical means, e.g. recording using a thermal beam of optical radiation by modifying optical properties or the physical structure, reproducing using an optical beam at lower power by sensing optical properties; Record carriers therefor
- G11B7/007—Arrangement of the information on the record carrier, e.g. form of tracks, actual track shape, e.g. wobbled, or cross-section, e.g. v-shaped; Sequential information structures, e.g. sectoring or header formats within a track
- G11B7/00718—Groove and land recording, i.e. user data recorded both in the grooves and on the lands
-
- G—PHYSICS
- G11—INFORMATION STORAGE
- G11B—INFORMATION STORAGE BASED ON RELATIVE MOVEMENT BETWEEN RECORD CARRIER AND TRANSDUCER
- G11B7/00—Recording or reproducing by optical means, e.g. recording using a thermal beam of optical radiation by modifying optical properties or the physical structure, reproducing using an optical beam at lower power by sensing optical properties; Record carriers therefor
- G11B7/004—Recording, reproducing or erasing methods; Read, write or erase circuits therefor
- G11B7/005—Reproducing
-
- G—PHYSICS
- G11—INFORMATION STORAGE
- G11B—INFORMATION STORAGE BASED ON RELATIVE MOVEMENT BETWEEN RECORD CARRIER AND TRANSDUCER
- G11B20/00—Signal processing not specific to the method of recording or reproducing; Circuits therefor
- G11B20/10—Digital recording or reproducing
-
- G—PHYSICS
- G11—INFORMATION STORAGE
- G11B—INFORMATION STORAGE BASED ON RELATIVE MOVEMENT BETWEEN RECORD CARRIER AND TRANSDUCER
- G11B20/00—Signal processing not specific to the method of recording or reproducing; Circuits therefor
- G11B20/10—Digital recording or reproducing
- G11B20/10009—Improvement or modification of read or write signals
- G11B20/10268—Improvement or modification of read or write signals bit detection or demodulation methods
- G11B20/10287—Improvement or modification of read or write signals bit detection or demodulation methods using probabilistic methods, e.g. maximum likelihood detectors
- G11B20/10296—Improvement or modification of read or write signals bit detection or demodulation methods using probabilistic methods, e.g. maximum likelihood detectors using the Viterbi algorithm
-
- G—PHYSICS
- G11—INFORMATION STORAGE
- G11B—INFORMATION STORAGE BASED ON RELATIVE MOVEMENT BETWEEN RECORD CARRIER AND TRANSDUCER
- G11B20/00—Signal processing not specific to the method of recording or reproducing; Circuits therefor
- G11B20/10—Digital recording or reproducing
- G11B20/18—Error detection or correction; Testing, e.g. of drop-outs
-
- G—PHYSICS
- G11—INFORMATION STORAGE
- G11B—INFORMATION STORAGE BASED ON RELATIVE MOVEMENT BETWEEN RECORD CARRIER AND TRANSDUCER
- G11B7/00—Recording or reproducing by optical means, e.g. recording using a thermal beam of optical radiation by modifying optical properties or the physical structure, reproducing using an optical beam at lower power by sensing optical properties; Record carriers therefor
- G11B7/004—Recording, reproducing or erasing methods; Read, write or erase circuits therefor
- G11B7/005—Reproducing
- G11B7/0052—Reproducing involving reflectivity, absorption or colour changes
-
- G—PHYSICS
- G11—INFORMATION STORAGE
- G11B—INFORMATION STORAGE BASED ON RELATIVE MOVEMENT BETWEEN RECORD CARRIER AND TRANSDUCER
- G11B7/00—Recording or reproducing by optical means, e.g. recording using a thermal beam of optical radiation by modifying optical properties or the physical structure, reproducing using an optical beam at lower power by sensing optical properties; Record carriers therefor
- G11B7/007—Arrangement of the information on the record carrier, e.g. form of tracks, actual track shape, e.g. wobbled, or cross-section, e.g. v-shaped; Sequential information structures, e.g. sectoring or header formats within a track
-
- G—PHYSICS
- G11—INFORMATION STORAGE
- G11B—INFORMATION STORAGE BASED ON RELATIVE MOVEMENT BETWEEN RECORD CARRIER AND TRANSDUCER
- G11B7/00—Recording or reproducing by optical means, e.g. recording using a thermal beam of optical radiation by modifying optical properties or the physical structure, reproducing using an optical beam at lower power by sensing optical properties; Record carriers therefor
- G11B7/24—Record carriers characterised by shape, structure or physical properties, or by the selection of the material
- G11B7/2407—Tracks or pits; Shape, structure or physical properties thereof
- G11B7/24073—Tracks
-
- G—PHYSICS
- G11—INFORMATION STORAGE
- G11B—INFORMATION STORAGE BASED ON RELATIVE MOVEMENT BETWEEN RECORD CARRIER AND TRANSDUCER
- G11B20/00—Signal processing not specific to the method of recording or reproducing; Circuits therefor
- G11B20/10—Digital recording or reproducing
- G11B20/10009—Improvement or modification of read or write signals
-
- G—PHYSICS
- G11—INFORMATION STORAGE
- G11B—INFORMATION STORAGE BASED ON RELATIVE MOVEMENT BETWEEN RECORD CARRIER AND TRANSDUCER
- G11B7/00—Recording or reproducing by optical means, e.g. recording using a thermal beam of optical radiation by modifying optical properties or the physical structure, reproducing using an optical beam at lower power by sensing optical properties; Record carriers therefor
- G11B2007/0003—Recording, reproducing or erasing systems characterised by the structure or type of the carrier
- G11B2007/0006—Recording, reproducing or erasing systems characterised by the structure or type of the carrier adapted for scanning different types of carrier, e.g. CD & DVD
Definitions
- the present disclosure relates to an information processing apparatus, an optical disk, an information processing method, and a program. More particularly, the disclosure relates to an information processing apparatus, an optical disk, an information processing method, and a program for achieving recording and reproduction of high-density data.
- optical disks such as DVDs (Digital Versatile Discs) and BDs (Blu-ray (registered trademark) Discs) are extensively used as optical disks (media) for recording diverse content including movies, pieces of music and the like.
- Ultra-high Definition images Today's recording media such as BDs mostly record HD images, i.e., so-called Hi-vision-ready 2K images. As enhancement of image quality continues, those media having ultra-high definition images (UHD: Ultra High Definition images) recorded thereon are expected to multiply. It is to be noted that, for example, 4K and 8K high-definition images are typical of the ultra-high definition images (UHD images).
- Performed on the optical disks such as BDs is the process of emitting a laser beam to the data-recording surface of the disk and analyzing reflected light therefrom to read the signal recorded on the disk.
- resolution limit i.e., maximum reproducible period
- PTL 2 shows a method and apparatus for processing an optical disc signal.
- PTL 3 shows re-writable optical disk having reference clock information permanently formed on the disk.
- the present disclosure has been made in view of the above circumstances among others, and provides as an object an information processing apparatus, an optical disk, an information processing method, and a program for achieving recording and reproduction of high-density data.
- an information processing apparatus including a photo-detecting section configured to receive reflected light from a disk, and a signal processing section configured to generate a reproduced signal by performing signal processing on a light reception signal from the photo-detecting section.
- the photo-detecting section has two split detectors A and B in a direction of tracks on the disk.
- the signal processing section generates a TPP (Tangential Push-pull) signal made of a differential signal derived from detection signals from the detectors A and B, and generates the reproduced signal by extracting, from the TPP signal through calculation, a high-frequency component signal in a record signal recorded on the disk.
- TPP Tangential Push-pull
- an optical disk having a record signal recorded on a carrier signal on a disk made of carrier grooves in a protruding and recessed pattern having a high frequency higher than or equal to a cut-off frequency.
- the reproduction apparatus is used to read a TPP (Tangential Push-pull) signal obtained by frequency-shifting a superimposed signal having the carrier signal and the record signal superimposed with each other, the reproduction apparatus being further used to extract a high-frequency component signal from the record signal recorded on the optical disk by performing an operation of frequency-shifting the TPP signal to a high-frequency component range in the record signal recorded on the optical disk.
- TPP Tangential Push-pull
- an information processing method for execution by an information processing apparatus includes a photo-detecting section configured to receive reflected light from a disk, and a signal processing section configured to generate a reproduced signal by performing signal processing on a light reception signal from the photo-detecting section.
- the photo-detecting section has two split detectors A and B in a direction of tracks on the disk.
- the information processing method includes causing the signal processing section to generate a TPP (Tangential Push-pull) signal made of a differential signal derived from detection signals from the detectors A and B, and causing the signal processing section to generate the reproduced signal by extracting, from the TPP signal through calculation, a high-frequency component signal in a record signal recorded on the disk.
- TPP Tangential Push-pull
- the information processing apparatus includes a photo-detecting section configured to receive reflected light from a disk, and a signal processing section configured to generate a reproduced signal by performing signal processing on a light reception signal from the photo-detecting section.
- the photo-detecting section has two split detectors A and B in a direction of tracks on the disk.
- the program performing a procedure includes causing the signal processing section to generate a TPP (Tangential Push-pull) signal made of a differential signal derived from detection signals from the detectors A and B, and causing the signal processing section to generate the reproduced signal by extracting, from the TPP signal through calculation, a high-frequency component signal in a record signal recorded on the disk.
- TPP Torcial Push-pull
- the program of the present disclosure may be offered in a computer-readable format using storage media or communication media to information processing apparatuses or computer systems capable of executing diverse program codes.
- the information processing apparatus or the computer system performs the processes defined by the program.
- system refers to a group of logically configured devices.
- the devices in such a configuration may or may not be housed in a single enclosure.
- an optical disk from which high-density data is reproduced as well as a reproduction apparatus that reproduces data from such an optical disk having high-density data recorded thereon.
- a photo-detecting section having two split detectors A and B in the track direction of the disk and a signal processing section are provided.
- the signal processing section generates a TPP (Tangential Push-pull) signal as a differential signal derived from detection signals of the detectors A and B.
- TPP Transmission Push-pull
- the signal processing section extracts by calculation a high-frequency component signal from a record signal recorded on the disk to generate a reproduced signal.
- the disk is structured to have the record signal recorded on a carrier signal over the disk formed with a protruding and recessed pattern of high frequencies higher than or equal to a cut-off frequency.
- the signal processing section multiplies by the carrier signal the TPP signal read from the disk as a frequency-shifted signal having the carrier signal and the record signal superimposed thereon. In so doing, the signal processing section shifts the TPP signal to frequencies in the high-frequency range to extract the high-frequency component signal from the record signal on the disk.
- These structures are used to implement an optical disk from which high-density data is reproduced as well as a reproduction apparatus that reproduces data from an optical disk having high-density data recorded thereon.
- BD Blu-ray (registered trademark) Disc
- FIG. 1 depicts a typical structure of a data reproduction process for reading and reproducing data from an optical disk 10 that is an optical disk such as BD.
- the disk 10 has mark (pit) arrays of data recorded thereon.
- An optical pickup 20 reads the mark arrays.
- the optical pickup 20 includes a laser beam outputting section 21.
- the laser beam output by the laser beam outputting section 21 is emitted to the disk through a setting light path made up of multiple lenses, for example. Reflected light from the disk 10 is further received by a photo-detecting section (split photo-detector) 22.
- the photo-detecting section (split photo-detector) 22 includes multiple split detectors. Each of the detectors outputs to a signal processing section 23 an electrical signal reflecting the amount of light received.
- the photo-detecting section (split photo-detector) 22 is split into two detectors A and B.
- the signal processing section 23 receives input of two electrical signals (A) and (B) reflecting the amounts of light received by the two detectors A and B.
- the signal processing section 23 performs the process of binarizing a reproduced signal using the electrical signals (A) and (B) input from the photo-detecting section (split photo-detector) 22. That is, the signal processing section 23 generates 1/0 signals reflecting the mark arrays recorded on the disk 10 and outputs the generated signals as the reproduced signal.
- the signal processing section 23 has the functions of performing the process of A/D conversion of the input signal from the photo-detecting section (split photo-detector) 22, the process of generating a clock signal using a PLL (Phase Lock Loop), and a maximum likelihood decoding process based on the method of PRML (Partial Response Maximum Likelihood), for example. Using these processing functions, the signal processing section 23 generates 1/0 signals reflecting the mark arrays recorded on the disk 10 and outputs the generated signals as the reproduced signal.
- PLL Phase Lock Loop
- PRML Partial Response Maximum Likelihood
- the disk 10 has, for example, 4K or 8K high-resolution images recorded thereon as ultra-high definition images (UHD: Ultra High Definition images).
- UHD Ultra High Definition images
- Such high-definition image data contains large quantities of information.
- the disks such as BDs are required to record such data with higher density than ever.
- the disk 10 comes in two types with different densities of mark (pit) arrays: a low-density recording disk with a small amount of recorded data, and a high-density recording disk with a large amount of recorded data.
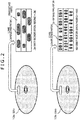
- FIG. 2 schematically depicts typical mark arrays on disks with different data recording densities.
- a disk-a 10a is a low-density recording disk that has marks (low-reflectance portions) 11 formed along with high-reflectance portions 12 other than the marked portions, the two types of portions being alternated at relatively long intervals.
- a disk-b 10b is a high-density recording disk that has numerous marks (low-reflectance portions) 11 arrayed at short intervals with high density in the high-reflectance portions 12 other than the marked portions. This is an example of recorded data with a high spatial frequency.
- what is performed on the optical disk such as BD is the process of emitting a laser beam to the data-recording surface and analyzing reflected light therefrom to read the signal from the disk.
- this method of reproduction using the optical pickup is subject to resolution-level constraints stemming from diffraction of light, for example.
- resolution limit frequency is defined as 2NA/ ⁇ .
- FIG. 3 is an explanatory diagram explaining the resolution limit.
- the example depicted in FIG. 3 is a typical structure for generating a reproduced signal made up of 1 and 0 signals reflecting the mark arrays on the basis of a sum signal A+B generated by a sum signal generating section (Sum) 24 that sums up the electrical signals (A) and (B) formed in the signal processing section 23 from the photo-detecting section 22 having the two split detectors (A, B) described above with reference to FIG. 1 .
- a sum signal generating section (Sum) 24 that sums up the electrical signals (A) and (B) formed in the signal processing section 23 from the photo-detecting section 22 having the two split detectors (A, B) described above with reference to FIG. 1 .
- the output (signal amplitude) of the sum signal generating section (Sum) 24 formed in the signal processing section 23 varies depending on the spatial frequency of the data recorded on the disk 10, as depicted in Subfigure (A) in FIG. 3 , "Corresponding relations between spatial frequencies and sum signal.”
- the signal amplitude becomes 0. That means it is impossible to distinguish the data recorded on the disk having a recording density with a spatial frequency higher than or equal to the frequency Fc.
- the spatial frequency that is the readout limit is known as the cut-off frequency.
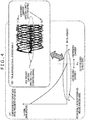
- Subfigure (A) in FIG. 4 is the same as Subfigure (A) in FIG. 3 , "Corresponding relations between spatial frequencies and sum signal.”
- a region S depicted in the graph represents the distribution of spatial frequencies included in the signal recorded on the disk 10. That it, the disk 10 is assumed to store data of the frequency components ranging from a spatial frequency a to a spatial frequency b.
- the frequency a is lower than the cut-off frequency Fc.
- the frequency b is a high-frequency component higher than the cut-off frequency Fc.
- a typical reproduced signal derived from the record signal S has the waveform depicted in Subfigure (B) in FIG. 4 .
- the signal of the low-frequency component lower than the cut-off frequency Fc is divided into the upper and lower portions of the waveform. That is, this signal is reproduced as 1 or 0 signal values.
- the signal of the high-frequency component higher than the cut-off frequency Fc is not divided into the upper and lower portions of the waveform.
- This signal is concentrated on a center portion, i.e., on a boundary region between 0s and 1s. As a result, the signal cannot be reproduced as 1 or 0 signal values.
- resolution limit frequency 2NA/ ⁇ .
- Described below are the structures for achieving recording and reproduction of high-density data.
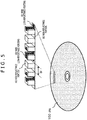
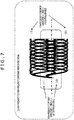
- FIG. 5 depicts an example of a high-density recording disk 100 according to the present disclosure.
- a protruding and recessed pattern that is regularly periodic in the direction of tracks is formed on the disk 100.
- marks corresponding to the record signal making up content data such as movies are recorded.
- the regularly periodic protruding and recessed pattern is formed in advance on the disk, and has a period p as illustrated.
- the frequency specific to the protruding and recessed pattern having the period p is higher than the cut-off frequency Fc explained above with reference to FIGS. 3 and 4 . This is a frequency that exceeds the readout limit of the optical pick 20.
- the record signal corresponding to content such as movies on the disk 100 is recorded by forming marks 101 over the protruding and recessed pattern having the period p.
- the marks 101 are formed, for example, by emitting a laser beam to a phase-change recording layer prepared on the reflecting surface.
- the marks 101 constitute the low-reflectance portions, and the unmarked portions are set to make up high-reflectance portions 102.
- the marked portions (low-reflectance portions) correspond to 1 signals and the high-reflectance portions 102 correspond to 0 signals, or vice versa.
- a mark signal corresponding to the recorded data also includes a high-frequency component. This is a frequency component higher than the cut-off frequency Fc explained above with reference to FIGS. 3 and 4 . That is, the mark signal includes a high-frequency component that exceeds the readout limit of the optical pickup 20.
- the disk 100 according to the present disclosure has the following structures:
- the mark arrays corresponding to the record signal of the data making up content such as movies is recorded on the "carrier.”
- the carrier has frequencies higher than the cut-off frequency Fc.
- the record signal (mark arrays) also includes a high-frequency component higher than the cut-off frequency Fc.
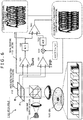
- the disk 100 depicted in FIG. 6 has the following structures as discussed above with reference to FIG. 5 :
- the record signal on the disk 100 is read by an optical pickup 110.
- the optical pickup 110 has the structure similarly to that of the optical pickup 20 described above with reference to FIG. 1 .
- the optical pickup 110 includes a laser beam outputting section 111.
- a laser beam output from the laser beam outputting section 111 is emitted to the disk through multiple lenses, for example. Reflected light from the disk 100 further reaches a photo-detecting section (split photo-detector) 112.
- the photo-detecting section (split photo-detector) 112 has multiple split detectors. Each of the detectors outputs to a signal processing section 113 an electrical signal reflecting the amount of light received.
- the photo-detecting section (split photo-detector) 112 is split into two detectors A and B.
- the signal processing section 113 receives input of two electrical signals (A) and (B) reflecting the amounts of light received by the two detectors A and B.
- the signal processing section 113 performs the process of binarizing a reproduced signal using the electrical signals (A) and (B) input from the photo-detecting section (split photo-detector) 112. That is, the signal processing section 113 generates 1/0 signals reflecting the mark arrays recorded on the disk 100, and outputs the generated signals as the reproduced signal.
- the signal processing section 113 includes two sections:
- the electrical signals (A) and (B) from the two split detectors (A, B) of the photo-detecting section 112 are input to the sum signal generating section (Sum) 121 and to the differential signal generating section (TPP) 131.
- the differential signal generating section (TPP) 131 generates a push-pull signal using the two electrical signals (A) and (B) from the photo-detecting section 112 with the two split detectors (A, B) arrayed in the track direction (tangential direction) on the disk 11. That is, the output of the differential signal generating section (TPP) 131 is a tangential push-pull signal (TPP: Tangential Push-pull) based on the electrical signals (A) and (B).
- the output of the sum signal generating section (Sum) 121 will be referred to as “sum signal” or “addition signal,” and the output of the differential signal generating section (TPP) 131 as “TPP signal” or “differential signal.”
- the sum signal which is output from the sum signal generating section (Sum) 121, is input to a gain controlling section (K1) 122 as well as to a composite signal generating section 141.
- the gain controlling section (K1) may be configured as a filter here.
- a reference example depicted as "(1) Sum base reproduced signal (for reference)" in FIG. 6 is similar signal to the reproduced signal explained above with reference to Subfigure (B) in FIG. 4 .
- the sum base reproduced signal is a signal with a low-frequency component lower than the cut-off frequency Fc and is divided into the upper and lower portions of the waveform. That is, this signal is reproduced as 1 or 0 signal values.
- a signal with a high-frequency component higher than the cut-off frequency Fc is not divided into the upper and lower portions of the waveform.
- Such a signal is concentrated on the center portion, i.e., the boundary region between 0s and 1s. As a result, the signal cannot be reproduced as 1 or 0 signal values.
- the sum base reproduced signal is not used as the reproduced signal. Instead, the output of the composite signal generating section 141 depicted in FIG. 6 , i.e., a reproduced signal depicted in Subfigure (2) in FIG. 6 (low-frequency to high-frequency component reproduced signal), is generated and used as the reproduced signal.
- the TPP signal which is output from the differential signal generating section (TPP) 131 depicted in FIG. 6 , is multiplied with a separately generated carrier signal by a multiplier 132.
- the carrier signal on the disk is a signal based on the protruding and recessed pattern with the period p formed beforehand on the disk 100.
- This signal corresponds to a sine wave defined as [Sin(2 ⁇ x/p)]. It is to be noted that the symbol x indicates a position in the track direction of the disk.
- the TPP signal which is output from the differential signal generating section (TPP) 131, is a so-called moire signal having the following two different signals superimposed thereon:
- the carrier signal on the disk is a protruding and recessed pattern making up a phase component and because the marks constitute changes in reflectance with no phase, the moire signal is generated as the phase component by the multiplication.
- the TPP signal reproduces the phase component.
- the TPP signal as the superimposed signal is multiplied with the separately-generated carrier signal [Sin(2 ⁇ x/p)].
- This operation involves frequency-shifting the TPP signal read from the disk as a frequency-shifted readout signal (moire signal) having the carrier signal and the record signal superimposed thereon, to the high-frequency component signal in the record signal on the disk for signal component extraction.
- the output of the multiplier 132 is the record signal component extracted by frequency-shifting the TPP signal to the high-frequency component in the record signal recorded on the disk, the TPP signal having been obtained as a frequency-shifted readout signal (moire signal) having the carrier signal on the disk and the record signal superimposed thereon.
- the output of the multiplier 132 is input to a gain controlling section (K2) 133, before being input to a sum signal generating section 118.
- the gain controlling section (K2) may be configured as a filter here.
- the composite signal generating section 141 performs the process of combining two signals: the sum base reproduced signal explained above with reference to Subfigure (1) in FIG. 6 , and a TPP base signal based on the output of the multiplier 132 having removed the carrier signal component of the disk from the TPP signal.
- the output of the composite signal generating section 141 is the reproduced signal (low-frequency to high-frequency component reproduced signal) depicted in Subfigure (2) in FIG. 6 .
- the reproduced signal depicted in Subfigure (2) in FIG. 6 is a composite signal combining the following two signals:
- the reproduced signal indicated in Subfigure (2) in FIG. 6 is a composite signal combining the above two signals.
- the sum base reproduced signal is obtained through the sum signal generating section (Sum) 121 and the gain controlling section (K1) 122.
- the TPP base reproduced signal is obtained through the differential signal generating section (TPP) 131, the multiplier 132, and the gain controlling section (K2) 133.
- the TPP signal having the following two signals superimposed thereon is obtained as a readout signal frequency-shifted to low frequencies:
- the TPP base reproduced signal is then extracted by frequency-shifting the TPP signal to the high-frequency component in the record signal recorded on the disk.
- the moire signal often occurs at low frequencies in a range where the carrier signal on the disk with frequencies higher than the cut-off frequency (Fc) over the entire range and the high-frequency portion in the record signal with frequencies higher than the cut-off frequency (Fc) are superimposed on each other.
- the composite signal generating section 141 combines the high-frequency range signal in the record signal obtained from the TPP base reproduced signal, with the low-frequency range signal in the record signal acquired from the sum base reproduced signal, the low-frequency range signal having frequencies lower than the cut-off frequency (Fc). In so doing, the composite signal generating section 141 acquires a reproduced signal with a wide frequency band ranging from the low to high frequencies in the record signal, as depicted in Subfigure (2) in FIG. 6 .
- the data recorded on the disk 100 includes mixed frequency component signals ranging from low-frequency signal to high-frequency signal.
- FIG. 7 depicts a typical reproduced signal that is read using the optical pickup 110 depicted in FIG. 6 and obtained as a result of the processing by the signal processing section 113.
- the frequency component lower than the cut-off frequency Fc is divided into the upper and lower portions of a signal pattern waveform depicted in FIG. 7 . That is, the low-frequency component is reproduced as 1 or 0 signal values.
- the low-frequency component is a reproduced signal obtained from the sum base reproduced signal. That is, this is a signal acquired through the sum signal generating section (Sum) 121 and the gain controlling section (K1) 122.
- the frequency component higher than the cut-off frequency Fc is divided into the upper and lower portions in a center region of the signal pattern waveform depicted in FIG. 7 .
- the signal is also divided distinctly into the upper and lower portions around a center line p-q. That is, the high-frequency component is reproduced as 1 or 0 signal values.
- the high-frequency component is concentrated on the center portion of the waveform and is not divided into the upper and lower portions.
- the high-frequency component is divided into the upper and lower portions around the center line p-q, so that the reproduced signal made up of 1s and 0s is obtained.
- This high-frequency component is the reproduced signal obtained from the TPP base reproduced signal. That is, this is a signal acquired through the differential signal generating section (TPP) 131, the multiplier 132, and the gain controlling section (K2) 132.
- the signal obtained by the photo-detecting section 112 split into two detectors is used to acquire the sum base reproduced signal and the TPP base reproduced signal.
- the reproduced signal is obtained as a signal with a wider frequency range ranging from low frequencies lower than the cut-off frequency (Fc) to high frequencies higher than the cut-off frequency (Fc).
- the TPP base reproduced signal is obtained by removing the carrier signal component from the superimposed signal (moire signal) including:
- the TPP base reproduced signal corresponds to the high-frequency range signal in the record signal.
- FIG. 8 is an explanatory diagram explaining the characteristics of the sum signal and of the TPP signal.
- the disk 100 stores a carrier (protruding and recessed pattern) recorded in the track direction with frequencies higher than the cut-off frequency Fc.
- a record signal made up of mark arrays is recorded on the carrier.
- the photo-detecting section 112 of the pickup has two split detectors A and B in the track direction.
- Each of the split detectors of the photo-detecting section receives reflected light of a laser beam emitted to the disk 100, and outputs an electrical signal reflecting the amount of light received.
- the electrical signal output from the detector A is designated by reference character A, and the electrical signal from the detector B is indicated by reference character B.
- This graph is the same as the graphs explained above with reference to FIGS. 3 and 4 .
- the output (signal amplitude) of the sum signal generating section (Sum) 121 varies depending on the spatial frequency of the data recorded on the disk 100, as depicted in the graph of Subfigure (1) in FIG. 8 .
- the signal amplitude is 0. That means it is impossible to distinguish the data recorded on the disk having a recording density with a spatial frequency higher than or equal to the frequency Fc.
- the cut-off frequency Fc which is the spatial frequency constituting the readout limit
- the output (signal amplitude) of the differential signal generating section (TPP) 131 varies depending on the spatial frequency of the data recorded on the disk 100, as depicted in the graph of Subfigure (2) in FIG. 8 .
- the signal amplitude of the TPP signal plots a smooth, mound-shaped curve in keeping with changing spatial frequencies.
- the carrier protruding and recessed pattern recorded in the track direction with frequencies higher than the cut-off frequency Fc is formed on the disk 100.
- the signal made up of mark arrays is recorded on the carrier.
- the optical pickup reads the superimposed signal having the two signals (carrier signal and record signal) superimposed on each other, i.e., reads a multiplication of complex reflectance rates.
- the amplitude of the TPP signal corresponds to the amplitude of the moire signal obtained as the superimposed signal having the two signals superimposed on each other.
- the amplitude of the TPP signal is maximized at a spatial frequency Fa in the graph of Subfigure (2) in FIG. 8 .
- the spatial frequency Fa is the point at which the moire signal as the superimposed signal of the two signals (carrier signal and record signal) is most distinctly reproduced.
- FIG. 9 is an explanatory diagram explaining a carrier signal structure and a record signal on the disk 100.
- the disk 100 stores the following two kinds of data:
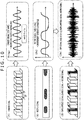
- FIG. 10 depicts typical data of these two signals (the carrier signal and the record signal on the disk) and of the superimposed signal (moire signal) made up of the two signals.
- FIG. 10 indicates the structures of the following three signals on the disk together with readout signals from these structures:
- the signal depicted in Subfigure (3b) in FIG. 10 is a TPP signal obtained as the readout signal of a signal range A (reproducible range A) of the superimposed signal, i.e., a typical TPP signal output by the differential signal generating section (TPP) 131 explained above with reference to FIG. 6 .
- This TPP signal is a signal pattern read out as the superimposed signal constituted by the carrier signal made of the sine wave depicted in Subfigure (1b) in FIG. 10 and by the record signal indicated in Subfigure (2b) in FIG. 10 , i.e., a signal pattern read out as the moire signal.
- the TPP signal depicted in Subfigure (3b) is a multiplication of the carrier signal component and the record signal component. This is a signal obtained by having the high-frequency component of the record signal shifted lower by the amount of the carrier signal frequency. Shifting the frequency of this TPP signal higher by the amount of the carrier signal frequency reconstitutes the frequency of the record signal component on the disk.
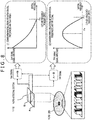
- FIG. 11 depicts the following signals:
- a dotted line in the graph constitutes the signal characteristics of the sum signal A+B output from the sum signal generating section (Sum) 121 depicted in FIG. 6 , i.e., from the two detectors.
- the dotted line graphically represents a sum characteristic curve.
- the output (signal amplitude) of the sum signal generating section (Sum) 121 varies depending on the spatial frequency of the data recorded on the disk 100, as indicated by the graph in Subfigure (1) in FIG. 11 .
- the signal amplitude is 0. That means it is impossible to distinguish the data recorded on the disk having a recording density with a spatial frequency higher than or equal to the frequency Fc.
- the cut-off frequency Fc which is the spatial frequency constituting the readout limit
- a solid line in the graph represents the frequency distribution of the record signal recorded on the disk 100.
- the record signal includes diverse frequency components ranging from low-frequency components lower than the cut-off frequency (Fc) to high-frequency components higher than the cut-off frequency (Fc).
- the portion inside the sum characteristic curve plotted by the dotted line makes up a signal range that can be reproduced using the sum signal (reproducible range A).
- the portion outside the sum characteristic curve represented by the dotted line is a signal range that cannot be reproduced using the sum signal.
- the graph in Subfigure (2) in FIG. 11 indicates the signal characteristics of the differential signal A-B made of the output from the differential signal generating section (TPP) 131 explained above with reference to Subfigure (2) in FIG. 8 , i.e., of the output from the two detectors.
- the output (signal amplitude) of the differential signal generating section (TPP) 131 varies depending on the spatial frequency of the data recorded on the disk 100, as indicated by the curve (TPP characteristic curve) in Subfigure (2) in FIG. 11 .
- the record signal component is then extracted by shifting the TPP signal by the amount of the carrier signal frequency on the disk.
- the process of shifting the TPP signal by the amount of the carrier signal frequency is carried out by the multiplier 132 explained above with reference to FIG. 6 , i.e., the process of multiplying the TPP signal with the separately generated carrier signal [Sin(2 ⁇ x/p)].
- the signal depicted in Subfigure (3) in FIG. 11 is obtained by the process of multiplying the TPP signal depicted in Subfigure (2) in FIG. 11 with the separately generated carrier signal [Sin(2 ⁇ x/p)].
- the signal in Subfigure (3) in FIG. 11 is thus a signal obtained by shifting the TPP signal in Subfigure (2) in FIG. 11 to the high-frequency range.
- the high-frequency component in the record signal recorded on the disk is reconstituted from the carrier signal on the disk and from the TPP signal as the readout signal obtained by frequency-shifting the superimposed signal of the carrier signal and the record signal, through the process of multiplying the TPP signal depicted in Subfigure (2) in FIG. 11 with the separately-generated carrier signal [Sin(2 ⁇ x/p)].
- the characteristic curve of only the record signal included in the TPP signal depicted in Subfigure (3) in FIG. 11 i.e., the TPP characteristic curve corresponding to the record signal, is obtained.
- a dotted line depicted in Subfigure (3) in FIG. 11 represents the TPP characteristic curve corresponding to the record signal.
- the TPP signal output from the differential signal generating section 131 in FIG. 6 is multiplied by the separately generated carrier signal [Sin(2 ⁇ x/p)]. This removes the carrier signal component from the TPP signal.
- the result is the frequency-shifted TPP signal in Subfigure (3) in FIG. 11 , i.e., the TPP characteristic curve corresponding to the record signal containing only the record signal component.
- a solid line in this graph is similarly to the solid line depicted in Subfigure (1) in FIG. 11 , and represents the frequency distribution of the record signal on the disk.
- the range inside the TPP characteristic curve corresponding to the record signal plotted by the dotted line is a signal range that can be reproduced using the TPP signal (reproducible range B).
- the portion outside the TPP characteristic curve corresponding to the record signal plotted by the dotted line constitutes a signal range that cannot be reproduced using the TPP signal.
- the signal range A (reproducible range A) in the graph depicted in Subfigure (1) in FIG. 11 corresponds to the low-frequency range signal in the record signal.
- the signal range B (reproducible range B) in the graph depicted in Subfigure (3) in FIG. 11 corresponds to the high-frequency range signal in the record signal.
- the reproduced signal depicted in Subfigure (4) in FIG. 11 is similarly to the reproduced signal explained above with reference to Subfigure (2) in FIG. 6 .
- the reproduced signal depicted in Subfigure (4) in FIG. 11 is a composite signal of the following two signals:
- the low-frequency component signal corresponding to the signal range A (reproducible range A) depicted in Subfigure (1) in FIG. 11 is a reproduced signal based on the sum signal of the upper and lower ends in Subfigure (4) in FIG. 11 .
- the low-frequency component in the record signal with frequencies lower than or equal to the cut-off frequency (Fc) may be acquired from the sum base reproduced signal in this manner.
- the high-frequency component signal corresponding to the signal range B (reproducible range B) depicted in Subfigure (3) in FIG. 11 is a reproduced signal based on the TPP signal separated into the upper and lower portions in the center region of Subfigure (4) in FIG. 11 .
- the high-frequency component in the record signal with frequencies higher than or equal to the cut-off frequency (Fc) may be acquired from the TPP base reproduced signal in this manner.
- the reproduced signal based on the sum signal is obtained through the sum signal generating section (Sum) 121 and the gain controlling section (K1) 122 in the configuration depicted in FIG. 6 .
- the reproduced signal based on the TPP signal is obtained through the differential signal generating section (TPP) 131, the multiplier 132, and the gain controlling section (K2) 133 indicated in the configuration depicted in FIG. 6 .
- FIG. 12 depicts typical reproduced data from the simulation in which data was recorded and reproduced under the following condition settings.
- FIG. 12 gives respective subfigures representing the details resulting from the simulation of data reproduction under the above-described condition settings.
- the subfigures indicate:
- Subfigure (1) in FIG. 12 depicts a typical sum signal and a typical TPP signal acquired from the readout signal from the disk.
- the acquired signals depicted in Subfigure (1) are two reproduced signals obtained using the reproduction apparatus configured as explained above with reference to FIG. 6 , the reproduction apparatus reproducing the signals from the disk 100 by means of the split detectors (A, B) of the photo-detecting section 112.
- the two reproduced signals are:
- Subfigure (2) in FIG. 12 depicts a typical reproduced signal obtained using only the sum signal (A+B). This signal corresponds to the output signal from the gain controlling section 122 in the configuration of FIG. 6 .
- the reproduced signal obtained using only the sum signal depicted in Subfigure (2) in FIG. 12 is a low-frequency component signal with frequencies lower than the cut-off frequency Fc, the low-frequency component being divided into the upper and lower portions of the waveform and thus reproduced as 1 or 0 signal values.
- a high-frequency component signal with frequencies higher than the cut-off frequency Fc is not divided into the upper and lower portions of the waveform.
- the high-frequency component is concentrated on the center region, i.e., on a boundary region at the center of the up-down direction of the waveform. As a result, the high-frequency component signal cannot be reproduced as 1 or 0 signal values.
- Subfigure (3) in FIG. 12 depicts a typical reproduced signal obtained using the sum signal (A+B) and the TPP signal (A-B). This signal corresponds to the output of the composite signal generating section 141 in the configuration of FIG. 6 .
- the reproduced signal depicted in Subfigure (3) in FIG. 12 is a composite signal of the following two signals:
- the sum base reproduced signal is obtained through the sum signal generating section (Sum) 121 and the gain controlling section (K1) 122 in the configuration depicted in FIG. 6 .
- the TPP base reproduced signal is obtained through the differential signal generating section (TPP) 131, the multiplier 132, and the gain controlling section (K2) 133.
- the TPP base reproduced signal is acquired by removing the carrier signal component from the superimposed signal (moire signal) made up of the following two different signals:
- the moire signal often occurs at low frequencies in a range where the carrier signal on the disk with frequencies higher than the cut-off frequency (Fc) and the high-frequency portion in the record signal with frequencies higher than the cut-off frequency (Fc) are superimposed on each other.
- the composite signal generating section 141 combines the high-frequency range signal in the record signal obtained from the TPP base reproduced signal, with the low-frequency range signal in the record signal acquired from the sum base reproduced signal, the low-frequency range signal having frequencies lower than the cut-off frequency (Fc). In so doing, the composite signal generating section 141 acquires a reproduced signal with a wide frequency band ranging from the low to high frequencies in the record signal, the reproduced signal being depicted in Subfigure (2) in FIG. 12 .
- BDs utilize the RLL-PP modulation method (RLL: Run Length Limited, PP: Parity preserve/Prohibit rmtr (repeated minimum transition runlength)), which improves on the existing (1, 7) RLL modulation method.
- RLL Run Length Limited
- PP Parity preserve/Prohibit rmtr (repeated minimum transition runlength)
- the (1, 7) RLL-PP modulation method has a number of improvements including suppression of the DC component and constraints on the repeat count of minimum marks and minimum spaces.
- the RLL (Run Length Limited) code involves widening the interval between edges so as to minimize the occurrence of intersymbol interference while improving recording density.
- the RLL code is a variation of run-length coding. This is a technique that involves limiting the maximum and minimum run lengths for run-length coding by which m-bit recorded data is converted to n-bit data, n being different from m.
- Tmin d + 1 m / n Td
- Td denotes the clock pulse width
- d represents the maximum number of consecutive 0s in an NRZI (Non Return to Zero Inverted) signal, which is a record signal generated by inverting the polarity of pulses in accordance with the values of 0s or 1s in the modulated data to be recorded
- (d+1) stands for the minimum run length.
- Tmin/Td which represents recording density ratio, is preferably longer in view of optical constraints.
- the width which can represent an allowable jitter amount, is preferably larger.
- RLL Random Length Limited
- the modulation based on the (1, 7) RLL modulation method constitutes a data conversion method in which the number of consecutive 0s in modulated bits is between a minimum of 1 and a maximum of 7 under the (1, 7) RLL run-length constraints.
- recording units are generated in synchronism with a synchronizing signal and recorded on the disk.
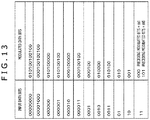
- the conversion table is used in the process of modulating two-bit data into three-bit data in accordance with the (1, 7) RLL run-length rules.
- a specific example of the conversion table is depicted in FIG. 13 .
- the conversion table associates input bits with modulated data bits. For example, if the input data is [00000000], the modulated data bits are [010100100100]. Where the input data is [11], the modulated data bits are [000] if the preceding modulated bits are [ ⁇ 1] or are [101] if the preceding modulated data bits are [ ⁇ 0].
- modulated data bits are generated in accordance with the (1, 7) RLL run-length rules.
- FIG. 14 is an explanatory diagram explaining (1, 7) RLL-pp modulated data as the record signal as well as the carrier signal used in the simulation.
- Subfigure (1) in FIG. 14 is a graph with the horizontal axis denoting frequencies and the vertical axis representing amplitudes.
- the graph plots a 3T frequency carrier and the (1, 7) RLL-pp modulated data as the record signal.
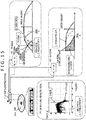
- FIG. 15 depicts the following signals:
- Subfigure (1) in FIG. 15 depicting a carrier signal and a record signal indicates the same graph explained above with reference to Subfigure (2) in FIG. 14 .
- the graph depicts the frequency distribution of a carrier (3T) and a record signal with its high frequencies cut off.
- FIG. 16 is an explanatory diagram explaining the process of generating a reproduced signal using the record signal band-limited as described above.
- FIG. 16 gives graphs of the following signals:
- the graph in Subfigure (1) in FIG. 16 depicts the output of the differential signal generating section (TPP) 131 explained above with reference to Subfigure (2) in FIG. 8 , i.e., the signal characteristics of the differential signal A-B output from the two detectors.
- the output (signal amplitude) of the differential signal generating section (TPP) 131 varies depending on the spatial frequency of the data recorded on the disk 100, as indicated by the curve (TPP characteristic curve) depicted in Subfigure (1) in FIG. 16 .
- the record signal component can be extracted by frequency-shifting the TPP signal through multiplication with the carrier signal.
- the process of removing the carrier signal component from the TPP signal is performed by the multiplier 132 explained above with reference to FIG. 6 , i.e., by multiplying the TPP signal with the carrier signal [Sin(2 ⁇ x/p)].
- the signal depicted in Subfigure (2) in FIG. 16 is obtained by the process of multiplying the TPP signal depicted in Subfigure (1) in FIG. 16 with the carrier signal [Sin(2 ⁇ x/p)].
- the signal depicted in Subfigure (2) in FIG. 16 is acquired by shifting the TPP signal depicted in Subfigure (1) in FIG. 16 to the high-frequency range.
- the record signal reproduced as a moire signal when shifted to the low-frequency range is brought back to the initial frequency band through multiplication of the TPP signal depicted in Subfigure (1) in FIG. 16 with the carrier signal [Sin(2 ⁇ x/p)].
- This provides the characteristic curve of only the record signal contained in the TPP signal depicted in Subfigure (2) in FIG. 16 , i.e., a TPP characteristic curve corresponding to the record signal.
- Subfigure (2) in FIG. 16 depicts the TPP characteristic curve corresponding to the record signal, together with the band-limited record signal.
- the range enclosed by the TPP characteristic curve corresponding to the record signal is a range that is readable using the TPP signal.
- a dashed line denotes the frequency distribution of the record signal on the disk.
- the portion inside the solid-line TPP characteristic curve corresponding to the record signal is a signal range that can be reproduced using the TPP signal.
- the portion outside the TPP characteristic curve corresponding to the record signal is a signal range that cannot be reproduced using the TPP signal.
- Subfigure (3) sum signal in FIG. 16 depicts a graph indicative of the corresponding relations between the spatial frequency and the sum signal explained above with reference to Subfigure (1) in FIG. 8 , along with a pattern of the reproduced signal based on the sum signal.
- the graph depicts the output of the sum signal generating section (Sum) 121 depicted in FIG. 6 , i.e., the sum characteristic curve representing the signal characteristics of the sum signal A+B output from the two detectors, together with the band-limited record signal.
- the output (signal amplitude) of the sum signal generating section (Sum) 121 varies depending on the spatial frequency of the data recorded on the disk 100, as graphically indicated in Subfigure (3) in FIG. 16 .
- the signal amplitude is 0. That means it is impossible to distinguish the data recorded on the disk having a recording density with a spatial frequency higher than or equal to the frequency Fc.
- the cut-off frequency Fc which is the spatial frequency constituting the readout limit
- a dashed line in the graph denotes the frequency distribution of the record signal recorded on the disk 100.
- the record signal includes diverse frequency components ranging from low-frequency components lower than the cut-off frequency (Fc) to high-frequency components higher than the cut-off frequency (Fc).
- the portion inside the sum characteristic curve designated by a dotted line is a signal range that can be reproduced using the sum signal.
- the portion outside the sum characteristic curve indicted by a solid line is a signal range that cannot be reproduced using the sum signal.
- a "range readable using the sum signal" in the graph depicted in Subfigure (3) in FIG. 16 corresponds to the low-frequency range signal in the record signal.
- a "range readable using the TPP signal" in the graph depicted in Subfigure (2) in FIG. 16 corresponds to the high-frequency range signal in the record signal.
- This signal corresponds to the output of the composite signal generating section 141 in the configuration depicted in FIG. 6 .
- the reproduced signal based on the sum signal is obtained through the sum signal generating section (Sum) 121 and the gain controlling section (K1) 122 in the configuration depicted in FIG. 6 .
- the reproduced signal based on the TPP signal is acquired through the differential signal generating section (TPP) 131, the multiplier 132, and the gain controlling section (K2) 133 in the configuration indicated in FIG. 6 .
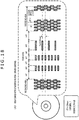
- the formation of the carrier on the disk i.e., the formation of the protruding and recessed pattern as carrier grooves, has multiple variations.
- FIG. 17 depicts disks having two different carriers formed thereon. Depicted in this drawing are the following disks:
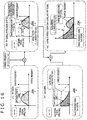
- FIG. 18 depicts an example of how record data and servo data are recorded on the disk formed with staggered pattern carrier grooves indicated in Subfigure (A) in FIG. 17 .
- the record data that constitutes content such as movies alternates with the servo data. That is, as illustrated, a recording area for recording the record data and a servo area for recording the servo data are alternated when recorded.
- the staggered pattern carrier grooves are formed in the recording area.
- the protruding and the recessed portions are arrayed in a staggered manner between adjacent tracks.
- the record signal recorded in the recording area includes a high-frequency range signal with frequencies higher than the cut-off frequency.
- the servo data recorded in the servo area is provided as data of a frequency band that can be read using only the usual sum signal, without recourse to the above-described TPP signal.
- the servo data is recorded using marks 10T to 14T.
- FIG. 19 depicts an example of how record data and servo data are recorded on the disk formed with radiating pattern carrier grooves indicated in Subfigure (B) in FIG. 17 .
- the record data that makes up content such as movies alternates with the servo data. That is, as illustrated, a recording area for recording the record data and a servo area for recording the servo data are alternated when recorded.
- the radiating pattern carrier grooves are formed in the recording area.
- the protruding and the recessed portions are aligned between adjacent tracks.
- the record signal recorded in the recording area includes a high-frequency range signal with frequencies higher than the cut-off frequency.
- the servo data recorded in the servo area is provided as data of a frequency band that can be read using only the usual sum signal, without recourse to the above-described TPP signal.
- the servo data is recorded using marks 10T to 14T.
- FIG. 20 depicts a typical circuit configuration for executing reproduction of data from a disk that stores record data including the record signal with a frequency band higher than the cut-off frequency.
- the drawing depicts a typical configuration of a reproduction circuit that reproduces, from the disk formed with staggered pattern carrier grooves explained above with reference to Subfigure (A) in FIG. 17 and FIG. 19 , the (1, 7) RLL-pp signal of which the high frequencies were cut off as explained above with reference to FIGS. 14 to 16 , for example.
- a disk 200 stores data including the record signal with a frequency band higher than the cut-off frequency. Specifically, this is a disk which has staggered pattern carrier grooves formed thereon and which stores, for example, the above-mentioned (1, 7) RLL-pp signal of which the high frequency range was cut off.
- a photo-detecting section 300 has two split detectors as explained above with reference to FIGS. 1 and 6 , among others.
- reflected light is received not only from one read target track but also from two adjacent tracks on both sides thereof.
- rectangles A and B constitute a light-receiving region that receives reflected light from the read target center track. Rectangles on both sides of the rectangles A and B make up a light-receiving region that receives reflected light from the adjacent tracks.
- an adaptive equalizer 301 performs the process of removing noise signals which are incident on the photo-detecting section 300 and which come from adjacent tracks.
- the signals from the read track and from two adjacent tracks are input to adaptive equalizer filters that perform an adaptive equalization process in reference to an ideal signal of the read target track.
- the process permits acquisition of the signal from the read target track.
- the ideal signal of the read target track is output from a PR target signal generating section 307.
- the output of the adaptive equalizer 301 constitutes a signal B from the read target track.
- an adaptive equalizer 302 also performs the process of removing noise signals which are incident on the photo-detecting section 300 and which come from the adjacent tracks in order to extract a detection signal detected by the detector A from the reflected light off the read target track.
- the specific process involved is similarly to that carried out by the adaptive equalizer 301.
- the signals from the read track and from the two adjacent tracks are input to adaptive equalizer filters that perform an adaptive equalization process in reference to an ideal signal of the read target track. The process permits acquisition of the signal from the read target track.
- the ideal signal of the read target track is output from the PR target signal generating section 307.
- the output of the adaptive equalizer 302 constitutes a signal A from the read target track.
- the signals A and B correspond to the signals (A, B) output from the optical pickup explained above with reference to FIGS. 1 and 6 .
- the output signals (A, B) of the adaptive equalizers 301 and 302 are input to a sum signal generating section (Sum) 303 and to a differential signal generating section (TPP) 304.
- the sum signal generating section (Sum) 303 generates a sum signal (A+B) of the output signals (A, B) from the adaptive equalizers 301 and 302.
- the differential signal generating section (TPP) 304 generates a differential signal (A-B) of the output signals (A, B) from the adaptive equalizers 301 and 302.
- the sum signal (A+B) generated by the sum signal generating section (Sum) 303 is input to an adaptive equalizer 305.
- the differential signal (A-B) generated by the differential signal generating section (TPP) 304 is input to a multiplier 311.
- the multiplier 311 performs the process of multiplying the differential signal (A-B) with the carrier signal [Sin(2nx/p)] generated by a carrier generating section 310.
- This process corresponds to the process of generating the TPP (after being shifted) in Subfigure (2) in FIG. 16 from the TPP signal in Subfigure (1) in FIG. 16 explained above with reference to FIG. 16 .
- the process is equivalent to bringing back to the initial frequency band the signal which is included in the TPP signal and which was frequency-shifted through multiplication of the carrier grooves with the recorded mark signal.
- the adaptive equalizer 305 receives input of the sum signal (A+B) generated by the sum signal generating section (Sum) 303 and the frequency-shifted TPP signal generated by the multiplier 311, as well as a target signal generated by a PRML (Partial Response Maximum Likelihood) decoder 306 and the PR target signal generating section 307. Based on these inputs, the adaptive equalizer 305 performs the process of removing noise components and outputs the resulting generated signal to the PRML decoder 306, to a PLL 309, and to a subtractor 308.
- PRML Partial Response Maximum Likelihood
- the PRML decoder 306 receives input of the sum signal (A+B) from the adaptive equalizer 305 and the frequency-shifted TPP signal. Given the inputs, the PRML decoder 306 generates the reproduced signal of maximum likelihood by the maximum likelihood decoding method.
- Viterbi decoding involves achieving maximum likelihood decoding of a convolutional code by repeating the simple processes of addition, comparison, and selection, followed by a trace-back operation for ultimate data decoding.
- Viterbi decoding every time coded data (received data sequence) corresponding to one information bit is obtained, the intersignal intervals (metric) of paths in diverse states at that point are calculated to find out the path of maximum likelihood.
- This decoding process causes the reproduced signal to be output.
- the reproduced signal includes frequency components ranging from low-frequency components lower than the cut-off frequency to high-frequency components higher than the cut-off frequency, as explained above with reference to Subfigure (4) in FIG. 16 , for example.
- the PRML decoder 306 receives input of a clock signal from the PLL 309 that generates the clock signal based on the output from the adaptive equalizer 305. Under control of the clock signal, the PRML decoder 306 generates and outputs the reproduced signal.
- the PLL 309 performs the process of generating the clock signal in accordance with a servo signal included in the output from the adaptive equalizer 305.
- the clock signal generated by the PLL 309 is also input to the carrier generating section 310.
- the carrier generating section 310 outputs the carrier signal [Sin(2nx/p)] to the multiplier 311 in time with reproduction of data from the recorded data area other than the servo area.
- the multiplier 311 Only when the record signal is reproduced from the recorded data area other than the servo area, does the multiplier 311 perform selectively the process of multiplication with the carrier signal [Sin(2 ⁇ x/p)].
- the reproduced signal generated by the PRML decoder 306 is also input to the PR target generating section 307.
- the PR target generating section 307 Based on the reproduced signal generated by the PRML decoder 306, the PR target generating section 307 generates a target signal of the subsequent reproduced signal and inputs the generated target signal to the subtractor 308.
- the subtractor calculates the difference between the target signal and the generated signal from the adaptive equalizer 305.
- the subtractor then feeds the difference regarding the target (error amount) back to the adaptive equalizers 301, 302, and 305.
- the adaptive equalizers 301, 302, and 305 receive input of the difference (error amount) and carry out an adaptive equalization process to generate an output signal.
- reproduction process in accordance with the circuit configuration depicted in FIG. 20 may be carried out, for example, under control of a reproduction processing program stored in a storage section of the reproduction apparatus (information processing apparatus).
- FIG. 21 depicts the results of evaluation of reproduced signals according to the types of carrier grooves formed on the disks.
- the graph in FIG. 21 depicts evaluation values with regard to data reproduction from the following six disk types:
- the horizontal axis denotes data recoding density (GBL: gigabyte linear density) on the disks, and the vertical axis represents e-MLSE (%) as the evaluation value for reproduced signals.
- the index i-MLSE has been known as the evaluation value for the reproduced signal.
- the MLSE Maximum Likelihood Sequence Error
- Calculating the index i-MLSE involves weighting a number of error-prone data patterns.
- the index e-MLSE adopted as the reproduction evaluation value represents the probability of error included in the reproduced signal. That is, when the value of e-MLSE is smaller, that means a satisfactorily reproduced signal is acquired at lower error rates.
- the high-density recording disks are ranked as follows:
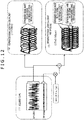
- the configuration depicted in FIG. 22 is another typical configuration of the reproduction circuit different from the configuration in FIG. 20 .
- the reproduction circuit depicted in FIG. 22 is configured to perform the process of reproducing data from the disk that stores data including the record signal with a frequency band higher than the cut-off frequency.
- this is another typical configuration of the reproduction circuit that reproduces the high-frequency-cut (1, 7) RLL-pp signal explained above with reference to FIG. 14 to 16 , the signal being recorded on the disk formed with staggered pattern carrier grooves discussed above with reference to Subfigure (A) in FIG. 17 and FIG. 19 , for example.
- the disk 200 stores data including the record signal with a frequency band higher than the cut-off frequency.
- this is a disk which has staggered pattern carrier grooves formed thereon and which stores, for example, the above-mentioned (1, 7) RLL-pp signal of which the high-frequency range was cut off.
- a photo-detecting section 320 has two split detectors as explained above with reference to FIGS. 1 and 6 , among others.
- reflected light is received not only from one read target track but also from two adjacent tracks on both sides thereof.
- rectangles A and B constitute a light-receiving region that receives reflected light from the read target center track. Rectangles on both sides of the rectangles A and B make up a light-receiving region that receives reflected light from the adjacent tracks.
- detection signals detected by the detectors A and B from the read track and detection signals detected by the detectors A and B from the two adjacent tracks are input individually to sum signal calculating sections 321 and differential signal calculating sections 322.
- the outputs from three sum signal calculating section 321 constitute the sum signal (A+B) of the detection signals detected by the detectors A and B from the read track, and a sum signal of the detection signals detected by the detectors A and B from the tracks adjacent to the read track.
- These outputs representing the three tracks are input to an adaptive equalizer (Sum) 325.
- the adaptive equalizer 325 performs the process of removing the sum signal which is incident on the photo-detecting section 300 and which corresponds to the adjacent tracks, i.e., the sum signal (An+Bn) made up of noise signals.
- the sum signal (A+B) from the read track and the noise sum signal (An+Bn) from the two adjacent tracks are input to adaptive equalizer filters that perform an adaptive equalization process in reference to an ideal signal of the read target track (ideal sum signal). The process permits acquisition of the sum signal (A+B) from the read target track.
- An ideal sum signal 331, which is the ideal signal of the read target track, is output from a PR target signal generating section 329.
- the output of the adaptive equalizer 325 constitutes the sum signal (A+B) from the read target track.
- an adaptive equalizer 326 performs the process of removing the differential signal which is incident on the photo-detecting section 300 and which corresponds to the adjacent tracks, i.e., the differential signal (An-Bn) made up of noise signals.
- the differential signal (A-B) from the read track and the noise differential signal (An-Bn) from the two adjacent tracks are input to adaptive equalizer filters to perform an adaptive equalization process in reference to an ideal signal of the read target track (i.e., ideal TPP signal). This process permits acquisition of the differential signal (A-B) from the read target track.
- An ideal TPP signal 332, which is the ideal signal of the read target track, is output from the PR target signal generating section 329.
- the output of the adaptive equalizer 326 constitutes the differential signal (A-B) from the read target track.
- the sum signal (A+B) generated by the adaptive equalizer 326 is input to an adaptive equalizer 327.
- the differential signal (A-B) generated by the adaptive equalizer 326 is input to a multiplier 335.
- the multiplier 335 performs the process of multiplying the differential signal (A-B) with the carrier signal [Sin(2nx/p)] generated by a carrier generating section 334.
- This process corresponds to the process of generating the TPP signal (after being shifted) in Subfigure (2) in FIG. 16 from the TPP signal in Subfigure (1) in FIG. 16 explained above with reference to FIG. 16 .
- this process is equivalent to bringing back to the initial frequency band the signal which is included in the TPP signal and which was frequency-shifted through multiplication of the carrier grooves with the recorded mark signal.
- the adaptive equalizer 327 receives input of the sum signal (A+B) generated by the adaptive equalizer 325 and the frequency-shifted TPP signal generated by the multiplier 335, as well as a target signal generated by a PRML (Partial Response Maximum Likelihood) decoder 328 and the PR target signal generating section 329. Based on these inputs, the adaptive equalizer 327 performs the process of removing noise components and outputs the resulting generated signal to the PRML decoder 328, to a PLL 333, and to a subtractor 360.
- PRML Partial Response Maximum Likelihood
- the PRML decoder 328 receives input of the sum signal (A+B) from the adaptive equalizer 327 and the frequency-shifted TPP signal. Given the inputs, the PRML decoder 328 generates the reproduced signal of maximum likelihood by the maximum likelihood decoding method.
- Viterbi decoding involves achieving maximum likelihood decoding of a convolutional code by repeating the simple processes of addition, comparison, and selection, followed by a trace-back operation for ultimate data decoding.
- Viterbi decoding every time coded data (received data sequence) corresponding to one information bit is obtained, the intersignal intervals (metric) of paths in diverse states at that point are calculated to find out the path of maximum likelihood.
- This decoding process causes the reproduced signal to be output.
- the reproduced signal includes frequency components ranging from low-frequency components lower than the cut-off frequency to high-frequency components higher than the cut-off frequency, as explained above with reference to Subfigure (4) in FIG. 16 , for example.
- the PRML decoder 328 receives input of a clock signal from the PLL 333 that generates the clock signal based on the output of the adaptive equalizer 327. Under control of the clock signal, the PRML decoder 328 generates and outputs the reproduced signal.
- the PLL 333 performs the process of generating the clock signal in accordance with a servo signal included in the output of the adaptive equalizer 327.
- the clock signal generated by the PLL 333 is also input to the carrier generating section 334.
- the carrier generating section 334 outputs the carrier signal [Sin(2nx/p)] to the multiplier 311 in time with reproduction of data from the recorded data area other than the servo area.
- the multiplier 335 Only when the record signal is reproduced from the recorded data area other than the servo area, does the multiplier 335 perform selectively the process of multiplication with the carrier signal [Sin(2 ⁇ x/p)].
- the reproduced signal generated by the PRML decoder 328 is also input to the PR target generating section 329.
- the PR target generating section 329 Based on the reproduced signal generated by the PRML decoder 328, the PR target generating section 329 generates a target signal of the subsequent reproduced signal.
- the target signal includes the ideal sum signal 331 and the ideal TPP signal 332.
- the ideal sum signal 331 is input to a subtractor 341.
- the ideal TPP signal 332 is input to a subtractor 342.
- an ideal reproduced signal including the ideal sum signal and the ideal TPP signal is input to a subtractor 330.
- the subtractor 341 calculates the difference between the ideal sum signal 331 and the signal generated by the adaptive equalizer 325. The subtractor 341 then feeds the difference regarding the target (error amount) back to the adaptive equalizer 325.
- the adaptive equalizer 325 receives input of the difference (error amount) and carries out an adaptive equalization process to generate and output an output signal (A+B).
- the subtractor 342 calculates the difference between the ideal TPP signal 332 and the signal generated by the adaptive equalizer 326. The subtractor 342 then feeds the difference regarding the target (error amount) back to the adaptive equalizer 326.
- the adaptive equalizer 326 receives input of the difference (error amount) and carries out an adaptive equalization process to generate and output an output signal (A-B).
- the subtractor 330 calculates the difference between the ideal reproduced signal and the signal generated by the adaptive equalizer 327. The subtractor 330 then feeds the difference regarding the target (error amount) back to the adaptive equalizer 327.
- the adaptive equalizer 327 receives input of the difference (error amount) and carries out an adaptive equalization process to generate and output a reproduced signal that constitutes the output signal.
- the sum signal and the differential signal are generated individually not only from the read track but also from the adjacent tracks.
- the adaptive equalization process is subsequently carried out to calculate the sum signal (A+B) and differential signal (A-B) regarding the read target track.
- reproduction process in accordance with the circuit configuration depicted in FIG. 22 may be carried out, for example, under control of a reproduction processing program stored in a storage section of the reproduction apparatus (information processing apparatus).
- FIG. 23 Another typical configuration of the reproduction circuit is depicted in FIG. 23 .
- the circuit depicted in FIG. 23 is configured approximately the same as the circuit depicted in FIG. 22 , except that the input to the PLL 333 that performs the process of clock generation is different from what is indicated in FIG. 22 .
- the PLL 333 receives input of the output from the adaptive equalizer 327 that generates the reproduced signal including the sum signal (addition signal) and the TPP signal (differential signal).
- the PLL 333 receives input of the output from the adaptive equalizer 325 that generates and outputs the sum signal (addition signal (A+B)).
- the PLL 333 is configured to generate the clock signal based on the record signal from the servo area recorded on the disk.
- the record signal from the servo area can be read using only the sum signal (addition signal (A+B)). That is, the high-frequency signal of which the frequencies exceed the cut-off frequency and which can be read using the TPP signal is not used.
- the signal input to the PLL 333 is not the output from the adaptive equalizer 327 that generates the reproduced signal including the TPP signal but the output from the adaptive equalizer 325 that outputs only the sum signal (addition signal (A+B)). This still allows the PLL 333 to generate the clock signal correctly.
- reproduction process in accordance with the circuit configuration depicted in FIG. 23 may also be carried out, for example, under control of a reproduction processing program stored in a storage section of the reproduction apparatus (information processing apparatus).
- the series of the processes described in the description may be executed by hardware, by software, or by the combination of both.
- the programs constituting processing sequences may be either installed into an internal memory of a computer in dedicated hardware for program execution, or installed into a general-purpose computer capable of performing diverse processes for execution of the programs.
- the programs may be recorded beforehand on recording media, for example.
- the programs may be installed into the computer from such recording media or received through networks such as a LAN (Local Area Network) or the Internet before being installed onto internal recording media such as hard disks.
- LAN Local Area Network
- system refers to a group of logically configured devices. The devices in such a configuration may or may not be housed in a single enclosure.
- an optical disk from which high-density data is reproduced as well as a reproduction apparatus that reproduces data from such an optical disk having high-density data recorded thereon.
- a photo-detecting section having two split detectors A and B in the track direction of the disk and a signal processing section are provided.
- the signal processing section generates a TPP (Tangential Push-pull) signal as a differential signal derived from detection signals of the detectors A and B.
- TPP Transmission Push-pull
- the signal processing section extracts by calculation a high-frequency component signal from a record signal recorded on the disk to generate a reproduced signal.
- the disk is structured to have the record signal recorded on a carrier signal over the disk formed with a protruding and recessed pattern of high frequencies higher than or equal to a cut-off frequency.
- the signal processing section multiplies by the carrier signal the TPP signal read from the disk as a frequency-shifted signal having the carrier signal and the record signal superimposed thereon. In so doing, the signal processing section shifts the TPP signal to frequencies in the high-frequency range to extract the high-frequency component signal from the record signal on the disk.
- These structures are used to implement an optical disk from which high-density data is reproduced as well as a reproduction apparatus that reproduces data from an optical disk having high-density data recorded thereon.
Landscapes
- Engineering & Computer Science (AREA)
- Signal Processing (AREA)
- Physics & Mathematics (AREA)
- Probability & Statistics with Applications (AREA)
- Optical Recording Or Reproduction (AREA)
- Optical Record Carriers And Manufacture Thereof (AREA)
- Signal Processing For Digital Recording And Reproducing (AREA)
Claims (9)
- Appareil de traitement d'informations comprenant :une section de photo-détection (112) conçue pour recevoir de la lumière réfléchie d'un disque (100) ; etune section de traitement de signal (113) conçue pour générer un signal reproduit par un traitement de signal effectué sur un signal de réception de lumière provenant de la section de photo-détection (112),le disque (100) comprenant :un signal de porteuse formé par des rainures de porteuse ménagées selon un motif de saillies et d'évidements régulièrement périodique formé à l'avance sur le disque (100), ledit motif ayant une haute fréquence supérieure ou égale à une fréquence de coupure qui est définie par Fc = 2NA/λ, λ étant la longueur d'onde du faisceau laser provenant du capteur optique (110) et NA étant l'ouverture numérique des lentilles formant le capteur optique (110) ; etun signal d'enregistrement qui est enregistré par formation de marques sur ledit motif de saillies et d'évidements régulièrement périodique,la section de photo-détection (112) comportant deux détecteurs divisés A et B dans une direction de pistes sur le disque (100),la section de traitement de signal (113) générant un signal TPP (Tangential Push-Pull) comprenant un signal différentiel dérivé de signaux de détection des détecteurs A et B, le signal TPP étant obtenu sous forme de signal de lecture par décalage fréquentiel d'un signal superposé comportant le signal de porteuse et le signal d'enregistrement superposés l'un à l'autre, etla section de traitement de signal (113) générant le signal reproduit par extraction d'une gamme de composantes à haute fréquence du signal d'enregistrement enregistré sur le disque (100) par une opération de décalage fréquentiel du signal TPP généré vers la gamme de composantes à haute fréquence du signal d'enregistrement enregistré sur le disque (100),l'opération étant un processus de multiplication du signal TPP par le signal de porteuse,la section de traitement de signal (113) exécutant le processus de multiplication du signal TPP par le signal de porteuse afin de décaler en fréquence le signal TPP vers la gamme de composantes à haute fréquence dans le signal d'enregistrement enregistré sur le disque (100), etla section de traitement de signal (113) générant le signal reproduit par un processus de combinaison d'un signal de somme sommant les signaux de détection provenant des détecteurs A et B avec le signal TPP duquel la composante du signal de porteuse est supprimée de manière à correspondre au signal d'enregistrement.
- Appareil de traitement d'informations selon l'une quelconque des revendications précédentes,
sur la base du signal de somme la section de traitement de signal (113) générant le signal reproduit comprenant principalement une composante fréquentielle inférieure ou égale à la fréquence de coupure et,
sur la base du signal TPP la section de traitement de signal (113) générant le signal reproduit comprenant principalement une composante fréquentielle supérieure ou égale à la fréquence de coupure. - Appareil de traitement d'informations selon l'une quelconque des revendications précédentes, le motif de saillies et d'évidements, qui comprend les rainures de porteuse, étant disposé en quinconce entre des pistes adjacentes.
- Appareil de traitement d'informations selon la revendication 1 ou 2, le motif de saillies et d'évidements, qui comprend les rainures de porteuse, étant disposé de manière rayonnante et aligné entre des pistes adjacentes.
- Appareil de traitement d'informations selon l'une quelconque des revendications précédentes,
le disque (100) étant structuré de manière à comporter une zone d'enregistrement dans laquelle le signal d'enregistrement est enregistré et une zone d'asservissement dans laquelle un signal d'asservissement est enregistré, la zone d'enregistrement et la zone d'asservissement étant disposées alternativement sur le disque (100), et
la section de traitement de signal (113) générant un signal d'horloge sur la base du signal d'asservissement pour effectuer une commande de synchronisation sur le processus de génération du signal reproduit. - Appareil de traitement d'informations selon l'une quelconque des revendications précédentes,
la section de traitement de signal (113) comportant un égaliseur adaptatif destiné à supprimer des signaux provenant de pistes adjacentes provenant du signal de réception de lumière venant de la section de photo-détection. - Appareil de traitement d'informations selon l'une quelconque des revendications précédentes, la section de traitement de signal (113) effectuant un processus de décodage à maximum de vraisemblance conformément à un procédé PRML (Partial Response Maximum Likelihood).
- Procédé de traitement d'informations destiné à être exécuté par un appareil de traitement d'informations comprenant
une section de photo-détection (112) conçue pour recevoir de la lumière réfléchie d'un disque (100), et
une section de traitement de signal (113) conçue pour générer un signal reproduit par un traitement de signal effectué sur un signal de réception de lumière provenant de la section de photo-détection (112),
le disque (100) comprenant :un signal de porteuse formé par des rainures de porteuse selon un motif de saillie et d'évidement régulièrement périodique formé à l'avance sur le disque (100), ledit motif ayant une haute fréquence supérieure ou égale à une fréquence de coupure qui est définie par Fc = 2NA/λ, λ étant la longueur d'onde du faisceau laser provenant du capteur optique (110) et NA étant l'ouverture numérique des lentilles formant le capteur optique (110) ; etun signal d'enregistrement qui est enregistré par formation de marques sur ledit motif de saillies et d'évidements régulièrement périodique, la section de photo-détection (112) comportant deux détecteurs divisés A et B dans une direction de pistes sur le disque (100),le procédé de traitement d'informations comprenant les étapes suivantes :amener la section de traitement de signal (113) à générer un signal TPP (Tangential Push-Pull) comprenant un signal différentiel dérivé de signaux de détection provenant des détecteurs A et B, le signal TPP étant obtenu sous forme de signal de lecture par décalage fréquentiel d'un signal superposé comportant le signal de porteuse et le signal d'enregistrement superposés l'un à l'autre ; etamener la section de traitement de signal à générer le signal reproduit par extraction d'une gamme de composantes à haute fréquence du signal d'enregistrement enregistré sur le disque (100) par une opération de décalage fréquentiel du signal TPP généré vers la gamme de composantes à haute fréquence dans le signal d'enregistrement enregistré sur le disque (100),l'opération étant un processus de multiplication du signal TPP par le signal de porteuse,
la section de traitement de signal (113) exécutant le processus de multiplication du signal TPP par le signal de porteuse afin de décaler en fréquence le signal TPP vers la gamme de composantes à haute fréquence dans le signal d'enregistrement enregistré sur le disque (100), et
la section de traitement de signal (113) générant le signal reproduit par un processus de combinaison d'un signal de somme sommant les signaux de détection provenant des détecteurs A et B, avec le signal TPP duquel la composante du signal de porteuse est supprimée de manière à correspondre au signal d'enregistrement. - Programme destiné à amener un appareil de traitement d'informations à effectuer un traitement d'informations, l'appareil de traitement d'informations incluant
une section de photo-détection (112) conçue pour recevoir de la lumière réfléchie provenant d'un disque (100), et
une section de traitement de signal (113) conçue pour générer un signal reproduit par un traitement de signal effectué sur un signal de réception de lumière provenant de la section de photo-détection (112),
le disque (100) comprend :un signal de porteuse formé par des rainures de porteuse selon un motif de saillies et d'évidements régulièrement périodique formé à l'avance sur le disque (100), ledit motif ayant une haute fréquence supérieure ou égale à une fréquence de coupure qui est définie par Fc = 2NA/λ, λ étant la longueur d'onde du faisceau laser provenant du capteur optique (110) et NA étant l'ouverture numérique des lentilles formant le capteur optique (110) ; etun signal d'enregistrement qui est enregistré par formation de marques sur ledit motif de saillies et d'évidements régulièrement périodique,la section de photo-détection comportant deux détecteurs divisés A et B dans une direction de pistes sur le disque (100),
le programme exécutant une procédure comprenant les étapes suivantes :amener la section de traitement de signal (113) à générer un signal TPP (Tangential Push-Pull) comprenant un signal différentiel dérivé de signaux de détection provenant des détecteurs A et B, le signal TPP étant obtenu sous forme de signal de lecture par décalage fréquentiel d'un signal superposé comportant le signal de porteuse et le signal d'enregistrement superposés l'un à l'autre ; etamener la section de traitement de signal (113) à générer le signal reproduit par extraction d'une gamme de composantes à haute fréquence du signal d'enregistrement enregistré sur le disque (100) par une opération de décalage fréquentiel du signal TPP généré vers la plage de composante à haute fréquence du signal d'enregistrement enregistré sur le disque (100),l'opération étant un processus de multiplication du signal TPP par le signal de porteuse,la section de traitement de signal (113) exécutant le processus de multiplication du signal TPP par le signal de porteuse afin de décaler en fréquence le signal TPP vers la gamme de composantes à haute fréquence dans le signal d'enregistrement enregistré sur le disque (100), etla section de traitement de signal (113) générant le signal reproduit par un processus de combinaison d'un signal de somme sommant les signaux de détection provenant des détecteurs A et B, avec le signal TPP duquel la composante du signal de porteuse est supprimée de manière à correspondre au signal d'enregistrement.
Applications Claiming Priority (2)
| Application Number | Priority Date | Filing Date | Title |
|---|---|---|---|
| JP2015235804 | 2015-12-02 | ||
| PCT/JP2016/084407 WO2017094541A1 (fr) | 2015-12-02 | 2016-11-21 | Dispositif de traitement d'informations, disque optique, procédé de traitement d'informations, et programme |
Publications (3)
| Publication Number | Publication Date |
|---|---|
| EP3385952A1 EP3385952A1 (fr) | 2018-10-10 |
| EP3385952A4 EP3385952A4 (fr) | 2018-12-12 |
| EP3385952B1 true EP3385952B1 (fr) | 2020-08-26 |
Family
ID=58797237
Family Applications (1)
| Application Number | Title | Priority Date | Filing Date |
|---|---|---|---|
| EP16870478.1A Active EP3385952B1 (fr) | 2015-12-02 | 2016-11-21 | Dispositif de traitement d'informations, procédé de traitement d'informations, et programme |
Country Status (5)
| Country | Link |
|---|---|
| US (1) | US10410667B2 (fr) |
| EP (1) | EP3385952B1 (fr) |
| JP (1) | JP6868777B2 (fr) |
| CN (1) | CN108369814B (fr) |
| WO (1) | WO2017094541A1 (fr) |
Family Cites Families (26)
| Publication number | Priority date | Publication date | Assignee | Title |
|---|---|---|---|---|
| JP2910084B2 (ja) | 1989-09-06 | 1999-06-23 | ソニー株式会社 | 光磁気記録媒体における信号再生方法 |
| JP2762629B2 (ja) * | 1989-11-21 | 1998-06-04 | ソニー株式会社 | 記録媒体及び該記録媒体の再生装置 |
| CA2108457A1 (fr) * | 1992-02-14 | 1993-08-15 | Seiji Kobayashi | Support d'enregistrement d'informations et appareils d'enregistrement, de lecture et d'enregistrement-lecture |
| US5638354A (en) * | 1993-07-16 | 1997-06-10 | Ricoh Company, Ltd. | Optical information recording medium |
| JPH087495A (ja) * | 1994-06-27 | 1996-01-12 | Hitachi Ltd | データ記録再生装置および媒体 |
| JPH1031869A (ja) * | 1996-07-16 | 1998-02-03 | Pioneer Electron Corp | 再生装置 |
| JPH1116216A (ja) * | 1997-06-19 | 1999-01-22 | Sony Corp | 光ディスク及び光ディスク装置 |
| US7701836B2 (en) * | 2001-11-27 | 2010-04-20 | Hewlett-Packard Development Company, L.P. | Re-writable optical disk having reference clock information permanently formed on the disk |
| JP3841798B2 (ja) * | 1999-06-30 | 2006-11-01 | シャープ株式会社 | 光ディスクおよび光ディスク装置 |
| KR20010007585A (ko) * | 1999-06-30 | 2001-01-26 | 마찌다 가쯔히꼬 | 상이한 깊이로 피트들이 형성되어 있는 광 디스크, 이 광디스크를 재생하기 위한 광 디스크 디바이스, 및 재생 방법 |
| JP2001084596A (ja) * | 1999-09-10 | 2001-03-30 | Matsushita Electric Ind Co Ltd | 光ディスクおよび光ディスク装置 |
| JP3658252B2 (ja) * | 1999-10-01 | 2005-06-08 | シャープ株式会社 | 光ディスク記録再生装置 |
| JP4206620B2 (ja) * | 2000-07-31 | 2009-01-14 | 日本ビクター株式会社 | 光情報記録媒体およびその記録再生装置 |
| US20030147338A1 (en) * | 2000-09-27 | 2003-08-07 | Akira Yoshikawa | Optical disk |
| JP2004194108A (ja) * | 2002-12-12 | 2004-07-08 | Sony Corp | 情報処理装置および情報処理方法、記録媒体、並びにプログラム |
| WO2004092312A1 (fr) * | 2003-03-24 | 2004-10-28 | Sanyo Chemical Industries Ltd. | Lubrifiant pour huile de travail sur metaux miscible avec l'eau |
| JP2005222597A (ja) * | 2004-02-05 | 2005-08-18 | Sony Corp | 再生装置及び再生方法 |
| JP2006120243A (ja) * | 2004-10-21 | 2006-05-11 | Tdk Corp | 光ヘッドの焦点ズレ誤差信号検出方法及びそれを用いた光記録再生装置 |
| JP2006146979A (ja) * | 2004-11-16 | 2006-06-08 | Tdk Corp | 光ヘッドの焦点ズレ誤差信号検出方法及びそれを用いた光ヘッド並びに光記録再生装置 |
| EP1964116A2 (fr) * | 2005-12-13 | 2008-09-03 | Koninklijke Philips Electronics N.V. | Procede de positionnement d une lentille pour realiser une compensation d inclinaison, procede et appareil de lecture et d enregistrement de donnees sur un disque optique |
| JP4961922B2 (ja) * | 2006-09-14 | 2012-06-27 | ソニー株式会社 | 光ディスク装置及び焦点位置制御方法 |
| JP4419098B2 (ja) * | 2006-09-14 | 2010-02-24 | ソニー株式会社 | 光ディスク装置及び焦点位置制御方法 |
| JP4500949B2 (ja) * | 2007-05-11 | 2010-07-14 | 独立行政法人産業技術総合研究所 | 光ディスクの信号処理方法及び装置 |
| JP5539905B2 (ja) * | 2008-03-07 | 2014-07-02 | トムソン ライセンシング | マルチレベルデータ層を含む光記憶媒体 |
| JP2012243363A (ja) * | 2011-05-20 | 2012-12-10 | Sony Corp | 再生方法、再生装置 |
| WO2014054246A1 (fr) * | 2012-10-05 | 2014-04-10 | パナソニック株式会社 | Dispositif de lecture d'informations et procédé de lecture d'informations |
-
2016
- 2016-11-21 JP JP2017553779A patent/JP6868777B2/ja active Active
- 2016-11-21 WO PCT/JP2016/084407 patent/WO2017094541A1/fr active Application Filing
- 2016-11-21 EP EP16870478.1A patent/EP3385952B1/fr active Active
- 2016-11-21 US US15/766,696 patent/US10410667B2/en active Active
- 2016-11-21 CN CN201680069089.4A patent/CN108369814B/zh active Active
Non-Patent Citations (1)
| Title |
|---|
| None * |
Also Published As
| Publication number | Publication date |
|---|---|
| CN108369814A (zh) | 2018-08-03 |
| WO2017094541A1 (fr) | 2017-06-08 |
| EP3385952A1 (fr) | 2018-10-10 |
| US10410667B2 (en) | 2019-09-10 |
| US20180286454A1 (en) | 2018-10-04 |
| JPWO2017094541A1 (ja) | 2018-09-20 |
| JP6868777B2 (ja) | 2021-05-12 |
| EP3385952A4 (fr) | 2018-12-12 |
| CN108369814B (zh) | 2020-07-17 |
Similar Documents
| Publication | Publication Date | Title |
|---|---|---|
| JP4156595B2 (ja) | 周波数制御装置、周波数制御方法、制御プログラム、情報再生装置および情報再生方法 | |
| JP2004213862A (ja) | 光ディスク及び光ディスク記録再生装置および光ディスクの信号品質評価方法 | |
| KR20100134542A (ko) | 기록 제어 장치, 기록 및 재생 장치, 및 기록 제어 방법 | |
| JP2004327013A (ja) | 光ディスク媒体および光ディスク装置 | |
| JP3857685B2 (ja) | 信号評価方法と情報記録再生装置と情報再生装置及び情報媒体 | |
| JP3760961B2 (ja) | 変調装置および変調方法、復調装置および復調方法、並びに記録媒体 | |
| US20080151726A1 (en) | Optical disc recording and reproducing apparatus and optical disc recording and reproducing method | |
| JP2006352867A (ja) | 位相同期ループ回路での周波数検出器及び周波数エラーの検出方法 | |
| JP4701240B2 (ja) | 光ストレージシステム向けのdc制御符号化 | |
| EP3385952B1 (fr) | Dispositif de traitement d'informations, procédé de traitement d'informations, et programme | |
| JP2002298518A (ja) | フルレスポンスチャネルシステムに用いられるデータエラー訂正方法 | |
| KR100556004B1 (ko) | 재생 신호 처리 장치 및 광 디스크 장치 | |
| JPWO2009041598A1 (ja) | 信号品質評価装置、方法、及び、情報記録再生装置 | |
| JP3539091B2 (ja) | データ復号方法及びデータ復号装置 | |
| JP2008287763A (ja) | ビタビ検出器、及び、情報再生装置 | |
| US20110304936A1 (en) | Data demodulating device, data demodulating method, and program | |
| JP4697096B2 (ja) | 光ディスク装置 | |
| JP2007109349A (ja) | ディジタル情報記録再生装置およびディジタルフェーズロックドループ回路 | |
| KR20050088423A (ko) | 분할 포토 검출기를 갖는 비트 검출기 | |
| JP4383270B2 (ja) | 再生信号評価装置、再生信号評価方法および再生信号評価用コンピュータプログラム | |
| KR100664006B1 (ko) | 디지털 신호 처리 장치 및 방법 | |
| WO2010113231A1 (fr) | Appareil de lecture de disque optique | |
| Conway | A partial response read channel for two dimensional optical data storage | |
| JP2007534103A (ja) | セカンダリチャネルのセカンダリ情報をプライマリチャネルのチャネルデータストリームに符号化する装置及び方法 | |
| KR20060017782A (ko) | 다차원 기록 시스템을 위한 순회 스트라이프 방식 트렐리스기반 심볼 검출 방법 및 장치 |
Legal Events
| Date | Code | Title | Description |
|---|---|---|---|
| STAA | Information on the status of an ep patent application or granted ep patent |
Free format text: STATUS: THE INTERNATIONAL PUBLICATION HAS BEEN MADE |
|
| PUAI | Public reference made under article 153(3) epc to a published international application that has entered the european phase |
Free format text: ORIGINAL CODE: 0009012 |
|
| STAA | Information on the status of an ep patent application or granted ep patent |
Free format text: STATUS: REQUEST FOR EXAMINATION WAS MADE |
|
| 17P | Request for examination filed |
Effective date: 20180525 |
|
| AK | Designated contracting states |
Kind code of ref document: A1 Designated state(s): AL AT BE BG CH CY CZ DE DK EE ES FI FR GB GR HR HU IE IS IT LI LT LU LV MC MK MT NL NO PL PT RO RS SE SI SK SM TR |
|
| AX | Request for extension of the european patent |
Extension state: BA ME |
|
| A4 | Supplementary search report drawn up and despatched |
Effective date: 20181114 |
|
| RIC1 | Information provided on ipc code assigned before grant |
Ipc: G11B 7/24073 20130101ALI20181108BHEP Ipc: G11B 7/007 20060101ALI20181108BHEP Ipc: G11B 7/005 20060101AFI20181108BHEP Ipc: G11B 20/10 20060101ALI20181108BHEP Ipc: G11B 20/18 20060101ALI20181108BHEP |
|
| DAV | Request for validation of the european patent (deleted) | ||
| DAX | Request for extension of the european patent (deleted) | ||
| GRAP | Despatch of communication of intention to grant a patent |
Free format text: ORIGINAL CODE: EPIDOSNIGR1 |
|
| STAA | Information on the status of an ep patent application or granted ep patent |
Free format text: STATUS: GRANT OF PATENT IS INTENDED |
|
| INTG | Intention to grant announced |
Effective date: 20200326 |
|
| GRAS | Grant fee paid |
Free format text: ORIGINAL CODE: EPIDOSNIGR3 |
|
| GRAA | (expected) grant |
Free format text: ORIGINAL CODE: 0009210 |
|
| STAA | Information on the status of an ep patent application or granted ep patent |
Free format text: STATUS: THE PATENT HAS BEEN GRANTED |
|
| AK | Designated contracting states |
Kind code of ref document: B1 Designated state(s): AL AT BE BG CH CY CZ DE DK EE ES FI FR GB GR HR HU IE IS IT LI LT LU LV MC MK MT NL NO PL PT RO RS SE SI SK SM TR |
|
| REG | Reference to a national code |
Ref country code: GB Ref legal event code: FG4D |
|
| REG | Reference to a national code |
Ref country code: CH Ref legal event code: EP |
|
| REG | Reference to a national code |
Ref country code: AT Ref legal event code: REF Ref document number: 1307133 Country of ref document: AT Kind code of ref document: T Effective date: 20200915 |
|
| REG | Reference to a national code |
Ref country code: IE Ref legal event code: FG4D |
|
| REG | Reference to a national code |
Ref country code: DE Ref legal event code: R096 Ref document number: 602016042960 Country of ref document: DE |
|
| REG | Reference to a national code |
Ref country code: NL Ref legal event code: FP |
|
| REG | Reference to a national code |
Ref country code: LT Ref legal event code: MG4D |
|
| PG25 | Lapsed in a contracting state [announced via postgrant information from national office to epo] |
Ref country code: PT Free format text: LAPSE BECAUSE OF FAILURE TO SUBMIT A TRANSLATION OF THE DESCRIPTION OR TO PAY THE FEE WITHIN THE PRESCRIBED TIME-LIMIT Effective date: 20201228 Ref country code: GR Free format text: LAPSE BECAUSE OF FAILURE TO SUBMIT A TRANSLATION OF THE DESCRIPTION OR TO PAY THE FEE WITHIN THE PRESCRIBED TIME-LIMIT Effective date: 20201127 Ref country code: SE Free format text: LAPSE BECAUSE OF FAILURE TO SUBMIT A TRANSLATION OF THE DESCRIPTION OR TO PAY THE FEE WITHIN THE PRESCRIBED TIME-LIMIT Effective date: 20200826 Ref country code: HR Free format text: LAPSE BECAUSE OF FAILURE TO SUBMIT A TRANSLATION OF THE DESCRIPTION OR TO PAY THE FEE WITHIN THE PRESCRIBED TIME-LIMIT Effective date: 20200826 Ref country code: LT Free format text: LAPSE BECAUSE OF FAILURE TO SUBMIT A TRANSLATION OF THE DESCRIPTION OR TO PAY THE FEE WITHIN THE PRESCRIBED TIME-LIMIT Effective date: 20200826 Ref country code: FI Free format text: LAPSE BECAUSE OF FAILURE TO SUBMIT A TRANSLATION OF THE DESCRIPTION OR TO PAY THE FEE WITHIN THE PRESCRIBED TIME-LIMIT Effective date: 20200826 Ref country code: BG Free format text: LAPSE BECAUSE OF FAILURE TO SUBMIT A TRANSLATION OF THE DESCRIPTION OR TO PAY THE FEE WITHIN THE PRESCRIBED TIME-LIMIT Effective date: 20201126 Ref country code: NO Free format text: LAPSE BECAUSE OF FAILURE TO SUBMIT A TRANSLATION OF THE DESCRIPTION OR TO PAY THE FEE WITHIN THE PRESCRIBED TIME-LIMIT Effective date: 20201126 |
|
| REG | Reference to a national code |
Ref country code: AT Ref legal event code: MK05 Ref document number: 1307133 Country of ref document: AT Kind code of ref document: T Effective date: 20200826 |
|
| PG25 | Lapsed in a contracting state [announced via postgrant information from national office to epo] |
Ref country code: PL Free format text: LAPSE BECAUSE OF FAILURE TO SUBMIT A TRANSLATION OF THE DESCRIPTION OR TO PAY THE FEE WITHIN THE PRESCRIBED TIME-LIMIT Effective date: 20200826 Ref country code: RS Free format text: LAPSE BECAUSE OF FAILURE TO SUBMIT A TRANSLATION OF THE DESCRIPTION OR TO PAY THE FEE WITHIN THE PRESCRIBED TIME-LIMIT Effective date: 20200826 Ref country code: LV Free format text: LAPSE BECAUSE OF FAILURE TO SUBMIT A TRANSLATION OF THE DESCRIPTION OR TO PAY THE FEE WITHIN THE PRESCRIBED TIME-LIMIT Effective date: 20200826 Ref country code: IS Free format text: LAPSE BECAUSE OF FAILURE TO SUBMIT A TRANSLATION OF THE DESCRIPTION OR TO PAY THE FEE WITHIN THE PRESCRIBED TIME-LIMIT Effective date: 20201226 |
|
| PG25 | Lapsed in a contracting state [announced via postgrant information from national office to epo] |
Ref country code: RO Free format text: LAPSE BECAUSE OF FAILURE TO SUBMIT A TRANSLATION OF THE DESCRIPTION OR TO PAY THE FEE WITHIN THE PRESCRIBED TIME-LIMIT Effective date: 20200826 Ref country code: DK Free format text: LAPSE BECAUSE OF FAILURE TO SUBMIT A TRANSLATION OF THE DESCRIPTION OR TO PAY THE FEE WITHIN THE PRESCRIBED TIME-LIMIT Effective date: 20200826 Ref country code: CZ Free format text: LAPSE BECAUSE OF FAILURE TO SUBMIT A TRANSLATION OF THE DESCRIPTION OR TO PAY THE FEE WITHIN THE PRESCRIBED TIME-LIMIT Effective date: 20200826 Ref country code: EE Free format text: LAPSE BECAUSE OF FAILURE TO SUBMIT A TRANSLATION OF THE DESCRIPTION OR TO PAY THE FEE WITHIN THE PRESCRIBED TIME-LIMIT Effective date: 20200826 Ref country code: SM Free format text: LAPSE BECAUSE OF FAILURE TO SUBMIT A TRANSLATION OF THE DESCRIPTION OR TO PAY THE FEE WITHIN THE PRESCRIBED TIME-LIMIT Effective date: 20200826 |
|
| REG | Reference to a national code |
Ref country code: DE Ref legal event code: R097 Ref document number: 602016042960 Country of ref document: DE |
|
| PG25 | Lapsed in a contracting state [announced via postgrant information from national office to epo] |
Ref country code: ES Free format text: LAPSE BECAUSE OF FAILURE TO SUBMIT A TRANSLATION OF THE DESCRIPTION OR TO PAY THE FEE WITHIN THE PRESCRIBED TIME-LIMIT Effective date: 20200826 Ref country code: AT Free format text: LAPSE BECAUSE OF FAILURE TO SUBMIT A TRANSLATION OF THE DESCRIPTION OR TO PAY THE FEE WITHIN THE PRESCRIBED TIME-LIMIT Effective date: 20200826 Ref country code: AL Free format text: LAPSE BECAUSE OF FAILURE TO SUBMIT A TRANSLATION OF THE DESCRIPTION OR TO PAY THE FEE WITHIN THE PRESCRIBED TIME-LIMIT Effective date: 20200826 |
|
| PG25 | Lapsed in a contracting state [announced via postgrant information from national office to epo] |
Ref country code: MC Free format text: LAPSE BECAUSE OF FAILURE TO SUBMIT A TRANSLATION OF THE DESCRIPTION OR TO PAY THE FEE WITHIN THE PRESCRIBED TIME-LIMIT Effective date: 20200826 Ref country code: SK Free format text: LAPSE BECAUSE OF FAILURE TO SUBMIT A TRANSLATION OF THE DESCRIPTION OR TO PAY THE FEE WITHIN THE PRESCRIBED TIME-LIMIT Effective date: 20200826 |
|
| REG | Reference to a national code |
Ref country code: CH Ref legal event code: PL |
|
| PLBE | No opposition filed within time limit |
Free format text: ORIGINAL CODE: 0009261 |
|
| STAA | Information on the status of an ep patent application or granted ep patent |
Free format text: STATUS: NO OPPOSITION FILED WITHIN TIME LIMIT |
|
| GBPC | Gb: european patent ceased through non-payment of renewal fee |
Effective date: 20201126 |
|
| RAP4 | Party data changed (patent owner data changed or rights of a patent transferred) |
Owner name: SONY GROUP CORPORATION |
|
| PG25 | Lapsed in a contracting state [announced via postgrant information from national office to epo] |
Ref country code: IT Free format text: LAPSE BECAUSE OF FAILURE TO SUBMIT A TRANSLATION OF THE DESCRIPTION OR TO PAY THE FEE WITHIN THE PRESCRIBED TIME-LIMIT Effective date: 20200826 Ref country code: LU Free format text: LAPSE BECAUSE OF NON-PAYMENT OF DUE FEES Effective date: 20201121 |
|
| 26N | No opposition filed |
Effective date: 20210527 |
|
| REG | Reference to a national code |
Ref country code: BE Ref legal event code: MM Effective date: 20201130 |
|
| PG25 | Lapsed in a contracting state [announced via postgrant information from national office to epo] |
Ref country code: CH Free format text: LAPSE BECAUSE OF NON-PAYMENT OF DUE FEES Effective date: 20201130 Ref country code: SI Free format text: LAPSE BECAUSE OF FAILURE TO SUBMIT A TRANSLATION OF THE DESCRIPTION OR TO PAY THE FEE WITHIN THE PRESCRIBED TIME-LIMIT Effective date: 20200826 Ref country code: LI Free format text: LAPSE BECAUSE OF NON-PAYMENT OF DUE FEES Effective date: 20201130 |
|
| PG25 | Lapsed in a contracting state [announced via postgrant information from national office to epo] |
Ref country code: IE Free format text: LAPSE BECAUSE OF NON-PAYMENT OF DUE FEES Effective date: 20201121 Ref country code: FR Free format text: LAPSE BECAUSE OF NON-PAYMENT OF DUE FEES Effective date: 20201130 |
|
| PG25 | Lapsed in a contracting state [announced via postgrant information from national office to epo] |
Ref country code: GB Free format text: LAPSE BECAUSE OF NON-PAYMENT OF DUE FEES Effective date: 20201126 |
|
| PG25 | Lapsed in a contracting state [announced via postgrant information from national office to epo] |
Ref country code: IS Free format text: LAPSE BECAUSE OF FAILURE TO SUBMIT A TRANSLATION OF THE DESCRIPTION OR TO PAY THE FEE WITHIN THE PRESCRIBED TIME-LIMIT Effective date: 20201226 Ref country code: TR Free format text: LAPSE BECAUSE OF FAILURE TO SUBMIT A TRANSLATION OF THE DESCRIPTION OR TO PAY THE FEE WITHIN THE PRESCRIBED TIME-LIMIT Effective date: 20200826 Ref country code: MT Free format text: LAPSE BECAUSE OF FAILURE TO SUBMIT A TRANSLATION OF THE DESCRIPTION OR TO PAY THE FEE WITHIN THE PRESCRIBED TIME-LIMIT Effective date: 20200826 Ref country code: CY Free format text: LAPSE BECAUSE OF FAILURE TO SUBMIT A TRANSLATION OF THE DESCRIPTION OR TO PAY THE FEE WITHIN THE PRESCRIBED TIME-LIMIT Effective date: 20200826 |
|
| PG25 | Lapsed in a contracting state [announced via postgrant information from national office to epo] |
Ref country code: MK Free format text: LAPSE BECAUSE OF FAILURE TO SUBMIT A TRANSLATION OF THE DESCRIPTION OR TO PAY THE FEE WITHIN THE PRESCRIBED TIME-LIMIT Effective date: 20200826 |
|
| PG25 | Lapsed in a contracting state [announced via postgrant information from national office to epo] |
Ref country code: BE Free format text: LAPSE BECAUSE OF NON-PAYMENT OF DUE FEES Effective date: 20201130 |
|
| PGFP | Annual fee paid to national office [announced via postgrant information from national office to epo] |
Ref country code: NL Payment date: 20221020 Year of fee payment: 7 |
|
| PGFP | Annual fee paid to national office [announced via postgrant information from national office to epo] |
Ref country code: DE Payment date: 20220616 Year of fee payment: 7 |
|
| P01 | Opt-out of the competence of the unified patent court (upc) registered |
Effective date: 20230527 |