EP2746748B1 - Dispositif d'analyse photométrique par détection de particules électroluminescentes individuelles, procédé et programme d'ordinateur afférents - Google Patents
Dispositif d'analyse photométrique par détection de particules électroluminescentes individuelles, procédé et programme d'ordinateur afférents Download PDFInfo
- Publication number
- EP2746748B1 EP2746748B1 EP12823870.6A EP12823870A EP2746748B1 EP 2746748 B1 EP2746748 B1 EP 2746748B1 EP 12823870 A EP12823870 A EP 12823870A EP 2746748 B1 EP2746748 B1 EP 2746748B1
- Authority
- EP
- European Patent Office
- Prior art keywords
- light
- detection region
- moving
- route
- light detection
- Prior art date
- Legal status (The legal status is an assumption and is not a legal conclusion. Google has not performed a legal analysis and makes no representation as to the accuracy of the status listed.)
- Active
Links
- 239000002245 particle Substances 0.000 title claims description 299
- 238000001514 detection method Methods 0.000 title claims description 284
- 238000000034 method Methods 0.000 title claims description 105
- 238000004590 computer program Methods 0.000 title claims description 10
- 238000005375 photometry Methods 0.000 title 3
- 239000012488 sample solution Substances 0.000 claims description 145
- 230000003287 optical effect Effects 0.000 claims description 107
- 238000004458 analytical method Methods 0.000 claims description 35
- 238000004204 optical analysis method Methods 0.000 claims description 22
- 230000033001 locomotion Effects 0.000 claims description 13
- 230000005653 Brownian motion process Effects 0.000 claims description 12
- 238000005537 brownian motion Methods 0.000 claims description 12
- 238000012545 processing Methods 0.000 claims description 12
- 238000009792 diffusion process Methods 0.000 claims description 11
- 125000004122 cyclic group Chemical group 0.000 claims description 10
- 238000006073 displacement reaction Methods 0.000 claims description 3
- 238000005259 measurement Methods 0.000 description 41
- 230000008569 process Effects 0.000 description 28
- 239000000523 sample Substances 0.000 description 25
- 230000005284 excitation Effects 0.000 description 22
- 230000008859 change Effects 0.000 description 21
- 239000000243 solution Substances 0.000 description 20
- 238000002060 fluorescence correlation spectroscopy Methods 0.000 description 17
- 108020004707 nucleic acids Proteins 0.000 description 15
- 102000039446 nucleic acids Human genes 0.000 description 15
- 150000007523 nucleic acids Chemical class 0.000 description 15
- 230000006870 function Effects 0.000 description 12
- 238000009826 distribution Methods 0.000 description 10
- 108090000623 proteins and genes Proteins 0.000 description 9
- 238000003860 storage Methods 0.000 description 9
- 238000004364 calculation method Methods 0.000 description 8
- 238000010586 diagram Methods 0.000 description 8
- 238000009499 grossing Methods 0.000 description 8
- 230000010287 polarization Effects 0.000 description 8
- 230000004087 circulation Effects 0.000 description 7
- 239000000975 dye Substances 0.000 description 7
- 239000007850 fluorescent dye Substances 0.000 description 7
- 238000004061 bleaching Methods 0.000 description 6
- 230000007246 mechanism Effects 0.000 description 6
- 238000009739 binding Methods 0.000 description 5
- 238000006243 chemical reaction Methods 0.000 description 5
- 238000002360 preparation method Methods 0.000 description 5
- 230000029918 bioluminescence Effects 0.000 description 4
- 238000005415 bioluminescence Methods 0.000 description 4
- 238000002474 experimental method Methods 0.000 description 4
- 238000005286 illumination Methods 0.000 description 4
- 230000006872 improvement Effects 0.000 description 4
- 239000013612 plasmid Substances 0.000 description 4
- 102000004169 proteins and genes Human genes 0.000 description 4
- 230000009467 reduction Effects 0.000 description 4
- 238000012546 transfer Methods 0.000 description 4
- UDGUGZTYGWUUSG-UHFFFAOYSA-N 4-[4-[[2,5-dimethoxy-4-[(4-nitrophenyl)diazenyl]phenyl]diazenyl]-n-methylanilino]butanoic acid Chemical compound COC=1C=C(N=NC=2C=CC(=CC=2)N(C)CCCC(O)=O)C(OC)=CC=1N=NC1=CC=C([N+]([O-])=O)C=C1 UDGUGZTYGWUUSG-UHFFFAOYSA-N 0.000 description 3
- IAZDPXIOMUYVGZ-UHFFFAOYSA-N Dimethylsulphoxide Chemical compound CS(C)=O IAZDPXIOMUYVGZ-UHFFFAOYSA-N 0.000 description 3
- 101150105104 Kras gene Proteins 0.000 description 3
- 241000700605 Viruses Species 0.000 description 3
- 230000004075 alteration Effects 0.000 description 3
- 150000001413 amino acids Chemical class 0.000 description 3
- 239000000356 contaminant Substances 0.000 description 3
- 239000000835 fiber Substances 0.000 description 3
- 239000010419 fine particle Substances 0.000 description 3
- 150000002632 lipids Chemical class 0.000 description 3
- 238000000691 measurement method Methods 0.000 description 3
- 108090000765 processed proteins & peptides Proteins 0.000 description 3
- 239000012088 reference solution Substances 0.000 description 3
- 238000010183 spectrum analysis Methods 0.000 description 3
- 239000000126 substance Substances 0.000 description 3
- 239000000758 substrate Substances 0.000 description 3
- 238000012360 testing method Methods 0.000 description 3
- 230000004544 DNA amplification Effects 0.000 description 2
- 238000012408 PCR amplification Methods 0.000 description 2
- FAPWRFPIFSIZLT-UHFFFAOYSA-M Sodium chloride Chemical compound [Na+].[Cl-] FAPWRFPIFSIZLT-UHFFFAOYSA-M 0.000 description 2
- QAOWNCQODCNURD-UHFFFAOYSA-N Sulfuric acid Chemical compound OS(O)(=O)=O QAOWNCQODCNURD-UHFFFAOYSA-N 0.000 description 2
- 230000009471 action Effects 0.000 description 2
- 230000002776 aggregation Effects 0.000 description 2
- 238000004220 aggregation Methods 0.000 description 2
- 238000005311 autocorrelation function Methods 0.000 description 2
- 230000004888 barrier function Effects 0.000 description 2
- 239000000084 colloidal system Substances 0.000 description 2
- 238000004891 communication Methods 0.000 description 2
- 230000023077 detection of light stimulus Effects 0.000 description 2
- 230000006866 deterioration Effects 0.000 description 2
- 239000006185 dispersion Substances 0.000 description 2
- 239000013307 optical fiber Substances 0.000 description 2
- 230000003252 repetitive effect Effects 0.000 description 2
- 239000004065 semiconductor Substances 0.000 description 2
- 230000035945 sensitivity Effects 0.000 description 2
- 238000012109 statistical procedure Methods 0.000 description 2
- QKNYBSVHEMOAJP-UHFFFAOYSA-N 2-amino-2-(hydroxymethyl)propane-1,3-diol;hydron;chloride Chemical compound Cl.OCC(N)(CO)CO QKNYBSVHEMOAJP-UHFFFAOYSA-N 0.000 description 1
- 238000012935 Averaging Methods 0.000 description 1
- 229920002307 Dextran Polymers 0.000 description 1
- 108090000790 Enzymes Proteins 0.000 description 1
- 102000004190 Enzymes Human genes 0.000 description 1
- 239000007983 Tris buffer Substances 0.000 description 1
- 238000010521 absorption reaction Methods 0.000 description 1
- 238000000137 annealing Methods 0.000 description 1
- 239000007864 aqueous solution Substances 0.000 description 1
- 238000000149 argon plasma sintering Methods 0.000 description 1
- 230000008901 benefit Effects 0.000 description 1
- 230000000975 bioactive effect Effects 0.000 description 1
- 238000002306 biochemical method Methods 0.000 description 1
- 230000015572 biosynthetic process Effects 0.000 description 1
- 239000000872 buffer Substances 0.000 description 1
- 238000003759 clinical diagnosis Methods 0.000 description 1
- 238000010367 cloning Methods 0.000 description 1
- 230000000295 complement effect Effects 0.000 description 1
- 230000003247 decreasing effect Effects 0.000 description 1
- 230000001419 dependent effect Effects 0.000 description 1
- 238000011161 development Methods 0.000 description 1
- 230000018109 developmental process Effects 0.000 description 1
- 230000004069 differentiation Effects 0.000 description 1
- 208000018459 dissociative disease Diseases 0.000 description 1
- 239000003814 drug Substances 0.000 description 1
- 230000000694 effects Effects 0.000 description 1
- 238000000295 emission spectrum Methods 0.000 description 1
- 238000011156 evaluation Methods 0.000 description 1
- 238000002866 fluorescence resonance energy transfer Methods 0.000 description 1
- 238000009396 hybridization Methods 0.000 description 1
- 230000003993 interaction Effects 0.000 description 1
- 230000009878 intermolecular interaction Effects 0.000 description 1
- 239000007788 liquid Substances 0.000 description 1
- 239000000693 micelle Substances 0.000 description 1
- 230000004660 morphological change Effects 0.000 description 1
- 239000003960 organic solvent Substances 0.000 description 1
- 239000013618 particulate matter Substances 0.000 description 1
- 230000002265 prevention Effects 0.000 description 1
- 238000000746 purification Methods 0.000 description 1
- 238000010791 quenching Methods 0.000 description 1
- 230000000171 quenching effect Effects 0.000 description 1
- 238000012827 research and development Methods 0.000 description 1
- 238000012216 screening Methods 0.000 description 1
- 239000011780 sodium chloride Substances 0.000 description 1
- 238000001228 spectrum Methods 0.000 description 1
- 238000013179 statistical model Methods 0.000 description 1
- 238000003786 synthesis reaction Methods 0.000 description 1
- LENZDBCJOHFCAS-UHFFFAOYSA-N tris Chemical compound OCC(N)(CO)CO LENZDBCJOHFCAS-UHFFFAOYSA-N 0.000 description 1
Images


Classifications
-
- G—PHYSICS
- G01—MEASURING; TESTING
- G01N—INVESTIGATING OR ANALYSING MATERIALS BY DETERMINING THEIR CHEMICAL OR PHYSICAL PROPERTIES
- G01N21/00—Investigating or analysing materials by the use of optical means, i.e. using sub-millimetre waves, infrared, visible or ultraviolet light
- G01N21/62—Systems in which the material investigated is excited whereby it emits light or causes a change in wavelength of the incident light
- G01N21/63—Systems in which the material investigated is excited whereby it emits light or causes a change in wavelength of the incident light optically excited
- G01N21/64—Fluorescence; Phosphorescence
-
- G—PHYSICS
- G01—MEASURING; TESTING
- G01N—INVESTIGATING OR ANALYSING MATERIALS BY DETERMINING THEIR CHEMICAL OR PHYSICAL PROPERTIES
- G01N15/00—Investigating characteristics of particles; Investigating permeability, pore-volume, or surface-area of porous materials
- G01N15/10—Investigating individual particles
- G01N15/14—Electro-optical investigation, e.g. flow cytometers
- G01N15/1429—Electro-optical investigation, e.g. flow cytometers using an analyser being characterised by its signal processing
-
- G—PHYSICS
- G01—MEASURING; TESTING
- G01N—INVESTIGATING OR ANALYSING MATERIALS BY DETERMINING THEIR CHEMICAL OR PHYSICAL PROPERTIES
- G01N15/00—Investigating characteristics of particles; Investigating permeability, pore-volume, or surface-area of porous materials
- G01N15/10—Investigating individual particles
- G01N15/14—Electro-optical investigation, e.g. flow cytometers
- G01N15/1434—Electro-optical investigation, e.g. flow cytometers using an analyser being characterised by its optical arrangement
-
- G—PHYSICS
- G01—MEASURING; TESTING
- G01N—INVESTIGATING OR ANALYSING MATERIALS BY DETERMINING THEIR CHEMICAL OR PHYSICAL PROPERTIES
- G01N21/00—Investigating or analysing materials by the use of optical means, i.e. using sub-millimetre waves, infrared, visible or ultraviolet light
- G01N21/17—Systems in which incident light is modified in accordance with the properties of the material investigated
- G01N21/47—Scattering, i.e. diffuse reflection
- G01N21/49—Scattering, i.e. diffuse reflection within a body or fluid
- G01N21/51—Scattering, i.e. diffuse reflection within a body or fluid inside a container, e.g. in an ampoule
-
- G—PHYSICS
- G01—MEASURING; TESTING
- G01N—INVESTIGATING OR ANALYSING MATERIALS BY DETERMINING THEIR CHEMICAL OR PHYSICAL PROPERTIES
- G01N21/00—Investigating or analysing materials by the use of optical means, i.e. using sub-millimetre waves, infrared, visible or ultraviolet light
- G01N21/62—Systems in which the material investigated is excited whereby it emits light or causes a change in wavelength of the incident light
- G01N21/63—Systems in which the material investigated is excited whereby it emits light or causes a change in wavelength of the incident light optically excited
- G01N21/64—Fluorescence; Phosphorescence
- G01N21/6408—Fluorescence; Phosphorescence with measurement of decay time, time resolved fluorescence
-
- G—PHYSICS
- G01—MEASURING; TESTING
- G01N—INVESTIGATING OR ANALYSING MATERIALS BY DETERMINING THEIR CHEMICAL OR PHYSICAL PROPERTIES
- G01N21/00—Investigating or analysing materials by the use of optical means, i.e. using sub-millimetre waves, infrared, visible or ultraviolet light
- G01N21/62—Systems in which the material investigated is excited whereby it emits light or causes a change in wavelength of the incident light
- G01N21/63—Systems in which the material investigated is excited whereby it emits light or causes a change in wavelength of the incident light optically excited
- G01N21/64—Fluorescence; Phosphorescence
- G01N21/645—Specially adapted constructive features of fluorimeters
- G01N21/6452—Individual samples arranged in a regular 2D-array, e.g. multiwell plates
-
- G—PHYSICS
- G01—MEASURING; TESTING
- G01N—INVESTIGATING OR ANALYSING MATERIALS BY DETERMINING THEIR CHEMICAL OR PHYSICAL PROPERTIES
- G01N21/00—Investigating or analysing materials by the use of optical means, i.e. using sub-millimetre waves, infrared, visible or ultraviolet light
- G01N21/62—Systems in which the material investigated is excited whereby it emits light or causes a change in wavelength of the incident light
- G01N21/63—Systems in which the material investigated is excited whereby it emits light or causes a change in wavelength of the incident light optically excited
- G01N21/64—Fluorescence; Phosphorescence
- G01N21/645—Specially adapted constructive features of fluorimeters
- G01N21/6456—Spatial resolved fluorescence measurements; Imaging
- G01N21/6458—Fluorescence microscopy
-
- G—PHYSICS
- G01—MEASURING; TESTING
- G01N—INVESTIGATING OR ANALYSING MATERIALS BY DETERMINING THEIR CHEMICAL OR PHYSICAL PROPERTIES
- G01N21/00—Investigating or analysing materials by the use of optical means, i.e. using sub-millimetre waves, infrared, visible or ultraviolet light
- G01N21/62—Systems in which the material investigated is excited whereby it emits light or causes a change in wavelength of the incident light
- G01N21/63—Systems in which the material investigated is excited whereby it emits light or causes a change in wavelength of the incident light optically excited
- G01N21/64—Fluorescence; Phosphorescence
- G01N21/6486—Measuring fluorescence of biological material, e.g. DNA, RNA, cells
-
- G—PHYSICS
- G02—OPTICS
- G02B—OPTICAL ELEMENTS, SYSTEMS OR APPARATUS
- G02B21/00—Microscopes
- G02B21/0004—Microscopes specially adapted for specific applications
- G02B21/002—Scanning microscopes
- G02B21/0024—Confocal scanning microscopes (CSOMs) or confocal "macroscopes"; Accessories which are not restricted to use with CSOMs, e.g. sample holders
- G02B21/0032—Optical details of illumination, e.g. light-sources, pinholes, beam splitters, slits, fibers
-
- G—PHYSICS
- G02—OPTICS
- G02B—OPTICAL ELEMENTS, SYSTEMS OR APPARATUS
- G02B21/00—Microscopes
- G02B21/0004—Microscopes specially adapted for specific applications
- G02B21/002—Scanning microscopes
- G02B21/0024—Confocal scanning microscopes (CSOMs) or confocal "macroscopes"; Accessories which are not restricted to use with CSOMs, e.g. sample holders
- G02B21/0052—Optical details of the image generation
- G02B21/0076—Optical details of the image generation arrangements using fluorescence or luminescence
-
- G—PHYSICS
- G02—OPTICS
- G02B—OPTICAL ELEMENTS, SYSTEMS OR APPARATUS
- G02B21/00—Microscopes
- G02B21/0004—Microscopes specially adapted for specific applications
- G02B21/002—Scanning microscopes
- G02B21/0024—Confocal scanning microscopes (CSOMs) or confocal "macroscopes"; Accessories which are not restricted to use with CSOMs, e.g. sample holders
- G02B21/008—Details of detection or image processing, including general computer control
-
- G—PHYSICS
- G01—MEASURING; TESTING
- G01N—INVESTIGATING OR ANALYSING MATERIALS BY DETERMINING THEIR CHEMICAL OR PHYSICAL PROPERTIES
- G01N21/00—Investigating or analysing materials by the use of optical means, i.e. using sub-millimetre waves, infrared, visible or ultraviolet light
- G01N21/62—Systems in which the material investigated is excited whereby it emits light or causes a change in wavelength of the incident light
- G01N21/63—Systems in which the material investigated is excited whereby it emits light or causes a change in wavelength of the incident light optically excited
- G01N21/64—Fluorescence; Phosphorescence
- G01N2021/6417—Spectrofluorimetric devices
- G01N2021/6419—Excitation at two or more wavelengths
-
- G—PHYSICS
- G01—MEASURING; TESTING
- G01N—INVESTIGATING OR ANALYSING MATERIALS BY DETERMINING THEIR CHEMICAL OR PHYSICAL PROPERTIES
- G01N21/00—Investigating or analysing materials by the use of optical means, i.e. using sub-millimetre waves, infrared, visible or ultraviolet light
- G01N21/62—Systems in which the material investigated is excited whereby it emits light or causes a change in wavelength of the incident light
- G01N21/63—Systems in which the material investigated is excited whereby it emits light or causes a change in wavelength of the incident light optically excited
- G01N21/64—Fluorescence; Phosphorescence
- G01N21/6428—Measuring fluorescence of fluorescent products of reactions or of fluorochrome labelled reactive substances, e.g. measuring quenching effects, using measuring "optrodes"
- G01N2021/6439—Measuring fluorescence of fluorescent products of reactions or of fluorochrome labelled reactive substances, e.g. measuring quenching effects, using measuring "optrodes" with indicators, stains, dyes, tags, labels, marks
- G01N2021/6441—Measuring fluorescence of fluorescent products of reactions or of fluorochrome labelled reactive substances, e.g. measuring quenching effects, using measuring "optrodes" with indicators, stains, dyes, tags, labels, marks with two or more labels
-
- G—PHYSICS
- G01—MEASURING; TESTING
- G01N—INVESTIGATING OR ANALYSING MATERIALS BY DETERMINING THEIR CHEMICAL OR PHYSICAL PROPERTIES
- G01N2201/00—Features of devices classified in G01N21/00
- G01N2201/10—Scanning
- G01N2201/103—Scanning by mechanical motion of stage
-
- G—PHYSICS
- G01—MEASURING; TESTING
- G01N—INVESTIGATING OR ANALYSING MATERIALS BY DETERMINING THEIR CHEMICAL OR PHYSICAL PROPERTIES
- G01N2201/00—Features of devices classified in G01N21/00
- G01N2201/10—Scanning
- G01N2201/105—Purely optical scan
Definitions
- This invention relates to an optical analysis technique capable of detecting light from a particulate object, e.g. an atom, a molecule or an aggregate thereof (Hereafter, these are called a "particle”.), such as a biological molecule, for example, protein, peptide, nucleic acid, lipid, sugar chain, amino acid or these aggregate, virus and cell, etc., or a non-biological particle, dispersed or dissolved in a solution, by using an optical system, such as the optical system of a confocal microscope or a multiphoton microscope, which can detect light from a micro region in a solution, to acquire useful information in an analysis of conditions (interaction, binding or dissociating condition, etc.) of particles, and more specifically, relates to an optical analysis device, optical analysis method and computer program for optical analysis, which detect individually the light from a single particle which emits light, using an optical system as described above, to make it possible to conduct various optical analyses.
- a particulate object e.g. an atom,
- a particle which emits light may be any of a particle which itself emits light and a particle to which an arbitrary light-emitting label or light-emitting probe has been attached, and the light emitted from a light-emitting particle may be fluorescence, phosphorescence, chemiluminescence, bioluminescence, scattered light, etc.
- patent documents 1-3 and non-patent documents 1-3 by means of the optical system of a laser confocal microscope and a photon counting technique, there is performed the measurement of fluorescence intensity of fluorescent molecules or fluorescently labeled molecules (fluorescent molecules, etc.), entering into and exiting out of a micro region (the focal region to which the laser light of the microscope is condensed, called a "confocal volume”) in a sample solution, and based on the average dwell time (translational diffusion time) of the fluorescent molecules, etc.
- a micro region the focal region to which the laser light of the microscope is condensed
- patent document 5 there is generated a histogram of fluorescence intensity of fluorescent molecules, etc., entering into and exiting out of a confocal volume, measured similarly to FCS; and the average value of the characteristic brightness of the fluorescent molecules, etc. and the average number of molecules dwelling in the confocal volume are calculated by fitting a statistical model formula to the distribution of the histogram, so that, based on the information thereof, the structure or size changes, binding or dissociative conditions or dispersion and aggregation conditions of molecules can be estimated.
- Patent documents 6 and 7 there are proposed methods of detecting fluorescent substances based on a time progress of fluorescence signals of a sample solution measured using the optical system of a confocal microscope.
- Patent document 8 has proposed a signal calculation processing technique for measuring faint light from fluorescent fine particles flowing through a flow cytometer or fluorescent fine particles fixed on a substrate by a photon counting technique to detect the existences of the fluorescent fine particles in the flow or on the substrate.
- a sample amount required for the measurement may be extremely small (an amount used in one measurement is at most several tens of • L), and its concentration is extremely low as compared with the prior art, and the measuring time is also shortened extremely (In one measurement, a measuring process for time of order of seconds is repeated several times.).
- those techniques are expected to be a strong tool enabling an experiment or a test at low cost and/or quickly in comparison with conventional biochemical methods, especially in conducting an analysis of a rare or expensive sample often used in the field of the medical or biological research and development or in conducting tests of a large number of specimens, such as sick clinical diagnosis or the screening of bioactive substances.
- Patent document 9 A device and a method according to the respective preamble of the independent claims is known from Patent document 9.
- WO 00/71991 A1 discloses a system and method for detecting fluorescence from particles in a solution using a focused light beam with a limited depth of field, whereby the particles are detected from a heightened fluorescence intensity above a given threshold of background fluorescence when the particle in solution passes through the focus of the light beam.
- the measured light is the light emitted from single or several fluorescent molecules
- the analysis of the light statistical procedures for the calculating of the fluorescence intensity fluctuation, etc. such as the computation of the autocorrelation function or the fitting to the histogram of fluorescence intensity data measured in time series, and therefore the signal of the light from an individual fluorescent molecule is not seen or analyzed. That is, in these optical analysis techniques, through the statistical processing of the signals of the lights from a plurality of fluorescent molecules, etc., statistical average characteristics of the fluorescent molecules, etc. will be detected.
- the concentration or number density of a fluorescent molecule, etc. to be an observation object in the sample solution should be at a level so that fluorescent molecules, etc. of the number enabling a statistical process will enter in and exit from a micro region in one measuring term of a length of order of seconds in an equilibrium, preferably at a level so that about one fluorescent molecule, etc. will be always present in the micro region.
- the volume of a confocal volume is about 1 fL, the concentration of a fluorescent molecule, etc.
- Applicant of the present application has proposed an optical analysis technique based on a new principle which makes it possible to observe quantitatively a condition or characteristic of a light-emitting particle in a sample solution where the concentration or number density of the light-emitting particle to be an observation object is lower than the level at which the optical analysis techniques including statistical procedures, such as FCS and FIDA, etc. are used.
- an optical system which can detect light from a micro region in a solution, such as an optical system of a confocal microscope or a multiphoton microscope, similarly to FCS, FIDA, etc., and additionally, the position of the micro region, i.e.
- the detection region of light (called “light detection region” in the following) is moved in the sample solution, namely, the inside of the sample solution is scanned with the light detection region, and when the light detection region encompasses a light-emitting particle, dispersed and moving at random in the sample solution, the light emitted from the light-emitting particle is detected, and thereby each of the light-emitting particles in the sample solution is detected individually so that it becomes possible to perform the counting of light-emitting particles and the acquisition of the information about the concentration or number density of the light-emitting particle in the sample solution.
- light detection region the detection region of light
- a sample amount necessary for measurement may be small (for example, about several 10 ⁇ L) and the measuring time is short similarly to optical analysis techniques, such as FCS and FIDA, but also, it becomes possible to detect the presence of a light-emitting particle and to quantitatively detect its characteristic, such as a concentration, a number density, etc., at a lower concentration or number density, as compared with the case of optical analysis techniques, such as FCS and FIDA.
- a light detection region is movable along a route of a broader region or a longer distance in order to detect as many light-emitting particles as possible.
- the main object of the present invention is to provide a novel way of lowering the possibility of detecting the same light-emitting particle as different particles, and, moving a light detection region without its size or shape change to enable scanning the inside of a sample solution in a broader region or along a longer route in the above-mentioned scanning molecule counting method.
- An optical analysis device which detects light from a light-emitting particle dispersed and moving at random in a sample solution using an optical system of a confocal microscope or a multiphoton microscope may comprise: a light detection region moving portion which moves a position of a light detection region of the optical system of the microscope in a flat plane in the sample solution; a light detecting portion which detects light from the light detection region; and a signal processing portion which generates time series light intensity data of the light from the light detection region detected with the light detecting portion during moving the position of the light detection region in the sample solution and detects a signal indicating light from each light-emitting particle individually in the time series light intensity data; wherein the light detection region moving portion moves the position of the light detection region along a second route whose position moves along a first route.
- a light-emitting particle dispersed and moving at random in a sample solution may be a particle, such as an atom, a molecule or an aggregate of these, which is dispersed or dissolved in a sample solution and emits light, and it may be an arbitrary particulate matter making the Brownian motion freely in a solution without being fixed on a substrate, etc.
- the light-emitting particle is typically a fluorescent particle, but may be a particle which emits light by phosphorescence, chemiluminescence, bioluminescence, light scattering, etc.
- the "light detection region” of the optical system of the confocal microscope or multiphoton microscope is the micro region where light is detected in those microscopes, which region corresponds to the region to which illumination light is condensed when the illumination light is given from an objective (Especially in a confocal microscope, this region is determined in accordance with the spatial relationship of an objective and a pinhole.
- a light-emitting particle which emits light without illumination light for example, a molecule which emits light according to chemiluminescence or bioluminescence, no illumination light is required in the microscope.
- a signal of a light-emitting particle means a signal expressing light from a light-emitting particle, unless noted otherwise.
- the light detection is sequentially performed while the position of a light detection region is moved in a sample solution, namely, while the inside of the sample solution is scanned with the light detection region. Then, when the light detection region moving in the sample solution encompasses a randomly moving light-emitting particle, the light from the light-emitting particle is detected by the light detecting portion, and thereby, it is expected that the existence of one particle will be detected.
- a signal indicating light from a light-emitting particle is individually detected, and thereby, the existences of individual particles are detected one by one, and accordingly, diverse information on the conditions of the particles in the solution will be acquired.
- the position of the light detection region is moved in a manner that it circulates along a certain closed route, and thus, if the diffusive motion of a light-emitting particle was comparatively slow, the same light-emitting particle could be detected in every circulation.
- the mechanism of the light detection region moving portion would become complicated, and the shape and size of the light detection region could be changed in accordance with the position of the light detection region in the direction of the optical axis, depending upon types of objectives.
- the objective used in a highly sensitive confocal optical system to detect one molecule has the short operating distance, the adjustment for a microtiter plate is difficult because, in the case of the microtiter, the direction allowing the approaching to the sample solution is limited to only the direction from the bottom of the container.
- the position of the light detection region is moved along the second route whose position moves along the first route in a flat plane in the sample solution.
- the moving route of the position of the light detection region in the sample solution does not pass through the same region at least until the completion of the moving of the position of the second route along the first route (except momentarily passed route crossings), so that the possibility of detecting the same light-emitting particle twice or more will be reduced substantially.
- the position of the light detection region is moved in a flat plane in the sample solution, the change in shape or size of the position of the light detection region will be suppressed to the minimum.
- the position of the light detection region in order to suppress the change in shape or size of the light detection region to the possible minimum, the position of the light detection region should be restricted within the range where aberration is small in the field of view of the objective.
- the object to be observed is a light-emitting particle moving at random, it can be considered that the position of the light detection region is allowed to pass the same position after the lapse of time sufficient for a once detected light-emitting particle to diffuse and move to a different place.
- the second route that is the track of the position of the light detection region, and the first route that is the track of the position of the second route may be cyclic routes, respectively.
- the moving cycle time of the position of the light detection region along the second route may be set shorter than the moving cycle time of the position of the second route along the first route.
- the moving cycle time ⁇ 1 of the position of the light detection region and the moving speed v2 of the position of the second route are set so that the moving cycle time ⁇ 1 of the position of the light detection region, the moving speed v2 of the position of the second route and the diameter d of the light detection region will satisfy: v 2 ⁇ ⁇ 1 > d .
- the second route moves at least the distance equal to the diameter of the light detection region during one circulation of the position of the light detection region along the second route, and thus, during the continuous circulations of the position of the light detection region, it will be avoided that the light detection region overlaps with the region through which it has passed in the previous circulation.
- the above-mentioned moving of the position of the light detection region in the sample solution in the optical system of the confocal light microscope is concretely performable by either of the changing of the optical path of the optical system of the microscope and the moving of the container containing a sample solution.
- the moving along the second route of the position of the light detection region may be made by changing the optical path of the optical system of the microscope while the moving of the position of the second route along the first route may be performed by moving the position of the sample solution.
- the combination of the circulating motion of the light detection region by changing the optical path of the optical system and the circulating motion of the sample solution enables the scanning of broader area or longer distance in the sample solution.
- the moving of the position of the light detection region along the second route within the sample solution by changing the optical path of the optical system of the microscope may be conducted in an arbitrary way.
- changing the optical path of the optical system of the microscope to change the position of the light detection region may be performed using a galvanometer mirror adopted in a laser scan type light microscope.
- the moving of the light detection region is quick, and since neither mechanical vibration nor hydrodynamic action occurs substantially in the sample solution, it is advantageous to enable a measurement under a stable condition without a light-emitting particle to be an object to be detected being influenced by a dynamic action.
- the second route may be circular or elliptical.
- the shape of the first route may be circular, elliptical or linear.
- the moving of the sample solution may be conducted by moving the container of the sample solution with the moving of the stage of the microscope. In that case, it is thought that, since no flow does occur in the solution, the light-emitting particle in the sample solution is less influenced.
- the moving speed of the position of the light detection region in the sample solution may be appropriately changed based on the characteristic or the number density or concentration of the light-emitting particle in the sample solution.
- the condition of detected light from the light-emitting particle may change in accordance with its characteristic, number density or concentration in the sample solution.
- the moving speed of the light detection region becomes quick, the amount of light obtained from one light-emitting particle will be reduced, and therefore it is preferable that the moving speed of the light detection region can be changed appropriately so that the light from one light-emitting particle can be measured precisely or with sufficient sensitivity.
- the moving speed of the position of the light detection region in the sample solution is preferably set to be higher than the diffusional moving velocity of a light-emitting particle (the average moving speed of a particle owing to the Brownian motion).
- a light-emitting particle will be detected individually by detecting the light emitted from the light-emitting particle in the light detection region.
- the moving speed of the light detection region is set higher than the diffusional moving velocity of a light-emitting particle, and thereby it becomes possible to make one light-emitting particle associated with one signal.
- the moving speed of the light detection region can be changed appropriately according to the characteristics (especially, the diffusion constant) of the light-emitting particle as described above.
- the judgment of whether or not one light-emitting particle enters into the light detection region from a signal in the successively detected values from the light detecting portion may be performed based on the shape of the signal in the time series light intensity data.
- the entry of one light-emitting particle into a light detection region is detected when a signal with a larger intensity than a predetermined threshold value is detected.
- the signal processing portion of the device may be designed to detect on time series light intensity data a pulse form signal which has an intensity exceeding a predetermined threshold value as a signal indicating light from a single light-emitting particle.
- the "predetermined threshold value” can be experimentally set to an appropriate value.
- the object to be detected in the inventive device is the light from a single light-emitting particle, and thus, light intensity is extremely weak, and when one light-emitting particle is a single fluorescent molecule or several molecules, the light is stochastically emitted from the light-emitting particle, so that minute time gaps can be generated in the signal values. If such a gap is generated, the identification of a signal corresponding to the existence of one light-emitting particle will become difficult.
- the signal processing portion may be designed to smooth time series light intensity data to process the data so that minute time gaps in signal values can be ignored, and to detect as a signal indicating light from a single light-emitting particle a bell-shaped pulse form signal having an intensity beyond a predetermined threshold value in the smoothed time series light intensity data.
- the number of light-emitting particles encompassed in the light detection region may be counted by counting the number of the selectively detected signals (The counting of particles). In that case, by associating the number of the detected light-emitting particles with the moving amount of the position of the light detection region, the information on the number density or concentration of the light-emitting particle identified in the sample solution will be acquired.
- the ratio of number densities or concentrations of two or more sample solutions or a relative ratio of a number density or concentration to a standard sample solution to be the reference of a concentration or a number density may be computed, or an absolute number density value or concentration value may be determined using a relative ratio of a number density or concentration to a standard sample solution to be the reference of a concentration or a number density.
- an absolute number density value or concentration value may be determined using a relative ratio of a number density or concentration to a standard sample solution to be the reference of a concentration or a number density.
- the processes of the optical analysis technique of conducting a light detection with moving the position of a light detection region in a sample solution and detecting the signal from each light-emitting particle individually in the above-mentioned device, in which the position of the light detection region is moved along the second route whose position moves along the first route in a flat plane in the sample solution so that the possibility that the same light-emitting particle is detected twice or more is substantially reduced, can be realized with a general-purpose computer.
- a computer program for optical analysis of detecting light from a light-emitting particle dispersed and moving at random in a sample solution using an optical system of a confocal microscope or a multiphoton microscope characterized by making a computer execute: a light detection region moving procedure of moving a position of a light detection region of the optical system of the microscope in a flat plane in the sample solution along a second route whose position moves along a first route in a flat plane in the sample solution; a time series light intensity data generation procedure of detecting light from the light detection region and generating time series light intensity data during the moving of the position of the light detection region; and a light-emitting particle signal detection procedure of detecting individually a signal indicating light from each light-emitting particle using the time series light intensity data.
- the computer program is provided with being stored in a computer readable storage medium.
- the computer reads out the program memorized in the storage device and realizes the above-mentioned procedures by performing the processing and calculations of information.
- a computer readable storage device may be a magnetic disc, a magnetic optical disk, a CD-ROM, a DVD-ROM, a semiconductor memory, etc.
- the above-mentioned program may be distributed to a computer through communication line, and the computer which received this distribution may be made to execute the program.
- the first and the second route are cyclic routes
- the moving cycle time of the position of the light detection region along the second route is set shorter than the moving cycle time of the position of the second route along the first route.
- the moving cycle time ⁇ 1 of the position of the light detection region, the moving speed v2 of the position of the second route and the diameter d of the light detection region are set to satisfy: v 2 ⁇ ⁇ 1 > d .
- the moving of the position of the light detection region along the second route may be performed by changing the optical path of the optical system while the moving of the position of the second route in the sample solution along the first route may be performed by moving the position of the sample solution.
- the optical path of the optical system of the microscope may be changed to change the position of the light detection region using a galvanometer mirror adopted in a laser scan type light microscope.
- the second route may be circular or elliptical and the first route may be circular, elliptical or linear.
- the moving speed of the position of the light detection region in the sample solution may be appropriately changed based on the characteristics, the number density or concentration of the light-emitting particle in the sample solution.
- the moving speed of the position of the light detection region in the sample solution is set higher than the diffusion moving velocity of the light-emitting particle to be the object to be detected.
- individual detection of a signal indicating light from each light-emitting particle is performed based on the shape of the time series signals.
- the entry of one light-emitting particle into the light detection region is detected when a signal with a larger intensity than a predetermined threshold value is detected.
- a bell-shaped pulse form signal having an intensity beyond a predetermined threshold value in light intensity data may be detected as a signal indicating light from a single light-emitting particle, and preferably, the time series light intensity data may be smoothed so that a bell-shaped pulse form signal having an intensity beyond a predetermined threshold value in the smoothed time series light intensity data may be detected as a signal indicating light from a single light-emitting particle.
- an optical analysis method of detecting light from a light-emitting particle dispersed and moving at random in a sample solution using an optical system of a confocal microscope or a multiphoton microscope characterized by comprising: a light detection region moving step of moving a position of a light detection region of the optical system of the microscope in a flat plane in the sample solution; a time series light intensity data generation step of detecting light from the light detection region and generating time series light intensity data during the moving of the position of the light detection region; and a light-emitting particle signal detection step of detecting individually a signal indicating light from each light-emitting particle using the time series light intensity data, wherein in the light detection region moving step, the light detection region is moved along a second route whose position moves along a first route.
- the first and the second route are cyclic routes
- the moving cycle time of the position of the light detection region along the second route is set shorter than the moving cycle time of the position of the second route along the first route.
- the moving cycle time ⁇ 1 of the position of the light detection region, the moving speed v2 of the position of the second route and the diameter d of the light detection region are set to satisfy: v 2 ⁇ ⁇ 1 > d .
- the moving of the position of the light detection region along the second route may be performed by changing the optical path of the optical system while the moving of the position of the second route in the sample solution along the first route may be performed by moving the position of the sample solution.
- the optical path of the optical system of the microscope may be changed to change the position of the light detection region using a galvanometer mirror adopted in a laser scan type light microscope.
- the second route may be circular or elliptical and the first route may be circular, elliptical or linear.
- the moving speed of the position of the light detection region in the sample solution may be appropriately changed based on the characteristics, the number density or concentration of the light-emitting particle in the sample solution.
- the moving speed of the position of the light detection region in the sample solution is set higher than the diffusion moving velocity of the light-emitting particle to be the object to be detected.
- individual detection of a signal indicating light from each light-emitting particle may be performed based on the shape of the time series signals.
- the entry of one light-emitting particle into the light detection region is detected when a signal with a larger intensity than a predetermined threshold value is detected.
- a bell-shaped pulse form signal having an intensity beyond a predetermined threshold value in light intensity data may be detected as a signal indicating light from a single light-emitting particle, and preferably, the time series light intensity data may be smoothed so that a bell-shaped pulse form signal having an intensity beyond a predetermined threshold value in the smoothed time series light intensity data may be detected as a signal indicating light from a single light-emitting particle.
- the optical analysis technique of the above-mentioned present disclosure is used, typically, for an analysis of a condition in a solution of a biological particulate object, such as a biological molecule, e.g. a protein, a peptide, a nucleic acid, a lipid, a sugar chain, an amino acid or these aggregate, a virus and a cell, etc., but it may be used for an analysis of a condition in a solution of a non-biological particle (for example, an atom, a molecule, a micelle, a metallic colloid, etc.), and it should be understood that such a case belongs to the scope of the present invention also.
- a biological particulate object such as a biological molecule, e.g. a protein, a peptide, a nucleic acid, a lipid, a sugar chain, an amino acid or these aggregate, a virus and a cell, etc.
- a non-biological particle for example, an atom, a molecule
- the moving track of the position of a light detection region i.e., the scanning route in a sample solution
- the scanning in the sample solution is performed in a broader region or along a longer distance so that the prevention of deterioration of the accuracy of the detected number or number density of light-emitting particles will be achieved.
- an optical analysis device which realizes the optical analysis technique according to the present invention is a device constructed by associating the optical system of a confocal microscope and a photodetector, enabling FCS, FIDA, etc., as schematically illustrated in Fig. 1 (A) .
- the optical analysis device 1 consists of an optical system 2-17 and a computer 18 for acquiring and analyzing data together with controlling the operation of each part in the optical system.
- the optical system of the optical analysis device 1 may be the same as the optical system of a usual confocal microscope, where laser light, emitted from a light source 2 and transmitted through the inside of a single mode fiber 3 (Ex), forms light diverging to be radiated at the angle decided by an inherent NA at the emitting end of the fiber; and after forming a parallel beam with a collimator 4, the light is reflected on a dichroic mirror 5 and reflective mirrors 6 and 7, entering into an objective 8.
- the objective 8 typically, there is placed a sample container or a micro plate 9 having wells 10 arranged thereon, to which one to several tens of ⁇ L of a sample solution is dispensed, and the laser light emitted from the objective 8 is focused in the sample solution in the sample container or well 10, forming a region having strong light intensity (excitation region).
- light-emitting particles to be observed objects which are typically fluorescent particles or particles to which a light emitting label such as a fluorescent dye is attached, are dispersed or dissolved, and when such a light-emitting particle enters into the excitation region, the light-emitting particle is excited and emits light during dwelling in the excitation region.
- the pinhole 13 is located at a conjugate position of the focal position of the objective 8, and thereby only the light emitted from the focal region of the laser light, i.e., the excitation region, as schematically shown in Fig. 1 (B) , passes through the pinhole 13 while the light from regions other than the excitation region is blocked.
- the focal region of the laser light illustrated in Fig. 1 (B) is a light detection region, whose effective volume is usually about 1-10 fL in this optical analysis device (typically, the light intensity is spread in accordance with a Gaussian type distribution having the peak at the center of the region.
- the effective volume is a volume of an approximate ellipsoid bordering a surface where the light intensity is reduced to 1/e 2 of the peak intensity.), which focal region is called as "confocal volume".
- confocal volume since the light from a single light-emitting particle, for example, the faint light from one fluorescent dye molecule is detected, preferably, a super high sensitive photodetector, usable for the photon counting, is used for the photodetector 16.
- the detection of light is performed by the photon counting, the measurement of light intensity is performed for a predetermined time in a manner of measuring the number of photons which have sequentially arrived at a photodetector in every predetermined unit time (BIN TIME).
- the time series light intensity data is time series photon count data.
- a stage position changing apparatus 17a for moving the horizontal position of the micro plate 9, in order to change the well 10 to be observed.
- the operation of the stage position changing apparatus 17a may be controlled by the computer 18. According to this structure, quick measurement can be achieved even when there are two or more specimens.
- a mechanism for changing the optical path of the optical system to scan the inside of the sample solution with the light detection region namely to move the position of the focal region i.e., the light detection region, within the sample solution.
- a mechanism for moving the position of the light detection region for example, there may be employed a mirror deflector 17 which changes the direction of the reflective mirror 7, as schematically illustrated in Fig. 1 (C) (the type of changing an optical path to move the absolute position of a light detection region).
- This mirror deflector 17 may be the same as that of a galvanomirror device equipped on a usual laser scan type microscope. Furthermore, as illustrated in Fig.
- the stage position changing apparatus 17a is operated in order to move the horizontal position of the container 10 (micro plate 9), into which the sample solution has been dispensed, to move the relative position of the light detection region in the sample solution (the type of moving the position of a sample solution).
- the light detection region is moved to circulate along a scanning track (the second route) by the above-mentioned type of moving the absolute position of the light detection region by changing optical path while the position of the scanning track of the light detection region in the sample solution is moved along a predetermined moving track (the first route) by the type of moving the position of a sample solution simultaneously.
- the mirror deflector 17 and the stage position changing apparatus 17a are driven in harmony with the light detection of the photodetector 16 under the control of the computer 18.
- the scanning track of the position of the light detection region may be a closed cyclic route of a circle or an ellipse, etc., and the moving track of the position of the sample solution may be arbitrarily selected from circular, elliptical, straight and curvilinear ones, or a combination of these (The program in the computer 18 may be designed so that various moving patterns can be selected.)
- the above-mentioned optical system is used as a multiphoton microscope.
- the pinhole 13 since the light is emitted only from the focal region of the excitation light (light detection region), the pinhole 13 may be removed.
- the optical system 2-5 for generating excitation light may be omitted.
- the above-mentioned optical system of the confocal microscope is used as it is.
- two or more excitation light sources 2 may be provided so that the wavelength of the excitation light can be appropriately selected in accordance with the wavelength of the light for exciting a light-emitting particle.
- it may be designed to divide a detected light into two or more wavelength bands by inserting a dichroic mirror 14a in a detected light optical path, and detect them independently with two or more photodetectors 16. According to this structure, it becomes possible to detect the information on the emission wavelength characteristic (emission spectrum) of a light-emitting particle or detect the lights of two or more kinds of light-emitting particles, when contained, independently in accordance with the wavelengths.
- the light detection it may be designed to use light, polarized in a predetermined direction, as excitation light and detect separately components of detected light in the direction of the excitation light and the direction perpendicular thereto, so as to detect the polarization characteristics of the light of a light-emitting particle.
- a polarizer (not shown) is inserted in an excitation light optical path, and a polarization beam splitter 14a is inserted in a detected light optical path.
- the computer 18 has a CPU and a memory, and the inventive procedures are performed through the CPU executing various operational processes. In this regard, each procedure may be done with hardware. All or a part of processes explained in this embodiment may be performed by the computer 18 with a computer readable storage device having memorized the programs to realize those processes. Accordingly, the computer 18 may read out the program memorized in the storage device and realize the above-mentioned steps by performing the processing and calculations of information.
- a computer readable storage device may be a magnetic disc, a magnetic optical disk, a CD-ROM, a DVD-ROM, a semiconductor memory, etc., or the above-mentioned program may be distributed to a computer through communication line, and the computer which received this distribution may be made to execute the program.
- the scanning track of the position of a light detection region is moved in a flat plane in a sample solution during the moving of the position of the light detection region so as to prevent the light detection region from passing through the same region in a short time as far as possible, thereby avoiding the detecting of the same light-emitting particle as different particles and the change in size or shape of the light detection region as far as possible, and thus, it is tried to suppress the scattering in the detected number of light-emitting particles and improve the detection accuracy.
- the principle of the scanning molecule counting method and the manners of the circulating movements of a light detection region in the present invention are explained.
- Spectral analysis techniques such as FCS, FIDA, etc.
- FCS fluorescence intensity fluctuation
- concentration or number density of the light-emitting particle in a sample solution should be at a level where about one light-emitting particle always exists in a light detection region CV during the fluorescence intensity measurement as schematically drawn in Fig.
- the concentration of the light-emitting particle is significantly lower than the level where about one light-emitting particle always exists in the inside of the light detection region during the measurement, the calculation of light intensity fluctuation would become subject to the influence of the background, and the measuring time should be made long in order to obtain the significant quantity of the light intensity data (photon count) sufficient for the calculation.
- the light detection is performed together with moving the position of the light detection region CV in a sample solution, namely, scanning the inside of the sample solution with the light detection region CV by driving the mechanism for moving the position of the light detection region to change the optical path as schematically drawn in Fig. 2(A) .
- the light detection region CV in the drawing, time to-t2
- t1 region where one light-emitting particle exists
- a pulse form signal having significant light intensity (Em) appears on time series light intensity data as drawn in Fig. 2 (B) .
- each pulse form signal (significant light intensity) appearing as illustrated in Fig. 2 (B) during the execution of the moving of the position of the light detection region CV and the light detection as described above
- the light-emitting particles are detected individually, and by counting the number thereof, the information about the number, concentration or number density of the light-emitting particles existing in the measured region can be acquired.
- the characteristics of the lights of various light-emitting particles and the characteristics of light-emitting particle itself become detectable for the respective light-emitting particles.
- the position of the light detection region is moved at a higher speed than the moving speed of the Brownian motion (diffusion moving velocity) of a light-emitting particle.
- the moving of the position of a light detection region is performed by changing the optical path of the optical system of a microscope. This is because, as explained above, according to the changing the optical path with the mirror deflector 17, the moving of the position of a light detection region is comparatively easily executable at a high speed.
- the moving range of the position of the light detection region by changing the optical path is within an area around the center of the field of view of the objective with little aberration.
- the region through which the light detection region passes i.e., the scanning region, becomes small so that the detected number of light-emitting particles may be decreased.
- the light detection region will repetitively pass through the region occupied by the particle, so that the same particle could be detected multiple times.
- a wider region or a longer distance can be scanned without multiple times detection of the same particles when it is wanted to increase the detected number of light-emitting particles as much as possible for counting the number, detecting the concentration or number density of light-emitting particles, etc.
- the size and shape of the light detection region are hardly changed so that the length or volume of the scanned region (the passing region of the light detection region) can be easily estimated.
- the moving track of the position of a light detection region is improved such that the position of the light detection region is moved along a predetermined scanning track while the scanning track is moved in a two-dimensional flat plane so as to avoid the position of the light detection region passing through the same region (except the crossings of the route) within a short time as far as possible.
- the stage position changing apparatus 17a is driven continuously to move the position of the sample solution as shown in Fig. 2 (D) , thereby moving the position of the scanning track of the light detection region with reference to the sample solution, so that it is avoided as far as possible that the light detection region scans the same region within a short time.
- the speed of the light detection region with reference to the sample solution is almost constant so that the pulse form shape of a signal of light of a light-emitting particle will be always constant, but when the moving speed of the position of the sample solution is high to the extent equal to the moving speed of the light detection region along the scanning track, the speed of the light detection region with reference to the sample solution would be changed.
- the moving speed of the position of the sample solution is low enough as compared with the moving speed of the light detection region along the scanning track (for example, 20% or less). Also, as shown in Fig.
- the moving speed of the position of the sample solution (the moving speed of the position of the scanning track) v2 and the moving cycle time ⁇ 1 of the light detection region in the scanning track are set to satisfy: v 2 ⁇ ⁇ 1 > d in the relation with the diameter d of the light detection region.
- the moving speed v2 of the position of the sample solution is to become 0.67 ⁇ m/ second or more.
- the moving cycle time ⁇ 1 in the scanning track of the light detection region is usually set to 6 ⁇ 60 mseconds, and thus, in that case, the moving speed v2 of the position of the sample solution will become 17 ⁇ m/second or more. Since the moving speed of the light detection region in the scanning track is typically set in 10 ⁇ 90 mm /second, the moving speed v2 of the position of the sample solution is so small that it can almost be disregarded.
- Fig. 1 (A) concretely, there are conducted (1) a preparation of a sample solution containing light-emitting particles; (2) a process of measuring the light intensity of the sample solution and (3) a process of analyzing measured light intensities.
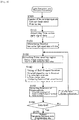
- Fig. 3 shows the processes in this embodiment in form of the flow chart.
- the particle to be an observed object in the inventive optical analysis technique may be an arbitrary particle as long as it is dispersed in a sample solution and moving at random in the solution, such as a dissolved molecule, and the particle may be, for instance, a biological molecule, i.e. a protein, a peptide, a nucleic acid, a lipid, a sugar chain, an amino acid, etc. or an aggregate thereof, a virus, a cell, a metallic colloid or other non-biological molecules.
- a biological molecule i.e. a protein, a peptide, a nucleic acid, a lipid, a sugar chain, an amino acid, etc. or an aggregate thereof, a virus, a cell, a metallic colloid or other non-biological molecules.
- the particle to be an observed object is a particle which emits no light
- a particle to which a light emitting label (a fluorescence molecule, a phosphorescence molecule, and a chemiluminescent or bioluminescent molecule) is attached in an arbitrary manner.
- the sample solution is an aqueous solution, but not limited to this, and it may be an organic solvent or other arbitrary liquids.
- the measurement of the light intensity in the optical analysis by the scanning molecule counting method of the present embodiment may be conducted in a manner similar to a measurement process of light intensity in FCS or FIDA except that the mirror deflector 17 and the stage position changing apparatus 17a are driven to move the position of the light detection region within the sample solution (scanning the sample solution) and move the sample solution during the measurement.
- the computer 18 executes programs memorized in a storage device (not shown) (the process of moving the position of the light detection region in the sample solution, and the process of detecting light from the light detection region during the moving of the position of the light detection region) to start radiating the excitation light and measuring the light intensity in the light detection region.
- the mirror deflector 17 drives the mirror 7 (galvanomirror) to perform the circulating movement of the position of the light detection region along a scanning track in the well 10 while the stage position changing apparatus 17a moves the position of the micro plate 9 on the stage of the microscope.
- the photodetector 16 sequentially converts the detected light into electric signals and transmits it to the computer 18, which generates the time series light intensity data from the transmitted signals and stores it in an arbitrary manner. Then, these processes are performed for arbitrary time and one measurement is completed.
- the photodetector 16 is typically a super high sensitive photodetector which can detect an arrival of a single photon, and thus when the detection of light is performed by the photon counting, the time series light intensity data may be time series photon count data.
- the moving speed of the position of the light detection region in the circulating movement along a scanning track during the measurement of the light intensity may be a predetermined velocity set arbitrarily, for example, experimentally or in order to meet the purpose of an analysis.
- the region size or volume through which the light detection region has passed is required, and therefore, the moving of the position of the light detection region is performed in a manner enabling the grasping of the moving distance.
- the moving speed is constant, although not limited thereto.
- the moving speed of the position of the light detection region is preferably set to to a value quicker than the moving speed in the random motion, i.e., the Brownian motion of a light-emitting particle in order to perform quantitatively precisely individual detection of a light-emitting particle to be observed from the measured time series light intensity data or the counting of the number of light-emitting particles, while satisfying the condition of the above-mentioned Expression (1).
- the particle to be observed in the inventive optical analysis technique is a particle dispersed or dissolved in a solution and moving at random freely, its position moves with time owing to the Brownian motion.
- the moving speed of the position of the light detection region is set to be quicker than the average moving speed of a particle by the Brownian motion (diffusional moving velocity) so that the particle will cross the light detection region in an approximately straight line and thereby the profile of the change of the light intensity corresponding to each light-emitting particle becomes almost uniform in the time series light intensity data as illustrated in the most upper row of Fig. 4 (C) (When a light-emitting particle passes through the light detection region in an approximately straight line, the profile of the light intensity change forms a bell shape similar to the excitation light intensity distribution.) and the correspondence between each light-emitting particle and light intensity can be easily determined.
- the moving speed of the position of the light detection region may be set to its 10 times or more, 15 mm/s, etc.
- an appropriate moving speed of the position of the light detection region may be determined by repeating the executions of a preliminary experiment with setting various moving speeds of the position of the light detection region in order to find the condition that the profile of the light intensity variation becomes an expected profile (typically, similar to the excitation light intensity distribution).
- the light intensity variation in the signal corresponding to the particle in the time series light intensity data has a bell shaped profile reflecting the light intensity distribution in the light detection region (determined by the optical system) (See Fig. 4(C) , the most upper row).
- the signal having the profile of the light intensity may be judged to correspond to one particle having passed through the light detection region, and thereby one light-emitting particle is detected.
- a signal whose time width in which light intensity beyond the threshold value continues is not within the predetermined range is judged as noise or a signal of a contaminant.
- a smoothing treatment is performed to the time series light intensity data ( Fig. 4(C) , the most upper row "detected result (unprocessed)") ( Fig. 3 - step 110, Fig. 4 (C) mid-upper row "smoothing").
- the smoothing treatment may be done, for example, by the moving average method, etc.
- parameters in performing the smoothing treatment e.g., the number of datum points in one time of the averaging, the number of times of a moving average, etc. in the moving averages method, may be appropriately set in accordance with the moving speed (scanning speed) of the position of the light detection region and/or BIN TIME in the light intensity data acquisition.
- the first differentiation value with time of the smoothed time series light intensity data is computed (step 120).
- the mid-low row "time differential" in the time differential value of time series light intensity data the value variation increases at the time of the signal value change, and thereby, the start point and the end point of a significant signal can be determined advantageously by referring to the time differential value.
- the bell-shaped function to be used in the fitting is typically Gauss function as in Expression (5), it may be Lorentz type function.
- Step 150 it is judged whether or not the computed parameters of the bell shaped function are within the respective ranges assumed for the parameters of the bell-shaped profile drawn by a pulse signal to be detected when one light-emitting particle passes through the light detection region, namely, whether or not the peak intensity, pulse width and correlation coefficient of a pulse are in the respective predetermined ranges, e.g. whether or not the following conditions are satisfied: 20 ⁇ sec . ⁇ pulse width ⁇ 400 ⁇ sec . Peak intensity > 1.0 pc / 10 ⁇ sec . Correlation coefficient > 0.95 (Step 150).
- the signal whose computed parameters of the bell-shaped function are judged to be within the ranges assumed in a light signal corresponding to one light-emitting particle, as shown in Fig. 5 left, is judged as a signal corresponding to one light-emitting particle, and thereby one light-emitting particle has been detected.
- a pulse signal whose computed parameters of the bell-shaped function are not within the assumed ranges, as shown in Fig. 5 right, is disregarded as noise.
- the searching and judging of a pulse signal in the above-mentioned processes of steps 130-150 may be repetitively carried out throughout time series light intensity data (step 160).
- the processes for detecting individually a signal from the time series light intensity data may be performed by an arbitrary way, other than the above-mentioned procedures.
- the number of light-emitting particles may be determined by counting the number of signals of detected light-emitting particles (Counting of light-emitting particles). Also, when the volume of the whole region through which the light detection region has passed is computed out by an arbitrary way, the number density or concentration of the light-emitting particle in the sample solution can be determined from the number of light-emitting particles and the volume (Step 170).
- the volume of the whole region through which the light detection region has passed may be theoretically computed out with the wavelength of excitation light or detected light, the numerical aperture of lenses and the adjustment condition of the optical system, but the volume may be determined experimentally, for instance, using the number of light-emitting particles detected by performing, with a solution having a known light-emitting particle concentration (a reference solution), the light intensity measurement, detection of (a) light-emitting particle(s) and their counting under the same condition as the measurement of a sample solution to be tested, and the light-emitting particle concentration of the reference solution.
- a reference solution a solution having a known light-emitting particle concentration
- the average value of the computed Vts may be employed as the whole volume Vt of the region though which the light detection region has passed.
- the volume of the light detection region and the volume of the whole region which the light detection region has passed through may be given by an arbitrary method, for instance, using FCS and FIDA, instead of the above-mentioned method.
- the optical analysis device of this embodiment there may be previously memorized in a storage device of the computer 18 the information on the relations (Expression (6)) between concentrations C and light-emitting particle numbers N of various standard light-emitting particles for assumed moving patterns of the light detection region, so that a user of the device can appropriately use the memorized information on the relation in conducting an optical analysis.
- the scanning molecule counting method which scans in a sample solution with a light detection region and detects light-emitting particles individually, the counting of the light-emitting particles, the determination of their concentration, etc. in the sample solution can be performed through the above-mentioned procedures.
- an arbitrary index value indicating polarization characteristics such as a polarization degree and polarization anisotropy, can be computed from the intensity values of signals acquired from those respective light intensity data so that, from such an index value, an index value of the rotatory diffusion characteristics of the light-emitting particle can be computed.
- the present invention in the measurement of detected light, in which components of a plurality of wavelength bands in a detected light are separately measured and light intensity data are generated for each of the wavelength bands, it becomes possible to acquire information (e.g., intensity ratio in two or more wavelengths) on the emission wavelength spectrum of a light-emitting particle from the intensity values of the signals acquired from those light intensity data.
- information e.g., intensity ratio in two or more wavelengths
- the present invention is directed to, the information on the characteristics of light of a light-emitting particle, the characteristics of light-emitting particle itself as above can be determined for each light-emitting particle.
- the information on the number density and concentration of a light-emitting particle in a sample solution or information on other characteristics will be acquired in the scanning molecule counting method.
- the position of the light detection region is moved along a scanning track while the position of the scanning track of the position of the light detection region in a sample solution is moved by moving the position of the sample solution in the two-dimensional flat plane in the sample solution, and thereby the change of the shape and size of the light detection region is suppressed to the minimum, and also, it is avoided that the light detection region repetitively passes through the same region within a short time period.
- this structure significantly reduces the possibility of unintentional detecting the same light-emitting particle twice or more, enabling the detection of as many light-emitting particles as possible in a broader region and trying the improvement in the accuracy of the detected result.
- the molecular beacon is a nucleic acid molecule in which a molecule to be a fluorescent dye FL functioning as the donor and a molecule Qc functioning as the acceptor in a fluorescence energy transfer phenomenon are attached on the respective ends.
- the donor dye FL and the acceptor molecule Qc are close in the distance so that a fluorescence energy transfer phenomenon FRET from the donor dye to the acceptor dye occurs, while, when it binds with a nucleic acid or a nucleic acid analogue T having a base sequence complementary to the base sequence of the molecular beacon, the distance between the donor dye FL and the acceptor molecule Qc is made increase as schematically drawn on the right of Fig. 6 (A) so that the fluorescence energy transfer phenomenon no longer occurs.
- the donor dye ATTO647N was used, and for the acceptor molecule, BHQ2, a quenching molecule absorbing the fluorescence of ATTO647N was used.
- the fluorescence of ATTO647N is absorbed by BHQ2 because of the fluorescence energy transfer phenomenon so that no fluorescence will be emitted, while, when the molecular beacon binds with a nucleic acid to be a target, the distance between the donor dye and the acceptor molecule increases so that the fluorescence Em will be emitted and detectable.
- the sample solutions were prepared as follows:
- k-Ras gene was artificially synthesized, inserted into a plasmid and prepared with cloning (the synthesis and preparation were ordered to Hokkaido System Science).
- PCR amplification was conducted, using the synthesized plasmid as a template (a template in which k-RasWt sequence was inserted into pUC57 vector), with 10000 copies of k-Ras plasmids, 0.1 ⁇ M FwPrimer (Fasmac), 0.1 ⁇ M RePrimer (Fasmac), 0.125U PrimeStar Taq (TaKaRa, R010A), 1 ⁇ PrimeStar Buffer, 800mM dNTPs and 2% DMSO, in 10 ⁇ L of a reaction capacity through thermal cycles of (10 seconds at 98 °C to 3 minutes 72 °C) ⁇ 35 cycles.
- the PCR product was purified with Wizard SV Gel and PCR Clean-Up system (Promega, A9281), preparing nucleic acids having a target sequence.
- the FwPrimer for kRas gene amplification
- the RePrimer for kRas gene amplification
- the template in which k-RasWt sequence has been inserted into pUC57 vector has the base sequence of sequence No. 3.
- Molecular beacon i.e., DNA having the base sequence of sequence No. 4 and in which ATTO647N was labeled to the 5' end and BHQ2 was labeled to the 3' end (83b, 20pM, Sigma Genosis), was mixed with the template (0 - 50pM) which had been obtained through PCR-amplification and purification of the plasmid into which k-Ras gene was inserted, and its annealing was conducted for 2 minutes at 95 °C and 3 hours at 60 °C in Tris buffer (10 mM Tris-HCl (pH 8.0), 400mM NaCl, 0.1% PluronicF-127, 10% dextran sulfuric acid), and the preparation was stored at 10°C and collected.
- Tris buffer 10 mM Tris-HCl (pH 8.0), 400mM NaCl, 0.1% PluronicF-127, 10% dextran sulfuric acid
- a single molecule fluorescence measuring apparatus MF20 (Olympus Corporation), equipped with the optical system of a confocal fluorescence microscope and a photon counting system, was used as the optical analysis device, and time series light intensity data (photon count data) was acquired for the above-mentioned sample solution in accordance with the manner explained in the above-mentioned "(2) Measurement of Light Intensity of a Sample Solution".
- a 633-nm laser light 600 ⁇ W
- was used for excitation light and, using a band pass filter, the light of the wavelength bands, 660 to 710 nm, was measured.
- a measurement by photon counting with BIN TIME of 10 ⁇ seconds for 20 seconds was continuously performed in 30 times(Namely, the light measurement was continuously performed for 600 seconds.). Also, in the case without only moving of the position of the sample container, the measurement was conducted under the same conditions except the moving of the sample solution (without moving the sample container).
- step 150 only a pulse signal satisfying the following conditions was judged as a signal corresponding to a light-emitting particle: 20 ⁇ seconds ⁇ pulse width ⁇ 400 ⁇ seconds Peak intensity > 1.0 pc / 10 ⁇ sec .
- Correlation coefficient > 0.95 while a pulse signal which did not satisfy the above-mentioned conditions was disregarded as a noise, and the number of the signals judged as signals corresponding to the light-emitting particles was counted as the "number of pulses.”
- the threshold value of the above-mentioned peak intensity was a magnitude to the degree in which noise of photodetector APD did not be erroneously detected as a signal of a light-emitting particle.
- Fig. 6 (B) shows the average values (bar graph) and the CV values (error bar) of the detected numbers of the light-emitting particles measured for the sample solutions prepared with various concentrations of the target nucleic acid according to the above-mentioned procedures.
- the values in the drawing are the average values and CV values computed from the detected numbers in 30 measurements where a measurement for 20 seconds is 1 time. Referring to the drawing, in the sample solutions of the respective concentrations, there was seen no large difference in the average values of the detected numbers between the case with moving the sample container and the case without moving the sample container, but, as for the CV values, it was 5 to 19% in the case without moving the sample container while it was 2 to 3% in the case with moving the sample container, where the scattering of the results was significantly reduced.
- the lower limit of discriminable concentration was 50pM in the case without moving the sample container while it was 500fM in the case with moving the sample container, and accordingly, an improvement of 100 times was obtained. Namely, according to the above-mentioned results, it has been confirmed that the reduction of the scattering and the improvement of accuracy in result values of detected numbers of light-emitting particles can be achieved according the present invention.
- Fig. 6 (C) shows variations of the average value for the light-emitting particles when the measurement for 20 seconds was continuously repeated 30 times with the sample solution of the target nucleic acid concentration of 50pM.
- the ordinate axis indicates the ratios of the detected numbers in the respective times to the number of particles detected in the first time (in the first 20 seconds).
- the molecular beacon emits fluorescence when it binds with a target nucleic acid molecule so that its existence becomes detectable, and therefore, it is considered that the undulation and reduction of the detected number in the same sample solution were caused by the bleaching of the fluorescent dyes.
- the undulation and reduction of the detected number owing to the bleaching of the fluorescent dyes when the moving of the sample container was not performed suggests that a light-emitting particle did not deviate from the scanning track of the light detection region during the light detection region circulating along the scanning track one time or more, and thereby, the light-emitting particle was irradiated repetitively with the excitation light.
Claims (11)
- Dispositif d'analyse optique (1) pour détecter une lumière provenant d'une particule électroluminescente dispersée et se déplaçant aléatoirement dans une solution d'échantillon, comprenant :un système optique d'un microscope confocal ou d'un microscope multiphotonique ;des moyens de déplacement de région de détection de lumière (17, 17a) pour déplacer une position d'une région de détection de lumière (CV) du système optique dans un plan plat dans la solution d'échantillon à une vitesse supérieure à la vitesse de déplacement de particule dû au mouvement Brownien ;des moyens de détection de lumière (16) pour détecter de la lumière provenant de la région de détection de lumière (CV) ; etdes moyens de traitement de signal pour générer des données d'intensité de lumière chronologiques de la lumière provenant de la région de détection de lumière (CV) détectée avec les moyens de détection de lumière (16) avec déplacement de la position de la région de détection de lumière (CV) dans la solution d'échantillon, pour détecter un signal indiquant la lumière provenant de chaque particule électroluminescente individuellement dans les données d'intensité de lumière chronologiques, etpour commander les moyens de déplacement de région de détection de lumière (17, 17a) pour déplacer de manière séquentielle la position de la région de détection de lumière (CV) le long d'au moins un second trajet, pour déplacer la région de détection de lumière (CV) le long d'au moins un premier trajet et pour déplacer la position de la région de détection de lumière (CV) le long d'au moins un autre second trajet identique au précédent au moins un second trajet mais déplacée depuis celui-ci par le déplacement le long du premier trajet ;caractérisé par le fait queles moyens de traitement de signal sont capables de déterminer qu'uniquement une particule électroluminescente est passée à travers la région de détection de lumière (CV) sur la base du signal ayant un profil d'intensité de lumière en fonction du temps en forme de cloche, de telle sorte que la largeur temporelle pendant laquelle la valeur d'intensité de lumière dépasse de manière continue une valeur de seuil définie de façon appropriée se situe dans une plage prédéterminée,les premier et second trajets sont des trajets cycliques, et un temps de cycle de déplacement de la position de la région de détection de lumière (CV) le long du second trajet est plus court qu'un temps de cycle de déplacement de la position du second trajet le long du premier trajet.
- Dispositif (1) selon la revendication 1, caractérisé par le fait qu'un temps de cycle de déplacement T1 de la position de la région de détection de lumière (CV), une vitesse de déplacement v2 de la position du second trajet et un diamètre d de la région de détection de lumière (CV) satisfont v2•T1 > d.
- Dispositif (1) selon l'une ou l'autre des revendications 1 et 2, caractérisé par le fait que la position de la région de détection de lumière (CV) est déplacée le long du second trajet par changement du trajet optique du système optique ; et la position du second trajet est déplacée le long du premier trajet dans la solution d'échantillon par le déplacement de la position de la solution d'échantillon.
- Procédé d'analyse optique de détection de lumière provenant d'une particule électroluminescente dispersée et se déplaçant aléatoirement dans une solution d'échantillon à l'aide d'un système optique d'un microscope confocal ou d'un microscope multiphotonique, comprenant :une étape de déplacement de région de détection de lumière, pour déplacer une position d'une région de détection de lumière (CV) du système optique dans un plan plat dans la solution d'échantillon à une vitesse plus rapide qu'une vitesse de déplacement de diffusion de la particule électroluminescente ;une étape de génération de données d'intensité de lumière chronologiques, pour détecter de la lumière provenant de la région de détection de lumière (CV) et générer des données d'intensité de lumière chronologiques durant le déplacement de la position de la région de détection de lumière (CV) ;et une étape de détection de signal de particule électroluminescente, pour détecter individuellement un signal indiquant la lumière provenant de chaque particule électroluminescente à l'aide des données d'intensité de lumière chronologiques ;dans lequel, dans l'étape de déplacement de région de détection de lumière, la position de la région de détection de lumière (CV) est déplacée de manière séquentielle le long d'au moins un second trajet, déplacé le long d'au moins un premier trajet et déplacé le long d'au moins un autre second trajet identique au précédent au moins un second trajet mais déplacé depuis celui-ci par le déplacement le long de l'au moins un premier trajet ;caractérisé par le fait quedans l'étape de détection de signal de particule électroluminescente, il est déterminé qu'uniquement une particule électroluminescente est passée à travers la région de détection de lumière (CV) par un signal ayant un profil d'une intensité de lumière en fonction du temps en forme de cloche, lorsqu'une largeur temporelle pendant laquelle la valeur d'intensité de lumière dépasse de manière continue une valeur de seuil définie de façon appropriée se situe dans une plage prédéterminée ;dans lequel les premier et second trajets sont des trajets cycliques, et un temps de cycle de déplacement de la position de la région de détection de lumière le long du second trajet est plus court qu'un temps de cycle de déplacement de la position du second trajet le long du premier trajet.
- Procédé selon la revendication 4, caractérisé par le fait qu'un temps de cycle de déplacement T1 de la position de la région de détection de lumière (CV), une vitesse de déplacement v2 de la position du second trajet et un diamètre d de la région de détection de lumière (CV) satisfont v2•T1 > d.
- Procédé selon l'une ou l'autre des revendications 4 et 5, caractérisé par le fait que la position de la région de détection de lumière (CV) est déplacée le long du second trajet par changement du trajet optique du système optique ; et la position du second trajet est déplacée le long du premier trajet dans la solution d'échantillon par le déplacement de la position de la solution d'échantillon.
- Procédé selon l'une quelconque des revendications 4 à 6, caractérisé par le fait que le second trajet est circulaire ou elliptique, et le premier trajet est circulaire, elliptique ou linéaire.
- Procédé selon l'une quelconque des revendications 4 à 7, caractérisé par le fait qu'il comprend en outre une étape de comptage d'un nombre de signaux détectés individuellement indiquant la lumière provenant des particules électroluminescentes, pour compter un nombre des particules électroluminescentes détectées durant le déplacement de la position de la région de détection de lumière (CV).
- Procédé selon l'une quelconque des revendications 4 à 8, caractérisé par le fait que, dans l'étape de détection de signal de particule électroluminescente, les données d'intensité de lumière chronologiques sont lissées ; et le signal de forme d'impulsion en forme de cloche ayant une intensité dépassant une valeur de seuil prédéterminée est détecté en tant que signal indiquant la lumière provenant d'une unique particule électroluminescente dans les données d'intensité de lumière chronologiques lissées.
- Procédé selon l'une quelconque des revendications 4 à 9, caractérisé par le fait qu'il comprend en outre une étape de détermination d'un nombre volumique ou d'une concentration de la particule électroluminescente dans la solution d'échantillon sur la base d'un nombre des particules électroluminescentes détectées.
- Programme d'ordinateur pour exécuter un procédé selon l'une quelconque des revendications 4 à 10.
Applications Claiming Priority (2)
| Application Number | Priority Date | Filing Date | Title |
|---|---|---|---|
| JP2011177453 | 2011-08-15 | ||
| PCT/JP2012/067692 WO2013024650A1 (fr) | 2011-08-15 | 2012-07-11 | Dispositif d'analyse photométrique par détection de particules électroluminescentes individuelles, procédé et programme d'ordinateur afférents |
Publications (3)
| Publication Number | Publication Date |
|---|---|
| EP2746748A1 EP2746748A1 (fr) | 2014-06-25 |
| EP2746748A4 EP2746748A4 (fr) | 2015-04-29 |
| EP2746748B1 true EP2746748B1 (fr) | 2017-12-06 |
Family
ID=47714976
Family Applications (1)
| Application Number | Title | Priority Date | Filing Date |
|---|---|---|---|
| EP12823870.6A Active EP2746748B1 (fr) | 2011-08-15 | 2012-07-11 | Dispositif d'analyse photométrique par détection de particules électroluminescentes individuelles, procédé et programme d'ordinateur afférents |
Country Status (5)
| Country | Link |
|---|---|
| US (1) | US9423349B2 (fr) |
| EP (1) | EP2746748B1 (fr) |
| JP (1) | JP6013337B2 (fr) |
| CN (1) | CN103733049B (fr) |
| WO (1) | WO2013024650A1 (fr) |
Families Citing this family (10)
| Publication number | Priority date | Publication date | Assignee | Title |
|---|---|---|---|---|
| CN103328955B (zh) | 2011-01-20 | 2017-10-20 | 奥林巴斯株式会社 | 利用来自单个发光粒子的光的检测的光分析方法和光分析装置 |
| CN103733049B (zh) | 2011-08-15 | 2016-01-20 | 奥林巴斯株式会社 | 利用单个发光粒子检测的光分析装置、光分析方法以及光分析用计算机程序 |
| EP2749867B1 (fr) | 2011-08-26 | 2017-05-10 | Olympus Corporation | Analyseur optique utilisant la détection de particules à émission de lumière |
| CN105431759B (zh) | 2013-07-31 | 2018-04-13 | 奥林巴斯株式会社 | 利用单个发光粒子检测技术的光学显微镜装置、显微镜观察法以及用于显微镜观察的计算机程序 |
| DE102015005656A1 (de) * | 2015-05-02 | 2016-11-03 | Testo Ag | Zytometrierverfahren und Zytometereinheit |
| US10383198B2 (en) * | 2015-08-04 | 2019-08-13 | Signify Holding B.V. | Maintaining a lighting system |
| JPWO2017098597A1 (ja) | 2015-12-09 | 2018-10-11 | オリンパス株式会社 | 単一発光粒子検出を用いた光分析方法及び光分析装置 |
| CN107516397B (zh) * | 2017-09-28 | 2023-04-07 | 深圳市泰和安科技有限公司 | 光电感烟探测器 |
| JP7246413B2 (ja) * | 2019-01-09 | 2023-03-27 | 株式会社日立ハイテクサイエンス | サイズ分布計測装置、サイズ分布計測方法 |
| US10962461B2 (en) * | 2019-08-02 | 2021-03-30 | X Energy, Llc | System and method for controlling metal oxide gel particle size |
Citations (2)
| Publication number | Priority date | Publication date | Assignee | Title |
|---|---|---|---|---|
| US20040036870A1 (en) * | 1997-06-09 | 2004-02-26 | Guava Technologies, Inc. | Method and apparatus for detecting microparticles in fluid samples |
| US20110192595A1 (en) * | 2008-10-23 | 2011-08-11 | M-I L.L.C. | Method and apparatus for measuring particle size distribution in drilling fluid |
Family Cites Families (64)
| Publication number | Priority date | Publication date | Assignee | Title |
|---|---|---|---|---|
| US4251733A (en) | 1978-06-29 | 1981-02-17 | Hirleman Jr Edwin D | Technique for simultaneous particle size and velocity measurement |
| JPS63225145A (ja) | 1987-03-16 | 1988-09-20 | Sasakura Eng Co Ltd | 流体中の不純微粒子計測方法及び計測装置 |
| US4885473A (en) | 1988-04-29 | 1989-12-05 | Shofner Engineering Associates, Inc. | Method and apparatus for detecting particles in a fluid using a scanning beam |
| CA2035703A1 (fr) | 1991-01-22 | 1992-07-23 | Pedro Lilienfeld | Systeme et methode de determination/enregistrement de la concentration de particules dans l'air |
| JPH04337446A (ja) | 1991-05-15 | 1992-11-25 | Hitachi Ltd | 微粒子計測方法、定量方法および微粒子計測装置 |
| US5866336A (en) | 1996-07-16 | 1999-02-02 | Oncor, Inc. | Nucleic acid amplification oligonucleotides with molecular energy transfer labels and methods based thereon |
| EP0836090A1 (fr) | 1996-10-12 | 1998-04-15 | Evotec BioSystems GmbH | Procédé d'analyse d'échantillons par détermination de la distribution de la clarité des particules |
| US6235471B1 (en) | 1997-04-04 | 2001-05-22 | Caliper Technologies Corp. | Closed-loop biochemical analyzers |
| DE19723999B4 (de) | 1997-06-06 | 2008-04-10 | Schwartz, Margit | Vorrichtung zur Messung von Partikelabmessungen in Fluiden |
| GB2326229A (en) | 1997-06-13 | 1998-12-16 | Robert Jeffrey Geddes Carr | Detecting and analysing submicron particles |
| SE9800360D0 (sv) | 1998-02-06 | 1998-02-06 | Goeteborg University Science I | Method, apparatus and flow cell for high sensitivity detection of fluorescent molecules |
| CN100380160C (zh) | 1998-03-16 | 2008-04-09 | 通用电气医疗集团生物科学公司 | 共焦显微镜成像系统、用于检验物品的方法、聚焦方法 |
| US6388788B1 (en) | 1998-03-16 | 2002-05-14 | Praelux, Inc. | Method and apparatus for screening chemical compounds |
| US20030036855A1 (en) | 1998-03-16 | 2003-02-20 | Praelux Incorporated, A Corporation Of New Jersey | Method and apparatus for screening chemical compounds |
| US6376843B1 (en) | 1999-06-23 | 2002-04-23 | Evotec Oai Ag | Method of characterizing fluorescent molecules or other particles using generating functions |
| DK1175602T3 (da) | 1999-04-29 | 2003-05-26 | Evotec Ag | Fremgangsmåde til karakterisering af fluorescente molekyler eller andre partikler, der anvender frembringerfunktioner |
| AU780158B2 (en) * | 1999-05-04 | 2005-03-03 | Mettler-Toledo Autochem, Inc. | Method and apparatus for particle assessment using multiple scanning beam reflectance |
| WO2000071991A1 (fr) * | 1999-05-25 | 2000-11-30 | Biometric Imaging, Inc. | Procede et appareil de detection optique dans une profondeur de champ limitee |
| US8264680B2 (en) | 1999-05-28 | 2012-09-11 | Yokogawa Electric Corporation | Biochip reader and electrophoresis system |
| US6965113B2 (en) | 2000-02-10 | 2005-11-15 | Evotec Ag | Fluorescence intensity multiple distributions analysis: concurrent determination of diffusion times and molecular brightness |
| US20010035954A1 (en) | 2000-03-10 | 2001-11-01 | Rahn John Richard | Method and apparatus for measuring particle size distributions using light scattering |
| DE10035190C5 (de) | 2000-07-20 | 2009-07-16 | MAX-PLANCK-Gesellschaft zur Förderung der Wissenschaften e.V. | Verfahren und Vorrichtung zur Fluoreszenzmessung |
| DE10038528A1 (de) | 2000-08-08 | 2002-02-21 | Zeiss Carl Jena Gmbh | Verfahren und Anordnung zur Erhöhung der spektralen und räumlichen Detektorauflösung |
| US6947133B2 (en) | 2000-08-08 | 2005-09-20 | Carl Zeiss Jena Gmbh | Method for increasing the spectral and spatial resolution of detectors |
| HU226937B1 (en) | 2000-11-17 | 2010-03-29 | Mta Szegedi Biolog Koezpont | Method and apparatus for determining polarization amount of material by a laser scanning microscope |
| JP3999662B2 (ja) * | 2000-12-14 | 2007-10-31 | オリンパス株式会社 | 蛍光分析装置および蛍光分析方法 |
| US6782297B2 (en) | 2001-05-24 | 2004-08-24 | Eric Paul Tabor | Methods and apparatus for data smoothing |
| US6750963B2 (en) | 2002-05-21 | 2004-06-15 | Agilent Technologies, Inc. | Imaging systems for signals on a surface |
| CN1735808A (zh) | 2002-11-07 | 2006-02-15 | 鹿特丹伊拉兹马斯大学 | 用于检测相互作用的分子的fret探针和方法 |
| US7038848B2 (en) | 2002-12-27 | 2006-05-02 | Olympus Corporation | Confocal microscope |
| JP4315794B2 (ja) | 2002-12-27 | 2009-08-19 | オリンパス株式会社 | 共焦点顕微鏡 |
| JP2005098876A (ja) | 2003-09-25 | 2005-04-14 | Institute Of Physical & Chemical Research | 2成分相互作用分析方法 |
| AU2005290314A1 (en) | 2004-09-28 | 2006-04-06 | Singulex, Inc. | System and method for spectroscopic analysis of single particles |
| JP2008536093A (ja) * | 2005-01-31 | 2008-09-04 | ザ ボード オブ トラスティーズ オブ ザ ユニヴァーシティー オブ イリノイ | 透明媒質及び懸濁媒質内の粒子を特性評価する方法及びデバイス |
| JP4757103B2 (ja) | 2005-06-13 | 2011-08-24 | 学校法人関西文理総合学園 | 試料中のウイルスを検出する方法およびシステム |
| WO2007010803A1 (fr) | 2005-07-15 | 2007-01-25 | Olympus Corporation | Instrument de mesure de lumière |
| JP2007093370A (ja) * | 2005-09-28 | 2007-04-12 | Olympus Corp | 蛍光分光分析装置 |
| WO2007118209A2 (fr) | 2006-04-07 | 2007-10-18 | Kim Laboratories | Appareil et procédé pour la détection rapide d'analytes |
| WO2007147159A2 (fr) | 2006-06-16 | 2007-12-21 | Cornell Research Foundation, Inc. | Ligands fonctionnels de type acide nucléique pour protéines fluorescentes |
| WO2008007580A1 (fr) | 2006-07-13 | 2008-01-17 | Olympus Corporation | Procédé d'analyse de particules fines |
| US20080052009A1 (en) | 2006-08-23 | 2008-02-28 | Washington, University Of | Method for deconvolving single-molecule intensity distributions for quantitative biological measurements |
| GB0618057D0 (en) | 2006-09-14 | 2006-10-25 | Perkinelmer Ltd | Improvements in and relating to scanning confocal microscopy |
| JP5473202B2 (ja) | 2006-10-13 | 2014-04-16 | 滋賀県 | 試料中の蛍光性物質を検出する方法およびシステム |
| JP4891057B2 (ja) * | 2006-12-27 | 2012-03-07 | オリンパス株式会社 | 共焦点レーザー走査型顕微鏡 |
| WO2008080417A1 (fr) | 2006-12-28 | 2008-07-10 | Flult Biosystems Gmbh | Procédé de détermination de propriétés caractéristiques d'un échantillon contenant des particules |
| US7804594B2 (en) | 2006-12-29 | 2010-09-28 | Abbott Laboratories, Inc. | Method and apparatus for rapidly counting and identifying biological particles in a flow stream |
| WO2008099778A1 (fr) | 2007-02-14 | 2008-08-21 | Nikon Corporation | Microscope confocal à balayage à fente |
| JP2008292371A (ja) | 2007-05-25 | 2008-12-04 | Institute Of Physical & Chemical Research | 蛍光相関分光による複数成分相互作用の分析方法及び相互作用制御化合物のスクリーニング方法 |
| JP2009145242A (ja) | 2007-12-14 | 2009-07-02 | Olympus Corp | 光測定装置 |
| AU2008352940B2 (en) * | 2007-12-19 | 2014-06-05 | Singulex, Inc. | Scanning analyzer for single molecule detection and methods of use |
| JP5139885B2 (ja) | 2008-05-21 | 2013-02-06 | 浜松ホトニクス株式会社 | 蛍光解析装置及び解析方法 |
| JP2009288161A (ja) * | 2008-05-30 | 2009-12-10 | Olympus Corp | 光測定装置及び光測定方法 |
| US20100177190A1 (en) | 2008-12-16 | 2010-07-15 | Ann-Shyn Chiang | Microscopy system with revolvable stage |
| JP5265408B2 (ja) * | 2009-02-18 | 2013-08-14 | オリンパス株式会社 | 相関分光分析方法及び相関分光分析装置 |
| JP2010276380A (ja) * | 2009-05-26 | 2010-12-09 | Olympus Corp | 蛍光相関分光分析装置及び方法並びにそのためのコンピュータプログラム |
| JP2011002415A (ja) * | 2009-06-22 | 2011-01-06 | Olympus Corp | 蛍光相関分光装置 |
| JP5802653B2 (ja) * | 2010-03-01 | 2015-10-28 | オリンパス株式会社 | 光分析装置、光分析方法並びに光分析用コンピュータプログラム |
| WO2012014778A1 (fr) * | 2010-07-26 | 2012-02-02 | オリンパス株式会社 | Procédé de détection de particules diluées dans une solution en utilisant une sonde luminescente |
| CN103154708B (zh) * | 2010-10-13 | 2015-01-14 | 奥林巴斯株式会社 | 利用单个发光粒子检测的粒子的扩散特性值的测量方法 |
| JP5885738B2 (ja) * | 2011-04-13 | 2016-03-15 | オリンパス株式会社 | 単一発光粒子検出を用いた光分析装置、光分析方法及び光分析用コンピュータプログラム |
| CN103620389B (zh) | 2011-04-18 | 2016-08-17 | 奥林巴斯株式会社 | 目标粒子的定量方法、光分析装置以及光分析用计算机程序 |
| CN103733049B (zh) | 2011-08-15 | 2016-01-20 | 奥林巴斯株式会社 | 利用单个发光粒子检测的光分析装置、光分析方法以及光分析用计算机程序 |
| WO2013031365A1 (fr) * | 2011-08-30 | 2013-03-07 | オリンパス株式会社 | Procédé de détection de particules cibles |
| EP2840380A4 (fr) | 2012-04-18 | 2015-11-25 | Olympus Corp | Dispositif de détection de particules uniques utilisant la photo-analyse, procédé de détection de particules uniques et programme informatique de détection de particules uniques |
-
2012
- 2012-07-11 CN CN201280039905.9A patent/CN103733049B/zh active Active
- 2012-07-11 EP EP12823870.6A patent/EP2746748B1/fr active Active
- 2012-07-11 JP JP2013528935A patent/JP6013337B2/ja active Active
- 2012-07-11 WO PCT/JP2012/067692 patent/WO2013024650A1/fr active Application Filing
-
2014
- 2014-02-12 US US14/178,442 patent/US9423349B2/en active Active
Patent Citations (2)
| Publication number | Priority date | Publication date | Assignee | Title |
|---|---|---|---|---|
| US20040036870A1 (en) * | 1997-06-09 | 2004-02-26 | Guava Technologies, Inc. | Method and apparatus for detecting microparticles in fluid samples |
| US20110192595A1 (en) * | 2008-10-23 | 2011-08-11 | M-I L.L.C. | Method and apparatus for measuring particle size distribution in drilling fluid |
Also Published As
| Publication number | Publication date |
|---|---|
| CN103733049A (zh) | 2014-04-16 |
| JP6013337B2 (ja) | 2016-10-25 |
| WO2013024650A1 (fr) | 2013-02-21 |
| US9423349B2 (en) | 2016-08-23 |
| CN103733049B (zh) | 2016-01-20 |
| US20140162268A1 (en) | 2014-06-12 |
| JPWO2013024650A1 (ja) | 2015-03-05 |
| EP2746748A4 (fr) | 2015-04-29 |
| EP2746748A1 (fr) | 2014-06-25 |
Similar Documents
| Publication | Publication Date | Title |
|---|---|---|
| EP2746748B1 (fr) | Dispositif d'analyse photométrique par détection de particules électroluminescentes individuelles, procédé et programme d'ordinateur afférents | |
| EP2584343B1 (fr) | Procédé de détection de particules diluées dans une solution en utilisant une sonde luminescente | |
| US8471220B2 (en) | Optical analysis device, optical analysis method and computer program for optical analysis | |
| EP2749867B1 (fr) | Analyseur optique utilisant la détection de particules à émission de lumière | |
| US8785886B2 (en) | Optical analysis method using the light intensity of a single light-emitting particle | |
| EP2615445B1 (fr) | Procédé de mesure d'une valeur de caractéristique de diffusion d'une particule | |
| US20130338968A1 (en) | Optical analysis device, optical analysis method and computer program for optical analysis using single light-emitting particle detection | |
| US8958066B2 (en) | Optical analysis method using measurement of light of two or more wavelength bands | |
| US9329117B2 (en) | Optical analysis device, optical analysis method and computer program for optical analysis using single light-emitting particle detection | |
| US8803106B2 (en) | Optical analysis device, optical analysis method and computer program for optical analysis for observing polarization characteristics of a single light-emitting particle | |
| EP2816344A1 (fr) | Dispositif d'analyse optique utilisant une technique de détection de particule unique, procédé d'analyse optique et programme d'ordinateur pour analyse optique | |
| US9528923B2 (en) | Optical analysis device, optical analysis method and computer program for optical analysis using single light-emitting particle detection | |
| JP6010029B2 (ja) | 蛍光粒子の検出方法 | |
| US9103718B2 (en) | Optical analysis device and optical analysis method using a wavelength characteristic of light of a single light-emitting particle | |
| US20140179023A1 (en) | Method for detecting a target particle in biosample containing pancreatic juice |
Legal Events
| Date | Code | Title | Description |
|---|---|---|---|
| PUAI | Public reference made under article 153(3) epc to a published international application that has entered the european phase |
Free format text: ORIGINAL CODE: 0009012 |
|
| 17P | Request for examination filed |
Effective date: 20140217 |
|
| AK | Designated contracting states |
Kind code of ref document: A1 Designated state(s): AL AT BE BG CH CY CZ DE DK EE ES FI FR GB GR HR HU IE IS IT LI LT LU LV MC MK MT NL NO PL PT RO RS SE SI SK SM TR |
|
| DAX | Request for extension of the european patent (deleted) | ||
| RA4 | Supplementary search report drawn up and despatched (corrected) |
Effective date: 20150331 |
|
| RIC1 | Information provided on ipc code assigned before grant |
Ipc: G02B 21/00 20060101ALI20150325BHEP Ipc: G01N 21/64 20060101AFI20150325BHEP |
|
| RAP1 | Party data changed (applicant data changed or rights of an application transferred) |
Owner name: OLYMPUS CORPORATION |
|
| RIN1 | Information on inventor provided before grant (corrected) |
Inventor name: TANABE, TETSUYA Inventor name: YAMAGUCHI, MITSUSHIRO |
|
| STAA | Information on the status of an ep patent application or granted ep patent |
Free format text: STATUS: EXAMINATION IS IN PROGRESS |
|
| 17Q | First examination report despatched |
Effective date: 20161124 |
|
| RIN1 | Information on inventor provided before grant (corrected) |
Inventor name: TANABE, TETSUYA Inventor name: YAMAGUCHI, MITSUSHIRO |
|
| RIC1 | Information provided on ipc code assigned before grant |
Ipc: G02B 21/00 20060101ALI20170608BHEP Ipc: G01N 15/14 20060101ALI20170608BHEP Ipc: G01N 21/51 20060101ALI20170608BHEP Ipc: G01N 21/64 20060101AFI20170608BHEP |
|
| GRAP | Despatch of communication of intention to grant a patent |
Free format text: ORIGINAL CODE: EPIDOSNIGR1 |
|
| STAA | Information on the status of an ep patent application or granted ep patent |
Free format text: STATUS: GRANT OF PATENT IS INTENDED |
|
| RIN1 | Information on inventor provided before grant (corrected) |
Inventor name: TANABE, TETSUYA Inventor name: YAMAGUCHI, MITSUSHIRO |
|
| INTG | Intention to grant announced |
Effective date: 20170721 |
|
| GRAS | Grant fee paid |
Free format text: ORIGINAL CODE: EPIDOSNIGR3 |
|
| GRAA | (expected) grant |
Free format text: ORIGINAL CODE: 0009210 |
|
| STAA | Information on the status of an ep patent application or granted ep patent |
Free format text: STATUS: THE PATENT HAS BEEN GRANTED |
|
| AK | Designated contracting states |
Kind code of ref document: B1 Designated state(s): AL AT BE BG CH CY CZ DE DK EE ES FI FR GB GR HR HU IE IS IT LI LT LU LV MC MK MT NL NO PL PT RO RS SE SI SK SM TR |
|
| REG | Reference to a national code |
Ref country code: GB Ref legal event code: FG4D |
|
| RIN1 | Information on inventor provided before grant (corrected) |
Inventor name: YAMAGUCHI, MITSUSHIRO Inventor name: TANABE, TETSUYA |
|
| REG | Reference to a national code |
Ref country code: AT Ref legal event code: REF Ref document number: 952821 Country of ref document: AT Kind code of ref document: T Effective date: 20171215 Ref country code: CH Ref legal event code: EP |
|
| REG | Reference to a national code |
Ref country code: IE Ref legal event code: FG4D |
|
| REG | Reference to a national code |
Ref country code: DE Ref legal event code: R096 Ref document number: 602012040675 Country of ref document: DE |
|
| REG | Reference to a national code |
Ref country code: NL Ref legal event code: MP Effective date: 20171206 |
|
| REG | Reference to a national code |
Ref country code: LT Ref legal event code: MG4D |
|
| PG25 | Lapsed in a contracting state [announced via postgrant information from national office to epo] |
Ref country code: LT Free format text: LAPSE BECAUSE OF FAILURE TO SUBMIT A TRANSLATION OF THE DESCRIPTION OR TO PAY THE FEE WITHIN THE PRESCRIBED TIME-LIMIT Effective date: 20171206 Ref country code: FI Free format text: LAPSE BECAUSE OF FAILURE TO SUBMIT A TRANSLATION OF THE DESCRIPTION OR TO PAY THE FEE WITHIN THE PRESCRIBED TIME-LIMIT Effective date: 20171206 Ref country code: NO Free format text: LAPSE BECAUSE OF FAILURE TO SUBMIT A TRANSLATION OF THE DESCRIPTION OR TO PAY THE FEE WITHIN THE PRESCRIBED TIME-LIMIT Effective date: 20180306 Ref country code: ES Free format text: LAPSE BECAUSE OF FAILURE TO SUBMIT A TRANSLATION OF THE DESCRIPTION OR TO PAY THE FEE WITHIN THE PRESCRIBED TIME-LIMIT Effective date: 20171206 Ref country code: SE Free format text: LAPSE BECAUSE OF FAILURE TO SUBMIT A TRANSLATION OF THE DESCRIPTION OR TO PAY THE FEE WITHIN THE PRESCRIBED TIME-LIMIT Effective date: 20171206 |
|
| REG | Reference to a national code |
Ref country code: AT Ref legal event code: MK05 Ref document number: 952821 Country of ref document: AT Kind code of ref document: T Effective date: 20171206 |
|
| PG25 | Lapsed in a contracting state [announced via postgrant information from national office to epo] |
Ref country code: RS Free format text: LAPSE BECAUSE OF FAILURE TO SUBMIT A TRANSLATION OF THE DESCRIPTION OR TO PAY THE FEE WITHIN THE PRESCRIBED TIME-LIMIT Effective date: 20171206 Ref country code: GR Free format text: LAPSE BECAUSE OF FAILURE TO SUBMIT A TRANSLATION OF THE DESCRIPTION OR TO PAY THE FEE WITHIN THE PRESCRIBED TIME-LIMIT Effective date: 20180307 Ref country code: BG Free format text: LAPSE BECAUSE OF FAILURE TO SUBMIT A TRANSLATION OF THE DESCRIPTION OR TO PAY THE FEE WITHIN THE PRESCRIBED TIME-LIMIT Effective date: 20180306 Ref country code: LV Free format text: LAPSE BECAUSE OF FAILURE TO SUBMIT A TRANSLATION OF THE DESCRIPTION OR TO PAY THE FEE WITHIN THE PRESCRIBED TIME-LIMIT Effective date: 20171206 Ref country code: HR Free format text: LAPSE BECAUSE OF FAILURE TO SUBMIT A TRANSLATION OF THE DESCRIPTION OR TO PAY THE FEE WITHIN THE PRESCRIBED TIME-LIMIT Effective date: 20171206 |
|
| PG25 | Lapsed in a contracting state [announced via postgrant information from national office to epo] |
Ref country code: NL Free format text: LAPSE BECAUSE OF FAILURE TO SUBMIT A TRANSLATION OF THE DESCRIPTION OR TO PAY THE FEE WITHIN THE PRESCRIBED TIME-LIMIT Effective date: 20171206 |
|
| PG25 | Lapsed in a contracting state [announced via postgrant information from national office to epo] |
Ref country code: EE Free format text: LAPSE BECAUSE OF FAILURE TO SUBMIT A TRANSLATION OF THE DESCRIPTION OR TO PAY THE FEE WITHIN THE PRESCRIBED TIME-LIMIT Effective date: 20171206 Ref country code: CZ Free format text: LAPSE BECAUSE OF FAILURE TO SUBMIT A TRANSLATION OF THE DESCRIPTION OR TO PAY THE FEE WITHIN THE PRESCRIBED TIME-LIMIT Effective date: 20171206 Ref country code: SK Free format text: LAPSE BECAUSE OF FAILURE TO SUBMIT A TRANSLATION OF THE DESCRIPTION OR TO PAY THE FEE WITHIN THE PRESCRIBED TIME-LIMIT Effective date: 20171206 |
|
| PG25 | Lapsed in a contracting state [announced via postgrant information from national office to epo] |
Ref country code: AT Free format text: LAPSE BECAUSE OF FAILURE TO SUBMIT A TRANSLATION OF THE DESCRIPTION OR TO PAY THE FEE WITHIN THE PRESCRIBED TIME-LIMIT Effective date: 20171206 Ref country code: RO Free format text: LAPSE BECAUSE OF FAILURE TO SUBMIT A TRANSLATION OF THE DESCRIPTION OR TO PAY THE FEE WITHIN THE PRESCRIBED TIME-LIMIT Effective date: 20171206 Ref country code: SM Free format text: LAPSE BECAUSE OF FAILURE TO SUBMIT A TRANSLATION OF THE DESCRIPTION OR TO PAY THE FEE WITHIN THE PRESCRIBED TIME-LIMIT Effective date: 20171206 Ref country code: PL Free format text: LAPSE BECAUSE OF FAILURE TO SUBMIT A TRANSLATION OF THE DESCRIPTION OR TO PAY THE FEE WITHIN THE PRESCRIBED TIME-LIMIT Effective date: 20171206 Ref country code: IT Free format text: LAPSE BECAUSE OF FAILURE TO SUBMIT A TRANSLATION OF THE DESCRIPTION OR TO PAY THE FEE WITHIN THE PRESCRIBED TIME-LIMIT Effective date: 20171206 |
|
| REG | Reference to a national code |
Ref country code: DE Ref legal event code: R097 Ref document number: 602012040675 Country of ref document: DE |
|
| PLBE | No opposition filed within time limit |
Free format text: ORIGINAL CODE: 0009261 |
|
| STAA | Information on the status of an ep patent application or granted ep patent |
Free format text: STATUS: NO OPPOSITION FILED WITHIN TIME LIMIT |
|
| 26N | No opposition filed |
Effective date: 20180907 |
|
| PG25 | Lapsed in a contracting state [announced via postgrant information from national office to epo] |
Ref country code: DK Free format text: LAPSE BECAUSE OF FAILURE TO SUBMIT A TRANSLATION OF THE DESCRIPTION OR TO PAY THE FEE WITHIN THE PRESCRIBED TIME-LIMIT Effective date: 20171206 Ref country code: SI Free format text: LAPSE BECAUSE OF FAILURE TO SUBMIT A TRANSLATION OF THE DESCRIPTION OR TO PAY THE FEE WITHIN THE PRESCRIBED TIME-LIMIT Effective date: 20171206 |
|
| REG | Reference to a national code |
Ref country code: CH Ref legal event code: PL |
|
| GBPC | Gb: european patent ceased through non-payment of renewal fee |
Effective date: 20180711 |
|
| PG25 | Lapsed in a contracting state [announced via postgrant information from national office to epo] |
Ref country code: LU Free format text: LAPSE BECAUSE OF NON-PAYMENT OF DUE FEES Effective date: 20180711 Ref country code: MC Free format text: LAPSE BECAUSE OF FAILURE TO SUBMIT A TRANSLATION OF THE DESCRIPTION OR TO PAY THE FEE WITHIN THE PRESCRIBED TIME-LIMIT Effective date: 20171206 |
|
| REG | Reference to a national code |
Ref country code: BE Ref legal event code: MM Effective date: 20180731 |
|
| REG | Reference to a national code |
Ref country code: IE Ref legal event code: MM4A |
|
| PG25 | Lapsed in a contracting state [announced via postgrant information from national office to epo] |
Ref country code: GB Free format text: LAPSE BECAUSE OF NON-PAYMENT OF DUE FEES Effective date: 20180711 Ref country code: CH Free format text: LAPSE BECAUSE OF NON-PAYMENT OF DUE FEES Effective date: 20180731 Ref country code: LI Free format text: LAPSE BECAUSE OF NON-PAYMENT OF DUE FEES Effective date: 20180731 Ref country code: FR Free format text: LAPSE BECAUSE OF NON-PAYMENT OF DUE FEES Effective date: 20180731 Ref country code: IE Free format text: LAPSE BECAUSE OF NON-PAYMENT OF DUE FEES Effective date: 20180711 |
|
| PG25 | Lapsed in a contracting state [announced via postgrant information from national office to epo] |
Ref country code: BE Free format text: LAPSE BECAUSE OF NON-PAYMENT OF DUE FEES Effective date: 20180731 |
|
| PG25 | Lapsed in a contracting state [announced via postgrant information from national office to epo] |
Ref country code: MT Free format text: LAPSE BECAUSE OF NON-PAYMENT OF DUE FEES Effective date: 20180711 |
|
| PG25 | Lapsed in a contracting state [announced via postgrant information from national office to epo] |
Ref country code: TR Free format text: LAPSE BECAUSE OF FAILURE TO SUBMIT A TRANSLATION OF THE DESCRIPTION OR TO PAY THE FEE WITHIN THE PRESCRIBED TIME-LIMIT Effective date: 20171206 |
|
| PG25 | Lapsed in a contracting state [announced via postgrant information from national office to epo] |
Ref country code: PT Free format text: LAPSE BECAUSE OF FAILURE TO SUBMIT A TRANSLATION OF THE DESCRIPTION OR TO PAY THE FEE WITHIN THE PRESCRIBED TIME-LIMIT Effective date: 20171206 Ref country code: HU Free format text: LAPSE BECAUSE OF FAILURE TO SUBMIT A TRANSLATION OF THE DESCRIPTION OR TO PAY THE FEE WITHIN THE PRESCRIBED TIME-LIMIT; INVALID AB INITIO Effective date: 20120711 |
|
| PG25 | Lapsed in a contracting state [announced via postgrant information from national office to epo] |
Ref country code: MK Free format text: LAPSE BECAUSE OF NON-PAYMENT OF DUE FEES Effective date: 20171206 Ref country code: CY Free format text: LAPSE BECAUSE OF FAILURE TO SUBMIT A TRANSLATION OF THE DESCRIPTION OR TO PAY THE FEE WITHIN THE PRESCRIBED TIME-LIMIT Effective date: 20171206 |
|
| PG25 | Lapsed in a contracting state [announced via postgrant information from national office to epo] |
Ref country code: AL Free format text: LAPSE BECAUSE OF FAILURE TO SUBMIT A TRANSLATION OF THE DESCRIPTION OR TO PAY THE FEE WITHIN THE PRESCRIBED TIME-LIMIT Effective date: 20171206 Ref country code: IS Free format text: LAPSE BECAUSE OF FAILURE TO SUBMIT A TRANSLATION OF THE DESCRIPTION OR TO PAY THE FEE WITHIN THE PRESCRIBED TIME-LIMIT Effective date: 20180406 |
|
| P01 | Opt-out of the competence of the unified patent court (upc) registered |
Effective date: 20230528 |
|
| PGFP | Annual fee paid to national office [announced via postgrant information from national office to epo] |
Ref country code: DE Payment date: 20230719 Year of fee payment: 12 |