EP1418238A1 - Dispositif et procede d'analyse de microbes - Google Patents
Dispositif et procede d'analyse de microbes Download PDFInfo
- Publication number
- EP1418238A1 EP1418238A1 EP02751628A EP02751628A EP1418238A1 EP 1418238 A1 EP1418238 A1 EP 1418238A1 EP 02751628 A EP02751628 A EP 02751628A EP 02751628 A EP02751628 A EP 02751628A EP 1418238 A1 EP1418238 A1 EP 1418238A1
- Authority
- EP
- European Patent Office
- Prior art keywords
- sample
- microbe
- excitation light
- fluorescence
- fluorescent
- Prior art date
- Legal status (The legal status is an assumption and is not a legal conclusion. Google has not performed a legal analysis and makes no representation as to the accuracy of the status listed.)
- Withdrawn
Links
- 238000000034 method Methods 0.000 title claims description 140
- 230000005284 excitation Effects 0.000 claims abstract description 175
- 238000007689 inspection Methods 0.000 claims abstract description 84
- 238000002189 fluorescence spectrum Methods 0.000 claims description 79
- 238000012360 testing method Methods 0.000 claims description 68
- 239000007850 fluorescent dye Substances 0.000 claims description 51
- 238000009826 distribution Methods 0.000 claims description 27
- 230000001678 irradiating effect Effects 0.000 claims description 17
- FWBHETKCLVMNFS-UHFFFAOYSA-N 4',6-Diamino-2-phenylindol Chemical compound C1=CC(C(=N)N)=CC=C1C1=CC2=CC=C(C(N)=N)C=C2N1 FWBHETKCLVMNFS-UHFFFAOYSA-N 0.000 claims description 14
- 238000002360 preparation method Methods 0.000 claims description 10
- 238000010186 staining Methods 0.000 claims description 9
- MHMNJMPURVTYEJ-UHFFFAOYSA-N fluorescein-5-isothiocyanate Chemical compound O1C(=O)C2=CC(N=C=S)=CC=C2C21C1=CC=C(O)C=C1OC1=CC(O)=CC=C21 MHMNJMPURVTYEJ-UHFFFAOYSA-N 0.000 claims description 8
- 239000000975 dye Substances 0.000 claims description 6
- 239000000298 carbocyanine Substances 0.000 claims description 5
- XMBWDFGMSWQBCA-UHFFFAOYSA-N hydrogen iodide Chemical compound I XMBWDFGMSWQBCA-UHFFFAOYSA-N 0.000 claims description 4
- WGTODYJZXSJIAG-UHFFFAOYSA-N tetramethylrhodamine chloride Chemical compound [Cl-].C=12C=CC(N(C)C)=CC2=[O+]C2=CC(N(C)C)=CC=C2C=1C1=CC=CC=C1C(O)=O WGTODYJZXSJIAG-UHFFFAOYSA-N 0.000 claims description 4
- MPLHNVLQVRSVEE-UHFFFAOYSA-N texas red Chemical compound [O-]S(=O)(=O)C1=CC(S(Cl)(=O)=O)=CC=C1C(C1=CC=2CCCN3CCCC(C=23)=C1O1)=C2C1=C(CCC1)C3=[N+]1CCCC3=C2 MPLHNVLQVRSVEE-UHFFFAOYSA-N 0.000 claims description 4
- 238000003860 storage Methods 0.000 claims description 3
- 239000000523 sample Substances 0.000 abstract description 143
- 239000012488 sample solution Substances 0.000 abstract description 24
- 238000012757 fluorescence staining Methods 0.000 abstract description 3
- 238000012545 processing Methods 0.000 description 113
- 239000012528 membrane Substances 0.000 description 33
- 235000019557 luminance Nutrition 0.000 description 21
- 238000005259 measurement Methods 0.000 description 20
- 238000010586 diagram Methods 0.000 description 18
- 235000013361 beverage Nutrition 0.000 description 11
- 210000004027 cell Anatomy 0.000 description 10
- 230000000813 microbial effect Effects 0.000 description 10
- 238000001514 detection method Methods 0.000 description 8
- 230000003287 optical effect Effects 0.000 description 8
- 238000001914 filtration Methods 0.000 description 7
- 230000000007 visual effect Effects 0.000 description 6
- 238000004458 analytical method Methods 0.000 description 5
- 235000013405 beer Nutrition 0.000 description 5
- 238000004519 manufacturing process Methods 0.000 description 5
- 108020004707 nucleic acids Proteins 0.000 description 5
- 102000039446 nucleic acids Human genes 0.000 description 5
- 150000007523 nucleic acids Chemical class 0.000 description 5
- 239000011148 porous material Substances 0.000 description 5
- 230000003252 repetitive effect Effects 0.000 description 5
- 238000010191 image analysis Methods 0.000 description 4
- 238000001228 spectrum Methods 0.000 description 4
- 238000007447 staining method Methods 0.000 description 4
- 108020004711 Nucleic Acid Probes Proteins 0.000 description 3
- 239000000427 antigen Substances 0.000 description 3
- 102000036639 antigens Human genes 0.000 description 3
- 108091007433 antigens Proteins 0.000 description 3
- 235000013305 food Nutrition 0.000 description 3
- 239000002853 nucleic acid probe Substances 0.000 description 3
- 238000003908 quality control method Methods 0.000 description 3
- 241000894006 Bacteria Species 0.000 description 2
- 241000606012 Pectinatus Species 0.000 description 2
- 240000004808 Saccharomyces cerevisiae Species 0.000 description 2
- 210000000349 chromosome Anatomy 0.000 description 2
- 239000002537 cosmetic Substances 0.000 description 2
- 238000012850 discrimination method Methods 0.000 description 2
- 229940079593 drug Drugs 0.000 description 2
- 239000003814 drug Substances 0.000 description 2
- 238000000605 extraction Methods 0.000 description 2
- 239000000835 fiber Substances 0.000 description 2
- 238000001215 fluorescent labelling Methods 0.000 description 2
- 239000001963 growth medium Substances 0.000 description 2
- 239000002609 medium Substances 0.000 description 2
- 238000011160 research Methods 0.000 description 2
- 241000894007 species Species 0.000 description 2
- 238000010200 validation analysis Methods 0.000 description 2
- 150000001720 carbohydrates Chemical class 0.000 description 1
- 239000003153 chemical reaction reagent Substances 0.000 description 1
- 230000000295 complement effect Effects 0.000 description 1
- 238000011161 development Methods 0.000 description 1
- 230000018109 developmental process Effects 0.000 description 1
- 230000007613 environmental effect Effects 0.000 description 1
- 230000002255 enzymatic effect Effects 0.000 description 1
- 238000001917 fluorescence detection Methods 0.000 description 1
- 230000012447 hatching Effects 0.000 description 1
- 238000003703 image analysis method Methods 0.000 description 1
- 239000008235 industrial water Substances 0.000 description 1
- 239000004615 ingredient Substances 0.000 description 1
- 150000002632 lipids Chemical class 0.000 description 1
- 239000007788 liquid Substances 0.000 description 1
- QSHDDOUJBYECFT-UHFFFAOYSA-N mercury Chemical compound [Hg] QSHDDOUJBYECFT-UHFFFAOYSA-N 0.000 description 1
- 229910052753 mercury Inorganic materials 0.000 description 1
- 238000007781 pre-processing Methods 0.000 description 1
- 238000003672 processing method Methods 0.000 description 1
- 102000004169 proteins and genes Human genes 0.000 description 1
- 108090000623 proteins and genes Proteins 0.000 description 1
- 239000002344 surface layer Substances 0.000 description 1
- 230000008685 targeting Effects 0.000 description 1
- 239000002351 wastewater Substances 0.000 description 1
- XLYOFNOQVPJJNP-UHFFFAOYSA-N water Substances O XLYOFNOQVPJJNP-UHFFFAOYSA-N 0.000 description 1
- 229910052724 xenon Inorganic materials 0.000 description 1
- FHNFHKCVQCLJFQ-UHFFFAOYSA-N xenon atom Chemical compound [Xe] FHNFHKCVQCLJFQ-UHFFFAOYSA-N 0.000 description 1
Images


Classifications
-
- C—CHEMISTRY; METALLURGY
- C12—BIOCHEMISTRY; BEER; SPIRITS; WINE; VINEGAR; MICROBIOLOGY; ENZYMOLOGY; MUTATION OR GENETIC ENGINEERING
- C12Q—MEASURING OR TESTING PROCESSES INVOLVING ENZYMES, NUCLEIC ACIDS OR MICROORGANISMS; COMPOSITIONS OR TEST PAPERS THEREFOR; PROCESSES OF PREPARING SUCH COMPOSITIONS; CONDITION-RESPONSIVE CONTROL IN MICROBIOLOGICAL OR ENZYMOLOGICAL PROCESSES
- C12Q1/00—Measuring or testing processes involving enzymes, nucleic acids or microorganisms; Compositions therefor; Processes of preparing such compositions
- C12Q1/02—Measuring or testing processes involving enzymes, nucleic acids or microorganisms; Compositions therefor; Processes of preparing such compositions involving viable microorganisms
-
- G—PHYSICS
- G01—MEASURING; TESTING
- G01N—INVESTIGATING OR ANALYSING MATERIALS BY DETERMINING THEIR CHEMICAL OR PHYSICAL PROPERTIES
- G01N15/00—Investigating characteristics of particles; Investigating permeability, pore-volume or surface-area of porous materials
- G01N15/10—Investigating individual particles
- G01N15/14—Optical investigation techniques, e.g. flow cytometry
- G01N15/1456—Optical investigation techniques, e.g. flow cytometry without spatial resolution of the texture or inner structure of the particle, e.g. processing of pulse signals
- G01N15/1459—Optical investigation techniques, e.g. flow cytometry without spatial resolution of the texture or inner structure of the particle, e.g. processing of pulse signals the analysis being performed on a sample stream
-
- C—CHEMISTRY; METALLURGY
- C12—BIOCHEMISTRY; BEER; SPIRITS; WINE; VINEGAR; MICROBIOLOGY; ENZYMOLOGY; MUTATION OR GENETIC ENGINEERING
- C12Q—MEASURING OR TESTING PROCESSES INVOLVING ENZYMES, NUCLEIC ACIDS OR MICROORGANISMS; COMPOSITIONS OR TEST PAPERS THEREFOR; PROCESSES OF PREPARING SUCH COMPOSITIONS; CONDITION-RESPONSIVE CONTROL IN MICROBIOLOGICAL OR ENZYMOLOGICAL PROCESSES
- C12Q1/00—Measuring or testing processes involving enzymes, nucleic acids or microorganisms; Compositions therefor; Processes of preparing such compositions
- C12Q1/02—Measuring or testing processes involving enzymes, nucleic acids or microorganisms; Compositions therefor; Processes of preparing such compositions involving viable microorganisms
- C12Q1/04—Determining presence or kind of microorganism; Use of selective media for testing antibiotics or bacteriocides; Compositions containing a chemical indicator therefor
-
- G—PHYSICS
- G01—MEASURING; TESTING
- G01J—MEASUREMENT OF INTENSITY, VELOCITY, SPECTRAL CONTENT, POLARISATION, PHASE OR PULSE CHARACTERISTICS OF INFRARED, VISIBLE OR ULTRAVIOLET LIGHT; COLORIMETRY; RADIATION PYROMETRY
- G01J3/00—Spectrometry; Spectrophotometry; Monochromators; Measuring colours
- G01J3/28—Investigating the spectrum
- G01J3/44—Raman spectrometry; Scattering spectrometry ; Fluorescence spectrometry
- G01J3/4406—Fluorescence spectrometry
-
- G—PHYSICS
- G01—MEASURING; TESTING
- G01N—INVESTIGATING OR ANALYSING MATERIALS BY DETERMINING THEIR CHEMICAL OR PHYSICAL PROPERTIES
- G01N21/00—Investigating or analysing materials by the use of optical means, i.e. using sub-millimetre waves, infrared, visible or ultraviolet light
- G01N21/62—Systems in which the material investigated is excited whereby it emits light or causes a change in wavelength of the incident light
- G01N21/63—Systems in which the material investigated is excited whereby it emits light or causes a change in wavelength of the incident light optically excited
- G01N21/64—Fluorescence; Phosphorescence
- G01N21/6428—Measuring fluorescence of fluorescent products of reactions or of fluorochrome labelled reactive substances, e.g. measuring quenching effects, using measuring "optrodes"
-
- G—PHYSICS
- G01—MEASURING; TESTING
- G01N—INVESTIGATING OR ANALYSING MATERIALS BY DETERMINING THEIR CHEMICAL OR PHYSICAL PROPERTIES
- G01N21/00—Investigating or analysing materials by the use of optical means, i.e. using sub-millimetre waves, infrared, visible or ultraviolet light
- G01N21/62—Systems in which the material investigated is excited whereby it emits light or causes a change in wavelength of the incident light
- G01N21/63—Systems in which the material investigated is excited whereby it emits light or causes a change in wavelength of the incident light optically excited
- G01N21/64—Fluorescence; Phosphorescence
- G01N21/645—Specially adapted constructive features of fluorimeters
- G01N21/6456—Spatial resolved fluorescence measurements; Imaging
- G01N21/6458—Fluorescence microscopy
-
- G—PHYSICS
- G01—MEASURING; TESTING
- G01N—INVESTIGATING OR ANALYSING MATERIALS BY DETERMINING THEIR CHEMICAL OR PHYSICAL PROPERTIES
- G01N33/00—Investigating or analysing materials by specific methods not covered by groups G01N1/00 - G01N31/00
- G01N33/02—Food
- G01N33/14—Beverages
- G01N33/146—Beverages containing alcohol
-
- G—PHYSICS
- G01—MEASURING; TESTING
- G01N—INVESTIGATING OR ANALYSING MATERIALS BY DETERMINING THEIR CHEMICAL OR PHYSICAL PROPERTIES
- G01N33/00—Investigating or analysing materials by specific methods not covered by groups G01N1/00 - G01N31/00
- G01N33/48—Biological material, e.g. blood, urine; Haemocytometers
- G01N33/50—Chemical analysis of biological material, e.g. blood, urine; Testing involving biospecific ligand binding methods; Immunological testing
- G01N33/53—Immunoassay; Biospecific binding assay; Materials therefor
- G01N33/569—Immunoassay; Biospecific binding assay; Materials therefor for microorganisms, e.g. protozoa, bacteria, viruses
-
- G—PHYSICS
- G01—MEASURING; TESTING
- G01N—INVESTIGATING OR ANALYSING MATERIALS BY DETERMINING THEIR CHEMICAL OR PHYSICAL PROPERTIES
- G01N1/00—Sampling; Preparing specimens for investigation
- G01N1/28—Preparing specimens for investigation including physical details of (bio-)chemical methods covered elsewhere, e.g. G01N33/50, C12Q
- G01N1/30—Staining; Impregnating ; Fixation; Dehydration; Multistep processes for preparing samples of tissue, cell or nucleic acid material and the like for analysis
-
- G—PHYSICS
- G01—MEASURING; TESTING
- G01N—INVESTIGATING OR ANALYSING MATERIALS BY DETERMINING THEIR CHEMICAL OR PHYSICAL PROPERTIES
- G01N15/00—Investigating characteristics of particles; Investigating permeability, pore-volume or surface-area of porous materials
- G01N15/10—Investigating individual particles
- G01N15/14—Optical investigation techniques, e.g. flow cytometry
- G01N15/1429—Signal processing
- G01N15/1433—Signal processing using image recognition
-
- G—PHYSICS
- G01—MEASURING; TESTING
- G01N—INVESTIGATING OR ANALYSING MATERIALS BY DETERMINING THEIR CHEMICAL OR PHYSICAL PROPERTIES
- G01N15/00—Investigating characteristics of particles; Investigating permeability, pore-volume or surface-area of porous materials
- G01N15/01—Investigating characteristics of particles; Investigating permeability, pore-volume or surface-area of porous materials specially adapted for biological cells, e.g. blood cells
- G01N2015/019—Biological contaminants; Fouling
-
- G—PHYSICS
- G01—MEASURING; TESTING
- G01N—INVESTIGATING OR ANALYSING MATERIALS BY DETERMINING THEIR CHEMICAL OR PHYSICAL PROPERTIES
- G01N21/00—Investigating or analysing materials by the use of optical means, i.e. using sub-millimetre waves, infrared, visible or ultraviolet light
- G01N21/62—Systems in which the material investigated is excited whereby it emits light or causes a change in wavelength of the incident light
- G01N21/63—Systems in which the material investigated is excited whereby it emits light or causes a change in wavelength of the incident light optically excited
- G01N21/64—Fluorescence; Phosphorescence
- G01N2021/6417—Spectrofluorimetric devices
- G01N2021/6419—Excitation at two or more wavelengths
-
- G—PHYSICS
- G01—MEASURING; TESTING
- G01N—INVESTIGATING OR ANALYSING MATERIALS BY DETERMINING THEIR CHEMICAL OR PHYSICAL PROPERTIES
- G01N21/00—Investigating or analysing materials by the use of optical means, i.e. using sub-millimetre waves, infrared, visible or ultraviolet light
- G01N21/62—Systems in which the material investigated is excited whereby it emits light or causes a change in wavelength of the incident light
- G01N21/63—Systems in which the material investigated is excited whereby it emits light or causes a change in wavelength of the incident light optically excited
- G01N21/64—Fluorescence; Phosphorescence
- G01N2021/6417—Spectrofluorimetric devices
- G01N2021/6421—Measuring at two or more wavelengths
-
- G—PHYSICS
- G01—MEASURING; TESTING
- G01N—INVESTIGATING OR ANALYSING MATERIALS BY DETERMINING THEIR CHEMICAL OR PHYSICAL PROPERTIES
- G01N21/00—Investigating or analysing materials by the use of optical means, i.e. using sub-millimetre waves, infrared, visible or ultraviolet light
- G01N21/62—Systems in which the material investigated is excited whereby it emits light or causes a change in wavelength of the incident light
- G01N21/63—Systems in which the material investigated is excited whereby it emits light or causes a change in wavelength of the incident light optically excited
- G01N21/64—Fluorescence; Phosphorescence
- G01N2021/6417—Spectrofluorimetric devices
- G01N2021/6423—Spectral mapping, video display
-
- G—PHYSICS
- G01—MEASURING; TESTING
- G01N—INVESTIGATING OR ANALYSING MATERIALS BY DETERMINING THEIR CHEMICAL OR PHYSICAL PROPERTIES
- G01N21/00—Investigating or analysing materials by the use of optical means, i.e. using sub-millimetre waves, infrared, visible or ultraviolet light
- G01N21/62—Systems in which the material investigated is excited whereby it emits light or causes a change in wavelength of the incident light
- G01N21/63—Systems in which the material investigated is excited whereby it emits light or causes a change in wavelength of the incident light optically excited
- G01N21/64—Fluorescence; Phosphorescence
- G01N21/6428—Measuring fluorescence of fluorescent products of reactions or of fluorochrome labelled reactive substances, e.g. measuring quenching effects, using measuring "optrodes"
- G01N2021/6439—Measuring fluorescence of fluorescent products of reactions or of fluorochrome labelled reactive substances, e.g. measuring quenching effects, using measuring "optrodes" with indicators, stains, dyes, tags, labels, marks
- G01N2021/6441—Measuring fluorescence of fluorescent products of reactions or of fluorochrome labelled reactive substances, e.g. measuring quenching effects, using measuring "optrodes" with indicators, stains, dyes, tags, labels, marks with two or more labels
-
- G—PHYSICS
- G01—MEASURING; TESTING
- G01N—INVESTIGATING OR ANALYSING MATERIALS BY DETERMINING THEIR CHEMICAL OR PHYSICAL PROPERTIES
- G01N21/00—Investigating or analysing materials by the use of optical means, i.e. using sub-millimetre waves, infrared, visible or ultraviolet light
- G01N21/62—Systems in which the material investigated is excited whereby it emits light or causes a change in wavelength of the incident light
- G01N21/63—Systems in which the material investigated is excited whereby it emits light or causes a change in wavelength of the incident light optically excited
- G01N21/64—Fluorescence; Phosphorescence
- G01N21/645—Specially adapted constructive features of fluorimeters
- G01N2021/6463—Optics
- G01N2021/6471—Special filters, filter wheel
-
- G—PHYSICS
- G01—MEASURING; TESTING
- G01N—INVESTIGATING OR ANALYSING MATERIALS BY DETERMINING THEIR CHEMICAL OR PHYSICAL PROPERTIES
- G01N21/00—Investigating or analysing materials by the use of optical means, i.e. using sub-millimetre waves, infrared, visible or ultraviolet light
- G01N21/84—Systems specially adapted for particular applications
- G01N2021/8411—Application to online plant, process monitoring
Definitions
- the present invention relates to a microbe inspection equipment and method and, more particularly, to a microbe inspection equipment and method which capture microbes and the like contained in, for example, a sample solution with a filter, fluorescent-stains the captured microbes, and automatically identify and display the microbe and others by using a microscope.
- microbe tests in manufacturing process control, product quality control, and the like for beverages like beer, foods, medicines, cosmetics, and the like have been conducted by cultivation tests which require a large variety of culture media, and have taken many days to complete.
- test results e.g., whether any microbes are present in a test target, the number of microbes, and identification of microbe species in the test target, resulting in placing large restrictions on the research, development, manufacturing, or shipping stages in various kinds of fields.
- Known methods of quickly measuring microbes include, for example, an impedance method (Brown, D., Warner, M., Taylor, C., and Warren, R., Clin. Pthol., 37, 65 - 69 (1984)), an enzyme-fluorescence detection method (Japanese Patent Laid-Open No. 58-116700), a PCR method, a DEFT method as a combination of a membrane. filter method and a epifluorescent microscope method (G.L. PETTIPHER, UBALDINAM. RODRIGUES, J. Appl. Bacteriol.
- Another known method is to separate microbes and the like by filtering the microbes existing in a sample solution, fluorescent-stain the sample containing the obtained microbes, and allow an observer to identify the microbes and others while visually observing the sample with a epifluorescent microscope.
- the observer since the observer identifies microbes and others while visually observing fluorescent images generated from a fluorescence-stained sample, the measurement result may contain errors due to misidentification by the person who makes measurement. In addition, it has been impossible to identify microbes and others in an unmanned fashion.
- the present invention has been made to solve the above problems in the prior art, and has as its object to provide a microbe inspection equipment and method which can automatically and quickly identify microbes in a sample as a test target.
- a testing method has the following arrangement.
- a testing method of testing a microbe contained in a sample characterized by comprising an irradiation step of irradiating the sample with a plurality of excitation light beams having different wavelengths, and an identification step of identifying a microbe contained in the sample on the basis of a distribution of peaks of fluorescence obtained from each object contained in the sample in correspondence with irradiation with the plurality of excitation light beams.
- the method further comprises an inspection step of specifying a fluorescent object that can be a microbe on the basis of fluorescence intensities or shapes of fluorescent objects obtained from the respective objects, and in the identification step, a distribution of peaks of the fluorescence is obtained by using the fluorescent object specified in the inspection step.
- the sample is sequentially or simultaneously irradiated with the plurality of excitation light beams having different wavelengths.
- fluorescence obtained from each object contained in the sample has not less than one peak, and in the identification step, a microbe contained in the sample is identified on the basis of each peak wavelength or frequency of fluorescence obtained from each object contained in the sample.
- each peak wavelength or frequency of fluorescence obtained from each of the objects is collated with determination criteria defined in advance in correspondence with the plurality of excitation light beams to determine whether or not each of the objects is a microbe.
- the microbe is preferably a specific microbe.
- fluorescence obtained from each object contained in the sample has not less than one peak, and in the identification step, a microbe contained in the sample is identified on the basis of a fluorescence spectrum obtained from each object contained in the sample.
- a fluorescence spectrum obtained from each of the object is collated with determination fluorescence spectra defined in advance in correspondence with the plurality of excitation light beams to determine whether or not each of the objects is a microbe.
- the microbe is preferably a specific microbe.
- the testing method comprises a primary inspection step, and a secondary inspection step
- a fluorescent object contained in the sample is specified by observing an entire region of the sample at a first magnification while irradiating the sample with the excitation light
- the irradiation step and the identification step are executed, and a distribution of peaks of fluorescence from each of the fluorescent objects is obtained while each fluorescent object specified in the primary inspection step is observed at a second magnification higher than the first magnification.
- the testing method comprises a primary inspection step, and a secondary inspection step
- a target microbe is separated from microbes other than the target microbe among fluorescent objects contained in the sample by observing an entire region of the sample at a first magnification while irradiating the sample with the excitation light
- the irradiation step and the identification step are executed, and a distribution of peaks of fluorescence from each of the target microbes is obtained while each target microbe extracted in the primary inspection step is observed at a second magnification higher than the first magnification.
- the method further comprises a sample preparation step of capturing a microbe contained in the sample on a filter, and staining objects including the microbe captured on the filter with a fluorescent dye.
- the method further comprises a sample preparation step of capturing a microbe contained in the sample on a filter, and staining the microbe captured on the filter with a fluorescent dye such that the microbe captured on the filter has a peak in not less than one fluorescence upon irradiation of excitation light including not less than two wavelengths.
- excitation light including not less than two wavelengths
- not less than two excitation light beams selected from excitation light beams having wavelengths falling within a range of 340 nm to 750 nm at maximum intensities are preferably used.
- fluorescent dye not less than one fluorescent dye selected from the group consisting of Texas Red, tetramethylrhodamine, indo-carbocyanine dye, Alexa dye, 4',6-diamidino-2-phenylindole (DAPI), providium iodide, and fluorescein isothiocyanate (FITC) is preferably used.
- the method further comprises a sample preparation step of capturing a microbe contained in the sample on a filter, and staining the microbe captured on the filter with different kinds of fluorescent dyes such that the microbe captured on the filter has a peak in not less than two fluorescences upon irradiation of excitation light including not less than three wavelengths.
- excitation light including not less than three wavelengths
- excitation light beams selected from excitation light beams having wavelengths falling within a range of 340 nm to 750 nm at maximum intensities are preferably used.
- fluorescent dye not less than two fluorescent dye selected from the group consisting of Texas Red, tetramethylrhodamine, indo-carbocyanine dye, Alexa dye, 4',6-diamidino-2-phenylindole (DAPI), providium iodide, and fluorescein isothiocyanate (FITC) are preferably used.
- an inspection equipment for testing a microbe contained in a sample, characterized by comprising an irradiation mechanism which irradiates the sample with a plurality of excitation light beams having different wavelengths, an image sensing device which image-senses the sample, and an analyzing device which analyzes an image sensing result obtained by the image sensing device, wherein the analyzing device is configured to identify, on the basis of the image sensing result, a microbe contained in the sample on the basis of a distribution of peaks of fluorescence obtained from each object contained in the sample in correspondence with irradiation with the plurality of excitation light beams.
- the analyzing device further comprises a testing unit which specifies a fluorescent object that can be a microbe on the basis of fluorescence intensities or shapes of fluorescent objects obtained from the respective objects, and the analyzing device obtains a distribution of peaks of the fluorescence by using the fluorescent object specified by the testing unit.
- an inspection equipment for testing a microbe contained in a sample, characterized by comprising an input device which receives a result obtained by image-sensing the sample while irradiating the sample with a plurality of excitation light beams having different wavelengths, and an analyzing device which identifies a microbe contained in the sample on the basis of a distribution of peaks of fluorescence obtained from each object contained in the sample in correspondence with the plurality of excitation light beams in accordance with the image sensing result received by the input device.
- the irradiation mechanism sequentially or simultaneously irradiates the sample with the plurality of excitation light beams having different wavelengths.
- fluorescence obtained from each object contained in the sample has not less than one peak
- the analyzing device identifies a microbe contained in the sample on the basis of each peak wavelength or frequency of fluorescence obtained from each object contained in the sample.
- the analyzing device preferably collates each peak wavelength or frequency of fluorescence obtained from each of the objects with determination criteria defined in advance in correspondence with the plurality of excitation light beams to determine whether or not each of the objects is a microbe.
- fluorescence obtained from each object contained in the sample has not less than one peak
- the analyzing device identifies a microbe contained in the sample on the basis of a fluorescence spectrum obtained from each object contained in the sample.
- the analyzing device preferably collates a fluorescence spectrum obtained from each of the object with determination fluorescence spectra defined in advance in correspondence with the plurality of excitation light beams to determine whether or not each of the objects is a microbe.
- the inspection equipment further comprises a control device which controls the irradiation mechanism and the image sensing device, the control device performing control to image-sense an entire region of the sample by using the image sensing device at a first magnification while irradiating the sample with the excitation light by using the irradiation mechanism and specify a fluorescent object contained in the sample by analyzing an image sensing result obtained by the image sensing device by using the analyzing device, and then performing control to image-sense only each of the specified fluorescent objects by using the image sensing device at a second magnification higher than the first magnification while irradiating each of the specified fluorescent objects with the excitation light by using the irradiation mechanism and obtain a distribution of peaks of fluorescence from each of the fluorescent dyes by analyzing an image sensing result obtained by the image sensing device by using the analyzing device.
- a control device which controls the irradiation mechanism and the image sensing device, the control device performing control to image-sense an entire region of the sample by using the
- the testing further comprises a control device which controls the irradiation mechanism, the image sensing device, and the analyzing device, the control device performing control to image-sense an entire region of the sample by using the image sensing device at a first magnification while irradiating the sample with the excitation light by using the irradiation mechanism and extract a target microbe, among fluorescent objects contained in the sample, while separating the target microbe from a microbe other than the target microbe by analyzing an image sensing result obtained by the image sensing device by using the analyzing device, and performing control to image-sense each of the extracted target microbes by using the image sensing device at a second magnification higher than the first magnification and obtain a distribution of peaks of fluorescence from the target microbe by analyzing an image sensing result obtained by the image sensing device by using the analyzing device.
- a control device which controls the irradiation mechanism, the image sensing device, and the analyzing device, the control device performing control to image-sense an entire
- the plurality of excitation light beams not less than two excitation light beams selected from excitation light beams having wavelengths falling within a range of 340 nm to 750 nm at maximum intensities are preferably used.
- the image sensing device further comprises a motor-driven stage
- the control device controls the image sensing device to image-sense an entire region of the sample while controlling the motor-driven stage to scan the entire region of the sample.
- the image sensing device comprises an objective lens and an equation which is set in advance to keep a distance between the objective lens and a surface of the filter constant
- the control device controls the image sensing device on the basis of the equation to image-sense the entire region of the sample while keeping the distance between the objective lens and the surface of the filter constant so as not to cause an out-of-focus state during the scanning.
- a control program which controls an inspection equipment for testing a microbe contained in a sample, characterized by comprising an identification step of, when the inspection equipment irradiates the sample with a plurality of excitation light beams having different wavelengths, identifying a microbe contained in the sample on the basis of a distribution of peaks of fluorescence obtained from each object contained in the sample in correspondence with irradiation with the plurality of excitation light beams.
- a computer-readable storage medium storing a control program which controls an inspection equipment for testing a microbe contained in a sample, characterized in that the control program comprises an identification step of, when the inspection equipment irradiates the sample with a plurality of excitation light beams having different wavelengths, identifying a microbe contained in the sample on the basis of a distribution of peaks of fluorescence obtained from each object contained in the sample in correspondence with irradiation with the plurality of excitation light beams.
- the microbe testing method and equipment having the above arrangements irradiate a sample with excitation light beams of two or three or more wavelengths, and compare a plurality of fluorescent images obtained in correspondence with the respective excitation light beams, thereby automatically identifying microbes contaminated in a sample solution. This makes it possible to shorten the testing time and prevent measurement errors due to human errors.
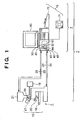
- FIG. 1 shows a outline for explaining the overall arrangement of the microbe inspection equipment 1.
- Fig. 2 shows a outline for explaining control on each component of the microbe inspection equipment 1.
- the microbe inspection equipment 1 is comprised of a epifluorescent microscope 2 and image analyzing unit 3.
- the epifluorescent microscope 2 has a epifluorescent microscope body 10 which magnifies a sample containing microbes for observation and an image capturing unit 21 (e.g., a monochrome or color camera such as a cooled CCD camera) for photoelectrically converting the magnified image.
- the image capturing unit 21 is controlled (23) by the image analyzing unit 3.
- Image data 22 obtained by the image capturing unit 21 is transmitted to the image analyzing unit 3.
- a computing unit 50 and identifying unit 44 analyze the image data 22 to identify microbes contained in the sample.
- a sample containing microbes is, for example, a beverage such as beer, which basically should contain no microbes or debris other than microbes (test sample solution).
- a sample containing microbes is a sample extracted from a test sample solution in a predetermined amount to check in the manufacturing process or the like whether microbes or debris other than microbes are contaminated in the solution.
- a sample extracted from a test sample solution to be used in the microbe inspection equipment 1 is prepared in the following steps: filtering the test sample solution with a filtering unit using a membrane filter, capturing microbes and debris other than microbes on the membrane filter, removing the membrane filter from the filtering unit, and applying fluorescent dyes to the membrane filter which has captured microbes and others to stain the microbes in the sample with the fluorescent dyes. Note that one or a plurality of fluorescent dyes are used to stain microbes in a sample, as needed.
- the optical microscope 10 includes a microscope motor-driven stage 16 on which a sample containing fluorescence-stained microbes is to be placed, an electric focus motor 17, a light source unit 18 which intensely fluorescence-labels a target microbe by irradiating the sample with excitation light emitted from a high-output mercury lamp, xenon lamp, or the like, a fluorescence filter block switching unit 19 having filters which are placed in an optical path from the light source unit 18 to the microscope motor-driven stage 16 to select one or a plurality of specific wavelengths of those of excitation light beams and select one or a plurality of specific wavelengths of those of fluorescences emitted from the sample upon irradiation with the excitation light, and a lens switching unit 20 which switches objective lenses.
- the optical microscope 10 sequentially irradiates the sample with a plurality of excitation light beams having different specific wavelengths.
- the optical microscope 10 can detect the respective fluorescences obtained in accordance with the respective excitation light beams by sequentially switching the filters of the fluorescence filter block switching unit 19.
- the optical microscope 10 may simultaneously irradiate the sample with a plurality of excitation light beams having different specific wavelengths.
- the optical microscope 10 sends measurement information 24 including current conditions, e.g., a lens, filter, stage position, and focus position, to the image analyzing unit 3.
- current conditions e.g., a lens, filter, stage position, and focus position
- the image analyzing unit 3 includes a control unit 40 which executes computation necessary for control on the electric focus motor 17 for the microscope motor-driven stage 16, the computing unit 50 which performs appropriate processing for the obtained image data 22 to automatically calculate feature information for identification of a microbe on the basis of each concatenated component of pixels (to be described later), an input unit 70 constituted by a keyboard 72 which inputs the definition of an inspection manner, a limit value used for determination on a microbe, and the like, a trackball 71 for stage focus movement, and the like, and a display unit 60 which displays the image-sensing result, various analysis results, and the like obtained by the optical microscope.
- a control unit 40 which executes computation necessary for control on the electric focus motor 17 for the microscope motor-driven stage 16
- the computing unit 50 which performs appropriate processing for the obtained image data 22 to automatically calculate feature information for identification of a microbe on the basis of each concatenated component of pixels (to be described later)
- an input unit 70 constituted by a keyboard 72 which inputs the definition
- the image analyzing unit 3 performs processing for each excitation light
- the fluorescent images emitted from fluorescent objects in the respective areas can be acquired by using excitation light beams having different specific wavelengths.
- they are stored in correspondence with the respective excitation light beams.
- the fluorescent images obtained by the respective excitation light beams are combined to form a fluorescence spectrum (or a peak wavelength).
- This fluorescence spectrum is then compared with a predetermined determination fluorescence spectrum (or determination criterion). This makes it possible to identify a target microbe, microbes other than the target, debris other than microbes, and the like.
- the determination fluorescence spectrum (or determination criterion) is stored in the image analyzing unit 3.
- the image analyzing unit 3 has an automatic fluorescence inspection function for controlling the respective steps from the measurement of a sample to analysis for identifying a microbe.
- This automatic fluorescence inspection function is executed by the CPU of the image analyzing unit 3 by using a RAM on the basis of the automatic fluorescence inspection program stored in the ROM of the image analyzing unit 3.
- the function includes a function of driving the microscope motor-driven stage 16 to scan the entire surface of a fluorescence-stained sample (e.g., a sample obtained by capturing a microbe on a membrane filter and fluorescence-staining it), a focus control function executed for each measurement visual field in synchronism with scanning on the entire surface of a sample, a function of storing a location in a sample from which a fluorescence signal is detected and allowing reconfirmation of the location by microscopic observation of a fluorescent object in the region after scanning on the sample (for example, a method of using a lens with a higher magnification than that in a primary entire scanning test, a method of applying one or more different excitation light beams in addition to excitation light used in a primary test, or a combination thereof, i.e., unmanned, automatic, visual Validation function), a function of automatically detecting a feature amount such as a fluorescence intensity or shape from each concatenated component in a captured image, and specifying
- the control unit 40 includes an motor-driven focus control unit 41 which always obtains correct focus by executing focus control following the movement of the microscope motor-driven stage 16 which moves a sample base for each predetermined area of a membrane filter, whose entire area is divided into predetermined areas, to sequentially irradiate the entire area of the membrane filter with excitation light, a motor-driven focus control unit 42 which drives the microscope motor-driven stage 16 to scan the entire surface of a sample containing microbes, a microscope/camera control unit 43, and an identifying unit 44 which identifies a microbe on the basis of the image data 22 transmitted from the image capturing unit 21.
- an motor-driven focus control unit 41 which always obtains correct focus by executing focus control following the movement of the microscope motor-driven stage 16 which moves a sample base for each predetermined area of a membrane filter, whose entire area is divided into predetermined areas, to sequentially irradiate the entire area of the membrane filter with excitation light
- a motor-driven focus control unit 42 which drives the microscope motor-driven
- the microscope/camera control unit 43 controls a light source shutter, lens switching, fluorescence filter block switching, exposure start timing, exposure time, and the like.
- Various kinds of control can be performed by using the control unit 40.
- the following control can be done: setting the optical microscope 10 to a low magnification by using a low-power lens, detecting and storing fluorescent objects by scanning the entire surface of a sample containing microbes while sequentially irradiating each region of the sample with excitation light having a specific wavelength (primary automatic identification), and precisely identifying the respective fluorescent objects while sequentially irradiating only regions, from which the fluorescent objects have been detected, with excitation light beams having one or two or more different specific wavelengths by using a high-power lens.
- the computing unit 50 which calculates a sample scanning region count in a domain of a fluorescent object to be measured which has a maximum diameter, includes an inspection region definition computing unit 51 and a predictive focus computing unit 52 which controls the microscope motor-driven stage 16 and electric focus motor 17 to set a focal point on a predetermined plane of a sample containing microbes in scanning the entire surface of the sample and always automatically achieve focus on the same plane (this method is sometimes referred to as a predictive focus method or the like).
- the predictive focus method is a method of setting in advance an equation (sample plane equation) for keeping the distance between a sample surface and an objective lens constant (constant in the Z direction) within a defined scanning range (a predetermined range in the X and Y directions) and automatically controlling a focal position according to the sample plane equation in accordance with scanning coordinates during measurement scanning.
- sample plane equation an equation for keeping the distance between a sample surface and an objective lens constant (constant in the Z direction) within a defined scanning range (a predetermined range in the X and Y directions) and automatically controlling a focal position according to the sample plane equation in accordance with scanning coordinates during measurement scanning.
- Primary automatic identification processing and secondary automatic identification processing can be performed by using a lens with any magnification. Assume, however, that in the following description, primary automatic identification processing is performed by using a low-power lens, and secondary automatic identification processing is performed by using high-power lens.
- Fig. 5 is a flow chart for explaining the steps in primary automatic identification processing for extracting the locations of fluorescent objects from the entire region of a sample.
- steps S91 to S93 correspond to preprocessing
- steps S94 to S99 correspond to primary automatic identification processing.
- This primary automatic identification processing is executed by the image analyzing unit 3 on the basis of an automatic fluorescence inspection program.
- a test sample solution is filtered by a filtering unit using a membrane filter having a predetermined filter diameter, e.g., 10 to 50 mm, to capture microbes and debris other than microbes on the membrane filter.
- step S92 the microbes captured on the membrane filter are stained with predetermined fluorescent dyes.
- a FISH method fluorescent antibody method, nucleic acid staining method, or enzymatic staining method is available.
- step S93 the membrane filter containing the stained sample is placed to the microscope motor-driven stage 16 of the microbe inspection equipment 1. This completes preparation of the sample from the test sample solution.
- step S94 the membrane filter containing the stained sample which is placed to the microscope motor-driven stage 16 is irradiated with excitation light beams having specific wavelengths corresponding to the respective fluorescent dyes.
- the membrane filter which is to be irradiated with excitation light beams is divided in advance into areas each having a predetermined size, and the filter is irradiated with excitation light for each divided area.
- step S95 fluorescent images having specific wavelengths are captured, which are emitted from portions of the sample in which the respective fluorescent dyes are absorbed by microbes, in accordance with the applied excitation light beams.
- step S96 1-bit gray-level binary image data is acquired from the obtained fluorescent images by using a binarization method, thereby extracting concatenated components necessary for identification processing of microbes.
- proper image processing may be performed for the obtained fluorescent images to acquire 1-bit gray-level binary image data from the images after the image processing by using the binarization method, thereby extracting concatenated components necessary for identification processing of microbes.
- step S97 image analysis processing is performed to identify microbes and others, and the locations of the fluorescent objects formed from the respective concatenated components are determined.
- This series of steps for one region i.e., from irradiation with excitation light beams in step S94 to identification processing of microbes in step S97, is performed for each region of the sample, and all the regions of the sample are scanned to determine the locations of fluorescent objects in the respective regions and perform primary determination of determining whether or not the fluorescent objects are microbes.
- step S98 the location map of microbes and others is generated, and detected microbes are displayed on the display screen.
- Microbes and others can be displayed on the display screen by three kinds of discrimination methods.
- step S99 the image analysis result is stored.
- the primary automatic identification processing in Fig. 5 will be described in detail next.
- the primary automatic identification processing is performed by using a low-power lens.
- a test sample solution to be measured by the microbe inspection equipment 1 is, for example, a beverage such as beer, which basically should contain no microbes or debris other than microbes.
- Microbes or debris other than microbes may be contaminated in a sample.
- Microbes in a beverage include, for example, bacteria and yeasts.
- Pectinatus species which is a bacteria harmful to beer has a width of 0.5 to 2 ⁇ m and a curve length of 1.5 to 10 ⁇ m.
- Another example is a yeast whose width and curve length fall within 3 to 10 ⁇ m.
- targets which are contaminated in a beverage may vary in size. For this reason, filters having different pore sizes can be selectively used in the microbe inspection equipment 1 in accordance with the size of a target which may be contaminated in a beverage.
- Part of a beverage is sampled as a test sample solution at the correct time and is analyzed by using the microbe inspection equipment 1 described above. This makes it possible to automatically discriminate quickly and quantitatively whether or not microbes and debris other than microbes are contaminated in the beverage and to separately display the microbes and the debris other than microbes, thereby performing quality control on the beverage.
- sample preparation is performed in the following step.
- test sample solution is sampled from a beverage such as beer.
- the test sample solution is then filtered with a filtering unit using a membrane filter to capture, on the membrane filter, all the microbes and debris other than microbes contained in the test sample solution.
- the number of all microbes and debris other than microbes contained in the test sample solution can be quantitatively analyzed by counting the total number of microbes captured on the membrane filter by using the microbe inspection equipment 1 (this operation will be described in detail later).
- the membrane filter is then removed from the filtering unit.
- fluorescent dyes to the microbes and others (to be referred to as a sample hereinafter)
- the microbes in the sample are stained with the fluorescent dyes.
- the microbes in the sample are stained with, for example, one or a plurality of kinds of fluorescent dyes selected from Fig. 3.
- the above membrane filter will be described.
- the membrane filter has, for example, a flat shape like a disc with many pores.
- the filter diameter is about 10 to 50 mm, and the filter pore diameter is 0.2 to 50 ⁇ m.
- the number of pores of the filter can be arbitrarily optimized as needed. Using the membrane filter therefore makes it possible to capture microbes larger than the filter pore size.
- a method of staining microbes captured on the above membrane filter with fluorescent dyes will be described in detail next.
- the FISH method, fluorescent antibody method, or the like is available.
- the FISH method is a method of fluorescence-staining a microbe by using a nucleic acid probe and targeting a nucleic acid in a cell. This method does not require the step of extracting a nucleic acid from a microbe, and directly adds a fluorescence-labeled nucleic acid probe to a pretreated microbe to make the probe hybridize to an rRNA or chromosome DNA of a nucleic acid in a microbial cell.
- an rRNA of a nucleic acid in a microbial cell is used as a probe target.
- probe targets There are several thousand to several hundred thousand rRNA copies in a microbial cell, and hence there are probe targets equal in number to the rRNA copies. For this reason, a large amount of fluorescent dye bonded to the nucleic acid probe is accumulated in the target microbial cell.
- the fluorescent dye used in this case is irradiated with proper excitation light, only the target microbial cell emits fluorescence without changing its shape to allow its observation under the epifluorescent microscope.
- a microbial cell can be fluorescence-stained in a species-specific manner.
- the fluorescent antibody method is a method of selectively staining a target microbe by using an antibody which specifically recognizes an antigen constituted by the proteins, saccharides, lipid, or the like of a target microbial cell.
- This method uses an antibody which recognizes an antigen existing in the surface layer of a cell.
- a microbe having a surface antigen recognized by the primary antibody is specifically fluorescence-stained to be detected.
- Fig. 3 shows an example of fluorescent dyes used when microbes captured on the above membrane filter are stained by using the FISH method or fluorescence antibody method.
- Fig. 3 shows the relationship between the fluorescent dyes, excitation light, and fluorescence.
- Fig. 3 when each fluorescent dye is irradiated with excitation light having a specific wavelength corresponding to the fluorescent dye, the fluorescent dye emits fluorescence having a specific wavelength corresponding to the dye. Therefore, the use of Fig. 3 makes it possible to select a fluorescent dye, the wavelength of excitation light, and the wavelength of fluorescence light. Assume that indo-carbocyanine dye (Cy3) is selected as a fluorescent dye, and the dye is irradiated with excitation light having a wavelength of 550 nm. In this case, fluorescence having a wavelength of 570 nm can be observed. When a sample is stained with a plurality of fluorescent dyes in Fig. 3 and is irradiated with corresponding excitation light beams, a plurality of fluorescences having different wavelengths can be observed from the sample.
- indo-carbocyanine dye Cy3
- a proper scanning range on the entire region of a sample is determined first.
- the magnification of an objective lens is set to, for example, 10x in accordance with the maximum-diameter domain of a fluorescent object as a measurement target, e.g., the range of 1 ⁇ m to 20 ⁇ m.
- the image analyzing unit 3 defines a measurement area, other than the image sensing area, per frame, and matches this value with the step amount. That is, settings are made such that adjacent camera image sensing range visual fields overlap each other by 20 ⁇ m on the two sides in the lateral direction and 20 ⁇ m on the upper side in the longitudinal direction per visual field in the camera image sensing range in scanning/image sensing operation.
- the image analyzing unit 3 can reliably measure a target fluorescent object in just proportion by using the above setting method.
- Fig. 4 shows a binary image to be described later.
- pixels 81 "active" pixels having luminances equal to or higher than a predetermined luminance are displayed by hatching, and a "cluster” formed by connecting "active pixels” is defined as a concatenated component 82.
- the area occupied by the concatenated component 82 shown on the central portion in Fig. 4 will be referred to as an occupied area 83 of the concatenated component; and the lowermost-rightmost pixel on the frame of the occupied area 83 of the concatenated component, a concatenated component end point 84.
- the image analyzing unit 3 controls the microscope motor-driven stage 16 and electric focus motor 17 to always automatically focus on the same plane of a membrane filter on which a sample is captured.
- the absolute positional coordinates of an image of a target fluorescent object on the membrane filter are automatically determined from the positional coordinates of the controlled microscope motor-driven stage 16 (the coordinates of the camera image sensing range visual field) and the positional coordinates of a concatenated component measured on the frame.
- This method can detect an image of a fluorescent object obtained on the entire region of a sample by unmanned automatic scanning operation. For example, whether or not each fluorescent object is a microbe can be automatically determined by setting in advance a limit value for microbe determination on the basis of a parameter such as the fluorescence intensity of an image of each fluorescent object or the feature value of the shape, e.g., an area, curve length, or curve width (to be described in detail later), and comparing each limit value with the above feature value obtained from one or a plurality of fluorescence intensity measurement results.
- a parameter such as the fluorescence intensity of an image of each fluorescent object or the feature value of the shape, e.g., an area, curve length, or curve width (to be described in detail later
- the images of the respective fluorescent objects on the membrane filter can be accurately and automatically measured in an unmanned fashion by sequentially scanning upon changing the magnification of the objective lens from 10x, set in the above operation, to, for example, 20x or 40x (this operation will be referred to as Validation operation). This further facilitates determination of microbe and others.
- Image processing (binarization technique) will be described next, which is to be performed for an image of a fluorescent object obtained in the entire region of the sample described above before the image analyzing unit 3 performs image analysis.
- An image to be processed by the image analyzing unit 3 has multi-tone digital information.
- monochrome images use 256 gray levels (8-bit gray levels).
- the image analyzing unit 3 can have a function of digitizing the captured image.
- the captured image is already digitized and is a multi-tone digital image (256 gray levels (8-bit gray levels).
- the image analyzing unit 3 then performs image processing by a binarization technique.
- binarization each pixel constituting this multi-tone image is "binarized” by setting a luminance within an arbitrary range as “active” and other luminances as "negative”, thereby converting an 8-bit gray-level image into a 1-bit gray-level image.
- Fig. 4 shows an example of a binary image obtained by performing image processing by the above binarization method for the image obtained by measuring the measurement area 80 as a predetermined area.
- the "cluster” obtained by connecting the "active" pixels (hatched portion) having luminances equal to or higher than a predetermined luminance is defined as the concatenated component 82.
- the area occupied by the concatenated component 82 is the occupied area 83 of the concatenated component.
- the concatenated component end point 84 indicates the coordinates of the lowermost-rightmost pixel on the frame of the occupied area of the concatenated component.
- the area, average luminance, curve length, curve width, and roundness of the occupied area 83 can be calculated from the concatenated component 82 as the cluster of the "active" pixels having luminances equal to or higher than the predetermined luminance by using the image analysis method to be described later.
- identifying methods i.e., a 1-wavelength identifying method (Fig. 6), 2-wavelength identifying method (Fig. 7), and 3-wavelength identifying method (Fig. 12), will be described in detail next as secondary automatic identification processing of identifying microbes from fluorescent objects extracted by primary automatic identification processing.
- the secondary automatic identification processing is performed by using a high-power lens to accurately identify microbes.
- the secondary automatic identification processing based on the 1-wavelength identification method will be described first.
- Fig. 6 is a flow chart for secondary automatic identification processing using one wavelength. This processing is executed by the image analyzing unit 3 on the basis of an automatic fluorescence inspection program.
- step S99 in Fig. 5 the flow advances from step S99 in Fig. 5 to step S195 to move the stage in accordance with the location map of fluorescent objects extracted by the primary automatic identification processing.
- step S196 Upon completion of the processing in steps S95 and S96, the flow advances to step S196. Note that the processing in steps S95 and S96 in Fig. 6 is the same as that in the steps denoted by the same reference symbols as in Fig. 5. A repetitive description of this processing will be omitted.
- Step S196 is a step which characterizes automatic microbe identification processing using excitation light of one wavelength.
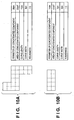
- automatic microbe identification processing for example, an area method, average luminance method, and curve length method are available, which specify fluorescent objects which can be microbes on the basis of the fluorescence intensity and shape of images of fluorescent objects. These methods will be described in detail below with reference to Figs. 8 to 10.
- Fig. 8 shows the area method, average luminance method, curve length method, curve width method, and roundness method, each exemplifying a microbe identification processing method using excitation light of one wavelength, and determination criteria for microbes in the respective methods.
- Fig. 9 shows equations for calculating a curve length, curve width, and roundness in the curve length method, curve width method, and roundness method shown in Fig. 8.
- Fig. 10 shows an example of how curve lengths, curve widths, and roundness are calculated from specific fluorescent images by using the curve length method, curve width method, and roundness method.
- the area method will be described first.
- the actual area (( ⁇ m) 2 ) of a concatenated component obtained by image sensing is calculated, which is the product of the total number of pixels (pix) of the concatenated component and a calibration value (( ⁇ m) 2 /pix) which is formed in advance and an actual area per unit pixel.
- the obtained actual area is then compared with a preset determination criterion (Fig. 8) to discriminate whether or not the concatenated component is a microbe.
- a determination criterion (Fig. 8) is set such that if the actual area of a concatenated component is 5 to 200 ( ⁇ m) 2 , the concatenated component is identified as a microbe.
- the average luminance method will be described next.
- the average luminance method is a method of obtaining an average luminance from the luminance (0 to 255) of each pixel constituting a concatenated component, as shown in Fig. 8.
- An average luminance is obtained by dividing the total luminance of the respective pixels by the total number of pixels (pix). For example, a determination criterion (Fig. 8) is set such that if the average luminance of a concatenated component is 10 to 255, the concatenated component is identified as a microbe.
- a curve length ( ⁇ m) is calculated, which is the product of the length (pix) of the longest pixel side of a rectangle having the same area and perimeter as those of a target concatenated component and a calibration value ( ⁇ m/pix) which is formed in advance and a unit pixel length.
- the curve length of the target concatenated component in Fig. 10A is 11 (pix), and the curve length of the target concatenated component in Fig. 10B is 5 (pix).
- the obtained curve length is then compared with a preset microbe determination criterion (Fig. 8) to discriminate whether or not the concatenated component is a microbe.
- a microbe determination criterion is set such that if the curve length is 0.5 to 50 ⁇ m, the concatenated component is identified as a microbe. Note that the value of a curve length indicates the length of a curved microbe, fiber, or the like.
- a curve length ( ⁇ m) is calculated, which is the product of the length (pix) of the shortest side of a rectangle having the same area and perimeter as those of a target concatenated component and a calibration value ( ⁇ m/pix) which is formed in advance and a unit pixel length.
- the curve width of the target concatenated component in Fig. 10A is 2 (pix)
- the curve width of the target concatenated component in Fig. 10B is 2 (pix).
- the obtained curve width is then compared with a preset microbe determination criterion (Fig. 8) to discriminate whether or not the concatenated component is a microbe.
- a microbe determination criterion is set such that if the curve width is 0.1 to 10 ⁇ m, the concatenated component is identified as a microbe. Note that the value of a curve width indicates the width of a curved microbe, fiber, or the like.
- a roundness is a dimensionless number given by the definition equation shown in Fig. 9, which is set to a minimum value of 1 when the target concatenated component has a circular shape, and is set to a value larger than 1 when the target concatenated component has a shape other than the circular shape.
- the roundness of the target concatenated component in Fig. 10A is 2.3
- the roundness of the target concatenated component in Fig. 10B is 1.5.
- 1.064 is an adjustment factor, which corrects corner errors caused by digitization of an image throughout the circumference.
- a microbe determination criterion (Fig. 8) is set such that if the curve width is 1 to 10 ⁇ m, the concatenated component is identified as a microbe.
- step S197 in Fig. 6 If it is determined in step S197 in Fig. 6 that there is a fluorescent object for which automatic identification processing is to be performed, the flow returns to step S195 to repeat the above processing from step S195 to step S196. If it is determined in step S197 that there is no fluorescent object for which automatic identification processing is to be performed, the flow advances to step S198.
- step S198 the location map of microbes and others is created on the basis of the determination obtained in step S196 with respect to each fluorescent object extracted in step S99, and the detected microbes are displayed on the display screen.
- microbes and others can be displayed by three kinds of discrimination methods.
- step S199 the microbe determination results on the respective fluorescent objects which are obtained by image analysis processing are stored, thereby completing automatic microbe identification processing using excitation light of one wavelength.
- the 1-wavelength identification method can identify microbes from the characteristic features of the shapes of fluorescent objects.
- a sample is stained in advance with a fluorescent dye in Fig. 3 to make a microbe to be detected, i.e., a target microbe, emit fluorescence when irradiated with specific excitation light.
- a target microbe contained in a sample is stained with one kind of fluorescent dye.
- the sample is sequentially irradiated with excitation light corresponding to the fluorescent dye and other excitation light other than this.
- Fluorescent images emitted from each fluorescent object are sequentially detected, and a fluorescence spectrum is created for each fluorescent object by combining the fluorescent images obtained in correspondence with the respective excitation light beams.
- the obtained fluorescence spectrum is compared with a preset fluorescence spectrum as a determination criterion.
- Each fluorescent object is then identified as a target microbe or a object other than the target microbe. This makes it possible to identify target microbes in the sample.
- Figs. 7 and 14 are flow charts for automatic microbe identification processing using two wavelengths. This processing is executed by the image analyzing unit 3 on the basis of the automatic fluorescence inspection program.
- step S99 in Fig. 5 the flow advances from step S99 in Fig. 5 to step S293 to move the stage in accordance with the location map of fluorescent objects extracted by primary automatic identification processing.
- steps S95, S96, and S196 is performed by using excitation light having the first wavelength to specify fluorescent objects that can be target microbes from characteristic features such as the shapes of the fluorescent objects according to the microbe determination criterion shown in Fig. 8.
- the flow then advances to step S294.
- steps S95, S96, and S196 in Fig. 7 is the same as that in the steps denoted by the same reference symbols in Fig. 6, and hence a detailed repetitive description will be omitted.
- step S294 the fluorescence filter is switched to another filter.
- the flow then advances to step S295 to repeatedly perform the above processing in steps S95, S96, and S196 by using excitation light having the second wavelength.
- step S296 target microbes are identified among the fluorescent objects specified in step S196 which can be the respective target microbes.
- Step S296 is a step which characterizes automatic microbe identification processing using excitation light beams of two wavelengths. Fig. 14 shows this step in detail.
- step S200 a fluorescence spectrum or peak wavelength is created from a fluorescent object obtained for each field in correspondence with each excitation light beam.
- step S201 the obtained fluorescence spectrum or peak wavelength is collated with a determination fluorescence spectrum or determination criterion to identify a microbe from the fluorescent object in each field.
- step S297 If it is determined in step S297 that there is a fluorescent object for which automatic identification processing is to be performed next, the flow advances to step S298 to return the fluorescence filter to the original position. The flow then returns to step S293 to repeatedly perform the above processing from step S293 to step S296. If it is determined in step S297 that there is no fluorescent object for which automatic identification processing is to be performed next, the flow advances to step S198 to perform the processing in steps S198 and S199.
- steps S198 and S199 in Fig. 7 is the same as that in the steps denoted by the same reference symbols in Fig. 6, and hence a detailed repetitive description will be omitted.
- the area method, average luminance method, curve length method, or the like described in the 1-wavelength identification method is applied to each of excitation light beams of two wavelengths to specify fluorescent objects that can be target microbes, according to the microbe determination criterion shown in Fig. 8, from the characteristic features, e.g., the fluorescence intensities or shapes, of the fluorescent objects with respect to the respective excitation light beams (step S196).
- Microbes are then identified by using the differences between the fluorescent objects that can be the target microbes which are obtained with respect to the respective excitation light beams (step S296).
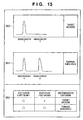
- Fig. 11 is a diagram for explaining an example of fluorescent objects (binary images) in the respective fields which are obtained by secondary identification processing using excitation light beams of two wavelengths.
- a sample on a membrane filter is irradiated with two different excitation light beams 1 (for example: for detection of Cy3) and 2 to image-sense fluorescent objects obtained for the respective fields (three fields A, B, and C in this case) in correspondence with the respective excitation light beams, thereby acquiring fluorescent objects (binary images) 301 to 306, as shown in, for example, Fig. 11.
- the six fluorescent objects 301 to 306 obtained in the fields A, B, and C in correspondence with the two excitation light beams 1 and 2 are combined to form fluorescence spectra 350, 352, and 354 or peak wavelengths 351, 353, and 355.
- the fluorescent objects 301 and 304 obtained in correspondence with the two excitation light beams are combined to form the fluorescence spectrum having two peaks or the peak wavelength 351.
- the fluorescent objects 302 and 305 obtained in correspondence with the two excitation light beams are combined to form the fluorescence spectrum having one peak and or the peak wavelength 353.
- the fluorescence spectrum 354 or peak wavelength 355 is formed in the same manner.
- the formed fluorescence spectra 350, 352, and 354 or peak wavelengths 351, 353, and 355 are then compared with a determination fluorescence spectrum 360 indicating a target microbe, a determination fluorescence spectrum 361 indicating a foreign object, or a determination criterion (for two wavelengths) 362, each of which is shown in Fig. 13 as an example.
- a determination fluorescence spectrum or determination criterion is set to determine from the distribution of fluorescence peaks obtained in advance in correspondence with each excitation light beam whether the fluorescence spectrum or peak wavelength corresponds to the target microbe or foreign object. For example, by comparing the fluorescence spectra 350, 352, and 354 obtained in the respective fields in Fig.
- the determination fluorescence spectra or determination criterions used in the above operation are stored in advance in the image analyzing unit 3 in correspondence with the respective excitation light beams.
- fluorescence spectra or peak wavelengths are formed from the fluorescent objects (binary images) 301 to 306 and are compared with a determination fluorescence spectrum or determination criterion. This makes it possible to automatically identify each fluorescent object as the target microbe or a foreign object. Therefore, a target microbe and the like contained in a sample solution can be easily identified in an unmanned fashion.
- a sample is stained with two kinds of fluorescent dyes (e.g., Cy3 and DAPI) to identify a target microbe and microbes other than the target microbe contained in the sample.
- fluorescent dyes e.g., Cy3 and DAPI
- a target microbe e.g., Pectinatus
- DAPI only one kind of fluorescent dye
- the 3-wavelength identification method will be described first.
- the microbes contained in a sample are stained with two kinds of fluorescent dyes such that a target microbe and other microbes can be identified.
- the sample is sequentially irradiated with two kinds of excitation light beams corresponding to the fluorescent dyes and other kinds of excitation light beams to sequentially detect fluorescent images emitted from the respective fluorescent objects.
- the fluorescent images obtained in correspondence with the respective excitation light beams are combined to form fluorescence spectra for the respective fluorescent objects.
- the obtained fluorescence spectra are compared with a determination fluorescence spectrum. This makes it possible to identify each fluorescent object as the target microbe or another microbe or another object, thus identifying the target microbe in the sample.
- Figs. 15 and 14 are flow charts for automatic microbe identification processing using three wavelengths.
- step S99 in Fig. 5 the flow advances from step S99 in Fig. 5 to step S293 to move the stage in accordance with the location map of fluorescent objects extracted by the primary automatic identification processing.
- steps S95, S96, and S196 is performed by using excitation light having the first wavelength to specify fluorescent objects that can be target microbes from characteristic features such as the fluorescence intensities or shapes of the fluorescent objects according to the microbe determination criterion shown in Fig. 8.
- the flow then advances to step S294. Note that the processing in steps S95, S96, and S196 in Fig. 15 is the same as that in the steps denoted by the same reference symbols in Fig. 6, and hence a detailed repetitive description will be omitted.
- step S390 If it is determined that the current fluorescence filter needs to be switched to the next fluorescence filter for irradiation with next excitation light, the flow advances to step S294 to switch the fluorescence filters. The flow then advances to step S295 to repeatedly perform the above processing in steps S95 and S96 by using excitation light having the second wavelength. Thereafter, the flow advances to step S396. If it is determined in step S390 that irradiation of the sample with all excitation light beams is complete, and there is no need to switch to the next filter, the flow advances to step S396.
- step S396 a target microbe is identified among the fluorescent objects specified in step S196 which can be the respective target microbes.
- Step S396 is a step which characterizes automatic microbe identification processing using excitation light beams of three or more wavelengths. Fig. 14 shows this step in detail.
- step S200 a fluorescence spectrum or peak wavelength is created from a fluorescent object obtained for each field in correspondence with each excitation light beam.
- step S201 the obtained fluorescence spectrum or peak wavelength is collated with a determination fluorescence spectrum or determination criterion to identify a microbe from the fluorescent object in each field.
- step S297 If it is determined in step S297 that there is a fluorescent object for which automatic identification processing is to be performed next, the flow advances to step S298 to return the fluorescence filter to the original position. The flow then returns to step S293 to repeatedly perform the above processing from step S293 to step S396. If it is determined in step S297 that there is no fluorescent object for which automatic identification processing is to be performed next, the flow advances to step S198 to perform the processing in steps S198 and S199.
- steps S198 and S199 in Fig. 12 are the same as that in the steps denoted by the same reference symbols in Fig. 6, and hence a detailed repetitive description will be omitted.
- the area method, average luminance method, curve length method, or the like described in the 1-wavelength identification method is applied to each of excitation light beams of three wavelengths to specify fluorescent objects that can be target microbes from the fluorescence intensities or shapes of the fluorescent objects with respect to the respective excitation light beams (step S196).
- Microbes are then identified by using the differences between the fluorescent objects that can be the target microbes which are obtained with respect to the respective excitation light beams (step S396).
- Fig. 16 is a diagram for explaining an example of fluorescent objects (binary images) in the respective fields which are obtained by primary automatic identification processing and secondary identification processing using excitation light beams of three wavelengths.
- a low-power lens is used to irradiate a sample on a membrane filter with, for example, excitation light beam 2 (for DAPI detection) and image-sense fluorescent objects obtained for the respective fields in correspondence with excitation light beam 2, thereby capturing fluorescent objects (binary images) 413 to 416.
- the fluorescent objects 401, 405, and 409 obtained in correspondence with the three excitation light beams are combined to form the fluorescence spectrum 451 having three peaks.
- the fluorescent objects 402, 406, and 410 obtained in correspondence with the three excitation light beams are combined to form the fluorescence spectrum 452 having two peaks.
- the fluorescence spectra 453 and 454 each having one peak are formed in the same manner.
- the formed fluorescence spectra 451 to 454 are then compared with determination fluorescence spectra 460 to 463 exemplarily shown in Fig. 18.
- the determination fluorescence spectra are prepared in correspondence with the excitation light used for primary identification and the combinations of excitation light beams used for secondary identification to determine from the obtained distributions of fluorescence peaks whether the corresponding fluorescence spectra correspond to target microbes, microbes other than target microbes, or foreign objects.
- determination fluorescence spectra 461 to 463 exemplarily shown in Fig. 18 are examples of determination fluorescence spectra for 3-wavelength identification processing, which are used for secondary identification using excitation light beams 1 to 3 with respect to the fluorescent objects detected from the sample upon irradiation with excitation light beam 2 as a primary identification excitation light beams denoted by reference numeral 460.
- the spectra 461, 462, and 463 respectively indicate a foreign object, a target microbe, and a microbe other than the target microbe.
- collating the fluorescence spectra 451 to 454 obtained for the respective fields with the determination fluorescence spectra 461 to 463 will identify only the fluorescent object in the field B, of the fluorescent objects obtained in the four fields in Fig. 16, as the target microbe, the fluorescent objects in the fields C and D as microbes other than the target, and the fluorescent object in the field A as a foreign object.
- an autofluorescent object with no fluorescence selectivity with respect to excitation light may be an example of foreign object.
- the determination fluorescence spectra used in the above operation are stored in advance in the image analyzing unit 3 in correspondence with the respective excitation light beams.
- the peak wavelengths shown in Fig. 12 may be formed in place of the above fluorescence spectra.
- determination criteria for 3-wavelength identification processing like those shown in Fig. 13, which are stored in the image analyzing unit 3, may be used in place of the determination fluorescence spectra.
- Forming fluorescence spectra or peak wavelengths from the fluorescent objects (binary images) 401 to 412 and comparing them with determination fluorescence spectra or determination criteria in this manner makes it possible to automatically identify the fluorescent objects as target microbes, microbes other than target microbes, or foreign objects. Therefore, a target microbe and the like contained in a sample solution can be easily identified in an unmanned fashion.
- Fig. 19 is a diagram for explaining another example of secondary automatic identification processing using excitation light beams of three wavelengths.
- a sample is stained in advance with two kinds of fluorescent dyes (e.g., Cy3 and DAPI) to identify a target microbe and microbes other than the target microbe contained in the sample.
- fluorescent dyes e.g., Cy3 and DAPI
- excitation light beams 2 for DAPI detection
- excitation light beam 1 for Cy3 detection
- Reference numerals 501 to 505 in Fig. 19 denote fluorescent objects detected in primary identification processing. They are binary images of fluorescent objects detected from the respective fields (five fields A to E in this case) in correspondence with excitation light beam 1 upon irradiation of a sample on a membrane filter with excitation light beam 1 (for Cy3 detection). Note that no fluorescent object is obtained from the field E.
- the formed fluorescence spectra are then compared with determination fluorescence spectra 471 to 474 for 3-wavelength identification processing, respectively, which are exemplarily shown in Fig. 20.
- the determination fluorescence spectra shown in Fig. 20 are prepared in correspondence with excitation light which is denoted by reference numeral 470 and used for primary identification and the combinations of excitation light beams used for secondary identification to determine from the obtained distributions of fluorescence peaks whether the corresponding fluorescence spectra correspond to target microbes, microbes other than target microbes, or foreign objects.
- determination fluorescence spectra 471 to 474 exemplarily shown in Fig. 20 are examples of determination fluorescence spectra for 3-wavelength identification processing, which are used for secondary identification using excitation light beams 1 to 3 with respect to the fluorescent objects detected from the sample upon irradiation with excitation light beam 1 as a primary identification excitation light beams denoted by reference numeral 470.
- the spectrum 471 indicates a foreign object; the spectrum 472, a target microbe; and the spectra 473 and 474, foreign objects.
- the determination fluorescence spectra used in the above operation are stored in advance in the image analyzing unit 3 in correspondence with the respective excitation light beams.
- Forming fluorescence spectra or peak wavelengths from the fluorescent objects (binary images) 506 to 517 and comparing them with determination fluorescence spectra or determination criteria in this manner makes it possible to automatically identify the fluorescent objects as target microbes or foreign objects. Therefore, a target microbe and the like contained in a sample solution can be easily identified in an unmanned fashion.
- Fig. 19 since only excitation light beam 1 (for Cy3 detection) for identifying only the target microbe is used as an excitation light beam used in primary identification processing, microbes other than the target microbe are excluded by the primary automatic identification processing. For this reason, only the target microbe can be identified among the microbes contained in the sample by primary automatic identification processing.
- the identification method shown in Fig. 19 can accurately discriminate the target microbe (field B) from the foreign objects (fields A, C and D) among the fluorescent objects (fields A to D) identified by the primary identification processing.
- the microbe inspection equipment of this embodiment can detect a trace amount of fluorescence, and hence can detect only one cell of target microbes in a sample. For this reason, unlike in the prior art, there is no need to take a long period of time to form a colony of microbes by cultivation to prepare a sample containing a large number of microbes.
- various kinds of parameters such as the feature amounts of shapes, e.g., the average fluorescence intensities, areas, and the ratios of curve lengths to curve widths of concatenated components, are calculated from images of detected fluorescent objects, and it can be detected in an unmanned fashion on the basis of the calculated various parameters whether or not the images of the fluorescent objects originate from microbes. This eliminates the necessity to visually identify and check microbes as in the prior art, and hence allows accurate, quick, automatic detection of microbes.
- a measurement equipment can therefore be applied to microbial tests in waste water, industrial water, environmental samples, and water and sewerage, microbial test in various research fields such as life-science, detection of minute autofluorescent objects and analysis of the number thereof, and the like as well as microbial tests in manufacturing process control, product quality control, and the like for beverages, foods, medicines, cosmetics, and the like.
- a microbe inspection equipment and method can be provided, which can automatically and quickly acquire information about microbes contained in a sample as a test target.
Landscapes
- Health & Medical Sciences (AREA)
- Chemical & Material Sciences (AREA)
- Life Sciences & Earth Sciences (AREA)
- Physics & Mathematics (AREA)
- Immunology (AREA)
- Engineering & Computer Science (AREA)
- Biochemistry (AREA)
- Analytical Chemistry (AREA)
- General Health & Medical Sciences (AREA)
- General Physics & Mathematics (AREA)
- Pathology (AREA)
- Organic Chemistry (AREA)
- Spectroscopy & Molecular Physics (AREA)
- Molecular Biology (AREA)
- Food Science & Technology (AREA)
- Wood Science & Technology (AREA)
- Proteomics, Peptides & Aminoacids (AREA)
- Zoology (AREA)
- Biotechnology (AREA)
- Microbiology (AREA)
- Biomedical Technology (AREA)
- Nuclear Medicine, Radiotherapy & Molecular Imaging (AREA)
- Hematology (AREA)
- Urology & Nephrology (AREA)
- Medicinal Chemistry (AREA)
- Bioinformatics & Cheminformatics (AREA)
- General Engineering & Computer Science (AREA)
- Genetics & Genomics (AREA)
- Biophysics (AREA)
- Tropical Medicine & Parasitology (AREA)
- Toxicology (AREA)
- Cell Biology (AREA)
- Virology (AREA)
- Dispersion Chemistry (AREA)
- Optics & Photonics (AREA)
- Chemical Kinetics & Catalysis (AREA)
- Investigating, Analyzing Materials By Fluorescence Or Luminescence (AREA)
Applications Claiming Priority (3)
| Application Number | Priority Date | Filing Date | Title |
|---|---|---|---|
| JP2001218625 | 2001-07-18 | ||
| JP2001218625 | 2001-07-18 | ||
| PCT/JP2002/007295 WO2003008634A1 (fr) | 2001-07-18 | 2002-07-18 | Dispositif et procede d'analyse de microbes |
Publications (2)
| Publication Number | Publication Date |
|---|---|
| EP1418238A1 true EP1418238A1 (fr) | 2004-05-12 |
| EP1418238A4 EP1418238A4 (fr) | 2009-08-12 |
Family
ID=19052783
Family Applications (1)
| Application Number | Title | Priority Date | Filing Date |
|---|---|---|---|
| EP02751628A Withdrawn EP1418238A4 (fr) | 2001-07-18 | 2002-07-18 | Dispositif et procede d'analyse de microbes |
Country Status (8)
| Country | Link |
|---|---|
| US (1) | US20040243318A1 (fr) |
| EP (1) | EP1418238A4 (fr) |
| JP (1) | JP4029983B2 (fr) |
| KR (1) | KR100753616B1 (fr) |
| CN (1) | CN100510099C (fr) |
| AU (1) | AU2002354896B2 (fr) |
| CA (1) | CA2454294A1 (fr) |
| WO (1) | WO2003008634A1 (fr) |
Families Citing this family (18)
| Publication number | Priority date | Publication date | Assignee | Title |
|---|---|---|---|---|
| WO2003102224A1 (fr) * | 2002-05-30 | 2003-12-11 | Fuji Electric Holdings Co., Ltd. | Procede de comptage de micro-organismes ou de cellules |
| JP4810871B2 (ja) * | 2004-09-03 | 2011-11-09 | パナソニック株式会社 | 微生物検出方法 |
| JP2007006709A (ja) * | 2005-06-28 | 2007-01-18 | Matsushita Electric Ind Co Ltd | 発光物の判別方法 |
| JP4967280B2 (ja) * | 2005-08-30 | 2012-07-04 | パナソニック株式会社 | 微生物計数装置 |
| JP5422870B2 (ja) * | 2006-10-06 | 2014-02-19 | パナソニック株式会社 | 微生物数計測方法 |
| EP1972928B1 (fr) * | 2007-03-21 | 2012-09-19 | Erlus Aktiengesellschaft | Dispositif et procédé de vérification non destructive des caractéristiques biostatiques ou biocides d'un revêtement de surface photocatalytique |
| FR2926820B1 (fr) * | 2008-01-30 | 2014-10-17 | Alain Rambach | Procede de selection de microorganismes dans un echantillon biologique |
| FR2936251B1 (fr) | 2008-09-23 | 2010-11-05 | Millipore Corp | Dispositif pour l'analyse microbiologique. |
| FR2936252B1 (fr) | 2008-09-23 | 2010-11-05 | Millipore Corp | Dispositif pour l'analyse microbiologique. |
| JP5451770B2 (ja) * | 2008-11-24 | 2014-03-26 | コーニンクレッカ フィリップス エヌ ヴェ | 流体サンプルの迅速なフィルタ解析方法及び装置 |
| CN102639986A (zh) * | 2009-08-27 | 2012-08-15 | 夏普株式会社 | 显示控制装置 |
| US8472661B2 (en) * | 2010-09-07 | 2013-06-25 | Alison Dana Bick | Method and apparatus for testing water quality using a cell-phone application, mirror and plastic bag |
| JP2014168442A (ja) * | 2013-03-05 | 2014-09-18 | Azbil Corp | 微生物検出装置及び微生物検出方法 |
| CN107614674B (zh) * | 2015-06-24 | 2022-05-17 | 株式会社日立制作所 | 检查系统、检查装置以及检查方法 |
| WO2018117273A1 (fr) | 2016-12-22 | 2018-06-28 | 国立大学法人筑波大学 | Procédé de création de données et procédé d'utilisation de données |
| CN109496230A (zh) * | 2018-02-09 | 2019-03-19 | 柴崎株式会社 | 细菌检测装置以及细菌检测方法 |
| CN109060674A (zh) * | 2018-08-24 | 2018-12-21 | 张晓焦 | 微生物识别方法 |
| CN110305790A (zh) * | 2019-07-04 | 2019-10-08 | 湖南开启时代智能科技有限公司 | 一种细胞制备培养系统及方法 |
Citations (3)
| Publication number | Priority date | Publication date | Assignee | Title |
|---|---|---|---|---|
| EP0405480A2 (fr) * | 1989-06-28 | 1991-01-02 | Kirin Beverage Corporation | Procédé et appareil de détection des micro-organismes |
| JPH08242886A (ja) * | 1995-03-08 | 1996-09-24 | Dam Suigenchi Kankyo Seibi Center | 植物プランクトンの濃度測定方法 |
| WO2000075636A1 (fr) * | 1999-06-04 | 2000-12-14 | Kairos Scientific, Inc. | Identification taxonomique multispectrale |
Family Cites Families (4)
| Publication number | Priority date | Publication date | Assignee | Title |
|---|---|---|---|---|
| US4686372A (en) * | 1983-05-09 | 1987-08-11 | Mitsubishi Denki Kabushiki Kaisha | Method and apparatus for measuring cell counts of Methanogens or methane producing activity thereof |
| JPS62269045A (ja) * | 1986-05-19 | 1987-11-21 | Mitsubishi Electric Corp | メタン菌の菌数またはメタン生成活性の測定方法 |
| JPH0630627B2 (ja) * | 1987-11-16 | 1994-04-27 | 日立電子エンジニアリング株式会社 | 生菌数測定方法 |
| JP2000232897A (ja) * | 1999-02-15 | 2000-08-29 | Nippon Mizushori Giken:Kk | 菌類の即時判別方法 |
-
2002
- 2002-07-18 US US10/484,055 patent/US20040243318A1/en not_active Abandoned
- 2002-07-18 EP EP02751628A patent/EP1418238A4/fr not_active Withdrawn
- 2002-07-18 CN CNB028143779A patent/CN100510099C/zh not_active Expired - Fee Related
- 2002-07-18 KR KR1020047000588A patent/KR100753616B1/ko not_active IP Right Cessation
- 2002-07-18 CA CA002454294A patent/CA2454294A1/fr not_active Abandoned
- 2002-07-18 JP JP2003514949A patent/JP4029983B2/ja not_active Expired - Fee Related
- 2002-07-18 AU AU2002354896A patent/AU2002354896B2/en not_active Ceased
- 2002-07-18 WO PCT/JP2002/007295 patent/WO2003008634A1/fr active IP Right Grant
Patent Citations (3)
| Publication number | Priority date | Publication date | Assignee | Title |
|---|---|---|---|---|
| EP0405480A2 (fr) * | 1989-06-28 | 1991-01-02 | Kirin Beverage Corporation | Procédé et appareil de détection des micro-organismes |
| JPH08242886A (ja) * | 1995-03-08 | 1996-09-24 | Dam Suigenchi Kankyo Seibi Center | 植物プランクトンの濃度測定方法 |
| WO2000075636A1 (fr) * | 1999-06-04 | 2000-12-14 | Kairos Scientific, Inc. | Identification taxonomique multispectrale |
Non-Patent Citations (1)
| Title |
|---|
| See also references of WO03008634A1 * |
Also Published As
| Publication number | Publication date |
|---|---|
| KR100753616B1 (ko) | 2007-08-29 |
| JP4029983B2 (ja) | 2008-01-09 |
| CN1537171A (zh) | 2004-10-13 |
| AU2002354896B2 (en) | 2007-07-12 |
| EP1418238A4 (fr) | 2009-08-12 |
| JPWO2003008634A1 (ja) | 2005-02-24 |
| KR20040047775A (ko) | 2004-06-05 |
| US20040243318A1 (en) | 2004-12-02 |
| CA2454294A1 (fr) | 2003-01-30 |
| WO2003008634A1 (fr) | 2003-01-30 |
| CN100510099C (zh) | 2009-07-08 |
Similar Documents
| Publication | Publication Date | Title |
|---|---|---|
| AU2002354896B2 (en) | Microbe examining device and method | |
| AU2022200112B2 (en) | Methods and apparatus for detecting an entity in a bodily sample | |
| CN108572163B (zh) | 荧光图像分析装置、分析方法及预处理的评价方法 | |
| US10648897B2 (en) | Method and apparatus for the identification and handling of particles | |
| JP3035698B2 (ja) | 蛍光による微生物の高速且つ高感度な検出及び計数のための装置及び方法 | |
| JP2001211896A (ja) | 画像解析方法、装置、及び記録媒体 | |
| JP2007071742A (ja) | 蛍光読取装置および微生物計数装置 | |
| JP4967280B2 (ja) | 微生物計数装置 | |
| JP4487985B2 (ja) | 微生物計量装置 | |
| WO2007029821A1 (fr) | Appareil de comptage du nombre de micro-organismes | |
| JP5140956B2 (ja) | 微生物計数装置 | |
| JP2007071743A (ja) | 蛍光読取装置および微生物計数装置 | |
| JP2007097582A (ja) | 微生物計数装置 | |
| EP4137795A1 (fr) | Procédé d'analyse d'image de fluorescence, analyseur d'image de fluorescence, programme d'analyse d'image de fluorescence | |
| US20220207725A1 (en) | Fluorescence image display method and fluorescence image analyzer |
Legal Events
| Date | Code | Title | Description |
|---|---|---|---|
| PUAI | Public reference made under article 153(3) epc to a published international application that has entered the european phase |
Free format text: ORIGINAL CODE: 0009012 |
|
| 17P | Request for examination filed |
Effective date: 20040212 |
|
| AK | Designated contracting states |
Kind code of ref document: A1 Designated state(s): AT BE BG CH CY CZ DE DK EE ES FI FR GB GR IE IT LI LU MC NL PT SE SK TR |
|
| RTI1 | Title (correction) |
Free format text: MICROBE INSPECTION EQUIPMENT AND METHOD |
|
| RAP1 | Party data changed (applicant data changed or rights of an application transferred) |
Owner name: ASAHI BREWERIES, LTD. |
|
| RAP1 | Party data changed (applicant data changed or rights of an application transferred) |
Owner name: ASAHI BREWERIES, LTD. |
|
| A4 | Supplementary search report drawn up and despatched |
Effective date: 20090713 |
|
| RIC1 | Information provided on ipc code assigned before grant |
Ipc: C12M 1/34 20060101ALI20090707BHEP Ipc: G01N 1/10 20060101ALI20090707BHEP Ipc: C12Q 1/02 20060101ALI20090707BHEP Ipc: G01N 1/30 20060101ALI20090707BHEP Ipc: G01N 33/02 20060101ALI20090707BHEP Ipc: G01N 21/64 20060101AFI20090707BHEP Ipc: G01N 33/569 20060101ALI20090707BHEP Ipc: G01N 33/483 20060101ALI20090707BHEP |
|
| STAA | Information on the status of an ep patent application or granted ep patent |
Free format text: STATUS: THE APPLICATION HAS BEEN WITHDRAWN |
|
| 18W | Application withdrawn |
Effective date: 20090831 |