EP1051104B1 - Imagerie endoscopique par fluorescence - Google Patents
Imagerie endoscopique par fluorescence Download PDFInfo
- Publication number
- EP1051104B1 EP1051104B1 EP99904331A EP99904331A EP1051104B1 EP 1051104 B1 EP1051104 B1 EP 1051104B1 EP 99904331 A EP99904331 A EP 99904331A EP 99904331 A EP99904331 A EP 99904331A EP 1051104 B1 EP1051104 B1 EP 1051104B1
- Authority
- EP
- European Patent Office
- Prior art keywords
- fluorescence
- image
- endoscope
- tissue
- normal
- Prior art date
- Legal status (The legal status is an assumption and is not a legal conclusion. Google has not performed a legal analysis and makes no representation as to the accuracy of the status listed.)
- Expired - Lifetime
Links
- 238000000799 fluorescence microscopy Methods 0.000 title claims description 22
- 238000002073 fluorescence micrograph Methods 0.000 claims abstract description 69
- 238000000034 method Methods 0.000 claims abstract description 61
- 230000008569 process Effects 0.000 claims abstract description 14
- 230000003287 optical effect Effects 0.000 claims abstract description 11
- 238000003384 imaging method Methods 0.000 claims description 65
- 239000000835 fiber Substances 0.000 claims description 36
- 230000003595 spectral effect Effects 0.000 claims description 30
- 230000035945 sensitivity Effects 0.000 claims description 26
- 239000013307 optical fiber Substances 0.000 claims description 20
- 230000008878 coupling Effects 0.000 claims description 2
- 238000010168 coupling process Methods 0.000 claims description 2
- 238000005859 coupling reaction Methods 0.000 claims description 2
- 238000005286 illumination Methods 0.000 abstract description 66
- 230000004044 response Effects 0.000 abstract description 6
- 210000004877 mucosa Anatomy 0.000 description 94
- 210000001519 tissue Anatomy 0.000 description 86
- 230000005284 excitation Effects 0.000 description 84
- 208000003200 Adenoma Diseases 0.000 description 82
- 208000037062 Polyps Diseases 0.000 description 53
- 239000000523 sample Substances 0.000 description 46
- 206010001233 Adenoma benign Diseases 0.000 description 44
- 206010058314 Dysplasia Diseases 0.000 description 38
- 238000001574 biopsy Methods 0.000 description 36
- 230000000112 colonic effect Effects 0.000 description 34
- 210000001072 colon Anatomy 0.000 description 25
- 238000000338 in vitro Methods 0.000 description 25
- 230000003902 lesion Effects 0.000 description 24
- 238000001514 detection method Methods 0.000 description 20
- 206010009944 Colon cancer Diseases 0.000 description 18
- 238000002052 colonoscopy Methods 0.000 description 18
- 208000017819 hyperplastic polyp Diseases 0.000 description 18
- 238000001727 in vivo Methods 0.000 description 18
- 208000004804 Adenomatous Polyps Diseases 0.000 description 16
- 238000013461 design Methods 0.000 description 16
- 208000001333 Colorectal Neoplasms Diseases 0.000 description 15
- 238000001228 spectrum Methods 0.000 description 14
- 208000037265 diseases, disorders, signs and symptoms Diseases 0.000 description 12
- 238000002189 fluorescence spectrum Methods 0.000 description 12
- 230000006870 function Effects 0.000 description 12
- 206010009900 Colitis ulcerative Diseases 0.000 description 11
- 206010028980 Neoplasm Diseases 0.000 description 11
- 201000006704 Ulcerative Colitis Diseases 0.000 description 11
- 201000010099 disease Diseases 0.000 description 11
- 238000012545 processing Methods 0.000 description 11
- 238000012216 screening Methods 0.000 description 11
- VYPSYNLAJGMNEJ-UHFFFAOYSA-N silicon dioxide Inorganic materials O=[Si]=O VYPSYNLAJGMNEJ-UHFFFAOYSA-N 0.000 description 10
- 201000009030 Carcinoma Diseases 0.000 description 9
- 210000004204 blood vessel Anatomy 0.000 description 9
- 230000000694 effects Effects 0.000 description 9
- 239000010453 quartz Substances 0.000 description 9
- 201000006107 Familial adenomatous polyposis Diseases 0.000 description 8
- 230000008901 benefit Effects 0.000 description 8
- 208000029664 classic familial adenomatous polyposis Diseases 0.000 description 8
- 238000005259 measurement Methods 0.000 description 8
- 102000008186 Collagen Human genes 0.000 description 7
- 108010035532 Collagen Proteins 0.000 description 7
- 206010048832 Colon adenoma Diseases 0.000 description 7
- 229920001436 collagen Polymers 0.000 description 7
- 238000011161 development Methods 0.000 description 7
- 230000018109 developmental process Effects 0.000 description 7
- 238000010586 diagram Methods 0.000 description 7
- 230000033001 locomotion Effects 0.000 description 7
- 210000004876 tela submucosa Anatomy 0.000 description 7
- 102000001554 Hemoglobins Human genes 0.000 description 6
- 108010054147 Hemoglobins Proteins 0.000 description 6
- 206010020718 hyperplasia Diseases 0.000 description 6
- QSHDDOUJBYECFT-UHFFFAOYSA-N mercury Chemical compound [Hg] QSHDDOUJBYECFT-UHFFFAOYSA-N 0.000 description 6
- 229910052753 mercury Inorganic materials 0.000 description 6
- 210000004400 mucous membrane Anatomy 0.000 description 6
- 238000004458 analytical method Methods 0.000 description 5
- -1 aromatic amino acids Chemical class 0.000 description 5
- 238000000701 chemical imaging Methods 0.000 description 5
- 210000000981 epithelium Anatomy 0.000 description 5
- 230000002390 hyperplastic effect Effects 0.000 description 5
- 230000000877 morphologic effect Effects 0.000 description 5
- 210000000664 rectum Anatomy 0.000 description 5
- XLYOFNOQVPJJNP-UHFFFAOYSA-N water Substances O XLYOFNOQVPJJNP-UHFFFAOYSA-N 0.000 description 5
- 229910052724 xenon Inorganic materials 0.000 description 5
- FHNFHKCVQCLJFQ-UHFFFAOYSA-N xenon atom Chemical compound [Xe] FHNFHKCVQCLJFQ-UHFFFAOYSA-N 0.000 description 5
- 238000010521 absorption reaction Methods 0.000 description 4
- 201000011510 cancer Diseases 0.000 description 4
- 230000001427 coherent effect Effects 0.000 description 4
- 210000001100 crypt cell Anatomy 0.000 description 4
- 230000009977 dual effect Effects 0.000 description 4
- 230000003211 malignant effect Effects 0.000 description 4
- 238000012856 packing Methods 0.000 description 4
- 239000007787 solid Substances 0.000 description 4
- 208000017095 Hereditary nonpolyposis colon cancer Diseases 0.000 description 3
- 206010064912 Malignant transformation Diseases 0.000 description 3
- 238000013459 approach Methods 0.000 description 3
- 230000005540 biological transmission Effects 0.000 description 3
- 238000012321 colectomy Methods 0.000 description 3
- 208000029742 colonic neoplasm Diseases 0.000 description 3
- 201000010989 colorectal carcinoma Diseases 0.000 description 3
- 210000002808 connective tissue Anatomy 0.000 description 3
- 238000003745 diagnosis Methods 0.000 description 3
- 238000002405 diagnostic procedure Methods 0.000 description 3
- 238000001839 endoscopy Methods 0.000 description 3
- 210000004072 lung Anatomy 0.000 description 3
- 230000036212 malign transformation Effects 0.000 description 3
- 239000000203 mixture Substances 0.000 description 3
- 230000004048 modification Effects 0.000 description 3
- 238000012986 modification Methods 0.000 description 3
- 150000004032 porphyrins Chemical class 0.000 description 3
- 239000002243 precursor Substances 0.000 description 3
- 238000005070 sampling Methods 0.000 description 3
- 238000004088 simulation Methods 0.000 description 3
- 238000001429 visible spectrum Methods 0.000 description 3
- 238000012935 Averaging Methods 0.000 description 2
- LLQPHQFNMLZJMP-UHFFFAOYSA-N Fentrazamide Chemical compound N1=NN(C=2C(=CC=CC=2)Cl)C(=O)N1C(=O)N(CC)C1CCCCC1 LLQPHQFNMLZJMP-UHFFFAOYSA-N 0.000 description 2
- 208000008051 Hereditary Nonpolyposis Colorectal Neoplasms Diseases 0.000 description 2
- 238000012404 In vitro experiment Methods 0.000 description 2
- 206010061218 Inflammation Diseases 0.000 description 2
- 201000005027 Lynch syndrome Diseases 0.000 description 2
- 108700025716 Tumor Suppressor Genes Proteins 0.000 description 2
- 102000044209 Tumor Suppressor Genes Human genes 0.000 description 2
- 230000002159 abnormal effect Effects 0.000 description 2
- XKRFYHLGVUSROY-UHFFFAOYSA-N argon Substances [Ar] XKRFYHLGVUSROY-UHFFFAOYSA-N 0.000 description 2
- 229910052786 argon Inorganic materials 0.000 description 2
- 210000001367 artery Anatomy 0.000 description 2
- 230000015572 biosynthetic process Effects 0.000 description 2
- 210000004369 blood Anatomy 0.000 description 2
- 239000008280 blood Substances 0.000 description 2
- 210000004027 cell Anatomy 0.000 description 2
- 230000008859 change Effects 0.000 description 2
- 210000000349 chromosome Anatomy 0.000 description 2
- 210000004953 colonic tissue Anatomy 0.000 description 2
- 230000000875 corresponding effect Effects 0.000 description 2
- 210000000805 cytoplasm Anatomy 0.000 description 2
- 230000003247 decreasing effect Effects 0.000 description 2
- 210000002919 epithelial cell Anatomy 0.000 description 2
- 210000005081 epithelial layer Anatomy 0.000 description 2
- 230000005281 excited state Effects 0.000 description 2
- 238000001917 fluorescence detection Methods 0.000 description 2
- 238000002795 fluorescence method Methods 0.000 description 2
- 230000004077 genetic alteration Effects 0.000 description 2
- 231100000118 genetic alteration Toxicity 0.000 description 2
- 210000002175 goblet cell Anatomy 0.000 description 2
- 230000005283 ground state Effects 0.000 description 2
- 230000012010 growth Effects 0.000 description 2
- 230000002962 histologic effect Effects 0.000 description 2
- 238000003703 image analysis method Methods 0.000 description 2
- 230000004054 inflammatory process Effects 0.000 description 2
- 230000010354 integration Effects 0.000 description 2
- 229910052743 krypton Inorganic materials 0.000 description 2
- 230000007246 mechanism Effects 0.000 description 2
- 210000003205 muscle Anatomy 0.000 description 2
- 230000035772 mutation Effects 0.000 description 2
- 210000005036 nerve Anatomy 0.000 description 2
- BOPGDPNILDQYTO-NNYOXOHSSA-N nicotinamide-adenine dinucleotide Chemical compound C1=CCC(C(=O)N)=CN1[C@H]1[C@H](O)[C@H](O)[C@@H](COP(O)(=O)OP(O)(=O)OC[C@@H]2[C@H]([C@@H](O)[C@@H](O2)N2C3=NC=NC(N)=C3N=C2)O)O1 BOPGDPNILDQYTO-NNYOXOHSSA-N 0.000 description 2
- 229930027945 nicotinamide-adenine dinucleotide Natural products 0.000 description 2
- 210000004940 nucleus Anatomy 0.000 description 2
- 239000012071 phase Substances 0.000 description 2
- 238000000513 principal component analysis Methods 0.000 description 2
- 230000005855 radiation Effects 0.000 description 2
- 238000002271 resection Methods 0.000 description 2
- 208000024891 symptom Diseases 0.000 description 2
- 230000001360 synchronised effect Effects 0.000 description 2
- 208000022271 tubular adenoma Diseases 0.000 description 2
- 230000002792 vascular Effects 0.000 description 2
- 210000003462 vein Anatomy 0.000 description 2
- 206010002091 Anaesthesia Diseases 0.000 description 1
- 208000037260 Atherosclerotic Plaque Diseases 0.000 description 1
- UJKPHYRXOLRVJJ-MLSVHJFASA-N CC(O)C1=C(C)/C2=C/C3=N/C(=C\C4=C(CCC(O)=O)C(C)=C(N4)/C=C4\N=C(\C=C\1/N\2)C(C)=C4C(C)O)/C(CCC(O)=O)=C3C Chemical class CC(O)C1=C(C)/C2=C/C3=N/C(=C\C4=C(CCC(O)=O)C(C)=C(N4)/C=C4\N=C(\C=C\1/N\2)C(C)=C4C(C)O)/C(CCC(O)=O)=C3C UJKPHYRXOLRVJJ-MLSVHJFASA-N 0.000 description 1
- 208000005623 Carcinogenesis Diseases 0.000 description 1
- 208000009458 Carcinoma in Situ Diseases 0.000 description 1
- 206010071161 Colon dysplasia Diseases 0.000 description 1
- 241000136376 Colonides Species 0.000 description 1
- 208000034826 Genetic Predisposition to Disease Diseases 0.000 description 1
- 206010027476 Metastases Diseases 0.000 description 1
- 108091092878 Microsatellite Proteins 0.000 description 1
- 238000000342 Monte Carlo simulation Methods 0.000 description 1
- 108700020796 Oncogene Proteins 0.000 description 1
- 208000035977 Rare disease Diseases 0.000 description 1
- CDBYLPFSWZWCQE-UHFFFAOYSA-L Sodium Carbonate Chemical compound [Na+].[Na+].[O-]C([O-])=O CDBYLPFSWZWCQE-UHFFFAOYSA-L 0.000 description 1
- 239000004904 UV filter Substances 0.000 description 1
- 239000006096 absorbing agent Substances 0.000 description 1
- 210000003892 absorptive cell Anatomy 0.000 description 1
- 230000009471 action Effects 0.000 description 1
- 230000004913 activation Effects 0.000 description 1
- 208000009956 adenocarcinoma Diseases 0.000 description 1
- 230000037005 anaesthesia Effects 0.000 description 1
- 210000003484 anatomy Anatomy 0.000 description 1
- 230000003466 anti-cipated effect Effects 0.000 description 1
- 210000000709 aorta Anatomy 0.000 description 1
- 230000004888 barrier function Effects 0.000 description 1
- 230000000903 blocking effect Effects 0.000 description 1
- 230000017531 blood circulation Effects 0.000 description 1
- 230000036770 blood supply Effects 0.000 description 1
- 210000000988 bone and bone Anatomy 0.000 description 1
- 210000004556 brain Anatomy 0.000 description 1
- 238000013276 bronchoscopy Methods 0.000 description 1
- UIZLQMLDSWKZGC-UHFFFAOYSA-N cadmium helium Chemical compound [He].[Cd] UIZLQMLDSWKZGC-UHFFFAOYSA-N 0.000 description 1
- 230000036952 cancer formation Effects 0.000 description 1
- 231100000504 carcinogenesis Toxicity 0.000 description 1
- 210000004534 cecum Anatomy 0.000 description 1
- 210000003679 cervix uteri Anatomy 0.000 description 1
- 238000012512 characterization method Methods 0.000 description 1
- 238000006243 chemical reaction Methods 0.000 description 1
- 239000003795 chemical substances by application Substances 0.000 description 1
- 238000002512 chemotherapy Methods 0.000 description 1
- 208000037976 chronic inflammation Diseases 0.000 description 1
- 230000006020 chronic inflammation Effects 0.000 description 1
- 239000003086 colorant Substances 0.000 description 1
- 210000002777 columnar cell Anatomy 0.000 description 1
- 230000000295 complement effect Effects 0.000 description 1
- 239000002131 composite material Substances 0.000 description 1
- 239000000470 constituent Substances 0.000 description 1
- 230000008602 contraction Effects 0.000 description 1
- 230000001276 controlling effect Effects 0.000 description 1
- 238000001816 cooling Methods 0.000 description 1
- 230000002596 correlated effect Effects 0.000 description 1
- 230000002380 cytological effect Effects 0.000 description 1
- 238000013480 data collection Methods 0.000 description 1
- 238000012217 deletion Methods 0.000 description 1
- 230000037430 deletion Effects 0.000 description 1
- 230000001419 dependent effect Effects 0.000 description 1
- 238000012774 diagnostic algorithm Methods 0.000 description 1
- 238000002845 discoloration Methods 0.000 description 1
- 208000035475 disorder Diseases 0.000 description 1
- 210000003979 eosinophil Anatomy 0.000 description 1
- 210000003238 esophagus Anatomy 0.000 description 1
- 238000011156 evaluation Methods 0.000 description 1
- 230000001747 exhibiting effect Effects 0.000 description 1
- 238000013213 extrapolation Methods 0.000 description 1
- 210000003608 fece Anatomy 0.000 description 1
- 239000005350 fused silica glass Substances 0.000 description 1
- 230000009395 genetic defect Effects 0.000 description 1
- 230000002068 genetic effect Effects 0.000 description 1
- 230000000762 glandular Effects 0.000 description 1
- 239000011521 glass Substances 0.000 description 1
- 239000003365 glass fiber Substances 0.000 description 1
- 239000008187 granular material Substances 0.000 description 1
- 230000036541 health Effects 0.000 description 1
- 238000010191 image analysis Methods 0.000 description 1
- 230000006872 improvement Effects 0.000 description 1
- 201000004933 in situ carcinoma Diseases 0.000 description 1
- 238000012623 in vivo measurement Methods 0.000 description 1
- 238000007373 indentation Methods 0.000 description 1
- 210000004969 inflammatory cell Anatomy 0.000 description 1
- 208000027866 inflammatory disease Diseases 0.000 description 1
- 230000000968 intestinal effect Effects 0.000 description 1
- 230000009545 invasion Effects 0.000 description 1
- 150000002605 large molecules Chemical class 0.000 description 1
- 238000001499 laser induced fluorescence spectroscopy Methods 0.000 description 1
- 238000012886 linear function Methods 0.000 description 1
- 238000012417 linear regression Methods 0.000 description 1
- 210000004185 liver Anatomy 0.000 description 1
- 208000022115 localized superficial mass Diseases 0.000 description 1
- 238000007477 logistic regression Methods 0.000 description 1
- 210000001165 lymph node Anatomy 0.000 description 1
- 210000001365 lymphatic vessel Anatomy 0.000 description 1
- 229920002521 macromolecule Polymers 0.000 description 1
- 238000013507 mapping Methods 0.000 description 1
- 239000011159 matrix material Substances 0.000 description 1
- 230000009401 metastasis Effects 0.000 description 1
- 230000001394 metastastic effect Effects 0.000 description 1
- 206010061289 metastatic neoplasm Diseases 0.000 description 1
- 230000004001 molecular interaction Effects 0.000 description 1
- 230000008450 motivation Effects 0.000 description 1
- 210000002200 mouth mucosa Anatomy 0.000 description 1
- 230000000869 mutational effect Effects 0.000 description 1
- 230000009826 neoplastic cell growth Effects 0.000 description 1
- 230000001613 neoplastic effect Effects 0.000 description 1
- 208000012108 neoplastic polyp Diseases 0.000 description 1
- 210000000056 organ Anatomy 0.000 description 1
- 230000001575 pathological effect Effects 0.000 description 1
- 230000007310 pathophysiology Effects 0.000 description 1
- 230000000737 periodic effect Effects 0.000 description 1
- 230000002572 peristaltic effect Effects 0.000 description 1
- 208000014081 polyp of colon Diseases 0.000 description 1
- 238000003672 processing method Methods 0.000 description 1
- 230000001902 propagating effect Effects 0.000 description 1
- 230000000069 prophylactic effect Effects 0.000 description 1
- 108090000623 proteins and genes Proteins 0.000 description 1
- 238000001959 radiotherapy Methods 0.000 description 1
- 108700042226 ras Genes Proteins 0.000 description 1
- 238000001454 recorded image Methods 0.000 description 1
- 238000000611 regression analysis Methods 0.000 description 1
- 230000001105 regulatory effect Effects 0.000 description 1
- 230000008439 repair process Effects 0.000 description 1
- 238000011160 research Methods 0.000 description 1
- 230000003248 secreting effect Effects 0.000 description 1
- 230000028327 secretion Effects 0.000 description 1
- 230000011218 segmentation Effects 0.000 description 1
- 238000000926 separation method Methods 0.000 description 1
- 210000001599 sigmoid colon Anatomy 0.000 description 1
- 238000002579 sigmoidoscopy Methods 0.000 description 1
- 210000003491 skin Anatomy 0.000 description 1
- 210000000329 smooth muscle myocyte Anatomy 0.000 description 1
- 210000000130 stem cell Anatomy 0.000 description 1
- 230000004083 survival effect Effects 0.000 description 1
- 230000002459 sustained effect Effects 0.000 description 1
- 230000002123 temporal effect Effects 0.000 description 1
- 230000008719 thickening Effects 0.000 description 1
- 238000013519 translation Methods 0.000 description 1
- 230000014616 translation Effects 0.000 description 1
- 208000022158 tubulovillous adenoma Diseases 0.000 description 1
- 230000007306 turnover Effects 0.000 description 1
- 210000003932 urinary bladder Anatomy 0.000 description 1
- 239000012808 vapor phase Substances 0.000 description 1
- 210000005166 vasculature Anatomy 0.000 description 1
- 208000009540 villous adenoma Diseases 0.000 description 1
- 230000000007 visual effect Effects 0.000 description 1
- 238000012800 visualization Methods 0.000 description 1
Images


Classifications
-
- G—PHYSICS
- G01—MEASURING; TESTING
- G01J—MEASUREMENT OF INTENSITY, VELOCITY, SPECTRAL CONTENT, POLARISATION, PHASE OR PULSE CHARACTERISTICS OF INFRARED, VISIBLE OR ULTRAVIOLET LIGHT; COLORIMETRY; RADIATION PYROMETRY
- G01J3/00—Spectrometry; Spectrophotometry; Monochromators; Measuring colours
- G01J3/28—Investigating the spectrum
- G01J3/44—Raman spectrometry; Scattering spectrometry ; Fluorescence spectrometry
- G01J3/4406—Fluorescence spectrometry
-
- A—HUMAN NECESSITIES
- A61—MEDICAL OR VETERINARY SCIENCE; HYGIENE
- A61B—DIAGNOSIS; SURGERY; IDENTIFICATION
- A61B1/00—Instruments for performing medical examinations of the interior of cavities or tubes of the body by visual or photographical inspection, e.g. endoscopes; Illuminating arrangements therefor
- A61B1/00002—Operational features of endoscopes
- A61B1/00004—Operational features of endoscopes characterised by electronic signal processing
- A61B1/00009—Operational features of endoscopes characterised by electronic signal processing of image signals during a use of endoscope
- A61B1/000094—Operational features of endoscopes characterised by electronic signal processing of image signals during a use of endoscope extracting biological structures
-
- A—HUMAN NECESSITIES
- A61—MEDICAL OR VETERINARY SCIENCE; HYGIENE
- A61B—DIAGNOSIS; SURGERY; IDENTIFICATION
- A61B1/00—Instruments for performing medical examinations of the interior of cavities or tubes of the body by visual or photographical inspection, e.g. endoscopes; Illuminating arrangements therefor
- A61B1/00002—Operational features of endoscopes
- A61B1/00043—Operational features of endoscopes provided with output arrangements
- A61B1/00045—Display arrangement
- A61B1/0005—Display arrangement combining images e.g. side-by-side, superimposed or tiled
-
- A—HUMAN NECESSITIES
- A61—MEDICAL OR VETERINARY SCIENCE; HYGIENE
- A61B—DIAGNOSIS; SURGERY; IDENTIFICATION
- A61B1/00—Instruments for performing medical examinations of the interior of cavities or tubes of the body by visual or photographical inspection, e.g. endoscopes; Illuminating arrangements therefor
- A61B1/04—Instruments for performing medical examinations of the interior of cavities or tubes of the body by visual or photographical inspection, e.g. endoscopes; Illuminating arrangements therefor combined with photographic or television appliances
- A61B1/043—Instruments for performing medical examinations of the interior of cavities or tubes of the body by visual or photographical inspection, e.g. endoscopes; Illuminating arrangements therefor combined with photographic or television appliances for fluorescence imaging
-
- A—HUMAN NECESSITIES
- A61—MEDICAL OR VETERINARY SCIENCE; HYGIENE
- A61B—DIAGNOSIS; SURGERY; IDENTIFICATION
- A61B5/00—Measuring for diagnostic purposes; Identification of persons
- A61B5/0059—Measuring for diagnostic purposes; Identification of persons using light, e.g. diagnosis by transillumination, diascopy, fluorescence
- A61B5/0071—Measuring for diagnostic purposes; Identification of persons using light, e.g. diagnosis by transillumination, diascopy, fluorescence by measuring fluorescence emission
-
- A—HUMAN NECESSITIES
- A61—MEDICAL OR VETERINARY SCIENCE; HYGIENE
- A61B—DIAGNOSIS; SURGERY; IDENTIFICATION
- A61B5/00—Measuring for diagnostic purposes; Identification of persons
- A61B5/0059—Measuring for diagnostic purposes; Identification of persons using light, e.g. diagnosis by transillumination, diascopy, fluorescence
- A61B5/0082—Measuring for diagnostic purposes; Identification of persons using light, e.g. diagnosis by transillumination, diascopy, fluorescence adapted for particular medical purposes
- A61B5/0084—Measuring for diagnostic purposes; Identification of persons using light, e.g. diagnosis by transillumination, diascopy, fluorescence adapted for particular medical purposes for introduction into the body, e.g. by catheters
-
- A—HUMAN NECESSITIES
- A61—MEDICAL OR VETERINARY SCIENCE; HYGIENE
- A61B—DIAGNOSIS; SURGERY; IDENTIFICATION
- A61B5/00—Measuring for diagnostic purposes; Identification of persons
- A61B5/41—Detecting, measuring or recording for evaluating the immune or lymphatic systems
- A61B5/414—Evaluating particular organs or parts of the immune or lymphatic systems
- A61B5/415—Evaluating particular organs or parts of the immune or lymphatic systems the glands, e.g. tonsils, adenoids or thymus
-
- A—HUMAN NECESSITIES
- A61—MEDICAL OR VETERINARY SCIENCE; HYGIENE
- A61B—DIAGNOSIS; SURGERY; IDENTIFICATION
- A61B5/00—Measuring for diagnostic purposes; Identification of persons
- A61B5/41—Detecting, measuring or recording for evaluating the immune or lymphatic systems
- A61B5/414—Evaluating particular organs or parts of the immune or lymphatic systems
- A61B5/418—Evaluating particular organs or parts of the immune or lymphatic systems lymph vessels, ducts or nodes
-
- G—PHYSICS
- G01—MEASURING; TESTING
- G01J—MEASUREMENT OF INTENSITY, VELOCITY, SPECTRAL CONTENT, POLARISATION, PHASE OR PULSE CHARACTERISTICS OF INFRARED, VISIBLE OR ULTRAVIOLET LIGHT; COLORIMETRY; RADIATION PYROMETRY
- G01J3/00—Spectrometry; Spectrophotometry; Monochromators; Measuring colours
- G01J3/02—Details
- G01J3/0205—Optical elements not provided otherwise, e.g. optical manifolds, diffusers, windows
- G01J3/0232—Optical elements not provided otherwise, e.g. optical manifolds, diffusers, windows using shutters
-
- G—PHYSICS
- G01—MEASURING; TESTING
- G01J—MEASUREMENT OF INTENSITY, VELOCITY, SPECTRAL CONTENT, POLARISATION, PHASE OR PULSE CHARACTERISTICS OF INFRARED, VISIBLE OR ULTRAVIOLET LIGHT; COLORIMETRY; RADIATION PYROMETRY
- G01J3/00—Spectrometry; Spectrophotometry; Monochromators; Measuring colours
- G01J3/02—Details
- G01J3/10—Arrangements of light sources specially adapted for spectrometry or colorimetry
-
- G—PHYSICS
- G01—MEASURING; TESTING
- G01N—INVESTIGATING OR ANALYSING MATERIALS BY DETERMINING THEIR CHEMICAL OR PHYSICAL PROPERTIES
- G01N21/00—Investigating or analysing materials by the use of optical means, i.e. using sub-millimetre waves, infrared, visible or ultraviolet light
- G01N21/62—Systems in which the material investigated is excited whereby it emits light or causes a change in wavelength of the incident light
- G01N21/63—Systems in which the material investigated is excited whereby it emits light or causes a change in wavelength of the incident light optically excited
- G01N21/64—Fluorescence; Phosphorescence
- G01N21/645—Specially adapted constructive features of fluorimeters
- G01N21/6456—Spatial resolved fluorescence measurements; Imaging
-
- A—HUMAN NECESSITIES
- A61—MEDICAL OR VETERINARY SCIENCE; HYGIENE
- A61B—DIAGNOSIS; SURGERY; IDENTIFICATION
- A61B1/00—Instruments for performing medical examinations of the interior of cavities or tubes of the body by visual or photographical inspection, e.g. endoscopes; Illuminating arrangements therefor
- A61B1/04—Instruments for performing medical examinations of the interior of cavities or tubes of the body by visual or photographical inspection, e.g. endoscopes; Illuminating arrangements therefor combined with photographic or television appliances
- A61B1/05—Instruments for performing medical examinations of the interior of cavities or tubes of the body by visual or photographical inspection, e.g. endoscopes; Illuminating arrangements therefor combined with photographic or television appliances characterised by the image sensor, e.g. camera, being in the distal end portion
-
- A—HUMAN NECESSITIES
- A61—MEDICAL OR VETERINARY SCIENCE; HYGIENE
- A61B—DIAGNOSIS; SURGERY; IDENTIFICATION
- A61B1/00—Instruments for performing medical examinations of the interior of cavities or tubes of the body by visual or photographical inspection, e.g. endoscopes; Illuminating arrangements therefor
- A61B1/06—Instruments for performing medical examinations of the interior of cavities or tubes of the body by visual or photographical inspection, e.g. endoscopes; Illuminating arrangements therefor with illuminating arrangements
- A61B1/07—Instruments for performing medical examinations of the interior of cavities or tubes of the body by visual or photographical inspection, e.g. endoscopes; Illuminating arrangements therefor with illuminating arrangements using light-conductive means, e.g. optical fibres
-
- G—PHYSICS
- G01—MEASURING; TESTING
- G01N—INVESTIGATING OR ANALYSING MATERIALS BY DETERMINING THEIR CHEMICAL OR PHYSICAL PROPERTIES
- G01N21/00—Investigating or analysing materials by the use of optical means, i.e. using sub-millimetre waves, infrared, visible or ultraviolet light
- G01N21/62—Systems in which the material investigated is excited whereby it emits light or causes a change in wavelength of the incident light
- G01N21/63—Systems in which the material investigated is excited whereby it emits light or causes a change in wavelength of the incident light optically excited
- G01N21/64—Fluorescence; Phosphorescence
- G01N2021/6417—Spectrofluorimetric devices
- G01N2021/6421—Measuring at two or more wavelengths
-
- G—PHYSICS
- G01—MEASURING; TESTING
- G01N—INVESTIGATING OR ANALYSING MATERIALS BY DETERMINING THEIR CHEMICAL OR PHYSICAL PROPERTIES
- G01N21/00—Investigating or analysing materials by the use of optical means, i.e. using sub-millimetre waves, infrared, visible or ultraviolet light
- G01N21/62—Systems in which the material investigated is excited whereby it emits light or causes a change in wavelength of the incident light
- G01N21/63—Systems in which the material investigated is excited whereby it emits light or causes a change in wavelength of the incident light optically excited
- G01N21/64—Fluorescence; Phosphorescence
- G01N21/645—Specially adapted constructive features of fluorimeters
- G01N2021/6484—Optical fibres
Definitions
- UV light was used at 370 nm to excite visible fluorescence (400-700 nm), the spectral signatures of which enabled differentiating between normal and abnormal tissues.
- Previously endoscopic imaging has been achieved using an optics module mounted in one of the biopsy ports of a two-port standard (white light) colonoscope.
- the optics module employs a quartz optical fiber and associated optics to deliver the UV light to the tissue, and a coherent quartz fiber-optic bundle to transmit the resulting fluorescence image to the proximal side of the endoscope, where a filter removes the large background of reflected UV light and the fluorescence image is then captured by a high-gain CID detector array.
- Endoscopically-collected autofluorescence images of colonic mucosa can be used as a screening tool for detecting pre-cursors to colorectal cancer (CRC). Fluorescence has been used to distinguish between normal mucosa and adenomas. In particular, spectra measured with single point contact probes with the use of several different excitation wavelengths.
- Fluorescence spectra have been obtained through optical fiber probes with several excitation wavelengths.
- An in vitro study performed a search over a wide range of excitation wavelengths, and concluded that 370 nm is optimal for distinguishing between normal mucosa and adenoma.
- Both in vitro and in vivo studies using adenomatous polyps as a model for dysplasia have shown that with this wavelength dysplasia has less peak intensity at 460 nm and may have increased fluorescence at 680 nm compared with normal colonic mucosa.
- the morphologic basis for these spectral differences have been studied by fluorescence microscopy.
- the decreased fluorescence intensity in polyps was attributed to its raised architecture, increased vasculature, and reduced collagen in the lamina propria.
- the red enhancements arise from increased fluorescence of the crypt cells, which may be caused by higher levels of porphyrin.
- US-A-5,187,572 discloses an electronic endoscope provided with a photoelectrically converting solid state imaging device and a light guide transmitting an illuminating light.
- a video signal processing circuit processes signals for the solid state imaging device.
- the electronic endoscope, the light guide and the video signal processing circuit are selectively connected and have a first light source and second light source for supplying different illuminating lights, respectively. Where the two light sources receive synchronizing signals from the video signal processing circuit and synchronized each other, the two light sources can supply the illuminating lights to a light guide. When the connection of the light guide is changed, the disorder of a picture image can be reduced.
- DE-A-195 35 114 discloses a fluorescence diagnosis endoscope system comprising the features of the first past of claim 1.
- the endoscope is used to observe human tissue.
- the system has a light source for illuminating the human tissue with normal light and excitation light having a certain wavelength range.
- the human tissue fluoresces in response to illumination with the excitation light.
- the system further has a pair of image receiving elements for outputting image signals corresponding to received optical images.
- a filter which transmits only light produced by the fluoresced human tissue is provided in front of one image receiving element.
- the image signals output by the image receiving elements are selectively processed and transmitted to a display.
- the present invention relates to imaging endoscopes and in particular to a floureacence imaging colonoscope using a dual channel electronic endoscope that employs a charge coupled device (CCD) chip or other solid state imaging device mounted on its distal tip to collect the white light image.
- CCD charge coupled device
- this chip can also collect the fluorescence image, displaying it on the endoscope's video monitor with much larger signal size than that obtained using the optics module and intensified CID camera.
- This configuration was used to collect fluorescence images of colonic dysplasia. Video images of two small FAP polyps, have been taken with the standard white light image and the unprocessed fluorescence image.
- the CCD detector which lacks gain intensification, detects the weak fluorescence signals, which are six orders of magnitude smaller in intensity than the diffusely reflected white light image.
- the CCD effectively serves as its own long pass filter.
- Other imaging devices can be used with a filter to reduce by at least one half the detected intensity in the ultraviolet region relative to the detected intensity in the visible region.
- the CCD has a resolution of 270 x 328 pixels and an objective lens of 2.5 mm in diameter.
- the images are collected in 33 ms in RGB format.
- the advantages of this particular embodiment include that the in vitro fluorescence images exhibit a signal-to-noise ratio (SNR) of about 34 at clinical working distances of 20 mm (distance between tip of endoscope and tissue surface), which is superior to that obtained using the UV Module/CID detector, which has a SNR of about 18 at the same distance.
- SNR signal-to-noise ratio
- the use of the CCD eliminates the need for the optics module and greatly simplifies system design. In addition, it also avoids problems associated with the tendency of the UV module to rotate in the biopsy channel.
- the CCD in this particular embodiment contains 88,560 pixels compared to 10,000 fibers for the UV module, resulting in higher total image resolution.
- the objective lens on the Pentax colonoscope has better imaging properties than the UV module.
- the characteristic width for the line spread function of the lens of this embodiment is 200 mm compared to 400 mm for the UV Module.
- the overall rigidity of the spectral endoscope is not increased significantly with a single UV illumination fiber.
- the diagnostic methods employed can be based on the overall fluorescence intensity difference between normal mucosa and dysplasia. Thus, in certain applications it is preferable to collect the fluorescence emission over the full band between 400-700 nm. However, accurate measurements can use a point contact device such that diagnostic information can be obtained by sampling the fluorescence at a plurality of specific wavelengths such as 460, 600 and 680 nm, for example. Endoscopic imaging studies with the electronic CCD endoscope can include the use of color CCD's, which have the ability provide such information.
- N s p ⁇ s ⁇ ⁇ cm ⁇ g 2 ⁇ T f ⁇ T i ⁇ T o ⁇ f p ⁇ r s 2 ⁇ ⁇ r ⁇ cm ⁇ ⁇ ⁇ tan ⁇ m 2 ⁇ P o ⁇ er ⁇ ⁇ ⁇ t hc ( 1 - cos ⁇ m ) N f ⁇ d 2 ⁇ 1 ⁇ + p d 2 3.5
- SNR N s N s + ⁇ c G 2
- the geometry and certain symbols are defined in Figure 1 .
- the signal to noise ratio (SNR) is a function of electronic noise ⁇ c and gain G.
- Colorectal cancer constitutes a major national health care problem.
- the incidence and mortality for carcinomas of the colon and rectum are second only to those of lung in the United States. This suggests that the current screening methods are inadequate for controlling the spread of colon cancer, and that little advancement in detection has occurred in a long time.
- the five year survival rate for all patients diagnosed is between 35-49%.
- Colorectal cancer is relatively unresponsive to radiation and chemotherapy, hence surgical resection with wide margins is the only reliable method of preventing its growth.
- These tumors spread by direct extension into adjacent structures and by metastasis through the lymphatics and blood vessels. The most common sites of metastatic spread in order are regional lymph nodes, liver, lungs, and bones.
- the pathophysiology of this disease begins in the epithelial layer of colonic mucosa as dysplastic changes in the crypts cells.
- This tissue can be accessed by colonoscope, and if the pre-malignant lesions are detected at an early stage, they can be removed for biopsy.
- Most carcinomas of the colon and rectum are believed to arise from visible precursor lesions called adenomatous polyps.
- These benign masses evolve from a monoclonal expansion of epithelial cells which develop irregularities in the size and shape of the nuclei and cytoplasm, a condition known as dysplasia. These lesions can be detected on colonoscopy by their raised architecture.
- adenoma-carcinoma sequence suggests that colorectal carcinoma arises from adenomatous tissue that undergoes malignant transformation, which is believed to occur through a multistep process in which genetic alterations accumulate.
- the presence of a precursor stage in the development of CRC provides a window of opportunity for early detection and removal of these lesions to prevent future progression into carcinoma.
- the method of fluorescence endoscopic imaging offers features which can overcome the present screening limitations with white light endoscopy. This method is sensitive to the biochemical constituents and microarchitecture below the tissue surface. Furthermore, combined with endoscopes, fluorescence images can scan wide areas, and can resolve tissue surfaces on the sub-millimeter scale. If sufficient information is present on the fluorescence, computers can be used to determine the presence and location of diseased regions in real-time. Autofluorescence has demonstrated the ability to distinguish between normal and neoplastic human tissue. The first studies showed that single point fluorescence spectra can be used to detect tumors in vitro from several types of tissue,.
- HpD hematoporphyrin derivative
- the mucosa is the layer in contact with the lumen, and has a thickness of about 400 ⁇ m.
- the epithelium is the most superficial layer and consists of absorptive columnar cells and intermittent mucin-producing goblet cells, which function to reabsorb water and to lubricate. These cells undergo continuous turnover, and are replaced by rapidly dividing stem cells at the base of the crypts, where the first signs of dysplasia can be observed.
- the surrounding lamina intestinal contains blood and lymphatic capillaries which supports the secretory, absorptive and other highly active functions of the mucosa. It consists of loose connective tissue, in particular collagen, along with numerous inflammatory cells which protect the intestinal wall from invasion by microbes.
- the muscularis mucosa is composed of several layers of smooth muscle fibers which contract to expel secretions from the glandular crypts, prevents clogging, and enhances absorption by maintaining contact between epithelium and luminal contents.
- the submucosa contains the larger blood vessels, lymphatics, and nerves, and are surrounded by dense collagenous connective tissue which keeps the mucosa attached to the muscularis propria.
- the muscularis laminate contains an inner circular and outer longitudinal muscle layer, which are involved in the involuntary peristaltic contractions of the colon for propagating the flow of fecal matter.
- the outer serosal layer consists of connective tissue which contain the major blood vessels and nerves.
- Adenomatous polyps are raised protrusions of mucosa which contain immature, poorly differentiated epithelial cells with irregularity in size and shape of the nuclei. These lesions are benign but they have the potential to transform into colorectal carcinoma.
- the different morphological types include tubular, villous, and tubulovillous adenomas. Although all forms are raised, each type can either contain a stalk, which is called pedunculated, or can be hemispheric, which is known as sessile.
- the malignant potential of polyps are greatest with the villous form and least with the tubular. Also, the probability of carcinoma developing increases with the size of the polyp.
- HNPCC hereditary nonpolyposis colorectal cancer
- ulcerative colitis the mucosa undergoes cytological changes resulting in the formation of dysplasia without the presence of polyp formation. These changes are believed to be associated with repeated episodes of chronic inflammation and repair of the colonic epithelium, and flat, ulcerated tumors with poorly defined margins are common. Patients who have had UC for over 8 years are recommended to have periodic colonoscopy with random biopsies taken. This screening process is not effective because less than 0.1 percent of the total mucosal surface area is sampled. However, it is important to note that only 1% of new incidences of CRC arise from UC cases.
- UC ulcerative colitis .
- Patients with UC are at increased risk for developing dysplasia or cancer. Recognition of this increased risk has resulted in colonoscopic surveillance strategies starting at 7-10 years after the initial presentation of symptoms. Colonic surveillance strategies include direct macroscopic visualization of colonic mucosa and access to mucosal biopsies for microscopic assessment of dysplasia. Although the pathological classification of dysplasia was standardized in 1983, differences and inconsistencies remain regarding the interpretation of dysplasia.
- Dysplasia is typically focal. Despite the practice of taking 12-20 mucosal biopsies during surveillance colonoscopy, less than 1% of the colonic surface is sampled, so the likelihood of missing small foci of dysplasia is high. Thus, cancers can develop in patients without any previous or concurrent dysplasia. Although performing prophylactic colectomy on all patients after the first decade of disease would be the most definitive solution to the cancer problem in UC, patients with minimal or mild symptoms of the disease are understandably reluctant to take this radical approach. Colonoscopic surveillance with histologic interpretation remains an imperfect science in need of improved methodologies with greater sensitivity and specificity.
- flat dysplasia may be the origin of sporadic colon cancer which does not arise via the adenoma-carcinoma sequence.
- the morphological characteristics of adenomas that proliferate superficially in flat nonpolypoid mucosa have been observed endoscopically as small plaquelike lesions with vague redness or discoloration.
- 33 such lesions were described as slightly elevated with a reddish surface and a central depression.
- Foci of cancer or severe atypia were found in 25% of lesions of diameter up to 4 mm, 40% of lesions measuring between 5 and 8 mm, and 80% of lesions with diameter between 9 and 10 mm.
- a sigmoidoscopy involves the clinician viewing the patient's rectum and sigmoid colon with either a rigid or flexible imaging device. This form of screening is based on the finding that 60% of CRC occur within the distal 25 cm of the colon. This length is reachable with a rigid sigmoidoscope, and a flexible one can reach up to 60 cm. However, recent statistics have shown that an increasing number of tumors are found beyond the reach of this device. An advantage of this procedure is that it can be performed without the patient undergoing anesthesia or taking a prep. The most extensive method of screening for this disease is a colonoscopy, where the patient is first prepped and sedated.
- a colonoscope is inserted throughout the full length of the colon, and the mucosal surface is viewed by the physician under white light for polyps and other abnormal masses. This procedure is adequate for identifying raised lesions, but flat region of dysplasia will go undetected.
- the fluorescence of tissue occurs through a process in which the electrons of a biological molecule enters an elevated energy state upon absorbing laser light at a given excitation wavelength ⁇ ex .
- the excited state is unstable, and the electrons will return to the ground state. Most of this energy is lost as heat through molecular collisions, but a small fraction of excited electrons undergo an internal conversion and spontaneously radiates light at longer emission wavelengths ⁇ em .
- the fraction of molecules which release energy by fluorescence is called the quantum efficiency of the tissue, denoted as ⁇ t .
- the fluorescence intensity depends on the product of the initial population of the excited state and the tissue quantum efficiency.
- the spectral lineshape is determined by the fluorescence emission and absorption by biochemical molecules which are unique to the composition of tissue.
- the electronic levels of the singlet state are split into vibrational and rotational states, which in large molecules consists of small intervals and may overlap due to molecular interactions.
- the electrons may decay to any of the vibrational-rotational levels of the ground state, thus, the fluorescence spectra of biomolecules are typically broad. This lack of structure in the spectra limits the amount of information that can be obtained from fluorescence.
- the tissue components which produce fluorescence are known as fluorophores, and endogenous chromophores include aromatic amino acids, NADH, FAD, and porphyrins.
- the local environment may have a large effect on the fluorescence emission, which may become quenched or shifted in wavelength. Further details regarding the use of outafluorescence for imaging tissue can be found in U.S. Patent Nos. 4,193,142 , 5,421,337 , 5,452,723 , 5,280,788 and 5,345,941 .
- a first step taken in evaluating the use of fluorescence in colon was to determine the existence of optimal wavelengths to differentiate between normal colon mucosa and adenomatous polyps in vitro with single point measurements on a sub-millimeter scale. For example, the fluorescence emissions of 4 normal colon and 11 adenomatous polyps were recorded with a spectrofluorimeter. The excitation wavelengths used ranged between 250 to 500 nm in 10 nm steps, and the results were tabulated in an array called an excitation-emission matrix (EEM). A ratio was taken of the average EEM from the normal colon to that of the adenomatous polyps, and excitation at 330, 370, and 430 nm were found to produce fluorescence spectra which contained the greatest amount of diagnostic information.
- EEM excitation-emission matrix
- the spectra showed a difference at 460 nm where the normal mucosa produced about 6 times greater fluorescence intensity than adenoma. This difference is almost twice that found from the in vitro studies. Above 650 nm, the average of the adenomas were slightly greater than that of normal.
- the fluorescence intensities at 460 and 680 nm were located on a scatter plot, and a straight line was drawn to minimize the number of misclassifications when compared to histology.
- the decision line correctly classified 31 of 31 adenomas, 3 of 4 hyperplastic polyps, and 31 of 32 normal colonic tissue specimens.
- the sensitivity, specificity and positive predictive value of the technique for diagnosing adenomas were 100%, 97%, and 94% respectively. Because only a small number of hyperplastic polyps were examined, it was unclear whether adenoma could be reliably distinguished from hyperplasia using fluorescence. The observed differences in the fluorescence may arise from architectural differences between polyps and the normal mucosa rather than from dysplastic changes.
- the next step was to use the data from this study to provide prospective methods of evaluating the performance of fluorescence.
- the data were randomly divided into two equal sets, and the first was used to devise an algorithm to distinguish the tissue type based on the fluorescence intensity at 460 nm and at the ratio between intensities at 680 to that at 600 nm.
- a biopsy of tissue from each point was classified histologically as adenomatous, hyperplastic, or normal. From the prospective decision criteria, the sensitivity, specificity and positive predictive value of the algorithm for diagnosing adenomas were 90%, 95%, and 90% respectively.
- fluorescence to distinguish between normal mucosa, adenomatous polyps and hyperplastic polyps in vivo with 337 nm excitation. Fluorescence spectra were measured from 86 normal colonic sites, 35 hyperplastic polyps, and 49 adenomatous polyps with a single optical fiber. The fluorescence emission displayed peaks at 390 and 460 nm, which was attributed to the collagen in the submucosa. Also, this peak decreased in intensity for normal mucosa, hyperplastic polyps, and adenomas, respectively. The peak intensity of the normal mucosa was found to be slightly less than twice that for adenomas.
- excitation wavelengths have been used to study fluorescence in colon.
- a continuous wave He-Cd laser was used to deliver 325 nm excitation to measure fluorescence spectra from 35 normal mucosa and 35 adenomatous polyps in vitro from a single optical fiber by an OMA.
- the peak intensity from normal mucosa occurred at 375 nm and that for adenoma appeared at 450 nm.
- a multi-variate linear regression (MVLR) analysis established a set of scores for each data point to determine a diagnostic criterion. Fluorescence spectra from an additional 34 normal, 16 adenomatous, and 16 hyperplastic sites were taken and analyzed prospectively using the established decision criteria.
- the sensitivity, specificity and positive predictive value of this study to distinguish between normal and adenomatous tissue were found to be 100%, 100%, and 94%, respectively.
- 15 of 16 hyperplastic polyps were classified as normal, which is the correct diagnosis because hyperplastic polyps are formed from a thickening of the epithelial layer.
- the fluorescence of colon was studied with 410 nm excitation as well.
- the emission from 450-800 nm was collected with a spectrofluorimeter from 83 biopsy specimens removed during colonoscopy from 45 patients.
- the intensity of the emission band from 460-530 nm declined from normal to carcinoma to adenomatous mucosa.
- the peak intensity at 460 nm was about 2.5 times higher for normal mucosa than for adenoma.
- a stepwise discriminant analysis was performed on the spectra using nine variables.
- the results compared to histology showed that the process distinguished between normal mucosa and adenoma with a sensitivity and specificity of 88.2% and 95.2%, respectively.
- the fluorescence emission resulted from the superposition of three bands centered at about 475, 485, and 404 nm.
- Fluorescence microphotographs of unstained frozen sections were studied to account for the morphological structures in normal colonic mucosa and adenomatous polyps which emit fluorescence.
- the 351 and 364 nm lines from an argon-ion laser were used for fluorescence excitation, and the emission was collected by a series of barrier filters with cut-off wavelengths of 420, 475, 515, 570, and 610 nm.
- the fluorescence intensity was graded semi-quantitatively from 1+ to 4+ by a single observer.
- fluorescence in the spectral band from 420 to 700 from collagen in the laminalitis was graded at 3+ and that in the submucosa at 4+ in the same emission bandwidth.
- the mucosa attenuates both the incoming excitation light and the returning fluorescence; if the mucosa is sufficiently thick, the underlying submucosa cannot contribute, but if it is thin, as in normal mucosa, attenuation is smaller, resulting in brighter tissue fluorescence.
- the fluorescence intensity of adenomas is less than that of normal colonic mucosa, perhaps because the dysplastic crypts tend to displace the collagen in the lamina intestinal, which is the dominant fluorophore.
- Adenomas exhibit greater attenuation of both the 370 nm excitation light and the return fluorescence, due to increased hemoglobin-rich microvasculature.
- a multi-spectral imaging system which collects fluorescence at four different emission wavelengths simultaneously.
- the output of a fiber optic endoscope is passed through 4 spatially separated interference filters.
- the 4 images are arranged onto quadrants of an intensified CCD array by adjustable segments of a multi-mirror system.
- the CCD or other imaging device 40 as seen in Figure 2 can have 30,000 pixel elements or more.
- the four wavelengths were selected to optimize the contrast in the fluorescence spectra between normal and diseased tissue. Fluorescence from human cadaveric aorta was excited with 337 nm, and emissions from 400, 420, 450, and 480 nm were ratioed to produce a dimensionless contrast function.
- the resolution of this design is limited by the fibers in the imaging bundle.
- the use of 4 fluorescence emission wavelengths provides for greater contrast between normal and diseased tissue and for flexibility in the development of the disease detection process.
- the signal is reduced by a factor of 4, thus lowering the SNR.
- the 4 spectral images must be aligned onto the detector at different angles, which poses a challenge for image registration.
- image processing algorithms using multiple images increase the computation time, and it is not clear that the fluorescence contains independent information at 4 bands.
- the fluorescence images are detected at the proximal end of the endoscope, which poses difficulty in clinical use for registering the white light image and in navigating the instrument.
- a simpler version of the multi-spectral imaging system which collects only 2 emission bands. This design splits the fluorescence emission with a beam splitter onto two intensified CCD cameras.
- a helium cadmium laser delivers excitation light at 442 nm via the illumination bundle of a fiberoptic bronchoscope.
- the fluorescence emission was filtered in 2 bands, one between 480 and 520 nm and the other at wavelengths greater than 630 nm.
- the two spectral images were aligned, and the intensities were ratioed point by point for discriminating normal from diseased tissue, and a color image was formed. This method eliminates the effects of distance and angle of the illuminating light, as well as tissue reflective properties.
- a color camera is attached separately for observing the white light image. This system was tested clinically on 53 patients and 41 volunteers, and the results were compared with conventional white light bronchoscopy at 328 sites. The sensitivity on fluorescence was 73%, which was significantly greater than that of 48% found on white light in detecting dysplasia and carcinoma in situ. The two methods were found to have the same specificity of 94%.
- the white light and fluorescence images were collected with a dual-channel electronic colonoscope (Pentax EC-3800TL).
- This model contains two biopsy channels with diameters of 3.8 and 2.8 mm, respectively.
- the outer diameter of the endoscope is 12.8 mm, and the working length is 1.7 m.
- the field of view of the multi-element objective lens has a divergence half-angle of 60° with a depth of focus ranging between 5 and 100 mm.
- the white light illumination is produced by a 300 W short-arc xenon lamp. By using the same detector for both white light and fluorescence imaging, perfect registration can be obtained. This feature is ideal for producing a diagnostic overlay.
- the illumination probe was inserted into one of the instrument channels, and the tip was placed flush with the distal end of the colonoscope.
- a mode mixer clamped the excitation fiber at the proximal end to maximize the divergence angle of the light.
- the probe was attached at the proximal end of the colonoscope by a leur lock to prevent movement.
- a power of 300 mW was delivered to the tissue.
- FIG. 1 shows a schematic view of the endoscope 10 with an imaging bundle 20, biopsy view of the endoscope 10 with an imaging bundle 20, biopsy channel 12, lens 18, and illumination ports 14.
- the distal end of the device is positioned at a distance d from the tissue.
- One problem associated with such a system is the shadows generated by the illumination system.
- An important feature of the invention described below is a process to compensate for shadows on the tissue 16 surface.
- a footswitch was activated by the user to block the excitation light when the white light was used for illumination, and vice versa, using a pair of computer controlled shutters (Uniblitz, VS14).
- the integration time for acquiring each fluorescence image is 33 ms.
- the clinical fluorescence imaging system 40 consists a video processor 48, computer 44, monitor 46, mavigraph 50, and VCR 52, laser 42 and colonoscope 54.
- An electronic colonoscope 54 detects photons at the distal end with a CCD detector.
- An important aspect of the present invention is that the spectral response of the Texas Instrument TC-210 CCD detector dropped sufficiently fast below 400 nm that no diffuse reflection from the UV excitation was observed. In fact, virtually no specular reflection, which is several orders of magnitude higher in intensity than diffuse reflectance and fluorescence, was observed either.
- Another aspect which made this system possible was that the detector has sufficient sensitivity to detect fluorescence from colonic mucosa without the use of an intensifier. Because the detector is located at the distal end, the optical transmission efficiency is determined only by the multi-element objective lens positioned between the detector and the tissue.
- Another significant feature of this embodiment of the invention is that the same chip detects both the white light and fluorescence image, thus perfect registration occurs on the pseudo-color overlay. Furthermore, no modifications are necessary to the colonoscope which can impede the clinician's ability to perform, the procedure.
- the TC 210 is a monochrome detector and collects fluorescence over the full visible spectrum. It is difficult to employ bandpass filters in front of the CCD because the light is collected at angles as high as 60°.
- RGB detectors exist which contain pixels which are sensitive to red, green, and blue light, and can produce fluorescence images in 3 frames.
- the passbands are determined by the integrated circuit manufacturer of the imaging circuit. Note that a gating mechanism can also be used, which is desirable for using pulsed lasers as the excitation source.
- Other excitation sources can include CW lasers and broad or narrow band light sources.
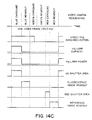
- FIG. 5 The block diagram of an electronic imaging system operated by switch 76 is shown in Figure 5 .
- An argon-ion laser 60 delivers UV light through a shutter 62 into a quartz optical fiber coupled to a microlens located in one instrument channel of the colonoscope, while the white light 64 is delivered through shutter 66 the illumination fibers of port 70.
- the pair of shutters 62, 55 are computer-controlled by a digital input/output (I/O) card 74. Both the fluorescence and white light images are detected by the CCD 72 at the distal end.
- a frame grabber 78 digitizes the fluorescence and white light images sequentially.
- a host microcomputer executes the image processing algorithm and displays the pseudo-color overlay.
- a mavigraph is used to convert the white light image with overlay into a format which can be recorded by the VCR.
- the plot in Figure 6 shows the fluorescence intensity from the average of 14 frames collected with the electronic imaging system. A row of pixels is shown from normal colonic mucosa. Also plotted are the measured and the predicted SNR. The SNR is approximately 30 at the center and it falls to about 10 near the periphery. Thus, the full field of view satisfies the minimum SNR requirement of 4 for the instrument-noise limited detection for distinguishing between normal colonic mucosa and adenomas.
- FIGS 7A and 7B show the differences between the values across a row of pixels in a single frame compared to the average of 14 frames.
- the plot in Figure 7A is that for the normal specimen shown in Figure 6
- the plot in Figure 7B is from a sample of mucosa which contains an adenoma in the center.
- the variation about the average is small compared to the difference in fluorescence intensity between normal and adenomatous tissue. Thus, the occurrence of false positives resulting from pixel-to-pixel variation is small.
- a streaking artifact appeared in the fluorescence images taken with the electronic imaging system. This artifact arose because the UV excitation light was not blocked while the CCD rows were being read out electronically, which is performed under normal white light illumination by a rotating wheel with spatially separated filter. This artifact can be removed in the processing software of the image data.
- the excitation source used was a Coherent Innova 328. This laser is rated for 1 W in the UV, and requires 60 A at 208 V of electrical power and 3 gal/min of water.
- the excitation light is coupled into an optical fiber device including lengths of 12.5 and 16.5 m of fiber were required to deliver the excitation light to the distal end of the colonoscope.
- the excitation fiber must be incorporated in the colonoscope.
- a method is used to rapidly switch between white light and laser illumination.
- a method of quickly and accurately registering the fluorescence results with the white light images must be implemented.
- the colonoscopy procedures included prep of the patient with 3 oz of Fleet phospha soda mixed with 4 oz of water. There was no measurable fluorescence from the prep mixture using an optical fiber contact probe on colonic mucosa in vitro with 370 nm excitation.
- the white light image can include a vascular pattern of arteries in red, and an outline of a vein in blue. Patches of specular reflection can be seen on the lower half of the images.
- the fluorescence of normal mucosa appears uniform with an arterial pattern interspersed as reduced fluorescence intensity. This effect is attributed to the absorption of fluorescence emission by hemoglobin.
- the vein does not appear on the fluorescence image, and there is virtually no specular reflection from the excitation light.
- the illumination field on fluorescence is slightly smaller than that on white light, as depicted in Figure 4 .
- An example illustrates the process of image collection, processing and evaluation of adenomatous polyps.
- a white light endoscopic image taken of a sporadic polyp located in the rectum shows a polyp with visible architectural features about 5 mm in diameter is located in the lower half of the image near the middle.
- the adenoma appears as a region of reduced intensity surrounding a brighter central region.
- This image was ratioed with its own moving average image, and multiplied by 100 to produce the percent ratio image. Thresholds on the processed fluorescence images taken at 60%, 75%, and 90% were used to determine the contour lines which define regions of mucosa with various likelihoods of containing dysplasia. The contours were then filled in pseudocolor to highlight areas of tissue to be targeted for biopsy. The pseudocolors red, green and blue designate regions on the white light image which have high, medium and low probability, respectively. The polyp was found to be adenomatous on histology.
- Overlay regions indicating disease included one located at the site of the adenoma, and the other two corresponded to shadows cast by mucosal folds. The shadows appeared as regions of reduced intensity on the fluorescence image. These effects were minimized by directing the endoscope normal to the mucosal surface. Moreover, the overlay regions which resulted from shadows changed in size and shape as the angle of the endoscope to the tissue surface varied, while those generated from the adenoma remained fixed in size.
- White light and fluorescence images were collected from a total of 30 patients undergoing routine colonoscopy, which included images from 14 adenomas and 5 hyperplastic polyps. A biopsy was taken of each adenoma and one adjacent normal site. The fluorescence images were processed by the moving average algorithm, and the sensitivity of detection was determined as a function of threshold values ranging from 55% to 90%. The results of sensitivity are plotted in Figure 8 .
- Autofluorescence images of colonic mucosa can be collected endoscopically in vivo and can be used to identify and localize dysplasia in the form of adenomatous polyps.
- the SNR of the fluorescence images was typically above 30.
- the adenomas were correctly identified by the fluorescence algorithm with high sensitivity.
- the sensitivity of in vivo detection when the images are collected at normal incidence is comparable to that from the in vitro studies.
- the sensitivity for detection of colonic adenomas was 86%, compared to that of 92% for the in vitro experiments.
- the true negatives and false positives must be identified.
- the in vivo images encompassed regions of mucosa as large as 10 x 10 cm 2 , whereas the specimens of colonic mucosa were only 2 x 2 cm 2 in the in vitro study.
- the colon contains many mucosal folds, and these layers of tissue blocked the excitation light from reaching the posteriorly-located normal mucosa, thus creating shadows. These folds were not present in the in vitro studies. Diagnostic errors on the processed fluorescence image resulted primarily from these shadows.
- the fluorescence method used is based upon the difference in intensity between normal and dysplastic mucosa. However, shadows appear as regions of reduced intensity without dysplasia being present.
- the fluorescence excitation is provided by one fiber located in the biopsy port for convenience.
- the center of this instrument channel is 8.3 mm away from the center of the CCD detector.
- the white light image is illuminated by two fibers whose centers are located only 3.8 mm from the detector. Thus, the shadows on the white light image are much less pronounced that those on fluorescence.
- the fluorescence technique used a single fluorescence emission band for detection of adenomas. This method worked well in vitro when the colonoscope is placed at normal incidence to the lesion, and no mucosal folds were present.
- the view of the endoscope was often limited to the side of the adenoma. Because the colon is a tube-shaped structure, some adenomas were anatomically located at sites where it was virtually impossible to orient the colonoscope at normal incidence to the lesion. As a result, one side of the lesion may not be surrounded by normal colonic mucosa. Another situation was that the normal mucosa is far away to produce fluorescence intensities sufficiently higher than that of the adenoma.
- the fluorescence intensifies were measured from the raw images.
- the normalized intensity values and the intensity ratios were taken at three sites within the adenoma (denoted by left, center, and right in Table 3).
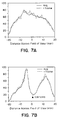
- the plot in Figure 9 contains fluorescence intensity profiles through the adenoma, representing the raw fluorescence and percent ratio values, respectively.
- the adenoma was approximately 8 mm in diameter.
- the lesion is located between the 11 mm and the 19 mm markings on the abscissa, which are labeled by the vertical lines near the x-axis in Figure 9 .
- the fluorescence intensities were measured from the raw images for hyperplastic polyps.
- the normalized intensity values and the intensity ratios were taken at three sites within the polyp (denoted by left, center, and right in Table 3).
- the plot in Figure 10 shows the fluorescence intensity profiles through the hyperplastic polyp, representing the raw fluorescence and percent ratio values, respectively.
- the hyperplastic polyp was approximately 5 mm in diameter.
- the lesion is located between the 17 mm and the 22 mm markings on the abscissa, which are labeled by the vertical lines near the x-axis in Figure 10 .
- the hyperplastic polyps exhibited an approximately uniform fluorescence intensity across the lesion which was continuous with the normal colonic mucosa.
- the average ratio between normal and diseased pixels was 1.1 ⁇ 0.1 at the center, and 1.2 ⁇ 0.1 and 1.1 ⁇ 0.2 at the left and right midpoints, respectively.
- the average intensity ratio at these sites was 1.1 ⁇ 0.2. Because this average ratio value is not significantly different from that of normal mucosa, it is not surprising that no region of disease could be identified by this intensity method.
- the vascular pattern was clearly displayed on both the white light and fluorescence images.
- the vessels were not apparent on the in vitro images, perhaps because the blood supply of the living colon was no longer intact.
- the hemoglobin in the blood is a well-known absorber of light, and produces linear patterns of weak fluorescence intensity.
- the intensities were measured from the raw fluorescence images of blood vessels.
- the intensity ratio from the blood vessels is 1.3 ⁇ 0.1. This value is significantly less than the average from adenomas, thus blood vessels will not present as a source of artifact on the overlay.
- image processing methods can be used to remove the blood vessels based on their shape.
- Table 3 the intensity ratios for adenomas, hyperplastic polyps, and blood vessels are summarized for comparison.
- Endoscopic images and single point spectra can both provide valuable information about tissue biochemistry.
- Each method has its own advantages and disadvantages.
- the endoscope collects images, and provides spatial information with sub-millimeter resolution.
- the fluorescence intensity between normal mucosa and adenomas can be compared from the same image field within a fraction of a mm from each other.
- fluorescence images are collected remotely, thus the pressure on the tissue is uniform throughout the image field.
- single point optical fiber contact probes collect fluorescence from an area of approximately 1 mm in diameter only.
- OMA intensified optical multi-channel analyzer
- spectra over a wide bandwidth can be measured with good spectral resolution and high SNR.
- the probe must be placed at several sites on the mucosa to sample differences between normal and adenoma.
- the normal mucosa sampled is several cm away from the adenoma, and comparisons of the absolute intensity can be affected by biological variability over distance.
- the degree of contact of the probe on the polyp can vary during the in vivo measurements because the colonic musculature is constantly contracting and expanding. As a result, movement is created which makes probe placement difficult.
- the adenoma is round and slippery, and the movement of the colonic wall renders complete contact with the surface of the polyp very difficult.
- the distal end of the optical fiber probe is not flat, but there is a 17° bevel. Thus, the orientation of the beveled side will affect the degree of contact as well.
- Results of the colonoscopy procedure showed that it was very difficult to place the probe onto the polyp for the 0.5 seconds required to collect a full EEM. Light escaping at various colors representing the excitation sources was observed on the normal mucosa surrounding the adenoma. This observation suggests that the delivery of excitation energy to the polyp and collection of fluorescence emission was not complete. Probe contact was hindered by the physiological movement of the mucosa, and by the fact that a flat probe was being placed on a slippery, hemispherical surface. Contact is not a problem for spectra collected on normal mucosa because this surface is flat.
- the ratios between the intensities of normal mucosa and adenomas can be affected by difference in the pressure exerted on each site.
- An in vitro experiment was conducted on a resected specimen of colonic mucosa which contained an adenoma. The fluorescence intensity in the spectral range between 400 and 700 nm was measured as a function of pressure exerted by the probe which was passed through the biopsy channel of a colonoscope. The pressure was measured with a balance. As shown in Figure 11 , the fluorescence intensity increases with pressure, and the intensity ratio does not change if equal pressure is exerted on both the normal and adenoma sites. However, this is usually not the case during the clinical acquisition of spectra.
- the normal mucosa is relatively flat, and measurements can be made with virtually complete probe contact with a few grams of pressure.
- the pressure on the polyp cannot be made the same as that on the normal site because the probe will slip off.
- the pressure on the normal site was estimated to be about 5 grams, while that on the adenoma was estimated to be close to zero.
- the difference in pressure exerted on the normal mucosa and the adenoma may result in the intensity ratio increasing from 2 to 3, as shown in Figure 11 .
- the normal mucosa showed an indentation at the site where the probe was placed during the collection of spectra. This observation confirmed the estimate that several grams pressure was exerted on normal mucosa during data collection. On the other hand, the probe was seen to slide off the polyp when any significant pressure was exerted, which resulted from the moistness of the surface. Thus, the pressure exerted on adenomas was significantly less.
- the normalized intensities and the intensity ratios are determined for the two adenomas on imaging and single point. These values are determined at the center and the left and right midpoints of the adenomas. For the left adenoma, the average intensity ratio was 1.43 on imaging and 1.54 on single point. For the right adenoma, the average intensity ratio was 1.52 on imaging and 1.72 on single point. These results indicate there is little difference in the intensity ratios between imaging and single point in vitro.
- the fluorescence intensity ratio was calculated from Monte-Carlo simulations to determine the fluorescence intensity ratio, given the different excitation and collection geometries of the imaging system and single point.
- Figure 12 a diagram of the collection geometry for the endoscope 100 and the single point probe 102 is shown.
- the endoscope contains a 2.5 mm diameter objective lens 104, and is located in air at a distance 20 from the surface of the tissue. This geometry corresponds to a collection angle of 40°.
- the probe contains a quartz shield 106 which is in contact with the tissue 16.
- the optical parameters of colonic mucosa for the excitation and emission wavelengths are shown in Table 2.
- the excitation used in the simulation is an infinitely-thin beam with a divergence angle of 0°.
- the fluorescence intensity at a point on the tissue from a uniform thick excitation beam can be determined from the fluorescence collected from a superposition of infinitely-thin excitation beams which are incrementally displaced in distance from the point to be measured.
- this result is equivalent to integrating the fluorescence intensity over the field of view.
- the LSF of the tissue falls off quickly within several mm, thus the simulation integrates over a 2 mm region within the collection angle specified in Table 5.
- the results of the simulation are shown in terms of the intensity ratio between the light collected at the tissue surface with chat of the excitation.
- the intensity ratio between normal colonic mucosa and adenomas is 3.0 and 2.9 for the endoscope and the probe, respectively.
- the intensity ratio is similar for the endoscope and the probe, a result which is consistent with the in vitro studies.
- the intensity ratio for the endoscope is slightly higher than that of the probe, which is consistent with the collection angle of the endoscope being smaller. Light from the highly fluorescent submucosa is more likely to reach the detector with a smaller collection angle.
- a model was developed to quantify the number of photons collected by the endoscopic imaging system over the field of view at normal angle of incidence. This result is valid for both white light reflectance and fluorescence images, and can be applied to both the fiber optic imaging bundles and electronic imaging systems.
- the SNR of the image can also be determined. This analysis showed that distance and optical collection geometry produces a profile in which the SNR at the periphery was always lower than that in the center. This parameter is needed for developing algorithms for identifying tissue lesions.
- the collected light intensity was found to decrease with the square of the distance between the distal end of the endoscope and the tissue.
- the light collection by coherent imaging bundles is limited by the numerical aperture of the optical fiber.
- This analytic tool can be used to design the optical parameters of the fluorescence imaging system and to identify the type of light source required to excited the fluorescence.
- the methods developed for endoscopic imaging model were used to determine the excitation source, optics, and detectors necessary for building two fluorescence imaging systems.
- the first design consisted of a fiber optic colonoscope which detected the fluorescence image at the proximal end with an intensified CID camera. A 400 nm long pass filter was used to block the reflected excitation light, an a quartz optical fiber located external to the colonoscope was used for image excitation.
- the second design was a modification of the first to accommodate the requirements for clinical use. This system used an electronic colonoscope with dual instrument channels, and detected fluorescence images at the distal end. The cutoff in spectral sensitivity of the CCD detector below 400 nm was used to avoid the reflected excitation light.
- An illumination probe with a high NA quartz optical fiber was coupled to a microlens and inserted into one instrument channel for image excitation.
- Fluorescence images were then collected from samples of resected colonic mucosa in vitro to evaluate the potential use of this technique for wide area surveillance of dysplasia Colectomy specimens from three patients with familial adenomatous polyposis containing polypoid and non-polypoid adenomas were studied. Each raw image was corrected for differences in distance and instrument light collection efficiency by normalizing to a spatially averaged image. Intensity thresholding was then used to identify diseased regions of mucosa. The sensitivity and specificity for detecting a region of dysplasia depended on the threshold value selected. With the threshold set to 75% of the average normal intensity, a sensitivity of 90% and a specificity of 92% were achieved. The average fluorescence intensity from normal mucosa was found to be greater than that from the adenomas by a factor of 2.2 ⁇ 0.6. These results demonstrate the potential of this technique to direct biopsy site selection.
- the results from the in vitro studies provided motivation for conducting an in vivo study.
- the electronic system was used to collect autofluorescence images from colonic adenomas in vivo. In the this system, an SNR of over 30 was attained as well, which exceeded the minimum SNR requirement of 4. Fluorescence images were collected from 14 adenomas and 6 hyperplastic polyps from 30 patients undergoing routine colonoscopy. The fluorescence images were collected in a 33 ms frames, and were processed by dividing the raw fluorescence image with a moving average image. The processed images displayed regions of mucosa with a probability of containing dysplasia in the form of adenomas, as verified on histology.
- the average intensity ratio between the fluorescence at 460 nm from normal colonic mucosa and adenomas was found to be about 3, while that in endoscopic imaging this ratio was measured to be 2.0 ⁇ 0.6.
- Direct comparison of fluorescence imaging and single point measurements in vitro revealed that there was little difference between the intensity ratio measured on imaging compared to that measured from single point. There are two possibilities that can account for the difference in intensity ratio between the two methods. First, the ratio of 3 measured by the single point method was performed in vivo. A lower ratio may have resulted in vitro because of the loss of blood flow, which is known to absorb light.
- the difference in the ratios may result from contact and pressure artifacts.
- Videotapes of the colonoscopy procedure showed that it was very difficult to place the probe onto the polyp for the 0.5 seconds required to collect a full EEM.
- Light at various color representing the excitation sources was observed, which indicated that the delivery of excitation energy to the polyp and collection of fluorescence emission was not complete.
- Probe contact was hindered by the physiological movement of the mucosa, and by the fact that a flat probe was being placed on a slippery, hemispherical surface. Contact is not a problem for spectra collected on normal mucosa because this surface is flat. Furthermore, increased pressure was found to elevate the fluorescence intensity collected.
- the results of the clinical studies identified future directions to improve the sensitivity and clinical usefulness of fluorescence endoscopic imaging.
- the shadow artifact can be reduced by illuminating the tissue through the two white light ports. This modification can be accomplished by replacing the glass fibers with quartz, thus allowing for both white and excitation light to be transmitted.
- the shadow artifact, angle of incidence, and detection yield can all be improved by collecting multi-spectral images consisting of two or more fluorescence images.
- the concurrent collection of EEM spectra can be used to identify new excitation wavelengths which result in higher intensity contrast ratios.
- Dysplastic tissue exhibits an increase in red fluorescence which can be detected to improve the sensitivity of disease detection.
- another embodiment includes the collection of multiple emission wavelengths.
- One method of collecting multiple fluorescence emission wavelengths is to use an electronic endoscope (e.g. Olympus, Model CF I OOTL) with a CCD detector which is sensitive to the red, green, and blue (RGB) regions of the visible spectrum. Fluorescence images from each RGB frame can be captured and processed, providing more detailed information for use in a diagnostic procedure. Furthermore, the use of spectral lineshape information from images at different wavelengths reduces all geometric distortions.
- the TI TC244 has a quantum efficiency of 30% at 640 nm and 15% at 480 nm [TI Mannual, 1994]. Extrapolating from the 370 nm imaging data and the EEM data, a SNR of 10:1 in the red and 50:1 in the blue is anticipated.
- Performing the detection on the distal end of the electronic colonoscope has many practical advantages.
- the same detector can be used for both white light and fluorescence imaging.
- a single detector not only results in perfect registration of the two images, but avoids the need to interchange of cameras, which can be cumbersome.
- fewer optical elements results in a transmission efficiency of fluorescence photons which is significantly higher than that of a fiber optic imaging bundle.
- the packing geometry of CCD pixels allow for minimal loss of surface area of detection, unlike fiber optic imaging bundles which have a hexagonal packing array.
- a fiber optic imaging bundle with proximal detection has advantages as well.
- the spectral bands of the distal CCD is limited to the RGB response of the distal detector, while the fluorescence collected by a fiber optic imaging bundle could be filtered into an unlimited number of spectral images.
- detection of the fluorescence image at the proximal can allow for detection with a gated intensifier. This device enables use of pulsed lasers.
- the ratio image can be used to normalize out shadow effects.
- the next phase of the imaging studies will use 410 nm excitation.
- a krypton ion laser (Coherent Innova Model 302) will provide 500 mW of power at the two lines 407 and 413 nm. This level of power is adequate to achieve large fluorescence signals in both red and blue bands.
- This laser will be installed at the BWH Laser Laboratory along with the existing 365 nm argon ion laser.
- excitation wavelengths can be employed.
- One approach would be to use excitation from the 407 and 413 mn lines of a krypton ion laser to excite the red fluorescence and to retain the 365 and 351 run lines from argon ion laser to excite the blue fluorescence.
- Two hardware configurations include (1) a fiber endoscope with a switchable filter wheel between the scope and camera, and (2) a dual-chip endoscope. Such a system has been developed, for example, by American Hospital, Inc., for stereo viewing during endoscopy. One can modify one of the windows on the chip with a spectral cut-off mechanism. The timing of the red-sensitive imaging channel can be synchronized with the excitation light.
- the diffuse reflectance image at 407-413 nm can be explored to obtain information about the tissue hemoglobin content.
- This image can be obtained by installing a filter with the appropriate bandwidth on the rotating wheel in front of the white light source.
- the approach is to ratio this reflectance image with the fluorescence images in the red and blue frames.
- an extensive contact probe study with 410 nm excitation can be performed.
- the shadow artifact obtained using the broadband intensity algorithm with 365 nm excitation can be greatly reduced by use of an improved excitation geometry.
- excitation light is delivered through a single quartz fiber located in the biopsy channel located 8.3 mm from the CCD detector.
- the use of a single illumination beam located a large distance from the CCD chip tends to enhance shadows.
- shadows are minimized by use of two closely spaced white light illumination beams symmetrically positioned on opposite sides of the CCD chip.
- the UV light can be delivered through the two white light illumination ports, which are located only 3.8 mm from the CCD detector. Implementing this requires modifying the video processor to enable alternate coupling of white light and laser excitation into the illumination fibers.
- spectral endoscope improvements can include: (I) regulating the excitation light intensity on the tissue surface via feedback control. This provides constant illumination, regardless of viewing distance, and is also important for patient safety; (ii) minimizing the streaking effect of the fluorescence excitation on the white light endoscopic imaging display by timing the fluorescence excitation to occur during the "blank" periods of the filter wheel used in the endoscope white-light source.
- Feedback control of the excitation light can be accomplished by measurement of the average intensity on the fluorescence image. The intensity of this average value will be used to modulate the open period on the shutter or filter wheel.
- the streaking effect can be completely removed by implementing the identical filter wheel for blocking the excitation light that is used for producing the RGB illumination on the white light mode.
- argon-ion laser was used as a near-LTV excitation source for the imaging studies. Although adequate for these studies, this light source is expensive and bulky and operates at only a few discrete wavelengths. Such a laser system with its special electrical and water cooling requirements cannot be easily moved, preventing use at multiple sites.
- Alternative excitation sources can be considered which include a pulsed laser and a white-light source with filters, both of which are compact and transportable.
- a pulsed ND:YAG laser is used because it can provide third harmonic radiation at 355 mm with sufficient average power for spectral imaging.
- good SNR was obtained with 300 mW of laser power, which corresponds to 10 mJ of energy per fi-ame. Therefore, a frequency tripled ND:YAG laser with a 5 - 10 ns pulse duration operating at 30 Hz with an average power of 300 mW at 355 nm will be adequate.
- this short excitation pulse enables simultaneous acquisition of white light and fluorescence images.
- the white light background is negligible, obviating the need to chop the white light illumination.
- a mercury lamp can also be used as an excitation source.
- Such a source is compact and lightweight and can provide a bright, narrowband illumination at a number of excitation wavelengths. Employing this light source simplifies system design and reduce cost, enabling less expensive units to be produced for use at multiple sites. The key issue is whether enough light in the desired wavelength range can be coupled into the illumination fiber (s).
- a commercial white light source with a 150 W xenon lamp is capable of delivering as much as 80 mW of white light at the distal end. Utilizing a 50 run excitation bandwidth, about 20 mW of light can be used to induce tissue fluorescence.
- mercury lamps have 5 to 10 times higher output powers than that of xenon. This indicates that with a 500 W mercury lamp having a relatively small filament, at least 300 mW of useful excitation light should be available at the distal end of the illumination fibery should be sufficient for collection of good quality fluorescent images from colonic tissue.
- either the total area of illumination can be reduced or imaging elements can be binned together.
- a lamp and power supply can be selected for this application with the proper brightness, stability and minimum electrical interference.
- the image processing scheme is based on ratioing the raw image to a spatially-averaged image, and applying a threshold criterion for classifying a region of tissue as normal or diseased.
- the averaging window and detection threshold values are pre-flexed, regardless of the polyp size, viewing angle and distance. These predetermined values limit the range of polyp sizes which can be accurately measured.
- Improved image processing and thresholding methods will employ variable window sizes for spatial averaging and variable thresholds. Information from the raw digitized image about the diameter of the largest lesion in the image will be used to determine these parameters. This change in the window size as a fimction of the lesion in the image field will maximize the intensity ratio and optimize the performance of the fluorescence method.
- a multivariate image is a collection of congruent images of the same ob ect measured with different variables, such as reflected wavelengths, or fluorescence or Rainan band intensities.
- Many methods are available for analyzing multivariate images, and they can be adapted to image analysis. In general, three steps will be followed, image processing, object segmentation, and contrast measurement. The images will first be processed based on the selected operation, such as moving-window average, intensity difference or ratio. The processed image will then be segmented based on both frequency and intensity information. This can be done either through thresholding, quick/slow descent, or region growth. These methods can be coupled to the concomitant identification and display of a lesion(s) based on a probabilistic scheme.
- Principal component analysis does not assume a known (a priori) distribution, but instead employs a set of calibrated data to extract information about structures exhibiting pre-malignant changes.
- the regression technique is based on the principle of building up a mathematical relationship between two groups of variables, i.e., between a number of independent variables and one or more dependent variables. As an example, a logistic regression to correlate spectral intensities in the images with histopatwogy of dysplastic lesions.
- fluorescence imaging endoscope has demonstrated the potential to perform wide-area surveillance colonoscopy using fluorescence.
- the fluorescence image can be analyzed in real time and can provide the endoscopist with an instant interpretation of the probability of dysplasia determined using a previously-validated algorithm.
- the ability to guide biopsy can be used with the present invention.
- fluorescence imaging can be used to direct mucosal biopsies to areas that are endoscopically normal-appearing (non-polypoid) but, based on their spectral characteristics, can have an increased likelihood of being dysplastic. Histopathological assessment of mucosal biopsies will be correlated with spectral data to validate for detection of "flat" dysplasia.
- the following method can be followed for determining the capability of the fluorescence imaging system for directing biopsy.
- the entire surface of the colon wall, both at colonoscopy and using resected samples at colectomy, is systematically imaged, and isolated areas which are diagnosed as dysplastic selected for directed biopsy. Random areas diagnosed as benign can also be sampled, and the spectral diagnosis confirmed by histological analysis. Again, the effects of complications such as inflammation can be investigated.
- diagnostic algorithms for UC must be capable of evaluating patients with various degrees of background inflammation. The same patient groups studied with contact probe EEMs will be studied with fluorescence imaging.
- biopsies obtained during conventional surveillance colonoscopy may be directed by the results of fluorescence imaging. Those biopsies can be separated from the remainder of the random biopsies to assess whether fluorescence imaging can increase the yield of dysplasia detection over random sampling.
- the development of the rapid EEM and spectral imaging systems represent two very important advances in instrumentation.
- the two systems are complementary.
- the imaging system views wide areas of mucosa in real time, and the EEM system provides complete spectral characterization of a given site of colonic mucosa.
- the two instruments can be used simultaneously, where appropriate.
- the EEM probe is placed through the second channel of a two channel colonoscope.
- each system can be used to verify the other.
- FIG. 13 presents a schematic outline of the system which has been demonstrated in clinical practice in a format which will allow comparison with the improved systems to be described below.
- the embodiment shown uses an ultraviolet laser source 200, switched by a shutter 202 and focused with a lens 204 into a fused silica fiber probe 206 inserted into a biopsy channel of an endoscope 208 to deliver it to a tissue site 210 so that it can illuminate the tissue over an area 212.
- the UV illumination thus comes from an aperture 214 which is different from the endoscope's own illumination ports 216.
- this procedure leaves one biopsy channel 218 free.
- the endoscope camera 220 obtains its white light illumination through its own fiberoptic illuminator 222 from a broadband Xenon arc lamp 224 and collection optics 226.
- a non-standard shutter 228 under computer 230 control 232 is attached to allow the white light illumination to be turned off while fluorescence images are being taken.
- the fluorescence image signal 234 is processed by the endoscope's video processor 236 to produce a standard video signal 238 which is digitized by a framegrabber in computer 230.
- the processed image signal 240 with its information on the state of the observed tissue is sent to monitor 242.
- the entire diagnostic procedure is initiated by a foot switch 244 attached to the computer by a cable 246.
- Figure 14A shows an design for the fluorescence imaging system which eliminates the tendency of the previous system to identify shadows in the image as regions of dysplasia.
- the improved design uses a 100W mercury (Hg) arc lamp light source 302, dichroic mirrors 304 and 306, wavelength filters 308 and 310 and rotating shutters 312 and 314 to provide precisely-timed, tissue-illumination pulses in two separate wavelength bands.
- the first wavelength band is centered on the near-ultraviolet (365 nm) mercury resonance line and is used to obtain the UV autofluorescence image.
- the second wavelength band is at the red end of the visible spectrum and is used to obtain a simultaneous or near-simultaneous, reflectance image for the purpose of identifying shadows and the extent of the UV illumination field.
- a reflectance (non-fluorescing) image taken with an endoscope camera system measures the brightness of the tissue surface 316 in its field of view.
- this image indicates the distance of the tissue from a single illumination source (or a weighted distance from multiple sources). If these illumination sources are not in the direct line-of-sight from the camera to the tissue source there will be shadows.
- a reflectance image can thus be used to measure both the UV illumination 318 at the tissue surface and the presence of shadows in the fluorescence image as long as the UV illumination and the visible illumination emanate from the same aperture 320 with the same angular divergence.
- this condition can be satisfied either by a two-color illumination fiber 322 passed through a biopsy channel of an endoscope 324 or by the two-color illumination being passed through the illumination bundle 326 of the endoscope.
- a shutter 328 switches off the normal white-light illumination of the endoscope while the two diagnostic images are being obtained.
- the closing of shutter 328 under computer control 329 occurs at the same time as the opening of shutter 330 by control line 331. This action enables the two-color light to reach the fiber 322 and thus the tissue 316.
- the algorithm for using the visible reference image along with the fluorescence image is as follows.
- the video signals 332 from the CCD camera at the distal tip of the endoscope 324 are converted by the video processor 334 to a standard NTSC color video signal 336 and sent to a video framegrabber in computer 338.
- the two images are first corrected for the gamma factor applied to the video signal by the video processor to insure that the digitized images acquired by the framegrabber in the computer are linear measurements of the tissue surface brightness. This is accomplished in real time by the framegrabber input look-up table.
- the two images are then normalized to their peaks, which will generally be a region of non-dysplastic tissue in the visual field. This normalizes the two illumination fields.
- the fluorescence image value is then divided by the visible reference image value. If the ratio falls below a predetermined threshold (typically one-half to one-third) then that pixel in the image represents a region of reduced fluorescence which is indicative of dysplasia. This pixel can then be set to a false color state in an output video signal 340 sent to a monitor 342 to indicate to the clinician the probability of dysplasia.
- a prior threshold requirement on both images insures that the ratio obtained is significant and eliminates false color output in regions of shadow or low illumination at the edges of the video field. This entire operation occurs for every depression of the footswitch 344 which is connected to the computer through cable 346.
- both the UV-excitation light pulse and the visible-reference light pulse are delivered to the tissue through the same optical fiber 322 inserted through a biopsy channel of the endoscope.
- the condition that the two illumination sources have the same angular distribution is assured by the design of the light collection apparatus shown in Figure 14A .
- a single Hg arc lamp 302 is used as the source of both wavelengths.
- a dichroic mirror 304 reflects the UV portion of the spectrum and transmits the visible portion. Filters in each path further refine the bandwidth of the two beams.
- the UV filter 308 must reject visible light to a high degree since the efficiency of the 460 nm tissue fluorescence is only about 0.1%.
- the filter 310 in the red path is less critical but the chosen center wavelength should avoid hemoglobin absorption bands to provide the best reference image.
- the design of the beam splitting optics and beam combining optics have an even number of reflections in both the UV and visible arms. This assures that any angular deviations of the output beams due to motion of the lamp track each other. It also makes the directions of the output beams invarient under translations and small rotations of the beam splitting and recombining optics as a whole.
- the current through the Hg lamp 302 is boosted at appropriate moments to increase the lamp output power for the UV exposure. This allows a larger area of tissue to be scanned for dysplasia in a single image.
- the data in Figure 14B show that the UV output power from a 100 W Hg lamp is a linear function of its input power to at least a factor of 3 over its nominal rated power. Since the lamp discharge maintains a constant voltage drop across the arc regardless of current, the lamp output power is essentially proportional to current. At least 50% power to the lamp must always be maintained, however, to keep the mercury in the vapor phase.
- the lamp power supply 348 in the improved fluorescence system utilizes a DC current section to maintain the idle current and a computer-controlled 350, pulsed current section which can rapidly switch in multiple constant-current sources to vary the output power of the lamp as required by the imaging system. If the idling power is kept below the rated power and the current pulses are kept to a sufficiently small duty factor, then the pulsed UV output can be sustained continuously.
- the rotating shutter in the UV path 312 and in the red path 314 of the light source are designed to provide pulsed illumination light according to the timing diagram in Figure 14C .
- This diagram shows how this fluorescence imaging system is used with a monochrome camera, which uses a xenon arc lamp 352 for illumination and a rotating blue-green-red filter wheel 354 to synthesize a color image from 3 monochrome images.
- a pulse of blue light first illuminates the tissue for about 6 milliseconds and the resulting tissue reflectance image is digitized for the next 6 milliseconds.
- the illumination must be turned off during the readout period because the monochrome camera used continues to collect photo current in the pixels as they are line shifted to the readout electronics.
- Illumination during the readout causes a smearing artifact in the image.
- the UV illumination is switched in during the normal blue exposure period and the red light illumination is switched in during the red exposure period.
- the green exposure period is not generally used but could be used to obtain an additional reference image or an additional UV fluorescence image.
- the shutters are timed to the video acquisition system using an LM1881 Video Sync Separator circuit to develop an even/odd frame synchronization pulse 356 from the standard composite video output signal.
- Phase-locked-loops (PLL) 358 and 360 synchronize the phase of the chopper wheels to this signal by varying a voltage to their DC driving motors 362 and 364. This signal is also used to synchronize the current pulser 348.
- PLL Phase-locked-loops
- the dual-wavelength illumination method can also be used with standard. color-CCD camera endoscopes.
- the UV light illumination and red light reference illumination are present simultaneously.
- the UV-induced fluorescence (primarily at 460 nm) is then detected by the blue-responsive pixels in the CCD camera and the reference reflectance image is detected by the red-responsive pixels.
- the visible blue light must still be removed from the diagnostic illumination so as not to decrease the contrast of the fluorescence image.
- the slight amount of red tissue fluorescence seen in dysplastic tissue due to the UV excitation is much smaller than the level of direct red illumination. The slight increase also acts to reduce the fluorescence/reference ratio which properly increases (slightly) the measured probability of dysplasia.
- Figure 15 shows a preferred embodiment of the fluorescence imaging system in which dual wavelength illumination capability as well as white-light illumination capability is built into the video endoscope system itself 400.
- Such a design fulfills the design requirement that the UV-excitation and visible-reference illumination emanate from the same aperture or apertures 406.
- Such a system would also be easier for an operator to use since the illumination fiber would not have to be threaded down through a biopsy channel 408 and those channels would be free for their standard uses.
- the tissue surface 410 would be illuminated over a larger area 412 with fewer shadows since dual illumination ports 406 are standard.
- the video signal 414 would be processed by the endoscope system 416, formatted into a standard signal 416 and processed by the computer 420.
- the output video signal with the false color overlay 422 would be sent to a monitor 424 for the clinician to see in real time.
- the diagnostic illumination would be initiated by a footswitch 426 connected by a cable 428 to the computer 420 with the light pulses controlled by signal lines 430 and 432 to the shutters in the light source.
Claims (6)
- Système d'imagerie à fluorescence comportant :un endoscope,une source de lumière couplée à un guide optique s'étendant à travers l'endoscope, etun capteur d'imagerie unique (220) sur une extrémité distale de l'endoscope conçu pour détecter une image de fluorescence et une image de réflectance d'un tissu,dans lequel la source de lumière comporte une première source de lumière à large bande (224) et une seconde source de lumière à bande étroite (200) qui émet une lumière ayant une longueur d'onde dans la plage de 350 nm à 420 nm, caractérisé en ce que le système d'imagerie comporte de plus :un processeur (230) conçu pour traiter l'image de réflectance et l'image de fluorescence et générer une image de fluorescence compensée.
- Système d'imagerie selon la revendication 1, comportant de plus un dispositif à fibre optique couplé de manière optique à la source de lumière.
- Système d'imagerie selon la revendication 1, comportant de plus un obturateur positionné le long d'un trajet optique entre la source de lumière et une fibre optique (222) s'étendant à travers l'endoscope.
- Système d'imagerie selon la revendication 1, dans lequel le capteur d'image (220) a une sensibilité réduite dans une région spectrale des ultraviolets par rapport à une sensibilité dans une région spectrale de la lumière visible.
- Système d'imagerie selon la revendication 1, dans lequel le capteur d'image (220) comporte un filtre réduisant la sensibilité du capteur d'imagerie au-dessous de 400 nm.
- Système d'imagerie selon la revendication 4, dans lequel la sensibilité de capteur dans la région spectrale des ultraviolets est inférieure à la moitié de la sensibilité dans la région de la lumière visible.
Applications Claiming Priority (3)
| Application Number | Priority Date | Filing Date | Title |
|---|---|---|---|
| US7245598P | 1998-01-26 | 1998-01-26 | |
| US72455P | 1998-01-26 | ||
| PCT/US1999/001723 WO1999037204A1 (fr) | 1998-01-26 | 1999-01-26 | Imagerie endoscopique par fluorescence |
Publications (2)
| Publication Number | Publication Date |
|---|---|
| EP1051104A1 EP1051104A1 (fr) | 2000-11-15 |
| EP1051104B1 true EP1051104B1 (fr) | 2008-04-09 |
Family
ID=22107696
Family Applications (1)
| Application Number | Title | Priority Date | Filing Date |
|---|---|---|---|
| EP99904331A Expired - Lifetime EP1051104B1 (fr) | 1998-01-26 | 1999-01-26 | Imagerie endoscopique par fluorescence |
Country Status (11)
| Country | Link |
|---|---|
| US (2) | US6537211B1 (fr) |
| EP (1) | EP1051104B1 (fr) |
| JP (1) | JP2002500907A (fr) |
| KR (1) | KR20010040418A (fr) |
| CN (1) | CN1289239A (fr) |
| AT (1) | ATE391451T1 (fr) |
| AU (1) | AU752829B2 (fr) |
| CA (1) | CA2318180A1 (fr) |
| DE (1) | DE69938493T2 (fr) |
| HK (1) | HK1041594A1 (fr) |
| WO (1) | WO1999037204A1 (fr) |
Families Citing this family (300)
| Publication number | Priority date | Publication date | Assignee | Title |
|---|---|---|---|---|
| US5959306A (en) * | 1996-02-08 | 1999-09-28 | Bright Solutions, Inc. | Portable light source and system for use in leak detection |
| US7253557B2 (en) * | 1996-02-08 | 2007-08-07 | Bright Solutions, Inc. | Light source provided with a housing enclosing voltage regulator means and method of manufacturing thereof |
| US7157724B2 (en) * | 1996-02-08 | 2007-01-02 | Bright Solutions, Inc. | Detection lamp |
| US20090324721A1 (en) * | 1996-09-23 | 2009-12-31 | Jack Kennedy | Hydrogels Suitable For Use In Polyp Removal |
| US7453490B2 (en) * | 1997-01-31 | 2008-11-18 | Gyrus Acmi, Inc. | Correction of image signals characteristic of non-uniform images in an endoscopic imaging system |
| US6462770B1 (en) * | 1998-04-20 | 2002-10-08 | Xillix Technologies Corp. | Imaging system with automatic gain control for reflectance and fluorescence endoscopy |
| JP2000137172A (ja) * | 1998-10-29 | 2000-05-16 | Olympus Optical Co Ltd | 撮像装置 |
| US6411838B1 (en) * | 1998-12-23 | 2002-06-25 | Medispectra, Inc. | Systems and methods for optical examination of samples |
| US20040147843A1 (en) * | 1999-11-05 | 2004-07-29 | Shabbir Bambot | System and method for determining tissue characteristics |
| US6339498B1 (en) * | 1999-04-27 | 2002-01-15 | Olympus Optical Co., Ltd. | Ultraviolet microscope optical system and optical filter used in the same optical system |
| JP2001008892A (ja) | 1999-06-28 | 2001-01-16 | Asahi Optical Co Ltd | 光源装置及び内視鏡システム |
| AU6867200A (en) * | 1999-09-01 | 2001-03-26 | Hamamatsu Photonics K.K. | Feeble light color imaging device |
| JP3881142B2 (ja) * | 1999-11-02 | 2007-02-14 | 富士フイルムホールディングス株式会社 | 蛍光表示方法および装置 |
| DE10055725B4 (de) * | 1999-11-11 | 2007-12-27 | Pentax Corp. | Elektronisches Endoskopsystem |
| US6468203B2 (en) | 2000-04-03 | 2002-10-22 | Neoguide Systems, Inc. | Steerable endoscope and improved method of insertion |
| US6858005B2 (en) | 2000-04-03 | 2005-02-22 | Neo Guide Systems, Inc. | Tendon-driven endoscope and methods of insertion |
| US6610007B2 (en) | 2000-04-03 | 2003-08-26 | Neoguide Systems, Inc. | Steerable segmented endoscope and method of insertion |
| US8517923B2 (en) | 2000-04-03 | 2013-08-27 | Intuitive Surgical Operations, Inc. | Apparatus and methods for facilitating treatment of tissue via improved delivery of energy based and non-energy based modalities |
| US8888688B2 (en) | 2000-04-03 | 2014-11-18 | Intuitive Surgical Operations, Inc. | Connector device for a controllable instrument |
| EP1148717A3 (fr) * | 2000-04-19 | 2002-03-20 | Fuji Photo Film Co., Ltd. | Méthode et appareil pour photographier des images fluorescentes et de lumière réfléchie |
| EP1759631B1 (fr) * | 2000-06-06 | 2011-03-09 | FUJIFILM Corporation | Méthode d'affichage d'image de sujets éclairés par de la lumière fluorescente et appareil correspondant |
| DE60109989T2 (de) | 2000-06-26 | 2006-02-23 | Fuji Photo Film Co. Ltd., Minamiashigara | Vorrichtung zur Aufnahme von Fluoreszenzbildern |
| WO2002007587A2 (fr) | 2000-07-14 | 2002-01-31 | Xillix Technologies Corporation | Systeme video compact d'endoscopie en fluorescence |
| JP2002034913A (ja) * | 2000-07-27 | 2002-02-05 | Asahi Optical Co Ltd | 電子内視鏡システムの光源装置の光学系 |
| DE10038185C2 (de) * | 2000-08-04 | 2003-05-28 | Siemens Ag | Einrichtung zum Erfassen von unterschiedlichen Fluoreszenzsignalen eines mit verschiedenen Anregungswellenlängen ganzflächig beleuchteten Probenträgers |
| JP3579638B2 (ja) | 2000-08-08 | 2004-10-20 | ペンタックス株式会社 | 内視鏡装置 |
| US6582363B2 (en) | 2000-08-25 | 2003-06-24 | Pentax Corporation | Video endoscope system and illumination optical system |
| US20020107448A1 (en) * | 2000-10-06 | 2002-08-08 | Gandjbakhche Amir H. | Probe using diffuse-reflectance spectroscopy |
| US9295391B1 (en) * | 2000-11-10 | 2016-03-29 | The General Hospital Corporation | Spectrally encoded miniature endoscopic imaging probe |
| GB0030310D0 (en) * | 2000-12-13 | 2001-01-24 | Medical Res Council | Apparatus and method for imaging a histological sample |
| US6826424B1 (en) | 2000-12-19 | 2004-11-30 | Haishan Zeng | Methods and apparatus for fluorescence and reflectance imaging and spectroscopy and for contemporaneous measurements of electromagnetic radiation with multiple measuring devices |
| US6697652B2 (en) | 2001-01-19 | 2004-02-24 | Massachusetts Institute Of Technology | Fluorescence, reflectance and light scattering spectroscopy for measuring tissue |
| DE10116859C2 (de) | 2001-04-04 | 2003-10-09 | Wolf Gmbh Richard | Vorrichtung zur bildgebenden Diagnose von Gewebe |
| US7139598B2 (en) * | 2002-04-04 | 2006-11-21 | Veralight, Inc. | Determination of a measure of a glycation end-product or disease state using tissue fluorescence |
| US20070276199A1 (en) * | 2002-04-04 | 2007-11-29 | Ediger Marwood N | Determination of a Measure of a Glycation End-Product or Disease State Using Tissue Fluorescence |
| JP3731814B2 (ja) * | 2001-05-07 | 2006-01-05 | 富士写真フイルム株式会社 | 蛍光画像表示装置 |
| JP3862582B2 (ja) * | 2001-06-29 | 2006-12-27 | 富士フイルムホールディングス株式会社 | 蛍光画像取得方法および装置並びにプログラム |
| JP4390096B2 (ja) * | 2001-07-06 | 2009-12-24 | 富士フイルム株式会社 | 内視鏡装置 |
| KR100411631B1 (ko) * | 2001-10-18 | 2003-12-18 | 주식회사 메디미르 | 형광 내시경 장치 및 그 장치를 이용한 진단부위 조상 방법 |
| US7738032B2 (en) * | 2001-11-08 | 2010-06-15 | Johnson & Johnson Consumer Companies, Inc. | Apparatus for and method of taking and viewing images of the skin |
| US20040146290A1 (en) * | 2001-11-08 | 2004-07-29 | Nikiforos Kollias | Method of taking images of the skin using blue light and the use thereof |
| US6922523B2 (en) * | 2001-11-08 | 2005-07-26 | Johnson & Johnson Consumer Companies, Inc. | Method of promoting skin care products |
| KR100443812B1 (ko) * | 2001-12-12 | 2004-08-09 | 박경순 | 형광 내시경 및 스펙트럼 분석 장치 |
| AU2002360767A1 (en) * | 2002-01-09 | 2003-07-30 | Neoguide Systems, Inc | Apparatus and method for spectroscopic examination of the colon |
| WO2003059151A2 (fr) | 2002-01-09 | 2003-07-24 | Neoguide Systems, Inc. | Appareil et procede pour colectomie endoscopique |
| US20060241496A1 (en) * | 2002-01-15 | 2006-10-26 | Xillix Technologies Corp. | Filter for use with imaging endoscopes |
| US8131332B2 (en) * | 2002-04-04 | 2012-03-06 | Veralight, Inc. | Determination of a measure of a glycation end-product or disease state using tissue fluorescence of various sites |
| US8140147B2 (en) * | 2002-04-04 | 2012-03-20 | Veralight, Inc. | Determination of a measure of a glycation end-product or disease state using a flexible probe to determine tissue fluorescence of various sites |
| US6684099B2 (en) * | 2002-04-04 | 2004-01-27 | Inlight Solutions, Inc. | Apparatus and method for reducing spectral complexity in optical sampling |
| US20040077951A1 (en) * | 2002-07-05 | 2004-04-22 | Wei-Chiang Lin | Apparatus and methods of detection of radiation injury using optical spectroscopy |
| US6818903B2 (en) * | 2002-07-09 | 2004-11-16 | Medispectra, Inc. | Method and apparatus for identifying spectral artifacts |
| KR100434690B1 (ko) * | 2002-07-19 | 2004-06-04 | 소광섭 | 생명체에 대한 자기장의 영향을 측정하는 장치 및 방법 |
| JP4199510B2 (ja) | 2002-09-30 | 2008-12-17 | Hoya株式会社 | 診断補助用装置 |
| ES2212733B1 (es) * | 2002-10-18 | 2005-05-01 | Jose Muñoz Leo | Sistema de visualizacion de imagenes del fondo marino. |
| CA2503471A1 (fr) | 2002-10-24 | 2004-05-06 | Glaxo Group Limited | Derives de 1-acyl-pyrrolidine destines au traitement d'infections virales |
| CN1493250A (zh) * | 2002-10-31 | 2004-05-05 | ƽ | 内窥镜诊断癌前病变的装置 |
| DE10252313B9 (de) * | 2002-11-11 | 2006-10-19 | Carl Zeiss | Untersuchungssystem zur gleichzeitigen direkten Sichtbarmachung einer Fluoreszenzmarkierung und eines die Fluoreszenzmarkierung umgebenden Gewebebereichs und Untersuchungsverfahren dafür |
| JP4632645B2 (ja) * | 2002-12-12 | 2011-02-16 | オリンパス株式会社 | イメージング装置およびプロセッサ装置 |
| JP4394356B2 (ja) * | 2003-02-07 | 2010-01-06 | Hoya株式会社 | 電子内視鏡装置 |
| JP2004248721A (ja) * | 2003-02-18 | 2004-09-09 | Pentax Corp | 診断補助用装置 |
| US8882657B2 (en) | 2003-03-07 | 2014-11-11 | Intuitive Surgical Operations, Inc. | Instrument having radio frequency identification systems and methods for use |
| US20040199052A1 (en) | 2003-04-01 | 2004-10-07 | Scimed Life Systems, Inc. | Endoscopic imaging system |
| US7697975B2 (en) * | 2003-06-03 | 2010-04-13 | British Colombia Cancer Agency | Methods and apparatus for fluorescence imaging using multiple excitation-emission pairs and simultaneous multi-channel image detection |
| US20050051699A1 (en) * | 2003-09-09 | 2005-03-10 | Bernard Petrillo | [microscope light regulator] |
| US20050059894A1 (en) * | 2003-09-16 | 2005-03-17 | Haishan Zeng | Automated endoscopy device, diagnostic method, and uses |
| WO2005032342A2 (fr) * | 2003-09-30 | 2005-04-14 | Vanderbilt University | Procedes et dispositifs de detection spectroscopique optique de la mort cellulaire et tissulaire |
| DE10357184A1 (de) * | 2003-12-08 | 2005-07-07 | Siemens Ag | Verfahren zur fusionierten Bilddarstellung |
| KR100583250B1 (ko) * | 2004-03-05 | 2006-05-24 | 한국전기연구원 | 개선된 영상 검출 모듈을 갖는 형광 내시경 장치 |
| US20060155178A1 (en) * | 2004-03-26 | 2006-07-13 | Vadim Backman | Multi-dimensional elastic light scattering |
| EP1757221A4 (fr) * | 2004-05-14 | 2014-04-09 | Olympus Medical Systems Corp | Endoscope électronique |
| JP3967337B2 (ja) * | 2004-05-14 | 2007-08-29 | オリンパス株式会社 | 内視鏡および内視鏡装置 |
| DE102004024494B4 (de) * | 2004-05-16 | 2019-10-17 | Dürr Dental SE | Medizinische Kamera |
| CN100343655C (zh) * | 2004-06-18 | 2007-10-17 | 中国科学院上海有机化学研究所 | 一种基于电荷耦合装置的在线自校正激光诱导荧光检测方法 |
| JP4575720B2 (ja) * | 2004-07-23 | 2010-11-04 | Hoya株式会社 | 電子内視鏡システム |
| JP2008514343A (ja) * | 2004-09-30 | 2008-05-08 | ジラ バイオテクノロジー・インク | 異常粘膜組織を検出し、異常粘膜組織の更なる評価を支援するための光指定法 |
| US8026942B2 (en) | 2004-10-29 | 2011-09-27 | Johnson & Johnson Consumer Companies, Inc. | Skin imaging system with probe |
| US7736313B2 (en) * | 2004-11-22 | 2010-06-15 | Carestream Health, Inc. | Detecting and classifying lesions in ultrasound images |
| US20060173358A1 (en) * | 2005-01-11 | 2006-08-03 | Olympus Corporation | Fluorescence observation endoscope apparatus and fluorescence observation method |
| JP4566754B2 (ja) * | 2005-01-12 | 2010-10-20 | Hoya株式会社 | 画像処理装置 |
| JP4786910B2 (ja) * | 2005-02-07 | 2011-10-05 | Hoya株式会社 | 電子内視鏡 |
| FR2882147B1 (fr) * | 2005-02-14 | 2007-10-05 | Commissariat Energie Atomique | Dispositif d'imagerie de fluorescence par reflexion a deux longueurs d'onde |
| DE102005013043A1 (de) * | 2005-03-18 | 2006-09-28 | Siemens Ag | Mobiler Fluoreszenz-Scanner für molekulare Signaturen |
| DE102005013044B4 (de) * | 2005-03-18 | 2007-08-09 | Siemens Ag | Fluoreszenz-Scanner |
| DE102005013045B4 (de) * | 2005-03-18 | 2013-03-14 | Siemens Aktiengesellschaft | Fluoreszenz-Scanner für molekulare Signaturen |
| DE102005013042A1 (de) * | 2005-03-18 | 2006-09-28 | Siemens Ag | Einrichtung zur Erzeugung von 3D-Fluoreszenz-oder Lumineszenz-Scans |
| US7709249B2 (en) * | 2005-04-01 | 2010-05-04 | 3M Innovative Properties Company | Multiplex fluorescence detection device having fiber bundle coupling multiple optical modules to a common detector |
| US7507575B2 (en) * | 2005-04-01 | 2009-03-24 | 3M Innovative Properties Company | Multiplex fluorescence detection device having removable optical modules |
| US20060235457A1 (en) * | 2005-04-15 | 2006-10-19 | Amir Belson | Instruments having a rigidizable external working channel |
| KR100927286B1 (ko) * | 2005-06-08 | 2009-11-18 | 올림푸스 메디칼 시스템즈 가부시키가이샤 | 내시경 장치 및 화상 처리 장치 |
| US20070038126A1 (en) * | 2005-06-23 | 2007-02-15 | Pyle Jason L | System and method for monitoring of end organ oxygenation by measurement of in vivo cellular energy status |
| US20070009382A1 (en) * | 2005-07-05 | 2007-01-11 | William Bedingham | Heating element for a rotating multiplex fluorescence detection device |
| US7527763B2 (en) * | 2005-07-05 | 2009-05-05 | 3M Innovative Properties Company | Valve control system for a rotating multiplex fluorescence detection device |
| US20120302892A1 (en) * | 2005-07-25 | 2012-11-29 | Niyom Lue | Portable optical fiber probe-based spectroscopic scanner for rapid cancer diagnosis |
| US20070038117A1 (en) * | 2005-07-26 | 2007-02-15 | Bala John L | Multi-spectral imaging endoscope system |
| US20070135803A1 (en) * | 2005-09-14 | 2007-06-14 | Amir Belson | Methods and apparatus for performing transluminal and other procedures |
| WO2007041383A2 (fr) | 2005-09-30 | 2007-04-12 | Purdue Research Foundation | Dispositif d'imagerie endoscopique |
| US20090203977A1 (en) * | 2005-10-27 | 2009-08-13 | Vadim Backman | Method of screening for cancer using parameters obtained by the detection of early increase in microvascular blood content |
| US20070129615A1 (en) * | 2005-10-27 | 2007-06-07 | Northwestern University | Apparatus for recognizing abnormal tissue using the detection of early increase in microvascular blood content |
| US9314164B2 (en) | 2005-10-27 | 2016-04-19 | Northwestern University | Method of using the detection of early increase in microvascular blood content to distinguish between adenomatous and hyperplastic polyps |
| US20070179368A1 (en) * | 2005-10-27 | 2007-08-02 | Northwestern University | Method of recognizing abnormal tissue using the detection of early increase in microvascular blood content |
| WO2007062179A2 (fr) | 2005-11-22 | 2007-05-31 | Neoguide Systems, Inc. | Procede de determination de la forme d'un instrument pliable |
| US20070135874A1 (en) * | 2005-11-22 | 2007-06-14 | Bala John L | Endoscope for therapeutic light delivery |
| WO2007062066A2 (fr) * | 2005-11-23 | 2007-05-31 | Neoguide Systems, Inc. | Cable de commande multibrin, non metallique, pour instruments orientables |
| US20090303317A1 (en) | 2006-02-07 | 2009-12-10 | Novadaq Technologies Inc. | Near infrared imaging |
| JP4914623B2 (ja) * | 2006-03-08 | 2012-04-11 | オリンパスメディカルシステムズ株式会社 | 内視鏡 |
| CN101489471B (zh) * | 2006-05-19 | 2014-08-27 | 北岸大学健康系统公司 | 利用检测微血管血液含量早期增大来识别异常组织的装置 |
| US8568299B2 (en) | 2006-05-19 | 2013-10-29 | Intuitive Surgical Operations, Inc. | Methods and apparatus for displaying three-dimensional orientation of a steerable distal tip of an endoscope |
| JP2009544430A (ja) * | 2006-07-26 | 2009-12-17 | ハンセン メディカル,インク. | 最小侵襲の外科手術を行うためのシステム |
| US8408269B2 (en) | 2006-07-28 | 2013-04-02 | Novadaq Technologies, Inc. | System and method for deposition and removal of an optical element on an endoscope objective |
| FR2904927B1 (fr) * | 2006-08-17 | 2018-05-18 | Mauna Kea Technologies | Utilisation d'un systeme d'imagerie par fluorescence confocale fibre in vivo in situ, systeme et procede d'imagerie par fluorescence confocale fibres in vivo in situ |
| US20080071144A1 (en) * | 2006-09-15 | 2008-03-20 | William Fein | Novel enhanced higher definition endoscope |
| US9079762B2 (en) | 2006-09-22 | 2015-07-14 | Ethicon Endo-Surgery, Inc. | Micro-electromechanical device |
| US7561317B2 (en) * | 2006-11-03 | 2009-07-14 | Ethicon Endo-Surgery, Inc. | Resonant Fourier scanning |
| US20080146898A1 (en) * | 2006-12-19 | 2008-06-19 | Ethicon Endo-Surgery, Inc. | Spectral windows for surgical treatment through intervening fluids |
| US8498695B2 (en) * | 2006-12-22 | 2013-07-30 | Novadaq Technologies Inc. | Imaging system with a single color image sensor for simultaneous fluorescence and color video endoscopy |
| US20080151343A1 (en) * | 2006-12-22 | 2008-06-26 | Ethicon Endo-Surgery, Inc. | Apparatus including a scanned beam imager having an optical dome |
| US7713265B2 (en) * | 2006-12-22 | 2010-05-11 | Ethicon Endo-Surgery, Inc. | Apparatus and method for medically treating a tattoo |
| US8273015B2 (en) * | 2007-01-09 | 2012-09-25 | Ethicon Endo-Surgery, Inc. | Methods for imaging the anatomy with an anatomically secured scanner assembly |
| US8801606B2 (en) | 2007-01-09 | 2014-08-12 | Ethicon Endo-Surgery, Inc. | Method of in vivo monitoring using an imaging system including scanned beam imaging unit |
| US7589316B2 (en) * | 2007-01-18 | 2009-09-15 | Ethicon Endo-Surgery, Inc. | Scanning beam imaging with adjustable detector sensitivity or gain |
| JP5396004B2 (ja) * | 2007-01-31 | 2014-01-22 | オリンパス株式会社 | 蛍光観察装置および蛍光観察装置の作動方法 |
| US8216214B2 (en) | 2007-03-12 | 2012-07-10 | Ethicon Endo-Surgery, Inc. | Power modulation of a scanning beam for imaging, therapy, and/or diagnosis |
| US20080226029A1 (en) * | 2007-03-12 | 2008-09-18 | Weir Michael P | Medical device including scanned beam unit for imaging and therapy |
| JP5174370B2 (ja) * | 2007-04-13 | 2013-04-03 | Hoya株式会社 | 蛍光内視鏡システム、及び光源ユニット |
| US7995045B2 (en) | 2007-04-13 | 2011-08-09 | Ethicon Endo-Surgery, Inc. | Combined SBI and conventional image processor |
| US8626271B2 (en) | 2007-04-13 | 2014-01-07 | Ethicon Endo-Surgery, Inc. | System and method using fluorescence to examine within a patient's anatomy |
| US9636015B2 (en) * | 2007-04-17 | 2017-05-02 | Covidien Lp | Colon polyp staging methods |
| US8160678B2 (en) | 2007-06-18 | 2012-04-17 | Ethicon Endo-Surgery, Inc. | Methods and devices for repairing damaged or diseased tissue using a scanning beam assembly |
| US7558455B2 (en) * | 2007-06-29 | 2009-07-07 | Ethicon Endo-Surgery, Inc | Receiver aperture broadening for scanned beam imaging |
| US7982776B2 (en) | 2007-07-13 | 2011-07-19 | Ethicon Endo-Surgery, Inc. | SBI motion artifact removal apparatus and method |
| US20090021818A1 (en) * | 2007-07-20 | 2009-01-22 | Ethicon Endo-Surgery, Inc. | Medical scanning assembly with variable image capture and display |
| US9125552B2 (en) * | 2007-07-31 | 2015-09-08 | Ethicon Endo-Surgery, Inc. | Optical scanning module and means for attaching the module to medical instruments for introducing the module into the anatomy |
| EP2182835B1 (fr) * | 2007-08-14 | 2019-06-19 | mivenion GmbH | Dispositif et procédure de diagnostic ou de préparation au diagnostic et/ou de surveillance de thérapie de maladies inflammatoires telles que la polyarthrite rhumatoïde |
| US7983739B2 (en) | 2007-08-27 | 2011-07-19 | Ethicon Endo-Surgery, Inc. | Position tracking and control for a scanning assembly |
| US7925333B2 (en) | 2007-08-28 | 2011-04-12 | Ethicon Endo-Surgery, Inc. | Medical device including scanned beam unit with operational control features |
| WO2009036396A1 (fr) * | 2007-09-14 | 2009-03-19 | Light Sciences Oncology, Inc. | Systèmes, dispositifs et procédés pour résection assistée par système photoactif |
| US9220398B2 (en) | 2007-10-11 | 2015-12-29 | Intuitive Surgical Operations, Inc. | System for managing Bowden cables in articulating instruments |
| JP4954858B2 (ja) * | 2007-11-30 | 2012-06-20 | オリンパス株式会社 | 蛍光観察装置および内視鏡装置 |
| US8031924B2 (en) * | 2007-11-30 | 2011-10-04 | General Electric Company | Methods and systems for removing autofluorescence from images |
| FR2924808B1 (fr) * | 2007-12-11 | 2010-09-03 | Commissariat Energie Atomique | Systeme d'analyse par fluorescence d'un champ dans une zone eclairee |
| JP5194819B2 (ja) * | 2008-01-16 | 2013-05-08 | コニカミノルタオプティクス株式会社 | 蛍光検出装置および蛍光検出方法 |
| US8406860B2 (en) | 2008-01-25 | 2013-03-26 | Novadaq Technologies Inc. | Method for evaluating blush in myocardial tissue |
| US8182418B2 (en) | 2008-02-25 | 2012-05-22 | Intuitive Surgical Operations, Inc. | Systems and methods for articulating an elongate body |
| JP5295587B2 (ja) * | 2008-02-27 | 2013-09-18 | オリンパスメディカルシステムズ株式会社 | 蛍光内視鏡装置及び蛍光内視鏡装置の作動方法 |
| JP2009207806A (ja) * | 2008-03-06 | 2009-09-17 | Fujinon Corp | 内視鏡の光源装置 |
| KR101517264B1 (ko) | 2008-03-18 | 2015-05-04 | 노바다크 테크놀러지즈 인코포레이티드 | 결합된 풀-칼라 반사 및 근-적외선 이미지용 이미지 시스템 |
| JP2009226066A (ja) * | 2008-03-24 | 2009-10-08 | Olympus Corp | カプセル型医療装置 |
| US8050520B2 (en) * | 2008-03-27 | 2011-11-01 | Ethicon Endo-Surgery, Inc. | Method for creating a pixel image from sampled data of a scanned beam imager |
| US9121055B2 (en) * | 2008-04-24 | 2015-09-01 | 3M Innovative Properties Company | Analysis of nucleic acid amplification curves using wavelet transformation |
| US8332014B2 (en) * | 2008-04-25 | 2012-12-11 | Ethicon Endo-Surgery, Inc. | Scanned beam device and method using same which measures the reflectance of patient tissue |
| US20090289200A1 (en) * | 2008-05-22 | 2009-11-26 | Fujifilm Corporation | Fluorescent image obtainment method and apparatus, fluorescence endoscope, and excitation-light unit |
| JP5081720B2 (ja) * | 2008-05-22 | 2012-11-28 | 富士フイルム株式会社 | 蛍光内視鏡装置および励起光ユニット |
| EP2241244A1 (fr) * | 2008-06-04 | 2010-10-20 | Fujifilm Corporation | Dispositif d'éclairage à utiliser dans un endoscope |
| DE102008027905A1 (de) * | 2008-06-12 | 2009-12-17 | Olympus Winter & Ibe Gmbh | Verfahren und Endoskop zur Verbesserung von Endoskopbildern |
| JP5216429B2 (ja) | 2008-06-13 | 2013-06-19 | 富士フイルム株式会社 | 光源装置および内視鏡装置 |
| US9531156B2 (en) * | 2008-06-18 | 2016-12-27 | Versatile Power, Inc. | Endoscopic light source |
| WO2010025122A1 (fr) * | 2008-08-25 | 2010-03-04 | William Marsh Rice University | Procédé permettant de mesurer la probabilité d’une maladie |
| JP5468756B2 (ja) | 2008-09-01 | 2014-04-09 | オリンパス株式会社 | 生体内観測装置 |
| US20100249607A1 (en) * | 2008-09-26 | 2010-09-30 | Massachusetts Institute Of Technology | Quantitative spectroscopic imaging |
| KR101061004B1 (ko) * | 2008-12-10 | 2011-09-01 | 한국전기연구원 | 광역학 치료 및 광 검출을 위한 장치 |
| US9885834B2 (en) | 2009-01-08 | 2018-02-06 | Northwestern University | Probe apparatus for measuring depth-limited properties with low-coherence enhanced backscattering |
| CN102368947A (zh) * | 2009-01-08 | 2012-03-07 | 美国生物光学公司 | 用于识别异常组织的探测设备 |
| US8300093B2 (en) * | 2009-01-12 | 2012-10-30 | Fujifilm Corporation | Endoscope image processing method and apparatus, and endoscope system using the same |
| US9155471B2 (en) | 2009-05-27 | 2015-10-13 | Lumicell, Inc'. | Methods and systems for spatially identifying abnormal cells |
| US8063385B2 (en) * | 2009-05-29 | 2011-11-22 | General Electric Company | Method and apparatus for ultraviolet scan planning |
| US9300113B2 (en) | 2009-06-18 | 2016-03-29 | Versatile Power, Inc. | Apparatus and method for driving multiple lasers |
| JP5460507B2 (ja) * | 2009-09-24 | 2014-04-02 | 富士フイルム株式会社 | 内視鏡装置の作動方法及び内視鏡装置 |
| JP5460506B2 (ja) * | 2009-09-24 | 2014-04-02 | 富士フイルム株式会社 | 内視鏡装置の作動方法及び内視鏡装置 |
| JP5371858B2 (ja) * | 2009-09-29 | 2013-12-18 | 富士フイルム株式会社 | 電子内視鏡装置 |
| JP5320268B2 (ja) * | 2009-11-12 | 2013-10-23 | 富士フイルム株式会社 | 画像表示装置 |
| EP2520211B1 (fr) * | 2010-02-10 | 2014-04-23 | Olympus Corporation | Dispositif d'endoscope a fluorescence |
| WO2011160062A2 (fr) | 2010-06-17 | 2011-12-22 | The Usa As Represented By The Secretary, National Institutes Of Health | Compositions et procédés pour traiter des affections inflammatoires |
| US20120190990A1 (en) * | 2010-06-25 | 2012-07-26 | Konica Minolta Opto, Inc. | Probe, Diagnosis Device, and Method for Using the Diagnosis Device |
| US9019345B2 (en) * | 2010-07-02 | 2015-04-28 | Intuitive Surgical Operations, Inc. | Imaging mode blooming suppression |
| JP5592715B2 (ja) * | 2010-07-02 | 2014-09-17 | オリンパス株式会社 | 画像処理装置および画像処理方法 |
| US20120010513A1 (en) * | 2010-07-08 | 2012-01-12 | Wong Stephen T C | Chemically-selective, label free, microendoscopic system based on coherent anti-stokes raman scattering and microelectromechanical fiber optic probe |
| US9277855B2 (en) * | 2010-08-10 | 2016-03-08 | Boston Scientific Scimed, Inc. | Endoscopic system for enhanced visualization |
| US8704890B2 (en) * | 2010-08-19 | 2014-04-22 | Olympus Corporation | Inspection apparatus and measuring method |
| EP2609742A4 (fr) * | 2010-08-27 | 2015-07-08 | Univ Leland Stanford Junior | Dispositif d'imagerie microscopique possédant des propriétés d'imagerie avancées |
| JP5604248B2 (ja) * | 2010-09-28 | 2014-10-08 | 富士フイルム株式会社 | 内視鏡画像表示装置 |
| JP5582948B2 (ja) * | 2010-09-29 | 2014-09-03 | 富士フイルム株式会社 | 内視鏡装置 |
| JP5737899B2 (ja) * | 2010-10-07 | 2015-06-17 | Hoya株式会社 | 診断システム |
| US9314304B2 (en) | 2010-12-08 | 2016-04-19 | Lumicell, Inc. | Methods and system for image guided cell ablation with microscopic resolution |
| JP5485191B2 (ja) * | 2011-01-19 | 2014-05-07 | 富士フイルム株式会社 | 内視鏡装置 |
| JP5485190B2 (ja) * | 2011-01-19 | 2014-05-07 | 富士フイルム株式会社 | 内視鏡装置 |
| DE102011002990B4 (de) * | 2011-01-21 | 2014-02-27 | Carl Zeiss Meditec Ag | Visualisieren von Gewebe in einem Operationsbereich |
| KR20140000329A (ko) | 2011-03-08 | 2014-01-02 | 노바다크 테크놀러지즈 인코포레이티드 | 풀 스펙트럼 led 조명기 |
| FR2972815B1 (fr) * | 2011-03-15 | 2013-03-22 | Commissariat Energie Atomique | Tete optique bispectrale a usage unique pour videoendoscope et videoendoscope associe |
| KR20120114895A (ko) * | 2011-04-08 | 2012-10-17 | 삼성전자주식회사 | 내시경 장치 및 상기 내시경 장치의 영상 획득 방법 |
| KR20120117165A (ko) * | 2011-04-14 | 2012-10-24 | 삼성전자주식회사 | 3차원 영상의 생성 방법 및 이를 이용하는 내시경 장치 |
| CH704900A1 (de) | 2011-05-05 | 2012-11-15 | Nemo Devices Ag | Messvorrichtung zur Messung zerebraler Parameter. |
| US8780362B2 (en) | 2011-05-19 | 2014-07-15 | Covidien Lp | Methods utilizing triangulation in metrology systems for in-situ surgical applications |
| US8878920B2 (en) * | 2011-07-12 | 2014-11-04 | Karl Storz Imaging, Inc. | Method and apparatus for protection from high intensity light |
| JP5926909B2 (ja) | 2011-09-07 | 2016-05-25 | オリンパス株式会社 | 蛍光観察装置 |
| US8634598B2 (en) | 2011-09-16 | 2014-01-21 | The Invention Science Fund I, Llc | Patient verification based on a landmark subsurface feature of the patient's body part |
| ES2727868T3 (es) | 2011-09-22 | 2019-10-21 | Univ George Washington | Sistemas para visualizar el tejido ablacionado |
| WO2013044182A1 (fr) * | 2011-09-22 | 2013-03-28 | The George Washington University | Systèmes et procédés de visualisation de tissu enlevé |
| JP6141196B2 (ja) * | 2011-12-28 | 2017-06-07 | オリンパス株式会社 | 蛍光観察装置 |
| DE102011122602A1 (de) * | 2011-12-30 | 2013-07-04 | Karl Storz Gmbh & Co. Kg | Vorrichtung und Verfahren zur endoskopischen Fluoreszenzdetektion |
| JP5872916B2 (ja) * | 2012-01-25 | 2016-03-01 | 富士フイルム株式会社 | 内視鏡システム、内視鏡システムのプロセッサ装置、及び内視鏡システムの作動方法 |
| EP2796085A4 (fr) * | 2012-02-17 | 2015-10-07 | Olympus Medical Systems Corp | Dispositif endoscopique |
| JP5993184B2 (ja) * | 2012-04-04 | 2016-09-14 | オリンパス株式会社 | 蛍光観察装置および蛍光観察装置の作動方法 |
| JP2013240401A (ja) * | 2012-05-18 | 2013-12-05 | Hoya Corp | 電子内視鏡装置 |
| JP6103824B2 (ja) * | 2012-06-04 | 2017-03-29 | オリンパス株式会社 | 蛍光内視鏡装置 |
| WO2013187148A1 (fr) | 2012-06-15 | 2013-12-19 | オリンパス株式会社 | Dispositif de traitement d'image, système de microscope, système d'endoscope et procédé de traitement d'image |
| US10278585B2 (en) | 2012-06-21 | 2019-05-07 | Novadaq Technologies ULC | Quantification and analysis of angiography and perfusion |
| GB201213827D0 (en) * | 2012-08-03 | 2012-09-19 | Artemis Diagnostics Ltd | Method and apparatus for imaging |
| WO2014024530A1 (fr) * | 2012-08-07 | 2014-02-13 | オリンパスメディカルシステムズ株式会社 | Dispositif d'endoscope à balayage, dispositif de traitement d'image et procédé de traitement d'image |
| EP2883489A4 (fr) * | 2012-08-08 | 2016-04-20 | Olympus Corp | Unité à fibre |
| KR101385978B1 (ko) * | 2012-08-09 | 2014-04-16 | 한국전기연구원 | 광학 진단 및 광 치료를 위한 복합 광원 장치 |
| CH707194A1 (de) | 2012-11-06 | 2014-05-15 | Nemodevices Ag | Messvorrichtung zur Bestimmung zerebraler Parameter. |
| EP2967280A4 (fr) * | 2013-03-14 | 2016-09-28 | Lumicell Inc | Dispositif d'imagerie médicale et ses procédés d'utilisation |
| EP2999402B1 (fr) | 2013-05-22 | 2023-01-04 | Luciole Medical AG | Système et procédé de mesure de paramètres dans un tissu corporel |
| RU2015148924A (ru) * | 2013-06-06 | 2017-05-22 | Конинклейке Филипс Н.В. | Устройство и способ визуализации субъекта |
| CN103393391A (zh) * | 2013-06-20 | 2013-11-20 | 中国科学院苏州生物医学工程技术研究所 | 一种多功能消化道内窥手术医疗器械 |
| CN106028914B (zh) * | 2013-11-14 | 2020-09-15 | 乔治华盛顿大学 | 用于使用荧光成像来确定损伤灶深度的系统和方法 |
| JP6737705B2 (ja) * | 2013-11-14 | 2020-08-12 | ザ・ジョージ・ワシントン・ユニバーシティThe George Washingtonuniversity | 損傷部位の深さを決定するシステムの動作方法及び心臓組織の画像を生成するシステム |
| CN105744883B (zh) | 2013-11-20 | 2022-03-01 | 乔治华盛顿大学 | 用于心脏组织高光谱分析的系统和方法 |
| DE102013224846B3 (de) * | 2013-12-04 | 2015-03-19 | Implen GmbH | Messkopf mit Beleuchtung |
| US20170220743A1 (en) * | 2014-02-19 | 2017-08-03 | Indiana University Research And Technology Corporation | Tracking real-time assessment of quality monitoring in endoscopy |
| US9267877B2 (en) | 2014-03-12 | 2016-02-23 | Nxgen Partners Ip, Llc | System and method for making concentration measurements within a sample material using orbital angular momentum |
| US9662019B2 (en) * | 2014-04-09 | 2017-05-30 | Nxgen Partners Ip, Llc | Orbital angular momentum and fluorescence-based microendoscope spectroscopy for cancer diagnosis |
| DE102014107342B4 (de) | 2014-05-24 | 2023-05-04 | Frank Braun | Vorrichtung und Verfahren zur Erkennung von Krebstumoren und anderen Gewebeveränderungen |
| EP3152549B1 (fr) * | 2014-06-05 | 2023-06-07 | Universität Heidelberg | Procédé et moyen d'imagerie multispectrale |
| CN104161493B (zh) * | 2014-07-22 | 2016-04-20 | 清华大学深圳研究生院 | 偏振成像内窥镜系统及内窥成像方法 |
| JP6085648B2 (ja) * | 2014-08-29 | 2017-02-22 | 富士フイルム株式会社 | 内視鏡用光源装置及び内視鏡システム |
| EP3215002B1 (fr) | 2014-11-03 | 2024-03-20 | The George Washington University | Systèmes d'évaluation de lésion |
| WO2016073492A1 (fr) | 2014-11-03 | 2016-05-12 | Luxcath, Llc. | Systèmes et procédés d'évaluation de qualité de contact |
| US10568687B2 (en) * | 2015-01-16 | 2020-02-25 | The Regents Of The University Of California | Integrated intraoperative diagnosis and thermal therapy system |
| US10779904B2 (en) | 2015-07-19 | 2020-09-22 | 460Medical, Inc. | Systems and methods for lesion formation and assessment |
| US10175171B2 (en) | 2015-08-01 | 2019-01-08 | Aron Vecht | Compact multi-UV-LED probe system and methods of use thereof |
| WO2017083709A1 (fr) * | 2015-11-13 | 2017-05-18 | Rutgers, The State University Of New Jersey | Diagnostic différentiel de maladies périapicales en fonction de résultats d'analyse d'image |
| AU2016351730B2 (en) | 2015-11-13 | 2019-07-11 | Novadaq Technologies Inc. | Systems and methods for illumination and imaging of a target |
| EP3408654B1 (fr) | 2016-01-26 | 2022-08-03 | Stryker European Operations Limited | Système d'imagerie par fluorescence et méthode pour l'imagerie par fluorescence |
| SE542683C2 (en) * | 2016-02-05 | 2020-06-23 | Haj Hosseini Neda | Probe for intracerebral guidance prior to stereotactic tumor biopsy |
| US10293122B2 (en) | 2016-03-17 | 2019-05-21 | Novadaq Technologies ULC | Endoluminal introducer with contamination avoidance |
| USD916294S1 (en) | 2016-04-28 | 2021-04-13 | Stryker European Operations Limited | Illumination and imaging device |
| US10447906B2 (en) * | 2016-05-02 | 2019-10-15 | Visionsense Ltd. | Dual path endoscope |
| CA3074106A1 (fr) * | 2016-05-19 | 2017-11-23 | Psip, Llc | Procedes de detection de polypes |
| US10869645B2 (en) | 2016-06-14 | 2020-12-22 | Stryker European Operations Limited | Methods and systems for adaptive imaging for low light signal enhancement in medical visualization |
| JPWO2018008136A1 (ja) * | 2016-07-07 | 2019-04-18 | オリンパス株式会社 | 画像処理装置および画像処理装置の作動方法 |
| WO2018125941A1 (fr) * | 2016-12-27 | 2018-07-05 | Urugus S.A. | Imagerie hyperspectrale lorsqu'un objet observé est immobile |
| CN106501948B (zh) * | 2016-12-29 | 2022-07-22 | 苏州塞罗尔医学影像科技有限公司 | 一种双通道光学旋转耦合器 |
| EP4242743A3 (fr) | 2017-02-10 | 2023-10-18 | Stryker European Operations Limited | Systèmes et procédés d'imagerie à fluorescence portative à champ ouvert |
| WO2018165620A1 (fr) * | 2017-03-09 | 2018-09-13 | The Board Of Trustees Of The Leland Stanford Junior University | Systèmes et procédés de classification d'images cliniques |
| US11426075B1 (en) | 2017-08-23 | 2022-08-30 | Lumicell, Inc. | System and method for residual cancer cell detection |
| JP2019078668A (ja) * | 2017-10-25 | 2019-05-23 | 株式会社トヨタプロダクションエンジニアリング | 応力発光測定システム、応力発光測定方法及び応力発光測定プログラム |
| CN107822585B (zh) * | 2017-11-27 | 2019-03-05 | 东北大学 | 一种多功能内窥镜系统 |
| KR20200104372A (ko) * | 2017-12-27 | 2020-09-03 | 에티컨, 엘엘씨 | 광 결핍 환경에서의 초분광 이미징 |
| US20190200906A1 (en) * | 2017-12-28 | 2019-07-04 | Ethicon Llc | Dual cmos array imaging |
| US10667693B1 (en) * | 2018-11-16 | 2020-06-02 | Perkinelmer Health Sciences, Inc. | Systems, methods, and apparatus for interference filter correction based on angle of incidence |
| WO2020118010A1 (fr) | 2018-12-06 | 2020-06-11 | Excelitas Technologies Corp. | Source de lumière à plasma et d'endoscopie entretenue par laser |
| AU2020209518A1 (en) * | 2019-01-17 | 2021-08-26 | Sbi Alapharma Canada, Inc. | Modular endoscopic system for visualization of disease |
| USD908881S1 (en) | 2019-01-17 | 2021-01-26 | Sbi Alapharma Canada, Inc. | Handheld endoscopic imaging device |
| US11625825B2 (en) | 2019-01-30 | 2023-04-11 | Covidien Lp | Method for displaying tumor location within endoscopic images |
| WO2020176906A1 (fr) * | 2019-02-26 | 2020-09-03 | Ai Biomed Corp. | Système de détection tissulaire et ses procédés d'utilisation |
| US11730340B2 (en) * | 2019-05-01 | 2023-08-22 | Karl Storz Imaging, Inc. | Video display system having an adaptive overlay |
| US11237270B2 (en) | 2019-06-20 | 2022-02-01 | Cilag Gmbh International | Hyperspectral, fluorescence, and laser mapping imaging with fixed pattern noise cancellation |
| US11937784B2 (en) | 2019-06-20 | 2024-03-26 | Cilag Gmbh International | Fluorescence imaging in a light deficient environment |
| US10841504B1 (en) | 2019-06-20 | 2020-11-17 | Ethicon Llc | Fluorescence imaging with minimal area monolithic image sensor |
| US11213194B2 (en) | 2019-06-20 | 2022-01-04 | Cilag Gmbh International | Optical fiber waveguide in an endoscopic system for hyperspectral, fluorescence, and laser mapping imaging |
| US11288772B2 (en) * | 2019-06-20 | 2022-03-29 | Cilag Gmbh International | Super resolution and color motion artifact correction in a pulsed fluorescence imaging system |
| US11671691B2 (en) | 2019-06-20 | 2023-06-06 | Cilag Gmbh International | Image rotation in an endoscopic laser mapping imaging system |
| US11622094B2 (en) | 2019-06-20 | 2023-04-04 | Cilag Gmbh International | Wide dynamic range using a monochrome image sensor for fluorescence imaging |
| US11540696B2 (en) | 2019-06-20 | 2023-01-03 | Cilag Gmbh International | Noise aware edge enhancement in a pulsed fluorescence imaging system |
| US11700995B2 (en) | 2019-06-20 | 2023-07-18 | Cilag Gmbh International | Speckle removal in a pulsed fluorescence imaging system |
| US11280737B2 (en) | 2019-06-20 | 2022-03-22 | Cilag Gmbh International | Super resolution and color motion artifact correction in a pulsed fluorescence imaging system |
| US11633089B2 (en) | 2019-06-20 | 2023-04-25 | Cilag Gmbh International | Fluorescence imaging with minimal area monolithic image sensor |
| US11154188B2 (en) | 2019-06-20 | 2021-10-26 | Cilag Gmbh International | Laser mapping imaging and videostroboscopy of vocal cords |
| US11533417B2 (en) | 2019-06-20 | 2022-12-20 | Cilag Gmbh International | Laser scanning and tool tracking imaging in a light deficient environment |
| US11674848B2 (en) | 2019-06-20 | 2023-06-13 | Cilag Gmbh International | Wide dynamic range using a monochrome image sensor for hyperspectral imaging |
| US11903563B2 (en) | 2019-06-20 | 2024-02-20 | Cilag Gmbh International | Offset illumination of a scene using multiple emitters in a fluorescence imaging system |
| US11925328B2 (en) | 2019-06-20 | 2024-03-12 | Cilag Gmbh International | Noise aware edge enhancement in a pulsed hyperspectral imaging system |
| US11793399B2 (en) | 2019-06-20 | 2023-10-24 | Cilag Gmbh International | Super resolution and color motion artifact correction in a pulsed hyperspectral imaging system |
| US11187658B2 (en) | 2019-06-20 | 2021-11-30 | Cilag Gmbh International | Fluorescence imaging with fixed pattern noise cancellation |
| US11758256B2 (en) | 2019-06-20 | 2023-09-12 | Cilag Gmbh International | Fluorescence imaging in a light deficient environment |
| US11432706B2 (en) | 2019-06-20 | 2022-09-06 | Cilag Gmbh International | Hyperspectral imaging with minimal area monolithic image sensor |
| US11412920B2 (en) | 2019-06-20 | 2022-08-16 | Cilag Gmbh International | Speckle removal in a pulsed fluorescence imaging system |
| US11083366B2 (en) | 2019-06-20 | 2021-08-10 | Cilag Gmbh International | Driving light emissions according to a jitter specification in a fluorescence imaging system |
| US11276148B2 (en) | 2019-06-20 | 2022-03-15 | Cilag Gmbh International | Super resolution and color motion artifact correction in a pulsed fluorescence imaging system |
| US11624830B2 (en) | 2019-06-20 | 2023-04-11 | Cilag Gmbh International | Wide dynamic range using a monochrome image sensor for laser mapping imaging |
| US11550057B2 (en) | 2019-06-20 | 2023-01-10 | Cilag Gmbh International | Offset illumination of a scene using multiple emitters in a fluorescence imaging system |
| US11389066B2 (en) | 2019-06-20 | 2022-07-19 | Cilag Gmbh International | Noise aware edge enhancement in a pulsed hyperspectral, fluorescence, and laser mapping imaging system |
| US11471055B2 (en) | 2019-06-20 | 2022-10-18 | Cilag Gmbh International | Noise aware edge enhancement in a pulsed fluorescence imaging system |
| US11877065B2 (en) | 2019-06-20 | 2024-01-16 | Cilag Gmbh International | Image rotation in an endoscopic hyperspectral imaging system |
| US11754500B2 (en) | 2019-06-20 | 2023-09-12 | Cilag Gmbh International | Minimizing image sensor input/output in a pulsed fluorescence imaging system |
| US11412152B2 (en) | 2019-06-20 | 2022-08-09 | Cilag Gmbh International | Speckle removal in a pulsed hyperspectral imaging system |
| US11589819B2 (en) | 2019-06-20 | 2023-02-28 | Cilag Gmbh International | Offset illumination of a scene using multiple emitters in a laser mapping imaging system |
| US11931009B2 (en) | 2019-06-20 | 2024-03-19 | Cilag Gmbh International | Offset illumination of a scene using multiple emitters in a hyperspectral imaging system |
| US11284784B2 (en) | 2019-06-20 | 2022-03-29 | Cilag Gmbh International | Controlling integral energy of a laser pulse in a fluorescence imaging system |
| US11898909B2 (en) | 2019-06-20 | 2024-02-13 | Cilag Gmbh International | Noise aware edge enhancement in a pulsed fluorescence imaging system |
| US11252326B2 (en) * | 2019-06-20 | 2022-02-15 | Cilag Gmbh International | Pulsed illumination in a laser mapping imaging system |
| US11716543B2 (en) | 2019-06-20 | 2023-08-01 | Cilag Gmbh International | Wide dynamic range using a monochrome image sensor for fluorescence imaging |
| US11398011B2 (en) * | 2019-06-20 | 2022-07-26 | Cilag Gmbh International | Super resolution and color motion artifact correction in a pulsed laser mapping imaging system |
| CN115066197A (zh) * | 2019-11-25 | 2022-09-16 | 艾科缇弗外科公司 | 用于医学成像的系统和方法 |
| US20210369118A1 (en) * | 2020-05-27 | 2021-12-02 | The George Washington University | Lesion visualization using dual wavelength approach |
| US20220039641A1 (en) * | 2020-08-05 | 2022-02-10 | Gyrus Acmi, Inc. D/B/A Olympus Surgical Technologies America | Techniques for composition identification of an anatomical target |
| NL2026240B1 (en) * | 2020-08-07 | 2022-04-08 | Limis Dev B V | Device for coupling coherent light into an endoscopic system |
| US20240023791A1 (en) * | 2020-08-26 | 2024-01-25 | Baylor College Of Medicine | End expandable optical fiber bundle |
| DE102021204906A1 (de) | 2021-05-14 | 2022-11-17 | Richard Wolf Gmbh | Biopsiesystem |
Family Cites Families (54)
| Publication number | Priority date | Publication date | Assignee | Title |
|---|---|---|---|---|
| US4193142A (en) | 1978-09-25 | 1980-03-18 | Bernadine Henningfield | Child's toilet apparatus |
| US4253447A (en) | 1978-10-16 | 1981-03-03 | Welch Allyn, Inc. | Color endoscope with charge coupled device and television viewing |
| US4261344A (en) | 1979-09-24 | 1981-04-14 | Welch Allyn, Inc. | Color endoscope |
| JPS59173020U (ja) * | 1983-05-06 | 1984-11-19 | オムロン株式会社 | 生体螢光内視鏡装置 |
| JPS60137342A (ja) | 1983-12-27 | 1985-07-20 | オリンパス光学工業株式会社 | 電子スコ−プ |
| US4746203A (en) | 1984-08-15 | 1988-05-24 | Olympus Optical Co., Ltd. | Optical system for endoscope |
| CN85100424B (zh) * | 1985-04-01 | 1986-10-29 | 上海医疗器械研究所 | 恶性肿瘤固有荧光诊断仪 |
| JPS63122421A (ja) * | 1986-11-12 | 1988-05-26 | 株式会社東芝 | 内視鏡装置 |
| US5255087A (en) * | 1986-11-29 | 1993-10-19 | Olympus Optical Co., Ltd. | Imaging apparatus and endoscope apparatus using the same |
| GB8701521D0 (en) | 1987-01-23 | 1993-12-01 | British Aerospace | Multi-parameter imaging polarimeter |
| JPH0828839B2 (ja) | 1987-04-21 | 1996-03-21 | オリンパス光学工業株式会社 | テレビカメラ装置 |
| WO1989002718A1 (fr) | 1987-09-24 | 1989-04-06 | Massachusetts Institute Of Technology | Systeme de catheter pour formation d'images |
| JP2732462B2 (ja) | 1987-09-30 | 1998-03-30 | オリンパス光学工業株式会社 | オートフォーカス付きビデオエンドスコープ装置 |
| US5001556A (en) * | 1987-09-30 | 1991-03-19 | Olympus Optical Co., Ltd. | Endoscope apparatus for processing a picture image of an object based on a selected wavelength range |
| DE3817915C2 (de) | 1988-05-26 | 1997-08-28 | Storz Karl Gmbh & Co | Flexibles Endoskop |
| US4981138A (en) * | 1988-06-30 | 1991-01-01 | Yale University | Endoscopic fiberoptic fluorescence spectrometer |
| US5143054A (en) * | 1988-12-28 | 1992-09-01 | Adair Edwin Lloyd | Cervical videoscope with detachable camera unit |
| US5421337A (en) | 1989-04-14 | 1995-06-06 | Massachusetts Institute Of Technology | Spectral diagnosis of diseased tissue |
| US5201318A (en) | 1989-04-24 | 1993-04-13 | Rava Richard P | Contour mapping of spectral diagnostics |
| JP2991299B2 (ja) | 1989-08-04 | 1999-12-20 | 株式会社東芝 | 内視鏡装置 |
| US5845639A (en) * | 1990-08-10 | 1998-12-08 | Board Of Regents Of The University Of Washington | Optical imaging methods |
| DE4026821A1 (de) * | 1990-08-24 | 1992-03-05 | Philips Patentverwaltung | Verfahren zur erfassung von anomalien der haut, insbesondere von melanomen, sowie vorrichtung zur durchfuehrung des verfahrens |
| JP3164609B2 (ja) * | 1990-10-31 | 2001-05-08 | オリンパス光学工業株式会社 | 内視鏡装置 |
| CA2104960C (fr) | 1991-02-26 | 2005-04-05 | Richard P. Rava | Systemes et methodes de spectroscopie moleculaire pour diagnostic tissulaire |
| US5280788A (en) | 1991-02-26 | 1994-01-25 | Massachusetts Institute Of Technology | Devices and methods for optical diagnosis of tissue |
| JPH0595900A (ja) | 1991-04-11 | 1993-04-20 | Olympus Optical Co Ltd | 内視鏡画像処理装置 |
| US5769792A (en) * | 1991-07-03 | 1998-06-23 | Xillix Technologies Corp. | Endoscopic imaging system for diseased tissue |
| WO1993025137A1 (fr) | 1992-06-05 | 1993-12-23 | Adair Edwin Lloyd | Endoscope video electronique operatoire |
| US5452723A (en) | 1992-07-24 | 1995-09-26 | Massachusetts Institute Of Technology | Calibrated spectrographic imaging |
| US5381784A (en) | 1992-09-30 | 1995-01-17 | Adair; Edwin L. | Stereoscopic endoscope |
| WO1994009694A1 (fr) | 1992-10-28 | 1994-05-11 | Arsenault, Dennis, J. | Endoscope electronique |
| US5438975A (en) | 1993-03-24 | 1995-08-08 | Machida Endoscope Co., Ltd. | Distal tip of endoscope having spirally coiled control wires |
| EP0696406B1 (fr) | 1993-04-07 | 1999-03-03 | John M. Ahern | Endoscope pourvu d'un dispositif a couplage de charge a son extremite distale |
| US5421339A (en) | 1993-05-12 | 1995-06-06 | Board Of Regents, The University Of Texas System | Diagnosis of dysplasia using laser induced fluoroescence |
| WO1995011624A2 (fr) | 1993-10-29 | 1995-05-04 | Feld Michael S | Endoscope raman |
| US5749830A (en) * | 1993-12-03 | 1998-05-12 | Olympus Optical Co., Ltd. | Fluorescent endoscope apparatus |
| US5590660A (en) * | 1994-03-28 | 1997-01-07 | Xillix Technologies Corp. | Apparatus and method for imaging diseased tissue using integrated autofluorescence |
| US5547455A (en) | 1994-03-30 | 1996-08-20 | Medical Media Systems | Electronically steerable endoscope |
| JP3455289B2 (ja) | 1994-06-23 | 2003-10-14 | ペンタックス株式会社 | 蛍光診断用内視鏡装置 |
| DE19535114B4 (de) * | 1994-09-21 | 2013-09-05 | Hoya Corp. | Endoskopsystem mit Fluoreszenzdiagnose |
| JP3411737B2 (ja) | 1995-03-03 | 2003-06-03 | ペンタックス株式会社 | 生体の蛍光診断装置 |
| JPH08280692A (ja) * | 1995-04-11 | 1996-10-29 | Matsushita Electric Ind Co Ltd | 医療用レーザ診断装置 |
| US5840017A (en) | 1995-08-03 | 1998-11-24 | Asahi Kogaku Kogyo Kabushiki Kaisha | Endoscope system |
| WO1997008538A1 (fr) * | 1995-08-24 | 1997-03-06 | Purdue Research Foundation | Imagerie et spectroscopie des tissus, basees sur la duree de vie de la fluorescence et autres supports programmables |
| JP3435268B2 (ja) | 1995-11-09 | 2003-08-11 | ペンタックス株式会社 | 蛍光観察内視鏡装置 |
| US5719399A (en) | 1995-12-18 | 1998-02-17 | The Research Foundation Of City College Of New York | Imaging and characterization of tissue based upon the preservation of polarized light transmitted therethrough |
| JP3796635B2 (ja) * | 1996-03-06 | 2006-07-12 | 富士写真フイルム株式会社 | 蛍光検出装置 |
| DE19612536A1 (de) * | 1996-03-29 | 1997-10-02 | Freitag Lutz Dr | Anordnung und Verfahren zur Diagnose von malignem Gewebe durch Fluoreszenzbetrachtung |
| US6296608B1 (en) * | 1996-07-08 | 2001-10-02 | Boston Scientific Corporation | Diagnosing and performing interventional procedures on tissue in vivo |
| US5793886A (en) * | 1996-12-19 | 1998-08-11 | Eastman Kodak Company | Method of adjusting image pixel values within an image sequence by interpolation of target cumulative histograms for images to be adjusted |
| US6201989B1 (en) * | 1997-03-13 | 2001-03-13 | Biomax Technologies Inc. | Methods and apparatus for detecting the rejection of transplanted tissue |
| US5999844A (en) * | 1997-04-23 | 1999-12-07 | Accumed International, Inc. | Method and apparatus for imaging and sampling diseased tissue using autofluorescence |
| US6124597A (en) * | 1997-07-07 | 2000-09-26 | Cedars-Sinai Medical Center | Method and devices for laser induced fluorescence attenuation spectroscopy |
| US6422994B1 (en) * | 1997-09-24 | 2002-07-23 | Olympus Optical Co., Ltd. | Fluorescent diagnostic system and method providing color discrimination enhancement |
-
1999
- 1999-01-26 KR KR1020007008162A patent/KR20010040418A/ko not_active Application Discontinuation
- 1999-01-26 WO PCT/US1999/001723 patent/WO1999037204A1/fr not_active Application Discontinuation
- 1999-01-26 CN CN99802431A patent/CN1289239A/zh active Pending
- 1999-01-26 AT AT99904331T patent/ATE391451T1/de not_active IP Right Cessation
- 1999-01-26 AU AU24748/99A patent/AU752829B2/en not_active Ceased
- 1999-01-26 EP EP99904331A patent/EP1051104B1/fr not_active Expired - Lifetime
- 1999-01-26 US US09/238,664 patent/US6537211B1/en not_active Expired - Fee Related
- 1999-01-26 JP JP2000528202A patent/JP2002500907A/ja active Pending
- 1999-01-26 DE DE69938493T patent/DE69938493T2/de not_active Expired - Lifetime
- 1999-01-26 CA CA002318180A patent/CA2318180A1/fr not_active Abandoned
-
2002
- 2002-04-30 HK HK02103268.7A patent/HK1041594A1/zh unknown
-
2003
- 2003-03-20 US US10/393,028 patent/US7235045B2/en not_active Expired - Fee Related
Also Published As
| Publication number | Publication date |
|---|---|
| US20030191368A1 (en) | 2003-10-09 |
| DE69938493D1 (de) | 2008-05-21 |
| EP1051104A1 (fr) | 2000-11-15 |
| WO1999037204A1 (fr) | 1999-07-29 |
| DE69938493T2 (de) | 2009-05-20 |
| HK1041594A1 (zh) | 2002-07-12 |
| AU752829B2 (en) | 2002-10-03 |
| KR20010040418A (ko) | 2001-05-15 |
| US7235045B2 (en) | 2007-06-26 |
| AU2474899A (en) | 1999-08-09 |
| ATE391451T1 (de) | 2008-04-15 |
| JP2002500907A (ja) | 2002-01-15 |
| CA2318180A1 (fr) | 1999-07-29 |
| CN1289239A (zh) | 2001-03-28 |
| US6537211B1 (en) | 2003-03-25 |
Similar Documents
| Publication | Publication Date | Title |
|---|---|---|
| EP1051104B1 (fr) | Imagerie endoscopique par fluorescence | |
| US10874333B2 (en) | Systems and methods for diagnosis of middle ear conditions and detection of analytes in the tympanic membrane | |
| US7697975B2 (en) | Methods and apparatus for fluorescence imaging using multiple excitation-emission pairs and simultaneous multi-channel image detection | |
| US6678398B2 (en) | Dual mode real-time screening and rapid full-area, selective-spectral, remote imaging and analysis device and process | |
| EP1669019B1 (fr) | Dispositif d'endoscopie par fluorescence | |
| Mayinger et al. | Endoscopic light-induced autofluorescence spectroscopy for the diagnosis of colorectal cancer and adenoma | |
| US8320650B2 (en) | In vivo spectral micro-imaging of tissue | |
| Mayinger et al. | Evaluation of in vivo endoscopic autofluorescence spectroscopy in gastric cancer | |
| US20060184040A1 (en) | Apparatus, system and method for optically analyzing a substrate | |
| US20080051664A1 (en) | Autofluorescence detection and imaging of bladder cancer realized through a cystoscope | |
| US20040068193A1 (en) | Optical devices for medical diagnostics | |
| DaCosta et al. | Light-induced fluorescence endoscopy of the gastrointestinal tract | |
| JPH0654792A (ja) | 撮像装置 | |
| JP2002535025A (ja) | 内視鏡用の自己蛍光画像化システム | |
| US6289236B1 (en) | Methods and apparatus for distinguishing inflamed and tumorous bladder tissue | |
| WO2009052607A1 (fr) | Procédé et appareil d'imagerie d'une oxygénation microvasculaire | |
| Song et al. | Endoscopic detection of early upper GI cancers | |
| Prosst et al. | Fluorescence diagnosis of colorectal neoplasms: a review of clinical applications | |
| Tercelj et al. | Acquisition of fluorescence and reflectance spectra during routine bronchoscopy examinations using the ClearVu Elite™ device: Pilot study | |
| Kang et al. | System for fluorescence diagnosis and photodynamic therapy of cervical disease | |
| RU2752279C1 (ru) | Способ комбинированной эндоскопической диагностики хронических гиперпластических, предопухолевых процессов и первичных раков гортани | |
| Waterhouse et al. | Flexible Endoscopy: Early Detection of Dysplasia in Barrett’s Oesophagus | |
| RU2152162C1 (ru) | Способ повышения точности обнаружения злокачественных новообразований и определения границ их локализации | |
| Van Dam | Laser-induced fluorescence spectroscopy: Somewhere over the rainbow | |
| Zeng | 6 Endoscopic Reflectance and Fluorescence Spectroscopy |
Legal Events
| Date | Code | Title | Description |
|---|---|---|---|
| PUAI | Public reference made under article 153(3) epc to a published international application that has entered the european phase |
Free format text: ORIGINAL CODE: 0009012 |
|
| 17P | Request for examination filed |
Effective date: 20000731 |
|
| AK | Designated contracting states |
Kind code of ref document: A1 Designated state(s): AT BE CH CY DE DK ES FI FR GB GR IE IT LI LU MC NL PT SE |
|
| RIN1 | Information on inventor provided before grant (corrected) |
Inventor name: FULGHUM, STEPHEN F. Inventor name: VAN DAM, JACQUES Inventor name: WANG, YANG Inventor name: FELD, MICHAEL, S. Inventor name: WANG, THOMAS, D. |
|
| RIN1 | Information on inventor provided before grant (corrected) |
Inventor name: FULGHUM, STEPHEN F. Inventor name: VAN DAM, JACQUES DIV. OF GASTROENT. MAILSTOP 5187 Inventor name: WANG, YANG Inventor name: FELD, MICHAEL, S. Inventor name: WANG, THOMAS, D. |
|
| 17Q | First examination report despatched |
Effective date: 20031023 |
|
| REG | Reference to a national code |
Ref country code: HK Ref legal event code: WD Ref document number: 1032346 Country of ref document: HK |
|
| GRAP | Despatch of communication of intention to grant a patent |
Free format text: ORIGINAL CODE: EPIDOSNIGR1 |
|
| GRAS | Grant fee paid |
Free format text: ORIGINAL CODE: EPIDOSNIGR3 |
|
| GRAA | (expected) grant |
Free format text: ORIGINAL CODE: 0009210 |
|
| AK | Designated contracting states |
Kind code of ref document: B1 Designated state(s): AT BE CH CY DE DK ES FI FR GB GR IE IT LI LU MC NL PT SE |
|
| REG | Reference to a national code |
Ref country code: GB Ref legal event code: FG4D |
|
| REG | Reference to a national code |
Ref country code: CH Ref legal event code: EP |
|
| REG | Reference to a national code |
Ref country code: IE Ref legal event code: FG4D |
|
| REF | Corresponds to: |
Ref document number: 69938493 Country of ref document: DE Date of ref document: 20080521 Kind code of ref document: P |
|
| NLV1 | Nl: lapsed or annulled due to failure to fulfill the requirements of art. 29p and 29m of the patents act | ||
| PG25 | Lapsed in a contracting state [announced via postgrant information from national office to epo] |
Ref country code: PT Free format text: LAPSE BECAUSE OF FAILURE TO SUBMIT A TRANSLATION OF THE DESCRIPTION OR TO PAY THE FEE WITHIN THE PRESCRIBED TIME-LIMIT Effective date: 20080909 Ref country code: NL Free format text: LAPSE BECAUSE OF FAILURE TO SUBMIT A TRANSLATION OF THE DESCRIPTION OR TO PAY THE FEE WITHIN THE PRESCRIBED TIME-LIMIT Effective date: 20080409 Ref country code: FI Free format text: LAPSE BECAUSE OF FAILURE TO SUBMIT A TRANSLATION OF THE DESCRIPTION OR TO PAY THE FEE WITHIN THE PRESCRIBED TIME-LIMIT Effective date: 20080409 Ref country code: ES Free format text: LAPSE BECAUSE OF FAILURE TO SUBMIT A TRANSLATION OF THE DESCRIPTION OR TO PAY THE FEE WITHIN THE PRESCRIBED TIME-LIMIT Effective date: 20080720 |
|
| PG25 | Lapsed in a contracting state [announced via postgrant information from national office to epo] |
Ref country code: AT Free format text: LAPSE BECAUSE OF FAILURE TO SUBMIT A TRANSLATION OF THE DESCRIPTION OR TO PAY THE FEE WITHIN THE PRESCRIBED TIME-LIMIT Effective date: 20080409 |
|
| EN | Fr: translation not filed | ||
| PG25 | Lapsed in a contracting state [announced via postgrant information from national office to epo] |
Ref country code: SE Free format text: LAPSE BECAUSE OF FAILURE TO SUBMIT A TRANSLATION OF THE DESCRIPTION OR TO PAY THE FEE WITHIN THE PRESCRIBED TIME-LIMIT Effective date: 20080709 Ref country code: DK Free format text: LAPSE BECAUSE OF FAILURE TO SUBMIT A TRANSLATION OF THE DESCRIPTION OR TO PAY THE FEE WITHIN THE PRESCRIBED TIME-LIMIT Effective date: 20080409 |
|
| PLBE | No opposition filed within time limit |
Free format text: ORIGINAL CODE: 0009261 |
|
| STAA | Information on the status of an ep patent application or granted ep patent |
Free format text: STATUS: NO OPPOSITION FILED WITHIN TIME LIMIT |
|
| PG25 | Lapsed in a contracting state [announced via postgrant information from national office to epo] |
Ref country code: BE Free format text: LAPSE BECAUSE OF FAILURE TO SUBMIT A TRANSLATION OF THE DESCRIPTION OR TO PAY THE FEE WITHIN THE PRESCRIBED TIME-LIMIT Effective date: 20080409 |
|
| 26N | No opposition filed |
Effective date: 20090112 |
|
| PG25 | Lapsed in a contracting state [announced via postgrant information from national office to epo] |
Ref country code: FR Free format text: LAPSE BECAUSE OF FAILURE TO SUBMIT A TRANSLATION OF THE DESCRIPTION OR TO PAY THE FEE WITHIN THE PRESCRIBED TIME-LIMIT Effective date: 20090130 |
|
| PG25 | Lapsed in a contracting state [announced via postgrant information from national office to epo] |
Ref country code: MC Free format text: LAPSE BECAUSE OF NON-PAYMENT OF DUE FEES Effective date: 20090131 Ref country code: IT Free format text: LAPSE BECAUSE OF FAILURE TO SUBMIT A TRANSLATION OF THE DESCRIPTION OR TO PAY THE FEE WITHIN THE PRESCRIBED TIME-LIMIT Effective date: 20080409 |
|
| REG | Reference to a national code |
Ref country code: CH Ref legal event code: PL |
|
| GBPC | Gb: european patent ceased through non-payment of renewal fee |
Effective date: 20090126 |
|
| PG25 | Lapsed in a contracting state [announced via postgrant information from national office to epo] |
Ref country code: CY Free format text: LAPSE BECAUSE OF FAILURE TO SUBMIT A TRANSLATION OF THE DESCRIPTION OR TO PAY THE FEE WITHIN THE PRESCRIBED TIME-LIMIT Effective date: 20080409 |
|
| PG25 | Lapsed in a contracting state [announced via postgrant information from national office to epo] |
Ref country code: LI Free format text: LAPSE BECAUSE OF NON-PAYMENT OF DUE FEES Effective date: 20090131 Ref country code: CH Free format text: LAPSE BECAUSE OF NON-PAYMENT OF DUE FEES Effective date: 20090131 |
|
| PG25 | Lapsed in a contracting state [announced via postgrant information from national office to epo] |
Ref country code: GB Free format text: LAPSE BECAUSE OF NON-PAYMENT OF DUE FEES Effective date: 20090126 |
|
| PG25 | Lapsed in a contracting state [announced via postgrant information from national office to epo] |
Ref country code: IE Free format text: LAPSE BECAUSE OF NON-PAYMENT OF DUE FEES Effective date: 20090126 |
|
| PG25 | Lapsed in a contracting state [announced via postgrant information from national office to epo] |
Ref country code: GR Free format text: LAPSE BECAUSE OF FAILURE TO SUBMIT A TRANSLATION OF THE DESCRIPTION OR TO PAY THE FEE WITHIN THE PRESCRIBED TIME-LIMIT Effective date: 20080710 |
|
| PG25 | Lapsed in a contracting state [announced via postgrant information from national office to epo] |
Ref country code: LU Free format text: LAPSE BECAUSE OF NON-PAYMENT OF DUE FEES Effective date: 20090126 |
|
| REG | Reference to a national code |
Ref country code: DE Ref legal event code: R082 Ref document number: 69938493 Country of ref document: DE Representative=s name: MAI DOERR BESIER PATENTANWAELTE, DE |
|
| PGFP | Annual fee paid to national office [announced via postgrant information from national office to epo] |
Ref country code: DE Payment date: 20140129 Year of fee payment: 16 |
|
| REG | Reference to a national code |
Ref country code: DE Ref legal event code: R119 Ref document number: 69938493 Country of ref document: DE |
|
| PG25 | Lapsed in a contracting state [announced via postgrant information from national office to epo] |
Ref country code: DE Free format text: LAPSE BECAUSE OF NON-PAYMENT OF DUE FEES Effective date: 20150801 |