WO2019230010A1 - 予兆データサーバ及びx線厚み測定システム - Google Patents
予兆データサーバ及びx線厚み測定システム Download PDFInfo
- Publication number
- WO2019230010A1 WO2019230010A1 PCT/JP2018/032781 JP2018032781W WO2019230010A1 WO 2019230010 A1 WO2019230010 A1 WO 2019230010A1 JP 2018032781 W JP2018032781 W JP 2018032781W WO 2019230010 A1 WO2019230010 A1 WO 2019230010A1
- Authority
- WO
- WIPO (PCT)
- Prior art keywords
- value
- unit
- measurement
- ray
- sign
- Prior art date
- Legal status (The legal status is an assumption and is not a legal conclusion. Google has not performed a legal analysis and makes no representation as to the accuracy of the status listed.)
- Ceased
Links
Images








Classifications
-
- G—PHYSICS
- G01—MEASURING; TESTING
- G01B—MEASURING LENGTH, THICKNESS OR SIMILAR LINEAR DIMENSIONS; MEASURING ANGLES; MEASURING AREAS; MEASURING IRREGULARITIES OF SURFACES OR CONTOURS
- G01B15/00—Measuring arrangements characterised by the use of electromagnetic waves or particle radiation, e.g. by the use of microwaves, X-rays, gamma rays or electrons
- G01B15/02—Measuring arrangements characterised by the use of electromagnetic waves or particle radiation, e.g. by the use of microwaves, X-rays, gamma rays or electrons for measuring thickness
-
- G—PHYSICS
- G01—MEASURING; TESTING
- G01N—INVESTIGATING OR ANALYSING MATERIALS BY DETERMINING THEIR CHEMICAL OR PHYSICAL PROPERTIES
- G01N23/00—Investigating or analysing materials by the use of wave or particle radiation, e.g. X-rays or neutrons, not covered by groups G01N3/00 – G01N17/00, G01N21/00 or G01N22/00
- G01N23/02—Investigating or analysing materials by the use of wave or particle radiation, e.g. X-rays or neutrons, not covered by groups G01N3/00 – G01N17/00, G01N21/00 or G01N22/00 by transmitting the radiation through the material
- G01N23/06—Investigating or analysing materials by the use of wave or particle radiation, e.g. X-rays or neutrons, not covered by groups G01N3/00 – G01N17/00, G01N21/00 or G01N22/00 by transmitting the radiation through the material and measuring the absorption
Definitions
- Embodiment relates to a precursor data server and an X-ray thickness measurement system.
- a measurement target such as a steel plate
- an X-ray thickness measurement device that measures the thickness of the measurement target using X-rays is used.
- the problem described above is solved, and the predictive data server of the embodiment is connected to an X-ray thickness measuring apparatus.
- the X-ray thickness measurement apparatus includes a power source, an X-ray generator, and an output detection unit.
- the power supply supplies power.
- the X-ray generator has a filament to which the power from the power source is supplied and irradiates the X-ray.
- the output detection unit outputs a detection value for calculating the thickness of the measurement object according to the intensity of the X-ray that has passed through the measurement object that is a target for measuring the thickness.
- the sign data server includes an acquisition unit and a sign unit.
- the acquisition unit includes: a drive voltage value indicating a voltage value supplied by the power source; a drive current value indicating a current value supplied by the power source; a tube voltage value indicating a voltage value supplied to the filament; Measurement information including at least one of the tube current value indicating the value of the supplied current and the detected value is acquired a plurality of times.
- the sign unit generates sign data for diagnosing an abnormality of the X-ray thickness measurement apparatus based on the measurement information acquired by the acquisition unit, accumulates it in a storage unit, and outputs it according to a request.
- FIG. 1 is a schematic diagram illustrating an overall configuration of an X-ray thickness measurement system according to an embodiment.
- FIG. 2 is a block diagram showing the configuration of the control system of the X-ray thickness measurement system.
- FIG. 3A is a graph showing an example of the tube voltage value TV of measurement information.
- FIG. 3B is a graph showing an example of the tube current value TC of the measurement information.
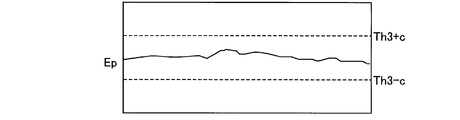
- FIG. 3C is a graph illustrating an example of the drive voltage value Ep of the measurement information.
- FIG. 3D is a graph illustrating an example of the drive current value Ip of the measurement information.
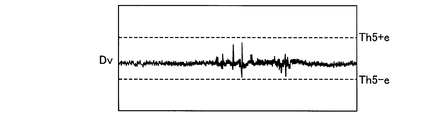
- FIG. 3E is a graph illustrating an example of a detection value Dv of measurement information.
- FIG. 4 is a diagram illustrating an example of a warning image output from the maintenance device.
- FIG. 4 is a diagram illustrating an example of a warning image output from the maintenance device.
- FIG. 5 is a flowchart of the measurement process executed by the control-side processing unit of the thickness measuring apparatus.
- FIG. 6 is a flowchart of the sign process executed by the sign side processing unit of the sign data server.
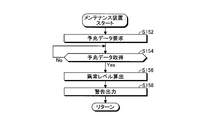
- FIG. 7 is a flowchart of maintenance processing executed by the maintenance-side processing unit of the maintenance device.
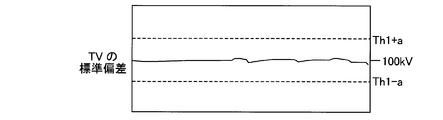
- FIG. 8A is a graph of the standard deviation of the tube voltage value TV of measurement information.
- FIG. 8B is a graph of the standard deviation of the tube current value TC of the measurement information.
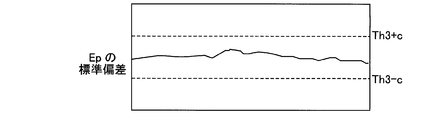
- FIG. 8C is a graph of the standard deviation of the drive voltage value Ep of the measurement information.
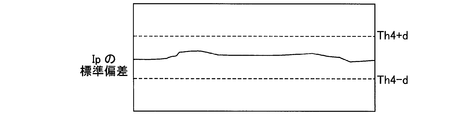
- FIG. 8D is a graph of the standard deviation of the drive current value Ip of the measurement information.
- FIG. 8E is a graph of the standard deviation of the detection value Dv of the measurement information.
- FIG. 9 is a graph of the product of variance and kurtosis of detected values included in measurement information.
- FIG. 1 is a schematic diagram illustrating an overall configuration of an X-ray thickness measurement system 10 according to an embodiment.
- the X-ray thickness measurement system 10 measures the thickness of the measurement object 90 with the X-ray thickness measurement device 12 and generates and accumulates predictive data necessary for diagnosing the abnormality of the X-ray thickness measurement device 12. An abnormality of the measuring device 12 is diagnosed.
- the X-ray thickness measurement system 10 includes an X-ray thickness measurement device 12, a predictive data server 14, a maintenance device 16, and a network 18.
- the network 18 may be a LAN (Local Area Network) or the like that connects the X-ray thickness measuring device 12, the predictive data server 14, and the maintenance device 16 so that information can be transmitted and received between them.
- LAN Local Area Network
- the X-ray thickness measurement apparatus 12 irradiates the measurement object 90 that is the object of thickness measurement with X-rays, and measures the thickness of the measurement object 90 based on the amount of X-rays that have passed through the measurement object 90.
- the X-ray thickness measurement device 12 includes a measurement unit 20, an X-ray control power source 22, and a control device 24.
- the measurement unit 20 irradiates the measurement target 90 with X-rays and outputs at least one of a detection voltage or a detection current for calculating the thickness of the measurement target 90 to the control device 24 as a detection value.
- the measurement unit 20 includes a holding unit 26, a transformer 28, an X-ray generator 30, a detector 32, an output detection unit 34, a drive detection unit 42, and a tube detection unit 44.
- the holding unit 26 holds a transformer 28, an X-ray generator 30, a detector 32, and an output detection unit 34.
- the transformer 28 transforms (for example, boosts) the electric power output from the X-ray control power supply 22 and supplies it to the filament 38 of the X-ray generator 30 described later.
- the X-ray generator 30 generates X-rays by the power supplied from the X-ray control power source 22 and irradiates the measurement object 90.
- the X-ray generator 30 includes an X-ray tube 36, a filament 38, and a target 40.
- the X-ray tube 36 is, for example, a sealed tube that maintains the inside in a vacuum state.
- the X-ray tube 36 accommodates and holds the filament 38 and the target 40 therein.
- the filament 38 emits electrons to the target 40 by the electric power supplied from the X-ray control power supply 22 via the transformer 28.
- the target 40 irradiates the measurement target 90 with X-rays by collision of electrons emitted from the filament 38.
- the detector 32 is disposed at a position facing the X-ray generator 30 with the measurement object 90 interposed therebetween.
- the detector 32 outputs at least one of a detection voltage and a detection current corresponding to the intensity of the X-rays irradiated by the X-ray generator 30 and passed through the measurement object 90 to the output detection unit 34 as a detection signal.
- the detector 32 may be, for example, an ionization chamber that outputs a detection voltage and a detection current corresponding to incident X-rays.
- the output detection unit 34 converts the detection signal output from the detector 32 and outputs the detection signal to the control device 24.
- the output detection unit 34 may include an AD converter and the like, and may output a value obtained by digitally converting an analog detection signal as a detection value for calculating the thickness of the measurement target 90.
- the X-ray control power supply 22 is an example of a power supply, and supplies power supplied to the filament 38 of the X-ray generator 30 via the transformer 28 based on a power supply control signal from the control device 24.
- the X-ray control power source 22 may be connected to an external power source such as a commercial power source, for example.
- the drive detection unit 42 detects a drive voltage value and a drive current value.
- the drive voltage value is a voltage value on the primary side of the transformer 28 and is a voltage value of power supplied from the X-ray control power supply 22.
- the drive current value is a value of a current flowing on the primary side of the transformer 28 and is a value of a current of power supplied from the X-ray control power supply 22.
- the drive detection unit 42 outputs the detected drive voltage value and drive current value to the control device 24.
- the tube detector 44 detects a tube voltage value and a tube current value.
- the tube voltage value is a voltage value on the secondary side of the transformer 28 and is a voltage value of power supplied to the filament 38.
- the tube current value is a value of a current flowing through the secondary side of the X-ray generator 30 and is a value of a current of power supplied to the filament 38.
- the tube detection unit 44 outputs the detected tube voltage value and tube current value to the control device 24.
- the control device 24 is responsible for overall control of the X-ray thickness measuring device 12.
- the control device 24 may be a computer used by an operator or the like who measures the thickness of the measurement object 90 using the X-ray thickness measurement device 12.
- the control device 24 calculates the thickness of the measurement target 90 based on the detection value acquired from the output detection unit 34.
- the control device 24 outputs to the X-ray control power supply 22 a power supply control signal that indicates a drive voltage value corresponding to the tube voltage value of the power supplied to the X-ray generator 30.
- the control device 24 may generate a power supply control signal that indicates a drive voltage value set based on the tube voltage value acquired from the tube detection unit 44.
- the control device 24 outputs the measurement information 56 including the detection value, the drive voltage value, the drive current value, the tube voltage value, and the tube current value acquired from the output detection unit 34, the drive detection unit 42, and the tube detection unit 44 to the network 18. To do.
- the control device 24 may output the measurement information 56 by broadcast, for example.
- the sign data server 14 repeatedly acquires the measurement information 56 from the control device 24 a plurality of times, and stores data indicating a sign of abnormality of the X-ray thickness measurement apparatus 12 generated from the plurality of measurement information 56 (hereinafter, sign data). And accumulate.
- the sign data server 14 outputs the sign data in response to a request from the maintenance device 16.
- the maintenance device 16 is a computer used by, for example, a maintenance person who maintains the X-ray thickness measuring device 12.
- the maintenance device 16 diagnoses an abnormality of the X-ray thickness measuring device 12 based on the predictive data acquired from the predictive data server 14 and outputs the diagnosis result as an image or the like.
- FIG. 2 is a block diagram showing the configuration of the control system of the X-ray thickness measurement system 10.
- the control device 24 includes a control side processing unit 46 and a control side storage unit 48.
- the control side processing unit 46 is responsible for overall control of the X-ray thickness measuring apparatus 12.
- the control-side processing unit 46 may be a hardware processor such as a CPU (Central Processing Unit) and a GPU (Graphics Processing Unit) that execute arithmetic processing and the like.
- the control processing unit 46 reads the program stored in the control storage unit 48 and develops the read program in the control storage unit 48 to execute various arithmetic processes.
- the control processing unit 46 reads the measurement program 54 and functions as the reception unit 50 and the calculation unit 52.
- Part or all of the reception unit 50 and the calculation unit 52 may be configured by hardware such as a circuit including an ASIC (Application Specific Integrated Circuit) or an FPGA (Field-Programmable Gate Array).
- ASIC Application Specific Integrated Circuit
- FPGA Field-Programmable Gate Array
- the reception unit 50 receives the measurement information 56 and outputs it to the calculation unit 52.
- the reception unit 50 receives, for example, the detection value from the output detection unit 34, the drive voltage value and the drive current value from the drive detection unit 42, and the tube voltage value and the tube current value from the tube detection unit 44 as the measurement information 56.
- the calculation unit 52 calculates the thickness of the measurement target 90 based on the measurement information 56 and controls the X-ray thickness measurement apparatus 12. For example, the calculation unit 52 calculates the thickness of the measurement target 90 based on the detection value.
- the calculation unit 52 generates and outputs a power supply control signal for instructing the drive voltage value to the X-ray control power supply 22 so that the tube voltage value and the tube current value become preset voltage values.
- the calculation unit 52 may output the measurement information 56 to the network 18 by broadcasting.
- the control-side storage unit 48 includes a main storage device and an auxiliary storage device such as a ROM (Read Only Memory), a RAM (Random Access Memory), and an HDD (Hard Disk Drive).
- the control-side storage unit 48 stores a measurement program 54 executed by the control-side processing unit 46, measurement information 56 acquired for executing the measurement program 54, and the like.
- the measurement program 54 may be provided by being stored in a computer-readable storage medium such as a CD-ROM (Compact Disc Read Only Memory) or a DVD-ROM (Digital Versatile Disc Read Only Memory) or a network such as the Internet. It may be provided via.
- the sign data server 14 includes a sign side processing unit 58 and a sign side storage unit 60.
- the sign side processing unit 58 governs overall control of the sign data server 14.
- the sign side processing unit 58 may be a hardware processor such as a CPU and a GPU.
- the sign side processing unit 58 reads the program stored in the sign side storage unit 60 and develops the read program in the sign side storage unit 60 to execute various arithmetic processes.
- the sign side processing unit 58 reads, for example, the sign program 66 and functions as the acquisition unit 62 and the sign unit 64. Part or all of the acquisition unit 62 and the sign unit 64 may be configured by hardware such as a circuit including an ASIC or FPGA.
- the acquisition unit 62 acquires measurement information 56 including a drive voltage value, a drive current value, a tube voltage value, a tube current value, and a detection value flowing on the network 18 a plurality of times, and outputs the measurement information 56 to the sign unit 64.
- the sign unit 64 generates sign data 68 for diagnosing an abnormality of the X-ray thickness measurement device 12 based on the plurality of pieces of measurement information 56 acquired from the network 18 and stores the sign data 68 in the sign side storage unit 60.
- the sign unit 64 may generate, as the sign data 68, a value obtained by statistically processing a result of comparing a plurality of measurement information 56 and a predetermined threshold value.
- the sign unit 64 accumulates the generated sign data 68 in the sign side storage unit 60.
- the sign unit 64 outputs the accumulated sign data 68 in response to a request from the maintenance device 16.
- the sign unit 64 generates the sign data 68 based on the result of comparing at least one of the drive voltage value, the drive current value, the tube voltage value, the tube current value, and the detection value included in the measurement information 56 with a threshold value. You can do it.
- the sign side storage unit 60 includes a ROM, a RAM, a main storage device such as an HDD, and an auxiliary storage device.
- the sign side storage unit 60 stores the sign program 66 executed by the sign side processing unit 58, the sign data 68 generated by the execution of the sign program 66, and the like.
- the predictor program 66 may be provided by being stored in a computer-readable storage medium such as a CD-ROM or DVD-ROM, or may be provided via a network such as the Internet.
- the maintenance device 16 includes a maintenance-side processing unit 70, a maintenance-side storage unit 72, and a display unit 73.
- the maintenance-side processing unit 70 is responsible for overall control of the maintenance device 16.
- the maintenance processing unit 70 may be a hardware processor such as a CPU and a GPU.
- the maintenance-side processing unit 70 reads the program stored in the maintenance-side storage unit 72 and develops the read program in the maintenance-side storage unit 72, thereby executing various arithmetic processes.
- the maintenance processing unit 70 reads the maintenance program 76 and functions as the diagnosis unit 74.
- Part or all of the diagnosis unit 74 may be configured by hardware such as a circuit including an ASIC or FPGA.
- the diagnosis unit 74 acquires the sign data 68 output from the sign data server 14 and diagnoses an abnormality of the X-ray thickness measuring apparatus 12 based on the sign data 68.
- the diagnosis unit 74 generates information indicating a warning, for example, an image indicating the warning, and causes the display unit 73 to display the information.
- the maintenance-side storage unit 72 includes a ROM, a RAM, a main storage device such as an HDD, and an auxiliary storage device.
- the maintenance side storage unit 72 stores a maintenance program 76 and the like executed by the maintenance side processing unit 70.
- the maintenance program 76 may be provided by being stored in a computer-readable storage medium such as a CD-ROM or DVD-ROM, or may be provided via a network such as the Internet.
- 3A, 3B, 3C, 3D, and 3E are graphs showing examples of the values TV, TC, Ep, Ip, and Dv of the measurement information 56, respectively.
- the horizontal axis of each graph in FIGS. 3A, 3B, 3C, 3D, and 3E indicates time.
- the graph of FIG. 3A shows the tube voltage value TV.
- the graph of FIG. 3B shows the tube current value TC.
- the graph of FIG. 3C shows the drive voltage value Ep.
- the graph of FIG. 3D shows the drive current value Ip.
- the graph of FIG. 3E shows the detection value Dv.
- 3A, 3B, 3C, 3D, and 3E are values when the drive voltage value Ep is controlled to maintain the tube voltage value TV at 100 kV. is there.
- the acquisition unit 62 acquires the values TV, TC, Ep, Ip, and Dv shown in FIGS. 3A, 3B, 3C, 3D, and 3E output from the control device 24 from the network 18, and sends them to the predictor 64. Output.
- the predictor 64 acquires each value TV, TC, Ep, Ip, Dv, the threshold value set in advance in association with each value TV, TC, Ep, Ip, Dv and each value TV, TC, Ep, Ip , Dv, and predictive data 68 are generated.
- the sign unit 64 determines, for example, whether or not the tube voltage value TV is equal to or higher than the first threshold Th1 + a or equal to or lower than the second threshold Th1-a. For example, when the tube voltage value TV is equal to or greater than the first threshold Th1 + a or equal to or less than the second threshold Th1-a, the predictor 64 increments the tube voltage abnormal value by one.
- the sign unit 64 determines, for example, whether or not the tube current value TC is greater than or equal to the third threshold Th2 + b or less than or equal to the fourth threshold Th2-b. For example, when the tube current value TC is equal to or greater than the third threshold Th2 + b or equal to or less than the fourth threshold Th2-b, the predictor 64 increments the tube current abnormal value by one. For example, in the example shown in FIGS. 3A, 3B, 3C, 3D, and 3E, the predictor 64 has the tube current value TC in the region surrounded by the broken line equal to or greater than the third threshold Th2 + b or the fourth threshold Th2- Since it is 7 times below b, the tube current abnormal value is incremented by 7.
- the predictor 64 determines whether or not the drive voltage value Ep is not less than the fifth threshold Th3 + c or not more than the sixth threshold Th3-c. For example, if the drive voltage value Ep is not less than the fifth threshold Th3 + c or not more than the sixth threshold Th3-c, the predictor 64 increments the drive voltage abnormal value by one.
- the predictor 64 determines whether or not the drive current value Ip is equal to or greater than the seventh threshold Th4 + d or equal to or less than the eighth threshold Th4-d. For example, if the drive current value Ip is not less than the seventh threshold Th4 + d or not more than the eighth threshold Th4-d, the predictor 64 increments the drive current abnormal value by one.
- the predictor 64 determines whether or not the detection value Dv is equal to or greater than the ninth threshold Th5 + e or equal to or less than the tenth threshold Th5-e. For example, when the detected value Dv is equal to or greater than the ninth threshold Th5 + e or equal to or smaller than the tenth threshold Th5-e, the predictor 64 increments the detected abnormal value by one.
- the sign unit 64 generates predictive data 68 including an abnormal tube voltage value, an abnormal tube current value, an abnormal drive voltage value, an abnormal drive current value, and a detected abnormal value.
- the initial values of the tube voltage abnormal value, the tube current abnormal value, the drive voltage abnormal value, the drive current abnormal value, and the detected abnormal value may be zero. Therefore, if the values TV, TC, Ep, Ip, and Dv are within the corresponding threshold ranges, the abnormal value corresponding to the values TV, TC, Ep, Ip, and Dv is zero.
- the above threshold value is an example, and the threshold value may be changed according to the tube voltage value TV, for example. In this case, the threshold value may be stored in the sign side storage unit 60 in association with the tube voltage TV.
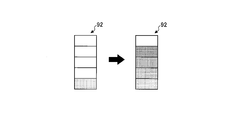
- FIG. 4 is a diagram illustrating an example of a warning image 92 output from the maintenance device 16.
- the diagnosis unit 74 of the maintenance device 16 may display the warning image 92 on the display unit 73 based on the predictive data 68 acquired from the predictive data server 14.
- the diagnosis unit 74 diagnoses the abnormal level based on the abnormal tube voltage value, the abnormal tube current value, the abnormal drive voltage value, the abnormal drive current value, and the detected abnormal value included in the predictive data 68.
- the diagnosis unit 74 may set the number of abnormal values other than 0 among the abnormal tube voltage value, the abnormal tube current value, the abnormal drive voltage value, the abnormal drive current value, and the detected abnormal value as an abnormal level. In this case, the diagnosis unit 74 sets an abnormal level in a range from 0 level to 5 level.
- the diagnosis unit 74 may set an abnormality level based on a predetermined abnormality determination threshold. In this case, the diagnosis unit 74 sets the number of abnormal values equal to or higher than the abnormality determination threshold among the abnormal tube voltage value, abnormal tube current value, abnormal drive voltage value, abnormal drive current value, and detected abnormal value as an abnormal level. May be set.
- the diagnosis unit 74 may generate a warning image 92 according to the abnormal level. For example, when the abnormal level is 1, the diagnosis unit 74 may generate a warning image 92 in which the bottom square is colored among the five squares arranged as shown on the left side of FIG. When the abnormal level is 4, the diagnosis unit 74 may generate a warning image 92 in which the four squares from the bottom are colored out of the five squares arranged. The diagnosis unit 74 may change the color for each square. The diagnosis unit 74 may cause the display unit 73 to display a warning image 92 generated according to the abnormality level.
- FIG. 5 is a flowchart of the measurement process executed by the control-side processing unit 46 of the X-ray thickness measurement apparatus 12.
- the control processing unit 46 executes the measurement process by reading the measurement program 54.
- the reception unit 50 of the control side processing unit 46 acquires the tube voltage value TV and the tube current value TC from the tube detection unit 44 and outputs them to the calculation unit 52 (S102). .
- the receiving unit 50 acquires the drive voltage value Ep and the drive current value Ip from the drive detection unit 42 and outputs them to the calculation unit 52 (S104).
- the receiving unit 50 compares the tube voltage value TV with the set voltage value and controls the drive voltage value Ep (S106). For example, if the tube voltage value TV is lower than the set voltage value, the receiving unit 50 outputs a power supply control signal indicating a voltage value higher than the acquired drive voltage value Ep to the X-ray control power supply 22, and the tube voltage value TV.
- a power supply control signal indicating a voltage value lower than the acquired drive voltage value Ep is output to the X-ray control power supply 22.
- the X-ray control power supply 22 changes the drive voltage value Ep to the voltage value indicated by the acquired power supply control signal, and supplies power to the X-ray generator 30.
- the reception unit 50 acquires the detection value Dv from the output detection unit 34 and outputs it to the calculation unit 52 (S108).
- the calculation unit 52 calculates the thickness of the measurement target 90 based on the detection value Dv (S110).
- the calculation unit 52 outputs measurement information 56 including the drive voltage value Ep, the drive current value Ip, the tube voltage value TV, the tube current value TC, and the detection value Dv to the network 18 (S112). Thereafter, the control-side processing unit 46 repeats step S102 and subsequent steps.
- FIG. 6 is a flowchart of the sign process executed by the sign side processing unit 58 of the sign data server 14.
- the sign side processing unit 58 executes the sign process by reading the sign program 66.
- the acquisition unit 62 acquires the measurement information 56 from the network 18 and outputs the measurement information 56 to the sign unit 64 (S132).
- the sign unit 64 generates the sign data 68 (S134).
- the predictor 64 compares, for example, each value TV, TC, Ep, Ip, Dv included in the measurement information 56 with a threshold value to determine whether each value TV, TC, Ep, Ip, Dv is an abnormal value.
- the prediction data 68 including the number of abnormal values is generated.
- the sign unit 64 stores the generated sign data 68 in the sign side storage unit 60 (S136).
- the sign unit 64 determines whether a request for the sign data 68 has been acquired (S138).
- step S132 When the sign unit 64 determines that the request for the sign data 68 has not been acquired (S138: No), the sign side processing unit 58 repeats step S132 and subsequent steps.
- the predictor 64 determines that the request for the predictor data 68 has been acquired (S138: Yes)
- the predictor 64 outputs the predictor data 68 to the network 18 (S140). After this, the sign side processing unit 58 repeats step S132 and subsequent steps.
- FIG. 7 is a flowchart of maintenance processing executed by the maintenance-side processing unit 70 of the maintenance device 16.
- the maintenance processing unit 70 executes the maintenance process by reading the maintenance program 76.
- the diagnosis unit 74 outputs a request for the predictive data 68 to the network 18 (S152).
- the diagnosis unit 74 determines whether or not the predictive data 68 has been acquired (S154).
- the diagnosis unit 74 is in a standby state until the sign data 68 is acquired (S154: No).
- the diagnosis unit 74 diagnoses an abnormality of the X-ray thickness measurement apparatus 12 based on the number of abnormal values included in the sign data 68 and calculates an abnormality level ( S156).
- the diagnosis unit 74 outputs a warning corresponding to the calculated abnormality level, for example, a warning image 92 to the display unit 73 (S158).
- the maintenance-side processing unit 70 repeats step S152 and subsequent steps.
- the predictive data server 14 can generate and store the predictive data 68 for diagnosing an abnormality such as a failure of the X-ray thickness measuring apparatus 12. As a result, the predictive data server 14 can diagnose the abnormality of the X-ray thickness measuring device 12 and reduce the processing load of the control device 24 of the X-ray thickness measuring device 12 and the storage capacity necessary for the diagnosis.
- the sign data server 14 provides the accumulated sign data 68 to the maintenance device 16 in response to a request from the maintenance device 16. Thereby, the predictive data server 14 can realize diagnosis of abnormality of the X-ray thickness measuring device 12 in the maintenance device 16.
- the sign unit 64 of the second embodiment generates the sign data 68 based on the result of comparing the standard deviation of each value TV, TC, Ep, Ip, and Dv with a threshold value.
- 8A, 8B, 8C, 8, 8D, and 8E are graphs of standard deviations of the values TV, TC, Ep, Ip, and Dv included in the measurement information 56, respectively.
- the graph of FIG. 8A shows the standard deviation of the tube voltage value TV.
- the graph of FIG. 8B shows the standard deviation of the tube current value TC.
- the graph of FIG. 8C shows the standard deviation of the drive voltage value Ep.
- FIGS. 8A, 8B, 8C, 8D, and 8E show the standard deviation of the drive current value Ip.
- the graph of FIG. 8E shows the standard deviation of the detected value Dv.
- the standard deviation of each value TV, TC, Ep, Ip, and Dv in FIGS. 8A, 8B, 8C, 8D, and 8E is when the drive voltage value Ep is controlled to maintain the tube voltage value TV at 100 kV. Is the value of
- the acquisition unit 62 acquires the values TV, TC, Ep, Ip, and Dv shown in FIGS. 8A, 8B, 8C, 8D, and 8E output from the control device 24 from the network 18 and sends them to the sign unit 64. Output.
- the predictor 64 acquires each value TV, TC, Ep, Ip, and Dv, it calculates a standard deviation of each value TV, TC, Ep, Ip, and Dv.
- the sign unit 64 generates the sign data 68 based on a result of comparing a standard threshold with a preset threshold value associated with the standard deviation.
- the predictor 64 compares the threshold with the standard deviation of at least one of the drive voltage value Ep, the drive current value Ip, the tube voltage value TV, the tube current value TC, and the detection value Dv included in the measurement information 56. Based on the above, the predictive data 68 may be generated.
- the predictor 64 determines whether or not the standard deviation of the tube voltage value TV is equal to or greater than the first threshold Th1 + a or equal to or less than the second threshold Th1-a. For example, if the standard deviation of the tube voltage value TV is not less than the first threshold Th1 + a or not more than the second threshold Th1-a, the predictor 64 increments the tube voltage abnormal value by 1.
- the predictor 64 determines whether or not the standard deviation of the tube current value TC is equal to or greater than the third threshold Th2 + b or equal to or less than the fourth threshold Th2-b. For example, if the standard deviation of the tube current value TC is not less than the third threshold Th2 + b or not more than the fourth threshold Th2-b, the predictor 64 increments the tube current abnormal value by one. For example, in the example shown in FIGS.
- the predictor 64 has a standard deviation of the tube current value TC in the region surrounded by the broken line equal to or greater than the third threshold Th2 + b, or the fourth Since it is twice below the threshold value Th2-b, the tube current abnormal value is incremented by 2.
- the predictor 64 determines whether or not the standard deviation of the drive voltage value Ep is equal to or greater than the fifth threshold Th3 + c or equal to or less than the sixth threshold Th3-c. For example, if the standard deviation of the drive voltage value Ep is not less than the fifth threshold Th3 + c or not more than the sixth threshold Th3-c, the predictor 64 increments the drive voltage abnormal value by one.
- the predictor 64 determines whether or not the standard deviation of the drive current value Ip is greater than or equal to the seventh threshold Th4 + d or less than or equal to the eighth threshold Th4-d. For example, if the standard deviation of the drive current value Ip is greater than or equal to the seventh threshold Th4 + d or less than or equal to the eighth threshold Th4-d, the predictor 64 increments the drive current abnormal value by one.
- the predictor 64 determines whether or not the standard deviation of the detection value Dv is greater than or equal to the ninth threshold Th5 + e or less than or equal to the tenth threshold Th5-e. For example, if the standard deviation of the detection value Dv is equal to or larger than the ninth threshold Th5 + e or equal to or smaller than the tenth threshold Th5-e, the predictor 64 increments the detected abnormal value by one.
- the sign unit 64 generates predictive data 68 including an abnormal tube voltage value, an abnormal tube current value, an abnormal drive voltage value, an abnormal drive current value, and a detected abnormal value.
- the initial values of the tube voltage abnormal value, the tube current abnormal value, the drive voltage abnormal value, the drive current abnormal value, and the detected abnormal value may be zero. Therefore, if the standard deviation of the values TV, TC, Ep, Ip, and Dv is within the corresponding threshold range, the abnormal value corresponding to the standard deviation of the values TV, TC, Ep, Ip, and Dv is 0.
- the predictive data server 14 of the second embodiment generates the predictive data 68 based on the standard deviations of the values TV, TC, Ep, Ip, and Dv included in the measurement information 56.
- the sign data server 14 can generate the sign data 68 that can reduce misdiagnosis of the abnormality of the X-ray thickness measurement device 12 based on the short time error of the measurement information 56 and is necessary for storing the sign data 68.
- the storage capacity can be reduced.
- the sign unit 64 of the third embodiment generates the sign data 68 based on the result of comparison between the threshold value and the product of the variance of the detected value Dv and the kurtosis.
- the sign unit 64 calculates the product of the variance and the kurtosis of the detection value Dv included in the measurement information 56.
- the sign unit 64 may generate the sign data 68 based on the result of comparing the product of the calculated variance and kurtosis and a threshold value.
- FIG. 9 is a graph of the product of the variance of the detected value Dv included in the measurement information 56 and the kurtosis.
- the statistical error with respect to the thickness of the measuring object 90 has a Poisson distribution. Using this statistical error, the nature of the noise is detected.
- the statistical error follows a Poisson distribution, the variance and the kurtosis can be expressed by the following equation using the average value m.
- the product of the variance and the kurtosis of the detected value Dv according to the Poisson distribution is a constant value (that is, 1) regardless of the average value m. Accordingly, the product of the variance of the detected value Dv and the kurtosis is approximately 1 if there is no abnormality in the filament 38 or the like.
- the predictor 64 can detect an abnormality in the filament 38 and the like by comparing the product of the dispersion of the detection value Dv and the kurtosis and the predetermined threshold Th6.
- the sign unit 64 may generate the sign data 68 by incrementing the detected abnormal value by 1 when the product of the variance of the detected value Dv and the kurtosis is equal to or greater than the threshold Th6.
- the sign data server 14 generates the sign data 68 based on the product of the variance of the detected value Dv included in the measurement information 56 and the kurtosis. Thereby, the sign data server 14 can generate the sign data 68 that can reduce misdiagnosis of the abnormality of the X-ray thickness measurement device 12 based on the short time error of the measurement information 56 and is necessary for storing the sign data 68. The storage capacity can be reduced.
- diagnosis unit 74 is provided in the maintenance device 16 different from the sign data server 14 .
- diagnosis unit 74 may be provided in the sign data server 14.
Landscapes
- Physics & Mathematics (AREA)
- General Physics & Mathematics (AREA)
- Health & Medical Sciences (AREA)
- Life Sciences & Earth Sciences (AREA)
- Chemical & Material Sciences (AREA)
- Analytical Chemistry (AREA)
- Biochemistry (AREA)
- General Health & Medical Sciences (AREA)
- Immunology (AREA)
- Pathology (AREA)
- Electromagnetism (AREA)
- Length-Measuring Devices Using Wave Or Particle Radiation (AREA)
Abstract
X線発生器(30)は、電源(22)からの電力が供給されるフィラメント(38)を有しX線を照射する。出力検出部(34)は、測定対象の厚みを算出するための検出値を出力する。予兆データサーバ(14)は、取得部(62)と、予兆部(64)とを備える。取得部(62)は、電源(22)が供給する電圧の値を示すドライブ電圧値、電源(22)が供給する電流の値を示すドライブ電流値、フィラメント(38)に供給される電圧の値を示す管電圧値、フィラメント(38)に供給される電流の値を示す管電流値、及び、検出値の少なくともいずれかを含む測定情報を複数回取得する。予兆部(64)は、X線厚み測定装置(12)の異常を診断するための予兆データを、取得部(62)が取得した測定情報に基づいて生成して記憶部(48)に蓄積し要求に応じて出力する。
Description
実施形態は、予兆データサーバ及びX線厚み測定システムに関する。
例えば鋼板等の板状の製品(以下、測定対象)の製造ライン等において、X線を用いて測定対象の厚みを測定するX線厚み測定装置が用いられている。
しかしながら、上述のX線厚み測定装置の異常を診断するためのデータを生成する装置が知られていない。
上述した課題を解決し、実施形態の予兆データサーバは、X線厚み測定装置と接続されている。X線厚み測定装置は、電源と、X線発生器と、出力検出部と、を備える。電源は、電力を供給する。X線発生器は、前記電源からの前記電力が供給されるフィラメントを有しX線を照射する。出力検出部は、厚みを測定する対象である測定対象を通過した前記X線の強度に応じた、前記測定対象の厚みを算出するための検出値を出力する。予兆データサーバは、取得部と、予兆部と、を備える。取得部は、前記電源が供給する電圧の値を示すドライブ電圧値、前記電源が供給する電流の値を示すドライブ電流値、前記フィラメントに供給される電圧の値を示す管電圧値、前記フィラメントに供給される電流の値を示す管電流値、及び、前記検出値の少なくともいずれかを含む測定情報を複数回取得する。予兆部は、前記X線厚み測定装置の異常を診断するための予兆データを、前記取得部が取得した前記測定情報に基づいて生成して記憶部に蓄積し要求に応じて出力する。
以下の例示的な実施形態や変形例には、同様の構成要素が含まれている。よって、以下では、同様の構成要素には共通の符号が付されるとともに、重複する説明が部分的に省略される。実施形態や変形例に含まれる部分は、他の実施形態や変形例の対応する部分と置き換えて構成されることができる。また、実施形態や変形例に含まれる部分の構成や位置等は、特に言及しない限りは、他の実施形態や変形例と同様である。
<第1実施形態>
図1は、実施形態のX線厚み測定システム10の全体構成を示す概略図である。X線厚み測定システム10は、X線厚み測定装置12によって測定対象90の厚みを測定するとともに、X線厚み測定装置12の異常の診断に必要な予兆データを生成して蓄積し、X線厚み測定装置12の異常を診断する。
図1は、実施形態のX線厚み測定システム10の全体構成を示す概略図である。X線厚み測定システム10は、X線厚み測定装置12によって測定対象90の厚みを測定するとともに、X線厚み測定装置12の異常の診断に必要な予兆データを生成して蓄積し、X線厚み測定装置12の異常を診断する。
図1に示すように、実施形態のX線厚み測定システム10は、X線厚み測定装置12と、予兆データサーバ14と、メンテナンス装置16と、ネットワーク18とを備える。ネットワーク18は、X線厚み測定装置12と、予兆データサーバ14と、メンテナンス装置16とを互いに情報を送受信可能に接続するLAN(Local Area Network)等であってよい。
X線厚み測定装置12は、厚み測定の対象である測定対象90にX線を照射して、測定対象90を通過したX線の量によって、測定対象90の厚みを測定する。X線厚み測定装置12は、測定部20と、X線制御電源22と、制御装置24とを備える。
測定部20は、測定対象90にX線を照射して、測定対象90の厚みを算出するための検出電圧または検出電流の少なくともいずれかを検出値として、制御装置24へ出力する。測定部20は、保持部26と、変圧器28と、X線発生器30と、検出器32と、出力検出部34と、ドライブ検出部42と、管検出部44とを有する。
保持部26は、変圧器28と、X線発生器30と、検出器32と、出力検出部34とを保持する。
変圧器28は、X線制御電源22が出力した電力を変圧(例えば、昇圧)して、後述するX線発生器30のフィラメント38に供給する。
X線発生器30は、X線制御電源22から供給される電力によって、X線を発生させて、測定対象90に照射する。X線発生器30は、X線管36と、フィラメント38と、ターゲット40とを有する。X線管36は、例えば、内部を真空状態に維持する密閉された管である。X線管36は、フィラメント38及びターゲット40を内部に収容して保持する。フィラメント38は、変圧器28を介して、X線制御電源22から供給された電力によって、電子をターゲット40へ放出する。ターゲット40は、フィラメント38が放出した電子の衝突によって、X線を測定対象90へと照射する。
検出器32は、測定対象90を挟んでX線発生器30と対向する位置に配置されている。検出器32は、X線発生器30が照射し、測定対象90を通過したX線の強度に応じた検出電圧及び検出電流の少なくともいずれかの値を検出信号として出力検出部34へ出力する。検出器32は、例えば、入射したX線に応じた検出電圧及び検出電流を出力する電離箱であってよい。
出力検出部34は、検出器32が出力した検出信号を変換処理して制御装置24へ出力する。例えば、出力検出部34は、AD変換器等を有し、アナログ信号の検出信号をデジタル変換した値を、測定対象90の厚みを算出するための検出値として出力してよい。
X線制御電源22は、電源の一例であって、制御装置24からの電源制御信号に基づいて、変圧器28を介してX線発生器30のフィラメント38に供給される電力を供給する。X線制御電源22は、例えば、商用電源等の外部電源に接続されていてよい。
ドライブ検出部42は、ドライブ電圧値及びドライブ電流値を検出する。ドライブ電圧値は、変圧器28の一次側の電圧の値であって、X線制御電源22が供給する電力の電圧の値である。ドライブ電流値は、変圧器28の一次側に流れる電流の値であって、X線制御電源22が供給する電力の電流の値である。ドライブ検出部42は、検知したドライブ電圧値及びドライブ電流値を制御装置24へ出力する。
管検出部44は、管電圧値及び管電流値を検出する。管電圧値は、変圧器28の二次側の電圧の値であって、フィラメント38に供給される電力の電圧の値である。管電流値は、X線発生器30の二次側を流れる電流の値であって、フィラメント38に供給される電力の電流の値である。管検出部44は、検知した管電圧値及び管電流値を制御装置24へ出力する。
制御装置24は、X線厚み測定装置12の制御全般を司る。制御装置24は、X線厚み測定装置12によって測定対象90の厚みを測定するオペレータ等が使用するコンピュータであってよい。制御装置24は、出力検出部34から取得した検出値に基づいて、測定対象90の厚みを算出する。制御装置24は、X線発生器30に供給する電力の管電圧値に応じたドライブ電圧値を指示する電源制御信号をX線制御電源22に出力する。制御装置24は、管検出部44から取得した管電圧値に基づいて設定したドライブ電圧値を指示する電源制御信号を生成してよい。制御装置24は、出力検出部34、ドライブ検出部42及び管検出部44から取得した検出値、ドライブ電圧値、ドライブ電流値、管電圧値及び管電流値を含む測定情報56をネットワーク18へ出力する。制御装置24は、例えば、ブロードキャストによって測定情報56を出力してよい。
予兆データサーバ14は、制御装置24から測定情報56を複数回繰り返し取得して、複数の測定情報56から生成したX線厚み測定装置12の異常の予兆を示すデータ(以下、予兆データ)を記憶して蓄積する。予兆データサーバ14は、予兆データをメンテナンス装置16からの要求に応じて出力する。
メンテナンス装置16は、例えば、X線厚み測定装置12をメンテナンスするメンテナンス担当者等が使用するコンピュータである。メンテナンス装置16は、予兆データサーバ14から取得した予兆データに基づいて、X線厚み測定装置12の異常を診断し、診断した結果を画像等によって出力する。
図2は、X線厚み測定システム10の制御系の構成を示すブロック図である。図2に示すように、制御装置24は、制御側処理部46と、制御側記憶部48とを有する。
制御側処理部46は、X線厚み測定装置12の制御全般を司る。制御側処理部46は、演算処理等を実行するCPU(Central Processing Unit)及びGPU(Graphics Processing Unit)等のハードウェアプロセッサであってよい。制御側処理部46は、制御側記憶部48に格納されたプログラムを読み込み、読み込んだプログラムを制御側記憶部48に展開することで、種々の演算処理を実行する。制御側処理部46は、例えば、測定プログラム54を読み込み、受付部50及び算出部52として機能する。尚、受付部50及び算出部52の一部または全部は、ASIC(Application Specific Integrated Circuit)またはFPGA(Field-Programmable Gate Array)を含む回路等のハードウェアによって構成されてもよい。
受付部50は、測定情報56を受け付けて、算出部52へ出力する。受付部50は、例えば、出力検出部34から検出値、ドライブ検出部42からドライブ電圧値及びドライブ電流値、及び、管検出部44から管電圧値及び管電流値を測定情報56として受け付ける。
算出部52は、受付部50から測定情報56を取得すると、当該測定情報56に基づいて、測定対象90の厚みを算出するとともに、X線厚み測定装置12を制御する。例えば、算出部52は、検出値に基づいて、測定対象90の厚みを算出する。算出部52は、管電圧値及び管電流値が予め設定された設定電圧値になるように、X線制御電源22にドライブ電圧値を指示する電源制御信号を生成して出力する。算出部52は、ブロードキャストで、測定情報56をネットワーク18へ出力してよい。
制御側記憶部48は、ROM(Read Only Memory)と、RAM(Random Access Memory)と、HDD(Hard Disk Drive)等の主記憶装置及び補助記憶装置を有する。制御側記憶部48は、制御側処理部46が実行する測定プログラム54、及び、測定プログラム54を実行するために取得した測定情報56等を記憶する。測定プログラム54は、CD-ROM(Compact Disc Read Only Memory)またはDVD-ROM(Digital Versatile Disc Read Only Memory)等のコンピュータにより読み取り可能な記憶媒体に記憶されて提供されてもよく、インターネット等のネットワークを介して提供されてもよい。
予兆データサーバ14は、予兆側処理部58と、予兆側記憶部60とを有する。
予兆側処理部58は、予兆データサーバ14の制御全般を司る。予兆側処理部58は、CPU及びGPU等のハードウェアプロセッサであってよい。予兆側処理部58は、予兆側記憶部60に格納されたプログラムを読み込み、読み込んだプログラムを予兆側記憶部60に展開することで、種々の演算処理を実行する。予兆側処理部58は、例えば、予兆プログラム66を読み込み、取得部62及び予兆部64として機能する。取得部62及び予兆部64の一部または全部は、ASICまたはFPGAを含む回路等のハードウェアによって構成されてもよい。
取得部62は、ネットワーク18上に流れるドライブ電圧値、ドライブ電流値、管電圧値、管電流値及び検出値を含む測定情報56を複数回取得して、予兆部64へ出力する。
予兆部64は、ネットワーク18から取得した複数の測定情報56に基づいて、X線厚み測定装置12の異常を診断するための予兆データ68を生成して、予兆側記憶部60に蓄積する。予兆部64は、例えば、複数の測定情報56と予め定められた閾値とを比較した結果を統計的に処理した値を予兆データ68として生成してよい。予兆部64は、生成した予兆データ68を予兆側記憶部60に蓄積する。予兆部64は、蓄積した予兆データ68をメンテナンス装置16からの要求に応じて出力する。尚、予兆部64は、測定情報56に含まれるドライブ電圧値、ドライブ電流値、管電圧値、管電流値及び検出値の少なくともいずれかと閾値とを比較した結果に基づいて、予兆データ68を生成してよい。
予兆側記憶部60は、ROMと、RAMと、HDD等の主記憶装置及び補助記憶装置を有する。予兆側記憶部60は、予兆側処理部58が実行する予兆プログラム66、及び、予兆プログラム66の実行によって生成された予兆データ68等を記憶する。予兆プログラム66は、CD-ROMまたはDVD-ROM等のコンピュータにより読み取り可能な記憶媒体に記憶されて提供されてもよく、インターネット等のネットワークを介して提供されてもよい。
メンテナンス装置16は、メンテナンス側処理部70と、メンテナンス側記憶部72と、表示部73とを有する。
メンテナンス側処理部70は、メンテナンス装置16の制御全般を司る。メンテナンス側処理部70は、CPU及びGPU等のハードウェアプロセッサであってよい。メンテナンス側処理部70は、メンテナンス側記憶部72に格納されたプログラムを読み込み、読み込んだプログラムをメンテナンス側記憶部72に展開することで、種々の演算処理を実行する。メンテナンス側処理部70は、例えば、メンテナンスプログラム76を読み込み、診断部74として機能する。診断部74の一部または全部は、ASICまたはFPGAを含む回路等のハードウェアによって構成されてもよい。
診断部74は、予兆データサーバ14が出力した予兆データ68を取得して、予兆データ68に基づいて、X線厚み測定装置12の異常を診断する。診断部74は、X線厚み測定装置12の異常の場合、警告を示す情報、例えば、警告を示す画像を生成し、表示部73に表示させる。
メンテナンス側記憶部72は、ROMと、RAMと、HDD等の主記憶装置及び補助記憶装置を有する。メンテナンス側記憶部72は、メンテナンス側処理部70が実行するメンテナンスプログラム76等を記憶する。メンテナンスプログラム76は、CD-ROMまたはDVD-ROM等のコンピュータにより読み取り可能な記憶媒体に記憶されて提供されてもよく、インターネット等のネットワークを介して提供されてもよい。
図3A、図3B、図3C、図3D、図3Eは、各々、測定情報56の各値TV、TC、Ep、Ip、Dvの一例を示すグラフである。図3A、図3B、図3C、図3D、図3Eの各グラフの横軸は、時間を示す。図3Aのグラフは、管電圧値TVを示す。図3Bのグラフは、管電流値TCを示す。図3Cのグラフは、ドライブ電圧値Epを示す。図3Dのグラフは、ドライブ電流値Ipを示す。図3Eのグラフは、検出値Dvを示す。図3A、図3B、図3C、図3D、図3Eの各値TV、TC、Ep、Ip、Dvは、管電圧値TVを100kVに維持するためにドライブ電圧値Epを制御した場合の値である。取得部62は、制御装置24が出力した図3A、図3B、図3C、図3D、図3Eに示す各値TV、TC、Ep、Ip、Dvをネットワーク18から取得して、予兆部64へ出力する。予兆部64は、各値TV、TC、Ep、Ip、Dvを取得すると、各値TV、TC、Ep、Ip、Dvに対応付けて予め設定された閾値と各値TV、TC、Ep、Ip、Dvとを比較して、予兆データ68を生成する。
予兆部64は、例えば、管電圧値TVが第1閾値Th1+a以上、または、第2閾値Th1-a以下か否かを判定する。予兆部64は、例えば、管電圧値TVが第1閾値Th1+a以上、または、第2閾値Th1-a以下であれば、管電圧異常値を1インクリメントする。
予兆部64は、例えば、管電流値TCが第3閾値Th2+b以上、または、第4閾値Th2-b以下か否かを判定する。予兆部64は、例えば、管電流値TCが第3閾値Th2+b以上、または、第4閾値Th2-b以下であれば、管電流異常値を1インクリメントする。例えば、図3A、図3B、図3C、図3D、図3Eに示す例では、予兆部64は、破線で囲む領域内の管電流値TCが第3閾値Th2+b以上、または、第4閾値Th2-b以下に7回なっているので、管電流異常値を7インクリメントする。
予兆部64は、例えば、ドライブ電圧値Epが第5閾値Th3+c以上、または、第6閾値Th3-c以下か否かを判定する。予兆部64は、例えば、ドライブ電圧値Epが第5閾値Th3+c以上、または、第6閾値Th3-c以下であれば、ドライブ電圧異常値を1インクリメントする。
予兆部64は、例えば、ドライブ電流値Ipが第7閾値Th4+d以上、または、第8閾値Th4-d以下か否かを判定する。予兆部64は、例えば、ドライブ電流値Ipが第7閾値Th4+d以上、または、第8閾値Th4-d以下であれば、ドライブ電流異常値を1インクリメントする。
予兆部64は、例えば、検出値Dvが第9閾値Th5+e以上、または、第10閾値Th5-e以下か否かを判定する。予兆部64は、例えば、検出値Dvが第9閾値Th5+e以上、または、第10閾値Th5-e以下であれば、検出異常値を1インクリメントする。
予兆部64は、管電圧異常値、管電流異常値、ドライブ電圧異常値、ドライブ電流異常値、及び、検出異常値を含む予兆データ68を生成する。尚、管電圧異常値、管電流異常値、ドライブ電圧異常値、ドライブ電流異常値、及び、検出異常値の各初期値は、0であってよい。従って、値TV、TC、Ep、Ip、Dvが対応する閾値範囲内であれば、値TV、TC、Ep、Ip、Dvに対応する異常値は0である。上述の閾値は、一例であって、例えば、管電圧値TVに応じて、閾値を変化させてもよい。この場合、閾値は管電圧TVに対応付けて予兆側記憶部60に格納されていてよい。
図4は、メンテナンス装置16が出力する警告画像92の一例を示す図である。メンテナンス装置16の診断部74は、予兆データサーバ14から取得した予兆データ68に基づいて、表示部73に警告画像92を表示させてよい。診断部74は、予兆データ68に含まれる管電圧異常値、管電流異常値、ドライブ電圧異常値、ドライブ電流異常値、及び、検出異常値に基づいて、異常レベルを診断する。例えば、診断部74は、管電圧異常値、管電流異常値、ドライブ電圧異常値、ドライブ電流異常値、及び、検出異常値のうち、0でない異常値の個数を異常レベルとしてよい。この場合、診断部74は、0レベルから5レベルまでの範囲で異常レベルを設定する。尚、診断部74は、予め定められた異常判定用閾値に基づいて、異常レベルを設定してもよい。この場合、診断部74は、管電圧異常値、管電流異常値、ドライブ電圧異常値、ドライブ電流異常値、及び、検出異常値のうち、異常判定用閾値以上の異常値の個数を異常レベルとして設定してよい。
診断部74は、異常レベルに応じて、警告画像92を生成してよい。例えば、異常レベルが1の場合、診断部74は、図4の左側に示すように、配列された5個の四角のうち、1番下の四角を着色した警告画像92を生成してよい。また、異常レベルが4の場合、診断部74は、配列された5個の四角のうち、1番下から4個の四角を着色した警告画像92を生成してよい。尚、診断部74は、四角毎に色を変化させてよい。診断部74は、異常レベルに応じて生成した警告画像92を表示部73に表示させてよい。
図5は、X線厚み測定装置12の制御側処理部46が実行する測定処理のフローチャートである。制御側処理部46は、測定プログラム54を読み込むことによって、測定処理を実行する。
図5に示すように、測定処理では、制御側処理部46の受付部50は、管電圧値TV及び管電流値TCを管検出部44から取得して、算出部52へ出力する(S102)。受付部50は、ドライブ電圧値Ep及びドライブ電流値Ipをドライブ検出部42から取得して、算出部52へ出力する(S104)。受付部50は、管電圧値TVと設定電圧値とを比較して、ドライブ電圧値Epを制御する(S106)。受付部50は、例えば、管電圧値TVが設定電圧値よりも低ければ、取得したドライブ電圧値Epより高い電圧値を指示する電源制御信号をX線制御電源22に出力し、管電圧値TVが設定電圧値よりも高ければ、取得したドライブ電圧値Epより低い電圧値を指示する電源制御信号をX線制御電源22に出力する。X線制御電源22は、取得した電源制御信号が示す電圧値にドライブ電圧値Epを変化させて、X線発生器30に電力を供給する。
受付部50は、検出値Dvを出力検出部34から取得して、算出部52へ出力する(S108)。算出部52は、検出値Dvに基づいて、測定対象90の厚みを算出する(S110)。算出部52は、ドライブ電圧値Ep、ドライブ電流値Ip、管電圧値TV、管電流値TC及び検出値Dvを含む測定情報56をネットワーク18に出力する(S112)。この後、制御側処理部46は、ステップS102以降を繰り返す。
図6は、予兆データサーバ14の予兆側処理部58が実行する予兆処理のフローチャートである。予兆側処理部58は、予兆プログラム66を読み込むことによって、予兆処理を実行する。
図6に示すように、予兆処理では、取得部62が、測定情報56をネットワーク18から取得して、予兆部64へ出力する(S132)。予兆部64は、予兆データ68を生成する(S134)。予兆部64は、例えば、測定情報56に含まれる各値TV、TC、Ep、Ip、Dvと閾値とを比較して、各値TV、TC、Ep、Ip、Dvが異常値か否かを判定し、異常値の個数を含む予兆データ68を生成する。予兆部64は、生成した予兆データ68を予兆側記憶部60に格納する(S136)。予兆部64は、予兆データ68の要求を取得したか否かを判定する(S138)。予兆部64は、予兆データ68の要求を取得していないと判定すると(S138:No)、予兆側処理部58は、ステップS132以降を繰り返す。予兆部64は、予兆データ68の要求を取得したと判定すると(S138:Yes)、予兆データ68をネットワーク18へ出力する(S140)。この後、予兆側処理部58は、ステップS132以降を繰り返す。
図7は、メンテナンス装置16のメンテナンス側処理部70が実行するメンテナンス処理のフローチャートである。メンテナンス側処理部70は、メンテナンスプログラム76を読み込むことによって、メンテナンス処理を実行する。
図7に示すように、メンテナンス処理では、診断部74が、予兆データ68の要求をネットワーク18へ出力する(S152)。診断部74は、予兆データ68を取得したか否かを判定する(S154)。診断部74は、予兆データ68を取得するまで待機状態となる(S154:No)。診断部74は、予兆データ68を取得すると(S154:Yes)、予兆データ68に含まれる異常値の個数に基づいて、X線厚み測定装置12の異常を診断して、異常レベルを算出する(S156)。診断部74は、算出した異常レベルに対応する警告、例えば、警告画像92を表示部73に出力する(S158)。この後、メンテナンス側処理部70は、ステップS152以降を繰り返す。
上述したように第1実施形態の予兆データサーバ14は、X線厚み測定装置12の故障等の異常を診断するための予兆データ68を生成して蓄積することができる。これにより、予兆データサーバ14は、X線厚み測定装置12の異常の診断を可能にするとともに、X線厚み測定装置12の制御装置24の処理負担及び診断に必要な記憶容量を低減できる。
予兆データサーバ14は、メンテナンス装置16からの要求に応じて、蓄積した予兆データ68をメンテナンス装置16に提供している。これにより、予兆データサーバ14は、メンテナンス装置16におけるX線厚み測定装置12の異常の診断を実現できる。
<第2実施形態>
次に、第1実施形態の予兆データ68の生成方法を変更した第2実施形態について説明する。
次に、第1実施形態の予兆データ68の生成方法を変更した第2実施形態について説明する。
第2実施形態の予兆部64は、各値TV、TC、Ep、Ip、Dvの標準偏差と閾値とを比較した結果に基づいて、予兆データ68を生成する。図8A、図8B、図8C、図8、図8D、図8Eは、各々、測定情報56に含まれる各値TV、TC、Ep、Ip、Dvの標準偏差のグラフである。図8A、図8B、図8C、図8D、図8Eの横軸は時間を示す。図8Aのグラフは、管電圧値TVの標準偏差を示す。図8Bのグラフは、管電流値TCの標準偏差を示す。図8Cのグラフは、ドライブ電圧値Epの標準偏差を示す。図8Dのグラフは、ドライブ電流値Ipの標準偏差を示す。図8Eのグラフは、検出値Dvの標準偏差を示す。図8A、図8B、図8C、図8D、図8Eの各値TV、TC、Ep、Ip、Dvの標準偏差は、管電圧値TVを100kVに維持するためにドライブ電圧値Epを制御した場合の値である。
取得部62は、制御装置24が出力した図8A、図8B、図8C、図8D、図8Eに示す各値TV、TC、Ep、Ip、Dvをネットワーク18から取得して、予兆部64へ出力する。予兆部64は、各値TV、TC、Ep、Ip、Dvを取得すると、各値TV、TC、Ep、Ip、Dvの標準偏差を算出する。予兆部64は、当該標準偏差に対応付けて予め設定された閾値と標準偏差とを比較した結果に基づいて、予兆データ68を生成する。尚、予兆部64は、測定情報56に含まれるドライブ電圧値Ep、ドライブ電流値Ip、管電圧値TV、管電流値TC及び検出値Dvの少なくともいずれかの標準偏差と閾値とを比較した結果に基づいて、予兆データ68を生成してよい。
予兆部64は、例えば、管電圧値TVの標準偏差が第1閾値Th1+a以上、または、第2閾値Th1-a以下か否かを判定する。予兆部64は、例えば、管電圧値TVの標準偏差が第1閾値Th1+a以上、または、第2閾値Th1-a以下であれば、管電圧異常値を1インクリメントする。
予兆部64は、例えば、管電流値TCの標準偏差が第3閾値Th2+b以上、または、第4閾値Th2-b以下か否かを判定する。予兆部64は、例えば、管電流値TCの標準偏差が第3閾値Th2+b以上、または、第4閾値Th2-b以下であれば、管電流異常値を1インクリメントする。例えば、図8A、図8B、図8C、図8D、図8Eに示す例では、予兆部64は、破線で囲む領域内の管電流値TCの標準偏差が第3閾値Th2+b以上、または、第4閾値Th2-b以下に2回なっているので、管電流異常値を2インクリメントする。
予兆部64は、例えば、ドライブ電圧値Epの標準偏差が第5閾値Th3+c以上、または、第6閾値Th3-c以下か否かを判定する。予兆部64は、例えば、ドライブ電圧値Epの標準偏差が第5閾値Th3+c以上、または、第6閾値Th3-c以下であれば、ドライブ電圧異常値を1インクリメントする。
予兆部64は、例えば、ドライブ電流値Ipの標準偏差が第7閾値Th4+d以上、または、第8閾値Th4-d以下か否かを判定する。予兆部64は、例えば、ドライブ電流値Ipの標準偏差が第7閾値Th4+d以上、または、第8閾値Th4-d以下であれば、ドライブ電流異常値を1インクリメントする。
予兆部64は、例えば、検出値Dvの標準偏差が第9閾値Th5+e以上、または、第10閾値Th5-e以下か否かを判定する。予兆部64は、例えば、検出値Dvの標準偏差が第9閾値Th5+e以上、または、第10閾値Th5-e以下であれば、検出異常値を1インクリメントする。
予兆部64は、管電圧異常値、管電流異常値、ドライブ電圧異常値、ドライブ電流異常値、及び、検出異常値を含む予兆データ68を生成する。尚、管電圧異常値、管電流異常値、ドライブ電圧異常値、ドライブ電流異常値、及び、検出異常値の各初期値は、0であってよい。従って、値TV、TC、Ep、Ip、Dvの標準偏差が対応する閾値範囲内であれば、値TV、TC、Ep、Ip、Dvの標準偏差に対応する異常値は0である。
上述したように、第2実施形態の予兆データサーバ14は、測定情報56に含まれる値TV、TC、Ep、Ip、Dvの標準偏差によって予兆データ68を生成している。これにより、予兆データサーバ14は、測定情報56の短時間の誤差に基づく、X線厚み測定装置12の異常の誤診を低減可能な予兆データ68を生成できるとともに、予兆データ68の記憶に必要な記憶容量を低減できる。
<第3実施形態>
次に、上述の実施形態の予兆データ68の生成方法を変更した第3実施形態について説明する。
次に、上述の実施形態の予兆データ68の生成方法を変更した第3実施形態について説明する。
第3実施形態の予兆部64は、検出値Dvの分散と尖度との積と閾値との比較の結果に基づいて、予兆データ68を生成する。予兆部64は、測定情報56に含まれる検出値Dvの分散と尖度との積を算出する。予兆部64は、算出した分散と尖度との積と閾値とを比較した結果に基づいて、予兆データ68を生成してよい。図9は、測定情報56に含まれる検出値Dvの分散と尖度との積のグラフである。
測定対象90の厚みに対する統計誤差は、ポアソン分布になる。この統計的な誤差を利用して、雑音の性質を検出する。統計誤差がポアソン分布に従う場合、分散及び尖度は、平均値mを用いて次の式で表すことができる。
分散=m
尖度=1/m
分散=m
尖度=1/m
従って、ポアソン分布に従う検出値Dvの分散と尖度の積は、平均値mに依存せず一定の値(即ち、1)となる。従って、検出値Dvの分散と尖度の積は、フィラメント38等に異常がなければ、ほぼ1となる。一方、フィラメント38が切れる直前であれば、検出値Dvの分散と尖度の積は、図9に破線の四角で囲む領域で示すように、高い値を示す。従って、予兆部64は、検出値Dvの分散と尖度の積と予め定められた閾値Th6とを比較することにより、フィラメント38等の異常を検出することができる。予兆部64は、検出値Dvの分散と尖度の積が閾値Th6以上となった場合、検出異常値を1インクリメントして予兆データ68を生成してよい。
上述したように、第3実施形態の予兆データサーバ14は、測定情報56に含まれる検出値Dvの分散と尖度との積によって予兆データ68を生成している。これにより、予兆データサーバ14は、測定情報56の短時間の誤差に基づく、X線厚み測定装置12の異常の誤診を低減可能な予兆データ68を生成できるとともに、予兆データ68の記憶に必要な記憶容量を低減できる。
本発明のいくつかの実施形態を説明したが、これらの実施形態は、例として提示したものであり、発明の範囲を限定することは意図していない。これら新規な実施形態は、その他の様々な形態で実施されることが可能であり、発明の要旨を逸脱しない範囲で、種々の省略、置き換え、変更を行うことができる。これら実施形態やその変形は、発明の範囲や要旨に含まれるとともに、請求の範囲に記載された発明とその均等の範囲に含まれる。
上述の実施形態では、予兆データサーバ14とは別のメンテナンス装置16に診断部74を設ける例を挙げて説明したが、診断部74は予兆データサーバ14に設けられていてもよい。
Claims (3)
- 電力を供給する電源と、前記電源からの前記電力が供給されるフィラメントを有しX線を照射するX線発生器と、厚みを測定する対象である測定対象を通過した前記X線の強度に応じた、前記測定対象の厚みを算出するための検出値を出力する出力検出部と、を備えるX線厚み測定装置と接続された予兆データサーバであって、
前記電源が供給する電圧の値を示すドライブ電圧値、前記電源が供給する電流の値を示すドライブ電流値、前記フィラメントに供給される電圧の値を示す管電圧値、前記フィラメントに供給される電流の値を示す管電流値、及び、前記検出値の少なくともいずれかを含む測定情報を複数回取得する取得部と、
前記X線厚み測定装置の異常を診断するための予兆データを、前記取得部が取得した前記測定情報に基づいて生成して記憶部に蓄積し要求に応じて出力する予兆部と、
を備える予兆データサーバ。 - 前記予兆部は、前記測定情報の少なくともいずれか、前記測定情報の少なくともいずれかの標準偏差、及び、前記測定情報の前記検出値の分散と尖度との積と、予め定められた閾値とを比較した結果を含む前記予兆データを前記記憶部に蓄積する
請求項1に記載の予兆データサーバ。 - 請求項1または2に記載の予兆データサーバと、前記X線厚み測定装置と、メンテナンス装置とを備える厚み測定システムであって、
前記予兆部は、前記メンテナンス装置からの要求に応じて前記予兆データを出力し、
前記メンテナンス装置は、前記予兆データに基づいて前記X線厚み測定装置の異常を診断して、診断した結果を出力する
X線厚み測定システム。
Applications Claiming Priority (2)
| Application Number | Priority Date | Filing Date | Title |
|---|---|---|---|
| JP2018105991 | 2018-06-01 | ||
| JP2018-105991 | 2018-06-01 |
Publications (1)
| Publication Number | Publication Date |
|---|---|
| WO2019230010A1 true WO2019230010A1 (ja) | 2019-12-05 |
Family
ID=68698022
Family Applications (2)
| Application Number | Title | Priority Date | Filing Date |
|---|---|---|---|
| PCT/JP2018/032781 Ceased WO2019230010A1 (ja) | 2018-06-01 | 2018-09-04 | 予兆データサーバ及びx線厚み測定システム |
| PCT/JP2019/002138 Ceased WO2019230040A1 (ja) | 2018-06-01 | 2019-01-23 | 予兆データサーバ及びx線厚み測定システム |
Family Applications After (1)
| Application Number | Title | Priority Date | Filing Date |
|---|---|---|---|
| PCT/JP2019/002138 Ceased WO2019230040A1 (ja) | 2018-06-01 | 2019-01-23 | 予兆データサーバ及びx線厚み測定システム |
Country Status (3)
| Country | Link |
|---|---|
| CN (1) | CN111051812B (ja) |
| TW (1) | TWI687647B (ja) |
| WO (2) | WO2019230010A1 (ja) |
Cited By (1)
| Publication number | Priority date | Publication date | Assignee | Title |
|---|---|---|---|---|
| JP6983966B1 (ja) * | 2020-09-16 | 2021-12-17 | 株式会社東芝 | 厚み測定装置 |
Families Citing this family (4)
| Publication number | Priority date | Publication date | Assignee | Title |
|---|---|---|---|---|
| KR102385159B1 (ko) * | 2018-06-01 | 2022-04-12 | 가부시끼가이샤 도시바 | 예조 데이터 서버 및 x선 두께 측정 시스템 |
| TWI752533B (zh) * | 2020-03-10 | 2022-01-11 | 日商東芝股份有限公司 | 維護裝置 |
| DE102020112651A1 (de) | 2020-05-11 | 2021-11-11 | Volume Graphics Gmbh | Computerimplementiertes Verfahren zur Zustandsüberwachung einer Vorrichtung zur Untersuchung von Objekten |
| JP2022094017A (ja) * | 2020-12-14 | 2022-06-24 | トヨタ自動車株式会社 | 車載システム |
Citations (6)
| Publication number | Priority date | Publication date | Assignee | Title |
|---|---|---|---|---|
| JPS4929666A (ja) * | 1972-07-11 | 1974-03-16 | ||
| JPH04201963A (ja) * | 1990-11-30 | 1992-07-22 | Mitsubishi Electric Corp | 昇降機の遠隔監視制御装置 |
| US5418830A (en) * | 1992-05-15 | 1995-05-23 | Scan-Tech S.A. | Radiometric thickness measurement gage |
| JPH0864388A (ja) * | 1994-08-24 | 1996-03-08 | Toshiba Corp | X線高電圧装置 |
| JP2002100498A (ja) * | 2000-09-21 | 2002-04-05 | Shimadzu Corp | X線診断装置 |
| JP2018032561A (ja) * | 2016-08-25 | 2018-03-01 | 株式会社ジョブ | X線装置およびx線装置の制御方法 |
Family Cites Families (10)
| Publication number | Priority date | Publication date | Assignee | Title |
|---|---|---|---|---|
| JPS5958798A (ja) * | 1982-09-28 | 1984-04-04 | Toshiba Corp | X線管の劣化判定装置 |
| US5351203A (en) * | 1992-08-03 | 1994-09-27 | Bethlehem Steel Corporation | Online tomographic gauging of sheet metal |
| CN102564361B (zh) * | 2011-11-18 | 2013-10-23 | 北京金自天正智能控制股份有限公司 | 一种射线式测厚仪及其校正方法 |
| JP2013156137A (ja) * | 2012-01-30 | 2013-08-15 | Toshiba Corp | 厚さ測定装置、厚さ測定方法及び制御プログラム |
| EP2843362A4 (en) * | 2012-04-25 | 2015-12-02 | Nippon Steel & Sumitomo Metal Corp | METHOD AND DEVICE FOR DETERMINING THE FE-ZN ALLOYING PHASE THICKNESS OF A HOTZIN-COATED STEEL PLATE |
| JP6122796B2 (ja) * | 2014-02-24 | 2017-04-26 | 株式会社東芝 | X線厚さ計 |
| JP2016017823A (ja) * | 2014-07-08 | 2016-02-01 | 株式会社日立ハイテクサイエンス | X線分析用試料板及び蛍光x線分析装置 |
| JP6888905B2 (ja) * | 2015-12-10 | 2021-06-18 | 株式会社東芝 | 検出信号におけるa/dコンバータの雑音を低減した厚み計装置 |
| JP2017215173A (ja) * | 2016-05-30 | 2017-12-07 | 株式会社東芝 | 厚さ測定装置 |
| JP6640769B2 (ja) * | 2017-02-22 | 2020-02-05 | 株式会社日立製作所 | 情報処理装置、モビリティデータ収集システム |
-
2018
- 2018-09-04 WO PCT/JP2018/032781 patent/WO2019230010A1/ja not_active Ceased
-
2019
- 2019-01-23 CN CN201980004190.5A patent/CN111051812B/zh active Active
- 2019-01-23 WO PCT/JP2019/002138 patent/WO2019230040A1/ja not_active Ceased
- 2019-03-26 TW TW108110392A patent/TWI687647B/zh active
Patent Citations (6)
| Publication number | Priority date | Publication date | Assignee | Title |
|---|---|---|---|---|
| JPS4929666A (ja) * | 1972-07-11 | 1974-03-16 | ||
| JPH04201963A (ja) * | 1990-11-30 | 1992-07-22 | Mitsubishi Electric Corp | 昇降機の遠隔監視制御装置 |
| US5418830A (en) * | 1992-05-15 | 1995-05-23 | Scan-Tech S.A. | Radiometric thickness measurement gage |
| JPH0864388A (ja) * | 1994-08-24 | 1996-03-08 | Toshiba Corp | X線高電圧装置 |
| JP2002100498A (ja) * | 2000-09-21 | 2002-04-05 | Shimadzu Corp | X線診断装置 |
| JP2018032561A (ja) * | 2016-08-25 | 2018-03-01 | 株式会社ジョブ | X線装置およびx線装置の制御方法 |
Cited By (3)
| Publication number | Priority date | Publication date | Assignee | Title |
|---|---|---|---|---|
| JP6983966B1 (ja) * | 2020-09-16 | 2021-12-17 | 株式会社東芝 | 厚み測定装置 |
| WO2022059246A1 (ja) * | 2020-09-16 | 2022-03-24 | 株式会社東芝 | 厚み測定装置 |
| JP2022049550A (ja) * | 2020-09-16 | 2022-03-29 | 株式会社東芝 | 厚み測定装置 |
Also Published As
| Publication number | Publication date |
|---|---|
| CN111051812A (zh) | 2020-04-21 |
| TWI687647B (zh) | 2020-03-11 |
| CN111051812B (zh) | 2021-06-18 |
| WO2019230040A1 (ja) | 2019-12-05 |
| TW202004127A (zh) | 2020-01-16 |
Similar Documents
| Publication | Publication Date | Title |
|---|---|---|
| WO2019230010A1 (ja) | 予兆データサーバ及びx線厚み測定システム | |
| CN105939667B (zh) | 用于生成谱计算机断层摄影投影数据的系统 | |
| CN108158597B (zh) | 确定原始x射线能量数据的方法、装置及ct设备 | |
| JP6494274B2 (ja) | 放射線撮影装置、放射線撮影システム、撮影制御装置、撮影制御方法およびプログラム | |
| US11199637B2 (en) | Radiation imaging apparatus, radiation imaging system, control method of radiation imaging apparatus, and non-transitory computer-readable storage medium | |
| CN101996344A (zh) | 计数光子的系统和方法 | |
| JP2020525151A5 (ja) | ||
| JP2023145796A (ja) | X線コンピュータ断層撮影装置 | |
| JP2014138654A (ja) | X線画像診断装置 | |
| EP2944257B1 (en) | Radiation imaging apparatus, method of determining radiation irradiation, and storage medium | |
| JP5280172B2 (ja) | X線ct装置 | |
| US11119059B2 (en) | Semiconductor defect inspection apparatus and semiconductor defect inspection method | |
| WO2017093045A1 (en) | Determining a status of an x-ray tube of an x-ray system | |
| JP6585325B1 (ja) | 予兆データサーバ及びx線厚み測定システム | |
| CN106932829B (zh) | 放射线人体检查方法和放射线人体检查系统 | |
| JP2020113445A (ja) | 医用システム及びx線コンピュータ断層撮影装置 | |
| US10895652B2 (en) | Object radiography apparatus and method for determining a state of an object radiography apparatus | |
| EP4430924B1 (en) | Monitoring the state of an x-ray tube | |
| JP5413283B2 (ja) | 焦点ズレ検出装置、焦点ズレ検出方法およびプログラム | |
| US11599990B2 (en) | Deterioration determination method and deterioration determination device for industrial x-ray imaging apparatus | |
| JP4680096B2 (ja) | 物品検査システム | |
| JP4948855B2 (ja) | 物品選別装置 | |
| CN113375606B (zh) | 维护装置 | |
| JP7195050B2 (ja) | 放射線検査装置 | |
| US20230204522A1 (en) | Radiation imaging apparatus, image processing apparatus, operation method for radiation imaging apparatus, and non-transitory computer readable storage medium |
Legal Events
| Date | Code | Title | Description |
|---|---|---|---|
| 121 | Ep: the epo has been informed by wipo that ep was designated in this application |
Ref document number: 18920339 Country of ref document: EP Kind code of ref document: A1 |
|
| NENP | Non-entry into the national phase |
Ref country code: DE |
|
| 122 | Ep: pct application non-entry in european phase |
Ref document number: 18920339 Country of ref document: EP Kind code of ref document: A1 |