WO2018003011A1 - 分析装置 - Google Patents
分析装置 Download PDFInfo
- Publication number
- WO2018003011A1 WO2018003011A1 PCT/JP2016/069124 JP2016069124W WO2018003011A1 WO 2018003011 A1 WO2018003011 A1 WO 2018003011A1 JP 2016069124 W JP2016069124 W JP 2016069124W WO 2018003011 A1 WO2018003011 A1 WO 2018003011A1
- Authority
- WO
- WIPO (PCT)
- Prior art keywords
- mass
- analysis
- charge ratio
- unit
- analysis method
- Prior art date
Links
Images


Classifications
-
- G—PHYSICS
- G01—MEASURING; TESTING
- G01N—INVESTIGATING OR ANALYSING MATERIALS BY DETERMINING THEIR CHEMICAL OR PHYSICAL PROPERTIES
- G01N30/00—Investigating or analysing materials by separation into components using adsorption, absorption or similar phenomena or using ion-exchange, e.g. chromatography or field flow fractionation
- G01N30/02—Column chromatography
- G01N30/86—Signal analysis
- G01N30/8624—Detection of slopes or peaks; baseline correction
- G01N30/8641—Baseline
-
- G—PHYSICS
- G01—MEASURING; TESTING
- G01N—INVESTIGATING OR ANALYSING MATERIALS BY DETERMINING THEIR CHEMICAL OR PHYSICAL PROPERTIES
- G01N30/00—Investigating or analysing materials by separation into components using adsorption, absorption or similar phenomena or using ion-exchange, e.g. chromatography or field flow fractionation
- G01N30/02—Column chromatography
- G01N30/86—Signal analysis
- G01N30/8624—Detection of slopes or peaks; baseline correction
- G01N30/8631—Peaks
-
- G—PHYSICS
- G01—MEASURING; TESTING
- G01N—INVESTIGATING OR ANALYSING MATERIALS BY DETERMINING THEIR CHEMICAL OR PHYSICAL PROPERTIES
- G01N30/00—Investigating or analysing materials by separation into components using adsorption, absorption or similar phenomena or using ion-exchange, e.g. chromatography or field flow fractionation
- G01N30/02—Column chromatography
- G01N30/62—Detectors specially adapted therefor
- G01N30/72—Mass spectrometers
-
- G—PHYSICS
- G01—MEASURING; TESTING
- G01N—INVESTIGATING OR ANALYSING MATERIALS BY DETERMINING THEIR CHEMICAL OR PHYSICAL PROPERTIES
- G01N30/00—Investigating or analysing materials by separation into components using adsorption, absorption or similar phenomena or using ion-exchange, e.g. chromatography or field flow fractionation
- G01N30/02—Column chromatography
- G01N30/86—Signal analysis
- G01N30/8675—Evaluation, i.e. decoding of the signal into analytical information
- G01N30/8679—Target compound analysis, i.e. whereby a limited number of peaks is analysed
-
- G—PHYSICS
- G01—MEASURING; TESTING
- G01N—INVESTIGATING OR ANALYSING MATERIALS BY DETERMINING THEIR CHEMICAL OR PHYSICAL PROPERTIES
- G01N30/00—Investigating or analysing materials by separation into components using adsorption, absorption or similar phenomena or using ion-exchange, e.g. chromatography or field flow fractionation
- G01N30/02—Column chromatography
- G01N30/62—Detectors specially adapted therefor
- G01N2030/621—Detectors specially adapted therefor signal-to-noise ratio
- G01N2030/625—Detectors specially adapted therefor signal-to-noise ratio by measuring reference material, e.g. carrier without sample
-
- G—PHYSICS
- G01—MEASURING; TESTING
- G01N—INVESTIGATING OR ANALYSING MATERIALS BY DETERMINING THEIR CHEMICAL OR PHYSICAL PROPERTIES
- G01N30/00—Investigating or analysing materials by separation into components using adsorption, absorption or similar phenomena or using ion-exchange, e.g. chromatography or field flow fractionation
- G01N30/02—Column chromatography
- G01N30/88—Integrated analysis systems specially adapted therefor, not covered by a single one of the groups G01N30/04 - G01N30/86
- G01N2030/8809—Integrated analysis systems specially adapted therefor, not covered by a single one of the groups G01N30/04 - G01N30/86 analysis specially adapted for the sample
- G01N2030/8872—Integrated analysis systems specially adapted therefor, not covered by a single one of the groups G01N30/04 - G01N30/86 analysis specially adapted for the sample impurities
-
- G—PHYSICS
- G01—MEASURING; TESTING
- G01N—INVESTIGATING OR ANALYSING MATERIALS BY DETERMINING THEIR CHEMICAL OR PHYSICAL PROPERTIES
- G01N30/00—Investigating or analysing materials by separation into components using adsorption, absorption or similar phenomena or using ion-exchange, e.g. chromatography or field flow fractionation
- G01N30/02—Column chromatography
- G01N30/62—Detectors specially adapted therefor
- G01N30/72—Mass spectrometers
- G01N30/7206—Mass spectrometers interfaced to gas chromatograph
-
- G—PHYSICS
- G01—MEASURING; TESTING
- G01N—INVESTIGATING OR ANALYSING MATERIALS BY DETERMINING THEIR CHEMICAL OR PHYSICAL PROPERTIES
- G01N30/00—Investigating or analysing materials by separation into components using adsorption, absorption or similar phenomena or using ion-exchange, e.g. chromatography or field flow fractionation
- G01N30/02—Column chromatography
- G01N30/62—Detectors specially adapted therefor
- G01N30/72—Mass spectrometers
- G01N30/7233—Mass spectrometers interfaced to liquid or supercritical fluid chromatograph
Definitions
- the present invention relates to an analyzer such as a chromatograph mass spectrometer or a spectroscopic analyzer combining a liquid chromatograph (LC) or gas chromatograph (GC) and a mass spectrometer.
- an analyzer such as a chromatograph mass spectrometer or a spectroscopic analyzer combining a liquid chromatograph (LC) or gas chromatograph (GC) and a mass spectrometer.
- a chromatogram total ion chromatogram
- a peak having a signal intensity of a predetermined ratio or more with respect to a signal intensity (peak height) of a known target compound-derived peak is an impurity Detect as a peak.
- Patent Document 1 acquires and stores a chromatogram and a mass spectrum in which background noise appears by performing GC / MS analysis on a blank sample containing only a solvent that does not contain a sample component, An apparatus for removing the influence of background noise by subtracting the chromatogram or mass spectrum in which the background noise appears from the chromatogram or mass spectrum obtained by performing GC / MS analysis is disclosed.
- a gas chromatograph mass spectrometer that combines a gas chromatograph and a mass spectrometer also has the same problem due to impurities contained in the carrier gas.
- an object of the present invention is to provide an analyzer such as a chromatograph mass spectrometer capable of detecting a trace amount of compound that could not be detected conventionally.
- the second object of the present invention is to easily create an analytical method including analytical conditions and the like, which is used when performing an analysis for detecting a trace amount of a compound that could not be detected in the past as described above. It is to provide an analyzer that can.
- the first aspect of the present invention made to solve the above-described problem is that a spectrum over a range of a predetermined value for a predetermined parameter is acquired by executing an analysis according to an analysis method including an analysis condition.
- a background information storage unit for storing parameter values of background signals appearing during analysis; b) When one or a plurality of parameter values or parameter value ranges are set as one of the analysis conditions, the parameter values stored in the background information storage unit are excluded from the parameter values or parameter value ranges.
- an analysis method creation unit for creating an analysis method for analyzing a plurality of parameter values or parameter value ranges, It is characterized by having.
- the parameter is, for example, a mass-to-charge ratio or a wavelength (or wave number).
- the analyzer according to the present invention includes a mass including an inductively coupled plasma mass spectrometer (ICP-MS), a matrix-assisted laser desorption ionization time-of-flight mass spectrometer (MALDI-TOFMS), and the like.
- ICP-MS inductively coupled plasma mass spectrometer
- MALDI-TOFMS matrix-assisted laser desorption ionization time-of-flight mass spectrometer
- the analyzer is a spectroscopic analyzer such as a photodiode array detector (PDA), an ultraviolet-visible spectrophotometer, a Fourier transform infrared spectrophotometer (FTIR), and the spectrum is Absorption spectrum and fluorescence spectrum.
- PDA photodiode array detector
- FTIR Fourier transform infrared spectrophotometer
- the analyzer according to the present invention is a mass spectrometer
- a single-type mass spectrometer that does not cleave ions such as a quadrupole mass spectrometer
- a mass spectrometer capable of such MS / MS analysis may be used.
- the analyzer according to the first aspect of the present invention is a chromatograph mass spectrometer that detects a component temporally separated by a chromatograph using a mass spectrometer
- the background information storage unit stores a mass-to-charge ratio value of a background signal that appears during analysis
- the analysis method creation unit when one or more mass-to-charge ratios or mass-to-charge ratio ranges to be repeatedly analyzed, which is one of the analysis conditions, is set from the mass-to-charge ratio or mass-to-charge ratio range.
- the analysis method can be configured to repeatedly analyze the mass to charge ratio or the mass to charge ratio range excluding the mass to charge ratio stored in the ground information storage unit.
- the background information storage unit stores the mass-to-charge ratio of the background signal that appears during analysis.
- the background signal here is typically derived from the mobile phase used in the liquid chromatograph and various reagents added thereto, and is present almost entirely in the total ion chromatogram. Such background signals may change from user to user or from analysis to analysis. In addition, the background signal may change depending on other conditions such as the flow rate of the mobile phase and the type of column.
- the background information is stored by extracting the parameter value of the background signal, that is, the mass-to-charge ratio, based on the result obtained by performing the blank analysis. It is good to set it as the structure further provided with the background information acquisition part memorize
- a blank analysis is actually performed without injecting the sample into the mobile phase or by injecting a solvent-only sample into the mobile phase, and the background information acquisition unit obtains a background from the obtained mass spectrum, for example. Extract the mass-to-charge ratio of the ground signal. As a result, the mass-to-charge ratio of the background signal appearing under the mobile phase used for the analysis at that time and other conditions can be accurately obtained.
- the analysis method creation unit is stored in the background information storage unit from one or more mass-to-charge ratios or mass-to-charge ratio ranges to be repeatedly analyzed, which is set by the user or automatically as one of the analysis conditions.
- the mass to charge ratio or the mass to charge ratio range excluding the mass to charge ratio is determined. Specifically, for example, in the case where repetition of scan measurement over a predetermined mass-to-charge ratio range is set, one or more mass-to-charge ratios stored in the background information storage unit from the mass-to-charge ratio range In other words, a mass-to-charge ratio range in which the mass-to-charge ratio range is interrupted is obtained.
- the background information storage unit stores the plurality of mass to charge ratios.
- One or more mass-to-charge ratios excluding the stored one or more mass-to-charge ratios are determined.
- ions having the mass-to-charge ratio of the background signal are excluded from the analysis target. Therefore, the background signal does not appear in the total ion chromatogram or mass spectrum obtained by the analysis according to this analytical method, and the mass-to-charge ratio of the background signal is not the same as the mass-to-charge ratio of the ions derived from impurities. For example, on the total ion chromatogram, a peak of a trace component such as an impurity that has been conventionally hidden behind a background signal can be observed.
- the background information storage unit may be a database that stores parameter values of background signals under various conditions.
- the various conditions referred to here are conditions that may change the manner in which the background signal is output as described above.
- the mobile phase and the types of various reagents added thereto are different.
- the flow rate of the mobile phase and the type of column can be included.
- Such a database may be created by the user himself or may be provided by a device manufacturer or the like.
- the second aspect of the present invention which has been made to solve the above-mentioned problems, is to acquire a spectrum over a range of a predetermined value for a predetermined parameter by executing an analysis according to an analysis method including an analysis condition.
- An intensity value determination unit for obtaining a parameter value whose signal intensity value exceeds the threshold; It is characterized by having.
- the “parameter value or parameter value range excluded from the analysis target” is, for example, the background stored in the background information storage unit in the analyzer according to the first aspect.
- the parameter value of the ground signal or a parameter value range having a predetermined width including the parameter value can be used.
- the analyzer according to the second aspect of the present invention is a chromatograph mass spectrometer that detects, by a mass spectrometer, components separated in time by a chromatograph
- the exclusion information setting unit sets a mass-to-charge ratio or mass-to-charge ratio range to be excluded from the analysis target
- the intensity value determination unit excludes the mass-to-charge ratio or the mass-to-charge ratio range set by the exclusion information setting unit on the mass spectrum obtained by analyzing the sample, and the signal intensity at other mass-to-charge ratios. It is possible to determine whether or not the value exceeds a predetermined threshold value, and obtain a mass-to-charge ratio in which the signal intensity value exceeds the threshold value.
- the intensity value determination unit Except for the mass-to-charge ratio or the mass-to-charge ratio range set by the exclusion information setting unit, it is determined whether or not the signal intensity value exceeds a predetermined threshold at other mass-to-charge ratios. In other words, no matter how large a peak exists in the mass-to-charge ratio or any mass-to-charge ratio within the mass-to-charge ratio range set by the exclusion information setting unit, the peak is ignored, and at other mass-to-charge ratios. Only those whose signal intensity values exceed a predetermined threshold are extracted.
- the intensity value determination unit is derived from a significant component other than the background signal, that is, the target compound or impurity.
- the mass-to-charge ratio of ions can be determined.
- an extracted ion chromatogram (usually a mass) at a mass-to-charge ratio obtained by the intensity value determination unit using data obtained by analyzing a sample. It may be configured to further include a chromatogram creation unit that creates a chromatogram). According to this configuration, an extracted ion chromatogram in which a peak derived from a target compound or an impurity in a sample is observed can be automatically created. For example, impurities are quantified based on the peak area value on the chromatogram. It is also possible.
- the analyzer according to the second aspect of the present invention is a chromatograph mass spectrometer that performs analysis according to an analysis method including analysis conditions
- the mass-to-charge ratio obtained by the intensity value determination unit is repeatedly analyzed.
- An analysis method creating unit that creates the analyzed method may be further included.
- the analysis method creation unit creates, for example, an analysis method that executes SIM measurement targeting the mass-to-charge ratio obtained by the intensity value determination unit.
- the mass spectrometer is a mass spectrometer capable of MS / MS analysis
- An analysis method for executing MRM measurement using a ratio as a precursor ion and a product ion as a predetermined mass electrolysis ratio corresponding to the mass-to-charge ratio is created. Thereby, it is possible to automatically create an analysis method for performing analysis with the target compound or impurity in the sample as a target without being affected by the background signal.
- the intensity value determination unit is a mass whose signal intensity value exceeds the threshold value based on a mass spectrum obtained in substantially real time during the analysis of the sample.
- An analysis control unit that obtains a charge ratio and controls each unit so as to execute SIM measurement, product ion scan measurement, or MRM measurement targeting the mass-to-charge ratio when the mass-to-charge ratio is obtained It is good.
- the analyzer of the first aspect of the present invention it can be conventionally detected because of the influence of a mobile phase, a reagent, etc. in a liquid chromatograph, or because of the influence of an impurity in a carrier gas in a gas chromatograph. It is possible to detect a minute amount of impurities and the like that have not been present on the chromatogram. Further, according to the analyzer of the first aspect of the present invention, it is possible to remove the influence of a small amount of impurities when performing the analysis according to the prepared analysis method, so that the background is obtained by data processing after data collection. Unlike the removal of impurities, the presence or absence of impurities can be confirmed in real time during the execution of the analysis. In addition, since an analysis method for performing such an analysis can be automatically created, the burden on the user can be reduced.
- the analyzer of the second aspect of the present invention it can be conventionally detected, for example, due to the influence of a mobile phase or a reagent in a liquid chromatograph or due to the influence of an impurity in a carrier gas in a gas chromatograph.
- the mass-to-charge ratio of ions derived from a trace amount of impurities that were not present can be easily confirmed.
- an analysis method for performing an analysis targeting such impurities can be automatically created.
- the retention time of impurities can be confirmed by detecting a peak on the extracted ion chromatogram in the mass-to-charge ratio of ions derived from impurities.
- the block diagram of the principal part of LC-MS which is 1st Example of this invention Explanatory drawing of the scan measurement in LC-MS of 1st Example.
- the block diagram of the principal part of LC-MS which is 2nd Example of this invention The flowchart which shows the procedure of the impurity confirmation process in LC-MS of 2nd Example.
- FIG. 1 is a configuration diagram of a main part of the LC-MS of the first embodiment.
- the measurement unit 1 includes a liquid chromatograph (LC unit) 11 and a mass spectrometer (MS unit) 12.
- the liquid chromatograph 11 includes a liquid feed pump 112 that sucks and feeds the mobile phase from the mobile phase container 111, an injector 113 that injects a sample into the mobile phase, a column 114 that separates each component in the sample, including.
- the mass spectrometer 12 is a quadrupole mass spectrometer having a quadrupole mass filter as a mass analyzer.
- the detection signal obtained by the measurement unit 1 is converted into digital data by an analog-digital converter (ADC) 2 and input to the control / processing unit 4.
- the control / processing unit 4 to which the input unit 5 and the display unit 6 are connected includes a data storage unit 41, a background information extraction unit 42, a background information storage unit 43, an analysis method creation unit 44, an analysis method storage unit 45, Functional blocks such as the impurity detection unit 46 are included.
- the control / processing unit 4 controls the operation of the measurement unit 1 via the analysis control unit 3.
- Each function of the control / processing unit 4 can be achieved by executing dedicated control / processing software installed in advance in the personal computer on the computer.
- FIGS. 3 is a flowchart of impurity detection control and processing in the LC-MS of this embodiment
- FIG. 2 is an explanatory diagram of scan measurement in the LC-MS of this embodiment
- FIG. 4 is an example of a mass spectrum obtained by blank analysis.
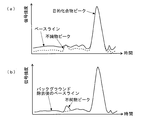
- FIG. 5A is a diagram showing an example of a total ion chromatogram (TIC) from which a background signal is not removed
- FIG. 5B is a diagram showing an example of a TIC from which a background signal is removed. .
- TIC total ion chromatogram
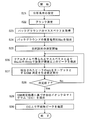
- the user sets analysis conditions including a mass-to-charge ratio range (that is, a lower limit value M min and an upper limit value M max ) of scan measurement performed in the mass spectrometer 12 from the input unit 5 (step S1).
- the set analysis conditions are temporarily stored in the analysis method storage unit 45.
- the analysis control unit 3 that has received an instruction from the control / processing unit 4 performs blank measurement by controlling the measurement unit 1 according to the previously stored analysis conditions (step S2). In the blank measurement, a sample is not injected into the mobile phase in the liquid chromatograph 11 or a sample containing only a solvent is injected into the mobile phase.
- the mass spectrometer 12 repeatedly performs scan measurement in the mass to charge ratio range of M min to M max .
- FIG. 2 (a) schematically shows the voltage applied to the quadrupole mass filter of the mass spectrometer 12 at this time.
- the mass spectrum obtained by the scan measurement mainly reflects the component in the mobile phase. That is, the data constituting the mass spectrum of the background signal due to the components in the mobile phase is stored in the data storage unit 41 (step S3).
- the background information extraction unit 42 extracts a peak having an intensity value equal to or greater than a predetermined threshold in the mass spectrum of the background signal, and obtains the mass-to-charge ratio of the peak as the mass-to-charge ratio M BG of the background signal (Ste S4). For example, when the mass spectrum of the background signal shown in FIG. 4 is obtained, m / z 279 and 391 corresponding to two peaks whose intensity values are equal to or greater than the threshold are extracted as the mass-to-charge ratio M BG of the background signal. .
- the analysis method creation unit 44 obtains a mass-to-charge ratio range excluding the background-charged mass-to-charge ratio M BG from the previously set scan-to-charge mass-to-charge ratio range M min to M max and scans this.
- An analysis method to be measured is created (step S5).
- M min ⁇ M max: m / z is 250 ⁇ 500
- m / z250 ⁇ 278 Three mass-to-charge ratio ranges of 280 to 390 and 392 to 500 are scan measurement targets.
- the mass-to-charge ratio width ( ⁇ 1 in the above example) to be excluded may be appropriately changed with respect to a certain mass-to-charge ratio value.
- the analysis method in which the mass-to-charge ratio range to be scanned is changed is stored in the analysis method storage unit 45.
- the analysis control unit 3 controls the measurement unit 1 to execute LC / MS analysis on the target sample according to the analysis method created in step S5 (step S6).
- various components are temporally separated in the column 114 and introduced into the mass spectrometer 12, but the components that cause the background signal (for example, components in the mobile phase) are also introduced into the mass spectrometer 12. Is done.
- the mass-to-charge ratio of ions derived from the component that caused the background signal is excluded from the scan measurement target, the intensity of ions derived from this component is not reflected in the collected data.
- Step S7 Data obtained by LC / MS analysis on the target sample is stored in the data storage unit 41. Then, after the analysis is completed, the impurity detection unit 46 creates a TIC based on the data stored in the data storage unit 41, sets the peak having the maximum signal intensity on the TIC as the main peak, and sets the signal intensity of the main peak to the peak. On the other hand, a threshold of a predetermined ratio is set, and a peak having a signal intensity equal to or higher than the threshold is detected as an impurity peak (step S7). As described above, since the main background signal derived from the mobile phase or the like is not reflected in the data which is the analysis result, the rise of the baseline due to the background signal is eliminated in the TIC as shown in FIG. . As a result, a minute impurity peak that has been hidden behind the base line can be detected.
- step S8 If no peak is detected on the TIC (No in step S8), the impurity detector 46 determines that there is no impurity (step S9). On the other hand, when a peak is detected on the TIC (Yes in step S8), a spectrum peak having a signal intensity equal to or greater than a predetermined threshold is detected on the mass spectrum obtained near the peak retention time (step S8). S10). Then, the mass-to-charge ratio of the spectrum peak is obtained, and this is recorded or displayed as the mass-to-charge ratio of the impurity (step S11).
- a series of processing and control is basically automatically performed. However, a part of the processing and control may be manually performed by the user. For example, after the TIC is created in step S7, the TIC is displayed on the screen of the display unit 6, and the subsequent work, that is, the confirmation of the impurity peak on the TIC or the mass spectrum when there is an impurity, is displayed. The confirmation of the mass-to-charge ratio of the impurities may be performed manually by the user. In addition, when the mass-to-charge ratio of the background signal is extracted from the mass spectrum in step S4, the user confirms the mass spectrum displayed on the screen of the display unit 6, and manually calculates the mass-to-charge ratio of the background signal. You may make it select.
- the scan measurement in the predetermined mass-to-charge ratio range was performed in the blank measurement and the LC / MS analysis for the target sample after that, but the scan measurement for scanning the mass-to-charge ratio substantially continuously.
- the mass-to-charge ratio may be changed by a predetermined step width (for example, 1 Da or 2 Da) within a predetermined mass-to-charge ratio range. This can be seen as a combination of a large number of SIM measurements, or it can be seen as an intermittent scan measurement.
- SIM measurement is performed with a mass-to-charge ratio corresponding to the mass of the impurity as a target. You may do it.
- the LC / MS analysis of the target sample was performed after the blank measurement was performed and the mass-to-charge ratio of the background signal was obtained based on the result.
- the background information is acquired during the period from when the sample is injected into the mobile phase at the time of analysis until the first peak appears, and based on the results, the analysis method is changed during the analysis, and data for each component in the sample is obtained. May be obtained.
- background information may be acquired together with acquisition of data for another purpose other than analysis of the target sample.
- the background information may be obtained when obtaining calibration curve data or when analyzing analysis conditions such as a mobile phase, a column, and a gradient.
- background information may be obtained during the optimization work such as the voltage / gas of the apparatus.
- the mass spectrometer 12 when it is a triple quadrupole mass spectrometer, it has a function of automatically optimizing collision-induced dissociation energy and the like, and background information is acquired in such a function. You may make it include a function. Moreover, you may make it acquire background information at the time of the validation work of a measurement method. Furthermore, in the case of a mass spectrometer using a MALDI ion source, background information may be obtained when examining the matrix effect.
- the mass-to-charge ratio of the background signal under various conditions is obtained in advance and stored in the background information storage unit 43, and the analysis is performed when analyzing the target sample.
- the analysis method may be created by reading out the mass-to-charge ratio of the background signal under the condition corresponding to or closest to the above condition from the storage unit 43.
- the various conditions may include the type of mobile phase used, the type and concentration of various reagents added to the mobile phase, the flow rate of the mobile phase, the type of column used, and the like.
- This is a kind of database that correlates various analysis conditions with the mass-to-charge ratio of the background signal. By using such a database, it is possible to sufficiently back up without performing blank measurement for each analysis of the target sample. A TIC from which the ground signal is removed can be obtained.
- background information under various conditions other than the LC separation conditions as described above can be stored in advance and used.
- pretreatment method such as solid phase extraction (reverse phase, normal phase) or liquid phase extraction
- sample storage container vial, vial cap, mobile phase bottle, column
- sample storage container vial, vial cap, mobile phase bottle, column
- background information for each sample type for example, XX for spinach, ⁇ for tomatoes, XX for mice), ionization methods in mass spectrometers (for example, XX for ESI methods, ⁇ for APCI methods, etc.) May be stored.
- background information may be stored.
- Background information may be stored according to “sample to be compared”.
- background information may be stored for each matrix (substances other than the sample, coexisting substances) (for example, in the case of a biological sample, the matrix is plasma, urine, etc.). Further, such background information may be included in a method package provided in advance from the apparatus manufacturer to the user.
- LC / MS analysis was performed on the target sample in accordance with the created analysis method, and a TIC or the like was created.
- the background information is excluded. You may make it produce and display a mass spectrometry imaging image from the data acquired based on it.
- FIG. 6 is a configuration diagram of a main part of the LC-MS of the second embodiment, and the same components as those of the LC-MS of the first embodiment shown in FIG.
- the measurement unit 1, ADC 2, and analysis control unit 3 are the same as those of the LC-MS of the first embodiment.
- the control / processing unit 4 includes a data storage unit 41, a background information extraction unit 42, a background information storage unit 43 similar to the LC-MS of the first embodiment, a significant peak detection unit 401, an automatic SIM measurement control unit. 402, functional blocks such as an EIC creation unit 403 and an analysis method creation unit 404 are included.
- FIG. 8 is a flowchart of impurity detection control / processing in the LC-MS of this embodiment
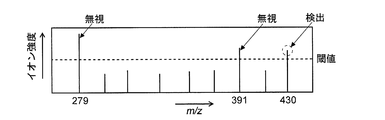
- FIG. 7 is an explanatory diagram of a significant peak detection operation in the LC-MS of this embodiment.
- steps S21 to S24 is the same as that of steps S1 to S4 in FIG. 3, and the background information storage unit 43 stores the mass-to-charge ratio M BG of the background signal.
- the analysis control unit 3 controls the measurement unit 1 so as to execute LC / MS analysis on the target sample and starts measurement (step S25).
- the mass spectrometer 12 performs scan measurement over a predetermined mass-to-charge ratio range Mmin to Mmax.
- the significant peak detector 401 creates a mass spectrum in real time based on the obtained data, and detects a significant peak on the mass spectrum.
- the peak of the mass-to-charge ratio M BG of the background signal stored in the background information storage unit 43 is ignored regardless of the intensity, and the peak whose intensity is greater than or equal to the threshold is significant at other mass-to-charge ratios. It is determined that the peak is a large peak (step S26).
- M BG m / z 279 and m / z 391 and a mass spectrum as shown in FIG. 7 is obtained, the peaks of m / z 279 and m / z 391 are ignored and the intensity exceeds the threshold value. Only the peak at m / z 430 is judged as a significant peak.
- the automatic SIM measurement control unit 402 controls the measurement unit 1 to continue the SIM measurement targeting the detected mass-to-charge ratio (step S27).
- the detected peak is a peak derived from an impurity
- the time during which the impurity is introduced into the mass spectrometer 12 is limited. Therefore, the SIM measurement may be performed for a predetermined time from the time when a peak at a certain mass-to-charge ratio is detected as a significant peak, or the SIM measurement and the scan measurement are performed in a very short time division.
- SIM measurement targeting the mass-to-charge ratio may be performed only while the peak in the mass-to-charge ratio is detected as a significant peak. If the measurement end condition is not satisfied, for example, when a predetermined measurement end time is reached, the process returns from step S28 to S26.
- SIM measurement targeting the mass-to-charge ratio of the peak is performed, and the ion intensity at the mass-to-charge ratio is measured.
- Data indicating a time change is stored in the data storage unit 41.
- An ion peak derived from the component that caused the background signal is also observed on the mass spectrum. However, since this peak is not extracted as a significant peak, naturally, the SIM targeting the mass-to-charge ratio of the background signal is targeted. No measurement is performed.
- the EIC creation unit 403 creates an extracted ion chromatogram at a specific mass-to-charge ratio based on the data obtained by the SIM measurement stored in the data storage unit 41, and displays this. Drawing on the screen of the unit 6 (step S29).
- the user checks the displayed extracted ion chromatogram, for example, grasps the retention time of the impurity and grasps the mass-to-charge ratio of the impurity from the target mass-to-charge ratio (step S30).
- the peak derived from the target compound in the sample is also detected as a significant peak, but if it is not necessary to detect this, the target compound is detected when detecting a significant peak.
- the corresponding known mass-to-charge ratio may be set to be ignored. Thereby, only an extracted ion chromatogram in which impurities are observed can be created.
- the flowchart shown in FIG. 8 may be modified as follows. That is, each time a significant peak is detected in step S26, the mass-to-charge ratio of the peak and the time range (holding time) in which the peak is detected are stored. Then, after the measurement is completed, the analysis method creation unit 404 automatically performs an analysis method that performs SIM measurement targeting the mass-to-charge ratio of all detected significant peaks only in the time range corresponding to the peaks. Create it. Using these analytical methods, it is possible to identify (determine whether they are included) or quantify impurities in another sample of the same type (for example, a sample of another lot of pharmaceuticals having the same target compound). .
- the mass spectrometer 12 in the measurement unit 1 is a general single-type quadrupole mass spectrometer, but the mass spectrometer 12 is a triple quadrupole mass capable of MS / MS analysis.
- An analyzer may be used.
- Q1 scan mass scan in the front quadrupole mass filter
- Q3 scan mass scan in the rear quadrupole mass filter
- product ion scan precursor Perform measurements such as ion scan, neutral loss scan, etc., or set the mass-to-charge ratio of the significant peak to the mass-to-charge ratio of the precursor ion and the mass-to-charge ratio set in advance for each mass-to-charge ratio of the precursor ion
- a general measurement mode used in MS / MS analysis such as executing MRM measurement using the mass-to-charge ratio of ions, may be used.
- the present invention can be applied to mass spectrometers other than the quadrupole mass spectrometer, such as a time-of-flight mass spectrometer, an ion trap mass spectrometer, and an inductively coupled plasma mass spectrometer.
- mass spectrometers other than the quadrupole mass spectrometer, such as a time-of-flight mass spectrometer, an ion trap mass spectrometer, and an inductively coupled plasma mass spectrometer.
- the present invention can be applied not only to a liquid chromatograph mass spectrometer but also to a gas chromatograph mass spectrometer.
- the present invention can also be used for an imaging mass spectrometer using MALDI-TOFMS.
- the present invention is used when the background signal appears in a specific wavelength or wavelength range. Obviously it is applicable.
Landscapes
- Physics & Mathematics (AREA)
- Health & Medical Sciences (AREA)
- Life Sciences & Earth Sciences (AREA)
- Chemical & Material Sciences (AREA)
- Analytical Chemistry (AREA)
- Biochemistry (AREA)
- General Health & Medical Sciences (AREA)
- General Physics & Mathematics (AREA)
- Immunology (AREA)
- Pathology (AREA)
- Engineering & Computer Science (AREA)
- Library & Information Science (AREA)
- Other Investigation Or Analysis Of Materials By Electrical Means (AREA)
Priority Applications (5)
| Application Number | Priority Date | Filing Date | Title |
|---|---|---|---|
| EP16907244.4A EP3477293A4 (de) | 2016-06-28 | 2016-06-28 | Analysevorrichtung |
| US16/307,650 US10935528B2 (en) | 2016-06-28 | 2016-06-28 | Analysis device |
| JP2018524618A JP6665933B2 (ja) | 2016-06-28 | 2016-06-28 | 分析装置 |
| PCT/JP2016/069124 WO2018003011A1 (ja) | 2016-06-28 | 2016-06-28 | 分析装置 |
| CN201680087362.6A CN109416342B (zh) | 2016-06-28 | 2016-06-28 | 分析装置 |
Applications Claiming Priority (1)
| Application Number | Priority Date | Filing Date | Title |
|---|---|---|---|
| PCT/JP2016/069124 WO2018003011A1 (ja) | 2016-06-28 | 2016-06-28 | 分析装置 |
Publications (1)
| Publication Number | Publication Date |
|---|---|
| WO2018003011A1 true WO2018003011A1 (ja) | 2018-01-04 |
Family
ID=60786185
Family Applications (1)
| Application Number | Title | Priority Date | Filing Date |
|---|---|---|---|
| PCT/JP2016/069124 WO2018003011A1 (ja) | 2016-06-28 | 2016-06-28 | 分析装置 |
Country Status (5)
| Country | Link |
|---|---|
| US (1) | US10935528B2 (de) |
| EP (1) | EP3477293A4 (de) |
| JP (1) | JP6665933B2 (de) |
| CN (1) | CN109416342B (de) |
| WO (1) | WO2018003011A1 (de) |
Cited By (4)
| Publication number | Priority date | Publication date | Assignee | Title |
|---|---|---|---|---|
| WO2020110583A1 (ja) * | 2018-11-29 | 2020-06-04 | 株式会社島津製作所 | 有害物質分析システム及び有害物質分析用プログラム |
| CN112601958A (zh) * | 2018-08-30 | 2021-04-02 | 英国质谱公司 | 质量校正 |
| GB2586376B (en) * | 2018-04-18 | 2023-03-29 | Agilent Technologies Inc | Analysis of blank runs for chromatograph performance |
| WO2023054125A1 (ja) * | 2021-10-01 | 2023-04-06 | 株式会社日立ハイテク | 液体クロマトグラフ質量分析装置の制御方法 |
Families Citing this family (5)
| Publication number | Priority date | Publication date | Assignee | Title |
|---|---|---|---|---|
| CN111465864A (zh) * | 2018-02-09 | 2020-07-28 | 株式会社岛津制作所 | 电传导度检测器及求取背景减法信号的相位调整值的方法 |
| CN113383232B (zh) * | 2019-02-04 | 2023-09-19 | 株式会社日立高新技术 | 液相色谱质量分析装置 |
| WO2020194582A1 (ja) * | 2019-03-27 | 2020-10-01 | 株式会社島津製作所 | クロマトグラフ質量分析装置 |
| JP7375826B2 (ja) * | 2019-11-12 | 2023-11-08 | 株式会社島津製作所 | 分析方法、分析装置およびプログラム |
| JP2022123952A (ja) * | 2021-02-15 | 2022-08-25 | 株式会社島津製作所 | 液体クロマトグラフ |
Citations (7)
| Publication number | Priority date | Publication date | Assignee | Title |
|---|---|---|---|---|
| JPS63135854A (ja) * | 1986-11-28 | 1988-06-08 | Hitachi Ltd | 質量分析装置 |
| JPS63168960A (ja) * | 1986-12-29 | 1988-07-12 | Shimadzu Corp | 4重極質量分析計の走査方法 |
| JPH10185873A (ja) * | 1996-12-26 | 1998-07-14 | Shimadzu Corp | 質量分析装置 |
| JP2000131284A (ja) | 1998-08-20 | 2000-05-12 | Shimadzu Corp | クロマトグラフ質量分析装置 |
| JP2005221276A (ja) * | 2004-02-04 | 2005-08-18 | Shimadzu Corp | クロマトグラフ質量分析用データ処理装置 |
| US20100213368A1 (en) * | 2009-02-22 | 2010-08-26 | Xin Wang | Precise and thorough background subtraction |
| JP2013228295A (ja) * | 2012-04-26 | 2013-11-07 | Shimadzu Corp | クロマトグラフ質量分析用データ処理装置 |
Family Cites Families (12)
| Publication number | Priority date | Publication date | Assignee | Title |
|---|---|---|---|---|
| US5668373A (en) * | 1996-04-26 | 1997-09-16 | Trustees Of Tufts College | Methods and apparatus for analysis of complex mixtures |
| JP3317221B2 (ja) * | 1997-11-28 | 2002-08-26 | 株式会社島津製作所 | プロセスガス監視装置 |
| WO2003087770A2 (en) | 2002-04-12 | 2003-10-23 | Northeastern University | Matched filtration with experimental noise determination for denoising, peak picking and quantitation in lc-ms |
| US9859105B2 (en) * | 2006-02-14 | 2018-01-02 | Excellims Corporation | Multiple ion gate method and apparatus |
| JP2012145382A (ja) * | 2011-01-07 | 2012-08-02 | Shimadzu Corp | 液体クロマトグラフ分析装置 |
| WO2012099971A2 (en) | 2011-01-21 | 2012-07-26 | Massdefect Technologies, Llc | Background subtraction-mediated data-dependent acquisition |
| JP6115288B2 (ja) * | 2012-04-27 | 2017-04-19 | 株式会社島津製作所 | 質量分析におけるピーク検出方法及びそのシステム |
| JP6221800B2 (ja) | 2014-02-12 | 2017-11-01 | 株式会社島津製作所 | クロマトグラフ質量分析装置用データ処理装置 |
| US9490115B2 (en) * | 2014-12-18 | 2016-11-08 | Thermo Finnigan Llc | Varying frequency during a quadrupole scan for improved resolution and mass range |
| US9869662B2 (en) * | 2014-06-19 | 2018-01-16 | Shimadzu Corporation | Chromatograph/mass spectrometer data processing device |
| US10768151B2 (en) | 2014-09-16 | 2020-09-08 | Waters Technologies Corporation | Techniques for display and processing of mass spectral data |
| US9960027B2 (en) * | 2016-05-25 | 2018-05-01 | Thermo Finnigan Llc | Analyzing a complex sample by MS/MS using isotopically-labeled standards |
-
2016
- 2016-06-28 JP JP2018524618A patent/JP6665933B2/ja active Active
- 2016-06-28 CN CN201680087362.6A patent/CN109416342B/zh active Active
- 2016-06-28 US US16/307,650 patent/US10935528B2/en active Active
- 2016-06-28 WO PCT/JP2016/069124 patent/WO2018003011A1/ja active Application Filing
- 2016-06-28 EP EP16907244.4A patent/EP3477293A4/de not_active Withdrawn
Patent Citations (7)
| Publication number | Priority date | Publication date | Assignee | Title |
|---|---|---|---|---|
| JPS63135854A (ja) * | 1986-11-28 | 1988-06-08 | Hitachi Ltd | 質量分析装置 |
| JPS63168960A (ja) * | 1986-12-29 | 1988-07-12 | Shimadzu Corp | 4重極質量分析計の走査方法 |
| JPH10185873A (ja) * | 1996-12-26 | 1998-07-14 | Shimadzu Corp | 質量分析装置 |
| JP2000131284A (ja) | 1998-08-20 | 2000-05-12 | Shimadzu Corp | クロマトグラフ質量分析装置 |
| JP2005221276A (ja) * | 2004-02-04 | 2005-08-18 | Shimadzu Corp | クロマトグラフ質量分析用データ処理装置 |
| US20100213368A1 (en) * | 2009-02-22 | 2010-08-26 | Xin Wang | Precise and thorough background subtraction |
| JP2013228295A (ja) * | 2012-04-26 | 2013-11-07 | Shimadzu Corp | クロマトグラフ質量分析用データ処理装置 |
Non-Patent Citations (1)
| Title |
|---|
| See also references of EP3477293A4 |
Cited By (6)
| Publication number | Priority date | Publication date | Assignee | Title |
|---|---|---|---|---|
| GB2586376B (en) * | 2018-04-18 | 2023-03-29 | Agilent Technologies Inc | Analysis of blank runs for chromatograph performance |
| CN112601958A (zh) * | 2018-08-30 | 2021-04-02 | 英国质谱公司 | 质量校正 |
| US11823882B2 (en) | 2018-08-30 | 2023-11-21 | Micromass Uk Limited | Mass correction |
| CN112601958B (zh) * | 2018-08-30 | 2024-01-26 | 英国质谱公司 | 质量校正 |
| WO2020110583A1 (ja) * | 2018-11-29 | 2020-06-04 | 株式会社島津製作所 | 有害物質分析システム及び有害物質分析用プログラム |
| WO2023054125A1 (ja) * | 2021-10-01 | 2023-04-06 | 株式会社日立ハイテク | 液体クロマトグラフ質量分析装置の制御方法 |
Also Published As
| Publication number | Publication date |
|---|---|
| CN109416342A (zh) | 2019-03-01 |
| JPWO2018003011A1 (ja) | 2018-11-29 |
| US20190170712A1 (en) | 2019-06-06 |
| JP6665933B2 (ja) | 2020-03-13 |
| EP3477293A4 (de) | 2019-07-10 |
| EP3477293A1 (de) | 2019-05-01 |
| US10935528B2 (en) | 2021-03-02 |
| CN109416342B (zh) | 2022-02-01 |
Similar Documents
| Publication | Publication Date | Title |
|---|---|---|
| WO2018003011A1 (ja) | 分析装置 | |
| EP2798664B1 (de) | Verwendung von gefensterten massenspektrometriedaten zur bestimmung und/oder bestätigung der verweilzeit | |
| Picó et al. | Identification of unknown pesticides in fruits using ultra-performance liquid chromatography–quadrupole time-of-flight mass spectrometry: Imazalil as a case study of quantification | |
| US7985948B2 (en) | Systems and methods for analyzing substances using a mass spectrometer | |
| US11215589B2 (en) | Data analyzer for chromatograph mass spectrometry | |
| He et al. | Wide-scope screening and quantification of 50 pesticides in wine by liquid chromatography/quadrupole time-of-flight mass spectrometry combined with liquid chromatography/quadrupole linear ion trap mass spectrometry | |
| JP6048590B2 (ja) | 包括的2次元クロマトグラフ用データ処理装置 | |
| US10818485B2 (en) | Multidimensional mass spectrometry data processing device | |
| JP6176334B2 (ja) | 質量分析方法、質量分析装置、及び質量分析データ処理プログラム | |
| US9583323B2 (en) | Use of variable XIC widths of TOF-MSMS data for the determination of background interference in SRM assays | |
| US11209406B2 (en) | Data processing device | |
| EP3605077B1 (de) | Massenspektrometer und chromatografisches massenspektrometer | |
| WO2018154400A1 (en) | Physical isolation of adducts and other complicating factors in precursor ion selection for ida | |
| US9823228B2 (en) | Chromatograph mass spectrometer and control method therefor | |
| WO2020059144A1 (ja) | 質量分析装置及び質量分析方法 | |
| JP2019124610A (ja) | クロマトグラフ質量分析装置 | |
| CN114509511A (zh) | 色谱仪质量分析装置 | |
| Wang | Investigation of Deconvolution Approaches in GC-MS Metabolomics Studies | |
| JP2022066655A (ja) | 質量分析を用いた試料分析方法及び試料分析システム | |
| CN115516302A (zh) | 色谱质量分析数据处理方法、色谱质量分析装置以及色谱质量分析数据处理用程序 |
Legal Events
| Date | Code | Title | Description |
|---|---|---|---|
| WWE | Wipo information: entry into national phase |
Ref document number: 2018524618 Country of ref document: JP |
|
| 121 | Ep: the epo has been informed by wipo that ep was designated in this application |
Ref document number: 16907244 Country of ref document: EP Kind code of ref document: A1 |
|
| NENP | Non-entry into the national phase |
Ref country code: DE |
|
| ENP | Entry into the national phase |
Ref document number: 2016907244 Country of ref document: EP Effective date: 20190128 |