WO2016147329A1 - 情報提供装置、コンピュータプログラム、記録媒体及び情報提供方法 - Google Patents
情報提供装置、コンピュータプログラム、記録媒体及び情報提供方法 Download PDFInfo
- Publication number
- WO2016147329A1 WO2016147329A1 PCT/JP2015/057987 JP2015057987W WO2016147329A1 WO 2016147329 A1 WO2016147329 A1 WO 2016147329A1 JP 2015057987 W JP2015057987 W JP 2015057987W WO 2016147329 A1 WO2016147329 A1 WO 2016147329A1
- Authority
- WO
- WIPO (PCT)
- Prior art keywords
- time
- vehicles
- information
- time point
- signal
- Prior art date
- Legal status (The legal status is an assumption and is not a legal conclusion. Google has not performed a legal analysis and makes no representation as to the accuracy of the status listed.)
- Ceased
Links
Images








Classifications
-
- G—PHYSICS
- G08—SIGNALLING
- G08G—TRAFFIC CONTROL SYSTEMS
- G08G1/00—Traffic control systems for road vehicles
- G08G1/01—Detecting movement of traffic to be counted or controlled
Definitions
- the present invention relates to an information providing apparatus that provides information relating to the number of vehicles passing through a predetermined position, a computer program for realizing the information providing apparatus, a recording medium that records the computer program, and an information providing method.
- the traffic signal controller switches the signal display of each signal lamp based on the step color information including the lamp color information defining the lamp color of the signal display (step) of each signal lamp and the display time of each lamp color.
- the traffic control center or traffic signal controller has an appropriate signal light device based on traffic data such as traffic volume or congestion length collected by a vehicle detector installed on the road.
- traffic data such as traffic volume or congestion length collected by a vehicle detector installed on the road.
- There is an automatic control method that calculates the display time and sequentially switches the signal display of the signal lamp.
- a traffic signal controller capable of reducing traffic congestion by taking advantage of the automatic control method and the manual control method by providing a semi-automatic control unit (see Patent Document 1).
- the present invention has been made in view of such circumstances, and provides an information providing apparatus that provides information for determining the timing to end a green signal, a computer program for realizing the information providing apparatus, and the computer program. It is an object to provide a recorded recording medium and an information providing method.
- An information providing apparatus includes a number acquisition unit that acquires the number of vehicles passing through a predetermined position in a predetermined lane of an inflow channel that flows into an intersection, and a signal that acquires signal information of the intersection
- the number of vehicles passing through the predetermined position between the information acquisition unit and the first time point to the second time point after the start of the green signal for the inflow path is updated a plurality of times while updating the second time point until the end of the green signal.
- a specifying unit for specifying and a display unit for displaying information on the number of vehicles per predetermined time passing through the predetermined position based on the number of vehicles specified by the specifying unit each time the second time point is updated.
- a computer program is a computer program for causing a computer to provide information related to the number of vehicles, and passes the computer through a predetermined position in a predetermined lane of an inflow path flowing into an intersection.
- a vehicle number acquisition unit that acquires the number of vehicles to be transmitted, a signal information acquisition unit that acquires signal information of the intersection, and the predetermined position between the first time point and the second time point after the start of the green light for the inflow path
- a recording medium is a non-transitory recording medium readable by a computer in which a computer program for causing a computer to provide information on the number of vehicles is recorded.
- the computer program includes a number acquisition unit that acquires the number of vehicles passing a predetermined position in a predetermined lane of an inflow path that flows into an intersection, a signal information acquisition unit that acquires signal information of the intersection, and the inflow path
- a specifying unit that specifies the number of vehicles passing through the predetermined position between a first time point and a second time point after the start of the green light, a plurality of times while updating the second time point until the end of the green light; Each time the time is updated, information on the number of vehicles per predetermined time passing through the predetermined position is generated on the display unit based on the specified number of vehicles. That to function as a generator.
- the number acquisition unit acquires the number of vehicles passing through a predetermined position of a predetermined lane of the inflow channel flowing into the intersection, and signal information of the intersection is signaled
- the number of vehicles passing through the predetermined position between the step acquired by the information acquisition unit and the first time point to the second time point after the start of the green light for the inflow path is updated until the end of the green light.
- the display unit displays information relating to the number of vehicles per predetermined time passing through the predetermined position based on the specified number of vehicles each time the specifying unit specifies a plurality of times. Steps.
- An information providing apparatus includes a number acquisition unit that acquires the number of vehicles passing through a predetermined position in a predetermined lane of an inflow channel that flows into an intersection, and a signal that acquires signal information of the intersection
- the number of vehicles passing through the predetermined position between the information acquisition unit and the first time point to the second time point after the start of the green signal for the inflow path is updated a plurality of times while updating the second time point until the end of the green signal.
- a specifying unit for specifying and a display unit for displaying information on the number of vehicles per predetermined time passing through the predetermined position based on the number of vehicles specified by the specifying unit each time the second time point is updated.
- a computer program is a computer program for causing a computer to provide information related to the number of vehicles, and passes the computer through a predetermined position in a predetermined lane of an inflow path flowing into an intersection.
- a vehicle number acquisition unit that acquires the number of vehicles to be transmitted, a signal information acquisition unit that acquires signal information of the intersection, and the predetermined position between the first time point and the second time point after the start of the green light for the inflow path
- a recording medium is a non-transitory recording medium readable by a computer in which a computer program for causing a computer to provide information on the number of vehicles is recorded.
- the computer program includes a number acquisition unit that acquires the number of vehicles passing a predetermined position in a predetermined lane of an inflow path that flows into an intersection, a signal information acquisition unit that acquires signal information of the intersection, and the inflow path
- a specifying unit that specifies the number of vehicles passing through the predetermined position between a first time point and a second time point after the start of the green light, a plurality of times while updating the second time point until the end of the green light; Each time the time is updated, information on the number of vehicles per predetermined time passing through the predetermined position is generated on the display unit based on the specified number of vehicles. That to function as a generator.
- the number acquisition unit acquires the number of vehicles passing through a predetermined position of a predetermined lane of the inflow channel flowing into the intersection, and signal information of the intersection is signaled
- the number of vehicles passing through the predetermined position between the step acquired by the information acquisition unit and the first time point to the second time point after the start of the green light for the inflow path is updated until the end of the green light.
- the display unit displays information relating to the number of vehicles per predetermined time passing through the predetermined position based on the specified number of vehicles each time the specifying unit specifies a plurality of times. Steps.
- the number acquisition unit acquires the number of vehicles passing through a predetermined position in a predetermined lane of the inflow path flowing into the intersection.
- the predetermined lane may be any one lane, for example, a typical lane, or a dedicated lane such as a right turn lane or a left turn lane.
- the predetermined lane may be an entire lane.
- the predetermined position can be a stop line before the intersection or a point a required distance from the intersection.
- the number-of-units acquisition unit can acquire the number of vehicles from, for example, a vehicle detector installed near the stop line at the intersection.
- the signal information acquisition unit acquires signal information at intersections.
- the signal information includes information such as a switching order of each signal display such as a blue signal, a yellow signal, and a red signal, and a display time of each signal display.
- the specifying unit specifies the number of vehicles passing through a predetermined position from the first time point to the second time point after the start of the green signal for the inflow path, while updating the second time point until the end of the green signal.
- M time from the first time point to the second time point
- N seconds
- the specifying unit can store the past M (seconds) every N (seconds) ) To specify the number of vehicles passing a predetermined position (for example, a stop line).
- the display unit displays information on the number of vehicles per predetermined time passing through a predetermined position based on the number of vehicles specified by the specifying unit every time the second time point is updated.
- the number of vehicles per predetermined time includes the flow rate.
- the number of vehicles per predetermined time can be, for example, the number of vehicles per 30 seconds.
- the flow rate can be obtained by converting the number of vehicles per predetermined time, for example, per second or per hour.
- Information may be displayed as an analog meter, for example, in a bar format such as a bar graph, or may be displayed as a digital meter. Further, the indicator lamp may be turned on.
- information related to the number of vehicles per predetermined time is repeatedly updated and displayed at the update cycle N (seconds), so that an increase or decrease in flow rate can be easily recognized.
- N the update cycle
- it can be used as an indicator of how much the information related to the number of vehicles per predetermined time is reduced to the end timing of the green signal, so that information for determining the timing for ending the green signal can be provided. it can.
- the display unit continues to display information satisfying a predetermined condition among the information displayed every time the second time point is updated until the predetermined time point. It is.
- the display unit continues to display information that satisfies a predetermined condition among information to be displayed every time the second time point is updated until the predetermined time point.
- the information that satisfies the predetermined condition can be, for example, information when the number of vehicles per predetermined time is maximum, that is, the maximum flow rate.
- the predetermined time point is a time point when the green signal ends after the green signal starts. That is, when the flow rate increases after the start of the green signal and once decreases and then decreases, the information indicating the maximum flow rate is continuously displayed until the end of the green signal.
- the information providing apparatus determines, as the predetermined condition, a case where the number of vehicles per predetermined time is maximum after the start of the green signal and until the end of the green signal. Is provided.
- the determination unit determines, as a predetermined condition, a case where the number of vehicles per predetermined time is maximum between the start of the green signal and the end of the green signal. As a result, it is possible to easily recognize how much the flow rate has decreased with respect to the maximum value, and it is possible to easily determine the timing for ending the green light.
- the maximum value of the number of vehicles per predetermined time passing through the predetermined position between the start of the green signal and the end of the green signal is set to a plurality of signal cycles.
- the display unit displays information related to the representative value of the maximum value stored in the storage unit.
- the storage unit stores the maximum value of the number of vehicles per predetermined time passing through a predetermined position between the start of the green signal and the end of the green signal over a plurality of signal cycles.
- the plurality of signal cycles may be, for example, a collection of signal cycles in a certain time zone of the day (for example, 8am, 6pm, etc.). It may be collected over one week or one month. That is, the storage unit stores the maximum flow rate for each signal cycle in a certain time zone, or the maximum flow rate for each signal cycle in a certain time zone over one week or one month.
- the display unit displays information related to the representative value of the maximum value stored in the storage unit.
- the representative value can be, for example, an average value, a median value, a mode value, or the like. That is, since the display unit displays the representative value of the past maximum flow rate, it is possible to easily see how much the flow rate has decreased with respect to the past maximum value, and the timing for ending the green signal. Judgment can be easily made.
- the display unit displays that the threshold is equal to or less than the threshold. is there.
- the display unit When the number of vehicles per predetermined time is below a predetermined threshold, the display unit displays that it is below the threshold.
- the predetermined threshold can be a ratio (less than 100%) to the maximum flow rate, for example, 80% of the maximum flow rate, but is not limited thereto. With such a configuration, when the flow rate is maximized and then decreases, it is displayed that the predetermined threshold value or less is displayed. It can be avoided that the end timing of the green light is determined by the individual judgment of a person (for example, a police officer).
- the display unit displays that the number of vehicles per predetermined time is decreased. It is.
- the display unit displays that every time the second time point is updated, if the number of vehicles per predetermined time decreases. That is, the display unit displays that the flow rate is decreasing when the flow rate is decreasing at every update cycle. As a result, even if it is difficult to determine whether or not the flow rate is decreasing only from the image of the vehicle passing near the intersection, it is possible to accurately grasp the decrease in the flow rate.
- the display unit displays that the number of vehicles per predetermined time increases. It is.
- the display unit displays that every time the second time point is updated, the number of vehicles per predetermined time increases. That is, the display unit displays that the flow rate is increasing when the flow rate is increasing at every update cycle. As a result, even if it is difficult to determine whether or not the flow rate is increasing from only the image of the vehicle passing near the intersection, it is possible to accurately grasp the increase in the flow rate.
- the first time point is a start time point of the green light.
- the first time is the start of the green light.
- the specifying unit specifies the number of vehicles passing through a predetermined position between the start time of the green signal for the inflow path and the second time point a plurality of times while updating the second time point until the end of the green signal.
- the time from the start point of the green light to the second time point becomes longer, so even if the number of vehicles passing through the predetermined position fluctuates, it is smoothed for a long time and the flow rate is stabilized. Can be obtained.
- the first time point is a time point that is a first predetermined time before the second time point.
- the first time point is a time point that is a first predetermined time before the second time point.
- the specifying unit specifies the number of vehicles passing through the predetermined position during the first predetermined time period from the second time point a plurality of times while updating the second time point until the end of the green light.
- the first predetermined time can be, for example, 30 seconds, but is not limited thereto.
- the flow rate is obtained based on the number of vehicles passing through the predetermined position for a long time, so that fluctuation of the flow rate can be reduced.
- the display unit displays an image obtained by imaging the inflow path together with information on the number of vehicles per predetermined time. .
- the display unit displays an image obtained by imaging the inflow path along with information on the number of vehicles per predetermined time.
- Information related to the number of vehicles per predetermined time is displayed repeatedly with an update cycle N (seconds), along with images of vehicles passing near the intersection, so that changes in flow rate can be recognized more easily and accurately. can do.
- the display unit displays information related to the number of vehicles per predetermined time after a time longer than the predetermined time from the start time of the green signal. It is like that.
- the display unit displays information related to the number of vehicles per predetermined time after a time longer than the predetermined time from the start of the green light. Since the time from the start of the green light to the predetermined time is in the process of obtaining the number of vehicles per predetermined time, the timing for displaying information relating to the number of vehicles per predetermined time is displayed after a time longer than the predetermined time has elapsed. By doing so, information relating to the number of vehicles per predetermined time can be accurately displayed.
- FIG. 1 is a block diagram illustrating an example of a configuration of an information providing system including the information providing apparatus according to the present embodiment.
- the information providing system includes a portable information processing device 50 as an information providing device, a traffic signal controller 100, signal lamps 201 and 202, a vehicle detector 2, and the like.
- the server 1 is installed in, for example, a traffic control center, and calculates the operation timing of each traffic signal controller for smoothly flowing traffic on the road based on traffic data such as traffic volume or traffic jam information.
- the calculated operation timing is transmitted to the traffic signal controller 100 as operation command information (information relating to signal control including signal control parameters and the like).
- the vehicle detector 2 is installed at a required position (for example, in the vicinity of the stop line) of the inflow path that flows into the intersection, and acquires a predetermined pulse position (for example, the predetermined lane of the inflow path that flows into the intersection by acquiring a sensing pulse signal). , Sensor information such as the number of vehicles passing through the stop line (traffic volume), occupation rate, and the like are calculated, and the calculated sensor information is transmitted to the sensor interface 12 of the traffic signal controller 100.
- an image type vehicle detector 2 equipped with an imaging device is installed in the vicinity of the intersection.
- the image-type vehicle detector 2 obtains sensing pulse signals to calculate sensing information such as traffic volume (number of vehicles) and occupancy rate, and the calculated sensing information is used as a sensor interface 12 of the traffic signal controller 100.
- the image-type vehicle sensor 2 connects video data (including moving images or still images) obtained by imaging each inflow path flowing into the intersection to a network such as Ethernet (registered trademark), for example.
- Ethernet registered trademark
- the ultrasonic vehicle sensor calculates sensing information such as traffic volume and occupancy based on the sensing pulse signal, and transmits the calculated sensing information to the sensor interface 12 and also the ultrasonic vehicle sensing.
- the imaging apparatus installed separately from the device may transmit the captured video data to the portable information processing apparatus 50 via the wireless communication unit 4.
- the traffic signal controller 100 receives sensing information (vehicle sensing information) from the vehicle detector 2 and the communication interface 11 that communicate with the server 1 and the portable information processing device 50 via a network such as the CPU 10 and Ethernet (registered trademark).
- the sensor interface 12 acquires vehicle detection information from the vehicle sensor 2.
- the communication interface 11 receives the operation command information transmitted from the server 1. Further, the communication interface 11 receives a command generated and transmitted by the portable information processing device 50 via the wireless communication unit 4 and the HUB 3. The command transmitted by the portable information processing device 50 is, for example, a command for switching signals. Further, the communication interface 11 transmits the vehicle detection information acquired from the vehicle detector 2 to the server 1 via the HUB 3.
- the CPU 10 or the server 1 sends the traffic information along with the road map information in the target road network, signal information including the stage floor map, intersection identification information and position information in the road network via the HUB 3 and the wireless communication unit 4. Then, the information is transmitted to the portable information processing device 50.
- the timer circuit 13 is driven based on a clock signal (not shown), measures a unit time of a step (for example, 1 second) according to the setting, and outputs a unit time signal (for example, a clock with a period of 1 second) to the step counter 17. To do.
- the CPU 10 Based on the operation command information transmitted from the server 1 or the command transmitted from the portable information processing device 50, the CPU 10 outputs a step command that is a timing signal for switching the color of the signal lamps 201 and 202 to the step counter 14. To send.
- the step command is a command to advance the signal display to the next signal display (advance the step to the next step).
- the step counter 14 sequentially designates the steps of the signal lamps 201 and 202 based on the step command sent from the CPU 10. Specifically, the step counter 14 measures a step based on a step command sent from the CPU 10 and generates a step signal. The step counter 14 outputs the generated step signal to the stage memory reading circuit 16. Note that counting a step means sequentially stepping to the next step while pointing to the current step.
- the stage memory reading circuit 16 reads the signal information stored in the stage memory 15 based on the step signal output from the step counter 14 and outputs the lamp color to each of the signal lamps 201 and 202 based on the read signal information. Do.
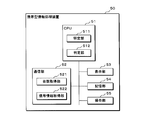
- FIG. 2 is a block diagram showing an example of the configuration of the portable information processing apparatus 50 as the information providing apparatus of the present embodiment.
- the portable information processing device 50 according to the present embodiment is, for example, a mobile phone, a smartphone, a tablet terminal device, a notebook personal computer, or the like.
- the portable information processing device 50 includes a CPU 51, a communication unit 52, a display unit 53, a storage unit 54, an operation unit 55, and the like.
- the CPU 51 includes a specifying unit 511, a determination unit 512, and the like.
- the communication unit 52 includes a number acquisition unit 521, a signal information acquisition unit 522, and the like.
- the communication unit 52 has a communication interface function such as, for example, a wireless LAN and a mobile phone network.
- the communication unit 52 communicates with the traffic signal controller 100, the vehicle detector 2, and the server 1 via the HUB 3 and the wireless communication unit 4. Wireless communication can be performed.
- the portable information processing device 50 and the traffic signal controller 100 may be connected by a cable or the like so as to perform wired communication.
- the communication unit 52 also has a function as an interface for downloading the computer program of the present embodiment from an application server (not shown) on the Internet using a communication interface function such as a wireless LAN or a mobile phone network. Have.
- the storage unit 54 includes an SSD (Solid State Drive) or an HDD (Hard Disk Drive) in addition to the RAM, the ROM, and the like.
- the storage unit 54 can store signal information transmitted by the traffic signal controller 100 and vehicle detection information of the vehicle detector 2.
- the storage unit 54 can store the computer program according to the present embodiment, and the CPU 51 can execute the stored computer program.
- the display unit 53 includes a liquid crystal panel.
- the liquid crystal panel of the display unit 53 is, for example, a touch panel, and the display unit 53 outputs an operation signal to the operation unit 55 by directly operating an icon, button, bar, or the like displayed on the liquid crystal panel with a finger.
- the operation unit 55 analyzes the operation signal and outputs the analysis result to the CPU 51.
- the liquid crystal panel is not limited to a touch panel.
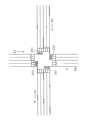
- FIG. 3 is a schematic diagram illustrating an example of an intersection related to information provided by the portable information processing device 50 according to the present embodiment.
- a plurality of inflow paths R1, R2, R3, and R4 flow into the intersection.
- the inflow paths R2 and R4 are inflow paths facing each other, and the signal lamp 201 is provided for the inflow paths R2 and R4.
- the inflow paths R1 and R3 are inflow paths facing each other, and the inflow paths R1 and R3
- a signal lamp 202 is provided.
- Each inflow channel has two lanes on one side, but the number of lanes is not limited to the example of FIG.
- FIG. 3 is an example in the case of left-hand traffic, and in the case of right-hand traffic, the lane is reversed left and right.
- the number acquisition unit 521 acquires the number of vehicles passing through a predetermined position in a predetermined lane of the inflow path flowing into the intersection from the vehicle detector 2 via the wireless communication unit 4.
- the predetermined lane may be any one lane, for example, a typical lane, or a dedicated lane such as a right turn lane or a left turn lane.
- the predetermined lane may be an entire lane.
- the predetermined position can be a stop line before the intersection, but is not limited to the stop line, and may be a point at a required distance from the intersection, for example. In the present embodiment, the predetermined position is described as a stop line.
- the signal information acquisition unit 522 acquires signal information of the intersection via the wireless communication unit 4.
- the signal information includes information such as a switching order of each signal display such as a blue signal, a yellow signal, and a red signal, and a display time of each signal display.
- the identifying unit 511 identifies the number of vehicles passing through the stop line between the first time point and the second time point after the start of the green signal for the inflow path, while updating the second time point until the end of the green signal.
- M seconds
- N seconds
- the specifying unit 511 performs the past M ( Number of vehicles passing the stop line in seconds).
- the display unit 53 displays information on the number of vehicles per predetermined time passing the stop line based on the number of vehicles specified by the specifying unit 511 every time the second time point is updated under the control of the CPU 51.
- the number of vehicles per predetermined time includes the flow rate.
- the number of vehicles per predetermined time can be, for example, the number of vehicles per 30 seconds.
- the flow rate can be obtained by converting the number of vehicles per predetermined time, for example, per second or per hour.
- the information related to the number of vehicles per predetermined time can be information that can read “the number of vehicles per predetermined time (including flow rate)” regardless of the display mode.
- Information may be displayed as an analog meter, for example, in a bar format such as a bar graph, or may be displayed as a digital meter. Further, the indicator lamp may be turned on.
- information related to the number of vehicles per predetermined time is repeatedly updated and displayed at the update cycle N (seconds), so that an increase or decrease in the flow rate can be easily recognized. be able to.
- N seconds
- it can be used as an indicator of how much the information relating to the flow rate is reduced to determine the end timing of the green signal, so that it is possible to provide information for determining the timing to end the green signal.
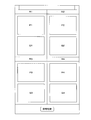
- FIG. 4 is a schematic diagram illustrating an example of a screen displayed on the display unit 53 of the portable information processing device 50 according to the present embodiment.
- FIG. 4 corresponds to the intersection illustrated in FIG. That is, the screen is divided into four parts for each of the inflow paths R1, R2, R3, and R4.
- the inflow path R1 an image of a vehicle traveling on the inflow path R1 is displayed at a position indicated by reference numeral P1, and information relating to the number of vehicles per predetermined time is displayed at a position indicated by reference numeral G1.
- the signal can be switched manually by operating the “signal switch” icon or button. For example, if it is determined that it is the end timing of the green light and the “signal switch” icon or button is operated, the green light is interrupted.
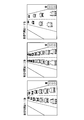
- FIG. 5 is a schematic diagram illustrating an example of a vehicle image displayed on the display unit 53 of the portable information processing device 50 according to the present embodiment.
- FIG. 5 shows an image of a vehicle traveling on an inflow path including a stop line (any one of R1 to R4).
- the video shown in FIG. 5 is displayed at the locations indicated by the symbols P1 to P4 illustrated in FIG.
- the video may be a moving image or a still image having a predetermined cycle (for example, 0.5 seconds, 1 second, etc.).
- FIG. 5 schematically shows three images for convenience.
- the diagram on the left shows a state after t1 (seconds) from the start of the green light, and shows a state where the number of vehicles traveling on the inflow path is slightly large.
- the middle figure shows a state after t2 (second, t2> t1) from the start of the green light, and shows a state where the number of vehicles traveling on the inflow path is larger.
- the figure on the right shows a state after t3 (second, t3> t2) from the start of the green light, and shows a state where the number of vehicles traveling on the inflow path has slightly decreased after the peak.
- the video shown in FIG. 5 is displayed for each inflow path from the start to the end of the green signal.
- the present signal lamp color with respect to an inflow path can also be displayed.
- FIG. 6 is a schematic diagram showing a first example of information relating to the number of vehicles per predetermined time displayed on the display unit 53 of the portable information processing device 50 of the present embodiment.
- the display shown in FIG. 6 is displayed at the locations indicated by the symbols G1 to G4 illustrated in FIG.
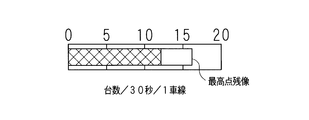
- information related to the number of vehicles per predetermined time is represented as the number of vehicles per 30 seconds (number of vehicles / 30 seconds / 1 lane) per lane.
- the information on the number of vehicles per predetermined time can be displayed like an analog speedometer of a car.
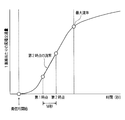
- FIG. 7 is an explanatory diagram showing an example of the relationship between the accumulated traffic volume after the start of the green light and the flow rate.
- the horizontal axis indicates time (seconds), and the vertical axis indicates the accumulated traffic volume per lane.
- Data vehicle sensing information
- the portable information processing device 50 receives the data and signal information (including the start time of the green light) collected by the vehicle sensor 2, thereby (1) cumulative traffic volume from the start of the green light, and (2) past M Information such as traffic volume per second can be obtained.
- Cumulative traffic is the cumulative number of vehicles that have passed the measurement point in the time after the measurement start time, and is the sum of all the values passing through the stop line divided by the ⁇ cross-section cumulative traffic volume '', the number of lanes, or The total of the measured values in the representative lane is called “cumulative traffic per lane”.
- the flow rate is the slope of a curve indicating the accumulated traffic volume.
- the measurement start time is the start time of the yellow signal before the blue signal, that is, in the case of a crossing intersection, the start time of the yellow signal on the crossing side (the previous yellow floor) (yellow signal start point) and the green signal
- starting time green light starting point
- the value of the yellow signal starting point is an index indicating the processing efficiency in the direction including the loss time (time when the vehicle cannot pass the intersection) at the time of signal switching.
- the value of the starting point is an index representing the processing efficiency in the direction in the green signal. In the following description, the green signal starting point is used.
- the number of vehicles passing through the stop line gradually increases from the start of the green light, and the slope of the cumulative traffic curve increases.
- the number of vehicles passing through the stop line decreases and the slope of the cumulative traffic curve starts to decrease, so the flow rate starts to increase and then decreases to the maximum value (maximum flow rate). .
- the maximum flow rate appears just before the processing efficiency begins to drop.
- the specifying unit 511 updates the number of vehicles passing through the stop line between the first time point and the second time point after the start of the green signal for the inflow path while updating the second time point until the end of the green signal. Specify multiple times.
- the time from the first time point to the second time point is represented by M (seconds)
- the update period of the second time point is represented by N (seconds)
- the specifying unit 511 performs the past M ( Number of vehicles passing the stop line in seconds).
- the slope of the straight line connecting the cumulative traffic value at the first time point and the cumulative traffic value at the second time point is the flow rate at the second time point, that is, from the second time point. Represents the slope of traffic volume for the past M seconds. Assuming the number of vehicles (traffic volume) V in the past M seconds, the flow rate is V / M (number of vehicles / second).
- the flow rate increases until the maximum flow rate point (the maximum number of vehicles per predetermined time), and the flow rate starts decreasing when the maximum flow rate point is exceeded.
- police officers can determine when to stop green light while recognizing such changes in flow rates, and can provide clear criteria that do not rely on the individual police officer's subjectivity. For example, if the maximum flow rate A is recorded once and then the flow rate is once decreased and then increased again and a new maximum flow rate B is recorded, according to the change in traffic volume, the B is the maximum flow rate point. And As a result, the maximum flow rate point can be set to the maximum value in the target cycle from the start of the blue signal to the end of the green signal.
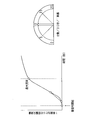
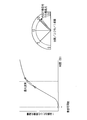
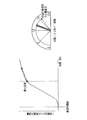
- FIGS. 8 to 12 are schematic views showing a first example of visualization by the portable information processing device 50 according to the present embodiment.
- the visualization examples shown in FIGS. 8 to 12 are the same as those illustrated in FIG.
- the left diagram shows the change in the cumulative traffic volume per lane, and also shows the change in the flow rate on the curve representing the cumulative traffic volume.
- the time M between the first time point and the second time point is 30 seconds.
- the diagrams on the right side show display examples of information related to the number of vehicles per predetermined time.
- N 1 to 5 seconds
- the example in the figure shows the number of vehicles per 30 seconds per lane, and V represents the traffic volume (number of vehicles) for M seconds.
- V represents the traffic volume (number of vehicles) for M seconds.
- a value of V / M (number / second) or V / M ⁇ 3600 (number / hour) may be displayed.
- the example in FIG. 8 shows a state 30 seconds after the start of the green light, and shows the number of vehicles in the past 30 seconds.
- the number of vehicles (flow rate) per predetermined time is relatively small.
- the example of FIG. 9 shows a state at the time when a plurality of update cycles N have passed.
- the number of vehicles (flow rate) per predetermined time is increasing.
- the needle color can be displayed in green.
- the display unit 53 displays an increase when the number of vehicles per predetermined time increases every time the second time point is updated under the control of the CPU 51. That is, the display unit 53 displays that the flow rate is increasing when the flow rate is increasing at every update cycle. As a result, even if it is difficult to determine whether or not the flow rate is increasing from only the image of the vehicle passing near the intersection, it is possible to accurately grasp the increase in the flow rate.
- the example in FIG. 10 shows a state when a plurality of update cycles N have passed.
- the number of vehicles (flow rate) per predetermined time is the maximum.
- FIG. 11 shows a state when a plurality of update cycles N have passed.
- the number of vehicles (flow rate) per predetermined time is decreasing from the maximum value.
- an afterimage of the highest point (maximum value of vehicle number, maximum flow rate) is displayed as shown in FIG.
- the police officer can compare the afterimage of the highest point (the highest point in the current green light) with the current value, and therefore can accurately determine the timing at which the green light is terminated. Further, when the current value is less than 90% with respect to the highest point, the needle is changed from green to yellow, for example. The police officer can determine that the current value is decreasing, and can predict that it will soon be the timing at which the green light will stop.
- the display unit 53 displays a decrease when the number of vehicles per predetermined time decreases every time the second time point is updated under the control of the CPU 51. That is, the display unit 53 displays that the flow rate is decreasing when the flow rate is decreasing at every update cycle. As a result, even if it is difficult to determine whether or not the flow rate is decreasing only from the image of the vehicle passing near the intersection, it is possible to accurately grasp the decrease in the flow rate.
- FIG. 12 shows a state when a plurality of update cycles N have further passed.
- the number of vehicles (flow rate) per predetermined time is further decreasing.
- the needle is changed from, for example, yellow to red.
- the police officer can determine that the current value is the timing at which the green light is terminated.
- a decrease in the flow rate of the police officer may be noticed by blinking a semicircular needle plate or outputting a voice.
- the display unit 53 displays the information satisfying the predetermined condition among the information related to the number of vehicles per predetermined time displayed every time the second time is updated under the control of the CPU 51 until the predetermined time. continue.
- the information that satisfies the predetermined condition can be, for example, information when the number of vehicles per predetermined time is maximum, that is, the maximum flow rate.
- the predetermined time point is a time point when the green signal ends after the green signal starts.
- the determination unit 512 determines the case where the number of vehicles per predetermined time is maximum between the start of the green signal and the end of the green signal as the above-described predetermined condition. As a result, it is possible to easily recognize how much the flow rate has decreased with respect to the maximum value, and it is possible to easily determine the timing for ending the green light.
- the display unit 53 displays that the number of vehicles per predetermined time is equal to or lower than the threshold when the number of vehicles per predetermined time is equal to or lower than the predetermined threshold under the control of the CPU 51.
- the predetermined threshold can be a predetermined ratio (less than 100%) with respect to the maximum flow rate, for example, 80% of the maximum flow rate, but is not limited thereto. With this configuration, as illustrated in FIG. 12, when the flow rate becomes maximum and then decreases, it is displayed that the flow rate is below a predetermined threshold value.
- the first time point is a time point that is a first predetermined time (M seconds) before the second time point. That is, the specifying unit 511 specifies the number of vehicles passing through a predetermined position during the past first predetermined time (past M seconds) from the second time point a plurality of times while updating the second time point until the end of the green light.
- the first predetermined time M can be set to, for example, 30 seconds in order to suppress fluctuations in traffic, but is not limited to this.
- the flow rate is obtained based on the number of vehicles passing through the predetermined position in a short time, so that the fluctuation of the flow rate can be increased.
- the first predetermined time (M seconds) is lengthened, the flow rate is obtained based on the number of vehicles passing through the predetermined position over a long time, so that fluctuations in the flow rate can be reduced.
- the display unit 53 displays an image obtained by imaging the inflow path together with information on the number of vehicles per predetermined time.
- Information related to the number of vehicles per predetermined time is displayed repeatedly with an update cycle N (seconds), along with images of vehicles passing near the intersection, so that changes in flow rate can be recognized more easily and accurately. can do.
- the display unit 53 displays information related to the number of vehicles per predetermined time after elapse of a time longer than the predetermined time from the start of the green light. Since the time from the start of the green light to the predetermined time is in the process of obtaining the number of vehicles per predetermined time, the timing for displaying information relating to the number of vehicles per predetermined time is displayed after a time longer than the predetermined time has elapsed. By doing so, information relating to the number of vehicles per predetermined time can be accurately displayed.
- the maximum value of the number of vehicles per predetermined time (that is, the maximum flow rate) is displayed as the highest afterimage until the end of the green light, but the maximum number of vehicles (
- the maximum flow rate is not limited to a value in real time. For example, past experience values can be displayed.
- FIG. 13 is a schematic diagram showing a second example of visualization by the portable information processing apparatus 50 of the present embodiment.
- the highest point in the current green signal and the representative value of the highest point in the past green signal are displayed.
- the storage unit 54 stores the maximum value of the number of vehicles per predetermined time passing through a predetermined position between the start of the green signal and the end of the green signal over a plurality of signal cycles.
- the plurality of signal cycles may be, for example, a collection of signal cycles in a certain time zone of the day (for example, 8am, 6pm, etc.). It may be collected over one week or one month. That is, the memory
- the display unit 53 displays information related to the representative value of the maximum value stored in the storage unit 54 under the control of the CPU 51.
- the representative value can be, for example, an average value, a median value, a mode value, or the like. That is, since the display unit 53 displays the representative value of the past maximum flow rate, it is possible to easily see how much the current flow rate has decreased with respect to the past maximum value, and the green signal is terminated. It is possible to easily determine the timing to be performed. In the example of FIG. 13, the highest point in the current green signal and the representative value of the highest point in the past green signal are displayed, but only the representative value of the highest point in the past green signal may be displayed. Good.
- FIG. 14 is a schematic diagram showing a third example of visualization by the portable information processing apparatus 50 of the present embodiment.
- the number of vehicles per predetermined time (including the flow rate) is displayed by a semicircular graph without displaying the hands.
- the number of vehicles per predetermined time increases, it is displayed in green and the afterimage of the highest point is continuously displayed until the end of the green signal.
- the number of vehicles per predetermined time falls below 90% of the highest point, it changes from green to yellow, and when it falls below 80% of the highest point, it changes from yellow to red, The same effect as in the first embodiment can be obtained.
- FIG. 15 is a schematic diagram showing a fourth example of visualization by the portable information processing device 50 of the present embodiment.
- the number of vehicles (including the flow rate) per predetermined time is displayed by a bar graph (bar format).
- the bar graph bar format
- the bar is displayed in green and the highest afterimage is continuously displayed until the end of the green signal.
- the bar is changed from green to yellow, and if it falls below 80% of the maximum score, the bar is changed from yellow to red. To do. Thereby, the same effect as in the first embodiment can be obtained.
- the number of vehicles per unit time is displayed like an analog meter.
- the present invention is not limited to this.
- the maximum number and the current number of vehicles (including the flow rate) per predetermined time may be displayed as digital values.
- the number of vehicles per predetermined time increases, the number is displayed in green and the highest afterimage is continuously displayed until the end of the green signal.
- the number of vehicles per given time falls below 90% of the maximum score, the number will be changed from green to yellow, and if it falls below 80% of the maximum score, the number will be changed from yellow to red. To do. Thereby, the same effect as in the first embodiment can be obtained.
- FIG. 16 is a schematic diagram showing a fifth example of visualization by the portable information processing device 50 of the present embodiment.
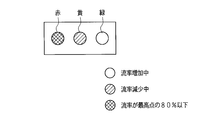
- the display unit 53 includes an indicator lamp such as a light bulb or an LED, and can emit red, yellow, and green light.
- the green indicator light is turned on, and when the number of vehicles per predetermined time decreases, the yellow indicator light is turned on. Further, when the number of vehicles per predetermined time falls below 80% of the maximum point, a red indicator lamp is turned on. Thereby, the same effect as in the first embodiment can be obtained.
- a configuration including only red and yellow indicator lights or a configuration including only a red indicator lamp may be employed. Thereby, it can be set as a simpler structure. Further, when the number of vehicles per predetermined time falls below 75% of the maximum score, the red indicator lamp may be blinked and the luminance may be increased. This can alert police officers.
- the specifying unit 511 updates the number of vehicles passing through the stop line between the first time point and the second time point after the start of the green signal for the inflow path until the second time point is reached until the end of the green signal.
- the first time point is a time point that is a first predetermined time (M seconds) before the second time point, but is not limited thereto.
- the first time point may be fixed to the start time point of the green light.
- FIG. 17 is an explanatory diagram showing another example of the relationship between the accumulated traffic volume and the flow rate after the start of the green light.
- the first time point is the start time point of the green light. That is, the specifying unit 511 specifies the number of vehicles passing through a predetermined position between the start time point of the green signal for the inflow path and the second time point a plurality of times while updating the second time point until the end of the green signal. Each time the second time point is updated, the time from the start point of the green light to the second time point becomes longer, so even if the number of vehicles passing through the predetermined position fluctuates, it is smoothed for a long time and the flow rate is stabilized. Can be obtained.
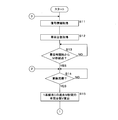
- FIGS. 18 and 19 are flowcharts illustrating an example of a processing procedure of the portable information processing device 50 according to the present embodiment.
- the processing subject will be described as the CPU 51.
- CPU51 acquires signal information (S11), and acquires the number of vehicles which pass the stop line of an intersection (S12).
- the CPU 51 determines whether or not M seconds (for example, 30 seconds) have elapsed since the start of the green signal (S13). If M seconds have not elapsed (NO in S13), the process of step S13 is continued.
- step S14 Continue processing.
- the CPU 51 calculates the number of vehicles V that have passed the stop line in the past M seconds per lane (S15).
- the CPU 51 determines whether or not the vehicle number V is equal to or greater than the maximum number Vm (S16).
- the number maximum value Vm is the maximum value of the number V of vehicles that have passed the stop line in the past M seconds, and the initial value is 0. If V ⁇ Vm (YES in S16), the CPU 51 assumes that the number of vehicles V has increased, sets the number of vehicles V to the maximum number of vehicles Vm (S17), displays the number of vehicles V in green (S18), Step S22 described later is performed.
- V ⁇ Vm is not satisfied (NO in S16)
- the CPU 51 determines whether or not V> Vm ⁇ 0.8 (S19), and if V> Vm ⁇ 0.8 (YES in S19), the vehicle Assuming that the number of vehicles V starts to decrease beyond the maximum value, an afterimage of the maximum number of vehicles Vm is left, the number of vehicles V is displayed in yellow (S20), and the process of step S22 described later is performed.
- V> Vm ⁇ 0.8 is not satisfied (NO in S19)
- the CPU 51 leaves an afterimage of the maximum number of vehicles Vm, displays the number of vehicles V in red (S21), and performs the process of step S22 described later.
- the CPU 51 determines whether or not the green signal has ended (S22). If the green signal has not ended (NO in S22), the processing after step S14 is continued.
- the CPU 51 deletes the number display (S23), sets the maximum number Vm to 0 (S24), and determines whether or not to end the process (S25). If the process is not terminated (NO in S25), the CPU 21 continues the process from step S11 onward, and if it is determined that the process is terminated (YES in S25), the process is terminated.
- the information providing apparatus of the present embodiment can also be realized using a general-purpose computer equipped with a CPU (processor), a RAM, and the like. That is, as shown in FIG. 18 and FIG. 19, a computer program that defines the procedure of each process (method steps executed by the CPU) is loaded into a RAM provided in the computer, and the computer program is executed by the CPU (processor). By doing so, an information providing apparatus can be realized on a computer.
- a general-purpose computer equipped with a CPU (processor), a RAM, and the like. That is, as shown in FIG. 18 and FIG. 19, a computer program that defines the procedure of each process (method steps executed by the CPU) is loaded into a RAM provided in the computer, and the computer program is executed by the CPU (processor).
- the computer program that defines the steps of the method executed by the CPU as shown in FIGS. 18 and 19 can be recorded on a non-transitory recording medium that can be read by the computer.
- the processing shown in FIGS. 18 and 19 can be performed for each of the inflow paths facing each other at the intersection (for example, the upward direction and the downward direction).
- a threshold value for example, 80% of the highest point
- the determination may be made with priority given to the one having a large traffic volume in the upward direction and the downward direction.
- the portable information processing device 50 performs the traffic signal control by performing the processes from step S11 to step S17, step S19, etc. in the traffic signal controller 100 or the server 1.
- the information received from the machine 100 or the server 1 may be displayed.
- the number of vehicles per predetermined time is a numerical value per lane, but is not limited to this, and is the total value of all the lanes of the inflow channel. Also good. Moreover, although the numerical value was demonstrated as the traffic volume per 30 seconds, it can also be shown per second or per hour. In this case, for example, 15 units / 30 seconds corresponds to 0.5 units / second and 1800 units / hour.
- Portable information processing device 51
- CPU 511
- Identification unit 512
- Communication unit 521
- Number acquisition unit 522
- Signal information acquisition unit 53
- Display unit 54
- Operation unit 100
Landscapes
- Physics & Mathematics (AREA)
- General Physics & Mathematics (AREA)
- Traffic Control Systems (AREA)
Abstract
青信号を終了させるタイミングを判断するための情報を提供する情報提供装置、コンピュータプログラム、コンピュータプログラムを記録した記録媒体及び情報提供方法を提供する。 情報提供装置は、交差点に流入する流入路の所定車線の所定位置を通過する車両台数を取得する台数取得部と、交差点の信号情報を取得する信号情報取得部と、流入路に対する青信号の開始以降の第1時点から第2時点までの間に所定位置を通過する車両台数を、第2時点を当該青信号の終了まで更新しつつ複数回特定する特定部と、第2時点を更新する都度、特定した車両台数に基づいて所定位置を通過する所定時間当たりの車両台数に係る情報を表示する表示部とを備える。
Description
本発明は、所定位置を通過する車両の台数に係る情報を提供する情報提供装置、該情報提供装置を実現するためのコンピュータプログラム、該コンピュータプログラムを記録した記録媒体及び情報提供方法に関する。
交通信号制御機は、各信号灯器の信号表示(ステップ)の灯色を定めた灯色情報、各灯色の表示時間などを含むステップ情報に基づいて、各信号灯器の信号表示を切り替える。このような交通信号制御機には、道路上に設置された車両感知器で収集される交通量又は渋滞長などの交通データに基づいて、交通管制センタ又は交通信号制御機が信号灯器の適切な表示時間を計算して、信号灯器の信号表示を順次切り替える自動制御方式がある。
また、交通信号制御機には、上述の自動制御方式が採用されていない交差点においても円滑な交通を維持するため、例えば、警察官等が信号の変更タイミングを判断し、手動操作により信号灯器の信号表示を順次切り替えるマニュアル制御方式がある。
また、所定の信号表示(ステップ)で手動歩進操作を受け付けた場合、当該信号表示の歩進時点を決定し、決定した信号表示の後の残りの信号表示を順次自動歩進すべく制御する半自動制御部を備えることにより、自動制御方式及びマニュアル制御方式それぞれの長所を生かして渋滞の軽減を図ることができる交通信号制御機が開示されている(特許文献1参照)。
しかし、国や地域によっては、交差点での交通量がピークとなるような時間帯(例えば、朝夕の時間帯など)において、依然として警察官による手動操作(マニュアル制御)が実施されている。交差点には、モニタ用のCCTVカメラ又は交通量計測用の画像感知器などが設置されており、警察官は、交差点付近の映像を見ながら信号の切り替えタイミングを判断する。しかし、映像を確認することができたとしても、いつのタイミングで交通量が少なくなったのか、すなわち青信号を終了させるタイミングの判断は、個々の警察官の主観によるところが多く、明確な指標は存在しない。
本発明は、斯かる事情に鑑みてなされたものであり、青信号を終了させるタイミングを判断するための情報を提供する情報提供装置、該情報提供装置を実現するためのコンピュータプログラム、該コンピュータプログラムを記録した記録媒体及び情報提供方法を提供することを目的とする。
(1)本発明の実施の形態に係る情報提供装置は、交差点に流入する流入路の所定車線の所定位置を通過する車両台数を取得する台数取得部と、前記交差点の信号情報を取得する信号情報取得部と、前記流入路に対する青信号の開始以降の第1時点から第2時点までの間に前記所定位置を通過する車両台数を、前記第2時点を該青信号の終了まで更新しつつ複数回特定する特定部と、前記第2時点を更新する都度、前記特定部で特定した車両台数に基づいて前記所定位置を通過する所定時間当たりの車両台数に係る情報を表示する表示部とを備える。
(12)本発明の実施の形態に係るコンピュータプログラムは、コンピュータに車両台数に係る情報を提供させるためのコンピュータプログラムであって、コンピュータを、交差点に流入する流入路の所定車線の所定位置を通過する車両台数を取得する台数取得部と、前記交差点の信号情報を取得する信号情報取得部と、前記流入路に対する青信号の開始以降の第1時点から第2時点までの間に前記所定位置を通過する車両台数を、前記第2時点を該青信号の終了まで更新しつつ複数回特定する特定部と、前記第2時点を更新する都度、特定した車両台数に基づいて前記所定位置を通過する所定時間当たりの車両台数に係る情報を表示部に表示すべく生成する生成部として機能させる。
(13)本発明の実施の形態に係る記録媒体は、コンピュータに車両台数に係る情報を提供させるためのコンピュータプログラムを記録したコンピュータでの読み取りが可能な非一時的な記録媒体であって、前記コンピュータプログラムは、コンピュータを、交差点に流入する流入路の所定車線の所定位置を通過する車両台数を取得する台数取得部と、前記交差点の信号情報を取得する信号情報取得部と、前記流入路に対する青信号の開始以降の第1時点から第2時点までの間に前記所定位置を通過する車両台数を、前記第2時点を該青信号の終了まで更新しつつ複数回特定する特定部と、前記第2時点を更新する都度、特定した車両台数に基づいて前記所定位置を通過する所定時間当たりの車両台数に係る情報を表示部に表示すべく生成する生成部として機能させる。
(14)本発明の実施の形態に係る情報提供方法は、交差点に流入する流入路の所定車線の所定位置を通過する車両台数を台数取得部が取得するステップと、前記交差点の信号情報を信号情報取得部が取得するステップと、前記流入路に対する青信号の開始以降の第1時点から第2時点までの間に前記所定位置を通過する車両台数を、前記第2時点を該青信号の終了まで更新しつつ複数回特定部が特定するステップと、前記第2時点を更新する都度、特定された車両台数に基づいて前記所定位置を通過する所定時間当たりの車両台数に係る情報を表示部が表示するステップとを含む。
本発明によれば、青信号を終了させるタイミングを判断するための情報を提供することができる。
[本願発明の実施形態の説明]
(1)本発明の実施の形態に係る情報提供装置は、交差点に流入する流入路の所定車線の所定位置を通過する車両台数を取得する台数取得部と、前記交差点の信号情報を取得する信号情報取得部と、前記流入路に対する青信号の開始以降の第1時点から第2時点までの間に前記所定位置を通過する車両台数を、前記第2時点を該青信号の終了まで更新しつつ複数回特定する特定部と、前記第2時点を更新する都度、前記特定部で特定した車両台数に基づいて前記所定位置を通過する所定時間当たりの車両台数に係る情報を表示する表示部とを備える。
(1)本発明の実施の形態に係る情報提供装置は、交差点に流入する流入路の所定車線の所定位置を通過する車両台数を取得する台数取得部と、前記交差点の信号情報を取得する信号情報取得部と、前記流入路に対する青信号の開始以降の第1時点から第2時点までの間に前記所定位置を通過する車両台数を、前記第2時点を該青信号の終了まで更新しつつ複数回特定する特定部と、前記第2時点を更新する都度、前記特定部で特定した車両台数に基づいて前記所定位置を通過する所定時間当たりの車両台数に係る情報を表示する表示部とを備える。
(12)本発明の実施の形態に係るコンピュータプログラムは、コンピュータに車両台数に係る情報を提供させるためのコンピュータプログラムであって、コンピュータを、交差点に流入する流入路の所定車線の所定位置を通過する車両台数を取得する台数取得部と、前記交差点の信号情報を取得する信号情報取得部と、前記流入路に対する青信号の開始以降の第1時点から第2時点までの間に前記所定位置を通過する車両台数を、前記第2時点を該青信号の終了まで更新しつつ複数回特定する特定部と、前記第2時点を更新する都度、特定した車両台数に基づいて前記所定位置を通過する所定時間当たりの車両台数に係る情報を表示部に表示すべく生成する生成部として機能させる。
(13)本発明の実施の形態に係る記録媒体は、コンピュータに車両台数に係る情報を提供させるためのコンピュータプログラムを記録したコンピュータでの読み取りが可能な非一時的な記録媒体であって、前記コンピュータプログラムは、コンピュータを、交差点に流入する流入路の所定車線の所定位置を通過する車両台数を取得する台数取得部と、前記交差点の信号情報を取得する信号情報取得部と、前記流入路に対する青信号の開始以降の第1時点から第2時点までの間に前記所定位置を通過する車両台数を、前記第2時点を該青信号の終了まで更新しつつ複数回特定する特定部と、前記第2時点を更新する都度、特定した車両台数に基づいて前記所定位置を通過する所定時間当たりの車両台数に係る情報を表示部に表示すべく生成する生成部として機能させる。
(14)本発明の実施の形態に係る情報提供方法は、交差点に流入する流入路の所定車線の所定位置を通過する車両台数を台数取得部が取得するステップと、前記交差点の信号情報を信号情報取得部が取得するステップと、前記流入路に対する青信号の開始以降の第1時点から第2時点までの間に前記所定位置を通過する車両台数を、前記第2時点を該青信号の終了まで更新しつつ複数回特定部が特定するステップと、前記第2時点を更新する都度、特定された車両台数に基づいて前記所定位置を通過する所定時間当たりの車両台数に係る情報を表示部が表示するステップとを含む。
台数取得部は、交差点に流入する流入路の所定車線の所定位置を通過する車両台数を取得する。所定車線は、流入路に車線が複数ある場合、任意の1車線でよく、例えば、代表的な車線でもよく、右折専用車線又は左折専用車線などの専用車線でもよい。また、所定車線は、全車線でもよい。所定位置は、交差点手前の停止線又は交差点から所要距離の地点とすることができる。台数取得部は、例えば、交差点の停止線付近に設置された車両感知器から車両台数を取得することができる。
信号情報取得部は、交差点の信号情報を取得する。信号情報は、青信号、黄信号、赤信号などの各信号表示の切替順序、各信号表示の表示時間などの情報を含む。
特定部は、流入路に対する青信号の開始以降の第1時点から第2時点までの間に所定位置を通過する車両台数を、第2時点を該青信号の終了まで更新しつつ複数回特定する。第1時点から第2時点までの間の時間をM(秒)で表し、第2時点の更新周期をN(秒)で表すと、特定部は、N(秒)の都度、過去M(秒)間に所定位置(例えば、停止線)を通過する車両台数を特定する。
表示部は、第2時点を更新する都度、特定部で特定した車両台数に基づいて所定位置を通過する所定時間当たりの車両台数に係る情報を表示する。所定時間当たりの車両台数は、流率も含む。所定時間当たりの車両台数は、例えば、30秒当たりの車両台数とすることができる。所定時間当たりの車両台数を、例えば、1秒当たり、あるいは1時間当たりに換算することにより、流率を求めることができる。情報の表示は、例えば、アナログメータの如く表示してよく、棒グラフのようなバー形式で表示してよく、デジタルメータの如く表示してもよい。また、表示灯を点灯させるようにしてもよい。
上述の構成により、所定時間当たりの車両台数に係る情報が、更新周期N(秒)で繰り返し更新されて表示されるので、流率の増減を容易に認識することができる。特に、所定時間当たりの車両台数に係る情報がどの程度まで減少すれば青信号の終了タイミングとするかの指標とすることができるので、青信号を終了させるタイミングを判断するための情報を提供することができる。
(2)本発明の実施の形態に係る情報提供装置は、前記表示部は、前記第2時点を更新する都度表示する情報のうち、所定条件を充足する情報の表示を所定時点まで継続するようにしてある。
表示部は、第2時点を更新する都度表示する情報のうち、所定条件を充足する情報の表示を所定時点まで継続する。所定条件を充足する情報とは、例えば、所定時間当たりの車両台数が最大となるときの情報、すなわち最大流率とすることができる。所定時点は、青信号が開始された後、当該青信号が終了する時点である。すなわち、青信号の開始以降、流率が増加し、一旦最大となった後に減少するような場合、最大流率を示す情報の表示を青信号終了まで継続する。かかる構成により、時間の経過とともに、流率が一旦最大値となった後に減少する場合に、流率が最大値に対してどの程度減少しているかを容易に視認することができ、青信号を終了させるタイミングを容易に判断することが可能となる。
(3)本発明の実施の形態に係る情報提供装置は、前記青信号の開始以降該青信号の終了までの間に前記所定時間当たりの車両台数が最大となる場合を前記所定条件として判定する判定部を備える。
判定部は、青信号の開始以降、当該青信号の終了までの間に、所定時間当たりの車両台数が最大となる場合を所定条件として判定する。これにより、流率が最大値に対してどの程度減少しているかを容易に視認することができ、青信号を終了させるタイミングを容易に判断することが可能となる。
(4)本発明の実施の形態に係る情報提供装置は、前記青信号の開始以降該青信号の終了までの間に前記所定位置を通過する所定時間当たりの車両台数の最大値を複数の信号サイクルに亘って記憶する記憶部を備え、前記表示部は、前記記憶部に記憶した最大値の代表値に係る情報を表示するようにしてある。
記憶部は、青信号の開始以降、当該青信号の終了までの間に所定位置を通過する所定時間当たりの車両台数の最大値を複数の信号サイクルに亘って記憶する。複数の信号サイクルは、例えば、1日のうちのある時間帯(例えば、午前8時台、午後6時台など)での信号サイクルを収集したものでもよく、1日の同じ時間帯を、例えば、1週間又は1か月に亘って収集したものでもよい。すなわち、記憶部は、ある時間帯の信号サイクル毎の最大流率、あるいは1週間又は1か月に亘ってある時間帯の信号サイクル毎の最大流率を記憶する。
表示部は、記憶部に記憶した最大値の代表値に係る情報を表示する。代表値は、例えば、平均値、中央値、最頻値などとすることができる。すなわち、表示部は、過去の最大流率の代表値を表示するので、流率が過去の最大値に対してどの程度減少しているかを容易に視認することができ、青信号を終了させるタイミングを容易に判断することが可能となる。
(5)本発明の実施の形態に係る情報提供装置は、前記表示部は、前記所定時間当たりの車両台数が所定の閾値以下となった場合、閾値以下となった旨を表示するようにしてある。
表示部は、所定時間当たりの車両台数が所定の閾値以下となった場合、閾値以下となった旨を表示する。所定の閾値は、最大流率に対する割合(100%未満)とすることができ、例えば、最大流率の80%とすることができるが、これに限定されない。かかる構成により、流率が最大となった後、減少する場合に所定の閾値以下となったことを表示するので、所定の閾値以下となった時点を青信号の終了タイミングと定めておくことにより、人(例えば、警察官)の個々の判断によって青信号の終了タイミングが決定されることを回避することができる。
(6)本発明の実施の形態に係る情報提供装置は、前記表示部は、前記第2時点を更新する都度、前記所定時間当たりの車両台数が減少する場合、減少する旨を表示するようにしてある。
表示部は、第2時点を更新する都度、所定時間当たりの車両台数が減少する場合、減少する旨を表示する。すなわち、表示部は、更新周期の都度、流率が減少している場合には、減少している旨を表示する。これにより、交差点付近を通過する車両の映像だけでは、流率が減少しているか否かを判断することが困難な場合でも、流率の減少を的確に把握することができる。
(7)本発明の実施の形態に係る情報提供装置は、前記表示部は、前記第2時点を更新する都度、前記所定時間当たりの車両台数が増加する場合、増加する旨を表示するようにしてある。
表示部は、第2時点を更新する都度、所定時間当たりの車両台数が増加する場合、増加する旨を表示する。すなわち、表示部は、更新周期の都度、流率が増加している場合には、増加している旨を表示する。これにより、交差点付近を通過する車両の映像だけでは、流率が増加しているか否かを判断することが困難な場合でも、流率の増加を的確に把握することができる。
(8)本発明の実施の形態に係る情報提供装置は、前記第1時点は、前記青信号の開始時点である。
第1時点は、青信号の開始時点である。すなわち、特定部は、流入路に対する青信号の開始時点から第2時点までの間に所定位置を通過する車両台数を、第2時点を当該青信号の終了まで更新しつつ複数回特定する。第2時点の更新の都度、青信号の開始時点から第2時点までの時間は長くなるので、所定位置を通過する車両台数が変動する場合でも、長い時間の間で平滑化され、流率を安定して求めることができる。
(9)本発明の実施の形態に係る情報提供装置は、前記第1時点は、前記第2時点より第1所定時間前の時点である。
第1時点は、第2時点より第1所定時間前の時点である。すなわち、特定部は、第2時点から過去第1所定時間の間に所定位置を通過する車両台数を、第2時点を当該青信号の終了まで更新しつつ複数回特定する。なお、第1所定時間は、例えば、30秒とすることができるが、これに限定されるものではない。第1所定時間を短くした場合、短い時間の間に所定位置を通過する車両台数に基づいて流率が求められるので、流率の変動を大きくすることができる。一方で、第1所定時間を長くした場合、長い時間の間に所定位置を通過する車両台数に基づいて流率が求められるので、流率の変動を小さくすることができる。かかる構成により、交差点に流入する流入路の交通量に応じて、流率の変化を容易に認識できるようにすることが可能となる。
(10)本発明の実施の形態に係る情報提供装置は、前記表示部は、前記所定時間当たりの車両台数に係る情報とともに前記流入路を撮像して得られた画像を表示するようにしてある。
表示部は、所定時間当たりの車両台数に係る情報とともに流入路を撮像して得られた画像を表示する。交差点付近を通過する車両の映像と合わせて、所定時間当たりの車両台数に係る情報が、更新周期N(秒)で繰り返し更新されて表示されるので、流率の増減をさらに容易かつ的確に認識することができる。
(11)本発明の実施の形態に係る情報提供装置は、前記表示部は、前記所定時間当たりの車両台数に係る情報を、前記青信号の開始時点から該所定時間よりも長い時間経過後に表示するようにしてある。
表示部は、所定時間当たりの車両台数に係る情報を、青信号の開始時点から当該所定時間よりも長い時間経過後に表示する。青信号の開始時点から所定時間までの間は、所定時間当たりの車両台数を求めている途中であるため、所定時間当たりの車両台数に係る情報を表示するタイミンングを、所定時間よりも長い時間経過後にすることにより、所定時間当たりの車両台数に係る情報を正確に表示することができる。
[本願発明の実施形態の詳細]
以下、本発明に係る情報提供装置、コンピュータプログラム、記録媒体及び情報提供方法の実施の形態を示す図面に基づいて説明する。図1は本実施の形態の情報提供装置を含む情報提供システムの構成の一例を示すブロック図である。情報提供システムは、情報提供装置としての携帯型情報処理装置50、交通信号制御機100、信号灯器201、202、車両感知器2などを備える。
以下、本発明に係る情報提供装置、コンピュータプログラム、記録媒体及び情報提供方法の実施の形態を示す図面に基づいて説明する。図1は本実施の形態の情報提供装置を含む情報提供システムの構成の一例を示すブロック図である。情報提供システムは、情報提供装置としての携帯型情報処理装置50、交通信号制御機100、信号灯器201、202、車両感知器2などを備える。
サーバ1は、例えば、交通管制センタに設置され、交通量又は渋滞情報などの交通データに基づき、道路上の交通が円滑に流れるための各交通信号制御機の動作タイミングを算出する。算出された動作タイミングは、動作指令情報(信号制御パラメータなどを含む信号制御に関する情報)として交通信号制御機100へ送信される。
車両感知器2は、交差点に流入する流入路の所要の位置(例えば、停止線付近)に設置され、感知パルス信号を取得することにより、交差点に流入する流入路の所定車線の所定位置(例えば、停止線など)を通過する車両台数(交通量)、占有率などの感知情報を算出し、算出した感知情報を交通信号制御機100の感知器インタフェース12へ送信する。
また、撮像装置を備えた画像型の車両感知器2を交差点近傍に設置してある。画像型の車両感知器2は、感知パルス信号を取得することにより、交通量(車両台数)、占有率などの感知情報を算出し、算出した感知情報を交通信号制御機100の感知器インタフェース12へ送信する。また、画像型の車両感知器2は、交差点に流入する各流入路を撮像して得られた映像データ(動画又は静止画を含む)を、例えば、イーサネット(登録商標)等のネットワークに接続するためのHUB3及び携帯電話網などの通信インタフェース機能を有する無線通信部4(無線ルータ)を経由して携帯型情報処理装置50へ送信する。なお、超音波型の車両感知器が感知パルス信号に基づいて交通量、占有率などの感知情報を算出し、算出した感知情報を感知器インタフェース12へ送信するとともに、当該超音波型の車両感知器とは別途に設置された撮像装置が、無線通信部4を経由して、撮像した映像データを携帯型情報処理装置50へ送信する構成であってもよい。
交通信号制御機100は、CPU10、イーサネット(登録商標)等のネットワークを経由してサーバ1及び携帯型情報処理装置50との通信を行う通信インタフェース11、車両感知器2から感知情報(車両感知情報とも称する)を受信するための感知器インタフェース12、タイマ回路13、信号灯器の信号表示を順次指定するステップカウンタ14、信号情報を記憶するステージメモリ15、ステージメモリ読取回路16などを備える。
感知器インタフェース12は、車両感知器2から車両感知情報などを取得する。
通信インタフェース11は、サーバ1が送信した動作指令情報を受信する。また、通信インタフェース11は、無線通信部4及びHUB3を経由して、携帯型情報処理装置50で生成されて送信された指令を受信する。携帯型情報処理装置50が送信する指令は、例えば、信号を切り替えるための指令である。また、通信インタフェース11は、車両感知器2から取得した車両感知情報を、HUB3を経由してサーバ1へ送信する。
CPU10又はサーバ1は、対象とする道路網内の道路地図情報、ステージ階梯図などを含む信号情報、道路網内の交差点の識別情報及び位置情報とともに渋滞情報を、HUB3及び無線通信部4を経由して、携帯型情報処理装置50へ送信する。
タイマ回路13は、不図示のクロック信号に基づいて駆動され、設定に従ってステップの単位時間(例えば、1秒)を計時し、単位時間信号(例えば、1秒周期のクロック)をステップカウンタ17へ出力する。
CPU10は、サーバ1から送信された動作指令情報、あるいは携帯型情報処理装置50から送信された指令に基づいて、信号灯器201、202の灯色の切替タイミング信号である歩進指令をステップカウンタ14へ送出する。歩進指令は、信号表示を次の信号表示に進める(ステップを次のステップに進める)指令である。
ステップカウンタ14は、CPU10から送出される歩進指令に基づいて、信号灯器201、202のステップを順次指定する。具体的には、ステップカウンタ14は、CPU10から送出される歩進指令に基づいて、ステップを計時し、ステップ信号を生成する。ステップカウンタ14は、生成したステップ信号をステージメモリ読取回路16へ出力する。なお、ステップを計時するとは、現在のステップを指し示しつつ、ステップを次のステップへ順次進めることを意味する。
ステージメモリ読取回路16は、ステップカウンタ14が出力するステップ信号に基づいて、ステージメモリ15に記憶された信号情報を読み取り、読み取った信号情報に基づいて、各信号灯器201、202へ灯色出力を行う。
図2は本実施の形態の情報提供装置としての携帯型情報処理装置50の構成の一例を示すブロック図である。本実施の形態の携帯型情報処理装置50は、例えば、携帯電話機、スマートフォン、タブレット型端末装置、ノート型パーソナルコンピュータ等である。携帯型情報処理装置50は、CPU51、通信部52、表示部53、記憶部54、操作部55などを備える。CPU51は、特定部511、判定部512などを備える。また、通信部52は、台数取得部521、信号情報取得部522などを備える。
通信部52は、例えば、無線LAN、携帯電話網などの通信インタフェース機能を有し、HUB3及び無線通信部4を経由して、交通信号制御機100、車両感知器2及びサーバ1との間で無線による通信を行うことができる。なお、携帯型情報処理装置50と交通信号制御機100との間をケーブル等で接続して有線で通信を行うようにすることもできる。
また、通信部52は、無線LAN、携帯電話網などの通信インタフェース機能を使用して、本実施の形態のコンピュータプログラムをインターネット上のアプリケーションサーバ(不図示)からダウンロードするためのインタフェースとしての機能も有する。
記憶部54は、RAM、ROM等の他にSSD(Solid State Drive)又はHDD(Hard Disk Drive)などを備える。記憶部54は、交通信号制御機100が送信した信号情報及び車両感知器2の車両感知情報を記憶することができる。また、記憶部54は、本実施の形態のコンピュータプログラムを記憶し、記憶したコンピュータプログラムをCPU51で実行することができる。
表示部53は、液晶パネルを備える。表示部53の液晶パネルは、例えば、タッチパネルであり、表示部53は、液晶パネルに表示されたアイコン、ボタン、バー等を直接指で操作することにより、操作信号を操作部55へ出力する。
操作部55は、操作信号を解析して、解析結果をCPU51へ出力する。なお、液晶パネルは、タッチパネルに限定されるものではない。
図3は本実施の形態の携帯型情報処理装置50が提供する情報に係る交差点の一例を示す模式図である。図3に示すように、交差点には、複数の流入路R1、R2、R3、R4が流入している。流入路R2、R4はお互いに対向する流入路であり、流入路R2、R4に対して信号灯器201が設けられ、流入路R1、R3はお互いに対向する流入路であり、流入路R1、R3に対して信号灯器202が設けられている。各流入路は、片側2車線であるが、車線数は図3の例に限定されるものではない。
なお、交差点の形状は、図3の例に限定されるものではなく、三差路、五差路等であってもよい。また、図3は左側通行の場合の一例であり、右側通行の場合は車線が左右逆になる。
台数取得部521は、無線通信部4を介して、車両感知器2から交差点に流入する流入路の所定車線の所定位置を通過する車両台数を取得する。所定車線は、流入路に車線が複数ある場合、任意の1車線でよく、例えば、代表的な車線でもよく、右折専用車線又は左折専用車線などの専用車線でもよい。また、所定車線は、全車線でもよい。所定位置は、交差点手前の停止線とすることができるが、停止線に限定されるものではなく、例えば、交差点から所要距離の地点とすることもできる。本実施の形態では、所定位置を停止線として説明する。
信号情報取得部522は、無線通信部4を介して、交差点の信号情報を取得する。信号情報は、青信号、黄信号、赤信号などの各信号表示の切替順序、各信号表示の表示時間などの情報を含む。
特定部511は、流入路に対する青信号の開始以降の第1時点から第2時点までの間に停止線を通過する車両台数を、第2時点を当該青信号の終了まで更新しつつ複数回特定する。第1時点から第2時点までの間の時間をM(秒)で表し、第2時点の更新周期をN(秒)で表すと、特定部511は、N(秒)の都度、過去M(秒)間に停止線を通過する車両台数を特定する。
表示部53は、CPU51の制御の下、第2時点を更新する都度、特定部511が特定した車両台数に基づいて停止線を通過する所定時間当たりの車両台数に係る情報を表示する。所定時間当たりの車両台数は、流率も含む。所定時間当たりの車両台数は、例えば、30秒当たりの車両台数とすることができる。所定時間当たりの車両台数を、例えば、1秒当たり、あるいは1時間当たりに換算することにより、流率を求めることができる。
「所定時間当たりの車両台数に係る情報」とは、表示の態様に関わらず、「所定時間当たりの車両台数(流率を含む)」を読み取ることができる情報とすることができる。情報の表示は、例えば、アナログメータの如く表示してよく、棒グラフのようなバー形式で表示してよく、デジタルメータの如く表示してもよい。また、表示灯を点灯させるようにしてもよい。
上述の構成により、所定時間当たりの車両台数に係る情報(流率を含む)に係る情報が、更新周期N(秒)で繰り返し更新されて表示されるので、流率の増減を容易に認識することができる。特に、流率に係る情報がどの程度まで減少すれば青信号の終了タイミングとするかの指標とすることができるので、青信号を終了させるタイミングを判断するための情報を提供することができる。
次に、本実施の形態の携帯型情報処理装置50の表示部53で表示する画面について説明する。図4は本実施の形態の携帯型情報処理装置50の表示部53で表示する画面の一例を示す模式図である。図4は図3に例示する交差点に対応している。すなわち、画面は、流入路R1、R2、R3、R4の別に4分割されている。流入路R1に対しては、符号P1で示す箇所に流入路R1を走行する車両の映像を表示し、符号G1で示す箇所に所定時間当たりの車両台数に係る情報を表示する。流入路R2、R3、R4についても同様である。
また、「信号切替」のアイコン又はボタンを操作することにより、手動で信号切替を行うことができる。例えば、青信号の終了タイミングであると判断して、「信号切替」のアイコン又はボタンを操作すると、青信号の打ち切りとなる。
図5は本実施の形態の携帯型情報処理装置50の表示部53で表示する車両の映像の一例を示す模式図である。図5は停止線を含む流入路(R1~R4のいずれか1つとする)を走行する車両の映像を示す。図5に示す映像は、図4に例示した符号P1からP4で示す箇所に表示される。なお、映像は、動画でもよく、あるいは所定の周期(例えば、0.5秒、1秒など)の静止画でもよい。図5には、簡便のため、3つの映像を模式的に示している。図5において、左側の図は青信号開始からt1(秒)後の様子を示し、流入路を走行する車両の台数がやや多い状態を示す。中央の図は青信号開始からt2(秒、t2>t1)後の様子を示し、流入路を走行する車両の台数がさらに多い状態を示す。右側の図は青信号開始からt3(秒、t3>t2)後の様子を示し、流入路を走行する車両の台数はピークを過ぎてやや少なくなった状態を示す。図5に示す映像は、それぞれの流入路について、青信号の開始から終了までの間表示される。また、図5に示すように、流入路に対する現在の信号灯色を表示することもできる。これにより、携帯型情報処理装置50を使用する人(例えば、警察官)は、実際の信号灯色が見えない又は見にくい場所で作業をせざるを得ない場合でも、現在の信号灯色を容易に確認することができる。
図6は本実施の形態の携帯型情報処理装置50の表示部53で表示する所定時間当たりの車両台数に係る情報の第1実施例を示す模式図である。図6に示す表示は、図4に例示した符号G1からG4で示す箇所に表示される。図6の例では、所定時間当たりの車両台数に係る情報を、1車線毎の30秒当たりの車両台数(台数/30秒/1車線)として表している。図6に示すように、所定時間当たりの車両台数に係る情報は、自動車のアナログ式のスピードメータのように表示することができる。
次に、累積交通量と流率の関係について説明する。図7は青信号開始以降の累積交通量と流率との関係の一例を示す説明図である。図7において、横軸は時間(秒)を示し、縦軸は1車線当たりの累積交通量を示す。交差点の停止線付近に設置された車両感知器2は、交差点(停止線)を通過する車両の交通量を計測しており、この情報は、N(=1~5)秒単位に集計されて、データ(車両感知情報)を集計する装置(サーバ1、交通信号制御機100)に送信される。携帯型情報処理装置50は、車両感知器2で集計されたデータ及び信号情報(青信号の開始時刻を含む)を受信することにより、(1)青信号開始からの累積交通量、(2)過去M秒間の交通量などの情報を得ることができる。
累積交通量とは、計測起点時刻以降の時間に計測地点を通過した車両の累積台数であり、停止線を通過する全ての合計値を「断面の累積交通量」、車線数で割ったもの又は代表車線の計測値で集計したものを「車線当りの累積交通量」と言う。また、流率は、累積交通量を示す曲線の傾きとなる。なお、計測起点時刻は、青信号の前の黄信号の開始時刻、すなわち、十字交差点の場合、交差側の黄信号(直前の黄色の階梯)の開始時刻とする場合(黄信号起点)と青信号の開始時刻とする場合(青信号起点)とがあり、黄信号起点の値は信号切替わり時の損失時間(車両が交差点を通過できない時間)を含めた当該方向の処理効率を表す指標であり、青信号起点の値は青信号内での当該方向の処理効率を表す指標である。以下の説明では、青信号起点を用いることにする。
図7に示すように、青信号開始から徐々に停止線を通過する車両台数が増加し、累積交通量の曲線の傾きが増加する。さらに青信号時間が経過すると、停止線を通過する車両台数が減少し、累積交通量の曲線の傾きが減少し始めるので、流率は増加から最大値(最大流率)を通過して減少に転じる。最大流率は、処理効率が落ち始める直前に現れる。
前述のように、特定部511は、流入路に対する青信号の開始以降の第1時点から第2時点までの間に停止線を通過する車両台数を、第2時点を当該青信号の終了まで更新しつつ複数回特定する。第1時点から第2時点までの間の時間をM(秒)で表し、第2時点の更新周期をN(秒)で表すと、特定部511は、N(秒)の都度、過去M(秒)間に停止線を通過する車両台数を特定する。図7に示すように、第1時点での累積交通量の値と第2時点での累積交通量の値とを結ぶ直線の傾きが、第2時点での流率、すなわち第2時点から見て過去M秒間の交通量の傾きを表している。過去M秒間の車両台数(交通量)Vとすると、流率はV/M(台数/秒)となる。
また、図7に示すように、最大流率点(所定時間当たりの車両台数の最大値)までの間は、流率が増加し、最大流率点を超えると流率は減少し始める。例えば、警察官は、かかる流率の変化を認識しながら、青信号の打ち切りタイミングを決定することができ、個々の警察官の主観に依拠しない明確な判断基準を提供することができる。なお、交通量の変動に応じて、例えば、一度最大流率Aを記録し、その後流率が一旦減少し再び増加して新たな最大流率Bが記録された場合、Bを最大流率点とする。これにより、最大流率点を青信号開始から当該青信号が終了するまでの対象サイクルでの最大値とすることができる。
次に、所定時間当たりの車両台数に係る情報(流率を含む)の可視化について説明する。図8、図9、図10、図11及び図12は本実施の形態の携帯型情報処理装置50による可視化の第1実施例を示す模式図である。図8から図12に示す可視化の例は、図6で例示したものと同様である。
図8から図12において、左側の図は、1車線当たりの累積交通量の変化を示し、累積交通量を表す曲線上での流率の変化も図示している。また、第1時点と第2時点との間の時間Mを30秒としている。図8から図12において、右側の図は、所定時間当たりの車両台数に係る情報の表示例を示す。情報の更新周期N(N=1~5秒)の都度、過去M(M=30)秒の通過台数又は流率をアナログスピードメータのような針と半円グラフとで表示している。図の例は、1車線毎の30秒当たりの車両台数を示し、M秒間の交通量(車両台数)をVとすると、Vを図示している。流率を図示する場合には、例えば、V/M(台数/秒)、あるいはV/M×3600(台数/時)の値を表示すればよい。
図8の例は、青信号開始から30秒後の状態を示し、過去30秒間の車両台数を図示している。所定時間当たりの車両台数(流率)は、比較的少ない。図9の例は、さらに複数回の更新周期Nが経過した時点の様子を示す。所定時間当たりの車両台数(流率)は、増加しつつある。図8、図9の例では、所定時間当たりの車両台数が増加しつつあることを示すため、例えば、針の色を緑色にして表示することができる。
表示部53は、CPU51の制御の下、第2時点を更新する都度、所定時間当たりの車両台数が増加する場合、増加する旨を表示する。すなわち、表示部53は、更新周期の都度、流率が増加している場合には、増加している旨を表示する。これにより、交差点付近を通過する車両の映像だけでは、流率が増加しているか否かを判断することが困難な場合でも、流率の増加を的確に把握することができる。
図10の例は、さらに複数回の更新周期Nが経過した時点の様子を示す。所定時間当たりの車両台数(流率)は、最大となっている。
図11の例は、さらに複数回の更新周期Nが経過した時点の様子を示す。所定時間当たりの車両台数(流率)は、最大値から減少しつつある。所定時間当たりの車両台数(流率)が、最大値を超えて減少する場合、図11に示すように、最高点(車両台数の最大値、最大流率)の残像を表示する。警察官は、最高点の残像(今回の青信号での最高点)と現状値とを比較することができるので、青信号の打ち切りタイミングを的確に判断することができる。また、最高点に対して、現状値が90%を下回った場合、針を、例えば、緑色から黄色に変更する。警察官は、現状値が、減少しつつあることを判断することができ、そろそろ青信号の打ち切りタイミングになることを予測することができる。
表示部53は、CPU51の制御の下、第2時点を更新する都度、所定時間当たりの車両台数が減少する場合、減少する旨を表示する。すなわち、表示部53は、更新周期の都度、流率が減少している場合には、減少している旨を表示する。これにより、交差点付近を通過する車両の映像だけでは、流率が減少しているか否かを判断することが困難な場合でも、流率の減少を的確に把握することができる。
図12の例は、さらに複数回の更新周期Nが経過した時点の様子を示す。所定時間当たりの車両台数(流率)は、さらに減少しつつある。図12に示すように、例えば、今回の青信号での最高点に対して、現状値が80%を下回った場合、針を、例えば、黄色から赤色に変更する。警察官は、現状値が、青信号の打ち切りタイミングであることを判断することができる。なお、現状値が、例えば、75%を下回った場合には、半円の針板を点滅させる、あるいは音声を出力することにより、警察官の流率の低下を気付かせるようしてもよい。
上述のように、表示部53は、CPU51の制御の下、第2時点を更新する都度表示する、所定時間当たりの車両台数に係る情報のうち、所定条件を充足する情報の表示を所定時点まで継続する。所定条件を充足する情報とは、例えば、所定時間当たりの車両台数が最大となるときの情報、すなわち最大流率とすることができる。所定時点は、青信号が開始された後、当該青信号が終了する時点である。
すなわち、青信号の開始以降、流率が増加し、一旦最大となった後に減少するような場合、最大流率を示す情報の表示を青信号終了まで継続する。かかる構成により、時間の経過とともに、流率が一旦最大値となった後に減少する場合に、流率が最大値に対してどの程度減少しているかを容易に視認することができ、青信号を終了させるタイミングを容易に判断することが可能となる。
判定部512は、青信号の開始以降、当該青信号の終了までの間に、所定時間当たりの車両台数が最大となる場合を前述の所定条件として判定する。これにより、流率が最大値に対してどの程度減少しているかを容易に視認することができ、青信号を終了させるタイミングを容易に判断することが可能となる。
また、表示部53は、CPU51の制御の下、所定時間当たりの車両台数が所定の閾値以下となった場合、閾値以下となった旨を表示する。閾値以下となった旨の表示は、例えば、前述の図12に示すような、所定時間当たりの車両台数(流率)の現状値が、今回の青信号での最高点の80%を下回った場合をいう。所定の閾値は、最大流率に対する所定の割合(100%未満)とすることができ、例えば、最大流率の80%とすることができるが、これに限定されない。かかる構成により、図12に例示したように、流率が最大となった後、減少する場合に所定の閾値以下となったことを表示するので、所定の閾値以下となった時点を青信号の終了タイミングと定めておくことにより、人(例えば、警察官)の個々の判断によって青信号の終了タイミングが決定されることを回避することができる。
また、上述の例では、第1時点は、第2時点より第1所定時間(M秒)前の時点である。すなわち、特定部511は、第2時点から過去第1所定時間(過去M秒)の間に所定位置を通過する車両台数を、第2時点を当該青信号の終了まで更新しつつ複数回特定する。なお、第1所定時間Mは、交通量の変動を抑制するため、例えば、30秒とすることができるが、これに限定されるものではない。
第1所定時間(M秒)を短くした場合、短い時間の間に所定位置を通過する車両台数に基づいて流率が求められるので、流率の変動を大きくすることができる。一方で、第1所定時間(M秒)を長くした場合、長い時間の間に所定位置を通過する車両台数に基づいて流率が求められるので、流率の変動を小さくすることができる。かかる構成により、交差点に流入する流入路の交通量に応じて、流率の変化を容易に認識できるようにすることが可能となる。
また、表示部53は、図4に示すように、所定時間当たりの車両台数に係る情報とともに流入路を撮像して得られた画像を表示する。交差点付近を通過する車両の映像と合わせて、所定時間当たりの車両台数に係る情報が、更新周期N(秒)で繰り返し更新されて表示されるので、流率の増減をさらに容易かつ的確に認識することができる。
また、表示部53は、所定時間当たりの車両台数に係る情報を、青信号の開始時点から当該所定時間よりも長い時間経過後に表示する。青信号の開始時点から所定時間までの間は、所定時間当たりの車両台数を求めている途中であるため、所定時間当たりの車両台数に係る情報を表示するタイミンングを、所定時間よりも長い時間経過後にすることにより、所定時間当たりの車両台数に係る情報を正確に表示することができる。
図8から図12の例では、所定時間当たりの車両台数の最大値(すなわち、最大流率)を最高点残像として青信号の終了時点まで表示しつづける構成であったが、車両台数の最大値(最大流率)は、リアルタイムでの値に限定されるものではない。例えば、過去の経験値を表示することもできる。
図13は本実施の形態の携帯型情報処理装置50による可視化の第2実施例を示す模式図である。図13の例では、今回の青信号での最高点と過去の青信号での最高点の代表値とを表示している。
記憶部54は、青信号の開始以降、当該青信号の終了までの間に所定位置を通過する所定時間当たりの車両台数の最大値を複数の信号サイクルに亘って記憶する。複数の信号サイクルは、例えば、1日のうちのある時間帯(例えば、午前8時台、午後6時台など)での信号サイクルを収集したものでもよく、1日の同じ時間帯を、例えば、1週間又は1か月に亘って収集したものでもよい。すなわち、記憶部54は、ある時間帯の信号サイクル毎の最大流率、あるいは1週間又は1か月に亘ってある時間帯の信号サイクル毎の最大流率を記憶する。
表示部53は、CPU51の制御の下、記憶部54に記憶した最大値の代表値に係る情報を表示する。代表値は、例えば、平均値、中央値、最頻値などとすることができる。すなわち、表示部53は、過去の最大流率の代表値を表示するので、現状の流率が過去の最大値に対してどの程度減少しているかを容易に視認することができ、青信号を終了させるタイミングを容易に判断することが可能となる。なお、図13の例では、今回の青信号での最高点と過去の青信号での最高点の代表値とを表示しているが、過去の青信号での最高点の代表値のみを表示してもよい。
図14は本実施の形態の携帯型情報処理装置50による可視化の第3実施例を示す模式図である。第3実施例では、針を表示させずに、半円状のグラフにより所定時間当たりの車両台数(流率を含む)を表示する。図14の例において、例えば、所定時間当たりの車両台数が増加する場合には、緑色で表示し、最高点の残像を青信号の終了まで表示し続ける。また、所定時間当たりの車両台数が最高点の90%を下回った場合には、緑色から黄色に変更し、さらに最高点の80%を下回った場合には、黄色から赤色に変更することにより、第1実施例の場合と同様の効果を得ることができる。
図15は本実施の形態の携帯型情報処理装置50による可視化の第4実施例を示す模式図である。第4実施例では、半円状のグラフに代えて、棒グラフ(バー形式)により所定時間当たりの車両台数(流率を含む)を表示する。図15の例において、例えば、所定時間当たりの車両台数が増加する場合には、バーを緑色で表示し、最高点の残像を青信号の終了まで表示し続ける。また、所定時間当たりの車両台数が最高点の90%を下回った場合には、バーを緑色から黄色に変更し、さらに最高点の80%を下回った場合には、バーを黄色から赤色に変更する。これにより、第1実施例の場合と同様の効果を得ることができる。
前述の第1実施例から第4実施例では、所定時間当たりの車両台数(流率を含む)をアナログメータのように表示する構成であったが、これに限定されるものではない。例えば、最高点及び現状の所定時間当たりの車両台数(流率を含む)をデジタル値で表示するようにしてもよい。この場合、所定時間当たりの車両台数が増加する場合には、数字を緑色で表示し、最高点の残像を青信号の終了まで表示し続ける。また、所定時間当たりの車両台数が最高点の90%を下回った場合には、数字を緑色から黄色に変更し、さらに最高点の80%を下回った場合には、数字を黄色から赤色に変更する。これにより、第1実施例の場合と同様の効果を得ることができる。
図16は本実施の形態の携帯型情報処理装置50による可視化の第5実施例を示す模式図である。図16に示すように、表示部53は、電球又はLEDなどの表示灯を備え、赤色、黄色及び緑色を発光することができる。所定時間当たりの車両台数が増加する場合には、緑色の表示灯を点灯し、所定時間当たりの車両台数が減少する場合には、黄色の表示灯を点灯する。また、所定時間当たりの車両台数が最高点の80%を下回った場合には、赤色の表示灯を点灯する。これにより、第1実施例の場合と同様の効果を得ることができる。
なお、第5実施例において、赤色及び黄色の表示灯だけを備える構成でもよく、あるいは赤色の表示灯だけを備える構成もよい。これにより、一層簡便な構成とすることができる。また、所定時間当たりの車両台数が最高点の75%を下回った場合には、赤色の表示灯を点滅させてもよく、輝度を高くしてもよい。これにより、警察官の注意を喚起することができる。
上述の実施の形態では、特定部511は、流入路に対する青信号の開始以降の第1時点から第2時点までの間に停止線を通過する車両台数を、第2時点を当該青信号の終了まで更新しつつ複数回特定する場合、第1時点は、第2時点より第1所定時間(M秒)前の時点であったが、これに限定されるものではない。例えば、第1時点を青信号の開始時点に固定するようにしてもよい。
図17は青信号開始以降の累積交通量と流率との関係の他の例を示す説明図である。図17に示すように、第1時点は、青信号の開始時点である。すなわち、特定部511は、流入路に対する青信号の開始時点から第2時点までの間に所定位置を通過する車両台数を、第2時点を当該青信号の終了まで更新しつつ複数回特定する。第2時点の更新の都度、青信号の開始時点から第2時点までの時間は長くなるので、所定位置を通過する車両台数が変動する場合でも、長い時間の間で平滑化され、流率を安定して求めることができる。
次に、本実施の形態の携帯型情報処理装置50の動作について説明する。図18及び図19は本実施の形態の携帯型情報処理装置50の処理手順の一例を示すフローチャートである。以下では、便宜上、処理の主体をCPU51として説明する。CPU51は、信号情報を取得し(S11)、交差点の停止線を通過する車両台数を取得する(S12)。CPU51は、青信号開始からM秒(例えば、30秒)経過したか否かを判定し(S13)、M秒経過していない場合(S13でNO)、ステップS13の処理を続ける。
M秒経過した場合(S13でYES)、CPU51は、更新周期N(N=1~5秒)であるか否かを判定し(S14)、更新周期Nでない場合(S14でNO)、ステップS14の処理を続ける。更新周期Nである場合(S14でYES)、CPU51は、1車線当たりの過去M秒間に停止線を通過した車両台数Vを算出する(S15)。
CPU51は、車両台数Vが、台数最大値Vm以上であるか否かを判定する(S16)。なお、台数最大値Vmは、過去M秒間に停止線を通過した車両台数Vの最大値であり、初期値は0である。V≧Vmである場合(S16でYES)、CPU51は、車両台数Vが増加しているとして、車両台数Vを台数最大値Vmとし(S17)、車両台数Vを緑色で表示し(S18)、後述のステップS22の処理を行う。
V≧Vmでない場合(S16でNO)、CPU51は、V>Vm×0.8であるか否かを判定し(S19)、V>Vm×0.8である場合(S19でYES)、車両台数Vが最大値を超えて減少し始めたとし、台数最大値Vmの残像を残し、車両台数Vを黄色で表示し(S20)、後述のステップS22の処理を行う。
V>Vm×0.8でない場合(S19でNO)、CPU51は、台数最大値Vmの残像を残し、車両台数Vを赤色で表示し(S21)、後述のステップS22の処理を行う。CPU51は、青信号が終了したか否かを判定し(S22)、青信号が終了していない場合(S22でNO)、ステップS14以降の処理を続ける。
青信号が終了した場合(S22でYES)、CPU51は、台数表示を消去し(S23)、台数最大値Vmを0にし(S24)、処理を終了するか否かを判定する(S25)。処理を終了しない場合(S25でNO)、CPU21は、ステップS11以降の処理を続け、処理を終了すると判定した場合(S25でYES)、処理を終了する。
本実施の形態の情報提供装置は、CPU(プロセッサ)、RAMなどを備えた汎用コンピュータを用いて実現することもできる。すなわち、図18及び図19に示すような、各処理の手順(CPUが実行する方法のステップ)を定めたコンピュータプログラムをコンピュータに備えられたRAMにロードし、コンピュータプログラムをCPU(プロセッサ)で実行することにより、コンピュータ上で情報提供装置を実現することができる。
また、図18及び図19に示すような、CPUが実行する方法のステップを定めたコンピュータプログラムは、コンピュータでの読み取りが可能な非一時的な記録媒体に記録することができる。
図18及び図19に示す処理は、交差点で対向する流入路(例えば、上り方向と下り方向)それぞれについて行うことができる。この場合、上り方向及び下り方向の両方の流入路で所定時間当たりの車両台数(流率を含む)が閾値(例えば、最高点の80%)以下となった場合、青信号の打ち切りタイミングと判断してもよく、上り方向と下り方向とで交通量の多い方を優先して判断してもよい。
図18及び図19に示す処理のうち、例えば、ステップS11からステップS17、ステップS19等の処理を交通信号制御機100又はサーバ1で行うようにして、携帯型情報処理装置50は、交通信号制御機100又はサーバ1から受信した情報を表示する構成としてもよい。
上述の実施の形態において、所定時間当たりの車両台数(流率を含む)は、1車線当たりの数値であるが、これに限定されるものではなく、流入路の全車線の合計値であってもよい。また、数値は30秒当たりの交通量として説明したが、1秒当たり、あるいは1時間当たりで示すこともできる。この場合、例えば、15台/30秒は、0.5台/秒、1800台/時に相当する。
開示された実施の形態は、すべての点で例示であって制限的なものではないと考えられるべきである。本発明の範囲は上記した説明ではなくて請求の範囲によって示され、請求の範囲と均等の意味及び範囲内でのすべての変更が含まれることが意図される。
50 携帯型情報処理装置
51 CPU
511 特定部
512 判定部
52 通信部
521 台数取得部
522 信号情報取得部
53 表示部
54 記憶部
55 操作部
100 交通信号制御機
201、202 信号灯器
51 CPU
511 特定部
512 判定部
52 通信部
521 台数取得部
522 信号情報取得部
53 表示部
54 記憶部
55 操作部
100 交通信号制御機
201、202 信号灯器
Claims (14)
- 交差点に流入する流入路の所定車線の所定位置を通過する車両台数を取得する台数取得部と、
前記交差点の信号情報を取得する信号情報取得部と、
前記流入路に対する青信号の開始以降の第1時点から第2時点までの間に前記所定位置を通過する車両台数を、前記第2時点を該青信号の終了まで更新しつつ複数回特定する特定部と、
前記第2時点を更新する都度、前記特定部で特定した車両台数に基づいて前記所定位置を通過する所定時間当たりの車両台数に係る情報を表示する表示部と
を備える情報提供装置。 - 前記表示部は、
前記第2時点を更新する都度表示する情報のうち、所定条件を充足する情報の表示を所定時点まで継続するようにしてある請求項1に記載の情報提供装置。 - 前記青信号の開始以降該青信号の終了までの間に前記所定時間当たりの車両台数が最大となる場合を前記所定条件として判定する判定部を備える請求項2に記載の情報提供装置。
- 前記青信号の開始以降該青信号の終了までの間に前記所定位置を通過する所定時間当たりの車両台数の最大値を複数の信号サイクルに亘って記憶する記憶部を備え、
前記表示部は、
前記記憶部に記憶した最大値の代表値に係る情報を表示するようにしてある請求項1から請求項3までのいずれか1項に記載の情報提供装置。 - 前記表示部は、
前記所定時間当たりの車両台数が所定の閾値以下となった場合、閾値以下となった旨を表示するようにしてある請求項1から請求項4までのいずれか1項に記載の情報提供装置。 - 前記表示部は、
前記第2時点を更新する都度、前記所定時間当たりの車両台数が減少する場合、減少する旨を表示するようにしてある請求項1から請求項5までのいずれか1項に記載の情報提供装置。 - 前記表示部は、
前記第2時点を更新する都度、前記所定時間当たりの車両台数が増加する場合、増加する旨を表示するようにしてある請求項1から請求項6までのいずれか1項に記載の情報提供装置。 - 前記第1時点は、前記青信号の開始時点である請求項1から請求項7までのいずれか1項に記載の情報提供装置。
- 前記第1時点は、前記第2時点より第1所定時間前の時点である請求項1から請求項7までのいずれか1項に記載の情報提供装置。
- 前記表示部は、
前記所定時間当たりの車両台数に係る情報とともに前記流入路を撮像して得られた画像を表示するようにしてある請求項1から請求項9までのいずれか1項に記載の情報提供装置。 - 前記表示部は、
前記所定時間当たりの車両台数に係る情報を、前記青信号の開始時点から該所定時間よりも長い時間経過後に表示するようにしてある請求項1から請求項10までのいずれか1項に記載の情報提供装置。 - コンピュータに車両台数に係る情報を提供させるためのコンピュータプログラムであって、
コンピュータを、
交差点に流入する流入路の所定車線の所定位置を通過する車両台数を取得する台数取得部と、
前記交差点の信号情報を取得する信号情報取得部と、
前記流入路に対する青信号の開始以降の第1時点から第2時点までの間に前記所定位置を通過する車両台数を、前記第2時点を該青信号の終了まで更新しつつ複数回特定する特定部と、
前記第2時点を更新する都度、特定した車両台数に基づいて前記所定位置を通過する所定時間当たりの車両台数に係る情報を表示部に表示すべく生成する生成部と
して機能させるコンピュータプログラム。 - コンピュータに車両台数に係る情報を提供させるためのコンピュータプログラムを記録したコンピュータでの読み取りが可能な非一時的な記録媒体であって、
前記コンピュータプログラムは、
コンピュータを、
交差点に流入する流入路の所定車線の所定位置を通過する車両台数を取得する台数取得部と、
前記交差点の信号情報を取得する信号情報取得部と、
前記流入路に対する青信号の開始以降の第1時点から第2時点までの間に前記所定位置を通過する車両台数を、前記第2時点を該青信号の終了まで更新しつつ複数回特定する特定部と、
前記第2時点を更新する都度、特定した車両台数に基づいて前記所定位置を通過する所定時間当たりの車両台数に係る情報を表示部に表示すべく生成する生成部と
して機能させるコンピュータでの読み取りが可能な非一時的な記録媒体。 - 交差点に流入する流入路の所定車線の所定位置を通過する車両台数を台数取得部が取得するステップと、
前記交差点の信号情報を信号情報取得部が取得するステップと、
前記流入路に対する青信号の開始以降の第1時点から第2時点までの間に前記所定位置を通過する車両台数を、前記第2時点を該青信号の終了まで更新しつつ複数回特定部が特定するステップと、
前記第2時点を更新する都度、特定された車両台数に基づいて前記所定位置を通過する所定時間当たりの車両台数に係る情報を表示部が表示するステップと
を含む情報提供方法。
Priority Applications (2)
| Application Number | Priority Date | Filing Date | Title |
|---|---|---|---|
| JP2017505934A JP6451830B2 (ja) | 2015-03-18 | 2015-03-18 | 情報提供装置、コンピュータプログラム、記録媒体及び情報提供方法 |
| PCT/JP2015/057987 WO2016147329A1 (ja) | 2015-03-18 | 2015-03-18 | 情報提供装置、コンピュータプログラム、記録媒体及び情報提供方法 |
Applications Claiming Priority (1)
| Application Number | Priority Date | Filing Date | Title |
|---|---|---|---|
| PCT/JP2015/057987 WO2016147329A1 (ja) | 2015-03-18 | 2015-03-18 | 情報提供装置、コンピュータプログラム、記録媒体及び情報提供方法 |
Publications (1)
| Publication Number | Publication Date |
|---|---|
| WO2016147329A1 true WO2016147329A1 (ja) | 2016-09-22 |
Family
ID=56920027
Family Applications (1)
| Application Number | Title | Priority Date | Filing Date |
|---|---|---|---|
| PCT/JP2015/057987 Ceased WO2016147329A1 (ja) | 2015-03-18 | 2015-03-18 | 情報提供装置、コンピュータプログラム、記録媒体及び情報提供方法 |
Country Status (2)
| Country | Link |
|---|---|
| JP (1) | JP6451830B2 (ja) |
| WO (1) | WO2016147329A1 (ja) |
Cited By (1)
| Publication number | Priority date | Publication date | Assignee | Title |
|---|---|---|---|---|
| CN107945544A (zh) * | 2017-12-12 | 2018-04-20 | 常州大学 | 一种基于动态车流量分配红绿灯的人工智能系统 |
Families Citing this family (1)
| Publication number | Priority date | Publication date | Assignee | Title |
|---|---|---|---|---|
| JP7817344B1 (ja) * | 2024-10-04 | 2026-02-18 | 株式会社京三製作所 | 予測システム、予測方法及びプログラム |
Citations (7)
| Publication number | Priority date | Publication date | Assignee | Title |
|---|---|---|---|---|
| JPH0337798A (ja) * | 1989-07-05 | 1991-02-19 | Matsushita Electric Ind Co Ltd | 交通信号制御装置 |
| JPH04211900A (ja) * | 1990-04-27 | 1992-08-03 | Hitachi Ltd | 交通流計測装置及び交通流計測制御装置 |
| JP2002109681A (ja) * | 2000-10-03 | 2002-04-12 | Nippon Signal Co Ltd:The | 飽和交通流率の算出方法 |
| JP2004171289A (ja) * | 2002-11-20 | 2004-06-17 | Hitachi Ltd | 道路交通計測装置 |
| JP2006018664A (ja) * | 2004-07-02 | 2006-01-19 | Kyosan Electric Mfg Co Ltd | 歩行者信号制御装置 |
| WO2010098559A2 (en) * | 2009-02-26 | 2010-09-02 | Korea Advanced Institute Of Science And Technology | Traffic signal control system and method |
| JP2010266930A (ja) * | 2009-05-12 | 2010-11-25 | Sumitomo Electric Ind Ltd | 信号制御装置及び信号制御方法 |
Family Cites Families (1)
| Publication number | Priority date | Publication date | Assignee | Title |
|---|---|---|---|---|
| JP2005284678A (ja) * | 2004-03-29 | 2005-10-13 | Mitsubishi Heavy Ind Ltd | 交通流計測装置 |
-
2015
- 2015-03-18 JP JP2017505934A patent/JP6451830B2/ja active Active
- 2015-03-18 WO PCT/JP2015/057987 patent/WO2016147329A1/ja not_active Ceased
Patent Citations (7)
| Publication number | Priority date | Publication date | Assignee | Title |
|---|---|---|---|---|
| JPH0337798A (ja) * | 1989-07-05 | 1991-02-19 | Matsushita Electric Ind Co Ltd | 交通信号制御装置 |
| JPH04211900A (ja) * | 1990-04-27 | 1992-08-03 | Hitachi Ltd | 交通流計測装置及び交通流計測制御装置 |
| JP2002109681A (ja) * | 2000-10-03 | 2002-04-12 | Nippon Signal Co Ltd:The | 飽和交通流率の算出方法 |
| JP2004171289A (ja) * | 2002-11-20 | 2004-06-17 | Hitachi Ltd | 道路交通計測装置 |
| JP2006018664A (ja) * | 2004-07-02 | 2006-01-19 | Kyosan Electric Mfg Co Ltd | 歩行者信号制御装置 |
| WO2010098559A2 (en) * | 2009-02-26 | 2010-09-02 | Korea Advanced Institute Of Science And Technology | Traffic signal control system and method |
| JP2010266930A (ja) * | 2009-05-12 | 2010-11-25 | Sumitomo Electric Ind Ltd | 信号制御装置及び信号制御方法 |
Cited By (1)
| Publication number | Priority date | Publication date | Assignee | Title |
|---|---|---|---|---|
| CN107945544A (zh) * | 2017-12-12 | 2018-04-20 | 常州大学 | 一种基于动态车流量分配红绿灯的人工智能系统 |
Also Published As
| Publication number | Publication date |
|---|---|
| JP6451830B2 (ja) | 2019-01-16 |
| JPWO2016147329A1 (ja) | 2017-12-28 |
Similar Documents
| Publication | Publication Date | Title |
|---|---|---|
| EP3549119B1 (en) | Method, apparatus and computer program product for estimation of road traffic condition using traffic signal data | |
| CN104011506B (zh) | 信息提供系统和信息提供方法 | |
| EP2824647B1 (en) | Methods and systems for determining information relating to the operation of traffic control signals | |
| KR102391502B1 (ko) | 사용자 상태에 기반한 주변 전자 장치 제어 방법 및 그 전자 장치 | |
| US20140118168A1 (en) | Travel optimization system | |
| CN113442929A (zh) | 一种车辆控制方法、装置、设备和计算机可读存储介质 | |
| JP2006259833A (ja) | 信号制御システム、および信号制御方法 | |
| CN110648549B (zh) | 基于车路协同的交通引导方法、设备、系统及存储介质 | |
| JP6451830B2 (ja) | 情報提供装置、コンピュータプログラム、記録媒体及び情報提供方法 | |
| JP2014002598A (ja) | 交通量判定装置、コンピュータプログラム及び交通量判定方法 | |
| JP5223533B2 (ja) | 交通信号制御装置、交通パラメータ算出装置、コンピュータプログラム、交通信号制御方法、及び交通パラメータ算出方法 | |
| JP2006065818A (ja) | 交通信号制御装置及びこれを用いた交通信号システム | |
| CN104008660B (zh) | 一种能监测路口信号控制器控制效果的系统及方法 | |
| JP2016116137A (ja) | 画像処理装置、画像処理方法、及び、プログラム | |
| CN106920417A (zh) | 一种车辆路径规划系统及方法 | |
| KR20160017162A (ko) | 교통흐름의 변화를 반영한 교통정보 생성방법 | |
| JP2013149168A (ja) | コンピュータプログラム、携帯型情報処理装置、交通信号制御システム及び信号制御方法 | |
| CN105160867A (zh) | 交通讯息预测方法 | |
| CN110751841B (zh) | 区域交通控制方法、设备、系统及存储介质 | |
| CN112669624B (zh) | 基于智能导航的交通路口信号控制方法和系统 | |
| CN112820122A (zh) | 基于行驶方向的可变车道控制方法和系统 | |
| JP4410079B2 (ja) | 交通信号制御装置及びこれを用いた交通信号システム | |
| JP6464675B2 (ja) | 交通信号制御機、コンピュータプログラム及び交通信号制御方法 | |
| JP6267889B2 (ja) | 横断歩道用信号システム | |
| US10368037B2 (en) | Public safety camera monitoring system and method |
Legal Events
| Date | Code | Title | Description |
|---|---|---|---|
| 121 | Ep: the epo has been informed by wipo that ep was designated in this application |
Ref document number: 15885425 Country of ref document: EP Kind code of ref document: A1 |
|
| ENP | Entry into the national phase |
Ref document number: 2017505934 Country of ref document: JP Kind code of ref document: A |
|
| NENP | Non-entry into the national phase |
Ref country code: DE |
|
| 122 | Ep: pct application non-entry in european phase |
Ref document number: 15885425 Country of ref document: EP Kind code of ref document: A1 |