EP0804732B1 - Procede de dosage multiparametrique biospecifique - Google Patents
Procede de dosage multiparametrique biospecifique Download PDFInfo
- Publication number
- EP0804732B1 EP0804732B1 EP96900108A EP96900108A EP0804732B1 EP 0804732 B1 EP0804732 B1 EP 0804732B1 EP 96900108 A EP96900108 A EP 96900108A EP 96900108 A EP96900108 A EP 96900108A EP 0804732 B1 EP0804732 B1 EP 0804732B1
- Authority
- EP
- European Patent Office
- Prior art keywords
- microparticles
- photon
- excitation
- label
- biospecific
- Prior art date
- Legal status (The legal status is an assumption and is not a legal conclusion. Google has not performed a legal analysis and makes no representation as to the accuracy of the status listed.)
- Expired - Lifetime
Links
Images


Classifications
-
- G—PHYSICS
- G01—MEASURING; TESTING
- G01N—INVESTIGATING OR ANALYSING MATERIALS BY DETERMINING THEIR CHEMICAL OR PHYSICAL PROPERTIES
- G01N33/00—Investigating or analysing materials by specific methods not covered by groups G01N1/00 - G01N31/00
- G01N33/48—Biological material, e.g. blood, urine; Haemocytometers
- G01N33/50—Chemical analysis of biological material, e.g. blood, urine; Testing involving biospecific ligand binding methods; Immunological testing
- G01N33/58—Chemical analysis of biological material, e.g. blood, urine; Testing involving biospecific ligand binding methods; Immunological testing involving labelled substances
- G01N33/585—Chemical analysis of biological material, e.g. blood, urine; Testing involving biospecific ligand binding methods; Immunological testing involving labelled substances with a particulate label, e.g. coloured latex
-
- G—PHYSICS
- G01—MEASURING; TESTING
- G01N—INVESTIGATING OR ANALYSING MATERIALS BY DETERMINING THEIR CHEMICAL OR PHYSICAL PROPERTIES
- G01N33/00—Investigating or analysing materials by specific methods not covered by groups G01N1/00 - G01N31/00
- G01N33/48—Biological material, e.g. blood, urine; Haemocytometers
- G01N33/50—Chemical analysis of biological material, e.g. blood, urine; Testing involving biospecific ligand binding methods; Immunological testing
- G01N33/53—Immunoassay; Biospecific binding assay; Materials therefor
- G01N33/543—Immunoassay; Biospecific binding assay; Materials therefor with an insoluble carrier for immobilising immunochemicals
- G01N33/54313—Immunoassay; Biospecific binding assay; Materials therefor with an insoluble carrier for immobilising immunochemicals the carrier being characterised by its particulate form
-
- Y—GENERAL TAGGING OF NEW TECHNOLOGICAL DEVELOPMENTS; GENERAL TAGGING OF CROSS-SECTIONAL TECHNOLOGIES SPANNING OVER SEVERAL SECTIONS OF THE IPC; TECHNICAL SUBJECTS COVERED BY FORMER USPC CROSS-REFERENCE ART COLLECTIONS [XRACs] AND DIGESTS
- Y10—TECHNICAL SUBJECTS COVERED BY FORMER USPC
- Y10S—TECHNICAL SUBJECTS COVERED BY FORMER USPC CROSS-REFERENCE ART COLLECTIONS [XRACs] AND DIGESTS
- Y10S435/00—Chemistry: molecular biology and microbiology
- Y10S435/973—Simultaneous determination of more than one analyte
-
- Y—GENERAL TAGGING OF NEW TECHNOLOGICAL DEVELOPMENTS; GENERAL TAGGING OF CROSS-SECTIONAL TECHNOLOGIES SPANNING OVER SEVERAL SECTIONS OF THE IPC; TECHNICAL SUBJECTS COVERED BY FORMER USPC CROSS-REFERENCE ART COLLECTIONS [XRACs] AND DIGESTS
- Y10—TECHNICAL SUBJECTS COVERED BY FORMER USPC
- Y10S—TECHNICAL SUBJECTS COVERED BY FORMER USPC CROSS-REFERENCE ART COLLECTIONS [XRACs] AND DIGESTS
- Y10S436/00—Chemistry: analytical and immunological testing
- Y10S436/80—Fluorescent dyes, e.g. rhodamine
-
- Y—GENERAL TAGGING OF NEW TECHNOLOGICAL DEVELOPMENTS; GENERAL TAGGING OF CROSS-SECTIONAL TECHNOLOGIES SPANNING OVER SEVERAL SECTIONS OF THE IPC; TECHNICAL SUBJECTS COVERED BY FORMER USPC CROSS-REFERENCE ART COLLECTIONS [XRACs] AND DIGESTS
- Y10—TECHNICAL SUBJECTS COVERED BY FORMER USPC
- Y10S—TECHNICAL SUBJECTS COVERED BY FORMER USPC CROSS-REFERENCE ART COLLECTIONS [XRACs] AND DIGESTS
- Y10S436/00—Chemistry: analytical and immunological testing
- Y10S436/805—Optical property
Definitions
- This invention relates to a biospecific multiparameter assay method.
- Immunoassays are a well-established group of biospecific assays and now widely used in routine diagnostics and research laboratories.
- Another group of biospecific assays is DNA hybridization assays.
- Biospecific assays generally employ one or several biospecific reactants (e.g. antibody, DNA probe) and normally one of these reactants is labelled.
- the labels currently used are radioisotopic, enzymatic, luminescent and fluorescent labels.
- the purpose of this invention is to present a better method for multiparameter biospecific assays.
- the method according to this invention is based on methods that are generally known within the field of immunology and DNA hybridization. Normally, they are performed as follows.
- the method uses two biospecific probes that recognize the analyte molecule k. In this text, these probes are referred to as the primary probe Ab(k,1) and the secondary probe Ab(k,2).
- the secondary probe is labeled, for example, with a photoluminescent label F, it is denoted with the symbol Ab F (k,2).
- Ab F photoluminescent label
- the analyte molecule which is either a polypeptide or a macromolecule
- epitopes i.e. molecule structures that bind specifically to the probes
- the amount of complex formed is directly proportional to the amount of the analyte, and the excess of primary and secondary probes remain in the solution.
- the complexes are separated from the free probes using a commonly known technique, for example, in which the primary probe is bound to a solid carrier and the free probes are washed away from the sample.
- the signal of bound label F in the complexes is measured in a traditional way which depends on the label chosen.
- the intensity of the signal obtained is directly proportional to the amount of label in the solution, and the response of the system is linear.
- the analyte to be measured is a small molecule without two or more epitopes which specifically bind to the probes
- a secondary probe that reacts specifically with the complex formed by the analyte and the primary probe (C.H. Self & al., Clin Chem 40 (1994) 2035-2041).
- a common problem in many multiparameter assays mentioned above is that the signal of photoluminescent label, which indicates the analyte category, and the signal from the photoluminescent label, which measures the concentration of the biospecific probe, interfere with each other. This is a problem that significantly restricts the dynamic range of the measurement of the analyte concentration. This interference may become particularly significant when measuring low analyte concentrations and when a wide dynamic range is required for the measurement of the biospecific signal.
- interference is eliminated by choosing such photoluminescent labels for the measurement of the biospecific reaction and identification labels which have substantially different emission decay times.
- the analyte is identified using an alternative method rather than using a photoluminescent label.
- the identification method of the analyte essentially restricts the dynamic range of the measurement.
- the object of this invention is an improved method for biospecific multiparameter assay method based on the use of small microparticles with a diameter range from 100 nanometer to 10 micrometer, but not limited to these measures.
- the microparticles are used as solid support for different bioaffinity reagents in reaction solution to which the sample is added.
- This invention allows the use of microparticles with very moderate monodispersity.
- the method of this invention allows the use of conventional short decay time fluorescent labels for labelling the biospecific reactants. Despite the fluorescent background, which is normally associated with such fluorescent labels, the optical measurement method of this invention ensures an ultimate sensitivity which potentially can be one molecule per microparticle.
- indicator is used in the context of a substance used for identification of the microparticles.
- indicator will be used if the indicator is a fluorescent dye.
- label will be used in the context of labelling of the biospecific reactant with a photoluminescent label F, which is a fluorescent dye with short decay time.
- this invention relates to the method of sensitive detection of the signal from the label F and identification of the category of microparticles using indicator D k .
- Figure 1 is a functional diagram of the measuring system needed for the method of this invention.
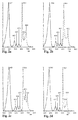
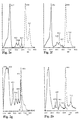
- Figures 2a - 2j show the excitation and emission spectra of the tetrapyrrolic compounds, which can be used as indicator D k .
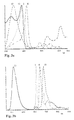
- Figures 3a and 3b show the excitation and emission spectra of selected tetrapyrrolic compounds, which can be used as indicator D k .
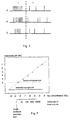
- Figure 4 presents an example of signals derived from the detector.
- Figure 5 shows the single photon count rate as a function of the number of molecules in the detector focal volume.
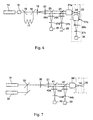
- Figure 6 shows a functional diagram of an alternative measuring system
- Figure 7 shows a functional diagram of an alternative measuring system
- the microparticles are in different categories representing different analytes to be assayed, said categories comprising different amounts of one or several indicators D 1 , D 2 , D 3 , ... D k (later D k ), for the purpose of identification of the category of said microparticles.
- Each category of microparticles is coated with a different biospecific reactant Ab(k,1), which reacts with the particular analyte M k and with a secondary reagent Ab F (k,2) and which is labelled with a photoluminescent label F.
- Said method is comprised of steps of
- microparticles A sufficient number of microparticles is analysed and the result of each microparticle is registered in a computer.
- the suspension is diluted adequately after the reaction. Often a dilution of one order of magnitude may be enough for sufficient separation of the bound and free fraction, because the photometric detector used in this invention is able to discriminate optically between those signals originating from the microparticle within the optical focal volume and the signal from the free label in the surrounding buffer solution.
- the photoluminescent label F in the method of this invention is a short decay fluorescent compound and the sample is illuminated by a continuous or pulsed laser beam which excites the fluorescence emissions.
- the fluorescent label with a typical emission decay time of a few nanoseconds, allows one to use an intensity of the exciting light up to 10 6 times higher than that of the excitation intensity of the long decay time fluorescent labels in the method referred to above.
- a much stronger signal with a short decay time can be derived from labels and, correspondingly, the signal can be measured precisely in much shorter time. Since the time needed for detecting one microparticle is very short, for example, 100 microseconds, the method of this invention has the advantage that a large number of microparticles can be measured within a short time. This results in higher capacity, accuracy and precision.
- the background signal which seriously reduces the sensitivity of ordinary fluorometry, is eliminated in this invention by using confocal excitation and detection or alternatively, by using two-photon excitation. Both of these methods restrict the active volume of measurement to a diffraction limited volume which approximately corresponds to the volume of one microparticle. Both of these methods and the related optical systems discriminate very efficiently all background scattering and fluorescence which originate from outside the active diffraction limited sample volume.
- the signal from the indicator used for the identification of the analyte does not interfere with the signal from the photoluminescent label used for the measurement of the biospecific reaction.
- this interference has been eliminated by using identification with non-fluorescent indicators or alternatively, when using a fluorescent indicator, the interference is eliminated with the use of the two-photon excitation method.
- Fig.1 shows an example of the functional diagram of the measuring system needed for the method of this invention.
- the laser (1) is used for excitation of fluorescence and it is focused through a lens (2a) and an objective lens (2b) to the sample (3) in a capillary cuvette (4).
- the fluorescence signal from the sample is directed by a dichroic mirror (5) to a pinhole (6).
- the light beam from the pinhole (6) is spit by dichroic mirrors (7) and (8) passes to the detectors (9), (10) and (11), which are tuned for the wavelengths of label F and indicators D 1 and D 2 respectively.
- the functional diagram presented now is applied to the registration of only two spectral features of the indicators D k requiring two detectors (10) and (11), respectively.
- the detectors incorporate appropriate spectral filters.
- the detectors (9), (10) and (11) are connected to a signal processor (12).
- the signal processor converts the signals to numerical form and the results are processed in the computer (13), which also controls the hardware.
- the label F and the indicator D k can also be excited with different lasers, if their excitation wavelengths are different, or if better results can be achieved by using two lasers. In this case, both lasers are focused to the same or adjacent points of the moving sample.
- a point-like light source (1) to the focal plane (3) of the objective lens (2b) is described. Due to diffraction, a point-like source of light forms an intensity distribution, which is characteristic to the optical system, in the focal plane.
- the intensity distribution is called the point spread function, which is determined in three dimensions.
- a normalised point spread function defines the probability S1 of how photons, radiated from a point-like source, are distributed on the focal area (3); that is, the probability that the photons are absorbed to different parts of the sample volume.
- a corresponding point spread function S2 can also be determined for the spatial distribution of the photons emitted from the focal point that reach the pinhole in front of the detectors.
- the value of this normalised function in the vicinity of the focal point defines the probability of the photons emitted from different points and hitting the pinhole (6).
- the light source (1) and the pinhole (6) are focused to the same focal point (3).
- the probability that a photon radiated from a point-like light source (1) causes a fluorescence emission in the sample, and that the emitted photon hits the pinhole (6), is described by the normalised product S1*S2 of the illumination and detection intensity distributions.
- the probability distribution thus derived is three dimensional and is clearly more restricted than the one produced by conventional optics, especially in the axial direction.
- the fluid volume to be measured in a confocal system is considerably smaller than the one in a conventional optical system.
- the active fluid volume is reduced to under a tenth of what is required in a conventional optical system.
- the dimension of the fluid volume under observation, is clearly larger axially than laterally, and it is inversely proportional to the square of the numerical aperture (N.A.).
- An alternative labelling and detection method that allows the use of fluorescent dyes as the identification indicator D k and offers a good separation between the signals from D k and F, is based on two-photon excitation of the label F.
- the fluorescent labels are single-photon excited, which means that the chromophores of the fluorescent label absorb light at the wavelength of the exciting light beam.
- Two-photon excitation can replace single-photon excitation and reduce the background caused by scattering and autofluorescence and it also very efficiently eliminates the spectral interference between D k and F.
- Two-photon excitation is possible when, by focusing an intensive light source, the density of photons per unit volume and per unit time becomes high enough for two photons to be absorbed into the same chromophore. In this case, the absorbed energy is the sum of the energies of the two photons.
- the chromophore In two-photon excitation, the chromophore is excited only when both photons are absorbed simultaneously, which is approximately within a femtosecond.
- the probability of absorption of two photons is equal to the product of probability distributions of absorption of the single photons.
- the intensity of fluorescence emission, caused by two photons, is thus a quadratic process with respect to the photon density of illumination.
- a point-like light source forms, due to diffraction, an intensity distribution in the focal plane characteristic of the optical system (point spread function).
- this point spread function is the probability distribution for the photons from the light source to reach the focal area.
- the probability distribution of excitation equals the normalised product of the intensity distributions of the two photons.
- the probability distribution thus derived is 3-dimensional, and is clearly more restricted than that for single-photon excitation, especially in the vertical direction. Thus in two-photon excitation, only the fluorescence that is formed in the clearly restricted 3-dimensional vicinity of the focal point is excited.
- two-photon excitation When a chromophore is two-photon excited and the excitation is restricted to the 3-dimensional vicinity of the focal point, then the signal caused by scattering in the vicinity of the focal point and from the optical components, is reduced remarkably if compared to normal excitation. Furthermore, two-photon excitation decreases the background fluorescence outside the focal point, in the surroundings of the sample and in the optics. Since the exciting light beam must be focused onto as small a point as possible, two-photon excitation best suits the observation of small sample volumes and structures, which is also the situation in the method according to this invention.
- NIR near-infrared
- the common way to produce two-photon excitation is to use ultra-short laser pulses. During the short pulse, it is possible to achieve a sufficiently high energy density for two-photon excitation, but the average energy is kept low. It has been observed, though, that two-photon excitations can also be observed with continuous-wave laser illumination.
- Suitable fluorescent labels for two-photon excitation are, for example, coumarin, rhodamine derivatives and phycobiliproteins.
- the coincidence condition of the laser pulse and the pulse from the photon detector can also be used to eliminate thermal noise from the photon detector.
- thermal noise becomes insignificant.
- the use of two photon excitation is advantageous compared to any single-photon excitation method because scattering and background noise, especially that caused by proteins and other macromolecules in the sample, is considerably lower. No fluorescence arises at the wavelength of the laser, nor can scattering caused by the laser beam reach the detector, because low-pass filters effectively block wavelengths lower than that of the laser.
- Two-photon excitation can best be performed with pulse lasers.
- the short transit time requires a pulsed laser with very high repetition frequency.
- the laser suitable for this application is the titanium-sapphire femtosecond laser with pulse energy of 10 nJ and with pulse frequency of 76 MHz and with adjustable 700-900 nm wavelength. Less expensive pulsed lasers suitable for this application will likely be available in the near future.
- Another example is a new, not yet commercially available diode pumped CrLi-Sapphire laser with 80 MHz pulse rate, 30 fs pulse width, 0.5 nJ pulse energy and adjustable 820-900 nm wavelength.
- Two-photon excitation can provide a diffraction-limited focal volume which is slightly larger than that of the confocal set-up, but clearly defined in three dimensions. The lower resolution is simply a consequence of using a longer excitation wavelength for two-photon excitation.
- the optical system for two-photon excitation can also be combined with a confocal set-up. By choosing an appropriate detector pinhole it is possible to optimise the size of the focal volume.
- Raman indicators is an alternative method for identification of the microparticle category. This method is well suited both for the confocal and two-photon excitation concept.
- Raman scattering is inelastic light scattering from molecular structures where the energy due to molecular vibrations is mixed with the Raman scattering due to light excitation.
- the Raman spectrum is expressed as a wavelength shift on both sides of the wavelength of the incident light, and called the Stokes shift and the anti-Stokes shift.
- a Raman spectrum includes information from the molecular structure similar to that from an infrared (IR) spectrum.
- Raman spectrum can also be obtained from very small objects like microparticles (P. Dhamelincourt & al. Spectroscopy Europe 5/2(1993) 16-26). Therefore, Raman spectra can be used to identify and to distinguish different molecular structures of microparticles.
- Microparticles for different categories can be produced with known polymerisation methods employing chemically different monomer mixtures for different particle categories.
- the monomer mixtures can include different kinds of monomers in different quantities or indicator substances can be added to the monomer.
- additional indicators are oligomers or polymers of above mentioned monomers or aliphatic or aromatic halogen compounds.
- Microparticles with a diameter ranging from 100 nanometers to 10 micrometers can be produced from different materials or material composites.
- the microparticle indicator substances can be added to production batches of different categories of microparticles and in different combinations.
- the Raman spectra obtained from microparticles of these different categories can be recognised by comparing the spectra using the correlation method described e.g. in US-patent 5,313,406 or by comparing the intensities of certain individual spectral peaks.
- fluorescent dyes are an alternative method for identification of a microparticle's category. This method is well suited only for the two-photon excitation concept because spectral overlap may cause significant interference in the confocal concept.
- Fluorescent microparticles with a diameter ranging from 100 nanometers to 10 micrometers can be manufactured combining the polymer material with a suitable short decay time fluorescent dye.
- Well known fluorescent dyes with very short decay time for example POPOP, bisMSB, fluorescein or rhodamine etc., can be added to any monomer (as discussed e.g. in "Theory and Practice of Scintillation Counting", Ed. J.B. Birks, Pergamon Press, 1967, pp. 321-353) and solid fluorescent material is formed in polymerisation. The material can be processed into microparticles in the same step.
- the fluorescent dyes can alternatively be impregnated into the surface of the microparticles or coupled on the surface of the microparticles.
- the fluorescent dye can be added into different batches of the monomer in substantially different concentrations differing e.g. by a factor of two from each other.
- the measuring device needed in this method can be simplified, if the excitation wavelength for all of the chromophores, F and D k , is the same, and the emission wavelengths differ substantially from each other, so that they can easily be separated spectrally. It is important that the fluorescent dye chosen has an absorption band that does not overlap with the emission band of the photoluminescent label F.
- the measuring device is simplified, if the chromophores F and D k can both be excited with the same light source.
- each of the chromophores, F and D k can be two-photon excited, or alternatively, F is two-photon excited and the fluorescent dyes of the NIR region are used as chromophores D k and they are one-photon excited by the fundamental wavelength of the same laser.
- F is two-photon excited and the fluorescent dyes of the NIR region are used as chromophores D k and they are one-photon excited by the fundamental wavelength of the same laser.
- chromophores similar to the ones described above are not used, it is necessary to excite them with two separate lasers, which are focused to the same or adjacent points of the moving sample. The excitation of the points, and the emission that follos it, are separated in the time domain.
- the potential fluorescent chromophores D k should show the following properties.
- They must have a common fluorescence excitation wavelength, which lies, if possible, on the excitation range of the bioaffinity label F, or at the fundamental wavelength of the laser that is used for the two-photon excitation of F; 2) they must have spectrally separable fluorescence emission bands that are higher than that of F; 3) the decay time of their fluorescence excited states must be short, and lie in the nanosecond range; in addition it is advantageous for a good function of this invention if 4) they have a large difference between their excitation and emission wavelengths; 5) they have no significant long decay emission component; 6) they are chemically stable and attachable to the microparticles; and 7) it would be very useful if their susceptibility to two-photon excitation is lower than that of F.
- the following commercially available and widely used dyes meet these specifications: Hoechst 33258, rhodamine (TRITC), Texas Red and Quantum Red. Although the excitation maxima of these dyes lie at different wavelengths, they can still be reasonably well excited at a single wavelength in the 300 to 450 nm range. The emission maxima lie at wavelengths of 470, 570, 620 and 670 nm, respectively.
- a group of compounds suitable for dyes D k can be found among the following group of tetrapyrrols: porphyrins, chlorines, bacteriochlorines, purpurines, pheophorbides, phtalocyanines and naphtalocyanines. These compounds generally have overlapping absorption bands at a near-UV range (320 nm - 450 nm, the so called "Sores band”) but also from the visible to the NIR-range and narrow separate fluorescence emission bands at the red and NIR-range (600 nm - 1200 nm). These compounds can be produced synthetically or microbiologically (Porphyrins, D.
- tetrapyrrolic dyes are: 1) deuteroporphyrine IX, 2) mesoporphyrine IX, 3) proto-porphyrine (IX) dimethyl ester, 4) octaethylporphin, 5) tetraphenylporphin, 6) tetra-(2-metoxy)-phenyl-porphin, 7) chlorine of coproporphyrin dimethyl ester, 8) bacteriochlorine of coproporphyrin dimethyl ester, 9) aluminium phtalocyanine and 10) zinc phtalocyanine.
- Another group of compounds suitable for dyes "D” can be found among the cyanine dyes. Examples of such cyanine dyes are:
- IR-125, IR-132, IR-140 and IR-144 Eastman Laboratory Chemicals, Catalog No. 55, Edition 93-94
- excitation (exc) and emission (em) wavelengths of the tetrapyrrolic and cyanines dyes listed above are presented in Table 1.
- the excitation and emission spectra of the compounds 1-10 are shown in Fig. 2a-2j. It can be seen that the spectra fulfil the requirements 1-4.
- requirement 6 we have found that tetrapyrrolic dyes show very low susceptibility to two-photon excitation.
- Phycoerythrin for example, shows very high susceptibility to two photon excitation. Because of this feature, tetrapyrrol dyes and phycoerythrin are a very good combination as D k and F.
- tetrapyrrolic and cyanine dyes can be supplemented with other known organic fluorescent dyes having the same excitation wavelength and showing an emission band either within the lower or the higher side of the emission range of tetrapyrrolic or cyanine dyes.
- organic fluorescent dyes having the same excitation wavelength and showing an emission band either within the lower or the higher side of the emission range of tetrapyrrolic or cyanine dyes.
- An example of this kind of compound is coumarin 120 in Table 1.
- Microparticles having fluorescent dyes like tetrapyrrolic or cyanine dyes, either internally or on their surface can be produced by different known methods.
- the dyes can be attached to the particle surface covalently if the particles are provided with chemically active groups (Molday, R.S. et al., J.Cell.Biol.,64(1975)75-88).
- the dye can also be impregnated within the surface layer of the microparticles by swelling the particles first in an organic solvent and the by washing and evaporating the solvent after impregnation. These methods have been described e.g. in following manufacturer's publications: Dyeing Large Particles, published by The Dow Chemical Co.,1972 and Uniform Latex Particles, published by Seragen Diagnostics Inc. Naturally the dyes can be added to the raw material before polymerisation of the particle.
- Fig.4(A), 4(B) and 4(C) present examples of pulses derived from the detectors as a function of time.
- a microparticle remains for a time t m , referred to as transit time, under the excitation of the laser beam within the volume defined by the point spread function of the confocal optics.
- the transit time depends on the speed of the flow inside the cuvette (3, Fig. 1), and is typically 100 microseconds.
- the number of photons observed by the detector depends on the quantum efficiency of the label F, the collection efficiency and the losses due to the optics and the quantum efficiency of the photon detector (9). In practice, a detection efficiency of 10 -2 can be obtained using avalanche photon diode counters with 80% quantum efficiency (EG&G Optoelectronics, Canada, type SPCM-141-AQ).
- the detector (9) can detect one or many photons from the fluorescence emission which come from one microparticle flowing through the active volume.
- the photons appear as stochastic photon bursts within the transit time t m (section 1, Fig.4).
- many other stochastic signals may also be detected (section 2, Fig.4). They originate from the background fluorescence, from free molecules in the sample and from scattering and thermal noise.
- An alternative photon detector is a photomultiplier tube and in particular a hybrid photomultiplier tube, which is composed of a single stage electron multiplier and a silicon diode as the electron sensor.
- This photomultiplier tube is capable of producing an analogue pulse which resolves a single photon.
- the advantage of the photomultiplier tube is its high dynamic range but the disadvantage is a quantum efficiency one order of magnitude lower than that of avalanche photo diodes. It is useful to adjust the laser intensity to the optimal frequency of single photons to be detected during the photon burst from each kind of sample to be analysed.
- the excitation power is an adjustable parameter for the optimal photon emission rate from the samples in each particular application.
- the avalanche diode photon counter may generate spontaneous after-pulsing with the probability of 10 -3 .
- Avalanche photon counters, as well as photomultiplier tubes, suffer from thermal noise which appears as stochastic counts.
- the afterpulsing and the noise can be eliminated with the following alternative methods.
- Auto-correlating the signals form avalanche photon counters with a threshold of 3 counts or higher eliminates the background caused by after-pulsing, but this is made at the cost of detection efficiency.
- By dividing the emission beam into two parts with a 50%/50% beam splitter for two separate photon counters and using a cross-correlator it is possible to discriminate the after-pulses and thermal noise.
- the increased optical losses can be compensated with increased laser power.
- the discrimination power between the background counts and the true counts from the particles can be enhanced further by cross-correlating the signals obtained from detectors (9), (10) and (11).
- the correlation analysis of the single photon counts can include both auto-correlation analysis and cross-correlation analysis.
- the auto-correlation analysis is based on registration of the time intervals between the photon counts from each detector.
- Application of the correlation analysis for two or several independent photon detectors is called cross-correlation.
- the emitted photons from the true particles, detected by one or several detectors during the transit time of the particle can correlate in the time domain and within the following correlation parameters: correlation time, correlation thresholds as a minimum number of counts per detector, coincidence threshold defined for the condition of coincident counts from independent detectors. These correlation parameters are adjustable for optimal discrimination of non-specific photon counts.
- the device (12) in Fig. 1 performing the correlation analysis for single photon bursts can be an electronic logic circuit, which gives an output signal if a pre-set number of single photon counts from each detector arrives within a pre-set period of time.
- the circuit may also perform more complex correlation functions or the circuit may be replaced by special computing software which is loaded into a dedicated signal processor or onto a conventional computer.
- the transit time of a microparticle is 100 microseconds. Since the microparticles arrive randomly to the laser beam, and because a combination of two particles or more is not allowed, the counting frequency of the microparticles can at most be 1000 microparticles/s. If, for example, 10000 microparticles of each kind are to be counted and if there are 10 different kinds, then altogether it would take 100 s to measure one sample.
- Fig. 1 The set-up shown in Fig. 1 was tested in single-photon excitation confocal fluorescence mode with a test-sample of Rhodamine-B dissolved in water in a predetermined concentration.
- a continuous wave frequency doubled Nd:YAG laser producing 532 nm wavelength was used as a light source.
- the illumination light was focused to the sample (3) with a microscope objective (2b) with numerical aperture of 0.7.
- the sample (3) was placed in a position adjustable capillary tube (4) in conjunction with a simple liquid handling system.
- the emitted fluorescence light was separated from the illumination light by a dichroic filter (5) and a pinhole (6), and detected by a photomultiplier tube (9).
- the limit of detection was 50 molecules in the focal volume.
- the sensitivity was limited mainly by the background fluorescence and scattering from the optical components.
- the dynamic range of the confocal measurement was estimated to be about 3-4 orders of magnitude - the upper end was limited by the maximum concentration of the dye before self-quenching in the sample becomes significant.
- the measurement was performed in two-photon excitation mode with a Q-switched (pulsed) Nd:YAG laser operating at 1064 nm wavelength and 20 kHz repeat rate.
- the photo-detector dark current was a significant source of background noise but a cross-correlation circuit reduced this background by a factor of 100.
- the rest of background was caused by second harmonic generation of 532 nm photons at the focal point, but this was suppressed using appropriate filters.
- the limit of detection was 1 molecule in the focal volume without cross-correlation and without second harmonic suppression filters. In two-photon excitation self-quenching does not play any role.
- Fig. 5 shows the single photon count rate as a function of number of molecules in the focal volume.
- the method and related device is subject to a statistical measurement error which may be significant if the test result is based on only one microparticle.
- the imprecision is caused by the following factors, for example: the microparticles have a limited monodispersity, the liquid handling system does not provide precise hydrodynamic focusing, the count rate from one microparticle is very limited at lowest concentrations of the analyte.
- the statistical precision of the method it is necessary to measure a large number of microparticles representing different analytes. As it has been discussed above in this text, averaging the results from 1000 or 10000 microparticles ensures sufficient precision in a reasonable time.
- identification of the category can be made using fluorescent indicators D k . It also important that the signal from these indicators does dot interfere with the signal obtained from the label F. Spectral filtering does not ensure sufficient separation of the signals obtained from F and D k . This is particularly true if the fluorescence emission spectra overlap and the signals cover a large dynamic intensity range. For reducing these problems we introduce examples of optical set-ups which ensure sufficient separation.
- the fundamental 1064 nm beam from a pulsed Q-switched Nd:YAG laser (14) is frequency doubled in a crystal (15).
- the 1064 nm and the frequency doubled 532 nm wavelength within the same beam is spit in two beams by a dichroic mirror (16).
- the 532 nm beam is conducted through a long fibre (17) thus delaying it by e.g. 500 ns and then combined again with the 1064 nm beam in the dichroic mirror (18).
- the light pulses at 1064 nm and 532 nm appear with 500 ns intervals and are focused to same focal point (22) in the capillary cuvette (23) with lenses (19), (20) and (21a).
- the set-up is equipped with an appropriate number of photon detectors. For simplicity, only two detectors (28) and (29) are shown in Fig. 6.
- the emission from the sample is collected by the objective lens (21a) and dichroic mirrors (24) and (25) and lenses (26a) and (26b) through pinholes (27a) and (27b) to detectors (28) and (29) which are connected to an appropriate signal analysis system.
- the identification signal D k and the signal F appear at different times, which are separated by the delay time of 500 ns.
- the signal analysis is synchronised with the pulse laser and the temporal separation eliminates any possible interference between F and D k .
- the instrumental set-up applicable for this example comprises a pulsed Q-switched Nd:YAG laser (31) with 1064 nm beam used for excitation of phycoerythrin.
- the system comprises an other laser, e.g. a pulsed diode laser at 630 nm (32).
- the beams of these lasers are combined using a dichroic mirror (33) and then focused to the same focal point (34) in the capillary cuvette (35) with lenses (36), (37) and (38).
- the set-up is equipped with an appropriate number of photon detectors. In Fig. 7 only two detectors (39) and (40) are shown for simplicity.
- the emission from the sample is collected by the objective lens (38), dichroic mirrors (41) and (42) and lenses (43a) and (43b) through pinholes (44a) and (44b) to detectors (40) and (39) which are connected to appropriate signal analysis system.
- the identification signal D k and the signal F appear at different times because the pulse lasers are activated at different times respectively.
- the signal analysis is synchronised with the lasers and the temporal separation eliminates the possible interference between F and D k .
- the long shift between the emission bands of phycoerythrin and cyanine dyes further enhances the separation.
- the instrumental set-up applicable for this example comprises a pulsed or CW Nd:YAG laser (14) producing a 1064 nm beam.
- the 1064 nm beam is focused to the sample (22) in the capillary cuvette (23) with lenses (19), (20) and (21a).
- This set-up needs a photon detector (28) for fluorescence emission from label F.
- the emission from the sample is collected by the objective lens (21a) and dichroic mirrors (25) and lens (26a) through the pinhole (27a) to the detector (28) which are connected to an appropriate signal analysis system.
- a detection system for Raman scattering is needed. Raman detection can take place either by a separate 90° objective lens (21b) or by the same objective lens (21a) as used for fluorescence. In both cases, Raman scattering will be focused to a pinhole (27b) or (27c) and detected with an appropriate Raman detector (29) or (30). Identification of the microparticle category on the basis of its Raman spectrum can be performed using several alternative and commonly known detection methods.
- the spectral features specific for microparticles in different categories can be registered with several photon detectors with appropriate spectral filters.
- registration of the spectrum or its interferogram can be made using e.g. a conventional grating spectrometer or an interferometer, which are coupled to an array detector providing continuous spectrum with adequate resolution.
- concentration of the indicators in the microparticle polymer can be high.
- the intensity of the Nd-YAG-laser is high enough to produce a signal in a short time and strong enough for reliable identification.
- the identification of the category i.e. correlation of spectral features, can be performed very fast and simply using known correlation calculation methods.
- a coumarin derivative as fluorescent label F and a set of tetrapyrrolic or cyanine dyes as identification indicators D k .
- the idea of this example is to use two photon excitation at 820 nm for coumarin and single photon excitation at 410 nm for tetrapyrrolic dyes.
- the instrumental set-up applicable to this example is similar with that used in Example 3, except the laser which in this example is a diode pumped CrLi-Sapphire laser with 80 MHz pulse rate, 30 fs pulse width, 0.5 nJ pulse energy and adjustable 820-900 nm wavelength.
- the laser is connected to a frequency doubling crystal for the 410 nm line and to a fibre delay line.
- the high pulse frequency prerequisites lead to shorter delay times and faster single photon counting.
- the identification signal D k and the signal F appear at different times which are separated by the delay time.
- the signal analysis is synchronised with the laser pulses and the temporal separation eliminates any possible interference between F and D k .
- the instrumental set-up applicable for this example comprises a CW frequency doubled Md:YAG laser (31) with 532 nm beam for D k and another laser, e.g. a diode laser at 785 nm (32) for excitation of F. Otherwise, the set-up follows the same principles as in Example 4. The long shift between the emission bands of phycoerythrin and the cyanine dye enhances the separation.
Claims (4)
- Procédé de dosage multiparamétrique biospécifique basé sur l'utilisationledit procédé comprenant les étapes consistant àde différentes catégories de microparticules sous forme de phase solide représentant différentes analytes à doser, chaque catégorie de microparticules étant revêtue d'un réactif biospécifique primaire différent, dans lequel un ou plusieurs indicateurs Dk ont été ajoutés auxdites microparticules ou bien sont compris dans la structure moléculaire desdites microparticules à raison d'une ou plusieurs concentrations, etde réactifs biospécifiques secondaires marqués avec une marque photoluminescente F,caractérisé en ce que la marque photoluminescente F est une marque fluorescente avec un durée d'extinction courte et que l'excitation et la détection de la marque F sont réalisées soit avec une excitation à deux photons soit avec un bloc optique confocal.grouper les différentes catégories de microparticules ensemble dans une suspension et ajouter l'échantillon contenant les analytes à doser dans la suspension,ajouter un mélange de réactifs biospécifiques secondaires marqués avec la marque photoluminescente F dans la suspension pour amorcer les réactions biospécifiques entre les analytes et les réactifs marqués et les réactifs liés aux microparticules,diluer la suspension afin de réduire la concentration des réactifs marqués non liés aux microparticules,activer les indicateurs Dk et la marque photoluminescence F,mesurer l'émission photonique provenant des indicateurs Dk pour identifier les catégories de microparticules et mesurer l'émission photonique provenant de la marque F pour déterminer la concentration d'analyte
- Procédé selon la revendication 1, caractérisé en ce que l'indicateur Dk est un jeu de colorants fluorescents comprenant un ou plusieurs composés tétrapyrroliques choisis dans le groupe formé par la porphyrine, le chlore, la bactériochlorine, la purpurine, le phéophorbide, la phtalocyanine et napthalocyanine ; ou les composés cyanine choisis dans le groupe formé parlesdits composés tétrapyrroliques ou lesdits composés cyanine ayant essentiellement la même longueur d'onde d'excitation et des bandes d'émission de fluorescence, spectrométriquement résolubles, étroites et séparées.le perchlorate de 3,3'-diéthylthiatricarbocyanine;l'iodure de 1,1'-diéthyl-2,2',-dicarbocyanine;l'iodure de 3,3'-diéthyloxadicarbocyanine;l'iodure de 3,3'-diéthyloxatricarbocyanine;l'iodure de 3,3'-diéthylthiadicarbocyanine;l'iodure de 3,3'-diéthylthiatricarbocyanine ;les colorants lasers commerciaux IR-125, IR-132, IR-140 ou TR-144 ;
- Procédé selon la revendication 2, caractérisé en ce que les composés tétrapyrroliques sont choisis dans le groupe formé par 1) la deutéroporphyrine IX, 2) la mésoporphyrine IX, 3) l'ester dimethylique (IX) de la proto-porphyrine, 4) l'actaéthylporphine, 5) la tétraphénylporphine, 6) la tétra-(2-méthoxy)-phénylporphine, 7) la chlorine de l'ester diméthylique de la coproporphyrine, 8) la bactériochlorine de l'ester diméthylique de la coproporphyrine, 9) la phtalocyanine d'aluminium ou 10) la phtalocyanine de zinc qui présentent une sensibilité très faible à l'excitation à deux photons.
- Procédé selon la revendication 1, caractérisé en ce que les indicateurs Dk sont des composés ajoutés aux microparticules ou à une structure moléculaire de la microparticule, lesdits composés ou structures moléculaires étant identifiables sur la base de leurs spectres Raman.
Applications Claiming Priority (5)
| Application Number | Priority Date | Filing Date | Title |
|---|---|---|---|
| FI950175A FI96641C (fi) | 1995-01-16 | 1995-01-16 | Biospesifinen määritysmenetelmä |
| FI950175 | 1995-01-16 | ||
| FI951040A FI101829B (fi) | 1995-03-07 | 1995-03-07 | Biospesifinen määritysmenetelmä |
| FI951040 | 1995-03-07 | ||
| PCT/FI1996/000004 WO1996022531A1 (fr) | 1995-01-16 | 1996-01-03 | Procede de dosage multiparametrique biospecifique |
Publications (2)
| Publication Number | Publication Date |
|---|---|
| EP0804732A1 EP0804732A1 (fr) | 1997-11-05 |
| EP0804732B1 true EP0804732B1 (fr) | 2001-10-10 |
Family
ID=26159871
Family Applications (1)
| Application Number | Title | Priority Date | Filing Date |
|---|---|---|---|
| EP96900108A Expired - Lifetime EP0804732B1 (fr) | 1995-01-16 | 1996-01-03 | Procede de dosage multiparametrique biospecifique |
Country Status (5)
| Country | Link |
|---|---|
| US (1) | US5891738A (fr) |
| EP (1) | EP0804732B1 (fr) |
| JP (1) | JP3215428B2 (fr) |
| DE (1) | DE69615818T2 (fr) |
| WO (1) | WO1996022531A1 (fr) |
Families Citing this family (53)
| Publication number | Priority date | Publication date | Assignee | Title |
|---|---|---|---|---|
| FI98765C (fi) * | 1995-01-16 | 1997-08-11 | Erkki Soini | Virtaussytometrinen menetelmä ja laite |
| FI954511A0 (fi) * | 1995-09-22 | 1995-09-22 | Labsystems Oy | Fluorometer |
| WO1998025143A1 (fr) * | 1996-12-03 | 1998-06-11 | Erkki Soini | Detection et dispositif de detection de fluorescence biospecifique, par excitation a deux photons |
| US6310354B1 (en) | 1996-12-03 | 2001-10-30 | Erkki Soini | Method and a device for monitoring nucleic acid amplification reactions |
| GB9804083D0 (en) | 1998-02-26 | 1998-04-22 | Univ Strathclyde | Immunoassays |
| FI981272A (fi) * | 1998-06-04 | 1999-12-05 | Erkki Juhani Soini | Homogeeninen biospesifinen määritysmenetelmä |
| US6342397B1 (en) * | 1998-06-04 | 2002-01-29 | Erkki Soini | Homogeneous biospecific assay using a solid phase, two-photon excitation and confocal fluorescence detection |
| US7737088B1 (en) * | 1998-08-28 | 2010-06-15 | Febit Holding Gmbh | Method and device for producing biochemical reaction supporting materials |
| US20030096433A1 (en) * | 1999-03-03 | 2003-05-22 | Evotec Analytical Systems Gmbh | Homogeneous fluorescence assay |
| EP1190232A1 (fr) * | 1999-06-26 | 2002-03-27 | Packard Instrument Company, Inc. | Lecteur pour microplaques |
| SE9902479D0 (sv) * | 1999-06-30 | 1999-06-30 | Amersham Pharm Biotech Ab | Particle classification as marker |
| EP1203218A1 (fr) * | 1999-07-30 | 2002-05-08 | California Institute of Technology | Systeme et procede de controle de l'activite cellulaire |
| US20040023293A1 (en) * | 1999-09-27 | 2004-02-05 | Kreimer David I. | Biochips for characterizing biological processes |
| US20030232388A1 (en) * | 1999-09-27 | 2003-12-18 | Kreimer David I. | Beads having identifiable Raman markers |
| US20020132371A1 (en) * | 1999-09-27 | 2002-09-19 | Kreimer David I. | Amplification of analyte detection by substrates having particle structures with receptors |
| US8497131B2 (en) * | 1999-10-06 | 2013-07-30 | Becton, Dickinson And Company | Surface enhanced spectroscopy-active composite nanoparticles comprising Raman-active reporter molecules |
| US7192778B2 (en) * | 1999-10-06 | 2007-03-20 | Natan Michael J | Surface enhanced spectroscopy-active composite nanoparticles |
| EP1282818A2 (fr) * | 2000-03-31 | 2003-02-12 | Glaxo Group Limited | Methode permettant d'etudier des interactions moleculaires fonctionnelles et reactifs utilises a cet effet |
| EP1365241A2 (fr) * | 2000-08-21 | 2003-11-26 | Darashkevitch, Oleg | Procede et dispositif de detection simultanee de plusieurs composants dans un melange |
| WO2002057743A2 (fr) * | 2001-01-17 | 2002-07-25 | Streamline Proteomics, Llc. | Methodes d'analyse et de triage d'un ou de plusieurs analytes |
| US6861263B2 (en) * | 2001-01-26 | 2005-03-01 | Surromed, Inc. | Surface-enhanced spectroscopy-active sandwich nanoparticles |
| US6707548B2 (en) | 2001-02-08 | 2004-03-16 | Array Bioscience Corporation | Systems and methods for filter based spectrographic analysis |
| WO2002074899A1 (fr) * | 2001-03-15 | 2002-09-26 | Array Bioscience Corporation | Surfaces d'optimisation pour la detection d'analysats |
| DE10120425C2 (de) * | 2001-04-26 | 2003-12-18 | Leica Microsystems | Scanmikroskop |
| CN1257408C (zh) | 2001-07-02 | 2006-05-24 | 北极医疗诊断有限公司 | 双光子吸收二吡咯亚甲基二氟化硼染料及其应用 |
| US8119041B2 (en) * | 2001-09-05 | 2012-02-21 | Fujifilm Corporation | Non-resonant two-photon absorption induction method and process for emitting light thereby |
| DE10156612A1 (de) * | 2001-11-20 | 2003-05-28 | Markus Klotz | Verfahren zum Bestimmen von Substanzen in einer flüssigen oder gasförmigen Probe |
| US20030232394A1 (en) * | 2002-06-12 | 2003-12-18 | Aventis Pharma Deutschland Gmbh | High throughput screening method and assay system for determining the interaction between C-reactive protein and components binding to it |
| US8227256B2 (en) * | 2002-09-27 | 2012-07-24 | Saloma Caesar A | Two-color (two-photon) excitation with focused excitation beams and a raman shifter |
| US20040131969A1 (en) * | 2002-10-07 | 2004-07-08 | Fuji Photo Film Co., Ltd. | Non-resonant two-photon absorbing material, non-resonant two-photon emitting material, method for inducing absorption of non-resonant two-photons and method for generating emission of non-resonant two-photons |
| US7432036B2 (en) | 2002-10-07 | 2008-10-07 | Fujifilm Corporation | Non-resonant two-photon absorbing material, non-resonant two-photon emitting material, and method for inducing absorption or generating emission of non-resonant two photons by using the material |
| JP2006504937A (ja) * | 2002-10-31 | 2006-02-09 | シェモメテック・アクティーゼルスカブ | 粒子の評価方法 |
| US20040175843A1 (en) * | 2003-03-04 | 2004-09-09 | Roitman Daniel B. | Near-field and far-field encoding and shaping of microbeads for bioassays |
| US20040175842A1 (en) * | 2003-03-04 | 2004-09-09 | Roitman Daniel B. | Near-field and far-field encoding of microbeads for bioassays |
| DE10335471A1 (de) * | 2003-08-02 | 2005-03-03 | Leica Microsystems Heidelberg Gmbh | Detektor und Verfahren zur Detektion schwacher fluoreszenter Strahlung mit einem Mikroskopsystem |
| US7919325B2 (en) * | 2004-05-24 | 2011-04-05 | Authentix, Inc. | Method and apparatus for monitoring liquid for the presence of an additive |
| JP2009523406A (ja) * | 2005-11-15 | 2009-06-25 | オクソニカ・インコーポレーテッド | 生体剤(bioagents)の検出のためのSERSに基づく方法 |
| US7595864B2 (en) * | 2005-11-18 | 2009-09-29 | Gonzalez Cruz Jorge E | Optical sensor for the instantaneous detection and identification of bioaerosols |
| US8409863B2 (en) | 2005-12-14 | 2013-04-02 | Becton, Dickinson And Company | Nanoparticulate chemical sensors using SERS |
| US7723100B2 (en) | 2006-01-13 | 2010-05-25 | Becton, Dickinson And Company | Polymer coated SERS nanotag |
| WO2007090058A2 (fr) * | 2006-01-27 | 2007-08-09 | Oxonica, Inc. | Immunoessai de flux latéral faisant intervenir des particules encapsulées en tant que modalité de détection |
| WO2008014223A2 (fr) * | 2006-07-24 | 2008-01-31 | Becton, Dickinson And Company | Bioessai à concentration de particules, appareil d'imagerie, et méthode |
| US7532128B2 (en) * | 2006-10-25 | 2009-05-12 | Alverix, Inc. | Position sensitive indicator detection |
| JP2008145309A (ja) * | 2006-12-12 | 2008-06-26 | Fujifilm Corp | 表面プラズモン増強蛍光センサ |
| WO2009134822A2 (fr) * | 2008-05-01 | 2009-11-05 | The Government Of The United States Of America, As Represented By The Secretary Of The Navy | Nanoparticules organiques fluorescentes |
| EP2414536B1 (fr) | 2009-04-03 | 2014-06-18 | Battelle Memorial Institute | Identification raman de micro-organismes viables fluorescence poussé |
| FI20095501A0 (fi) | 2009-05-04 | 2009-05-04 | Pekka Haenninen | Menetelmä näytteiden karakterisoimiseksi ja/tai määrittämiseksi |
| US8816284B2 (en) * | 2010-03-30 | 2014-08-26 | Lawrence Livermore National Security, Llc. | Room-temperature quantum noise limited spectrometry and methods of the same |
| US9588113B2 (en) | 2012-02-22 | 2017-03-07 | Church & Dwight Co., Inc. | Methods for electronic analyte assaying |
| US9933341B2 (en) | 2012-04-05 | 2018-04-03 | Becton, Dickinson And Company | Sample preparation for flow cytometry |
| CA2869472C (fr) * | 2012-04-05 | 2017-07-11 | Becton, Dickinson And Company | Preparation d'echantillon pour cytometrie de flux |
| DE102016110210B4 (de) * | 2016-06-02 | 2022-02-10 | Leibniz - Institut Für Analytische Wissenschaften - Isas - E.V. | Spektrometer |
| US10578542B2 (en) * | 2017-10-16 | 2020-03-03 | Becton, Dickinson And Company | Multi-photon counting for high sensitivity flow cytometer systems and methods for using the same |
Family Cites Families (15)
| Publication number | Priority date | Publication date | Assignee | Title |
|---|---|---|---|---|
| US4421860A (en) * | 1980-10-07 | 1983-12-20 | The Regents Of The University Of California | Homogeneous fluoroimmunoassay involving autocorrelation processing of optically sensed signals |
| SE458968B (sv) * | 1987-06-16 | 1989-05-22 | Wallac Oy | Biospecifikt analysfoerfarande foer flera analyter i vilket ingaar partikelraekning och maerkning med fluorescerande maerksubstanser |
| US5376556A (en) * | 1989-10-27 | 1994-12-27 | Abbott Laboratories | Surface-enhanced Raman spectroscopy immunoassay |
| US5034613A (en) * | 1989-11-14 | 1991-07-23 | Cornell Research Foundation, Inc. | Two-photon laser microscopy |
| JP3049254B2 (ja) * | 1990-02-08 | 2000-06-05 | シスメックス株式会社 | 2種類の光源を備えた光学式粒子分析装置 |
| US5196709A (en) * | 1991-05-03 | 1993-03-23 | University Of Maryland Systems | Fluorometry method and apparatus using a semiconductor laser diode as a light source |
| JPH04337446A (ja) * | 1991-05-15 | 1992-11-25 | Hitachi Ltd | 微粒子計測方法、定量方法および微粒子計測装置 |
| EP0606422B1 (fr) * | 1992-07-02 | 1997-09-03 | SOINI, Erkki | Methode d'analyse biospecifique portant sur plusieurs parametres |
| US5674698A (en) * | 1992-09-14 | 1997-10-07 | Sri International | Up-converting reporters for biological and other assays using laser excitation techniques |
| ATE266195T1 (de) * | 1992-09-14 | 2004-05-15 | Stanford Res Inst Int | Up-converting reporter molekül für biologische und andere testverfahren unter verwendung von laseranregungstechniken |
| US5736410A (en) * | 1992-09-14 | 1998-04-07 | Sri International | Up-converting reporters for biological and other assays using laser excitation techniques |
| FI925064A (fi) * | 1992-11-09 | 1994-05-10 | Erkki Juhani Soini | Metod och apparatur foer bioaffinitetsbestaemningar |
| JP3517241B2 (ja) * | 1993-01-18 | 2004-04-12 | エボテック バイオシステムズ アクチェン ゲゼルシャフト | 生体高分子の適応度を評価するための方法および装置 |
| FI96452C (fi) * | 1994-01-26 | 1996-06-25 | Pekka Haenninen | Menetelmä väriaineiden virittämiseksi |
| US5759767A (en) * | 1996-10-11 | 1998-06-02 | Joseph R. Lakowicz | Two-photon and multi-photon measurement of analytes in animal and human tissues and fluids |
-
1996
- 1996-01-03 DE DE69615818T patent/DE69615818T2/de not_active Expired - Lifetime
- 1996-01-03 US US08/817,753 patent/US5891738A/en not_active Expired - Lifetime
- 1996-01-03 EP EP96900108A patent/EP0804732B1/fr not_active Expired - Lifetime
- 1996-01-03 WO PCT/FI1996/000004 patent/WO1996022531A1/fr active IP Right Grant
- 1996-01-03 JP JP52206296A patent/JP3215428B2/ja not_active Expired - Fee Related
Non-Patent Citations (1)
| Title |
|---|
| Excerpt from: Ulrich Brackmann, Lambda Physik AG "Lambdachrome Laser Dyes", D-37079 Goettingen, Germany * |
Also Published As
| Publication number | Publication date |
|---|---|
| WO1996022531A1 (fr) | 1996-07-25 |
| EP0804732A1 (fr) | 1997-11-05 |
| US5891738A (en) | 1999-04-06 |
| JP3215428B2 (ja) | 2001-10-09 |
| JPH10512670A (ja) | 1998-12-02 |
| DE69615818T2 (de) | 2002-06-06 |
| DE69615818D1 (de) | 2001-11-15 |
Similar Documents
| Publication | Publication Date | Title |
|---|---|---|
| EP0804732B1 (fr) | Procede de dosage multiparametrique biospecifique | |
| JP3535174B2 (ja) | 生物特異性アッセイ法 | |
| US5026159A (en) | Area-modulated luminescence (AML) | |
| US4146604A (en) | Differential counting of leukocytes and other cells | |
| US5028545A (en) | Biospecific multianalyte assay method | |
| US6420183B1 (en) | Masking background fluorescence and luminescence in optical analysis of biomedical assays | |
| JP4201058B2 (ja) | 中間統計データに基づいて試料を特徴付けする方法 | |
| EP1797195B1 (fr) | Procede et appareil pour la detection d'elements de marquage dans un echantillon | |
| US5190857A (en) | Optical method for measuring an analyte using area-modulated luminescence | |
| JP2005104980A (ja) | レーザー励起技術を用いる生物学的および他の分析のためのアップコンバート性レポータ | |
| US6384914B1 (en) | Method for optical detection of analyte molecules in a natural biological medium | |
| Soini et al. | Two-photon fluorescence excitation in detection of biomolecules | |
| JP3400430B2 (ja) | 固相、二光子励起および共焦点蛍光検出を用いた生体特異的均一アッセイ | |
| US6342397B1 (en) | Homogeneous biospecific assay using a solid phase, two-photon excitation and confocal fluorescence detection | |
| Yamamoto et al. | Quantum approach for nanoparticle fluorescence by sub‐ns photon detection | |
| CA2532871C (fr) | Methode et systeme de distinction entre des matieres presentant des spectres chevauchants | |
| Wright et al. | Flow cytometry with upconverting phosphor reporters | |
| FI96641B (fi) | Biospesifinen määritysmenetelmä | |
| FI104586B (fi) | Menetelmä bioaffiniteettireaktion reaaliaikaista seuraamista varten | |
| FI90695B (fi) | Biospesifinen määritysmenetelmä |
Legal Events
| Date | Code | Title | Description |
|---|---|---|---|
| PUAI | Public reference made under article 153(3) epc to a published international application that has entered the european phase |
Free format text: ORIGINAL CODE: 0009012 |
|
| 17P | Request for examination filed |
Effective date: 19970313 |
|
| AK | Designated contracting states |
Kind code of ref document: A1 Designated state(s): DE FR GB SE |
|
| 17Q | First examination report despatched |
Effective date: 20000613 |
|
| GRAG | Despatch of communication of intention to grant |
Free format text: ORIGINAL CODE: EPIDOS AGRA |
|
| GRAG | Despatch of communication of intention to grant |
Free format text: ORIGINAL CODE: EPIDOS AGRA |
|
| GRAH | Despatch of communication of intention to grant a patent |
Free format text: ORIGINAL CODE: EPIDOS IGRA |
|
| RIN1 | Information on inventor provided before grant (corrected) |
Inventor name: SOINI, JUHANI Inventor name: HAENNINEN, PEKKA Inventor name: SOINI, ERKKI |
|
| GRAH | Despatch of communication of intention to grant a patent |
Free format text: ORIGINAL CODE: EPIDOS IGRA |
|
| GRAA | (expected) grant |
Free format text: ORIGINAL CODE: 0009210 |
|
| AK | Designated contracting states |
Kind code of ref document: B1 Designated state(s): DE FR GB SE |
|
| REF | Corresponds to: |
Ref document number: 69615818 Country of ref document: DE Date of ref document: 20011115 |
|
| ET | Fr: translation filed | ||
| REG | Reference to a national code |
Ref country code: GB Ref legal event code: IF02 |
|
| PLBE | No opposition filed within time limit |
Free format text: ORIGINAL CODE: 0009261 |
|
| STAA | Information on the status of an ep patent application or granted ep patent |
Free format text: STATUS: NO OPPOSITION FILED WITHIN TIME LIMIT |
|
| 26N | No opposition filed | ||
| PGFP | Annual fee paid to national office [announced via postgrant information from national office to epo] |
Ref country code: FR Payment date: 20120209 Year of fee payment: 17 |
|
| PGFP | Annual fee paid to national office [announced via postgrant information from national office to epo] |
Ref country code: DE Payment date: 20120125 Year of fee payment: 17 |
|
| PGFP | Annual fee paid to national office [announced via postgrant information from national office to epo] |
Ref country code: SE Payment date: 20120124 Year of fee payment: 17 Ref country code: GB Payment date: 20120130 Year of fee payment: 17 |
|
| REG | Reference to a national code |
Ref country code: SE Ref legal event code: EUG |
|
| GBPC | Gb: european patent ceased through non-payment of renewal fee |
Effective date: 20130103 |
|
| REG | Reference to a national code |
Ref country code: FR Ref legal event code: ST Effective date: 20130930 |
|
| PG25 | Lapsed in a contracting state [announced via postgrant information from national office to epo] |
Ref country code: DE Free format text: LAPSE BECAUSE OF NON-PAYMENT OF DUE FEES Effective date: 20130801 Ref country code: SE Free format text: LAPSE BECAUSE OF NON-PAYMENT OF DUE FEES Effective date: 20130104 |
|
| REG | Reference to a national code |
Ref country code: DE Ref legal event code: R119 Ref document number: 69615818 Country of ref document: DE Effective date: 20130801 |
|
| PG25 | Lapsed in a contracting state [announced via postgrant information from national office to epo] |
Ref country code: FR Free format text: LAPSE BECAUSE OF NON-PAYMENT OF DUE FEES Effective date: 20130131 Ref country code: GB Free format text: LAPSE BECAUSE OF NON-PAYMENT OF DUE FEES Effective date: 20130103 |