EP0612183B1 - Procédé pour corriger l'équilibre du gris d'une image en couleur enrégistrée sur un film négatif - Google Patents
Procédé pour corriger l'équilibre du gris d'une image en couleur enrégistrée sur un film négatif Download PDFInfo
- Publication number
- EP0612183B1 EP0612183B1 EP94100879A EP94100879A EP0612183B1 EP 0612183 B1 EP0612183 B1 EP 0612183B1 EP 94100879 A EP94100879 A EP 94100879A EP 94100879 A EP94100879 A EP 94100879A EP 0612183 B1 EP0612183 B1 EP 0612183B1
- Authority
- EP
- European Patent Office
- Prior art keywords
- density
- image
- values
- max
- gray balance
- Prior art date
- Legal status (The legal status is an assumption and is not a legal conclusion. Google has not performed a legal analysis and makes no representation as to the accuracy of the status listed.)
- Expired - Lifetime
Links
Images


Classifications
-
- H—ELECTRICITY
- H04—ELECTRIC COMMUNICATION TECHNIQUE
- H04N—PICTORIAL COMMUNICATION, e.g. TELEVISION
- H04N1/00—Scanning, transmission or reproduction of documents or the like, e.g. facsimile transmission; Details thereof
- H04N1/46—Colour picture communication systems
- H04N1/56—Processing of colour picture signals
- H04N1/60—Colour correction or control
- H04N1/6083—Colour correction or control controlled by factors external to the apparatus
- H04N1/6086—Colour correction or control controlled by factors external to the apparatus by scene illuminant, i.e. conditions at the time of picture capture, e.g. flash, optical filter used, evening, cloud, daylight, artificial lighting, white point measurement, colour temperature
-
- H—ELECTRICITY
- H04—ELECTRIC COMMUNICATION TECHNIQUE
- H04N—PICTORIAL COMMUNICATION, e.g. TELEVISION
- H04N1/00—Scanning, transmission or reproduction of documents or the like, e.g. facsimile transmission; Details thereof
- H04N1/46—Colour picture communication systems
- H04N1/56—Processing of colour picture signals
- H04N1/60—Colour correction or control
- H04N1/6027—Correction or control of colour gradation or colour contrast
Definitions
- the present invention relates to a gray balance correcting method for correcting the gray balance of an image recorded on a negative film.
- the exposure of R is set large for an image with a small amount of transmitted light (high in the accumulated transmission density of R), so that the total amount of each of the R, G and B light radiated onto print paper, through a negative film, is made coincident with each other when printing on the print paper is based on the exposure calculated as described above. Accordingly, the accumulated density values of R, G and B in an image printed on the print paper are made constant so that the gray balance is maintained over the entire image.
- the density change characteristics of the respective colors in the negative film are affected by processing conditions such as development, etc., so that the slopes of the curves of the density change characteristics are different, as shown in Fig. 1(B).
- the slopes of the curves for the density change characteristics for the respective colors are different, displacements in these curves occur in a region (for example, region A shown in Fig. 1(C)) in which the densities are higher than the predetermined values as compared with the accumulated transmission densities.
- a region for example, region B shown in Fig. 1(C)
- the densities are lower than the predetermined values.
- gray balance is not maintained, and the undesirable situation arises where the colors in the portions of the image that correspond to the aforementioned regions of the image printed on the print paper, are different from the colors of the subject at the time of photographing.
- Density failure occurs in situations where the background portion of an image has an extremely high or low density level. In such situations the accumulated transmission density differs greatly from the density of the main subject portion of the image. This is called density failure.
- density failure occurs in situations where the background portion of an image has an extremely high or low density level. In such situations the accumulated transmission density differs greatly from the density of the main subject portion of the image. This is called density failure.
- the image is affected by the density failure so that the exposure of the main subject portion of the image becomes either short or excessive.
- Color failure occurs in situations where the background portion of an image is wide and is comprised of a specific color, such as green grass, or blue sea, etc., and greatly differs from the color of the main subject. In such a situation the accumulated transmission density of the specific color is high. The result is that the color balance across the entire scene is greatly biassed against the color balance of the main subject. This is called color failure.
- the aforementioned image is printed on print paper with the basis of exposure determined by applying the integral neutral method, the image is affected by the color failure so that the color balance of the main subject portion in the image is not maintained. This problem also occurs when the accumulated transmission density of equation (1) is replaced by the average density of the entire scene.
- an object of the present invention is to provide a gray balance correcting method in which the color balance correction capacity, with respect to an image photographed by a specific light source, is prevented from being reduced and in which the influence of failure can be eliminated.
- a white or near white portion is contained in a subject of the photograph. This is because a reflected portion of the light source looks white except for the case where the color of the subject is simply white.
- White is the brightest color, so that a region corresponding to the white or near white portion of the subject, in an image formed on a negative film, has the highest three-color density values in the image.
- the color of the white or near white portion is affected by the color of light from the light source, so that the color is slightly shifted from white. For example, when a fluorescent lamp is used as a light source, a green component is added, on the whole, to the white portion of the subject.
- this predetermined region is the portion of the image having the highest three-color density values.
- an image recorded on a negative film is divided into a large number of regions. Density values of the three colors corresponding to the pigment density of the film are measured for the respective regions, and maximum reference values for the respective colors are determined based on the measured density values. For example, the maximum of the measured values for the respective colors may be used directly as the maximum reference values, or in order to reduce the influence of dust attached on the film, scratches on the film, or the like, a weighted average may be used as the approximate maximum reference values. To determine the weighted averages, as will be described with respect to an embodiment of the invention, the image is divided into the predetermined number of sections and the maximum values of the measured values are obtained for each section. Once the maximum values are obtained, the weighted average of the maximum values is calculated for each section by applying a predetermined weight to each section. These weighted averages may then be used as the reference value which approximates the maximum value.
- the maximum value may be used, such as an average, or the like, of a specified number of measured values of upper rank in descending order; a value of specified precedence of the measured values approximate to the maximum value; or an average of the measured values in a predetermined range of precedence values.
- conversion correlations are obtained so as to convert the maximum reference values, for each of the respective colors, so that they are coincident with each other.
- the measured values for the three colors are converted by using the conversion correlations.
- This is equivalent to correction of the gray balance based on the maximum reference values of the respective colors which correspond to a white or near white portion of the image, where the color of a region corresponding to the white or near white portion of the subject is corrected to be made white. Accordingly, not only the white portion of the subject in an image photographed under sun light is corrected to be made white, but the white portion containing, for example, the green component in an image photographed by using a fluorescent lamp as a light source is corrected to be made white. That is, the white portion is corrected so that gray balance is maintained.
- the magnitude of the maximum reference value is not affected so that the reference values do not vary. Accordingly, even in the case of an image in which density failure or color failure occurs, density data is obtained which is not influenced by such failures. It is statistically known that even in the case of an image obtained by photographing a subject having no white or near white portion, the maximum density values of the respective colors in the image are made substantially equal to the density values in the white or near white portion. Accordingly, if correction is carried out on the basis of the maximum reference value, color balance can be corrected so as to be appropriate even in the case of an image obtained by photographing the aforementioned subject.
- an image recorded on a negative film is divided into many regions and density values for the three colors are measured for the respective regions.
- Maximum reference values and minimum reference values for the respective colors are determined on the basis of the measured density values.
- the minimum reference values for example, the minimum of the measured values for each of the respective colors may be used directly, or after the image is divided into a predetermined number of sections and the minimum density values are obtained for the respective sections.
- the weighted average of the minimum density values is calculated by applying weights preliminarily set for the respective sections. The weighted average may be used as the minimum reference value.
- the minimum value may be used, such as: an average, or the like, of the specified number of measured values of lower rank in descending order; the value of specified precedence of the measured values approximate to the minimum value; or an average of the measured values in a predetermined range of precedence values.
- the base density of the negative film may be used.
- conversion correlations are obtained so as to convert the maximum reference values, for each respective color, so that they are coincident with each other, and so as to convert the minimum reference values, for each respective color, so that they are coincident with each other.
- the measured values, for each color are converted by using the conversion correlations.
- This is equivalent to correction of color balance by making the maximum reference values of the respective colors correspond to white and the minimum values of the respective colors correspond to black, and coincident at two points. That is, color balance is corrected so that the color of a region corresponding to a white or near white portion of the subject is made white, and that the color of a region corresponding to a black or near black portion contained in the subject is made black, in most cases.
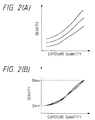
- correction is carried out to make the maximum reference values of the respective colors coincident with each other and to make the minimum reference values of the respective colors coincident with each other. That is, to make the density change characteristics as shown in the Fig. 2(A) coincident at two points, D max and D min , as shown in Fig. 2(B).
- the method of the present invention is a correcting method highly adapted to the psychological perceptions of a human being.
- the correction described in the second aspect of the invention can be performed to obtain appropriate color balance where an image is photographed under different light sources and the influence of density failure or color failure can be eliminated.
- gray balance is corrected by referring to the maximum density portion of the subject, that is, by referring to the white or near white portion of the image in which sun light is reflected.
- gray balance is not maintained in the intermediate density portion of the image when a strobe light is used as a light source.
- the density change characteristics of the respective colors in the negative film are not linear. Accordingly, slight displacement of the gray balance occurs when correction is performed by simply making the maximum reference density and minimum reference density values coincident, as shown in Fig. 2(B).
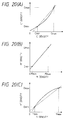
- the average of the density data, in a predetermined region, which contains a line passing through the converted maximum reference value and the converted minimum reference value is calculated based on the distribution, plotted on color coordinates, of the converted density data. Conversion correlations for the respective colors are corrected in accordance with a curve passing through the converted maximum density value, the converted minimum reference value, and the average, as shown in Fig. 19(C). Conversion is again performed by using the corrected conversion correlations to thereby correct the gray balance.
- density data is distributed on or near a line passing through the converted maximum reference value and the converted minimum reference value. However, in the case of an image in which color failure has occurred, the density data distribution can be spread far from the line. This distribution pattern corresponds to a high-saturation portion of the image. Thus, the distribution can be used to determine that the pattern corresponds to the background portion of the image.
- the average of the density data in the predetermined region corresponds to the gray balance of the portion of intermediate density between the converted maximum reference value and the converted minimum value, after the influence of color failure or the like is eliminated.
- the curve passing through the converted maximum reference value, the converted minimum value and the average is an indication expressing appropriate balance between conversion correlations of the respective colors.
- the influence of color failure can be eliminated without reduction of the color balance correction capacity in the case of an image photographed by a plurality of light sources.
- Division of the image is preferably carried out so that the area of each of regions on the negative film is less than or equal to 200 ⁇ m 2 .
- the maximum reference value or the minimum reference value
- the size of the maximum (or minimum) density value exerting an influence on the size of the maximum reference value (or the minimum reference value) varies in accordance with the size of each region obtained by division. That is, when the size of the regions obtained by division is selected to be large, measured density values may be estimated to be smaller so that the maximum value cannot be accurately obtained, since the density of a region having a high density in a small area is also subjected to averaging. This problem may also arise for regions having a low density in a small area.
- Fig. 1 shows a series of graphs for explaining conventional problems
- diagram (A) is a graph showing ideal density change characteristics of the respective colors of a negative image
- diagram (B) is a graph showing real density change characteristics
- diagram (C) is a graph showing density change characteristics corrected to make accumulated transmission densities coincident.
- Fig. 2 shows the operation of the present invention
- 2(A) is a graph showing density change characteristics of the respective colors before correction
- 2(B) is a graph showing density change characteristics which are corrected based on the maximum and minimum reference values.
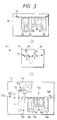
- Fig. 3 is a schematic diagram of a photographic processing system according to the present invention.
- Fig. 4 is a schematic diagram of a film image reader.
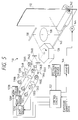
- Fig. 5 is a perspective view showing the schematic structure of a printer portion.
- Fig. 6 is a graph showing the waveform of an exposure control signal delivered to an AOM driver.
- Fig. 7 is a plan view of a negative film for explaining the negative film scene extracting and region dividing procedure and showing the base density measurement region.
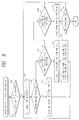
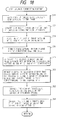
- Fig. 8 is a flow chart showing the main routine in a pre-scan portion of the film image reader.
- Fig. 9 is a flow chart showing the scan-reading procedure of the pre-scan portion.
- Fig. 10 is a flow chart showing the scan-reading procedure of the pre-scan portion in the second embodiment.
- Fig. 11 is a flow chart for explaining the reading procedure in a fine-scan portion in the first embodiment.
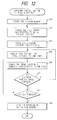
- Fig. 12 is a flow chart for explaining the exposure procedure in a printer portion.
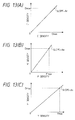
- Figs. 13(A)-(C) are graphs showing the processing for conversion of C, M and Y density into C', M' and Y' density in the first embodiment.
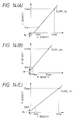
- FIGS. 14(A) to 14(C) are graphs showing the processing for conversion of C, M and Y densities into C', M' and Y' densities in the second embodiment.
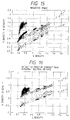
- Fig. 15 is a color coordinate graph showing color balance of respective pixels of a negative image in which R failure has occurred.
- Fig. 16 is a color coordinate graph showing the experimental results of printing by applying an integral neutral method to the negative image of Fig. 15.
- Fig. 17 is a color coordinate graph showing the experimental results of printing by applying the present invention to the negative image of Fig. 15.
- Fig. 18 is a flow chart for explaining the detail of the gray balance correcting procedure in the fine-scan portion of the third embodiment.
- Fig. 19(A) is a graph showing data plotted on color coordinates
- 19(B) is a graph showing a predetermined region S
- 19(C) is a graph showing curves of secondary degree P C and P Y passing through the averages respectively.
- Fig. 20(A)-(C) are graphs for explaining the procedure for converting C, M and Y density into C", M" and Y" density respectively.
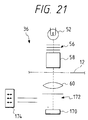
- Fig. 21 is a schematic diagram showing another example of the scan portion.
- a first embodiment relates to a photographic processing system 10 as shown in Fig. 3.
- a large number of negative films 12 are brought into the photographic processing system 10.
- On each negative film are a predetermined number of images that have been taken by a camera, which is not shown.
- the negative films 12 are spliced together by means of splicing tapes, or the like, and rolled so as to be stratified. Then, the roll of negative film is set in a film processor of the photographic processing system 10.
- the film processor has a color development tank 20, a bleach tank 22, a bleach-fixing tank 24, water washing tanks 26 and 28 and a stabilization tank 30 which are arranged in order within the film processor. These treating tanks each hold predetermined treating solutions.
- the negative film 12 set in the film processor is successively fed through each of the respective treating tanks and immersed in the respective treating solutions so that the negative film 12 is subjected to the treatments of color development, bleaching, bleaching-fixing, water washing and stabilization. As a result, negative images, which are recorded as latent images on the negative film 12, are made visible.
- a drying portion 32 is disposed in the downstream side of the stabilization tank 30, and has a fan and a heater, which are not shown. An air stream produced by the fan is heated by the heater to form a hot stream of air. The hot air stream is blown across the negative film 12 so that water deposited on a surface of the negative film 12 is removed by drying. The negative film 12 thus processed by the film processor is rolled so as to be stratified and then set in a film image reader 16.
- the film image reader 16 contains a pre-scan portion 36 and a fine-scan portion 38 which are arranged in order, along a film conveyance path.
- images recorded on the negative film 12 are scan-read, which is described below.
- An insertion detection sensor 40 is provided in the upstream side of the film conveyance path.
- the insertion detection sensor 40 consists of a light-emitting element 40A and a photo-detecting element 40B which form a pair and are arranged so as to be opposite to each other with respect to the film conveyance path.
- the photo-detecting element 40B is connected to a control circuit 42.
- the control circuit 42 determines whether or not the negative film 12 has been inserted in the film conveyance path, on the basis of a change in the level of the signal output from the photo-detecting element 40B.
- a pair of rollers 44 for conveying the negative film 12 while nipping the negative film 12, a read head 46, a frame number detection sensor 48 and a picture detection sensor 50.
- the read head 46, the frame number detection sensor 48 and the picture detection sensor 50 are connected to the control circuit 42.
- a negative film 12 may have information, such as frame number, film type, DX code, etc., magnetically recorded on a magnetic layer. Such a magnetic layer being formed by applying a transparent magnetic material onto the rear surface of the negative film 12.
- the read head 46 is arranged in a position in which the information magnetically recorded on the aforementioned magnetic layer can be read. The read head 46 reads the information and sends it to the control circuit 42.
- the frame number detection sensor 48 and the picture detection sensor 50 each consist of a light-emitting element and a photo-detecting element, which form a pair in the same manner as for the insertion detection sensor 40.
- the negative film 12 may have information, such as frame number, etc., recorded optically (for example, by means of bar code or the like) on the film.
- the frame number sensor 48 is arranged such a position that the optically recorded information can be detected.
- the frame number sensor 48 detects the recorded information such as frame number, etc., and feeds it to the control circuit 42.
- the picture detection sensor 50 is positioned in the center of the width of the negative film 12.
- a non-image portion of the negative film, between the images recorded on the negative film, allows a large quantity of light to be transmitted through negative film, compared with the above-described image recording portion of the film, since the density of the non-image portion is merely the density of the base of the negative film.
- the control circuit 42 monitors the level of the signal generated from the photo-detecting element of the picture detection sensor 50. When the level of the signal increases to a predetermined level corresponding to the base density of the film, and when the level of the signal decreases from the level corresponding to the base density, the control circuit 42 determines that an edge of an image that is recorded on the negative film, is under the picture sensor 50. The position (and size) of the image recorded on the negative film 12 can be determined based on the timing of edge detection.
- the pre-scan portion 36 has a lamp 52 which is arranged to emit light toward the negative film 12 passing through the pre-scan portion 36.
- the lamp 52 is connected to the control circuit 42 through a driver 54.
- the level of the voltage supplied from the driver 54 is controlled by the control circuit 42 to emit a predetermined quantity of light.
- a CC filter set 56 consisting of three CC filters, that is, C (cyan), M (magenta) and Y (yellow), and a light diffusion box 58 are arranged, in that order, on the light-emitting side of the lamp 52 and on one side of the film conveyance path.
- An image-forming lens 60 and a CCD line sensor 62 are arranged, in that order, on the other side of the film conveyance path.
- the respective CC filters of the CC filter set 56 are inserted into the light path and preliminarily adjusted in order to compensate for the variation in the CCD line sensor's 62 sensitivity to the three colors of R, G and B.
- Light successively transmitted through the CC filter set 56, the light diffusion box 58, the negative film 12 and the image-forming lens 60 impinges upon a photo-detecting surface of the CCD line sensor 62.
- the CCD line sensor 62 consists of a large number of sensor units spaced at intervals of a predetermined pitch, in the direction of the width of the negative film 12. Each of the sensor units is formed by arranging adjacent sensors for detecting the quantity of R light, sensors for detecting the quantity of G light and sensors for detecting the quantity of B light.
- the CCD line sensor 62 divides an image into a large number of pixels each having the above-mentioned sensor unit pitch as the size of one side, and it detects the quantity of transmitted light for each pixel.
- the area of each pixel corresponds to an area smaller than 200 ⁇ m.
- the image-forming lens 60 forms an image on the photo-detecting surface of the CCD line sensor 62 by converging light which is transmitted through the negative film 12 and transmitted through one pixel line (hereinafter the position of the pixel line being called "read position") crossing the optical axis of light emitted from the lamp 52 and arranged along the direction of the width of the negative film 12.
- An amplifier 64, a LOG converter 66 and an A/D converter 68 are successively connected to the output of the CCD line sensor 62.
- a signal generated from the CCD line sensor 62 is amplified by the amplifier 64, converted logarithmically (into a level corresponding to the density value) by the LOG converter 66, and converted into digital data having a value corresponding to the signal level by the A/D converter 68.
- the A/D converter 68 is connected to the control circuit 42, so that the converted digital data is input to the control circuit 42 as density value data.
- the control circuit 42 has an image buffer 70 capable of storing density data for several images, and the input density value data is stored in the image buffer 70. Further, a CRT display 72 is connected to the control circuit 42, so that a positive image is exhibited on the display 72 by processing the information using the input density value data.
- a roller set consisting of a pair of conveyance rollers 74 and a follower roller 76, and another roller set consisting of follower rollers 78A, 78B and 78C, are arranged at predetermined intervals.
- a loop for the negative film 12 is formed between the two roller sets. Differences between the speed of conveyance of the negative film 12 in the pre-scan portion 36 and the speed of conveyance of the negative film 12 in the fine-scan portion 38 are absorbed by the loop.
- a pulse motor 80 is connected to the conveyance roller pair 74.
- the pulse motor 80 is connected to the control circuit 42 through a driver 82.
- the control circuit 42 causes the driver 82 to drive the pulse motor 80 to thereby convey the negative film 12.
- the fine-scan portion 38 has substantially the same structure as the pre-scan portion 36. That is, the fine-scan portion 38 has a lamp 84 for emitting light toward the negative film 12.
- the lamp 84 is connected to the control circuit 42 through a driver 86.
- the level of the voltage supplied from the driver 86 is controlled by the control circuit 42 so that a predetermined quantity of light is emitted.
- a CC filter set 88 consisting of three CC filters and a light diffusion box 90 are arranged in that order on the light-emitting side of the lamp 84, and on one side of the film conveyance path.
- An image-forming lens 92 and a CCD line sensor 94 are arranged in order on the other side of the film conveyance path.
- the respective CC filters of the CC filter set 88 are inserted into the light path by an amount and preliminarily adjusted in order to compensate for the CCD line sensor's 94 variation in sensitivity to the three colors of R, G and B.
- the image-forming lens 92 forms an image on the photo-detecting surface of the CCD line sensor 94 by converging light which is transmitted through the CC filter set 88, the light diffusion box 90 and the negative film 12 and transmitted through one pixel line located in the read position.
- the CCD line sensor 94 has the same structure as the CCD line sensor 62 except that the sensor unit pitch of the CCD line sensor 94 is smaller than that of the CCD line sensor 62. Accordingly, compared with the CCD sensor 62, the CCD line sensor 94 divides an image into a larger number of pixels and detects the quantity of transmitted light for each pixel.
- An amplifier 96, a LOG converter 98 and an A/D converter 100 are successively connected to the output of the CCD line sensor 94.
- a signal generated from the CCD line sensor 94 is amplified by the amplifier 96, converted into a level corresponding to the density value by the LOG converter 98 and converted into digital data by the A/D converter 100.
- the A/D converter 100 is connected to the control circuit 42, so that the converted digital data is input as density value data to the control circuit 42.
- the input density value data is stored in an image buffer 70 in the same manner as described above.
- the control circuit 42 calculates exposure values for R, G and B colors on print paper, on the basis of the density value data.
- the control circuit 42 is further connected to a printer portion 110 of a printer processor 18 which will be described later, so that the calculated data, which expresses exposure values, are transferred to a control circuit 122.
- a pair of conveyance rollers 102 are arranged on the downstream side of the fine-scan portion 38.
- a pulse motor 104 is connected to the conveyance roller pair 102.
- the pulse motor 104 is connected to the control circuit 42 through a driver 106.
- the control circuit 42 causes the driver 106 to drive the pulse motor 104 to thereby convey the negative film 12.
- a magazine 114 for accommodating print paper 112 which is rolled so as to be stratified is set in the printer processor 18.
- the print paper 112 is drawn out of the magazine 114 and fed to the printer portion 110 through a cutter portion 116.
- the printer portion 110 exposes the image onto the print paper 112 based on the exposure value data.
- the printer portion 110 has a semiconductor laser 118R for emitting a laser beam with the wavelength of R.
- a collimator lens 124R, an acoustic-optic element (AOM) 133R, a dichroic mirror 134G for selectively reflecting light of G wavelength, a dichroic mirror 134B for reflecting light of B wavelength selectively and a polygon mirror 126 are arranged in order on the beam emitting side of the semiconductor laser 118R.
- the AOM 133 is provided with an acoustic-optic medium.
- a transducer which outputs an ultrasonic wave in accordance with an input high-frequency signal and a sound absorber for absorbing ultrasonic waves transmitted through the acoustic-optic medium, are attached to a surface opposite to the acoustic-optic element.
- the AOM transducer 133R is connected to an AOM driver 120R. Upon reception of a high-frequency signal from the AOM driver 120R, the transducer diffracts a selected one of the incident laser beams, and emits the selected laser beam as a recording laser beam. The recording laser beam impinges on the polygon mirror 126 through the dichroic mirrors 134G and 134B.
- the AOM driver 120R is connected to a control circuit 122.
- An exposure control signal corresponding to the R exposure value data is output from the control circuit 122 to the AOM driver 120R.
- the exposure control signal is a pulse signal with a period t 0 as shown in Fig. 6.
- the pulse width d is changed in accordance with the exposure value for each pixel on the basis of the R exposure value data.
- the AOM driver 120R outputs a high-frequency signal to the AOM 133R so that a recording laser beam is emitted from the AOM 133R. Accordingly, the quantity of light emitted from the R wavelength laser beam and radiated onto the print paper 112 at intervals of period t 0 , is changed on the basis of the R exposure value data.
- the printer portion 110 has semiconductor lasers 118G and 118B for emitting laser beams of predetermined wavelengths, respectively.
- a wavelength conversion element 124G, a collimator lens 124G, an AOM 133G and a total reflection mirror 136G are arranged in order on the beam emitting side of the semiconductor laser 118G.
- the AOM 133G is connected to the control circuit 122 through an AOM driver 120G.
- the control circuit 122 outputs an exposure control signal corresponding to the G exposure value data to the AOM driver 120G.
- the AOM driver 120G When the level of the exposure control signal is high, the AOM driver 120G outputs a high-frequency signal in the same manner as the AOM driver 120R.
- the laser beam emitted from the semiconductor laser 118G is converted into a G wavelength beam by the wavelength conversion element 124G, so that the G wavelength beam impinges on the AOM 133G.
- a high-frequency signal from the AOM driver 120G is input to the AOM 133G, a recording laser beam is emitted from the AOM 133G, reflected on the total reflection mirror 136G, reflected on the dichroic mirror 134G and mixed with the laser beam emitted from the semiconductor laser 118R.
- a wavelength conversion element 124B, a collimator lens 124B, an AOM 133B and a total reflection mirror 136B are arranged in order on the beam emitting side of the semiconductor laser 118B.
- the AOM 133B is connected to the control circuit 122 through an AOM driver 120B.
- the control circuit 122 outputs an exposure control signal corresponding to the B exposure value data, to the AOM driver 120B.
- the laser beam emitted from the semiconductor laser 118B is converted into a B wavelength beam by the wavelength conversion element 124B, so that the B wavelength beam impinges on the AOM 133B.
- a recording laser beam emitted from the AOM 133B is reflected on the total reflection mirror 136B and reflected on the dichroic mirror 134B so that the laser beam emitted from the semiconductor laser 118R and the laser beam emitted from the semiconductor laser 118G are mixed.
- the laser beam thus mixed through the dichroic mirrors 134G and 134B, impinges on the polygon mirror 126.
- the polygon mirror 126 which is connected to the control circuit 122 through a polygon mirror driver 128, rotates under control of the polygon mirror driver 128 which controls the rotational speed of the mirror.
- the exit direction of the laser beam incident on the polygon mirror 126 is successively changed by the rotation of the polygon mirror 126, so that scanning is performed along the horizontal direction as shown in Fig. 5.
- a mirror 130 is disposed on the laser beam exit side of the polygon mirror 126.
- the laser beam reflected on the polygon mirror 126 is reflected down by the mirror 130, as shown in Fig. 5.
- a scanning lens 138 and a mirror 140 are arranged in order on the laser beam exit side of the mirror 130.
- the laser beam reflected on the mirror 130 is transmitted through the scanning lens 138 and reflected on the mirror 140.
- the print paper 112 is disposed on the laser beam exit side of the mirror 140, so that the direction of the length of the paper is coincident with the vertical direction of Fig. 5, the laser beam reflected on the mirror 140 is radiated onto the print paper 112.
- a pair of conveyance rollers 142 for conveying the print paper 112 while nipping the print paper 112, are disposed below the laser beam radiation position of the print paper 112 conveyance path.
- the pair of conveyance rollers 142 are connected to a pulse motor 144.
- the pulse motor 144 is connected to the control circuit 122 through a driver 146.
- the control circuit 122 controls the driver 146 which drives the pulse motor 144 which conveys the print paper 112 downward, as shown in Fig. 5.
- the print paper 112 which has passed through the printer portion 110 is fed to a reservoir portion 150.
- a pair of rollers 152 are provided at a predetermined interval so that the print paper 112 forms a loop between the pair of rollers 152.
- the difference between the conveyance speed in the printer portion 110 and the conveyance speed in a processor portion 154 is absorbed by this loop.
- a color development tank 156, a bleach-fixing tank 158 and water washing tanks 160, 162 and 164 are arranged in order in the processor portion 154. These treating tanks hold predetermined solutions.
- the print paper 112 is fed to the treating tanks successively such that the print paper 112 is successively immersed in the treating solutions so as to be treated.
- a drying portion 166 is provided on the downstream side of the processor portion 154.
- the drying portion 166 supplies the print paper 112 with a hot air-stream produced by a fan and a heater, which are not shown. As a result, water deposited on a surface of the print paper 112 is removed by drying.
- the print paper 112, which has passed through the drying portion 166, is cut into print units by a cutter portion 168, and then ejected out of the printer processor 18.
- a negative film 12 set in the film processor is fed to the respective treating tanks and then fed to the drying portion 32, so that the negative film 12 is subjected to the treatments of color development, bleaching, bleach-fixing, water washing, stabilization and drying. As a result, latent images recorded by a camera, are made visible.
- the negative film 12 processed by the film processor is set in the film image reader 16.
- step 200 a decision is made on the basis of a signal from the insertion detection sensor 40, as to whether or not the negative film 12 has been inserted in the film image reader 16.
- the decision in step 200 is positive and, in step 202 the conveyance of the negative film 12 is started.
- information such as frame number, etc.
- the decision in step 204 is positive when the recording position value matches the frame number detection sensor 48 value.
- the decision in step 204 is positive when the magnetically encoded information matches the information from the read head 46.
- step 206 is executed and a decision is made as to whether or not an image fits an image detection position corresponding to the arrangement position of the image detection sensor 50.
- the routine goes to step 208 and a decision is made as to whether an image reaches the image reading position or not, that is, more particularly, whether the head pixel line of an image reaches the reading position or not.
- the routine goes back to step 202 and the respective decisions in steps 204, 206 and 208 are repeated while the conveyance of the negative film 12 is continued.
- step 210 When the decision in step 204 is now positive, the routine goes to step 210 and information such as frame number, etc., is read by the frame number detection sensor 48 or the read head 46 so that the frame number that is read, is stored.
- step 206 When the decision in step 206 is positive, the routine goes to step 212 and the picture position and size are detected on the basis of an output signal from the picture detection sensor 50.
- step 214 the picture position and size are stored so as to be related to the frame number.
- an image scan-reading procedure (which will be described later) is carried out in step 216.
- step 218 a decision is made whether the negative film 12 is finished or not.
- the routine goes back to step 202 and the aforementioned procedures are repeated.
- the pre-scan portion 36 not only the procedures of frame number reading, picture position and size detection and image scan-reading are successively carried out with respect to one image frame, but the procedures are carried out in parallel with respect to the respective image frames.
- the head pixel line of an image is located in the reading position; an image of light transmitted through the pixel line among the light emitted from the lamp 52 and transmitted through the CC filter set 56, the light diffusion box 58 and the negative film 12 is formed on the photo-detecting surface of the CCD line sensor 62 by the image-forming lens 60; and a signal output from the CCD line sensor 62 is amplified by the amplifier 64, converted into a level corresponding to the density value by the LOG converter 66, converted into digital data by the A/D converter 68 and stored.
- step 250 density value data with respect to one pixel line are fetched from the A/D converter 68.
- step 252 the density value data thus fetched are corrected in accordance with the variations in sensitivity of the plurality of sensor units arranged along the direction of the width of the negative film 12, and are stored in the image buffer 70.
- step 254 the pulse motor 80 is driven by the driver 82 to thereby convey the negative film 12 by a predetermined quantity corresponding to the intervals of image trains.
- step 256 a decision is made as to whether or not the image reading for a picture is completed.
- the routine goes back to step 250 and the procedure, from step 250 to step 256, is repeated until the decision in step 256 is positive.
- the routine goes to step 258, scanning of an entire image is completed so that data expressing densities of respective pixels, in images obtained by decomposing one image into three colors (R, G and B) (hereinafter referred to as "R image data”, “G image data” and “B image data” respectively), are stored in the image buffer 70.
- step 258 the density of the base portion (see Fig. 7) of the negative film 12 is measured for the respective colors of R, G and B, and stored.
- step 260 the data of a pixel having the smallest density value is extracted from the respective color image data stored in the image buffer 70.
- step 262 the optimum light quantity is calculated for the lamp 84 in the fine-scan portion 38, with respect to the image being read, based on the extracted data. This is because the level of the output signal of the CCD line sensor 94 may be saturated when the image is read in the fine-scan portion 38, when the minimum value of the density value data is very small.
- step 264 correction is performed by subtracting the base density of the negative film 12, measured in step 258, from the density value of each pixel in the respective image data that is stored in the image buffer 70.
- step 266 the respective image data stored in the image buffer 70 are averaged.
- this averaging procedure can be carried out by substituting the average value for a greatly different density value to all pixels while comparing the density value of a predetermined pixel with the density values of ambient pixels with respect to the respective image data of R, G and B.
- step 268 the respective image data of R, G and B are converted into pigment densities of C (cyan), M (magenta) and Y (yellow) so that C image data corresponding to a C image, M image data corresponding to an M image and Y image data corresponding to an Y image are respectively obtained.
- step 270 data for the pixels corresponding to the vicinity of the edge portion of the image, are removed from the respective image data of C, M and Y to thereby cut down a region surrounded by the virtual line in Fig. 7.
- step 274 the maximum values C max (i), M max (i) and Y max (i) (where i represents a code for identifying the area, the code having a value of from 1 to n ) of the density values of the pixels belonging to one area, are extracted for each area.
- step 276 the weighted average of the respective areas is calculated as a maximum C density reference value C max by using the maximum C density reference values C max (i) in the respective areas in accordance with the following expression (2):
- C max ⁇ K ( i ) ⁇ C max ( i ) ⁇ K ( i ) in which K(i) represents the weight of an area (i).
- a weighted average of the maximum M density maximum values M max (i) in each area is calculated as the M density maximum reference value and a weighted average of the maximum Y density values Y max (i) in each area is calculated as the Y density maximum reference value in the same manner as described above.
- the weights of the respective areas can be determined so that the weight of an area corresponding to the center portion of the picture, in which the possibility of a main subject existing is high, becomes higher.
- the quantity of light emitted from the lamp 52 has a distribution such that the peak quantity of light is along the optical axis, and gradually attenuates toward the periphery, the weights may be determined on the basis of this distribution.
- step 278 the average D max of the maximum reference values C max , M max and Y max for the respective colors, are calculated according to the following expression (3).
- D max (C max + M max + Y max ) / 3
- the M image conversion coefficient A M and the Y image conversion coefficient A Y are calculated according to the following expressions (5) and (6).
- D max A M • M max
- D max A Y • Y max
- a look-up table LUTc for converting C density into C' density to obtain a C' image is generated by successively substituting a value of from 0.0 to 2.0 for the C density in a conversion equation represented by the following expression (7) with use of the C image conversion coefficient A C obtained as described above, and which is stored.
- C' A C •
- look-up tables LUTm and LUTy for converting M density into M' density to obtain an M' image and for converting Y density into Y' density to obtain an Y' image respectively are generated by substituting the value of the same range into conversion equations using the coefficients A M and A Y as represented by the following expressions (8) and (9) respectively, and which are stored.
- step 284 arithmetical operations are performed for showing an image on the display 72, C' image data, M' image data and Y' image data are obtained from C image data, M image data and Y image data.
- step 286 positive image data (data expressing an image obtained by overlapping R', G' and B' images) are obtained on the basis of the C', M' and Y' image data so that a positive image is shown on the display 72 using the thus obtained data.
- this displayed image for example, it is made possible for the operator to designate correction of color, density, etc., in accordance with exposure.
- step 300 conveyance of the negative film 12 is performed.
- step 302 a decision is made as to whether the head pixel line reaches the reading position or not.
- the routine goes back to step 300 and the procedure of steps 300 and 302 is repeated to continue the conveyance of the negative film 12 until the decision in step 302 is positive.
- step 302 When the decision in step 302 is positive, the routine goes to step 304 and the optimum light quantity of the lamp 84, preliminarily obtained in the pre-scan portion 36, is fetched to thereby control the voltage supplied to the lamp 84 to a value corresponding to the light quantity. After a slight delay, while the light from the lamp stabilizes after execution of the procedure of step 304, the routine goes to step 306 and the image reading procedure is carried out in steps 306 to 312.
- step 306 one-pixel-line's density value data is fetched from the A/D converter 100.
- step 308 the density value data thus fetched is corrected in accordance with the variations in sensitivity of the large number of sensor units in the CCD sensor 94.
- the corrected data are then stored in the image buffer 70.
- step 310 the pulse motor 104 is driven by the driver 106 to convey the negative film 12 by a predetermined quantity corresponding to the interval of the image trains.
- the amount of conveyance corresponds to the interval between the sensor units and is smaller than the quantity of conveyance in the pre-scan portion 36. Accordingly, in the fine-scan portion 38, the quantity of light transmitted through the respective pixels is measured while the image is finely divided into a larger number of pixels.
- step 312 a decision is made as to whether or not the reading of one-picture's image is completed.
- the routine goes back to step 306 and the procedure from step 306 to step 312 is repeated until the decision in step 312 is positive.
- the R image data, G image data and B image data of a single image are stored in the image buffer 70.
- shading correction is carried out. This is because the quantity of light emitted from the lamp 84 also has a distribution in which the peak light quantity is along the optical axis and is attenuates toward the periphery.
- the image data stored in the image buffer 70 is corrected in accordance with the light quantity distribution which is measured in advance.
- step 316 correction is performed by subtracting the base density of the negative film 12, measured in the pre-scan portion 36, from the density values of the pixels in the respective image data which are stored in the image buffer 70.
- step 318 the R, G and B image data are subjected to C, M and Y pigment density conversion to obtain C, M and Y image data respectively.
- the pre-scan portion 36 and the fine-scan portion 38 differ in various aspects.
- the pre-scan portion 36 and the fine-scan portion 38 differ in the interval between the sensor units in the CCD sensor, so that they differ in the conveyance pitch at the time of image reading. Accordingly, the image data obtained in the pre-scan portion 36 and the image data obtained in the fine-scan portion 38 are different in the area of one pixel.
- the sensitivity of the CCD line sensor may vary. Therefore, in step 320, the image data obtained in step 318 is corrected in accordance with the difference between various kinds of conditions, such as pixel area difference.
- step 322 the look-up tables LUTc, LUTm and LUTy generated in the pre-scan portion 36 are fetched.
- step 324 the C, M and Y image data obtained in the fine-scan portion 38 are converted into C', M' and Y' image data by referring to the fetched look-up tables.
- the aforementioned look-up tables are used for obtaining C', M' and Y' image data from C, M and Y image data at a high speed, the present invention is not limited to the use of such look-up tables.
- C', M' and Y' image data may be obtained by substituting pixel data constituting C, M and Y image data into any one of the aforementioned equations (7), (8) and (9).
- step 326 C', M' and Y' image data expressing C', M' and Y' images are converted into R', G' and B' image data expressing R', G' and B' image data as a positive image. This conversion is carried out so that the difference (density width) between the maximum density value and the minimum density value in the positive image, after conversion, corresponds to the sensitivity difference of the print paper 112.
- color balance is corrected to make the maximum reference values of the respective colors coincident with each other. That is, to make the maximum density values substantially coincident with each other. Accordingly, in an image obtained by mixing R', G' and B' images, the color of a region corresponding to the white or near white portion of the subject is formed from a color corresponding to white. That is, even in the case where the color of the aforementioned portion is shifted from white by photographing under different kinds of light sources, correction is performed to set the color to the color corresponding to white.
- step 326 exposure data expressing exposure values of R, G and B to the respective pixels are obtained by exponentially converting the density values of the respective pixels in the R', G' and B' image data.
- the light quantity distribution expressed by the exposure data is made equal to the distribution of light transmitted through the image when light is radiated to the image so as to be uniform in the quantity of light, upon the assumption that an ideal image obtained by overlapping C', M' and Y' images is recorded on the negative film 12.
- step 328 the exposure data thus calculated are transferred to the control circuit 122 of the printer portion 110.
- step 330 a decision is made as to whether or not calculation of exposure values, with respect to all images recorded on the negative film 12, is finished. When the decision in step 330 is negative, the routine goes back to step 300 and the procedure from step 300 to step 330 is repeated. When the decision in step 330 is positive, the routine is terminated.
- step 350 rotation of the polygon mirror is started.
- step 352 the print paper 112 is conveyed by the pulse motor 144 to thereby place the non-exposed portion of the print paper in an exposure position.
- step 354 exposure data corresponding to an image to be exposed is fetched.
- the AOM drivers 120R, 120G and 120B send high-frequency signals to the AOMs 133R, 133G and 133B respectively when the level of the input exposure control signal is high.
- recording laser beams are emitted from the AOMs 133R, 133G and 133B for a time corresponding to the pulse width d at intervals corresponding to the pulse period t 0 for each of the exposure control signals, and are mixed by the dichroic mirrors 134G and 134B, so that the resulting mixture beam enters the polygon mirror 126.
- the position of the laser beam radiation onto the print paper 112 is successively moved in accordance with the rotation of the polygon mirror 126.
- the pulse period t 0 of each of the exposure control signals is determined so that the quantity of movement of the laser beam radiation position corresponds to the interval between pixels of the image to be recorded on the print paper 112. Accordingly, because the laser beam radiation time for each pixel varies in accordance with the pulse width d , the exposure value for each pixel is changed in accordance with the exposure data.
- the laser beam reflected by the polygon mirror 126 is further reflected by the mirrors 130 and 140 and radiated onto the print paper 112, so that one-pixel-line's (one-line's) exposure to the print paper 112 is performed whenever one line of laser beam scanning is carried out by the polygon mirror 126.
- step 358 the routine goes to step 358 in which the print paper 112 is conveyed by a predetermined quantity corresponding to the one-line's interval, by the pulse motor 4 until the rotation angle of the polygon mirror 126 is set to a rotation angle in which the incident laser beam is reflected toward the scanning start portion.
- step 360 a decision is made as to whether or not exposure of one-pixel-line is finished.
- step 360 is negative, the routine goes back to step 356 in which exposure control signals corresponding to the exposure data for the next one line are delivered to the AOM drivers 120R, 120G and 120B to perform the next exposure of a line, in the same manner as described above.
- step 360 By repeating the procedure from step 356 to step 360 a predetermined number of times, image exposure is performed in accordance with the exposure data.
- the decision in step 360 is positive and the routine goes to step 362.
- step 362 a decision is made as to whether or not exposure, in accordance with all transferred exposure data, is finished.
- the decision in step 362 is negative, the routine goes back to step 352 in which exposure for the next image is carried out in the same manner as described above.
- the decision in step 362 is positive, the rotation of the polygon mirror 126 is stopped in step 364 and the exposure control routine is finished.
- the non-exposed portion of the print paper 112 with its exposure control routine finished is cut by the cutter portion 116 and rewound into the magazine 114.
- the image exposed portion of the print paper 112 is successively delivered to the respective treating tanks of the processor portion 154 and then delivered to the drying portion 166, so that the exposure portion is subjected to the treatments of color development, bleach-fixing, water washing and drying, so that the exposed image in the printer portion is made visible.
- the print paper 112 is cut into image frames and discharged from the printer processor 18.
- a second embodiment of the present invention is described below.
- the second embodiment has the same structure as the first embodiment, and for simplification of the description, like numerals refer to like parts. Only the operation of the second embodiment different from that of the first embodiment is described below.
- the second embodiment is different from the first embodiment in the scan-reading routine of the pre-scan portion 36 (the procedure from step 274 to step 284 in the flow chart shown in Fig. 9). That is, as shown in the flow chart of Fig. 10, in step 274A, minimum density values C min (i), M min (i) and Y min (i) as well as maximum density values C max (i), M max (i) and Y max (i) are extracted in the respective divided regions. In step 276A, the weighted average of the maximum values C max (i) of C density in the respective regions is calculated as the maximum reference value C max of C density, in accordance with the aforementioned equation (2).
- the weighted average of the respective regions is calculated as the minimum reference value C min of C density, in accordance with the following equation (10) by using the minimum values C min (i) of C density of the respective regions calculated as described above.
- C min ⁇ K ( i ) ⁇ C min ( i ) ⁇ K ( i ) in which K(i) represents the weight of an area (i).
- a maximum M density reference value M max and a minimum M density reference value M min are calculated on the basis of the maximum M density values M max (i) and the minimum M density values M min (i) in the respective areas, in the same manner as described above.
- a maximum Y density reference value Y max and a minimum Y density reference value Y min are calculated on the basis of the maximum Y density values Y max (i) and the minimum Y density values Y min (i) in the respective areas, in the same manner as described above.
- the average D max of the maximum reference values C max , M max and Y max for the respective colors is calculated in accordance with the above expression (3), and the average D min of the minimum reference values C min , M min and Y min for the respective colors, are calculated in accordance with the following expressions (11).
- D min (C min + M min + Y min ) / 3
- M image conversion coefficient A M and constant B M and Y image conversion coefficient A Y and constant B Y are calculated in accordance with simultaneous equations of the following expressions (13) and (14).
- D max A M • M max + B M
- D min A M • M min + B M
- D max A Y • Y max + B Y
- D min A Y • Y min + B Y
- a look-up table LUTc for converting C density into C' density to obtain a C' image, is generated by successively substituting a value between 0.0 to 2.0 for the C density in a conversion equation represented by the following expression (15), with use of the C image conversion coefficient A C and constant B C obtained above and which is stored.
- C' A C • C + B C
- look-up tables LUTm and LUTy for converting M density into M' density, to obtain an M' image, and for converting Y density into Y' density, to obtain an Y' image respectively, are generated by substituting the value of the same range in the conversion equations using the coefficient A M and constant B M and the coefficient A Y and constant B Y as represented by the following expressions (16) and (17), respectively and which are stored.
- conversions in accordance with the expressions (15) to (17) are equivalent to conversions (corrections of density values) that make C' density, M' density and Y' density, after conversions of C max , M max and Y max , coincident with the average D max , and make C' density, M' density and Y' density, after conversions of C min , M min and Y min , coincident with the average D min .
- This is true even in the case where the values of C max , M max and Y max and the values of C min , M min and Y min vary as shown in Fig. 14(A)-(C).
- C'+M'+Y' is made as the lightest gray (white) on a print so that gray balance in the lightest portion is maintained.
- C'+M'+Y' is made as the darkest portion (black) on a print so that gray balance in the darkest portion is maintained.
- the coefficient A M and the constant B M used for conversion of M density, and the coefficient A Y and the constant B Y used for conversion of Y density can be calculated in the same manner as described above.
- Fig. 15 is a graph showing the case where the results of scan-reading a negative image in which R failure has occurred are plotted, by pixel, on a coordinate system with G density of each pixel as the abscissa and with R density versus G density and B density versus G density as the ordinate.
- a group greatly biassed on the ordinate side among the distribution of points "*" representing R density versus G density expresses pixels of a red ground portion having a wide area in the image.
- FIG. 16 A result of printing on the print paper by applying the integral neutral method to the negative image to determine exposure on the basis of accumulated transmission density is shown in Fig. 16.
- the group of points "*" greatly biassed on the ordinate side in Fig. 15 move near to the position of a line passing through the origin and having a slope of "1", so that a large number of points "*" are distributed at positions biassed on the abscissa side from the line with the movement. It can be understood from the result that color balance of the main subject is affected by the color (red) of the background portion so that the color balance is not maintained.
- Fig. 17 shows the results of printing on the print paper by applying the gray balance correcting method according to the present invention, to the same negative image to determine exposure.
- Plotted points are classified into two groups, that is, the group of points with good gray balance and at positions near the line passing through the origin and having a slope of "1", and the group of points consisting of points "*" and having the color ratio greatly inclined toward the R side. It is to be understood that not only color balance of the main subject is maintained but the red color of the background portion is reproduced to the color at the time of photographing.
- the gray balance correcting method according to the present invention is applied, an appropriate printing result can be obtained with respect to an image (for example, in which failure has occurred) which cannot be obtained conventionally.
- D max and D min are merely references for making the density values of the respective colors coincident with each other and that the invention is not limited thereto.
- these values may be set as predetermined constant values without any change of values by image, or any one of C max , M max and Y max and any one of C min , M min and Y min may be used.
- a third embodiment of the present invention is described below.
- the third embodiment has the same structure as the first and second embodiments, and for simplification of the description, like numerals refer to like parts. Only the operation of the third embodiment that is different from that of the second embodiment is described below.
- the third embodiment is similar to the second embodiment, but differs in steps 322 and 324, shown in Fig. 11, of the image reading procedure for the fine-scan portion 38.
- a gray balance correcting procedure is carried out, beginning with step 370 shown in Fig. 18, after execution of step 320, shown in Fig. 11.
- step 370 look-up tables LUTc, LUTm and LUTy generated in the pre-scan portion 36 are fetched.
- step 372 the C image data, M image data and Y image data obtained in the fine-scan portion 38 are converted into C' image, M' image data and Y' image data by referring to the fetched look-up tables.
- the look-up tables are used to quickly obtain C', M' and Y' image data from C, M and Y image data.
- the present invention is not limited to the use of such look-up tables.
- C', M' and Y' image data may be obtained by substituting pixel data, consisting of C, M and Y image data, into any one of the aforementioned equations (7), (8) and (9).
- the C', M' and Y' image data are plotted on color coordinates for the respective pixels.
- a color coordinate system with M' density data plotted along the abscissa and with C' and Y' density data plotted along the ordinate the present invention is not limited to such a coordinate system as various kinds of color coordinate systems may be used.
- a color coordinate system with a color other than M as a reference may be used.
- a color coordinate graph as shown in Fig. 19(A) is obtained.
- step 376 as shown in Fig. 19(B), a predetermined region S is selected, and a line L formed that connects the values D max and D min .
- the boundaries of the predetermined region S are determined by lines L 1 and L 2 which are obtained by moving the line L in a parallel direction by a predetermined value, on either side of the line L, as shown in Fig. 19(B).
- the present invention is not limited to the formation of the predetermined region S, as described above.
- the respective values of C'/M' and Y'/M' have D max and D min values of 1.0 so that the line L is formed parallel to the abscissa.
- the predetermined region S may be formed so that the region S contains the line L and the respective values of C'/M' and Y'/M' are in a range of 1.0 ⁇ .
- the respective densities of C', M' and Y' are coincident with each other at D max and D min .
- the line connecting the two points expresses a reference of appropriate gray balance which is estimated when the C', M' and Y' image data is converted.
- plotted points are distributed on, or in the vicinity of the line L.
- the distribution can also be formed such that the data is far from the line L, for example, when color failure occurs in an image.
- Such a distribution corresponds to a high-saturation portion of the image, so that a decision can be made that this distribution corresponds to the background portion.
- the distribution of data in a region corresponding to intermediate density, is only slightly shifted from the line, a decision can be made that the gray balance in the intermediate density of the respective images of C', M' and Y' is slightly shifted.
- a step 378 the average of the C' data with respect to M' and the average of the Y' data with respect to M' are calculated by using only the data falling within the predetermined region S, and not using the data outside of the predetermined region S as plotted on the color coordinate graph. Such corresponding points are plotted on the color coordinate graph as shown in Fig. 19(C).
- step 380 as shown in Fig. 19(C), a curve of secondary degree P C passing through D max , D min and the average of the C' data with respect to M', and a curve of secondary degree P Y passing through D max , D min and the average of the Y' data with respect to M' are deduced.
- D max , D min , the average C' data with respect to M', and the average of the Y' data with respect to M' are smoothly connected by the curves P C and P Y , there is a very high probability that these curves express the appropriate gray balance between D max and D min .
- the deduction of the curves of secondary degree is an example of a procedure for predicting the change between three points and performing interpolation, but it should be understood that the present invention is not limited thereto.
- the look-up table LUTc is corrected on the basis of the curve P C so that a conversion correlation of the C density (see Fig. 14(A)) with respect to a conversion correlation of the M density (see Fig. 14(B)) is expressed by curve of secondary degree P C .
- the look-up table LUTc for converting C density into C'' density is obtained in accordance with the conversion correlation shown in Fig. 20(A).
- the look-up table LUTy is corrected on the basis of the curve P Y so that conversion correlation of the Y density (see Fig. 14(C)) with respect to conversion correlation of the M density is expressed by the curve of secondary degree P Y .
- the look-up table LUTy for converting Y density into Y'' density is obtained in accordance with the conversion correlation shown in Fig. 20(C).
- the look-up table LUTm is not corrected as shown in Fig. 20(B).
- C'', M'' and Y'' image data may be obtained by substituting pixel data consisting of C, M and Y image data into the relation equations representing the aforementioned curves of secondary degree P C and P Y .
- C'', M'' and Y'' image data expressing C'', M'' and Y' images
- R'', G'' and B'' image data expressing R'', G'' and B'' images as a positive image. This conversion is carried out so that the difference (density width) between the maximum density value and the minimum density value in the positive image after conversion, corresponds to the sensitivity difference of the print paper 112.
- the color balance of C'', M'' and Y'' image data is corrected so that the maximum reference values and the minimum reference values of the respective colors are coincident with each other. Accordingly, in an image obtained by overlapping the R'', G'' and B'' images, gray balance is maintained in a region corresponding to the white or near white portion of the subject and in a region corresponding to the black or near black portion of the subject.
- the gray balance reference in the intermediate density portion is corrected by the curves of secondary degree P C and P Y , on the basis of the distribution of C', M' and Y' image data on color coordinates, disordering of gray balance in the intermediate density portion is prevented even in the case of an image in which the color of the light source for the intermediate density portion is different from the color of the light source for the maximum density portion.
- step 324 exposure data, expressing the exposure values of R, G and B for the respective pixels, are obtained by exponentially converting the density values of the respective pixels in the R'', G'' and B'' image data.
- the light quantity distribution, expressed by the exposure data is made equal to the distribution of light transmitted through the image so that the quantity of light is uniform, assuming that an ideal image, obtained by overlapping C'', M'' and Y'' images, is recorded on the negative film 12.
- a CCD area sensor 170 formed by arranging photometric sensors in the shape of a matrix, may be used to simultaneously detect the quantities of light transmitted through respective pixels of the image.
- photometric sensors in the CCD area sensor 170 have sensitivity with respect to the respective wavelengths of R, G and B.
- a spectral filter group 172 consisting of three spectral filters which are selectively pervious to light of wavelengths R, G and B respectively, is arranged between the image-forming lens 60 and the CCD area sensor 170, so that any one of the spectral filters is inserted in the light path by a filter driver 174 to thereby measure the quantity of transmitted light for each color successively.
- the spectral filter group 172 and the filter driver 174 can be omitted.
- the present invention is not limited thereto and can be applied to the case where exposure of an image is carried out by surface exposure as widely used in a general printer.
Landscapes
- Engineering & Computer Science (AREA)
- Multimedia (AREA)
- Signal Processing (AREA)
- Control Of Exposure In Printing And Copying (AREA)
Claims (8)
- Procédé de correction de l'équilibre des gris, comprenant les opérations suivantes :où lesdites valeurs de référence comprennent au moins des valeurs de densité de référence maximales des couleurs respectives pour chaque région.a) diviser (272) une image enregistrée sur une pellicule négative (12) en un nombre (n) de régions et mesurer des valeurs de densité (C, M, Y) de trois couleurs, correspondant à la densité de pigment de la pellicule pour chaque région ;b) déterminer (274; 274A) des valeurs de densité caractéristiques représentant la luminance relative aux couleurs respectives pour chaque région sur la base des valeurs de densité mesurées ;c) déterminer (276, 276A) des valeurs de référence (Cmax, Mmax, Ymax, Cmin, Mmin, Ymin) pour les couleurs respectives sur la base desdites valeurs caractéristiques en utilisant un procédé de pondération ;d) obtenir (278, 280, 282, 278A, 280A, 282A) une corrélation de conversion telle que les valeurs de référence des couleurs respectives, lors de la conversion, coïncident entre elles ; ete) convertir (284) les valeurs des données de densité mesurées (C, M, Y) des trois couleurs en utilisant lesdites corrélations de conversion, de manière à corriger l'équilibre des gris ;
- Procédé de correction de l'équilibre des gris selon la revendication 1, caractérisé en ce que les valeurs de densité caractéristiques déterminées dans l'opération b) comprennent les valeurs de densité maximales (Cmax(i), Mmax(i), Ymax(i)) des valeurs de densité mesurées dans l'opération a).
- Procédé de correction de l'équilibre des gris selon la revendication 1 ou 2, caractérisé en ce que les corrélations de conversion sont déterminées de façon que les valeurs de référence maximales converties des couleurs respectives soient amenées en coïncidence avec la valeur (Dmax) obtenue à partir des valeurs de référence maximales (Cmax, Mmax, Ymax) des trois couleurs.
- Procédé de correction de l'équilibre des gris selon l'une des revendications 1 et 2, caractérisé en ce que les valeurs de référence des couleurs respectives comprennent en outre des valeurs de densité de référence minimales.
- Procédé de correction de l'équilibre des gris selon les revendications 2 et 4, caractérisé en ce que les valeurs de densité caractéristiques déterminées dans l'opération b) comprennent les valeurs de densité minimales (Cmin(i), Mmin(i), Ymin(i)) des valeurs de densité mesurées dans l'opération a).
- Procédé de correction de l'équilibre des gris selon la revendication 4 ou 5, caractérisé en ce que les corrélations de conversion sont déterminées de façon que les valeurs de référence maximales converties des couleurs respectives soient amenées en coïncidence avec la moyenne (Dmax) obtenue à partir des valeurs de référence maximales des trois couleurs, et de façon que les valeurs de référence minimales converties des couleurs respectives soient amenées en coïncidence avec la moyenne (Dmin) obtenue à partir des valeurs de référence minimales des trois couleurs.
- Procédé de correction de l'équilibre des gris selon la revendication 5, caractérisé en ce qu'il comprend en outre les opérations suivantes :calculer (378) la moyenne des données de densité converties dans une région prédéterminée contenant une ligne (L) qui passe par la valeur de référence maximale convertie et la valeur de référence minimale convertie sur la base de la distribution, sur les coordonnées des couleurs, des données de densité converties ;corriger la corrélation de conversion (382) des couleurs respectives en fonction d'une courbe passant par la valeur de densité maximale convertie, la valeur de densité minimale convertie, et la moyenne des densités converties ; eteffectuer (384) une conversion des données de densité mesurées en utilisant la corrélation de conversion corrigée pour corriger l'équilibre des gris.
- Procédé de correction de l'équilibre des gris selon la revendication 1, caractérisé en ce que la division de l'image est effectuée de façon que l'aire de chacune des régions sur la pellicule soit fixée à une valeur inférieure ou égale à 200 µm2.
Applications Claiming Priority (4)
| Application Number | Priority Date | Filing Date | Title |
|---|---|---|---|
| JP05027007A JP3086352B2 (ja) | 1993-02-16 | 1993-02-16 | グレーバランス補正方法 |
| JP27008/93 | 1993-02-16 | ||
| JP27007/93 | 1993-02-16 | ||
| JP02700893A JP3319623B2 (ja) | 1993-02-16 | 1993-02-16 | グレーバランス補正方法 |
Publications (2)
| Publication Number | Publication Date |
|---|---|
| EP0612183A1 EP0612183A1 (fr) | 1994-08-24 |
| EP0612183B1 true EP0612183B1 (fr) | 1998-10-28 |
Family
ID=26364867
Family Applications (1)
| Application Number | Title | Priority Date | Filing Date |
|---|---|---|---|
| EP94100879A Expired - Lifetime EP0612183B1 (fr) | 1993-02-16 | 1994-01-21 | Procédé pour corriger l'équilibre du gris d'une image en couleur enrégistrée sur un film négatif |
Country Status (3)
| Country | Link |
|---|---|
| US (1) | US5475493A (fr) |
| EP (1) | EP0612183B1 (fr) |
| DE (1) | DE69414151T2 (fr) |
Families Citing this family (22)
| Publication number | Priority date | Publication date | Assignee | Title |
|---|---|---|---|---|
| JP3346639B2 (ja) * | 1994-01-28 | 2002-11-18 | 富士写真フイルム株式会社 | 写真焼付方法 |
| JP3507549B2 (ja) * | 1994-05-02 | 2004-03-15 | 富士写真フイルム株式会社 | 露光量決定方法 |
| US6100919A (en) * | 1994-09-07 | 2000-08-08 | Minolta Co., Ltd. | Film image reproduction apparatus utilizing apparatus illumination characteristics for film image reproduction |
| JP3421147B2 (ja) * | 1994-11-04 | 2003-06-30 | 富士写真フイルム株式会社 | 露光量決定方法 |
| JPH08179446A (ja) * | 1994-12-22 | 1996-07-12 | Fuji Photo Film Co Ltd | 写真プリントの作成方法 |
| JP3609189B2 (ja) * | 1995-03-14 | 2005-01-12 | 株式会社リコー | アンチエイリアシング機能を有する画像生成装置 |
| US5926562A (en) * | 1995-06-23 | 1999-07-20 | Fuji Photo Film Co., Ltd. | Image processing method using reference values to determine exposure state |
| JP3580613B2 (ja) * | 1995-10-06 | 2004-10-27 | 富士写真フイルム株式会社 | 写真の露光状態の判定方法 |
| US6243133B1 (en) * | 1997-03-07 | 2001-06-05 | Eastman Kodak Company | Method for automatic scene balance of digital images |
| US6333778B1 (en) * | 1998-09-07 | 2001-12-25 | Fuji Photo Film Co., Ltd. | Image reading apparatus |
| JP3474454B2 (ja) * | 1998-09-07 | 2003-12-08 | 富士写真フイルム株式会社 | 画像読取装置及び画像読取方法 |
| DE59803527D1 (de) * | 1998-09-15 | 2002-05-02 | Gretag Imaging Ag | Vorrichtung zur Herstellung fotografischer Abzüge |
| US6906833B1 (en) * | 1999-04-30 | 2005-06-14 | Fuji Photo Film Co., Ltd. | Constant speed image reading device and method |
| JP3424598B2 (ja) * | 1999-04-30 | 2003-07-07 | ノーリツ鋼機株式会社 | 焼付装置ならびにこれを備えた写真処理装置 |
| JP3793987B2 (ja) * | 2000-09-13 | 2006-07-05 | セイコーエプソン株式会社 | 補正カーブ生成方法、画像処理方法、画像表示装置および記録媒体 |
| US7228004B2 (en) * | 2002-09-05 | 2007-06-05 | Eastman Kodak Company | Method for sharpening a digital image |
| JP3994907B2 (ja) * | 2003-04-24 | 2007-10-24 | ノーリツ鋼機株式会社 | 異種光源写真画像の判定方法及び写真画像処理装置 |
| JP4065995B2 (ja) * | 2003-04-24 | 2008-03-26 | ノーリツ鋼機株式会社 | 異色構造物写真画像の判定方法及び写真画像処理装置 |
| JP4506240B2 (ja) * | 2004-03-31 | 2010-07-21 | ブラザー工業株式会社 | 画像形成装置及びプログラム |
| JP4232804B2 (ja) * | 2006-08-25 | 2009-03-04 | 日本電気株式会社 | 画像濃度変換方法、画像強調処理装置、およびそのプログラム |
| CN104553302B (zh) * | 2013-10-17 | 2017-01-04 | 北大方正集团有限公司 | 一种灰平衡校准方法及装置 |
| US9300829B2 (en) * | 2014-04-04 | 2016-03-29 | Canon Kabushiki Kaisha | Image reading apparatus and correction method thereof |
Family Cites Families (11)
| Publication number | Priority date | Publication date | Assignee | Title |
|---|---|---|---|---|
| GB2103449B (en) * | 1981-06-29 | 1985-05-30 | Nippon Telegraph & Telephone | Method and apparatus for gray level signal processing |
| JPS61275625A (ja) * | 1985-05-31 | 1986-12-05 | Fuji Photo Film Co Ltd | カラ−写真画像情報の較正方法 |
| JPS62111571A (ja) * | 1985-11-09 | 1987-05-22 | Fuji Photo Film Co Ltd | カラ−画像信号処理方法 |
| DE3629422C2 (de) * | 1986-08-29 | 1994-02-17 | Agfa Gevaert Ag | Verfahren und Vorrichtung zum Einstellen von Belichtungsgrößen an einem Kopiergerät |
| JP2525859B2 (ja) * | 1988-03-31 | 1996-08-21 | 大日本スクリーン製造株式会社 | ハイライト・シャド―濃度値の設定方法 |
| US5049985A (en) * | 1988-10-13 | 1991-09-17 | Canon Kabushiki Kaisha | Color images reading apparatus having transformation table formed base on average values of plural color component signals |
| JPH06101799B2 (ja) * | 1988-10-28 | 1994-12-12 | 富士ゼロックス株式会社 | 画像形成装置のグレイバランス制御方式 |
| JP2660568B2 (ja) * | 1989-01-12 | 1997-10-08 | 富士写真フイルム株式会社 | 不適正露光画像の復元方法 |
| JP2787231B2 (ja) * | 1989-08-19 | 1998-08-13 | 株式会社ヤマトヤ商会 | 色カブリのない複製画像を製作するための画像の階調変換法 |
| US5117293A (en) * | 1989-11-28 | 1992-05-26 | Dainippon Screen Mfg. Co. Ltd. | Method of and apparatus for generating conversion curve employable for converting reproduction characteristic of image |
| JP3044387B2 (ja) * | 1990-11-14 | 2000-05-22 | コニカ株式会社 | 画像記録装置における濃度補正装置 |
-
1994
- 1994-01-21 DE DE69414151T patent/DE69414151T2/de not_active Expired - Fee Related
- 1994-01-21 EP EP94100879A patent/EP0612183B1/fr not_active Expired - Lifetime
- 1994-02-14 US US08/194,850 patent/US5475493A/en not_active Expired - Lifetime
Also Published As
| Publication number | Publication date |
|---|---|
| US5475493A (en) | 1995-12-12 |
| DE69414151T2 (de) | 1999-03-18 |
| DE69414151D1 (de) | 1998-12-03 |
| EP0612183A1 (fr) | 1994-08-24 |
Similar Documents
| Publication | Publication Date | Title |
|---|---|---|
| EP0612183B1 (fr) | Procédé pour corriger l'équilibre du gris d'une image en couleur enrégistrée sur un film négatif | |
| US7043076B2 (en) | Image processing system | |
| EP0770905A2 (fr) | Correction numérique pour une sensibilité à un traitement | |
| US7327877B2 (en) | Image processing apparatus and image processing method | |
| US20050141046A1 (en) | Image reading apparatus, image recording medium and image forming apparatus | |
| US7616808B2 (en) | Photograph image-processing method and device thereof | |
| US20040126086A1 (en) | Image recording apparatus | |
| US6002498A (en) | Image processing method and image forming method | |
| JP4655210B2 (ja) | 濃度補正曲線生成方法と濃度補正曲線生成モジュール | |
| US6618512B1 (en) | Image reading apparatus | |
| US6366366B1 (en) | Image reading method and apparatus | |
| JP3086352B2 (ja) | グレーバランス補正方法 | |
| US6674466B1 (en) | Image processing apparatus utilizing light distribution characteristics of an electronic flash | |
| JP3319623B2 (ja) | グレーバランス補正方法 | |
| JP3904635B2 (ja) | 撮像装置 | |
| JP3171974B2 (ja) | 画像読取方法 | |
| US7123775B2 (en) | Image processing method, image processing program and image processing apparatus | |
| US6317194B1 (en) | Image reading apparatus, image processing system, image reading method, and image processing method | |
| JP3954144B2 (ja) | 画像処理方法及び装置 | |
| US6614945B1 (en) | Image processing method and apparatus | |
| JPH1079854A (ja) | 画情報の変換方法、画情報の変換条件設定方法及び画像記録装置 | |
| JP3556858B2 (ja) | フィルム画像読取装置 | |
| JP3530640B2 (ja) | デジタル画像記録方法及び装置並びにデジタル画像処理装置 | |
| JP3843336B2 (ja) | 階調補正方法及びその方法を採用したカラー画像プリンタ | |
| JP3785234B2 (ja) | 画像処理装置 |
Legal Events
| Date | Code | Title | Description |
|---|---|---|---|
| PUAI | Public reference made under article 153(3) epc to a published international application that has entered the european phase |
Free format text: ORIGINAL CODE: 0009012 |
|
| AK | Designated contracting states |
Kind code of ref document: A1 Designated state(s): DE GB |
|
| 17P | Request for examination filed |
Effective date: 19941118 |
|
| 17Q | First examination report despatched |
Effective date: 19970514 |
|
| GRAG | Despatch of communication of intention to grant |
Free format text: ORIGINAL CODE: EPIDOS AGRA |
|
| GRAG | Despatch of communication of intention to grant |
Free format text: ORIGINAL CODE: EPIDOS AGRA |
|
| GRAH | Despatch of communication of intention to grant a patent |
Free format text: ORIGINAL CODE: EPIDOS IGRA |
|
| GRAH | Despatch of communication of intention to grant a patent |
Free format text: ORIGINAL CODE: EPIDOS IGRA |
|
| GRAA | (expected) grant |
Free format text: ORIGINAL CODE: 0009210 |
|
| AK | Designated contracting states |
Kind code of ref document: B1 Designated state(s): DE GB |
|
| REF | Corresponds to: |
Ref document number: 69414151 Country of ref document: DE Date of ref document: 19981203 |
|
| PLBE | No opposition filed within time limit |
Free format text: ORIGINAL CODE: 0009261 |
|
| STAA | Information on the status of an ep patent application or granted ep patent |
Free format text: STATUS: NO OPPOSITION FILED WITHIN TIME LIMIT |
|
| 26N | No opposition filed | ||
| REG | Reference to a national code |
Ref country code: GB Ref legal event code: IF02 |
|
| REG | Reference to a national code |
Ref country code: GB Ref legal event code: 732E |
|
| PGFP | Annual fee paid to national office [announced via postgrant information from national office to epo] |
Ref country code: GB Payment date: 20080116 Year of fee payment: 15 Ref country code: DE Payment date: 20080117 Year of fee payment: 15 |
|
| GBPC | Gb: european patent ceased through non-payment of renewal fee |
Effective date: 20090121 |
|
| PG25 | Lapsed in a contracting state [announced via postgrant information from national office to epo] |
Ref country code: DE Free format text: LAPSE BECAUSE OF NON-PAYMENT OF DUE FEES Effective date: 20090801 |
|
| PG25 | Lapsed in a contracting state [announced via postgrant information from national office to epo] |
Ref country code: GB Free format text: LAPSE BECAUSE OF NON-PAYMENT OF DUE FEES Effective date: 20090121 |