EP0509839B1 - Digitales karthographisches System zur Verarbeitung von geographischen Informationen - Google Patents
Digitales karthographisches System zur Verarbeitung von geographischen Informationen Download PDFInfo
- Publication number
- EP0509839B1 EP0509839B1 EP92303490A EP92303490A EP0509839B1 EP 0509839 B1 EP0509839 B1 EP 0509839B1 EP 92303490 A EP92303490 A EP 92303490A EP 92303490 A EP92303490 A EP 92303490A EP 0509839 B1 EP0509839 B1 EP 0509839B1
- Authority
- EP
- European Patent Office
- Prior art keywords
- transformation
- map
- map projection
- region
- data
- Prior art date
- Legal status (The legal status is an assumption and is not a legal conclusion. Google has not performed a legal analysis and makes no representation as to the accuracy of the status listed.)
- Expired - Lifetime
Links
Images


Classifications
-
- G—PHYSICS
- G06—COMPUTING OR CALCULATING; COUNTING
- G06T—IMAGE DATA PROCESSING OR GENERATION, IN GENERAL
- G06T3/00—Geometric image transformations in the plane of the image
- G06T3/12—Panospheric to cylindrical image transformations
-
- G—PHYSICS
- G06—COMPUTING OR CALCULATING; COUNTING
- G06T—IMAGE DATA PROCESSING OR GENERATION, IN GENERAL
- G06T17/00—Three dimensional [3D] modelling, e.g. data description of 3D objects
- G06T17/05—Geographic models
Definitions
- the present invention generally relates to a method for displaying graphic data by a designated map projection in a digital cartographic system for geographical information processing. More specifically, the present invention is directed to both of a system and a method for varying the displaying map projection by transforming a coordinate value of the graphic data into a desirable map projection.
- a method for representing shapes, and ups and downs of a ground surface of the earth is so-called as a map projection (map projection transformations).
- map projection transformations there are such elements: 1 ⁇ an actual distance being analogously represented on a map (equidistance); 2 ⁇ an actual area being analogously displayed on a map (equivalence); and 3 ⁇ an angle at a ground surface being correctly expressed on a map (equiangularity). Since a map drawn on paper is such a fact that a sphere is projected onto a plane, all of the above-described conditions cannot be simultaneously satisfied. To satisfy any of these conditions, a map is represented by a proper map projection, depending upon its usage.
- the coordinate transformation in case that map data are processed in the computer is handled in view of inputting of a map and calculations of a distance and an area.
- a map is inputted, it is necessary to convert a coordinate value of map data which has been written on paper by way of a different map projection, into a common coordinate system in order to totally manage the data.
- Japanese System Control Information Institute "A Geographic Information System REALS for Personal Computer", volume 3, No.
- map data are processed in computers
- another map-projection transformation is required in view of output operations other than the above-described input operation. It is difficult to directly judge both azimuth and a distance from the map data which have been totally managed based on the longitude and latitude.
- the digital cartographic system is utilized as an information representing means to analyze a region, a proper information representation suitable for a desirable analyzing purpose is required. To achieve an intuitively understandable analysis support, it is required to display map data with satisfying correctness in azimuth as well as correctness in a distance.
- the azimuth map projection and the UTM map projection functioning as a method for representing either azimuth, or a distance.
- azimuth at a center point of projection is equal to azimuth at a ground surface, and a line segment for connecting this center line and an arbitrary point, becomes a minimum path between two points.
- UTM map projection used for the cylindrical-plane projection an angle between a ground surface and a corresponding map becomes equal, and also a distance on the map can be expressed as being substantially equal to an actual distance under practically acceptable map precision with a medium reduction ratio.
- continuous coordinate system with having the interval of longitude within a range of 6 degrees in the UTM map projection.
- the coordinate transformation effected in the ARC/INFO system is intended to perform the editing operation during the input/updating operations of the data, but to convert/display the map projections.
- the UTM map projection is effective to express an angle and a distance.
- the entire region is subdivided into narrow strips called zones at 6 degrees in this UTM coordinate system. Therefore, as represented in Fig. 8, there are great shifts at a boundary line of the adjoining zones in accordance with the higher latitude, so that the map data are represented with having the discontinuities on this boundary line.
- To represent the graphic data extending these zones in a continuous form there is another great problem that such a distortion becomes large in accordance with the higher latitude.
- US 4,899,293 describes a method of storage and retrieval of digital map data, which involves the transformation of the digital data between map projections, after dividing the data into regions.
- the present invention provides in a first aspect a digital cartographic system for processing geographic information, comprising:
- a second aspect of the present invention provides a method of displaying a digital map, comprising:
- Embodiments of the present invention may provide a digital cartographic system for solving the above-described problems such as the continuity of the graphic representation and the simplification of the coordinate transformation calculations, and also a method for transforming the coordinate system and for displaying the converted coordinate system, and furthermore, to a method for displaying a reference line having a function to assist an analysis.
- a transformation table which corresponds to a means for transforming the corresponding coordinate values, and thus the coordinate transformation is carried out by the linear interpolation with reference to this transformation table in the present invention.
- coordinate valves in the various sorts of map projections are related to the (equivalent) longitude and latitude and then the transformation is carried out via the longitude and latitude. As a result, it is possible to execute the coordinate transformation among arbitrary map projections contained in the table group.
- the map data is represented by the coordinate system based upon the longitude and latitude in order to maintain matching characteristics, and the map data is managed in unit of a sufficiently small section in order that the coordinate transformation by way of the linear interpolation can be achieved.
- the segment a region surrounded by longitude and latitude separated at a constant interval is utilized.
- both longitude/latitude of 4 vertexes in a segment in unit of respective segments, and also the coordinate values at each of the corresponding map projections are combined as a table shown in Fig. 2.
- a coordinate value at an arbitrary point within a segment unit can be calculated from a proportional distribution between the vertexes.
- the reference lines such as the longitude, the latitude and the curve of equal bearing, which can assist an analysis, can be calculated from the proportional distribution between the vertexes.
- the transformation is carried out with respect to the graphic data stored in the database. If the coordinate transformation is performed between one map projection A and the other map projection B, the graphic data stored in the database corresponding to the representation by the map projection A is referred, whereby the coordinate system of the longitude/latitude thereof is converted into the coordinate system for the map projection B.
- UTM coordinate system a corresponding table between longitude/latitude and UTM coordinates for a single zone is prepared.
- the UTM coordinate system is periodic. The same coordinate values are repeatedly utilized for each zone shifted by 6 degrees along the longitudinal direction. Therefore, an overall region of earth can be expressed by way of a remainder calculation for the longitude. As shown in Fig. 9, when a region extending over two adjoining zones is handled, the discontinuities are avoided by properly shifting the zone by 6 degrees.
- the map pattern is represented in the converted mode in conformity to correctness in a distance and correctness in azimuth in accordance with an object by a user, an intuitive idea can be supported. Since the linear interpolation is utilized to convert the coordinate values of the map pattern, both of the longitude/latitude and the coordinate values of the respective map projections can be mutually and easily converted therebetween.
- the transformation operations are independently carried out in unit of section by utilizing the transformation table corresponding to the transforming means, so that the calculation processes can be performed in a parallel distribution mode. To execute the coordinate transformation by the linear interpolation for the vertex data of the section, the continuity of the graphic data among the adjoining sections can be maintained.
- the coordinate values can be calculated at high precision. Furthermore, the discontinuities occurring between the adjoining zones can be avoided by shifting the zone with respect to the UTM coordinate system corresponding to the localized coordinate system.
- map data has been subdivided and managed in accordance with a coordinate system based upon longitude and latitude, and then stored into a map graphic database 105.
- transformation/display processes are entirely performed via the longitude and latitude coordinate system.
- coordinate data inputted by a user are interpreted as longitude/latitude coordinate data, and coordinate transformations are executed with respect to the map figure data stored in the map figure database 105.
- the transformation process is carried out by a linear interpolation, so that the transformation may be expressed by way of a matrix of 3X3 constants, and then a highspeed process operation by means of a hardware may be achieved. Since the transformations may be independently carried out an every subdivision management unit to be subject, it is easy to execute a parallel distributed processing. It should be noted that the transformation display process is performed as follows. 1 ⁇ The transformation conditions are determined for every subdivision management unit, whereby the transformations suitable for the sections are performed. 2 ⁇ Otherwise, the transformation condition is determined from a portion to which a user pays his specific attention (will be referred to "a region of interest"), so that the uniform transformation is performed over the entire region to be processed.
- the transformation since the transformation process is performed in such a manner that the coordinate transformation formula is set for every section unit, the transformation may be executed in uniform precision over the entire region.
- the transformation formula since the transformation formula is set from the region of interest and then the resultant transformation formulae are applied to the overall region, only one transformation-condition setting operation is required, whereby calculation process workloads for setting the transformation conditions may be reduced.
- Both a map projection B to be converted into and a region to be converted are entered by a user.
- a base point of transformation is required in this map projection B to be converted such as an azimuth map projection, this base point is also inputted by the user.
- Both the region and the base point which have been entered by the user are stored in a table for managing the coordinate transformation.
- a region 101 indicates a transformation region (by a representation map projection A) designated by the user.
- a region of interest is furthermore designated.
- a region 102 surrounded by points P 1 to P 4 within the region 101 corresponds to the region of interest.
- the map projection is converted by the system.
- both the coordinates of the vertexes of the region and the coordinate of the base point are back-converted from the map projection A into the longitude and latitude with employment of the transformation information utilized when the map is displayed under the map projection A.
- the coordinate transformation formula is determined based upon the relationship between the longitude/latitude coordinate ( ⁇ , ⁇ ) of the vertex in the management unit and the coordinate (X, Y) by the map pattern B thereof with respect to each of the subdivision management units contained in the region to be converted.
- a transformation result 103 is obtained, while sequentially retrieving the database 105.
- the setting and transforming process of the transformation conditions is carried out every single section in the unit of subdivision management.
- a region 104 within the display result 103 denotes a display range of the region 101 to be converted by the map projection B.
- superposition display/overlapping display of a reference line is performed as an auxiliary operation of an analysis in response to a user's demand.
- a reference line denotes a line such as a longitude, a latitude, a grid line of an UTM coordinate system, and an isometric line around a certain point. Correctness in the azimuth of the display result, correctness in the distance, and graphic distortion when the uniform transformation is performed can be intuitively represented to users by displaying such a reference line in the superposition/overlapping display mode.
- transformation processes are independently carried out in unit of section, these transformation processes can be executed in a parallel distribution manner.
- a parallel computer having a hyper cube structure is employed, if each of the sections of the management units is allocated to each of the calculation processors, the overall process operation can be accomplished at a high speed. As a result, a large quantity of graphic data can be readily handled so that the problems can be easily solved.
- the process operations for reading and transforming the graphic data need be repeated by the times equal to the quantity of sections in the suitable transformation in the unit of management.
- the uniform process is carried out based upon the region of interest. It should be noted that since the coordinate transformation is uniformly carried out over the entire region, the graphic data outside the region of interest does not always succeed to a nature of the map pattern B. To compensate for this problem, both the representation of the reference line and the evaluation of positional precision in the graphic data are performed in accordance with the user's demand after the presentation by the map projection B has been accomplished. The precision evaluation is performed by comparing with each other amounts of shifts among the uniformly converted data and the data converted every subdivision unit. The permissible range in the shift amounts (precision in transformation) depends upon worse precision in accordance with both of a size of a region and precision in graphic data which have been inputted by a user.
- FIG. 3 there is shown a construction of a computer system for carrying out the above-described processing operations.
- a calculation processing apparatus 301 executes 1 ⁇ a coordinate transformation calculation, taking account of a transformation map projection and a map projection transformation region which have been entered via an input apparatus 304 corresponding to an input device such as a keyboard and a mouse; 2 ⁇ display data transfer to a graphic display apparatus (GT) 303; and also 3 ⁇ controls of overall process operation.
- GT graphic display apparatus
- a main storage apparatus 302 there are stored a program of coordinate transformation/display, data on a coordinate transformation table, and figure data.
- An auxiliary storage apparatus 310 includes a program region 311, a region 312 for a coordinate transformation table file, and a region 313 for a coordinate transformation table file, and a region 313 for a graphic data file. Each of storage contents is read out from them into the main storage apparatus 302, if required.
- Reference numeral 305 indicates an I/O interface circuit.
- FIG. 4 there is shown a constructive example of the programs which have been prepared in the program storage region 311 within the auxiliary storage apparatus 310.
- Reference numeral 401 denotes a job control program to control executions of the respective process programs;
- reference numeral 402 indicates a map projection input program for causing a user to select the map projection B to be converted;
- reference numeral 403 represents a region input program for causing a user to designate a region to be converted;
- reference numeral 404 indicates a coordinate input program which is used to input a point and a base point when a region is designated.
- reference numeral 405 represents a program for operating a graphic transformation management table, by which a management table for region information entered by a user is operated.
- Reference numeral 406 is a program for forming a coordinate transformation table, which is used for such a map projection that the coordinate transformation table cannot be previously expressed by numeral data.
- the map projection capable of not expressing the table as the numeral data there are, for instance, an azimuth map projection requiring a base point, and also a conical map projection acceptable for a region designated by a user.
- This table production program 406 is arranged by subprograms used for the respective map projections.
- Reference numeral 407 indicates a graphic-data file operation program for operating a graphic data file; reference numeral 408 denotes a coordinate transformation execution program by way of the linear interpolation, reference numeral 409 represents a display scaling program for executing a scaling operation when transformation graphic data is displayed; reference numeral 410 is a precision evaluating program for transformation; reference numeral 411 indicates a reference line producing program used for superposition/overlay displaying the reference line; reference numeral 412 is a display control program for controlling reswitching of displays among the map projections A and B; and reference numeral 413 indicates an input/output program used to read/write the above-described programs from/into the input apparatus 304 and the auxiliary storage apparatus 310.
- Fig. 5 is a flow chart (PAD diagram) for representing one example of an overall process executed in the computer. A process flow will now be described in accordance with this flow chart.
- a map display method is initiated by a user.
- the job control program 401 is read out from the program region 311 and then is written into the main storage apparatus 302 by the calculation apparatus 301. Since the process operations are similar when the respective programs are initiated, the explanations thereof are omitted.
- the present display map projection and the data on the display range are read out from the system table into which they have been previously registered, and then prepared in the main storage apparatus 302.
- the transformation management table operation program 405 is initiated, and the Present display map projection data which have been registered in the coordinate transformation management table. This display map projection data is compared with the previously prepared data. If the display map projection data is different from the previously prepared data, the display map projection data is rewritten and this data is newly registered as the present display map projection data.
- the job control program initiates the map projection input program 402 so as to cause a user to input the map projection to be converted.
- the map projections to be converted are represented in a menu form and a user will select a proper map projection.
- the map projection management table selected by the user is read.
- the transformation management table operating program 405 reads the map projection management table from the coordinate transformation table file region 312 and writes this management table into the main storage apparatus 302.
- This map projection management table is utilized to confirm whether or not the map projection to be converted requires the base point, and whether or not the coordinate transformation table must be formed, and also to refer to the transformation table.
- the job control program 401 initiates the region input program 403 and the coordinate input program 404.
- the region input program 403 causes a user to enter a region to be converted. This is done in such a way that a coordinate of a vertex may be entered while requesting the user to input the numeral data from the keyboard, or a region may be designated on the display screen by utilizing a mouse.
- coordinate data may be inputted in a form of a coordinate value and also values of longitude and latitude by the present display map projection.
- the management program confirms whether the method for performing this transformation corresponds to the suitable process or the uniform process.
- a region of interest similar to that of the step 504 is inputted by the user at a step 506.
- step 507 in accordance with the map projection management table which has been read at the step 503, confirmation is made whether or not a base point should be inputted. If necessary, a point input operation similar to that of the step 504 is carried out by the user at a step 508.
- the map projection transformation has been prepared.
- the job control program initiates the coordinate transformation execution program 408.
- Processing steps from 509 to 511 correspond to such a process that the coordinate values inputted by the user are equal to those used in the present display map projection A.
- the process defined at the step 510 is executed.
- the coordinate transformation table for the map projection A and the longitude/latitude is prepared.
- the back transformation from the map pattern A to the longitude/latitude is carried out.
- a back-transformation formula is produced based upon the coordinate relationship among the subdivision management units containing the vertexes thereof, and then the map pattern A is converted into the longitude and latitude coordinate system. Also, the back-transformation from the longitude/latitude coordinate system to the map pattern A is executed under control of the coordinate transformation execution program 408.
- a coordinate transformation management data table is formed which is used in the map pattern B to be converted.
- the tables indicative of the information on the base point and the coordinate relationship as shown in Fig. 2 are prepared for the region to be converted and the region of interest.
- a subprogram corresponding to the sub-programs included in the coordinate transformation table forming program 406 is first initiated.
- a coordinate system in the map projection B is calculated under control of the program 406 based upon the longitude/latitude coordinate values with respect to the respective vertexes of the region to be converted and the region of interest.
- the coordinate values at the vertex "a" by the map projection B are linear-interpolated under control of the coordinate transformation execution program 408, and the linear-interpolated coordinate values are registered together with the longitude/latitude coordinate values thereof into the coordinate transformation management table.
- the above-described process operation will be executed with regard to all of the vertexes of the region to be converted and of the region of interest.
- an enlargement ratio (reduction ratio) for display purposes is determined.
- the enlargement ratio (reduction ratio) is determined in such a manner that the transforming region converted into the map projection B can be stored within the display area of the screen.
- a circumscribed rectangle is obtained with respect to the transforming region expressed by the coordinate system on the map projection B, and thereafter the enlargement (reduction) ratio is determined in such a manner that the longer side of the rectangle can be stored within the display region.
- This ratio will be referred by the display scaling program 409.
- the job control program 401 initiates the graphic data file operation program 407 and the display scaling program 409.
- both of the transformation and representation for the graphic data are carried out.
- the graphic data about the subdivision management unit group containing the region to be converted are read out under control of the graphic data file operation program 407, and are converted under control of the coordinate transformation execution program 408, and thereafter are enlarged/reduced under control of the display scaling program 409, whereby the resultant graphic data are transferred to the display apparatus 303.
- the process operation is carried out every unit of section.
- the graphic data in the unit of section is read out, the coordinate transforming formula is conducted from the relationship between the coordinate values at the vertexes of this section, and thereafter the coordinate system of the graphic data is converted. If the transformation executing method is performed based on the region of interest, the coordinate transforming formula is conducted from the relationship between the coordinate values at the vertexes of the region of interest, and then the subdivision units to be converted are uniformly converted.
- a method for obtaining a subdivision management unit group in question from a region to be converted among a graphic data file will be described later.
- the job control program 401 executes both the precision evaluation and the superposition display/overlaying display of the reference line such as the longitude and the latitude in response to user's request.
- the precision evaluation program 410, the reference line generation program 411, and the display change control program 412 are initiated in response to the request.
- a step 515 implies that the process operations from a step 516 to a step 520 are repeated until a user instructs an end of the process operation.
- the positional precision on the graphic data which has been designated by the user via the region of interest is evaluated under control of the display scaling program 409, and then the precision evaluated result is displayed on the display region under control of this program 409.
- the reference line is superposition-displayed/overlapping-displayed.
- the longitude, latitude, and grid line of the UTM coordinate system are superposition-displayed/overlapping-displayed, and erased at intervals designated by the user.
- the representations between the map projection A and the map projection B are rechanged.
- the transformation display executed in this embodiment is returned to the original map projection A, otherwise set to the map projection B.
- the display results of both of the map projections A and B may be compared with each other, and thus the analysis support may be performed more flexibly.
- the job control program 401 initiates the display control program 412 used for changing the representation, so that the back transformations from the map projection B to the longitude and latitude, and also from the longitude and latitude to the map projection A are executed in accordance with the contents of the coordinate transformation management data table. Otherwise, the back transformation from the map projection A to the map projection B is again executed.
- the display control program 412 merely controls the executions from the coordinate transformation table producing program 406 into the display scaling program 409. It should be noted that the coordinate transformation table producing program 406 executes changing operations of the coordinate transformation management data between the map projection A and the map projection B.
- the coordinate transformation table producing program 406 executes changing operations of the coordinate transformation management data between the map projection A and the map projection B.
- each of these transformation results is displayed on the separate windows, and these windows may be changed. More specifically, when both of these windows are positioned side by side in such a manner that these windows are not overlapped with each other as permeable as possible on the display screen, an easy window comparison can be achieved and an easy representation can be realized.
- an end process is executed under control of the job control program 401.
- the display map projection data to be converted within the coordinate transformation management table is again registered to the present display map projection data by the transformation management table operation program 405, and thus the map projection data to be converted is erased. Thereafter, an end instruction for the step 516 is given.
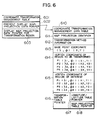
- Figs. 6 and 7 tables for managing information about the map projections and map projection transformations will be described. Both of the information about the map projections and the information about the coordinate transformation are independently prepared from the transformation process, so that the transformation process may be simply executed and the problems may be solved.
- Fig. 6 and 7 show contents of a coordinate transformation management table, a map projection management table and a coordinate transformation table.
- a coordinate transformation management table 601 corresponds to a table used for establishing a relationship among the present display map projection, the longitude/latitude management data and the map projection to be converted as shown in Fig. 1.
- the coordinate transformation management table 601 is constructed of two data tables for combining the longitude/latitude data in the graphic data file region 313 with the projection data to be converted, and also of a pointer table for designating these data tables.
- the pointer table is arranged by a pointer 602 to the present display map projection data table, and also a pointer 603 to a display map projection data table to be converted.
- a coordinate transformation management data table 610 designated by the respective pointers is constructed of an identifier 611 of a map projection; transformation method information 612 indicating a preparation state of a transformation table and also such a matter whether or not a region of interest is designated; a base point coordinate 613; a vertex coordinate table 614 for a transforming region; a vertex coordinate table 615 of a region of interest; and a pointer 616 for pointing out the coordinate transformation table.
- the transformation method information 612 indicates discrimination whether the transformation is performed based upon the respective management unit, or the uniform transformation is carried out based on the region of interest; discrimination whether or not there is a base point; and discrimination whether or not the coordinate transformation table has been prepared with respect to an overall region to be converted.
- the relationships between the longitude/latitude coordinate values of the vertexes of the region shown in Fig. 2, and the coordinate values by the map projection denoted by the identifier 611 have been registered in the vertex coordinate tables 614 and 615.
- the transformation table pointer 616 is arranged by a pointer 617 used for the longitude/latitude coordinate table and a pointer 618 used for the coordinate table of the map projection indicated by the identifier 611, and is accepted from each of the map projection management tables 701.
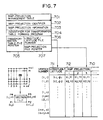
- a map projection management table 701 corresponds to such a table for managing information related to a map projection shown in a map projection identifier 702.
- This management table 701 is constructed of graphic information 703 related to such an information whether or not the transformation table has been expressed by numeral values, and also whether or not the base point is required; an identifier 704 of a transformation table forming program; and a pointer 705 for pointing out a transformation table within the coordinate transformation table file region 312.
- the graphic information 703 consists of a NUMERAL-LABEL and a BASE-POINT-LABEL.
- the NUMERAL-LABEL represents whether a transformation table is already expressed as the numeral values or not.
- the BASE-POINT-LABEL represents whether a map projection requires a base point or not. For instance, as to the azimuth map projection, the NUMERAL-LABEL is set to "YET". (The NUMERAL-LABEL requires to make the table expressed as the numeral values.) The BASE-POINT-LABEL is set to "NEED". (The azimuth map projection requires a base point.) On the other hand, as to the conical map projection, the NUMERAL-LABEL is set to "YET” and the BASE-POINT-LABEL is not set to "NO-NEED".
- the conical map projection does not require a base point. If the transformation table is not expressed as the numeral values, the transformation table file pointer 705 is not stored, but the program identifier 704 has been set instead of this pointer. At a step 513, the program corresponding to the program identifier 704 in the coordinate transformation table forming program 406 is initiated. If the transformation table has been expressed as the numeral values, the program identifier 704 is set to "0", and then a pointer for designating a file is stored into the transformation table file pointer 705. This transformation table file point 705 is arranged by a pointer 706 for the longitude/latitude coordinate file and also a pointer 707 for a coordinate file of a map projection indicated by the identifier 704.
- a transformation table file group 710 is stored into the coordinate transformation table file region 312 in accordance with the management unit of the graphic data which has been stored into the graphic data file region 313.
- the transformation table file group 710 is arranged by a longitude/latitude file 711 indicative of a longitude/latitude coordinate system corresponding to each of vertexes in the respective management units, and a coordinate value data file 712 provided for each map projection corresponding to the same vertex in conformity to the minimum subdivision management unit of the graphic data.
- these tables 711 and 712 of the subdivision management unit group corresponding to the region to be converted are produced with employment of the coordinate transformation table forming program 406.
- the produced tables are registered at table pointers 617 and 618.
- the coordinate relationship among the vertexes in the subdivision management unit can be easily conducted from the relationships 720 among the sections and vertex data, if the subdivision management unit is determined. This process operation is carried out under control of the transformation management table operation program 405.
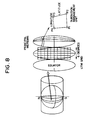
- Figs. 8 and 9 are explanatory diagrams in case of the UTM coordinate system.
- Fig. 8 is an explanatory diagram of a coordinate transformation table in the UTM coordinate system.
- the UTM coordinate system is segmented into zones every 6 degrees in a longitudinal direction, and thus an overall surface of the earth is represented by 60 zones. Since the UTM coordinate system corresponds to such a coordinate system every zone, the same coordinate values are obtained every time the zone is shifted by 6 degrees along the longitudinal direction. As a consequence, it is not required to prepare transformation tables over the entire file of the graphic data file region, and then a transformation table between longitude/latitude and the UTM coordinate system with respect to a single zone may be prepared.
- the UTM coordinate system can be related to the residue calculation of the longitude.
- Fig. 9 indicates a method for preventing a discontinuity of the UTM coordinate system.
- a region 901 to be converted extends over two zones 902 and 903.
- New zones can be set including an old boundary and the region 901 in one zone. Therefore the region 901 has no boundary in a new zone, so that the proglems can be also solved.
- an extension of the region 901 along the longitudinal direction is within 6 degrees, a zone such as the zone 904 is properly shifted, the discontinuity in representation can be avoided.
- An amount of shifting angle in the longitudinal direction is determined based upon a central value of the longitude of the region to be converted. A similar process operation can be achieved by shifting it by this shift amount while performing the residue calculation of the longitude with reference to the corresponding table.
- T 3X3 transformation matrix (constant matrix) Since the transformation matrix T is determined only from 4 vertexes of the segment and also the transformation formula is expressed by the linear form, the coordinate transformation calculation may be simplified. Furthermore, since the coordinate value after the transformation are determined from the proportional distributions of the coordinate values of the respective vertexes, there is no shift in the graphic data on the boundary line of the adjoining segments and thus the problems can be solved. Since the subdivision management unit corresponds to the segment surrounded by the longitude and the latitude, the transformations can be executed every segment in the suitable process.
- the above-described formula may be applied by that either the region of interest is inputted as the region surrounded by the longitude/latitude, or the region of interest is substituted by the longitude/latitude.
- the substitution method it is realized by selecting such a region which is inscribed with the region of interest and surrounded by the longitude/latitude.
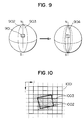
- Fig. 10 represents a relationship between a region to be converted and a subdivision management unit.
- Reference numeral 1001 indicates a data file within the graphic data file region 313. With respect to the respective vertexes of the region to be converted, points corresponding thereto on the data file are obtained from the longitude/latitude coordinates of the vertexes.
- a region 1002 formed by connecting the corresponding points of the respective vertexes is assumed to as a region to be converted on the data file.
- a minimum set 1003 of a section or segment including this region 1002 corresponds to a management unit group which should be converted.
- the coordinate transformation processes are carried out with respect to the respective segments. Since the transformation processes are independently carried out in the unit of segment, these transformation processes may be performed in the parallel distributed mode. Further, when a transformation table is formed, a relation is obtained between the longitudes and latitudes at these vertexes of the segments, and the coordinate values under the designated map projection.
- a method for generating a reference line will now be described. This is done with respect to a display screen.
- the representation made on this display screen is a region to be converted which has been designated by a user.
- the process to generate the reference line is carried out with regard to a graphic data subdivision management group similar to a subject of the coordinate transformation process.
- the kind of reference line is designated by the user, the positions of this reference line are calculated every subdivision management unit and displayed.
- Standard condition values are previously set to a display interval and a display color of the reference line.
- a confirmation is made during the setting operation whether or not a setting change is requested. If there is no specific input, the display of the reference line is carried out in accordance with the standard conditions.
- the reference line is generated in such a way that a cross point between a boundary line (longitude/latitude) of a segment and a reference line is calculated, and the calculated cross points are connected to each other. Since the management table of the reference line is independently provided from the map-projection transformation process and the transformation management table, the reference line can be produced irrelevant to the original display map projection and the transforming map projection. As a consequence, the reference line functioning as an assistance of analysis may be freely selected and therefore an analysis support may be flexibly achieved.
- Fig. 11 is a flow chart for explaining the process to generate the reference line.
- a sort of reference line is set.
- a check is done whether or not a management table of the reference line which has been set at the previous step 1101 is prepared. If the management table has not yet been prepared, a process defined at a step 1103 is executed to prepare such a management table.
- the support-management table operating program 405 the reference line management table is read out from the coordinate transformation table file region 312 and then is written into the major storage apparatus 302. Furthermore, under control of the support-management table operating program 405, a map projection identifier of the coordinate transformation management table is referred.
- this map projection identifier of the coordinate transformation management table is different from another map projection identifier of the reference line management table, or there is no coordinate transformation table for an overall region to be converted, a table is produced in accordance with the coordinate transformation table producing program 406.
- a map-projection management table indicated by the map projection identifier will be referred, if required.
- the base point is inputted in accordance with the coordinate input program 404.
- the resultant table is registered in a transformation table pointer of the reference line management table. If there is the same map projection in the coordinate transformation management table, it is also registered into a table pointer thereof.
- an interval of the generation of the reference line is set. This interval is indicated as Xint, Yint and ⁇ as shown in Fig. 12. In case of the longitude/latitude, or the equiangularity, this interval is an angle such as every certain degree. In case of the grid line of the UTM coordinate system, this interval corresponds to a distance interval such as every certain kilometers.
- a display condition of the reference line is set.
- a display color, a width of the reference line, and a sort of reference line are set.
- a step 1106 implies a present display range. That is to say, the process operations defined from the step 1107 to the step 1115 are repeatedly executed with respect to the respective subdivision management units of the region to be converted which has been designated by a user. Since these process operations can be separately executed with respect to each of the minimum sets 1003 of the segment, the parallel process operation may be performed similar to such a case of the coordinate transformation and thus the process operations can be carried out at a high speed.
- a step 1107 as shown in Fig. 2, coordinate values of the reference amount corresponding to the longitude and latitude are combined with each other with respect to the vertex of the subdivision unit to be processed at this time.
- This method is similar to such a method for producing a corresponding table between the longitude/latitude and the coordinate of the map projection B at the step 512 during the coordinate transformation.
- the grid line in the UTM coordinate system it may be combined with reference to a transformation table by way of the remainder calculation of the longitude and latitude.
- a minimum value and also a maximum value of a coordinate value for the reference amount are obtained from the corresponding table produced at the previous step 1107.
- the coordinate value of the table is converted into angular information around the base point 1208, and then a maximum (minimum) value thereof is obtained.
- a range of the reference amount to be processed is restricted by previously obtaining the maximum (minimum) value.
- a step 1109 implies that process operations defined at a step 1110 and the step 811 are executed with respect to each of the reference amounts X (or ⁇ ) contained in between the minimum value and the maximum value.
- the reference amount is expressed as a value obtained by multiplying the interval value by "K" (symbol "K" being natural numbers).
- a cross point between the reference line and each of the boundary lines (longitude/latitude) at the subdivision management unit is obtained.
- a cross point between the boundary line and a straight line having an angle "K ⁇ " in a designated direction is obtained.
- a line segment to connect the thus obtained cross points with each other is displayed.
- the line segment is enlarged/reduced under control of the display scaling program 309 and then is transferred to the display apparatus 203.
- a process operation similar to that defined from the step 1109 to the step 1111 is carried out with respect to the reference amount Y.
- a subsequent subdivision management unit is obtained.
- Fig. 12 schematically shows a process to generate a reference line, namely a relationship between the reference line and a subdivision management region.
- Fig. 12A represents such a case of longitude and latitude, and also a grid line of the UTM coordinate system, whereas Fig. 12B shows an equiangularity.
- Reference numerals 1201 and 1202 indicate boundary lines at the subdivision management unit, and become longitude and latitude.
- Dot lines 1203 and 1204 indicate reference lines indicative of k ⁇ Xint; reference numerals 1205, 1206 and 1207 denote cross points between the respective reference lines and the boundary lines; and reference numeral 1208 denote a base point of an equiangularity.
- Fig. 13 represents a content of a reference line management table. Also as to the reference line, since the management data is independent from the generation process similar to the map projection transformation, various sorts of the reference lines can be easily handled.
- the reference line management table 1301 is constructed of an identifier 1302 for the reference line; a line color 1303 of the reference line; a line width 1304; a sort of line 1305; a display interval 1306 of the reference line; and an identifier 1307 of a map projection to handle the reference amount; and also a transformation table pointer 1308.
- the transformation table pointer 1308 is similar to the transformation table pointer 616 of the coordinate transformation management data table.
- a coordinate value obtained by the suitable transformation is set as a true value, and precision is evaluated by checking a shift between another coordinate value obtained by the uniform transformation and such a coordinate value which has been originally obtained by way of the suitable transformation. That is to say, the comparison between the first-mentioned coordinate value and the second mentioned coordinate value, is performed at points obtained in the following sequence and positioned on the boundary lines in the respective subdivision management units in the region to be converted.
- a region having arbitrary precision may be displayed in an emphasis mode by setting the allowable error range in accordance with the following sequence.
- Fig. 14 is a flow chart for explaining a process to evaluate precision. From the coordinate transformation formula by the uniform transformation, a straight line having a constant X and a constant Y is determined in the coordinate system (X, Y) of the map projection B to be converted, a cross point between this straight line and a boundary line of a segment, and also a shift in a coordinate value at a cross point position is evaluated.
- Fig. 15 schematically illustrates a summary of the precision evaluating process.
- an allowable range for a positional shift amount of graphic data is determined.
- This allowable range of the shift amount is determined in accordance with an area of a region of interest (namely, the region of interest owns how many minimum subdivision units) which has been inputted by the user, and also precision in graphic data. If the coordinate transformation table at the region to be converted has not yet been expressed by numeral values, referring to the coordinate transformation management data table 610, a table is formed under control of the table forming program 405.
- Reference numeral 1502 indicates "PX+”.
- Reference numeral 1503 indicates "PX-”.
- Reference numeral 1504 indicates "PY+”.
- Reference numeral 1505 denotes "PY-”.
- Reference numeral 1510 indicates a range expressed in the emphasized mode on the display screen.
- the steps 1420 and 1430 are a flow chart for explaining the precision evaluation process operations executed from the steps 1403 to 1406.
- a process operation of a step 1421 implies that process operations defined from a step 1422 to a step 1425 are repeatedly performed unless the shift does not exceed the allowable range.
- a point 1501 is recorded.
- the cross points which have been obtained during the previous time are recorded.
- a subdivision management unit adjacent to the positive (negative) direction of the straight line is found.
- the coordinate value Xr is obtained by way of the linear interpolation from the corresponding relationship of the coordinates at the vertexes of the section.
- a judgement is made whether or not an absolute value of (X1-Xr) functioning as the shift amount is calculated. If the shift exceeds the allowable range, the cross point obtained during the previous time is set to PX+(PX-), whereby the process operation is completed.
- Reference numeral 1507 indicates a cross point exceeding the allowable range.
- This method may be applied to such a case that display results are different from each other, depending upon a position of a base point, as in the azimuth map projection.
- the base points are produced at a constant interval along the path inputted by the user, whereby the map projection transformation is performed and then displayed. If the base point is determined, the map projection transformation/display are executable similar to that of the previous case.
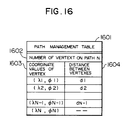
- Fig. 16 represents contents of a path management table.
- a path management table 1601 is constructed of a coordinate value 1603 of a vertex in a path, a quantity of vertex 1602, and also a distance 1604 up to the next vertex.
- Reference numeral 1603 represents a coordinate value of longitude/latitude of the vertex.
- Reference numeral 1604 denotes a distance up to the subsequently registered vertex, a value of which may be calculated either from the UTM coordinate value, or a distance between two points on a sphere.
- an accumulated distance among the respective vertexes is obtained from the distance 1604 to each vertex, and then the points on the path are interpolated every predetermined interval, thereby obtaining a base point.
- the maps can be displayed in conformity to correctness in a distance as well as correctness in an azimuth by performing various sorts of map-projection transformation, so that these correct maps can intuitively support user's idea. Also, since the continuities of the graphic data about the adjoining sections can be maintained by linear-interpolating the vertex data every section in case that the various sorts of map projection transformation, and furthermore, the discontinuities of the adjoining zones can be avoided by shifting the zone with respect to the UTM coordinate system corresponding to the local coordinate system, the maps can be displayed without causing inconvenient feeling to a user. As a result, the information representing function of the digital map information system can be improved. It is also possible to provide data on the basis of analysis.
Landscapes
- Physics & Mathematics (AREA)
- Engineering & Computer Science (AREA)
- Geometry (AREA)
- Software Systems (AREA)
- General Physics & Mathematics (AREA)
- Theoretical Computer Science (AREA)
- Remote Sensing (AREA)
- Computer Graphics (AREA)
- Processing Or Creating Images (AREA)
- Instructional Devices (AREA)
- Image Processing (AREA)
Claims (11)
- Digitales kartographisches System zur Verarbeitung geographischer Informationen, umfassend:dadurch gekennzeichnet, daß:eine graphische Datenbank (310, 105) zur Speicherung graphischer Daten in Einklang mit einem Koordinatensystem auf der Grundlage von Längen- und Breitengrad; undMittel (303) zur Anzeige ausgewählter Daten (101) der graphischen Daten gemäß einer ersten Kartenprojektion (A);
das System außerdem folgendes umfaßt:Eingabemittel (304) zur Bezeichnung einer zweiten Kartenprojektion (B); undMittel (301, 302) zur Umwandlung der ausgewählten Daten (101) in weitere Daten gemäß der zweiten Kartenprojektion (B), wobei das Umwandlungsmittel angeordnet ist, um die ausgewählten Daten in Abschnitte zu teilen, um die ausgewählten Daten jedes der Abschnitte in Längen- und Breitengrade zurückzuwandeln, wobei die Längen- und Breitengradewerte gemäß der zweiten Kartenprojektion (B) mittels einer Umwandlungstabelle in umgerechnete Werte umgewandelt werden und zwischen den umgerechneten Werten linear interpoliert wird, wodurch die weiteren Daten abgeleitet werden;wobei das Anzeigemittel (303) angeordnet ist, um die weiteren Daten gemäß der zweiten Kartenprojektion (B) anzuzeigen. - Digitales kartographisches System nach Anspruch 1, außerdem umfassend Mittel (410, 1403-1406) zur Bewertung der Präzision eines Ergebnisses der Kartenprojektionsumwandlung und Mittel (517, 1410) zur Anzeige eines spezifischen Bereichs in einem hervorgehobenen Modus, wodurch die Präzision der Daten im Umwandlungsergebnis die Bewertung ist und ein Bereich, der die vorbestimmte Präzision erfüllen kann, im hervorgehobenen Modus angezeigt wird.
- Digitales kartographisches System nach Anspruch 1, außerdem umfassend Mittel (411) zur Bildung einer Referenzlinie wie z.B. eines Längen- und Breitengrads, wodurch beim Anzeigen der umgerechneten graphischen Daten gemäß der zweiten Kartenprojektion (B) auf dem Ausgabemittel die Referenzlinie durch Überlagerung/Überlappung angezeigt wird (518, 1101-1115).
- Digitales kartographisches System nach Anspruch 1, worin die Mittel (304) zur Kennzeichnung eines Wegs durch Eingeben von Koordinatenwerten vorgesehen sind, wodurch eine Anzahl von Basisumwandlungspunkten nacheinander entlang des durch einen Benutzer gekennzeichneten Wegs erzeugt und die Ergebnisse der Kartenprojektionsumwandlung auf dem Ausgabemittel an jedem der Basispunkte angezeigt werden.
- Digitales kartographisches System nach Anspruch 1, worin die Umwandlungsmittel (301, 302) solcherart angeordnet sind, daß wenn die zweite Kartenprojektion eine UTM-Kartenprojektion ist, in der die Karte in eine Vielzahl sequentieller Zonen mit diskontinuierlichen Koordinatenwerten an Grenzen benachbarter Zonen unterteilt ist, und die weiteren Daten gemäß der zweiten Kartenprojektion (B) einen Bereich darstellen, der sich über die Grenze zwischen zwei benachbarten Zonen erstreckt, die Grenzen zwischen den sequentiellen Zonen verschoben werden, bis der Bereich zur Gänze innerhalb einer einzigen Zone liegt, wodurch in dem Bereich Diskontinuitäten aufgrund der Grenzen zwischen den Zonen verhindert werden.
- Digitales kartographisches System nach Anspruch 1, worin das Mittel zur Umwandlung der ausgewählten Daten angeordnet ist, die ausgewählten Daten umzurechnen und die Längs- und Breitengradwerte in einem Distributionsmodus umzuwandeln, in dem jeder der Abschnitte parallel verarbeitet wird.
- Verfahren zur Anzeige einer digitalen Karte, umfassend die folgenden Schritte:dadurch gekennzeichnet, daß das Verfahren außerdem folgende Schritte umfaßt:Speichern graphischer Daten in Einklang mit einem Koordinatensystem auf der Grundlage von Längen- und Breitengrad in einer graphischen Datenbank (105, 310); undAnzeigen ausgewählter Daten (101) der graphischen Daten gemäß einer ersten Kartenprojektion (A) auf dem Anzeigemittel (303);Bestimmen einer zweiten Kartenprojektion (B) auf dem Eingabemittel (304); undUmwandeln der ausgewählten Daten (101) in weitere Daten gemäß der zweiten Kartenprojektion (B), wobei dieses Umwandeln das Aufteilen der ausgewählten Daten in Abschnitte, das Rückrechnen der ausgewählten Daten jedes der Abschnitte in Längen- und Breitengradwerte, das Umwandeln der Längen- und Breitengradwerte in umgerechnete Werte gemäß der zweiten Kartenprojektion (B) mittels einer Umwandlungstabelle und das lineare Interpolieren zwischen den umgerechneten Werten umfaßt, um dadurch die weiteren Daten zu erhalten; undAnzeigen der weiteren Daten gemäß der zweiten Kartenprojektion (B).
- Verfahren zur Anzeige einer digitalen Karte nach Anspruch 7, worin die Präzision von Daten in den Umwandlungsergebnissen bewertet wird (410, 1403-1406) und ein Bereich, der die vorbestimmte Präzision erfüllen kann, in einem hervorgehobenen Modus angezeigt wird (517, 1410).
- Verfahren zur Anzeige einer digitalen Karte nach Anspruch 7, worin Mittel (411) vorgesehen sind, sodaß beim Anzeigen der weiteren Daten gemäß der zweiten Kartenprojektion (B) eine Referenzlinie durch Überlagerung/Überlappung angezeigt wird (518, 1101-1115).
- Verfahren nach Anspruch 7, worin nacheinander einige Basisumwandlungspunkte entlang eines durch einen Benutzer gekennzeichneten Wegs erzeugt (507, 508) und Ergebnisse der Kartenprojektionsumwandlung an jedem der Basispunkte angezeigt werden.
- Verfahren nach Anspruch 7, worin - wenn die zweite Kartenprojektion eine UTM-Kartenprojektion ist, in der die Karte in eine Vielzahl sequentieller Zonen mit diskontinuierlichen Koordinatenwerten an Grenzen benachbarter Zonen unterteilt ist, und die weiteren Daten gemäß der zweiten Kartenprojektion (B) einen Bereich darstellen, der sich über die Grenze zwischen zwei benachbarten Zonen erstreckt - die Grenzen zwischen den sequentiellen Zonen verschoben werden, bis der Bereich zur Gänze innerhalb einer einzigen Zone liegt, wodurch in dem Bereich Diskontinuitäten aufgrund der Grenzen zwischen den Zonen verhindert werden.
Applications Claiming Priority (2)
| Application Number | Priority Date | Filing Date | Title |
|---|---|---|---|
| JP88109/91 | 1991-04-19 | ||
| JP3088109A JP2900632B2 (ja) | 1991-04-19 | 1991-04-19 | ディジタル地図処理装置及びディジタル地図の表示方法 |
Publications (3)
| Publication Number | Publication Date |
|---|---|
| EP0509839A2 EP0509839A2 (de) | 1992-10-21 |
| EP0509839A3 EP0509839A3 (en) | 1995-01-11 |
| EP0509839B1 true EP0509839B1 (de) | 1998-07-01 |
Family
ID=13933714
Family Applications (1)
| Application Number | Title | Priority Date | Filing Date |
|---|---|---|---|
| EP92303490A Expired - Lifetime EP0509839B1 (de) | 1991-04-19 | 1992-04-16 | Digitales karthographisches System zur Verarbeitung von geographischen Informationen |
Country Status (3)
| Country | Link |
|---|---|
| US (1) | US5544052A (de) |
| EP (1) | EP0509839B1 (de) |
| JP (1) | JP2900632B2 (de) |
Cited By (1)
| Publication number | Priority date | Publication date | Assignee | Title |
|---|---|---|---|---|
| US7881562B2 (en) | 2006-03-31 | 2011-02-01 | Research In Motion Limited | Real-time spherical correction of map data |
Families Citing this family (70)
| Publication number | Priority date | Publication date | Assignee | Title |
|---|---|---|---|---|
| JPH07319915A (ja) * | 1994-05-30 | 1995-12-08 | Hitachi Ltd | 地図処理方法及びその装置 |
| US5742924A (en) * | 1994-12-02 | 1998-04-21 | Nissan Motor Co., Ltd. | Apparatus and method for navigating mobile body using road map displayed in form of bird's eye view |
| JP3376741B2 (ja) * | 1995-02-24 | 2003-02-10 | 日産自動車株式会社 | 車両用経路誘導装置 |
| EP0735380A1 (de) * | 1995-03-31 | 1996-10-02 | A.T. SYSTEM S.p.A. | Funkordnungs- und Funknavigationsanlage mobiler Einheiten |
| US5751612A (en) * | 1995-08-24 | 1998-05-12 | Lockheed Martin Corporation | System and method for accurate and efficient geodetic database retrieval |
| JP3266236B2 (ja) * | 1995-09-11 | 2002-03-18 | 松下電器産業株式会社 | 車載用ナビゲーション装置 |
| JPH1091804A (ja) * | 1996-09-11 | 1998-04-10 | Sony Miyuujitsuku Entertainment:Kk | ソフトウェアを有する記録媒体 |
| AT1856U9 (de) * | 1996-10-16 | 2004-05-25 | Walter Fink | Verfahren zur elektronischen unfalldatenaufnahme und vermessung von objekten in digitalisierten unfallbildern |
| JP3423848B2 (ja) * | 1996-11-25 | 2003-07-07 | 株式会社日立製作所 | 地理情報システム |
| US6016118A (en) * | 1998-03-05 | 2000-01-18 | Trimble Navigation Limited | Real time integration of a geoid model into surveying activities |
| US6219667B1 (en) * | 1998-05-28 | 2001-04-17 | International Business Machines Corporation | Efficient large-scale access control for internet/intranet information systems |
| US6373580B1 (en) * | 1998-06-23 | 2002-04-16 | Eastman Kodak Company | Method and apparatus for multi-dimensional interpolation |
| JP2000112342A (ja) * | 1998-09-30 | 2000-04-21 | Pioneer Electronic Corp | 地図情報の処理方法 |
| US6119069A (en) * | 1999-03-01 | 2000-09-12 | Case Corporation | System and method for deriving field boundaries using alpha shapes |
| JP2000311236A (ja) * | 1999-04-27 | 2000-11-07 | Pioneer Electronic Corp | 地図データ作成装置及び方法 |
| AUPQ363299A0 (en) * | 1999-10-25 | 1999-11-18 | Silverbrook Research Pty Ltd | Paper based information inter face |
| JP3473510B2 (ja) * | 1999-07-21 | 2003-12-08 | 株式会社デンソー | 地図表示装置 |
| US7428525B1 (en) * | 1999-11-12 | 2008-09-23 | Tele Atlas North America, Inc. | Virtual street addressing radius |
| JP3687731B2 (ja) * | 2000-04-27 | 2005-08-24 | アイシン・エィ・ダブリュ株式会社 | 地図表示装置及び記録媒体 |
| AU2002230389A1 (en) * | 2000-06-14 | 2002-04-29 | Vermeer Manufacturing Company | Utility mapping and data distribution system and method |
| US6930715B1 (en) | 2000-07-21 | 2005-08-16 | The Research Foundation Of The State University Of New York | Method, system and program product for augmenting an image of a scene with information about the scene |
| JP2002117126A (ja) * | 2000-10-05 | 2002-04-19 | Ibm Japan Ltd | 管理システム、検索システム、携帯型位置表示装置、データ管理装置、位置表示方法、記憶媒体 |
| US7689621B1 (en) * | 2000-11-06 | 2010-03-30 | Navteq North America, Llc | Multi-dimensional spatial index for a geographic database |
| US7987186B1 (en) * | 2000-11-06 | 2011-07-26 | Navteq North America, Llc | Method and system for wavelet-based representation and use of cartographic data |
| US20060197763A1 (en) * | 2002-02-11 | 2006-09-07 | Landnet Corporation | Document geospatial shape tagging, searching, archiving, and retrieval software |
| US7054741B2 (en) * | 2002-02-11 | 2006-05-30 | Landnet Corporation | Land software tool |
| US20070226004A1 (en) * | 2001-06-01 | 2007-09-27 | Landnet Corporation | Identification, storage and display of land data on a website |
| US7171389B2 (en) * | 2001-06-01 | 2007-01-30 | Landnet Corporation | Identification, storage and display of land data on a website |
| US20050116966A1 (en) * | 2002-04-04 | 2005-06-02 | Graham James J. | Web imaging serving technology |
| JP2004101780A (ja) * | 2002-09-09 | 2004-04-02 | Hitachi Ltd | 位置座標補正処理装置及び処理方法 |
| US7127352B2 (en) * | 2002-09-30 | 2006-10-24 | Lucent Technologies Inc. | System and method for providing accurate local maps for a central service |
| JP2003233304A (ja) * | 2002-12-09 | 2003-08-22 | Hitachi Ltd | 地理情報システム |
| JP4630528B2 (ja) * | 2003-05-30 | 2011-02-09 | 株式会社日立製作所 | 時空間データ管理装置 |
| JP4357213B2 (ja) * | 2003-06-02 | 2009-11-04 | アルパイン株式会社 | 地図データベースおよびそれを用いた地図描画方法ならびに地図描画装置 |
| JP4355535B2 (ja) * | 2003-08-07 | 2009-11-04 | 株式会社岩根研究所 | 360度画像変換処理装置 |
| ITMI20031920A1 (it) * | 2003-10-06 | 2005-04-07 | Milano Politecnico | Apparato per la generazione di una cartografia cronografica. |
| US20060010028A1 (en) * | 2003-11-14 | 2006-01-12 | Herb Sorensen | Video shopper tracking system and method |
| RU2277722C2 (ru) * | 2004-05-06 | 2006-06-10 | Военно-технический университет при Федеральной службе специального строительства Российской Федерации | Система цифровой картографической основы дорожной сети |
| US7596542B1 (en) * | 2004-05-25 | 2009-09-29 | Allstate Insurance Company | Systems and methods for creating geographic connection matrices |
| US20060122767A1 (en) * | 2004-12-07 | 2006-06-08 | Athalye Ravi G | Map based estimations, and information search |
| US7583273B2 (en) | 2005-03-02 | 2009-09-01 | Avenza Systems, Inc. | Method and system for transforming spatial data |
| FR2888023B1 (fr) * | 2005-06-29 | 2008-02-29 | Webraska Mobile Technologies S | Procede de projection cartographique du globe terrestre et carte etablie selon le procede |
| FR2888645B1 (fr) * | 2005-07-12 | 2007-10-12 | Ixsea Soc Par Actions Simplifi | Procede d'acquisition et de traitement de donnees magnetometriques par des mises a jour locales et en temps reel |
| JP2007133489A (ja) * | 2005-11-08 | 2007-05-31 | Sony Corp | 仮想空間画像表示方法、装置、仮想空間画像表示プログラム及び記録媒体 |
| US8089390B2 (en) * | 2006-05-16 | 2012-01-03 | Underground Imaging Technologies, Inc. | Sensor cart positioning system and method |
| US9646415B2 (en) * | 2006-05-16 | 2017-05-09 | Underground Imaging Technologies, Inc. | System and method for visualizing multiple-sensor subsurface imaging data |
| JP5164341B2 (ja) * | 2006-05-26 | 2013-03-21 | 古野電気株式会社 | 投影法および図形表示装置 |
| US7924294B2 (en) * | 2006-12-27 | 2011-04-12 | The Mathworks, Inc. | Polygon trimming using a modified azimuthal map projection |
| CA2587198A1 (en) * | 2007-05-02 | 2008-11-02 | Spartan Bioscience Inc. | Method for increasing the speed of nucleic acid amplification reactions |
| US7990394B2 (en) | 2007-05-25 | 2011-08-02 | Google Inc. | Viewing and navigating within panoramic images, and applications thereof |
| WO2008147561A2 (en) * | 2007-05-25 | 2008-12-04 | Google Inc. | Rendering, viewing and annotating panoramic images, and applications thereof |
| US8660895B1 (en) * | 2007-06-14 | 2014-02-25 | Videomining Corporation | Method and system for rating of out-of-home digital media network based on automatic measurement |
| JPWO2009104218A1 (ja) * | 2008-02-18 | 2011-06-16 | 三菱電機株式会社 | 地図表示装置 |
| EP2286370A4 (de) * | 2008-05-02 | 2014-12-10 | Eyeic Inc | System zur verwendung von bildausrichtung für die abbildung von objekten bei ungleichen bildern |
| US9235334B2 (en) * | 2008-05-09 | 2016-01-12 | Genesis Industries, Llc | Managing landbases and machine operations performed thereon |
| US8825387B2 (en) * | 2008-07-25 | 2014-09-02 | Navteq B.V. | Positioning open area maps |
| JP2010107861A (ja) * | 2008-10-31 | 2010-05-13 | Tokuda Industry Ltd | 地形模型の受注システム |
| JP4862887B2 (ja) * | 2008-12-25 | 2012-01-25 | ソニー株式会社 | 地図データ表示制御装置、地図データ表示制御方法およびプログラム |
| US8774468B2 (en) * | 2009-09-08 | 2014-07-08 | Schlumberger Technology Corporation | Dynamic shape approximation |
| GB201117901D0 (en) * | 2011-10-18 | 2011-11-30 | Tomtom Int Bv | Map code: a public location encoding standard |
| CN104335065B (zh) | 2012-03-12 | 2017-08-25 | 弗米尔公司 | 偏移频率零差探地雷达 |
| US9739133B2 (en) | 2013-03-15 | 2017-08-22 | Vermeer Corporation | Imaging underground objects using spatial sampling customization |
| US8917329B1 (en) | 2013-08-22 | 2014-12-23 | Gopro, Inc. | Conversion between aspect ratios in camera |
| US10217283B2 (en) | 2015-12-17 | 2019-02-26 | Google Llc | Navigation through multidimensional images spaces |
| CN105608984A (zh) * | 2016-02-29 | 2016-05-25 | 西安科技大学 | 一种高斯克吕格地图投影演示装置及演示方法 |
| CN105632325A (zh) * | 2016-03-14 | 2016-06-01 | 西安科技大学 | 一种墨卡托地图投影演示装置及演示方法 |
| CN107808012B (zh) * | 2017-11-20 | 2019-09-10 | 武汉大学 | 一种基于共位的地理信息叠加方法 |
| JP7008531B2 (ja) * | 2018-02-20 | 2022-01-25 | 日本放送協会 | 画像幾何変換装置、画像幾何逆変換装置及びプログラム |
| US12339124B2 (en) * | 2019-07-26 | 2025-06-24 | Cube Earth Co., Ltd. | Position space identification method, position space identifier imparting device, and computer program |
| US11287269B2 (en) * | 2019-12-10 | 2022-03-29 | Pony Ai Inc. | Map coordinate distortion compensation |
Family Cites Families (7)
| Publication number | Priority date | Publication date | Assignee | Title |
|---|---|---|---|---|
| US4283763A (en) * | 1979-09-13 | 1981-08-11 | Bylinsky Lev V | System for graphic representation of vessel's position on Mercator map |
| CA1295737C (en) * | 1986-03-14 | 1992-02-11 | Akira Ichikawa | Apparatus for displaying travel path |
| JPS6314097A (ja) * | 1986-07-01 | 1988-01-21 | 防衛庁技術研究本部長 | 飛しよう体発射装置 |
| US4873513A (en) * | 1987-08-26 | 1989-10-10 | Geodisplay Technology Limited Partnership | Automated map display system |
| US4972319A (en) * | 1987-09-25 | 1990-11-20 | Delorme David M | Electronic global map generating system |
| US4899293A (en) * | 1988-10-24 | 1990-02-06 | Honeywell Inc. | Method of storage and retrieval of digital map data based upon a tessellated geoid system |
| JP2610998B2 (ja) * | 1989-06-07 | 1997-05-14 | アルパイン 株式会社 | 自動車ナビゲーションシステムの描画方法 |
-
1991
- 1991-04-19 JP JP3088109A patent/JP2900632B2/ja not_active Expired - Lifetime
-
1992
- 1992-04-16 EP EP92303490A patent/EP0509839B1/de not_active Expired - Lifetime
-
1995
- 1995-02-28 US US08/396,328 patent/US5544052A/en not_active Expired - Lifetime
Non-Patent Citations (4)
| Title |
|---|
| "A Geographic Information System REALS for Personal Computers",S. Tanigushi et al, vol. 3, no. 5, 1990, pages 138-146 * |
| "ARC/INFO", Imai, PIXEL, no. 54, 1987, pages 65-70 * |
| "Edition and Projection for Map", K.Kosaka, published by SANKAIDO, 1982; * |
| "Summary of Country Numeral Information" Japanese Construction Ministry, Geographic map department, map supervision division, 1985 * |
Cited By (1)
| Publication number | Priority date | Publication date | Assignee | Title |
|---|---|---|---|---|
| US7881562B2 (en) | 2006-03-31 | 2011-02-01 | Research In Motion Limited | Real-time spherical correction of map data |
Also Published As
| Publication number | Publication date |
|---|---|
| US5544052A (en) | 1996-08-06 |
| EP0509839A3 (en) | 1995-01-11 |
| EP0509839A2 (de) | 1992-10-21 |
| JP2900632B2 (ja) | 1999-06-02 |
| JPH04319984A (ja) | 1992-11-10 |
Similar Documents
| Publication | Publication Date | Title |
|---|---|---|
| EP0509839B1 (de) | Digitales karthographisches System zur Verarbeitung von geographischen Informationen | |
| DE60003725T2 (de) | Geographische karten auf einem persönlichen digitalen assistenten (pda) und server | |
| EP0905655B1 (de) | Karteneditierungsgerät, das durch benutzerwählbare automatische Editierungsfunktionen eine einfache Editierung ermöglicht | |
| US20010012409A1 (en) | Method of displaying magnified and reduced areas and apparatus thereof | |
| Haber et al. | Discrete transfinite mappings for the description and meshing of three‐dimensional surfaces using interactive computer graphics | |
| GB2300338A (en) | Analytical data display method and apparatus | |
| EP1099148A1 (de) | Beweglicher planentwerfer | |
| US7327309B2 (en) | Radar scan converter and method for transforming | |
| EP0557924B1 (de) | Verfahren und Vorrichtung zum Suchen von Liniendaten in einem graphischen Datenbanksystem | |
| US7583273B2 (en) | Method and system for transforming spatial data | |
| JPH07287727A (ja) | 部分領域のズーミング解析操作方法 | |
| JPH04127379A (ja) | 解析対象物の要素分割方法およびその装置 | |
| JP7506107B2 (ja) | 電線共同溝設計支援装置、電線共同溝設計支援システム、および電線共同溝設計支援プログラム | |
| JP2534750B2 (ja) | ダイヤグラム表示装置 | |
| Winston | Programs for simplifying the analysis of geographic information in US Geological Survey ground-water models | |
| Rowley et al. | Paper 6. Reinforced concrete detailing systems for civil engineering | |
| JPH04205180A (ja) | 図面管理装置 | |
| JPH01134673A (ja) | ブロック図のデータ表示処理装置 | |
| Bramblett | A computer program for the calculation and display of phase fraction charts of ternary systems | |
| Tóth | Towards an optimal texture reconstruction | |
| Groop | Desktop Information Display System (DIDS) | |
| JPH03240881A (ja) | 面の表示装置 | |
| JPH04141780A (ja) | 図形情報管理方法およびシステム | |
| JP2864769B2 (ja) | 図形データ変換装置 | |
| JPS61199171A (ja) | 図面情報の管理方法 |
Legal Events
| Date | Code | Title | Description |
|---|---|---|---|
| PUAI | Public reference made under article 153(3) epc to a published international application that has entered the european phase |
Free format text: ORIGINAL CODE: 0009012 |
|
| 17P | Request for examination filed |
Effective date: 19920601 |
|
| AK | Designated contracting states |
Kind code of ref document: A2 Designated state(s): FR GB |
|
| PUAL | Search report despatched |
Free format text: ORIGINAL CODE: 0009013 |
|
| AK | Designated contracting states |
Kind code of ref document: A3 Designated state(s): FR GB |
|
| 17Q | First examination report despatched |
Effective date: 19960731 |
|
| GRAG | Despatch of communication of intention to grant |
Free format text: ORIGINAL CODE: EPIDOS AGRA |
|
| GRAG | Despatch of communication of intention to grant |
Free format text: ORIGINAL CODE: EPIDOS AGRA |
|
| GRAH | Despatch of communication of intention to grant a patent |
Free format text: ORIGINAL CODE: EPIDOS IGRA |
|
| GRAH | Despatch of communication of intention to grant a patent |
Free format text: ORIGINAL CODE: EPIDOS IGRA |
|
| GRAA | (expected) grant |
Free format text: ORIGINAL CODE: 0009210 |
|
| AK | Designated contracting states |
Kind code of ref document: B1 Designated state(s): FR GB |
|
| ET | Fr: translation filed | ||
| PLBE | No opposition filed within time limit |
Free format text: ORIGINAL CODE: 0009261 |
|
| STAA | Information on the status of an ep patent application or granted ep patent |
Free format text: STATUS: NO OPPOSITION FILED WITHIN TIME LIMIT |
|
| 26N | No opposition filed | ||
| REG | Reference to a national code |
Ref country code: GB Ref legal event code: IF02 |
|
| PGFP | Annual fee paid to national office [announced via postgrant information from national office to epo] |
Ref country code: FR Payment date: 20110426 Year of fee payment: 20 |
|
| PGFP | Annual fee paid to national office [announced via postgrant information from national office to epo] |
Ref country code: GB Payment date: 20110413 Year of fee payment: 20 |
|
| REG | Reference to a national code |
Ref country code: GB Ref legal event code: PE20 Expiry date: 20120415 |
|
| PG25 | Lapsed in a contracting state [announced via postgrant information from national office to epo] |
Ref country code: GB Free format text: LAPSE BECAUSE OF EXPIRATION OF PROTECTION Effective date: 20120415 |