The present invention generally relates to a
method for displaying graphic data by a designated map
projection in a digital cartographic system for
geographical information processing. More specifically,
the present invention is directed to both of a system
and a method for varying the displaying map projection
by transforming a coordinate value of the graphic data
into a desirable map projection.
A method for representing shapes, and ups and
downs of a ground surface of the earth is so-called as a
map projection (map projection transformations). As the
necessary conditions of the map projection, there are
such elements: 1 ○ an actual distance being analogously
represented on a map (equidistance); 2 ○ an actual area
being analogously displayed on a map (equivalence); and
3 ○ an angle at a ground surface being correctly expressed
on a map (equiangularity). Since a map drawn on
paper is such a fact that a sphere is projected onto a
plane, all of the above-described conditions cannot be
simultaneously satisfied. To satisfy any of these
conditions, a map is represented by a proper map
projection, depending upon its usage.
The various sorts of map projections are
described in detail in, for instance, Japanese
publication entitled "Edition and Projection for Map"
written by K. Kosaka, published by SANKAIDO publisher in
1982. In this publication, the calculations for
projecting the coordinate systems expressed by longitude
and latitude on a spherical surface onto the coordinate
systems on a plane, are classified in accordance with
shapes of projection surfaces and conditions of projection.
There are employed a plane, a cylinder and a
conic as the projection planes, whereas the above-described
three conditions are handled as the projection
conditions.
Conventionally, the coordinate transformation
in case that map data are processed in the computer, is
handled in view of inputting of a map and calculations
of a distance and an area. When a map is inputted, it
is necessary to convert a coordinate value of map data
which has been written on paper by way of a different
map projection, into a common coordinate system in order
to totally manage the data. To manage the map data
under better matching conditions, it is preferable to
employ an expression of a coordinate system based on the
longitude and latitude. If the longitude and latitude
are utilized, the map data can be continuously managed
over an entire region of the earth. In transactions of
Japanese System Control Information Institute, "A
Geographic Information System REALS for Personal
Computer", volume 3, No. 5, pages 138-146, 1990 by
Taniguchi et al., and "Summary of Country Numeral
Information" issued by Japanese Construction Ministry,
Geographic map department, map supervision division in
1985, data management based on the longitude and
latitude has been performed. In the former publication,
there is described such a method for transforming the
graphic data into the coordinate system by the longitude
and latitude, which have been inputted by the Universal
Transverse Mercator coordinate system (UTM coordinate
system) employed in a map with a reduction ratio of
1/25000. Since the UTM map projection corresponds to an
equiangular projection method, and furthermore a
distance can be measured under practically acceptable
precision in the map with the medium reduction ratio,
there are merits that both the angles and distances can
be directly calculated from the coordinate value. As a
consequence, the UTM coordinate system has been employed
to calculate the distances and areas in the latter
publication, and also there is described such a method
for transforming the longitude/latitude of the map data
into the UTM coordinate system so as to perform this
calculation.
Among others, there is another publication
"Geographic Information System with Superior Analyzing
Function: ARC/INFO" written by Imai, PIXEL, No. 54,
pages 65 to 70, 1987 as a digital cartographic system
handling a coordinate transformation. This system owns
the coordinate transformation function as the edition
function during the input/updating operations of the
graphic data, and then can execute several different
map-projection transformations with respect to the map
data.
In case when map data are processed in
computers, another map-projection transformation is
required in view of output operations other than the
above-described input operation. It is difficult to
directly judge both azimuth and a distance from the map
data which have been totally managed based on the
longitude and latitude. While the digital cartographic
system is utilized as an information representing means
to analyze a region, a proper information representation
suitable for a desirable analyzing purpose is required.
To achieve an intuitively understandable analysis
support, it is required to display map data with
satisfying correctness in azimuth as well as correctness
in a distance. There are the azimuth map projection and
the UTM map projection, functioning as a method for
representing either azimuth, or a distance. In
accordance with the azimuth map projection used for a
plane projection, azimuth at a center point of
projection is equal to azimuth at a ground surface, and
a line segment for connecting this center line and an
arbitrary point, becomes a minimum path between two
points. In accordance with the UTM map projection used
for the cylindrical-plane projection, an angle between a
ground surface and a corresponding map becomes equal,
and also a distance on the map can be expressed as being
substantially equal to an actual distance under
practically acceptable map precision with a medium
reduction ratio. However, it is only possible to
express continuous coordinate system with having the
interval of longitude within a range of 6 degrees in the
UTM map projection. As to an area, it is possible to
equally express the areas by way of the conical map
projection and the cylindrical map projection.
To display map data in various sorts of map
projections in conformity to objects, coordinate
transforming operations should be carried out at a high
speed and also at high precision. Further, when a
coordinate system is converted into such a coordinate
system as in the UTM coordinate system where discontinuities
continuities are present every 6 degrees, the
should be avoided by a proper way.
First, there is a problem in the coordinate
transforming speed. Generally speaking, the coordinate
transforming operation for the map data must be carried
out with respect to a large quantity of graphic data.
In the publication "Edition and Projection of Map", the
projection formulae from the longitude and latitude to
the coordinate systems of the various map projections
are described. Since each of these projection formulae
involves trigonometric functions and a logarithm, and
therefore requires a large amount of calculating steps,
there is a problem that a lengthy calculation time is
necessarily required. In particular, since the projection
formula to the UTM coordinate system is expressed
by a series expanding formula, a back projection is not
easily performed, but it is not suitable to calculate a
large amount of calculation elements. It should be
noted that although the coordinate calculating method
with employment of the transforming table between the
longitude/latitude and the UTM coordinate system has
been described in the above-described publication
"Edition and Projection of Map", since this transforming
table has a high volume in unit of 1 minute and also the
transforming formula is a biquadratic polynomial, a
total amount of this calculation is not so reduced. In
the publication "Summary of Country Numeral Information",
in order to simplify the transformation from the
longitude/latitude into the UTM coordinate system, the
graphic data are subdivided into segments and one
representative point is set in the segment, whereby the
transforming formula is analogous to a local formula.
Although the calculation of this method may be
simplified, there is another problem that shifts happen
to occur in the graphic data on the boundary line over
the adjoining segments, resulting in an occurrence of
discontinuities. Furthermore, the coordinate transformation
effected in the ARC/INFO system is intended to
perform the editing operation during the input/updating
operations of the data, but to convert/display the map
projections.
Subsequently, there is a problem in the discontinuities
of the graphic data. The UTM map projection
is effective to express an angle and a distance.
To suppress distortion in the distance, the entire
region is subdivided into narrow strips called zones at
6 degrees in this UTM coordinate system. Therefore, as
represented in Fig. 8, there are great shifts at a
boundary line of the adjoining zones in accordance with
the higher latitude, so that the map data are
represented with having the discontinuities on this
boundary line. To represent the graphic data extending
these zones in a continuous form, there is another great
problem that such a distortion becomes large in
accordance with the higher latitude. It should be noted
that the coordinate transformations as defined in the
above-described publications "Summary of Country Numeral
Information", and "A Geographic Information System REALS
for Personal Computer", are intended to effectively
manage the data and also correct the analyzing amount,
but not to represent various information to users. As a
consequence, these coordinate transformation methods
still contain the above-described discontinuities in the
graphic representations.
In addition thereto, it is necessary to
readily produce reference lines such as longitude,
latitude and a curve of equal bearing during representation,
which own such a function to assist the analysis.
Features of the represented map data may be easily
grasped by superimposing these reference lines thereon.
US 4,899,293 describes a method of storage and
retrieval of digital map data, which involves the
transformation of the digital data between map
projections, after dividing the data into regions.
The present invention provides in a first aspect a
digital cartographic system for processing geographic
information, comprising:
wherein:
the system further comprises:
- input means for designating a second map projection;
and
- means for transforming said selected data into
further data according to the second map projection,
the transforming means being arranged to divide said
selected data into sections, to back- convert said
selected data of each of said sections into longitude and
latitude values, transforming the longitudinal and
latitudinal values into converted values in accordance
with said second map projection by means of a
transformation table, and interpolating linearly
between said converted values, thereby to derive said
further data;
- the displaying means being arranged to display said
further data according to the second map projection.
A second aspect of the present invention provides a
method of displaying a digital map, comprising:
wherein:
the method further comprises:
- designating a second map projection on input means;
and
- transforming said selected data into further data
according to the second map projection, said
transforming including dividing said selected data into
sections, back-converting said selected data of each of
said sections into longitude and latitude values,
transforming the longitudinal and latitudinal values into
converted values in accordance with said second map
projection by means of a transformation table, and
interpolating linearly between said converted values,
thereby to derive said further data; and
- displaying said further data according to the second
map projection.
Embodiments of the present invention may provide a
digital cartographic system for solving the above-described
problems such as the continuity of the graphic
representation and the simplification of the coordinate
transformation calculations, and also a method for
transforming the coordinate system and for displaying the
converted coordinate system, and furthermore, to a method
for displaying a reference line having a function to
assist an analysis.
To simplify calculations for transforming a
coordinate system irrelevant to a map projection to be
converted, a transformation table is employed which
corresponds to a means for transforming the corresponding
coordinate values, and thus the coordinate transformation
is carried out by the linear interpolation with reference
to this transformation table in the present invention.
In the transformation table, coordinate valves in the
various sorts of map projections are related to the
(equivalent) longitude and latitude and then the
transformation is carried out via the longitude and
latitude. As a result, it is possible to execute the
coordinate transformation among arbitrary map projections
contained in the table group.
Concretely, first, the map data is represented
by the coordinate system based upon the longitude and
latitude in order to maintain matching characteristics,
and the map data is managed in unit of a sufficiently
small section in order that the coordinate transformation
by way of the linear interpolation can be achieved.
As the segment, a region surrounded by longitude and
latitude separated at a constant interval is utilized.
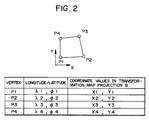
In addition thereto, both longitude/latitude of 4
vertexes in a segment in unit of respective segments,
and also the coordinate values at each of the corresponding
map projections are combined as a table shown
in Fig. 2. If the relationship between the longitude/latitude
and the coordinate values at four vertexes in
unit of subdivision management can be found out, then a
coordinate value at an arbitrary point within a segment
unit can be calculated from a proportional distribution
between the vertexes. Also, the reference lines such as
the longitude, the latitude and the curve of equal
bearing, which can assist an analysis, can be calculated
from the proportional distribution between the vertexes.
The transformation is carried out with respect to the
graphic data stored in the database. If the coordinate
transformation is performed between one map projection A
and the other map projection B, the graphic data stored
in the database corresponding to the representation by
the map projection A is referred, whereby the coordinate
system of the longitude/latitude thereof is converted
into the coordinate system for the map projection B. It
can be prevented deterioration in positional precision
caused by repeatedly perform the coordinate
transformation from the coordinate values of the
longitude/latitude stored in the database. It should be
noted that with respect to a coordinate system for such
a map projection that coordinate values of the
respective points are different from each other in
response to designation, such as an azimuth map
projection requiring a base point (namely, a center
point of projection) and also a conical map projection
depending upon a region designated by a user, since a
transformation table corresponding to the longitude and
latitude cannot be previously expressed by numeral
values, a table forming routine to produce a table in
response to the coordinate value of the base point is
prepared, and then the transformation table is expressed
by the numeral values every time the base point is
given.
With regard to the UTM coordinate system, a
corresponding table between longitude/latitude and UTM
coordinates for a single zone is prepared. The UTM
coordinate system is periodic. The same coordinate
values are repeatedly utilized for each zone shifted
by 6 degrees along the longitudinal direction.
Therefore, an overall region of earth can be expressed
by way of a remainder calculation for the longitude. As
shown in Fig. 9, when a region extending over two adjoining
zones is handled, the discontinuities are avoided by
properly shifting the zone by 6 degrees.
Since the map pattern is represented in the
converted mode in conformity to correctness in a
distance and correctness in azimuth in accordance with
an object by a user, an intuitive idea can be supported.
Since the linear interpolation is utilized to convert
the coordinate values of the map pattern, both of the
longitude/latitude and the coordinate values of the
respective map projections can be mutually and easily
converted therebetween. The transformation operations
are independently carried out in unit of section by
utilizing the transformation table corresponding to the
transforming means, so that the calculation processes
can be performed in a parallel distribution mode. To
execute the coordinate transformation by the linear
interpolation for the vertex data of the section, the
continuity of the graphic data among the adjoining
sections can be maintained. Even when the linear
approximation is carried out by subdividing the
calculation unit into the small regions, the coordinate
values can be calculated at high precision. Furthermore,
the discontinuities occurring between the
adjoining zones can be avoided by shifting the zone with
respect to the UTM coordinate system corresponding to
the localized coordinate system.
Fig. 1 schematically shows a processing
operation of a map projection transformation embodying
the present invention; Fig. 2 schematically represents a relationship
among coordinate values of vertexes in a region; Fig. 3 is a schematic block diagram for
representing an example of a construction of a computer
system to embody the present invention; Fig. 4 schematically illustrates a construction
of a program employed in the computer shown in Fig.
3; Fig. 5 is a flow chart for showing an overall
process executed in a computer embodying the
present invention; Fig. 6 schematically shows a coordinate-transformation
management table; Fig. 7 schematically represents both of a map-projection
management table and a coordinate transformation
table; Fig. 8 is a schematic diagram for showing an
UTM coordinate system; Fig. 9 schematically indicates a method for
preventing discontinuities of the UTM coordinate system; Fig. 10 schematically shows a relationship
between a coordinate transforming region and a data
file; Fig. 11 is a flow chart (PAD diagram) for
explaining a process to produce a reference line; Figs. 12A and 12B are schematic diagrams for
showing the process for generating the reference line; Fig. 13 is an illustration for showing a
reference-line management table; Fig. 14 is a flow chart (PAD diagram) for
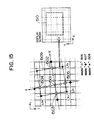
explaining a process for evaluating precision; Fig. 15 is a schematic diagram for explaining
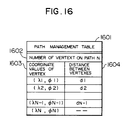
a process to evaluate precision; and, Fig. 16 is an illustration for showing a path
management table.
Referring now to Fig. 1, one
embodiment according to the present invention will be
summarized.
In Fig. 1, map data has been subdivided and
managed in accordance with a coordinate system based
upon longitude and latitude, and then stored into a map
graphic database 105. It should be noted in this
preferred embodiment that transformation/display
processes are entirely performed via the longitude and
latitude coordinate system. In other words, coordinate
data inputted by a user are interpreted as longitude/latitude
coordinate data, and coordinate transformations
are executed with respect to the map figure data stored
in the map figure database 105. As a result, it is
possible to prevent accumulation of transformation
errors of figure data which have been caused during the
preceding coordinate transformations.
The transformation process is carried out by a
linear interpolation, so that the transformation
may be expressed by way of a matrix of 3X3 constants,
and then a highspeed process operation by means of a
hardware may be achieved. Since the transformations may
be independently carried out an every subdivision management
unit to be subject, it is easy to execute a
parallel distributed processing. It should be noted
that the transformation display process is performed as
follows. 1 ○ The transformation conditions are
determined for every subdivision management unit, whereby
the transformations suitable for the sections are
performed. 2 ○ Otherwise, the transformation condition
is determined from a portion to which a user pays his
specific attention (will be referred to "a region of
interest"), so that the uniform transformation is
performed over the entire region to be processed. In
accordance with the flexible process 1 ○ since the
transformation process is performed in such a manner
that the coordinate transformation formula is set for every
section unit, the transformation may be executed in
uniform precision over the entire region. In accordance
with the uniform process, since the transformation
formula is set from the region of interest and then the
resultant transformation formulae are applied to the
overall region, only one transformation-condition
setting operation is required, whereby calculation
process workloads for setting the transformation
conditions may be reduced.
Both a map projection B to be converted into and a
region to be converted are entered by a user. When a
base point of transformation is required in this map
projection B to be converted such as an azimuth map
projection, this base point is also inputted by the
user. Both the region and the base point which have
been entered by the user are stored in a table for
managing the coordinate transformation. In Fig. 1, a
region 101 indicates a transformation region (by a
representation map projection A) designated by the user.
In case that the uniform process is performed, a region
of interest is furthermore designated. A region 102
surrounded by points P1 to P4 within the region 101
corresponds to the region of interest. Although the
region of interest will be described later, both a
coefficient of a coordinate transformation formula and
precision in the transformation are determined from this
region of interest.
In accordance with the various conditions
designated by the user, the map projection is converted
by the system. In case that the region has been entered
by the user in the coordinate system of the map projection
A, both the coordinates of the vertexes of the
region and the coordinate of the base point are back-converted
from the map projection A into the longitude
and latitude with employment of the transformation
information utilized when the map is displayed under the
map projection A. Subsequently, as represented in Fig.
2, the coordinate transformation formula is determined
based upon the relationship between the longitude/latitude
coordinate (λ, ) of the vertex in the
management unit and the coordinate (X, Y) by the map
pattern B thereof with respect to each of the
subdivision management units contained in the region to
be converted. Then, the graphic data on the region to
be converted are converted and displayed, whereby a
transformation result 103 is obtained, while
sequentially retrieving the database 105. The setting
and transforming process of the transformation
conditions is carried out every single section in the
unit of subdivision management. It should be noted that
a region 104 within the display result 103 denotes a
display range of the region 101 to be converted by the
map projection B. Furthermore, after the transformation
process has been completed, superposition display/overlapping
display of a reference line is performed as an
auxiliary operation of an analysis in response to a
user's demand. It should be understood that a reference
line denotes a line such as a longitude, a latitude, a
grid line of an UTM coordinate system, and an isometric
line around a certain point. Correctness in the azimuth
of the display result, correctness in the distance, and
graphic distortion when the uniform transformation is
performed can be intuitively represented to users by
displaying such a reference line in the superposition/overlapping
display mode.
Since the transformation processes are independently
carried out in unit of section, these
transformation processes can be executed in a parallel
distribution manner. In case that a parallel computer
having a hyper cube structure is employed, if each of
the sections of the management units is allocated to
each of the calculation processors, the overall process
operation can be accomplished at a high speed. As a
result, a large quantity of graphic data can be readily
handled so that the problems can be easily solved.
In case of such an environment which cannot be
processed in the parallel distribution processing mode,
the process operations for reading and transforming the
graphic data need be repeated by the times equal to the
quantity of sections in the suitable transformation in
the unit of management. To avoid such a cumbersome
repetitive process, the uniform process is carried out
based upon the region of interest. It should be noted
that since the coordinate transformation is uniformly
carried out over the entire region, the graphic data
outside the region of interest does not always succeed
to a nature of the map pattern B. To compensate for
this problem, both the representation of the reference
line and the evaluation of positional precision in the
graphic data are performed in accordance with the user's
demand after the presentation by the map projection B
has been accomplished. The precision evaluation is
performed by comparing with each other amounts of shifts
among the uniformly converted data and the data
converted every subdivision unit. The permissible range
in the shift amounts (precision in transformation)
depends upon worse precision in accordance with both of
a size of a region and precision in graphic data which
have been inputted by a user.
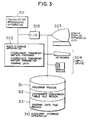
In Fig. 3, there is shown a construction of a
computer system for carrying out the above-described
processing operations. A calculation processing
apparatus 301 executes 1 ○ a coordinate transformation
calculation, taking account of a transformation map
projection and a map projection transformation region
which have been entered via an input apparatus 304
corresponding to an input device such as a keyboard and
a mouse; 2 ○ display data transfer to a graphic display
apparatus (GT) 303; and also 3 ○ controls of overall
process operation. In a main storage apparatus 302,
there are stored a program of coordinate transformation/display,
data on a coordinate transformation table, and
figure data. An auxiliary storage apparatus 310
includes a program region 311, a region 312 for a
coordinate transformation table file, and a region 313
for a coordinate transformation table file, and a region
313 for a graphic data file. Each of storage contents
is read out from them into the main storage apparatus
302, if required. Reference numeral 305 indicates an
I/O interface circuit.
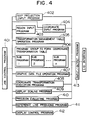
In Fig. 4, there is shown a constructive
example of the programs which have been prepared in the
program storage region 311 within the auxiliary storage
apparatus 310. Reference numeral 401 denotes a job
control program to control executions of the respective
process programs; reference numeral 402 indicates a map
projection input program for causing a user to select
the map projection B to be converted; reference numeral
403 represents a region input program for causing a user
to designate a region to be converted; and also reference
numeral 404 indicates a coordinate input program
which is used to input a point and a base point when a
region is designated. Furthermore, reference numeral
405 represents a program for operating a graphic
transformation management table, by which a management
table for region information entered by a user is
operated. Reference numeral 406 is a program for
forming a coordinate transformation table, which is used
for such a map projection that the coordinate transformation
table cannot be previously expressed by
numeral data. As the map projection capable of not
expressing the table as the numeral data, there are, for
instance, an azimuth map projection requiring a base
point, and also a conical map projection acceptable for
a region designated by a user. This table production
program 406 is arranged by subprograms used for the
respective map projections. Reference numeral 407
indicates a graphic-data file operation program for
operating a graphic data file; reference numeral 408
denotes a coordinate transformation execution program by
way of the linear interpolation, reference numeral 409
represents a display scaling program for executing a
scaling operation when transformation graphic data is
displayed; reference numeral 410 is a precision
evaluating program for transformation; reference numeral
411 indicates a reference line producing program used
for superposition/overlay displaying the reference line;
reference numeral 412 is a display control program for
controlling reswitching of displays among the map
projections A and B; and reference numeral 413 indicates
an input/output program used to read/write the above-described
programs from/into the input apparatus 304 and
the auxiliary storage apparatus 310.
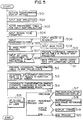
Fig. 5 is a flow chart (PAD diagram) for
representing one example of an overall process executed
in the computer. A process flow will now be described
in accordance with this flow chart.
At a step 501, a map display method according
to the present invention is initiated by a user. As a
result, the job control program 401 is read out from the
program region 311 and then is written into the main
storage apparatus 302 by the calculation apparatus 301.
Since the process operations are similar when the
respective programs are initiated, the explanations
thereof are omitted. Upon initiation of the job control
program 401, the present display map projection and the
data on the display range are read out from the system
table into which they have been previously registered,
and then prepared in the main storage apparatus 302.
Also, the transformation management table operation
program 405 is initiated, and the Present display map
projection data which have been registered in the
coordinate transformation management table. This
display map projection data is compared with the
previously prepared data. If the display map projection
data is different from the previously prepared data, the
display map projection data is rewritten and this data
is newly registered as the present display map
projection data.
At a step 502, the job control program
initiates the map projection input program 402 so as to
cause a user to input the map projection to be converted.
As one example, there is such a method that the
map projections to be converted are represented in a
menu form and a user will select a proper map
projection.
At a step 503, the map projection management
table selected by the user is read. The transformation
management table operating program 405 reads the map
projection management table from the coordinate
transformation table file region 312 and writes this
management table into the main storage apparatus 302.
This map projection management table is utilized to
confirm whether or not the map projection to be
converted requires the base point, and whether or not
the coordinate transformation table must be formed, and
also to refer to the transformation table.
To execute steps 504 to 511 (will be discussed
later), the job control program 401 initiates the region
input program 403 and the coordinate input program 404.
At the step 504, the region input program 403
causes a user to enter a region to be converted. This
is done in such a way that a coordinate of a vertex may
be entered while requesting the user to input the
numeral data from the keyboard, or a region may be
designated on the display screen by utilizing a mouse.
In response to an instruction issued by a
user, coordinate data may be inputted in a form of a
coordinate value and also values of longitude and
latitude by the present display map projection.
At a step 505, the management program confirms
whether the method for performing this transformation
corresponds to the suitable process or the uniform
process. In case of the uniform process, a region of
interest similar to that of the step 504 is inputted by
the user at a step 506.
At the step 507, in accordance with the map
projection management table which has been read at the
step 503, confirmation is made whether or not a base
point should be inputted. If necessary, a point input
operation similar to that of the step 504 is carried out
by the user at a step 508.
With the above-described input operations, the
map projection transformation has been prepared. To
prepare this map projection transformation, the job
control program initiates the coordinate transformation
execution program 408.
Processing steps from 509 to 511 correspond to
such a process that the coordinate values inputted by
the user are equal to those used in the present display
map projection A. First, a judgement is made at the
step 509 whether the user's input operation is caused by
the map projection A, or the longitude and latitude are
directly designated by the user. In case of the user's
input operation caused by the map projection A, the
process defined at the step 510 is executed. At this
step 510, the coordinate transformation table for the
map projection A and the longitude/latitude is prepared.
Next, at the step 511, the back transformation from the
map pattern A to the longitude/latitude is carried out.
With respect to the respective vertexes of the region to
be converted and the region of interest which have been
inputted by the user, a back-transformation formula is
produced based upon the coordinate relationship among
the subdivision management units containing the vertexes
thereof, and then the map pattern A is converted into
the longitude and latitude coordinate system. Also, the
back-transformation from the longitude/latitude
coordinate system to the map pattern A is executed under
control of the coordinate transformation execution
program 408.
At a step 512, a coordinate transformation
management data table is formed which is used in the map
pattern B to be converted. Although the contents of
this data table will be described later, the tables
indicative of the information on the base point and the
coordinate relationship as shown in Fig. 2 are prepared
for the region to be converted and the region of
interest.
In such a case that the coordinate transformation
table has not yet been expressed as the numeral
values by way of the map projection to be converted such
as the azimuth map projection and the conical map
projection, a subprogram corresponding to the sub-programs
included in the coordinate transformation table
forming program 406 is first initiated. A coordinate
system in the map projection B is calculated under
control of the program 406 based upon the longitude/latitude
coordinate values with respect to the
respective vertexes of the region to be converted and
the region of interest.
When the coordinate transformation table has
been prepared, one vertex of each of these region to be
converted and region of interest is picked up. It is
assumed that this picked up vertex is called as a vertex
"a". From the longitude/latitude coordinate system of
this vertex "a", the management unit containing the
vertex "a" on the graphic data file region 313 is
determined. Subsequently, the transformation data about
the respective vertexes of this management unit are read
out, and then a corresponding table between the
longitude/latitude and the coordinate system of the map
projection B is produced. The coordinate values at the
vertex "a" by the map projection B are linear-interpolated
under control of the coordinate transformation
execution program 408, and the linear-interpolated
coordinate values are registered together with the
longitude/latitude coordinate values thereof into the
coordinate transformation management table. The above-described
process operation will be executed with regard
to all of the vertexes of the region to be converted and
of the region of interest.
At a step 513, an enlargement ratio (reduction
ratio) for display purposes is determined. The enlargement
ratio (reduction ratio) is determined in such a
manner that the transforming region converted into the
map projection B can be stored within the display area
of the screen.
First, a circumscribed rectangle is obtained
with respect to the transforming region expressed by the
coordinate system on the map projection B, and thereafter
the enlargement (reduction) ratio is determined in
such a manner that the longer side of the rectangle can
be stored within the display region. This ratio will be
referred by the display scaling program 409.
Next, the map projection and representation
with regard to the graphic data of the transforming
region are carried out. The job control program 401
initiates the graphic data file operation program 407
and the display scaling program 409.
At a step 514, both of the transformation and
representation for the graphic data are carried out.
The graphic data about the subdivision management unit
group containing the region to be converted are read out
under control of the graphic data file operation program
407, and are converted under control of the coordinate
transformation execution program 408, and thereafter are
enlarged/reduced under control of the display scaling
program 409, whereby the resultant graphic data are
transferred to the display apparatus 303. In case that
the transformation executing method has been performed
every subdivision management unit, the process operation
is carried out every unit of section. The graphic data
in the unit of section is read out, the coordinate
transforming formula is conducted from the relationship
between the coordinate values at the vertexes of this
section, and thereafter the coordinate system of the
graphic data is converted. If the transformation
executing method is performed based on the region of
interest, the coordinate transforming formula is
conducted from the relationship between the coordinate
values at the vertexes of the region of interest, and
then the subdivision units to be converted are uniformly
converted.
A method for obtaining a subdivision management
unit group in question from a region to be
converted among a graphic data file will be described
later.
The above-described operations are the major
step of the map projection transformation. Thereafter,
the job control program 401 executes both the precision
evaluation and the superposition display/overlaying
display of the reference line such as the longitude and
the latitude in response to user's request. In this
case, the precision evaluation program 410, the
reference line generation program 411, and the display
change control program 412 are initiated in response to
the request.
A step 515 implies that the process operations
from a step 516 to a step 520 are repeated until a user
instructs an end of the process operation.
At a step 516, a judgement is made of an
instruction made by the user, and the subsequent step is
determined.
At a step 517, the positional precision on the
graphic data which has been designated by the user via
the region of interest, is evaluated under control of
the display scaling program 409, and then the precision
evaluated result is displayed on the display region
under control of this program 409.
At a step 518, the reference line is
superposition-displayed/overlapping-displayed. The
longitude, latitude, and grid line of the UTM coordinate
system are superposition-displayed/overlapping-displayed,
and erased at intervals designated by the
user.
At a step 519, the representations between the
map projection A and the map projection B are rechanged.
The transformation display executed in this embodiment
is returned to the original map projection A, otherwise
set to the map projection B. As a consequence, the
display results of both of the map projections A and B
may be compared with each other, and thus the analysis
support may be performed more flexibly. The job control
program 401 initiates the display control program 412
used for changing the representation, so that the back
transformations from the map projection B to the
longitude and latitude, and also from the longitude and
latitude to the map projection A are executed in
accordance with the contents of the coordinate transformation
management data table. Otherwise, the back
transformation from the map projection A to the map
projection B is again executed. At this time, since all
of parameters required for the transformations have been
prepared, the display control program 412 merely
controls the executions from the coordinate
transformation table producing program 406 into the
display scaling program 409. It should be noted that
the coordinate transformation table producing program
406 executes changing operations of the coordinate
transformation management data between the map projection
A and the map projection B. When the transformation
results are displayed on the separate windows, each
of these transformation results is displayed on the
separate windows, and these windows may be changed.
More specifically, when both of these windows are
positioned side by side in such a manner that these
windows are not overlapped with each other as permeable
as possible on the display screen, an easy window
comparison can be achieved and an easy representation
can be realized.
At a step 520, an end process is executed
under control of the job control program 401. The
display map projection data to be converted within the
coordinate transformation management table is again
registered to the present display map projection data by
the transformation management table operation program
405, and thus the map projection data to be converted is
erased. Thereafter, an end instruction for the step 516
is given.
Referring now to Figs. 6 and 7, tables for
managing information about the map projections and map
projection transformations will be described. Both of
the information about the map projections and the
information about the coordinate transformation are
independently prepared from the transformation process,
so that the transformation process may be simply
executed and the problems may be solved. Fig. 6 and 7
show contents of a coordinate transformation management
table, a map projection management table and a coordinate
transformation table.
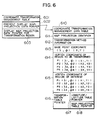
Fig. 6 shows the coordinate transformation
management table. A coordinate transformation
management table 601 corresponds to a table used for
establishing a relationship among the present display
map projection, the longitude/latitude management data
and the map projection to be converted as shown in Fig.
1. The coordinate transformation management table 601
is constructed of two data tables for combining the
longitude/latitude data in the graphic data file region
313 with the projection data to be converted, and also
of a pointer table for designating these data tables.
First, the pointer table is arranged by a pointer 602 to
the present display map projection data table, and also
a pointer 603 to a display map projection data table to
be converted. A coordinate transformation management
data table 610 designated by the respective pointers, is
constructed of an identifier 611 of a map projection;
transformation method information 612 indicating a
preparation state of a transformation table and also
such a matter whether or not a region of interest is
designated; a base point coordinate 613; a vertex
coordinate table 614 for a transforming region; a vertex
coordinate table 615 of a region of interest; and a
pointer 616 for pointing out the coordinate transformation
table. The transformation method information 612
indicates discrimination whether the transformation is
performed based upon the respective management unit, or
the uniform transformation is carried out based on the
region of interest; discrimination whether or not there
is a base point; and discrimination whether or not the
coordinate transformation table has been prepared with
respect to an overall region to be converted. The
relationships between the longitude/latitude coordinate
values of the vertexes of the region shown in Fig. 2,
and the coordinate values by the map projection denoted
by the identifier 611 have been registered in the vertex
coordinate tables 614 and 615. When the contents of the
coordinate transformation management table are rewritten
at a step 520, merely the pointers are substituted. The
transformation table pointer 616 is arranged by a
pointer 617 used for the longitude/latitude coordinate
table and a pointer 618 used for the coordinate table of
the map projection indicated by the identifier 611, and
is accepted from each of the map projection management
tables 701.
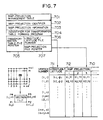
In Fig. 7, there is shown a relationship
between the map projection management table and the
coordinate transformation table. A map projection
management table 701 corresponds to such a table for
managing information related to a map projection shown
in a map projection identifier 702. This management
table 701 is constructed of graphic information 703
related to such an information whether or not the
transformation table has been expressed by numeral
values, and also whether or not the base point is
required; an identifier 704 of a transformation table
forming program; and a pointer 705 for pointing out a
transformation table within the coordinate transformation
table file region 312. The graphic information 703
consists of a NUMERAL-LABEL and a BASE-POINT-LABEL. The
NUMERAL-LABEL represents whether a transformation table
is already expressed as the numeral values or not. The
BASE-POINT-LABEL represents whether a map projection
requires a base point or not. For instance, as to the
azimuth map projection, the NUMERAL-LABEL is set to
"YET". (The NUMERAL-LABEL requires to make the table
expressed as the numeral values.) The BASE-POINT-LABEL
is set to "NEED". (The azimuth map projection requires
a base point.) On the other hand, as to the conical map
projection, the NUMERAL-LABEL is set to "YET" and the
BASE-POINT-LABEL is not set to "NO-NEED". (The conical
map projection does not require a base point." If the
transformation table is not expressed as the numeral
values, the transformation table file pointer 705 is not
stored, but the program identifier 704 has been set
instead of this pointer. At a step 513, the program
corresponding to the program identifier 704 in the
coordinate transformation table forming program 406 is
initiated. If the transformation table has been
expressed as the numeral values, the program identifier
704 is set to "0", and then a pointer for designating a
file is stored into the transformation table file
pointer 705. This transformation table file point 705
is arranged by a pointer 706 for the longitude/latitude
coordinate file and also a pointer 707 for a coordinate
file of a map projection indicated by the identifier
704.
A transformation table file group 710 is
stored into the coordinate transformation table file
region 312 in accordance with the management unit of the
graphic data which has been stored into the graphic data
file region 313. The transformation table file group
710 is arranged by a longitude/latitude file 711
indicative of a longitude/latitude coordinate system
corresponding to each of vertexes in the respective
management units, and a coordinate value data file 712
provided for each map projection corresponding to the
same vertex in conformity to the minimum subdivision
management unit of the graphic data. In case that the
transformation table is not previously expressed in a
numeral value, these tables 711 and 712 of the
subdivision management unit group corresponding to the
region to be converted are produced with employment of
the coordinate transformation table forming program 406.
The produced tables are registered at table pointers 617
and 618. The coordinate relationship among the vertexes
in the subdivision management unit, can be easily
conducted from the relationships 720 among the sections
and vertex data, if the subdivision management unit is
determined. This process operation is carried out under
control of the transformation management table operation
program 405.
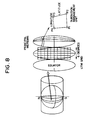
Figs. 8 and 9 are explanatory diagrams in case
of the UTM coordinate system.
Fig. 8 is an explanatory diagram of a coordinate
transformation table in the UTM coordinate system.
As a shown in this figure, to suppress distortions in
distances during projections, the UTM coordinate system
is segmented into zones every 6 degrees in a longitudinal
direction, and thus an overall surface of the
earth is represented by 60 zones. Since the UTM
coordinate system corresponds to such a coordinate
system every zone, the same coordinate values are
obtained every time the zone is shifted by 6 degrees
along the longitudinal direction. As a consequence, it
is not required to prepare transformation tables over
the entire file of the graphic data file region, and
then a transformation table between longitude/latitude
and the UTM coordinate system with respect to a single
zone may be prepared. The UTM coordinate system can be
related to the residue calculation of the longitude.
Furthermore, if an attention is given to symmetry, only
a transformation table with respect to a portion of a
zone corresponding to 1/4 upper portion thereof is
prepared. The format of the transformation table is
followed to the files 711 and 712, whereas the relationship
between the subdivision unit and the vertex is
followed to the relationship 720. The process operations
including the remainder calculation of the
longitude are carried out under control of the transformation
management table operation program 405.
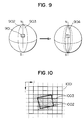
Fig. 9 indicates a method for preventing a
discontinuity of the UTM coordinate system. A description
will now be made of such a process executed in that
a region 901 to be converted extends over two zones 902
and 903. By performing this process, the overall
surface of the earth is segmented again into another UTM
zones by shifting zones properly. New zones can be set
including an old boundary and the region 901 in one
zone. Therefore the region 901 has no boundary in a new
zone, so that the proglems can be also solved. If an
extension of the region 901 along the longitudinal
direction is within 6 degrees, a zone such as the zone
904 is properly shifted, the discontinuity in representation
can be avoided. An amount of shifting angle
in the longitudinal direction is determined based upon a
central value of the longitude of the region to be
converted. A similar process operation can be achieved
by shifting it by this shift amount while performing the
residue calculation of the longitude with reference to
the corresponding table.
Next, a coordinate transformation process
operation by way of the linear interpolation will now be
explained. In accordance with the coordinate relationship
shown in Fig. 2 a coordinate value (Xi, Yi) in the
designated map projection corresponds to a longitude/
latitude coordinate (λi, i) of a vertex (λi, i) (note
that i=1 to 4). When the region to be converted is
surrounded by a longitude and a latitude, since λ3 = λ2;
λ4 = λ1, 2 = 1 and 3 = 4, (X, Y) corresponding to a
point (λ, ) will be calculated from both proportional
distributions about the respective "λ" and proportional
distributions about the respective "" as follows:
X = [(2 - ) {(λ - λ1) X2 + (λ2 - λ) X1} + (
- 1) {(λ - λ1) X3 + (λ2 - λ) X4}] / {(2 - 1) (λ2 -
λ1)}
Y = [(2 - ) {(λ - λ1) Y2 + (λ2 - λ) Y1} + (- 1) {(λ - λ1) Y3 + (λ2 - λ) Y4}] / {(2 - 1) (λ2 - λ1))
In other words, it may be obtained by the linear
transformation while the above-described formulae are
expanded to acquire the below-mentioned formula
[X, Y, l] = [λ , , λ.] . T
T: 3X3 transformation matrix (constant matrix)
Since the transformation matrix T is determined only
from 4 vertexes of the segment and also the transformation
formula is expressed by the linear form, the
coordinate transformation calculation may be simplified.
Furthermore, since the coordinate value after the
transformation are determined from the proportional
distributions of the coordinate values of the respective
vertexes, there is no shift in the graphic data on the
boundary line of the adjoining segments and thus the
problems can be solved. Since the subdivision management
unit corresponds to the segment surrounded by the
longitude and the latitude, the transformations can be
executed every segment in the suitable process. To the
contrary, in the uniform process, the above-described
formula may be applied by that either the region of
interest is inputted as the region surrounded by the
longitude/latitude, or the region of interest is
substituted by the longitude/latitude. As the
substitution method, it is realized by selecting such a
region which is inscribed with the region of interest
and surrounded by the longitude/latitude.
Fig. 10 represents a relationship between a
region to be converted and a subdivision management
unit. A description will now be made of a method for
obtaining a subdivision management unit group corresponding
to a region to be converted from a graphic data
file. Reference numeral 1001 indicates a data file
within the graphic data file region 313. With respect
to the respective vertexes of the region to be
converted, points corresponding thereto on the data file
are obtained from the longitude/latitude coordinates of
the vertexes. A region 1002 formed by connecting the
corresponding points of the respective vertexes is
assumed to as a region to be converted on the data file.
A minimum set 1003 of a section or segment including
this region 1002 corresponds to a management unit group
which should be converted. There is one method for
managing the minimum set 103 as a roster form list. The
coordinate transformation processes are carried out with
respect to the respective segments. Since the transformation
processes are independently carried out in the
unit of segment, these transformation processes may be
performed in the parallel distributed mode. Further,
when a transformation table is formed, a relation is
obtained between the longitudes and latitudes at these
vertexes of the segments, and the coordinate values
under the designated map projection.
Subsequently, a method for generating a
reference line according to a preferred embodiment of
the present invention will now be described. This is
done with respect to a display screen. The representation
made on this display screen is a region to be
converted which has been designated by a user. As a
result, the process to generate the reference line is
carried out with regard to a graphic data subdivision
management group similar to a subject of the coordinate
transformation process. Here, the kind of reference
line is designated by the user, the positions of this
reference line are calculated every subdivision
management unit and displayed. Standard condition
values are previously set to a display interval and a
display color of the reference line. A confirmation is
made during the setting operation whether or not a
setting change is requested. If there is no specific
input, the display of the reference line is carried out
in accordance with the standard conditions. The
reference line is generated in such a way that a cross
point between a boundary line (longitude/latitude) of a
segment and a reference line is calculated, and the
calculated cross points are connected to each other.
Since the management table of the reference line is
independently provided from the map-projection transformation
process and the transformation management
table, the reference line can be produced irrelevant to
the original display map projection and the transforming
map projection. As a consequence, the reference line
functioning as an assistance of analysis may be freely
selected and therefore an analysis support may be
flexibly achieved.
Fig. 11 is a flow chart for explaining the
process to generate the reference line.
At a step 1101, a sort of reference line is
set. As one example, there is such a method to select
the sort of reference line by a user while the sorts of
reference lines are displayed in a menu form.
At a step 1102, a check is done whether or not
a management table of the reference line which has been
set at the previous step 1101 is prepared. If the
management table has not yet been prepared, a process
defined at a step 1103 is executed to prepare such a
management table. Under control of the support-management
table operating program 405, the reference
line management table is read out from the coordinate
transformation table file region 312 and then is written
into the major storage apparatus 302. Furthermore,
under control of the support-management table operating
program 405, a map projection identifier of the coordinate
transformation management table is referred. If
either this map projection identifier of the coordinate
transformation management table is different from
another map projection identifier of the reference line
management table, or there is no coordinate transformation
table for an overall region to be converted, a
table is produced in accordance with the coordinate
transformation table producing program 406. A map-projection
management table indicated by the map
projection identifier will be referred, if required.
Also when no base point has been entered in case that
the base point is required such as in the equiangularity,
the base point is inputted in accordance
with the coordinate input program 404. Upon formation
of the table, the resultant table is registered in a
transformation table pointer of the reference line
management table. If there is the same map projection
in the coordinate transformation management table, it is
also registered into a table pointer thereof.
At a step 1104, an interval of the generation
of the reference line is set. This interval is
indicated as Xint, Yint and α as shown in Fig. 12. In
case of the longitude/latitude, or the equiangularity,
this interval is an angle such as every certain degree.
In case of the grid line of the UTM coordinate system,
this interval corresponds to a distance interval such as
every certain kilometers.
At a step 1105, a display condition of the
reference line is set. In this preferred embodiment, a
display color, a width of the reference line, and a sort
of reference line are set.
A step 1106 implies a present display range.
That is to say, the process operations defined from the
step 1107 to the step 1115 are repeatedly executed with
respect to the respective subdivision management units
of the region to be converted which has been designated
by a user. Since these process operations can be
separately executed with respect to each of the minimum
sets 1003 of the segment, the parallel process operation
may be performed similar to such a case of the coordinate
transformation and thus the process operations can
be carried out at a high speed.
At a step 1107, as shown in Fig. 2, coordinate
values of the reference amount corresponding to the
longitude and latitude are combined with each other with
respect to the vertex of the subdivision unit to be
processed at this time. This method is similar to such
a method for producing a corresponding table between the
longitude/latitude and the coordinate of the map
projection B at the step 512 during the coordinate
transformation. In case of the grid line in the UTM
coordinate system, it may be combined with reference to
a transformation table by way of the remainder
calculation of the longitude and latitude.
At a step 1108, a minimum value and also a
maximum value of a coordinate value for the reference
amount are obtained from the corresponding table
produced at the previous step 1107. In case of the
equiangularity, the coordinate value of the table is
converted into angular information around the base point
1208, and then a maximum (minimum) value thereof is
obtained. A range of the reference amount to be
processed is restricted by previously obtaining the
maximum (minimum) value.
A step 1109 implies that process operations
defined at a step 1110 and the step 811 are executed
with respect to each of the reference amounts X (or α)
contained in between the minimum value and the maximum
value. At this time, the reference amount is expressed
as a value obtained by multiplying the interval value by
"K" (symbol "K" being natural numbers).
At a step 1110, a cross point between the
reference line and each of the boundary lines
(longitude/latitude) at the subdivision management unit
is obtained. In case of the longitude and latitude, or
the grid line of the UTM coordinate, a cross point
between a straight line X = K·Xing and the boundary line
is obtained. In case of the equiangularity, a cross
point between the boundary line and a straight line
having an angle "Kα" in a designated direction is
obtained. At this time, a formula of the straight line
is expressed is follows:
Y = tan (kα)·(X - Xo) + Yo
At a step 1111, a line segment to connect the
thus obtained cross points with each other is displayed.
The line segment is enlarged/reduced under control of
the display scaling program 309 and then is transferred
to the display apparatus 203.
From a step 1112 to a step 1114, a process
operation similar to that defined from the step 1109 to
the step 1111 is carried out with respect to the
reference amount Y.
At a step 1115, a subsequent subdivision
management unit is obtained.
Fig. 12 schematically shows a process to
generate a reference line, namely a relationship between
the reference line and a subdivision management region.
Fig. 12A represents such a case of longitude and
latitude, and also a grid line of the UTM coordinate
system, whereas Fig. 12B shows an equiangularity.
Reference numerals 1201 and 1202 indicate boundary lines
at the subdivision management unit, and become longitude
and latitude. Dot lines 1203 and 1204 indicate
reference lines indicative of k·Xint; reference numerals
1205, 1206 and 1207 denote cross points between the
respective reference lines and the boundary lines; and
reference numeral 1208 denote a base point of an
equiangularity.
Fig. 13 represents a content of a reference
line management table. Also as to the reference line,
since the management data is independent from the
generation process similar to the map projection
transformation, various sorts of the reference lines can
be easily handled. The reference line management table
1301 is constructed of an identifier 1302 for the
reference line; a line color 1303 of the reference line;
a line width 1304; a sort of line 1305; a display
interval 1306 of the reference line; and an identifier
1307 of a map projection to handle the reference amount;
and also a transformation table pointer 1308. The
transformation table pointer 1308 is similar to the
transformation table pointer 616 of the coordinate
transformation management data table.
Referring now to Figs. 14 and 15, a method for
evaluating precision, according to one preferred embodiment,
will be described in case that a map projection
has been converted in accordance with a region of
interest. In this preferred embodiment, a coordinate
value obtained by the suitable transformation is set as
a true value, and precision is evaluated by checking a
shift between another coordinate value obtained by the
uniform transformation and such a coordinate value which
has been originally obtained by way of the suitable
transformation. That is to say, the comparison between
the first-mentioned coordinate value and the second
mentioned coordinate value, is performed at points
obtained in the following sequence and positioned on the
boundary lines in the respective subdivision management
units in the region to be converted.
It is assumed that precision is satisfactory
until the shift between these coordinate values is
within an allowable range. A region having arbitrary
precision may be displayed in an emphasis mode by
setting the allowable error range in accordance with the
following sequence.
Fig. 14 is a flow chart for explaining a
process to evaluate precision. From the coordinate
transformation formula by the uniform transformation, a
straight line having a constant X and a constant Y is
determined in the coordinate system (X, Y) of the map
projection B to be converted, a cross point between this
straight line and a boundary line of a segment, and also
a shift in a coordinate value at a cross point position
is evaluated. Fig. 15 schematically illustrates a
summary of the precision evaluating process.
At a step 1401, an allowable range for a
positional shift amount of graphic data is determined.
This allowable range of the shift amount (precision in
transformation) is determined in accordance with an area
of a region of interest (namely, the region of interest
owns how many minimum subdivision units) which has been
inputted by the user, and also precision in graphic
data. If the coordinate transformation table at the
region to be converted has not yet been expressed by
numeral values, referring to the coordinate transformation
management data table 610, a table is formed under
control of the table forming program 405. At a step
1402, a straight line (X=X1, Y=Y1) having a constant X
and a constant Y is determined from a coordinate value
(X1, Y1) of a vertex 1501 positioned at a lower left
position of the region of interest. Subsequently, the
precision evaluation is carried out along these straight
lines. In other words, a point 1501 is set to a
starting point, and then the precision evaluation is
executed along a positive direction and also a negative
direction. At a step 1403, the precision evaluation is
carried out along the positive direction of the straight
line X=X1 set at the previous step 1402. The adjacent
sections to the straight line X=X1 are successively
evaluated along the positive direction thereof, and it
is shown that the process operations defined from a step
1421 to a step 1427 are executed while the allowable
precision can be satisfied. It is now assumed that a
cross point with the boundary line which is separated
most remote from the region of interest within a range
not exceeding the allowable precision, is set to be
"PX+".
Reference numeral 1502 indicates "PX+". At a
step 1404, the precision evaluation is carried out along
the negative direction of the straight line X=X1, which
is similar to that of the step 1403. A cross point
obtained this precision evaluation is set to be "PX-".
Reference numeral 1503 indicates "PX-". At a step 1405,
the precision evaluation is performed along the positive
direction of the straight line Y=Y1, which is similar to
that of the step 1403. A cross point obtained at this
evaluation is set to be "PY+". Reference numeral 1504
indicates "PY+". At a step 1406, the precision evaluation
is carried out along the negative direction of the
straight line Y=Y1, which is similar to that of the
previous step 1403. A cross point obtained during this
precision evaluation is set to be "PY-". Reference
numeral 1505 denotes "PY-". At a step 1407, a straight
line LY+ which passes through the cross point "PX+"
along the direction of Y=Y1, is obtained, whereas a
straight line LY- which passes through the cross point
"PX-" along the direction of Y=Y1 is obtained. At a
step 1408, a straight line LX+ which passes through the
cross point PY+ along the direction of X=X1 is obtained,
and also a straight line LX- which passes through a
cross point "PY-" along the direction of X=X1 is
obtained. At a step 1410, a region 1509 surrounded by
the four straight lines LX+, LX-, LY+ and LY-, namely a
region whose vertex is the cross point obtained at the
step 1409, is represented in the emphasized mode as the
region capable of satisfying the precision. Reference
numeral 1510 indicates a range expressed in the
emphasized mode on the display screen.
The steps 1420 and 1430 are a flow chart for
explaining the precision evaluation process operations
executed from the steps 1403 to 1406. At the step 1420,
the precision evaluation process for the straight line
X=X1 is performed, whereas at the step 1430, the
precision evaluation process similar to that of the step
1420 is performed with respect to the straight line
Y=Y1.
A process operation of a step 1421 implies
that process operations defined from a step 1422 to a
step 1425 are repeatedly performed unless the shift does
not exceed the allowable range. At a step 1422,
positional information on a cross point 1506 between the
straight line X=X1 and the boundary line is recorded.
At the beginning, a point 1501 is recorded. After
second times, the cross points which have been obtained
during the previous time are recorded. At a step 1423,
a subdivision management unit adjacent to the positive
(negative) direction of the straight line is found. At
a step 1424, a longitude and a latitude of a cross point
between the straight line X=X1 and the boundary line of
the unit section found at the step 1423 are obtained,
and also a coordinate system at a cross point by the
flexible transformation is obtained. Since either the
longitude, or the latitude is constant on the boundary
line of the segment, both the longitude and latitude of
the cross point can be easily obtained. The coordinate
value Xr is obtained by way of the linear interpolation
from the corresponding relationship of the coordinates
at the vertexes of the section. At a step 1425, a
judgement is made whether or not an absolute value of
(X1-Xr) functioning as the shift amount is calculated.
If the shift exceeds the allowable range, the cross
point obtained during the previous time is set to
PX+(PX-), whereby the process operation is completed.
Reference numeral 1507 indicates a cross point exceeding
the allowable range.
Thereafter, a method for carrying out a map-projection
transformation/representation along a path
designated by a user, according to a preferred embodiment,
will now be described. This method may be applied
to such a case that display results are different from
each other, depending upon a position of a base point,
as in the azimuth map projection. The base points are
produced at a constant interval along the path inputted
by the user, whereby the map projection transformation
is performed and then displayed. If the base point is
determined, the map projection transformation/display
are executable similar to that of the previous case.
Fig. 16 represents contents of a path
management table. A path management table 1601 is
constructed of a coordinate value 1603 of a vertex in a
path, a quantity of vertex 1602, and also a distance
1604 up to the next vertex. Reference numeral 1603
represents a coordinate value of longitude/latitude of
the vertex. Reference numeral 1604 denotes a distance
up to the subsequently registered vertex, a value of
which may be calculated either from the UTM coordinate
value, or a distance between two points on a sphere. In
accordance with a method for generating a base point of
one preferred embodiment, an accumulated distance among
the respective vertexes is obtained from the distance
1604 to each vertex, and then the points on the path are
interpolated every predetermined interval, thereby
obtaining a base point.
In accordance with the present invention as claimed in independent claims 1 and 7, the
maps can be displayed in conformity to correctness in a
distance as well as correctness in an azimuth by performing
various sorts of map-projection transformation,
so that these correct maps can intuitively support
user's idea. Also, since the continuities of the
graphic data about the adjoining sections can be maintained
by linear-interpolating the vertex data every
section in case that the various sorts of map projection
transformation, and furthermore, the discontinuities of
the adjoining zones can be avoided by shifting the zone
with respect to the UTM coordinate system corresponding
to the local coordinate system, the maps can be
displayed without causing inconvenient feeling to a
user. As a result, the information representing
function of the digital map information system can be
improved. It is also possible to provide data on the
basis of analysis.