EP0353619A1 - Méthode et dispositif pour déterminer les concentrations locales de la matière colorante et les paramètres de dispersion dans les tissus d'animaux et d'humaines - Google Patents
Méthode et dispositif pour déterminer les concentrations locales de la matière colorante et les paramètres de dispersion dans les tissus d'animaux et d'humaines Download PDFInfo
- Publication number
- EP0353619A1 EP0353619A1 EP89113803A EP89113803A EP0353619A1 EP 0353619 A1 EP0353619 A1 EP 0353619A1 EP 89113803 A EP89113803 A EP 89113803A EP 89113803 A EP89113803 A EP 89113803A EP 0353619 A1 EP0353619 A1 EP 0353619A1
- Authority
- EP
- European Patent Office
- Prior art keywords
- curve
- wavelength range
- remission
- tissue
- hemoglobin
- Prior art date
- Legal status (The legal status is an assumption and is not a legal conclusion. Google has not performed a legal analysis and makes no representation as to the accuracy of the status listed.)
- Granted
Links
Images


Classifications
-
- A—HUMAN NECESSITIES
- A61—MEDICAL OR VETERINARY SCIENCE; HYGIENE
- A61B—DIAGNOSIS; SURGERY; IDENTIFICATION
- A61B5/00—Measuring for diagnostic purposes; Identification of persons
- A61B5/145—Measuring characteristics of blood in vivo, e.g. gas concentration, pH value; Measuring characteristics of body fluids or tissues, e.g. interstitial fluid, cerebral tissue
- A61B5/1455—Measuring characteristics of blood in vivo, e.g. gas concentration, pH value; Measuring characteristics of body fluids or tissues, e.g. interstitial fluid, cerebral tissue using optical sensors, e.g. spectral photometrical oximeters
-
- G—PHYSICS
- G01—MEASURING; TESTING
- G01N—INVESTIGATING OR ANALYSING MATERIALS BY DETERMINING THEIR CHEMICAL OR PHYSICAL PROPERTIES
- G01N21/00—Investigating or analysing materials by the use of optical means, i.e. using sub-millimetre waves, infrared, visible or ultraviolet light
- G01N21/17—Systems in which incident light is modified in accordance with the properties of the material investigated
- G01N21/25—Colour; Spectral properties, i.e. comparison of effect of material on the light at two or more different wavelengths or wavelength bands
- G01N21/31—Investigating relative effect of material at wavelengths characteristic of specific elements or molecules, e.g. atomic absorption spectrometry
- G01N21/314—Investigating relative effect of material at wavelengths characteristic of specific elements or molecules, e.g. atomic absorption spectrometry with comparison of measurements at specific and non-specific wavelengths
Definitions
- the invention relates to a method for determining local dye concentrations in animal and human tissues, in which light of different wavelengths is radiated into a partial area of the tissue, at least a portion of the backscattered light is collected and the remission is determined as a function of the wavelength and the Concentration of dyes is determined from the spectral reflectance.
- “Local” concentration is to be understood here in particular and, for example, the intracapillary area.
- “Dyes” are understood to mean, on the one hand, tissue-specific dyes (pigments), in particular hemoglobin, but also cytochromes, but also added dyes, in which the washing-out kinetics are then examined, for example.
- Light of different wavelengths is usually the mixed light of a lamp (e.g. a xenon high-pressure lamp), but can e.g. B. also be the light of a tunable laser light source.
- the light is usually only spectrally broken down after the remission and the intensity is evaluated as a function of the wavelength, the spectrally different initial intensities being taken into account by calculation.
- a “partial area” is understood to mean an area with a relatively small surface area, typically in the range from 50 to 500 ⁇ m diameter.
- the depth extension in the tissue depends on numerous factors and is (drop to 1 / e) in the order of - 150 ⁇ m.
- the tissue volume from which the remission is obtained is both tissue-specific and device-specific and furthermore also dependent on the hemoglobin concentration.
- the invention therefore provides a method and a device which make it possible to determine the dye concentration and other scattering factors in the tissue, in particular the hemoglobin absolute concentration, much more precisely.
- Basis remission here means the remission of the hemoglobin-free tissue, as can be determined, for example, in the case of a hemoglobin-free perfusion of the tissue.
- tissue-specific is understood to mean the special features that result from the special type of tissue (e.g. rat liver or human skin). “Tissue-specific” refers to values and curves in which the specific measurement of at least one of the two remission curves has already been included, even if it is only due to the selection from a family of curves determined in advance which is influenced by the measurement.
- the solution according to the invention has the particular advantage that the basic remission is relatively undisturbed in the first wavelength range, where the hemoglobin has a window, and the influence of the basic remission in the second wavelength range, where it is generally completely overlaid by the influence of hemoglobin , can be estimated and eliminated accordingly.
- the more precise values obtained in this way can be refined in further process steps.
- a set of tissue-specific standard basic remission curves is obtained in advance on tissue samples of the same tissue type, and the measured remission curve in the first wavelength range, the nearest branch in the first wavelength range from the family of standard basic remission curves and the associated branch of this standard basic remission curve in the second wavelength range selected as the tissue basic standard remission curve.
- Standard basic remission curves are understood to mean basic remission curves that "in advance" on a large number of tissues of the type of tissue to be measured, e.g. B. were measured and stored by hemoglobin-free perfusion.
- curves are determined which, as a family of curves, cover a large range of remissions at one wavelength without the individual curves intersecting. The curve that comes closest to the measured curve in the first wavelength range is now selected from the family and the other branch of this selected (tissue type-specific) standard basic remission curve in the second wavelength range becomes a tissue person-specific (standard) basic remission curve there.
- a standard basic remission curve from the family of previously obtained standard basic remission curves in the first wavelength range is assigned to the measured remission curve in such a way that the standard basic remission curve with the value at a predetermined isosbestic wavelength in the first wavelength range, the same as or next to it measured remission value at this isosbestic wavelength is selected, and the value of the selected standard basic remission curve at a predetermined isosbestic wavelength in the second wavelength range is used as the value for determining the hemoglobin concentration.
- the values at the isosbestic wavelengths are taken because there is no additional error due to the (still unknown) oxygenation of the hemoglobin. However, these values are sufficient for the stated purpose, because the remission value of the remission curve adjusted for the basic remission at an isosbestic wavelength is sufficient to determine the concentration from the remission value with an appropriately calibrated device.
- an averaged tissue type-specific standard remission curve is preferably obtained in advance on tissue samples of the same tissue type, and the measured remission curve in the first wavelength range is related to the averaged standard basic remission curve, and from the ratio obtained and the part of the tissue type-specific averaged standard remission curve in the obtained a tissue-specific standard basic remission curve in the second wavelength range in the second wavelength range.
- a typical curve is now determined from a large number of preliminary dimensions of the basic remission of the tissue (for example by means of hemoglobin-free perfusion) over both wavelength ranges, which is therefore also referred to as the "averaged" standard basic remission curve (although the curves of the Curve family in turn can also have arisen from averaging).
- the averaging of the averaged standard basic remission curve in the first wavelength range to the measured remission curve (in the first wavelength range) is such that the value of the averaged standard basic remission curve in the first wavelength range is at a predetermined isosbestic wavelength in the first wavelength range measured remission value at this isosbestic wavelength is related, and based on the ratio obtained from the value of the average standard remission curve at a predetermined isosbestic wavelength in the second wavelength range, a remission value at this isosbestic wavelength is obtained, which is used as a value for determining the hemoglobin concentration .
- the reflectance value which allows conclusions to be drawn about the hemoglobin concentration, is generally determined by subtracting the value obtained at the isosbestic wavelength in the second wavelength range from the measured reflectance value at this wavelength.
- the measured curve in the first wavelength range is preferably corrected on the basis of the value obtained for the hemoglobin concentration, as a result of which a further, improved approximation for the tissue-specific basic remission in the first wavelength range is obtained.
- the measured remission curve in the first wavelength range which still contained the (however slight) influence of the hemoglobin concentration in the above method, was a "zero approximation" of a tissue-specific basic remission curve in the first wavelength range.
- This zero approximation can now be improved by eliminating the hemoglobin concentration (which in turn is known from the above method steps in a first approximation) from the curve.
- the further approximation obtained in this way is advantageously introduced into the process steps described above instead of the measured remission curve.
- Steps 2 to 4 are therefore particularly preferably carried out with the improved curve instead of the measured remission curve, as a result of which a better approximation for the hemoglobin concentration and a further improved curve are obtained as tissue-specific basic remission in the first wavelength range.
- the above steps 2 to 4 are preferably repeated n times, on the basis of the respectively improved values or curves.
- the range from 630 nm to 100 nm is preferred as the wider first wavelength range.
- the wavelength range from 750 nm to 850 nm is preferred as the narrower first wavelength range. In these areas, hemoglobin has a window, so its influence on remission is minimal.
- the wavelength range from 500 nm to 620 nm is preferred as the wider second wavelength range.
- the range from 550 nm to 570 nm is preferred as the narrower second wavelength range.
- the influence of hemoglobin on tissue emission is great in the latter two areas.
- the invention also relates to a method for determining the oxygenation of hemoglobin, in particular using one or more of the curves from one or more of the above methods.
- the determination of the oxygenation of hemoglobin with high accuracy is also of particular importance when monitoring life processes using spectrophotometry.
- a “pure” hemoglobin curve is obtained from a tissue-specific standard basic remission curve and the measured remission curve in the second wavelength range, with a group of “pure” beforehand by superimposing two pure standard hemoglobin curves, namely for 0% and 100% oxygenation, with different weights "Hemoglobin curves in the range of 0% to 100% oxygenation is obtained, and the" pure "hemoglobin curve, after normalization to 1, is compared with the standard hemoglobin curves of the group, which are also normalized, the most suitable is selected, and their oxygenation as the value of the oxygenation of the measured curve assumed.
- a two-dimensional is carried out beforehand on the basis of a large number of measurements on the same type of tissue, with hemoglobin of different concentration and different oxygenation Generated by comparison curves, the comparison curves with hemoglobin concentrations in the vicinity of the determined concentration are searched over the entire oxygenation range, and the most suitable of the comparison curves provides an assumed value for the oxygenation and an improved value for the concentration.
- the values for the concentration and oxygenation obtained in the manner just described are preferably used in the step described to obtain an improved tissue-specific basic remission curve.
- the measured remission curve from the second wavelength range is normalized to the next matching curve from the two-dimensional family mentioned above, which is used to determine the oxygenation, the difference between the two curves is plotted as a function of the wavelength and as a measure of the distortion to determine the penetration depth of the incident light, ie of the volume V detected by the light.
- this distortion can be used as a measure of the depth of penetration.
- Corresponding previously determined distortion curves are again stored, the corresponding volume is assigned to them, and then the distortion curve obtained by the comparison is assigned to the closest matching curve from the stored distortion curves and the volume is thus determined.
- the Er Weg micro-optical fiber spectrophotometer is particularly preferably used for the above measurements. This is explained in more detail below.
- the interference waveform filter disc used therein preferably has both the first wavelength range and the second wavelength range. As a result, the measured remission curves of the first and the second wavelength range can be obtained in one revolution of the disk.
- the microlight guide spectrophotometer preferably has means for absolute calibration of the illuminating and detecting system. Absolute calibration is particularly important because the preliminary dimensions, which should be carried out with the same device anyway or have to be converted for specific devices, must take place under which defined conditions comparable to the concrete measurement must take place. Such means are in particular a white standard and a normal light source, which will be explained below.
- the invention also relates to a device for determining size changes in tissue particles.
- a device for determining size changes in tissue particles The observation of such changes, e.g. the size change of mitochondria is of particular practical importance since they e.g. enables early detection of brain edema.
- This is achieved by means of a device with a light guide radiating light into the tissue, at least two radially differently spaced light guides receiving the backscattered light, which are preferably arranged linearly on both sides of the illuminating light guide, and an evaluation unit for each of the light guides that determine the temporal Changes in the backscattered intensity relative to the other light guides are detected and evaluated.
- Such an evaluation unit can be constructed analogously to that of the Er Weg microlight guide spectrophotometer. A flattening or other deformation of the backscattering characteristic can then be recognized, which in turn allows conclusions to be drawn about the change in the particle size.
- the invention also relates to a device for determining local dye concentrations in animal and human tissues, with an illuminating device with which light of different wavelengths can be irradiated into a partial area of the tissue, a light-receiving device with which at least part of the backscattered light can be collected is, and an evaluation device that determines the reflectance as a function of the wavelength and determines the concentration of dyes from the spectral reflectance.
- the illuminating device, the light-receiving device and the evaluation device are explained later using examples of possible embodiments.
- the more precise determination of the dye concentrations is achieved in that the illuminating device radiates radiation from a first wavelength range in which the influence of hemoglobin on the reflectance is low in one step and the evaluation device the remission in this (first) wavelength range determines that the illuminating device radiates light from a second wavelength range, in which the remission is dominated by the influence of hemoglobin, into the same partial area of the tissue in a separate step and the evaluation device transmits the remission into This (second) wavelength range determines that the device, based on the remission in the first wavelength range and at least one previously obtained, stored tissue-type-specific standard remission curve for both wavelength ranges, provides a tissue-specific standard basic remission Curve determined for the second wavelength range, and that the device based on the determined tissue-specific standard basic remission curve and the measured remission in the second wavelength range provides a (first) value for the hemoglobin concentration.
- the device has preferably stored a family of tissue-specific standard basic remission curves obtained in advance from tissue samples of the same tissue type, and a computer assigns the measured remission curve in the first wavelength range to the next matching branch in the first wavelength range from the family of standard basic remission curves and selects the associated branch of this standard - Basic remission curve (which has the closest matching branch in the first wavelength range) in the second wavelength range as a tissue-specific standard basic remission curve.
- the computer preferably assigns the device a standard basic remission curve from the family of previously obtained standard basic remission curves in the first wavelength range to the measured remission curve (in the first wavelength range) in such a way that it calculates the standard basic remission curve with the value at a predetermined isosbestic wavelength in the first Select the wavelength range that is equal to or closest to the measured reflectance value at this isosbestic wavelength, and use the value of the selected standard basic remission curve at a predetermined isosbestic wavelength in the second wavelength range as the value for determining the (first) hemoglobin concentration.
- the computer of the device preferably has stored an averaged tissue type-specific standard basic remission curve obtained in advance from tissue samples of the same tissue type and relates the measured remission curve in the first wavelength range to the averaged standard basic remission curve, and forms from the obtained ratio and the part of the tissue type-specific averaged Standard basic remission curve in the second wavelength range a tissue-specific standard basic remission curve in the second wavelength range.
- the computer of the device relates the averaged standard basic remission curve in the first wavelength range to the measured remission curve (in the first wavelength range) in such a way that it measures the value of the averaged standard basic remission curve in the first wavelength range at a predetermined isosbestic wavelength in the first wavelength range
- the remission value at this isosbestic wavelength is related and, based on the ratio obtained from the value of the mean standard basic remission curve at a predetermined isosbestic wavelength in the second wavelength range, provides a remission value at this isosbestic wavelength which is used as a value for determining the (first) hemoglobin concentration .
- the computer of the device is particularly preferably set up and constructed such that it corrects the measured curve in the first wavelength range on the basis of the (first) value obtained for the hemoglobin concentration, as a result of which it provides a further, improved (1st) approximation for the tissue-specific basic remission in the first wavelength range forms ((see p. 19, 3rd paragraph)).
- the computer of the device is preferably set up and constructed in such a way that it uses the improved curve ("(1st) approximation" of the previous paragraph) instead of the measured remission curve to carry out steps 2 to 4 (counting see claims), whereby a better (second) approximation for the hemoglobin concentration and a further improved curve (2nd approximation) than tissue-specific basic remission in the first wavelength range is formed ((see p. 19, 4th paragraph)).
- the device has the computer, which repeats steps 2 to 4 n times, on the basis of the respectively improved values or curves.
- the first wavelength range preferably ranges from 630 nm to 1000 nm.
- the first wavelength range particularly preferably ranges from 750 nm to 850 nm.
- the second wavelength range preferably ranges from 500 nm to 620 nm.
- the second wavelength range particularly preferably ranges from 550 nm to 570 nm.
- the device contains an interference gradient filter disk, which contains the corresponding wavelength ranges, preferably combined in a single disk.
- a selection of certain wavelength ranges can also be made in that, since the evaluation device takes into account the respective position of the interference waveform filter disk, only the desired wavelengths (or the measured values at these wavelengths) are processed by the evaluation device.
- the invention also relates to a device for determining the oxygenation of hemoglobin, in particular one in which one or more of the curves obtained according to the invention by a device as described above are stored.
- a device for determining the oxygenation of hemoglobin in particular one in which one or more of the curves obtained according to the invention by a device as described above are stored.
- the computer of the device forms a "pure" hemoglobin curve from a tissue-specific standard basic remission curve (possibly nth approximation) and the measured remission curve in the second wavelength range, in that the computer beforehand by superimposing two pure standard hemoglobin curves , namely for 0% and 100% oxygenation, with different weighting has formed a group of "pure" hemoglobin curves in the range 0% to 100% oxygenation, and the "pure” hemoglobin curve, after normalization to 1, with the likewise standardized curves of the group compares, selects the next suitable one and supplies its oxygenation as the value of the oxygenation of the measured curve.
- the invention also relates to a device for determining the oxygenation of hemoglobin, in which one of the concentration values (possibly nth approximation) and in particular the curves which were formed by a device according to the invention described above are stored.
- this is characterized in that the device uses a large number of measurements on the same type of tissue, with hemoglobin of different concentration and different oxygenation, to create a two-dimensional set of comparison curves (see FIG.
- the comparison curves with hemoglobin concentrations in the vicinity of the determined concentration is searched over the entire oxygenation range, and from the best-fitting comparison curve forms an assumed value for oxygenation and an improved value (possibly n + 1th approximation) for the concentration.
- the device is particularly preferably set up in such a way that it further uses the values for the concentration (n + 1 th approximation) and the oxygenation to obtain an improved tissue-specific basic remission curve.
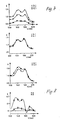
- the device is particularly preferably set up in such a way that it normalizes the measured remission curve (in the second wavelength range) to the closest matching curve from the two-dimensional family (see FIG. 7), and plots the difference between the two curves as a function of wavelength (see FIG. 8). and used as a measure of the distortion to determine the penetration depth of the radiated light, ie the volume V detected by the light ((see p. 21, last paragraph)).
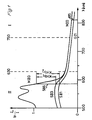
- Fig. 1 shows on the right a first measured curve MI0 (M should measure, I should indicate the wavelength range I (here: 750-850 nm), and the number 0 indicates that it is a curve that is considered the zero approximation of the basic remission curve can be considered).
- I0 / I is used here as a measure of the remission.
- the curve was measured on rat liver using the Er Weg microlight guide spectrophotometer, which u. a. in the dissertation "Optical Scattering on Biological Particles and Cells", Er Weg 1985, of one of the inventors, Frank, is explained in more detail, but was also described below.
- the curve shows only a slight influence of hemoglobin, since hemoglobin has a window in area I.
- Basis remission here means the remission of the hemoglobin-free tissue, as can be determined, for example, in the case of a hemoglobin-free perfusion of the tissue. This basic remission is still tissue-specific, it depends on the redox state of the remaining cell pigments and any added dyes and is also, if only to a small extent, tissue-specific. It is therefore necessary to determine the specific "true" basic remission as precisely as possible in order to be able to determine the concentration, oxygenation and redox state of various pigments / dyes.
- the curve MI0 (viewed systematically in a method step 1.1) represents a (zero) approximation in the method, because it still has an influence of the hemoglobin concentration (KHb) as well as the oxygenation of the, in the selected wavelength range I of 750 to 850 nm Hemoglobin (HbO2 / Hb) is dependent.
- an associated standard basic remission curve in the wavelength range II is selected for the measured basic remission curve MI0.
- the isosbestic wavelength of the hemoglobin (815) nm was selected in the wavelength range I, since the influence of the oxygenation of the hemoglobin on the reflectance in the wavelength range I is greater than the influence of the oxidation of the cytochromes, which influence only with an oxygen partial pressure of less when 5 Torr changes noticeably.
- the choice of the isosbestic wavelength makes one independent of the oxygenation of the hemoglobin (still unknown in this step).
- the error of the zero approximation, the measured curve MI0 only depends on the concentration of the hemoglobin.
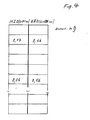
- the value of the sequence at the Isosbestes wavelength is selected in the wavelength range I, which is equal to or closest to the measured value at the isosbestic wavelength on the curve MI0 and by means of this Table 2 the associated value of the sequence in the wavelength range II, and thus the entire branch is also assigned to the corresponding standard remission curve in II.
- a single, averaged from all measured standard remissions, "averaged standard remission curve" is formed and there are tables for the differences (or factors) in relation to other remissions at the isosbestic wavelength in the area I (using a A large number of standard basic remission curves running over both wavelength ranges are created, which assign a difference (or a factor) to a difference (or a factor) for wavelengths in the second wavelength range, particularly there again at an isosbestic wavelength.
- the assignment alternatively (step 2.2) the difference (or the ratio) of the remission of the measured curve MI0 and the averaged standard basic remission curve is determined at the isosbestic wavelength, and the averaged standard basic remission curve in the second wavelength range at the the isosbestic wavelength is loaded with the factor or summand associated with the table in order to arrive at a curve, or at least its value, at an isosbestic wavelength in the wavelength range II which is the 0th approximation of the (standard) basic remission in the second wavelength range, II, SII0 , represents.
- an isosbestic wavelength (specifically 586 nm in the exemplary embodiment) is also selected in order to be independent of the still unknown oxygenation.
- the measured curve in the wavelength range II shows in the left half a remission curve obtained in the same passage of an interference filter disc (see below) (measured systematically in a step 1.2.) At the same tissue site.
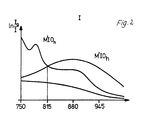
- MII0 the standard basic remission curve SII0 belonging to the measured value determined in the first wavelength range I, which is also available as a table as described above (a section is shown in FIG. 2), or from the comparison of the averaged standard basic remission curve in Area I is drawn with the curve MI0, as is alternatively described above.
- the total remission measured (curve MII0), which is composed of the basic remission (represented in zero approximation by the standard basic remission) and the hemoglobin-dependent remission, is subtracted from the value of the standard basic remission curve SII0 at the concrete isosbestic wavelength (586 nm) from the value of the measured remission curve MII0 the hemoglobin remission and thus a measure of the hemoglobin concentration in a first approximation, KHb1, (in a third step). This gives a first approximation, KHb1, for the concentration of hemoglobin.
- This concentration value KHb1 is used to correct the measured curve in the area I, MI0, and one obtains a corresponding curve of the first, better approximation, GI1, for the basic remission by (in a 4th step) at the 815 nm isosbestic wavelength at this concentration for this wavelength subtracts the (additional) amplitude value of MI0 caused by the hemoglobin concentration.
- the resulting value is used with the help of the table (FIG. 4) (or the alternative method step 2.2) to select a more suitable standard basic remission curve SII1 (see FIG. 1 left), which in turn improves the value of the concentration of the Hemoglobin serves at a KHb2 value.
- This in turn serves to determine an improved base remission curve in the area I, GI2. By inserting it several times in this way, one can finally achieve a greatly improved value for the concentration of hemoglobin, KHbn.
- the oxygenation is determined, if necessary with a simultaneous improvement in the value for the concentration.
- the standard base remission curve corresponding to the last iteration level is subtracted from the measured curve MII0 in order to obtain the "pure" hemoglobin curve, HII0.
- the adjusted measurement curve, HII0 after normalization to 1, is compared with the also normalized curves of this family and the next suitable one is selected (e.g. using the least squares method).
- the degree of oxygenation of the selected curve is assumed to be the degree of oxygenation of the measured curve MII0.
- the measured curve MII0 is now compared with the curves in the table. For example, and preferably the column corresponding to the first approximation of the hemoglobin concentration and one or, in the exemplary embodiment, two neighboring columns each, are searched for all values of the oxygenation.
- the integral of the area under the standard remission curves can be compared with the integral under the measured curve MII0.
- the curves are compared using the least squares method.
- the field of the matrix with the optimally fitting curve gives a concentration value of the hemoglobin, second approximation, KHb2, and an oxygenation level of the hemoglobin, first approximation, KHbO21.
- the method can be continued until a convergence sufficient in terms of the realistic measurement accuracy is achieved.
- the oxygenation of the hemoglobin also suggests the oxidation of the cytochromes. Furthermore, the base remission curve after subtracting the hemoglobin influence allows a more precise determination of other parameters in the tissue.
- Oxygen partial pressures ⁇ 5 Torr which are measured in the tissue, must be based on other basic remission curves, but this does not change the basic process.
- Fig. 2 shows on an enlarged scale the curve MI0 corresponding measured curves from the wavelength range I, once with high oxygenation of the hemoglobin (M'I0 h ) and once with low oxygenation of the hemoglobin (M'I0 n ).
- the 6 schematically shows the illuminating lamp 2, the illuminating light guide 4, the detecting light guide 6 and the photomultiplier 8.
- the volume into which the illuminating light guide 4 shines in the tissue is for a high Hb concentration with Eh and for a low one indicated with En; the volume from which, taking into account the sensitivity of the photomultiplier 8, the detecting light guide 6 can receive light, is denoted by R h or R n .
- the cutting volume, V h or V n is the volume on which the concentration measurement is based. Due to the high luminance, quasi-diffuse lighting is achieved.
- Information about the volume recorded under certain conditions can also be generated in tabular form.
- the corresponding values can be obtained by measurements on sections of the tissue or in scattering chambers with simulation of the tissue.
- concentration values are based on volumes that result from the tables as empirical values. However, the volumes can also be corrected using a special procedure.
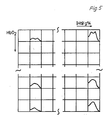
- the distortion of the measured hemoglobin curve MII0 compared to the standard remission curve RSII1 determined from the matrix (table) 2 (see FIG. 5) is used as a measure of the penetration depth and thus the volume measured.
- the measured hemoglobin curve MII0 is normalized to the determined standard curve at the isosbestic wavelength and the difference is plotted depending on the wavelength.
- FIG. 7 shows (schematically) an example of a possible standard remission curve RSII1 with two examples of possible measurement curves MII0 and FIG. 8 the resulting difference or distortion curves.
- the volume can be determined and in turn used as a correction factor for the previously determined values of concentration and oxygenation.
- the invention also enables the change in particle sizes in the tissue to be determined. This provision is of particular practical importance. A change in size of the mitochondria, for example, can be determined with it.
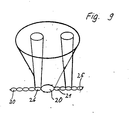
- a preferred embodiment of the device is shown schematically in FIG. 9.
- the device consists of an arrangement of a centrally arranged illuminating light guide 20 with a diameter of approx. 250 ⁇ m and linearly arranged detecting light guides, in the application example with a diameter of approx. 70 ⁇ m.
- This allows, if necessary after calculating the angular distortion resulting from the given arrangement, the distribution of the backscattered light in a cross section of the backscattering volume.
- a comparison of the reflectance values obtained from the various detecting light guides 21 to 30 allows a conclusion to be drawn about the change in the particle size over time.
- 11 graphically shows the change in the distribution of the light, which can also be used in evaluating the relative remissions on the individual or pairs or circles of receiving light guides (here: 21 to 30).
- a central illuminating light guide 20 and an array of, for example, 10 ⁇ 10 receiving light guides is provided (cf. also FIG. 12). This enables the measurement of entire topographies of oxygenation and dye distributions.
- the information coming from the respective individual light guides is first evaluated individually, as described in detail above for a receiving light guide, and the results then result in a topogram of the HB concentration, a topogram of the HbO2 concentration and basic remission topograms.
- the light guide can be queried at the same time, which then requires a corresponding number of the evaluation units described below. If a complete spectrum is short in both wavelength ranges (approx. 1/100 s), the light guides can also be queried in succession, which results in a time difference of approx. One second, which can often be accepted.
- the evaluation of the angle dependency can be used to determine spatial asymmetries.
- illuminating light guides 32-38 are also located on the side edges, in the middle thereof, as a result of which further information about the scattering behavior in the tissue can be obtained.
- the irradiation volume of the central light guide and the volumes detectable by the respective detecting light guides are shown schematically in the drawing using individual examples.
- FIG. 13 shows the basic structure of the Er Weg microlight guide spectrophotometer.
- the light from a xenon high-pressure lamp 40 e.g. XBO 75 W / 2, Osram
- a supply device 42 stabilized power supply unit
- This is combined with the detecting light guide 6 in such a way that the respective end faces lie in one plane and directly next to one another (not shown in FIG. 13).
- the pair of light guides (or the arrangement from FIG. 9 or FIG. 12) is then placed on the tissue surface 46.
- the light reaches an interference curve filter disk 48 via the receiving light guide 6.
- the interference curve filter disks in contrast to the interference curve filter disks previously used for tissue spectrophotometry, it contains the wavelength range from 500 up to 850 nm. It can be seen that the curves are then measured MI0 and MII0 can take place practically simultaneously and the order depends only on the direction of rotation of the filter disc.
- the light of the wavelength range just passed through the interference waveform filter disk 48 (the resolution is approximately 2 nm) is passed via a light guide 50 to a photomultiplier 52. Via an amplifier system 54, the signal is sent to an analog / digital converter 56 and, after digitization, to a computer (also in 56) for further processing.
- a decoding disk 60 is arranged on the shaft of the motor 58 driving the filter disk 48 and outputs the control signals to an EPROM 62.
- the EPROM 62 converts the control signals into trigger signals for the digitization of the measurement signal by the A / D converter 56.
- the decoding disk generates a pulse which marks the start of each disk rotation and which initiates the digitization of the A / D converter.
- the present method works with absolute values of remission. Special attention is therefore paid to the calibration of the entire arrangement.
- the spectral distribution of the light from the xenon arc lamp, the transmission properties of the optical elements (lenses, light guides) and the spectral sensitivity of the photomultiplier result in a wavelength-dependent response function for white light. This can be measured by the spectrum of a white standard, here BaSO4, using the known device shown in FIG. 14.
- the illuminating (4) and the receiving (6) light guide are placed vertically in a drop of immersion liquid 70 (0.9% NaCl) on a glass plate 72 in the arrangement also used for the measurement.
- the glass plate creates a fixed distance from the white standard 74.
- the intersection 76 of the light cone corresponds to the volume V.
- a wavelength-dependent dark curve must be saved.
- an absolute calibration e.g. of the photomultiplier and others
- a normal light source preferably in the form of beta light
- zinc sulfide or another radioluminescent substance is excited by radioactive decay products, in particular beta rays of the tritium.
Applications Claiming Priority (2)
| Application Number | Priority Date | Filing Date | Title |
|---|---|---|---|
| DE3825352 | 1988-07-26 | ||
| DE3825352A DE3825352A1 (de) | 1988-07-26 | 1988-07-26 | Verfahren und vorrichtung zur bestimmung von lokalen farbstoff-konzentrationen und von streuparametern in tierischen und menschlichen geweben |
Publications (2)
| Publication Number | Publication Date |
|---|---|
| EP0353619A1 true EP0353619A1 (fr) | 1990-02-07 |
| EP0353619B1 EP0353619B1 (fr) | 2001-12-12 |
Family
ID=6359575
Family Applications (1)
| Application Number | Title | Priority Date | Filing Date |
|---|---|---|---|
| EP89113803A Expired - Lifetime EP0353619B1 (fr) | 1988-07-26 | 1989-07-26 | Méthode pour déterminer les concentrations locales de la matière colorante dans les tissus d'animaux et d'humains |
Country Status (5)
| Country | Link |
|---|---|
| US (1) | US5645061A (fr) |
| EP (1) | EP0353619B1 (fr) |
| JP (2) | JPH067828B2 (fr) |
| AT (1) | ATE210406T1 (fr) |
| DE (2) | DE3825352A1 (fr) |
Cited By (3)
| Publication number | Priority date | Publication date | Assignee | Title |
|---|---|---|---|---|
| EP0442011A1 (fr) * | 1990-02-15 | 1991-08-21 | Hewlett-Packard GmbH | Sonde, appareil et méthode pour la mesure extracorporelle du taux d'oxygène |
| DE4393335D2 (de) * | 1992-11-09 | 1994-07-21 | Boehringer Mannheim Gmbh | Verfahren und Vorrichtung zur Analyse von Glucose in einer biologischen Matrix |
| DE4337570A1 (de) * | 1993-11-04 | 1995-05-11 | Boehringer Mannheim Gmbh | Verfahren zur Analyse von Glucose in einer biologischen Matrix |
Families Citing this family (11)
| Publication number | Priority date | Publication date | Assignee | Title |
|---|---|---|---|---|
| DE9110757U1 (fr) * | 1991-08-30 | 1992-02-13 | Klein, Rainer, 5840 Schwerte, De | |
| JP2586278B2 (ja) * | 1992-03-30 | 1997-02-26 | 株式会社島津製作所 | 光測定装置の吸光度原点標準器 |
| US20050245850A1 (en) * | 1994-03-30 | 2005-11-03 | Freyre Carlos V | Method and apparatus for inhibiting the growth of and shrinking cancerous tumors |
| DE19512478C2 (de) * | 1994-08-10 | 2001-05-31 | Bernreuter Peter | Verfahren zur Bestimmung der arteriellen Sauerstoffsättigung |
| CA2210791A1 (fr) * | 1997-07-18 | 1999-01-18 | The University Of Manitoba | Diagnostic de l'oedeme |
| US6850656B1 (en) | 1998-10-07 | 2005-02-01 | Ecole Polytechnique Federale De Lausanne | Method and apparatus for measuring locally and superficially the scattering and absorption properties of turbid media |
| US6615068B1 (en) * | 2000-01-20 | 2003-09-02 | The Research Foundation Of Cuny | Technique for examining biological materials using diffuse reflectance spectroscopy and the kubelka-munk function |
| FR2806609B1 (fr) * | 2000-03-24 | 2002-10-11 | Medick S A | Procede et dispositif de mesure non invasive d'un tissu et notamment du taux de bilirubine de la peau |
| EP1860991B1 (fr) * | 2005-03-01 | 2019-04-24 | Masimo Laboratories, Inc. | Moniteur non invasif a parametres multiples destine a un patient |
| US20090312646A1 (en) * | 2007-09-13 | 2009-12-17 | The Regents Of The University Of California | Optical detection of seizure, a pre-seizure state, and cerebral edema and optical fiber detection of the same |
| DE102009043523A1 (de) * | 2009-09-30 | 2011-04-07 | Siemens Aktiengesellschaft | Endoskop |
Citations (2)
| Publication number | Priority date | Publication date | Assignee | Title |
|---|---|---|---|---|
| DE3008651A1 (de) * | 1979-03-07 | 1980-10-16 | Hiroshi Abe | Verfahren zur messung der pneusis- funktion |
| EP0046601A2 (fr) * | 1980-08-26 | 1982-03-03 | Hellige GmbH | Procédé et dispositif pour la détermination colorimétrique de la concentration d'une substance chimique, notamment de la pression partielle d'un gaz dissous dans le sang |
Family Cites Families (21)
| Publication number | Priority date | Publication date | Assignee | Title |
|---|---|---|---|---|
| US455579A (en) | 1891-07-07 | Hand-car | ||
| US455179A (en) * | 1891-06-30 | Horse-detacher | ||
| US3612689A (en) * | 1967-04-10 | 1971-10-12 | American Standard Inc | Suspended particle concentration determination using polarized light |
| US3830568A (en) * | 1973-05-25 | 1974-08-20 | Texas Instruments Inc | Multiple detection volume laser doppler velocimeter |
| US3916197A (en) * | 1973-11-28 | 1975-10-28 | Particle Technology Inc | Method and apparatus for classifying biological cells |
| US4114604A (en) * | 1976-10-18 | 1978-09-19 | Shaw Robert F | Catheter oximeter apparatus and method |
| US4281645A (en) * | 1977-06-28 | 1981-08-04 | Duke University, Inc. | Method and apparatus for monitoring metabolism in body organs |
| US4463762A (en) * | 1977-10-18 | 1984-08-07 | Institute Of Applied Biology Special Cancer Research Project | Apparatus for obtaining an objective determination of the rate of oxygen utilization in peripheral tissue |
| JPS54123084A (en) * | 1978-03-16 | 1979-09-25 | Aroozu Kk | Optical mechanism |
| US4178917A (en) * | 1979-01-03 | 1979-12-18 | Shapiro Howard M | Method and system for non-invasive detection of zinc protoporphyrin in erythrocytes |
| FR2448145A2 (fr) * | 1979-02-05 | 1980-08-29 | Oreal | Appareil destine a reperer la quantite de sebum secretee par une peau |
| DE3019234C2 (de) * | 1980-05-20 | 1984-08-30 | Duke University Inc., Durham, N.C. | Einrichtung zur in vivo Blutmessung |
| DE3175632D1 (en) * | 1980-08-21 | 1987-01-08 | Oriel Scient Ltd | Analytical optical instruments |
| JPS57175345A (en) * | 1981-04-22 | 1982-10-28 | Sumitomo Electric Industries | Sensor for live body organ spectrum analyser |
| JPS57199943A (en) * | 1981-06-03 | 1982-12-08 | Hitachi Ltd | Measuring device for wetness of steam |
| DE3134124A1 (de) * | 1981-08-28 | 1983-03-10 | Erwin Braun Institut, 6390 Engelberg | Verfahren und geraet zur ueberwachung der sauerstoffsaettigung des blutes in vivo |
| US4801205A (en) * | 1984-06-30 | 1989-01-31 | Kabushiki Kaisha Toshiba | Particle size measuring apparatus |
| US4718417A (en) * | 1985-03-22 | 1988-01-12 | Massachusetts Institute Of Technology | Visible fluorescence spectral diagnostic for laser angiosurgery |
| DE3512602A1 (de) * | 1985-04-06 | 1986-10-09 | Richard Wolf Gmbh, 7134 Knittlingen | Endoskop zur bestimmung von objektgroessen in hohlraeumen |
| DE3629447A1 (de) * | 1985-08-30 | 1987-04-09 | Criticare Systems Inc | Oximetrieverfahren und -vorrichtung |
| DE3700577A1 (de) * | 1987-01-10 | 1988-07-21 | Helge Eichholz | Verfahren und untersuchungsvorrichtung zur untersuchung von menschlichem oder tierischem gewebe oder menschlicher oder tierischer koerperfluessigkeit auf einen bestimmten stoffgehalt |
-
1988
- 1988-07-26 DE DE3825352A patent/DE3825352A1/de active Granted
-
1989
- 1989-07-26 JP JP1191593A patent/JPH067828B2/ja not_active Expired - Lifetime
- 1989-07-26 AT AT89113803T patent/ATE210406T1/de not_active IP Right Cessation
- 1989-07-26 DE DE58909882T patent/DE58909882D1/de not_active Expired - Fee Related
- 1989-07-26 EP EP89113803A patent/EP0353619B1/fr not_active Expired - Lifetime
-
1993
- 1993-05-10 JP JP5108184A patent/JP2886031B2/ja not_active Expired - Lifetime
-
1994
- 1994-09-01 US US08/299,816 patent/US5645061A/en not_active Expired - Fee Related
Patent Citations (2)
| Publication number | Priority date | Publication date | Assignee | Title |
|---|---|---|---|---|
| DE3008651A1 (de) * | 1979-03-07 | 1980-10-16 | Hiroshi Abe | Verfahren zur messung der pneusis- funktion |
| EP0046601A2 (fr) * | 1980-08-26 | 1982-03-03 | Hellige GmbH | Procédé et dispositif pour la détermination colorimétrique de la concentration d'une substance chimique, notamment de la pression partielle d'un gaz dissous dans le sang |
Non-Patent Citations (1)
| Title |
|---|
| PHYSICS IN MEDICINE & BIOLOGY Band 33, Nr. 6, Juni 1988, Seiten 711-722, Bristol, GB; J.W. FEATHER et al. "A portable reflectometer for the rapid quantification of cutaneous haemoglobin and melanin" * |
Cited By (12)
| Publication number | Priority date | Publication date | Assignee | Title |
|---|---|---|---|---|
| EP0442011A1 (fr) * | 1990-02-15 | 1991-08-21 | Hewlett-Packard GmbH | Sonde, appareil et méthode pour la mesure extracorporelle du taux d'oxygène |
| US5188108A (en) * | 1990-02-15 | 1993-02-23 | Hewlett-Packard Company | Sensor, apparatus and method for non-invasive measurement of oxygen saturation |
| US5285783A (en) * | 1990-02-15 | 1994-02-15 | Hewlett-Packard Company | Sensor, apparatus and method for non-invasive measurement of oxygen saturation |
| EP0613652A2 (fr) * | 1990-02-15 | 1994-09-07 | Hewlett-Packard GmbH | Appareil et méthode pour la mesure non-invasive du taux d'oxygène |
| EP0613653A2 (fr) * | 1990-02-15 | 1994-09-07 | Hewlett-Packard GmbH | Méthode pour la mesure non-invasive du taux d'oxygène |
| EP0613653A3 (fr) * | 1990-02-15 | 1994-11-23 | Hewlett Packard Gmbh | Méthode pour la mesure non-invasive du taux d'oxygène. |
| EP0613652A3 (fr) * | 1990-02-15 | 1994-12-07 | Hewlett Packard Gmbh | Appareil et méthode pour la mesure non-invasive du taux d'oxygène. |
| DE4393335D2 (de) * | 1992-11-09 | 1994-07-21 | Boehringer Mannheim Gmbh | Verfahren und Vorrichtung zur Analyse von Glucose in einer biologischen Matrix |
| US5551422A (en) * | 1992-11-09 | 1996-09-03 | Boehringer Mannheim Gmbh | Method and apparatus for analytical determination of glucose in a biological matrix |
| US5676143A (en) * | 1992-11-09 | 1997-10-14 | Boehringer Mannheim Gmbh | Apparatus for analytical determination of glucose in a biological matrix |
| DE4337570A1 (de) * | 1993-11-04 | 1995-05-11 | Boehringer Mannheim Gmbh | Verfahren zur Analyse von Glucose in einer biologischen Matrix |
| US5692504A (en) * | 1993-11-04 | 1997-12-02 | Boehringer Mannheim Gmbh | Method and apparatus for the analysis of glucose in a biological matrix |
Also Published As
| Publication number | Publication date |
|---|---|
| JPH0698892A (ja) | 1994-04-12 |
| DE58909882D1 (de) | 2002-01-24 |
| JP2886031B2 (ja) | 1999-04-26 |
| DE3825352A1 (de) | 1990-02-01 |
| JPH067828B2 (ja) | 1994-02-02 |
| DE3825352C2 (fr) | 1990-09-27 |
| ATE210406T1 (de) | 2001-12-15 |
| JPH02257930A (ja) | 1990-10-18 |
| US5645061A (en) | 1997-07-08 |
| EP0353619B1 (fr) | 2001-12-12 |
Similar Documents
| Publication | Publication Date | Title |
|---|---|---|
| DE4239016C2 (de) | Verfahren zum Bestimmen der Konzentration von freien Ionen innerhalb einer Zelle unter Verwendung eines Fluoreszenzindikatorfarbstoffs | |
| DE3031249C2 (de) | Vorrichtung zum Entdecken von Karies und Anwendung dieser Vorrichtung | |
| DE10133451B4 (de) | Vorrichtung zum Erkennen von Karies, Plaque, Konkrementen oder bakteriellem Befall an Zähnen | |
| DE2902776C2 (fr) | ||
| DE2613617C2 (de) | Verfahren zur Analyse von Proben, z.B. Urin | |
| EP0534166B1 (fr) | Procédé et dispositif pour la détermination quantitatif des substances optiquement actif | |
| EP0353619B1 (fr) | Méthode pour déterminer les concentrations locales de la matière colorante dans les tissus d'animaux et d'humains | |
| DE2049716C3 (de) | Verfahren und Vorrichtung zur Absorptionsmessung im Blut | |
| DE60037437T2 (de) | Optimierung einer lichtleitersonde für spektroskopische messungen | |
| DE2134910C2 (de) | Verfahren zur Blutanalyse | |
| EP3051272B1 (fr) | Procédé et analyseur automatique de détermination de lipides et d'autres substances interférentes dans des échantillons de liquide corporel | |
| EP1635164B1 (fr) | Méthode pour calibrage d'un système de mesure de photoluminescence | |
| AT403412B (de) | Vorrichtung und verfahren zur bestimmung der konzentration von hämoglobinderivaten in einer unverdünnten, unhämolysierten vollblutprobe | |
| DE2944113C2 (fr) | ||
| EP0818682A2 (fr) | Procédé et dispositif pour la détermination optique de la concentration de l'hémoglobine totale | |
| EP0215772A2 (fr) | Procédé et dispositif pour les diagnostics de tumeurs au moyen de sérums | |
| EP0774658A2 (fr) | Procédé et dispositif de détermination de données analytiques concernant l'intérieur d'un milieu diffusant | |
| DE2340252A1 (de) | Verfahren und einrichtung zur auszaehlung von biologischen partikeln | |
| DE3542167C2 (fr) | ||
| DE10222359B4 (de) | Verfahren zur spektral differenzierenden, bildgebenden Messung von Fluoreszenzlicht | |
| DE4325529C2 (de) | Vorrichtung zum Bestimmen der Konzentration von Stoffen im Blut | |
| DE3844651A1 (de) | Vorrichtung zum ermitteln von groessenveraenderungen an gewebepartikeln | |
| DE3734588C2 (fr) | ||
| EP0679064A1 (fr) | Procede et dispositif de determination percutanee non invasive de la concentration de substances presentes dans des liquides ou des tissus du corps humain | |
| EP1236035B1 (fr) | Procede de controle de la qualite de couches de matiere |
Legal Events
| Date | Code | Title | Description |
|---|---|---|---|
| PUAI | Public reference made under article 153(3) epc to a published international application that has entered the european phase |
Free format text: ORIGINAL CODE: 0009012 |
|
| AK | Designated contracting states |
Kind code of ref document: A1 Designated state(s): AT BE CH DE ES FR GB IT LI NL SE |
|
| 17P | Request for examination filed |
Effective date: 19900727 |
|
| 17Q | First examination report despatched |
Effective date: 19930202 |
|
| APAB | Appeal dossier modified |
Free format text: ORIGINAL CODE: EPIDOS NOAPE |
|
| APAA | Appeal reference recorded |
Free format text: ORIGINAL CODE: EPIDOS REFN |
|
| APAD | Appeal reference recorded |
Free format text: ORIGINAL CODE: EPIDOS REFNE |
|
| APAB | Appeal dossier modified |
Free format text: ORIGINAL CODE: EPIDOS NOAPE |
|
| GRAG | Despatch of communication of intention to grant |
Free format text: ORIGINAL CODE: EPIDOS AGRA |
|
| RTI1 | Title (correction) |
Free format text: PROCESS FOR DETERMINATION OF LOCAL DYE-CONCENTRATIONS IN ANIMAL AND HUMAN TISSUE |
|
| GRAG | Despatch of communication of intention to grant |
Free format text: ORIGINAL CODE: EPIDOS AGRA |
|
| GRAH | Despatch of communication of intention to grant a patent |
Free format text: ORIGINAL CODE: EPIDOS IGRA |
|
| GRAH | Despatch of communication of intention to grant a patent |
Free format text: ORIGINAL CODE: EPIDOS IGRA |
|
| GRAA | (expected) grant |
Free format text: ORIGINAL CODE: 0009210 |
|
| AK | Designated contracting states |
Kind code of ref document: B1 Designated state(s): AT BE CH DE ES FR GB IT LI NL SE |
|
| PG25 | Lapsed in a contracting state [announced via postgrant information from national office to epo] |
Ref country code: IT Free format text: LAPSE BECAUSE OF FAILURE TO SUBMIT A TRANSLATION OF THE DESCRIPTION OR TO PAY THE FEE WITHIN THE PRESCRIBED TIME-LIMIT;WARNING: LAPSES OF ITALIAN PATENTS WITH EFFECTIVE DATE BEFORE 2007 MAY HAVE OCCURRED AT ANY TIME BEFORE 2007. THE CORRECT EFFECTIVE DATE MAY BE DIFFERENT FROM THE ONE RECORDED. Effective date: 20011212 Ref country code: NL Free format text: LAPSE BECAUSE OF FAILURE TO SUBMIT A TRANSLATION OF THE DESCRIPTION OR TO PAY THE FEE WITHIN THE PRESCRIBED TIME-LIMIT Effective date: 20011212 |
|
| REF | Corresponds to: |
Ref document number: 210406 Country of ref document: AT Date of ref document: 20011215 Kind code of ref document: T |
|
| RIN1 | Information on inventor provided before grant (corrected) |
Inventor name: KESSLER, MANFRED, PROF. DR. MED. Inventor name: FRANK, KLAUS, DR. |
|
| REG | Reference to a national code |
Ref country code: CH Ref legal event code: EP |
|
| REG | Reference to a national code |
Ref country code: GB Ref legal event code: IF02 |
|
| REF | Corresponds to: |
Ref document number: 58909882 Country of ref document: DE Date of ref document: 20020124 |
|
| PG25 | Lapsed in a contracting state [announced via postgrant information from national office to epo] |
Ref country code: SE Free format text: LAPSE BECAUSE OF FAILURE TO SUBMIT A TRANSLATION OF THE DESCRIPTION OR TO PAY THE FEE WITHIN THE PRESCRIBED TIME-LIMIT Effective date: 20020312 |
|
| GBT | Gb: translation of ep patent filed (gb section 77(6)(a)/1977) |
Effective date: 20020308 |
|
| ET | Fr: translation filed | ||
| NLV1 | Nl: lapsed or annulled due to failure to fulfill the requirements of art. 29p and 29m of the patents act | ||
| PG25 | Lapsed in a contracting state [announced via postgrant information from national office to epo] |
Ref country code: ES Free format text: LAPSE BECAUSE OF FAILURE TO SUBMIT A TRANSLATION OF THE DESCRIPTION OR TO PAY THE FEE WITHIN THE PRESCRIBED TIME-LIMIT Effective date: 20020627 |
|
| PG25 | Lapsed in a contracting state [announced via postgrant information from national office to epo] |
Ref country code: AT Free format text: LAPSE BECAUSE OF NON-PAYMENT OF DUE FEES Effective date: 20020726 |
|
| PGFP | Annual fee paid to national office [announced via postgrant information from national office to epo] |
Ref country code: GB Payment date: 20020726 Year of fee payment: 14 |
|
| PGFP | Annual fee paid to national office [announced via postgrant information from national office to epo] |
Ref country code: DE Payment date: 20020730 Year of fee payment: 14 |
|
| PG25 | Lapsed in a contracting state [announced via postgrant information from national office to epo] |
Ref country code: LI Free format text: LAPSE BECAUSE OF NON-PAYMENT OF DUE FEES Effective date: 20020731 Ref country code: BE Free format text: LAPSE BECAUSE OF NON-PAYMENT OF DUE FEES Effective date: 20020731 Ref country code: CH Free format text: LAPSE BECAUSE OF NON-PAYMENT OF DUE FEES Effective date: 20020731 |
|
| PGFP | Annual fee paid to national office [announced via postgrant information from national office to epo] |
Ref country code: FR Payment date: 20020819 Year of fee payment: 14 |
|
| PLBE | No opposition filed within time limit |
Free format text: ORIGINAL CODE: 0009261 |
|
| STAA | Information on the status of an ep patent application or granted ep patent |
Free format text: STATUS: NO OPPOSITION FILED WITHIN TIME LIMIT |
|
| 26N | No opposition filed | ||
| BERE | Be: lapsed |
Owner name: *KESSLER MANFRED Effective date: 20020731 |
|
| REG | Reference to a national code |
Ref country code: CH Ref legal event code: PL |
|
| NLV1 | Nl: lapsed or annulled due to failure to fulfill the requirements of art. 29p and 29m of the patents act | ||
| PG25 | Lapsed in a contracting state [announced via postgrant information from national office to epo] |
Ref country code: GB Free format text: LAPSE BECAUSE OF NON-PAYMENT OF DUE FEES Effective date: 20030726 |
|
| PG25 | Lapsed in a contracting state [announced via postgrant information from national office to epo] |
Ref country code: DE Free format text: LAPSE BECAUSE OF NON-PAYMENT OF DUE FEES Effective date: 20040203 |
|
| GBPC | Gb: european patent ceased through non-payment of renewal fee |
Effective date: 20030726 |
|
| PG25 | Lapsed in a contracting state [announced via postgrant information from national office to epo] |
Ref country code: FR Free format text: LAPSE BECAUSE OF NON-PAYMENT OF DUE FEES Effective date: 20040331 |
|
| REG | Reference to a national code |
Ref country code: FR Ref legal event code: ST |
|
| APAH | Appeal reference modified |
Free format text: ORIGINAL CODE: EPIDOSCREFNO |