WO2023189169A1 - 粒子分析装置、粒子分析方法、及び粒子分析用プログラム - Google Patents
粒子分析装置、粒子分析方法、及び粒子分析用プログラム Download PDFInfo
- Publication number
- WO2023189169A1 WO2023189169A1 PCT/JP2023/007791 JP2023007791W WO2023189169A1 WO 2023189169 A1 WO2023189169 A1 WO 2023189169A1 JP 2023007791 W JP2023007791 W JP 2023007791W WO 2023189169 A1 WO2023189169 A1 WO 2023189169A1
- Authority
- WO
- WIPO (PCT)
- Prior art keywords
- fluorescence
- particle
- particles
- unit
- excitation
- Prior art date
- Legal status (The legal status is an assumption and is not a legal conclusion. Google has not performed a legal analysis and makes no representation as to the accuracy of the status listed.)
- Ceased
Links
Images



Classifications
-
- G—PHYSICS
- G01—MEASURING; TESTING
- G01N—INVESTIGATING OR ANALYSING MATERIALS BY DETERMINING THEIR CHEMICAL OR PHYSICAL PROPERTIES
- G01N15/00—Investigating characteristics of particles; Investigating permeability, pore-volume or surface-area of porous materials
- G01N15/10—Investigating individual particles
- G01N15/14—Optical investigation techniques, e.g. flow cytometry
- G01N15/1425—Optical investigation techniques, e.g. flow cytometry using an analyser being characterised by its control arrangement
- G01N15/1427—Optical investigation techniques, e.g. flow cytometry using an analyser being characterised by its control arrangement with the synchronisation of components, a time gate for operation of components, or suppression of particle coincidences
-
- G—PHYSICS
- G01—MEASURING; TESTING
- G01N—INVESTIGATING OR ANALYSING MATERIALS BY DETERMINING THEIR CHEMICAL OR PHYSICAL PROPERTIES
- G01N15/00—Investigating characteristics of particles; Investigating permeability, pore-volume or surface-area of porous materials
- G01N15/02—Investigating particle size or size distribution
- G01N15/0205—Investigating particle size or size distribution by optical means
- G01N15/0227—Investigating particle size or size distribution by optical means using imaging; using holography
-
- G—PHYSICS
- G01—MEASURING; TESTING
- G01N—INVESTIGATING OR ANALYSING MATERIALS BY DETERMINING THEIR CHEMICAL OR PHYSICAL PROPERTIES
- G01N15/00—Investigating characteristics of particles; Investigating permeability, pore-volume or surface-area of porous materials
- G01N15/10—Investigating individual particles
- G01N15/14—Optical investigation techniques, e.g. flow cytometry
- G01N15/1429—Signal processing
- G01N15/1433—Signal processing using image recognition
-
- G—PHYSICS
- G01—MEASURING; TESTING
- G01N—INVESTIGATING OR ANALYSING MATERIALS BY DETERMINING THEIR CHEMICAL OR PHYSICAL PROPERTIES
- G01N15/00—Investigating characteristics of particles; Investigating permeability, pore-volume or surface-area of porous materials
- G01N15/10—Investigating individual particles
- G01N15/14—Optical investigation techniques, e.g. flow cytometry
- G01N15/1434—Optical arrangements
-
- G—PHYSICS
- G01—MEASURING; TESTING
- G01N—INVESTIGATING OR ANALYSING MATERIALS BY DETERMINING THEIR CHEMICAL OR PHYSICAL PROPERTIES
- G01N15/00—Investigating characteristics of particles; Investigating permeability, pore-volume or surface-area of porous materials
- G01N15/10—Investigating individual particles
- G01N2015/1006—Investigating individual particles for cytology
-
- G—PHYSICS
- G01—MEASURING; TESTING
- G01N—INVESTIGATING OR ANALYSING MATERIALS BY DETERMINING THEIR CHEMICAL OR PHYSICAL PROPERTIES
- G01N15/00—Investigating characteristics of particles; Investigating permeability, pore-volume or surface-area of porous materials
- G01N15/10—Investigating individual particles
- G01N15/14—Optical investigation techniques, e.g. flow cytometry
- G01N15/1434—Optical arrangements
- G01N2015/144—Imaging characterised by its optical setup
-
- G—PHYSICS
- G01—MEASURING; TESTING
- G01N—INVESTIGATING OR ANALYSING MATERIALS BY DETERMINING THEIR CHEMICAL OR PHYSICAL PROPERTIES
- G01N15/00—Investigating characteristics of particles; Investigating permeability, pore-volume or surface-area of porous materials
- G01N15/10—Investigating individual particles
- G01N15/14—Optical investigation techniques, e.g. flow cytometry
- G01N2015/1493—Particle size
Definitions
- the present invention relates to a particle analysis device, a particle analysis method, and a particle analysis program.
- PTA method particle trajectory analysis method
- this measurement method images particles in a cell using a CCD camera, etc., and analyzes physical properties such as particle size distribution by calculating the diffusion rate of particles due to Brownian motion based on the imaged data obtained. It is something to do.
- Patent Document 1 discloses one configured to irradiate a sample added with multiple types of fluorescent markers with excitation light having an excitation wavelength corresponding to each fluorescent marker.
- This particle analyzer is equipped with a filter in front of the CCD camera that cuts off excitation light while transmitting fluorescence, allowing each fluorescence to be observed in each color.
- the aim is to be able to analyze each particle by type.
- each of the different fluorescent markers added to different types of particles will emit fluorescence.
- a method for analyzing different types of particles by type is to prepare multiple filters that pass each fluorescence wavelength from a different fluorescent marker, and to measure while switching these filters according to the excitation wavelength. There is a way.
- the fluorescent markers added to the sample can be fluorescent marker A, which is excited by laser light from the first laser light source, and fluorescent marker B, which is excited by laser light from the second laser light source. It is.
- particles that can be analyzed by type include “particles to which only fluorescent marker A has been added,” “particles to which only fluorescent marker B has been added,” and “particles to which both fluorescent markers A and B have been added.” There are four types: ⁇ particles containing fluorescent markers A and B'' and ⁇ particles containing neither fluorescent marker A nor B.''
- the number of types of particles that can be analyzed is limited by the number of excitation light sources, and in order to analyze more types of particles, it is necessary to use a correspondingly large number of laser light sources. This leads to larger sizes and higher costs.
- the present invention solves the above-mentioned problems at once, and in particle analysis using the PTA method, even if the excitation wavelengths of fluorescent markers or particles with autofluorescence properties overlap,
- the object of the present invention is to make it possible to analyze each type of particle while suppressing the increase in size and cost of the device.
- the particle analyzer includes a light irradiation section that irradiates excitation light to a sample that emits fluorescence of a plurality of colors, and a light irradiation section that transmits the fluorescence of the plurality of colors while cutting the excitation light.
- an analysis section that determines the physical properties of the particles and analyzes the physical properties of the particles.
- a particle analyzer configured in this way has one or more filters that transmit fluorescent light of multiple colors while cutting excitation light, and a color discrimination ability that images the fluorescent light that has passed through this filter. Because it uses an imaging unit with It becomes possible to analyze by type.
- a method for analyzing different particles by type is to separate the particles by type in advance by, for example, centrifugation.
- this method requires pretreatment, which takes time and effort, and there is even a possibility that the properties of the sample may change during the treatment process.
- the particle analyzer according to the present invention described above even if the excitation wavelengths of fluorescence of multiple colors overlap, each color can be identified, so particles can be separated by type. It becomes possible to analyze each particle by type without performing pretreatment for separation.
- the imaging section captures an image of the fluorescent light so that the color of the fluorescent light can be discriminated, there is no need to determine the wavelength selectivity of the fluorescent light to be transmitted through the filter. Nevertheless, if the wavelength range of fluorescence that passes through the filter is narrow, it becomes necessary to replace the filter with a filter that transmits the fluorescence depending on the fluorescence wavelength of the fluorescence. Therefore, the light irradiation unit irradiates the sample with excitation light having different excitation wavelengths, and the one or more filters cut in a wavelength region longer than the shortest excitation wavelength. It is preferable that the wavelength range to be transmitted is wider than the wavelength range. With this configuration, fluorescent light of various colors passes through one or more filters, so the same filter can be used for fluorescent light of various colors, reducing the number of parts and cost. I can figure it out.
- a configuration may be considered in which a plurality of combinations of a filter that transmits fluorescence of a certain color and a CCD camera are provided, but in order to simplify the optical design, it is necessary to Preferably, the section has a color CCD.
- the light irradiation unit sequentially switches the excitation light having excitation wavelengths for generating fluorescence of the plurality of colors and irradiates the sample with the excitation light. With this, it is possible to accurately analyze each type of particle to which a fluorescent marker has been added.
- a particle identification unit that identifies particles emitting fluorescence from the image data of fluorescence obtained by the imaging unit; a fluorescence identification unit that identifies fluorescence information regarding the fluorescence emitted by the particles identified by the particle identification unit; It is preferable that the analysis unit analyzes the physical properties of the particles for each of the fluorescence information specified by the fluorescence identification unit. With this, physical properties can be analyzed for each fluorescence information, that is, for each type of particle.
- the fluorescence specifying section there can be mentioned one in which the hue obtained by converting the output value from the imaging section is specified as the fluorescence information.
- One axis is set to the fluorescence information obtained by irradiating the sample with excitation light of a first excitation wavelength, and the other axis is set to the fluorescence information obtained by irradiating the sample with excitation light of a second excitation wavelength. It is preferable to include a display unit that displays a graph set to fluorescence information and also displays a plot showing each particle on the graph. With this, fluorescence information of each of the various particles contained in the sample can be displayed with good visibility.
- the display section selectably display each of the plots, and when one or more of the plots is selected, display the analysis results of the analysis section for the particles indicated by those plots. With this, the analysis results of the particles you want to check can be easily displayed, improving operability.
- the display unit displays an enlarged image obtained by cutting out particles indicated by the plots from the image data.
- the display unit displays an enlarged image obtained by cutting out particles indicated by the plots from the image data.
- the average color information of a plurality of pixels representing one particle included in the image data is used as the fluorescence information of a fluorescent marker added to the particle.
- An example of a mode in which the calculation is performed is as follows.
- the center of a pixel representing one particle included in the image data may be blown out. Therefore, in order to obtain more accurate fluorescence information, the color information to be averaged is that of the pixels excluding at least the pixel located in the center among the plurality of pixels representing the one particle. It is preferable.
- At least one type of particles contained in the sample has a plurality of types of fluorescent markers added thereto. If this is the case, the particle analyzer according to the present invention will be useful for multiple staining methods.
- excitation light is irradiated onto a sample that emits fluorescence of a plurality of colors, and one or more filters are used to cut the excitation light while emitting fluorescence of the plurality of colors.
- the fluorescence that has passed through the filter is imaged by an imaging unit that transmits the fluorescence and has color discrimination ability, and from the image data of the fluorescence obtained by the imaging unit, the diffusion due to Brownian motion of particles contained in the sample is detected. This is a method of determining the velocity and analyzing the physical properties of the particles.
- the particle analysis program includes a light irradiation unit that irradiates excitation light to a sample that emits fluorescence of a plurality of colors, and a light irradiation unit that transmits the fluorescence of the plurality of colors while cutting the excitation light.
- a program used in a particle analyzer that includes one or more filters and an imaging unit having a color discrimination ability for imaging fluorescence that has passed through the filter, and image data of fluorescence obtained by the imaging unit.
- the present invention is characterized in that the computer functions as an analysis unit that determines the Brownian motion diffusion rate of particles contained in the sample and analyzes the physical properties of the particles.
- FIG. 1 is a schematic diagram showing a particle analyzer according to an embodiment of the present invention.
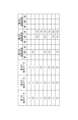
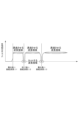
- a table showing an example of fluorescent markers used in the embodiment. 7 is a graph showing the transmittance of the filter group in the same embodiment.
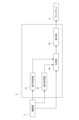
- FIG. 3 is a functional block diagram showing the functions of the information processing device according to the embodiment.
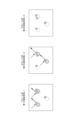
- FIG. 3 is a schematic diagram for explaining particles to which a fluorescent marker of the same embodiment is added.
- FIG. 3 is a schematic diagram for explaining particles to which a fluorescent marker of the same embodiment is added.
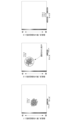
- FIG. 3 is a schematic diagram showing an example of content displayed by the display unit of the embodiment.
- FIG. 3 is a schematic diagram showing an example of content displayed by the display unit of the embodiment.
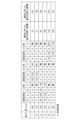
- 7 is a table showing an example of information stored in an analysis information storage unit according to another embodiment.
- the particle analyzer 100 of this embodiment is for analyzing the physical properties of particles contained in a sample within a cell 1, such as exosomes contained in a body fluid sample such as blood or urine, or It analyzes virus-like particles, liposomes, proteins, etc. related to vaccines.
- This particle analyzer 100 irradiates light onto a sample made by adding multiple types of fluorescent markers to particles, detects fluorescence from the particles to which those fluorescent markers have been added, and analyzes the physical properties of the particles. It is used in conjunction with multiple staining methods.
- Such particles can include, for example, inorganic materials such as fluorescent beads.
- three types of fluorescent markers are used. Specifically, like the second fluorescent marker and the third fluorescent marker in FIG. 2, excitation wavelengths overlap. This assumes that different types of fluorescent markers are used. However, it goes without saying that even if the excitation wavelengths of the fluorescent markers used do not overlap, analysis by the present particle analyzer 100 is possible.
- the fluorescence emitted by the second fluorescent marker is yellow, which is the sum of green and red
- the fluorescence emitted by the third fluorescent marker is red
- the fluorescence emitted by the second fluorescent marker and the third fluorescent marker is yellow.
- this particle analyzer 100 includes a light irradiation section 2 that irradiates excitation light that excites each of multiple types of fluorescent markers, and detects fluorescence from each of the multiple types of fluorescent markers.
- the imaging unit 3 includes an imaging unit 3 that images particles, and an information processing device 4 that analyzes physical properties of particles using imaging data obtained by the imaging unit 3.
- the light irradiation unit 2 has a plurality of light sources 21, 22, and 23 that irradiate light with an excitation wavelength that excites multiple types of fluorescent markers.
- the light sources 21, 22, and 23 are, for example, laser light sources. Since this embodiment uses three types of fluorescent markers, it has three light sources 21, 22, and 23. Note that one light source may irradiate light including three excitation wavelengths. Further, the number of light sources may be changed as appropriate depending on the number of types of fluorescent markers used.
- the first light source 21 irradiates the first fluorescent marker with excitation light (for example, blue light) having an excitation wavelength ⁇ 1
- the second light source 22 irradiates the first fluorescent marker with excitation light having an excitation wavelength ⁇ 2.
- the third light source 23 emits excitation light (for example, red light) having an excitation wavelength ⁇ 3 of the third fluorescent marker.
- the excitation wavelengths ⁇ 1, ⁇ 2, and ⁇ 3 are different from the fluorescence wavelengths ⁇ 1', ⁇ 2', and ⁇ 3' of the fluorescence emitted by the three types of fluorescent markers, respectively.
- the light emitted from each of these light sources 21, 22, and 23 is guided to the cell 1 via an irradiation optical system 24 including reflective mirrors 241, 242, half mirrors 243, 244, a condensing lens 245, and the like.
- These light sources 21, 22, and 23 are controlled by a control unit (not shown) so as to sequentially irradiate light with excitation wavelengths ⁇ 1, ⁇ 2, and ⁇ 3 corresponding to each fluorescent marker. Note that these light sources 21, 22, and 23 can also be controlled so that they emit light at the same time.
- the imaging unit 3 images the particles to which the fluorescent marker is added by detecting the fluorescence emitted by the fluorescent marker, and outputs, for example, image data as the imaging data.
- the imaging unit 3 has color discrimination ability, and in this embodiment is an imaging camera having a color CCD.
- the light irradiation direction of the light irradiation section 2 and the imaging direction of the imaging section 3 are provided to be orthogonal to each other, but the invention is not limited to this.
- the excitation light is scattered by the particles, and if the scattered light is detected by the imaging unit 3, the above-mentioned fluorescence detection will be inhibited.
- the particle analyzer 100 cuts off the excitation light from each of the light sources 21, 22, and 23, as shown in FIGS. 1 and 3. , is provided with one or more filters 5 that transmit fluorescence of a plurality of colors emitted by the plurality of types of fluorescent markers described above.
- a filter group 5 (hereinafter referred to as bandstop filter 5) made up of a plurality of filters stacked one on top of the other is provided between the cell 1 and the imaging unit 3.
- the imaging unit 3 detects the fluorescence that has passed through the bandstop filter 5 in a state where no excitation light is detected.
- the bandstop filter 5 has a wavelength range that is longer than the shortest excitation wavelength ⁇ 1 among the excitation lights from the plurality of light sources 21, 22, and 23, and a wavelength range that is transmitted rather than a wavelength range that is cut. It is designed to be wider. Note that here, all the light in the wavelength region shorter than the shortest excitation wavelength ⁇ 1 among the excitation lights is cut, but the transmittance in this short wavelength region may be changed as appropriate.
- the band stop filter 5 is a stack of at least a plurality of notch filters, including a first filter that transmits wavelengths longer than the shortest excitation wavelength ⁇ 1 and a first filter that cuts off the next shortest excitation wavelength ⁇ 2. It is formed by overlapping a second filter and a third filter that cuts the longest excitation wavelength ⁇ 3.
- the band stop filter 5 transmits fluorescence of various wavelengths (various colors) while cutting at least excitation wavelengths ⁇ 1, ⁇ 2, and ⁇ 3.
- the information processing device 4 is a computer equipped with a CPU, memory, display, various input/output devices, etc., and is connected to the imaging unit 3 by wire or wirelessly.
- the information processing device 4 By executing the particle analysis program stored in the memory, the information processing device 4 has a particle identification section 41, a fluorescence identification section 42, an analysis section 43, and a display section 44, as shown in FIG. It has the function of
- the particles to be measured contained in the sample are multi-stained.
- a step of stirring the sample may be provided before adding the fluorescent marker.
- the light irradiation unit 2 irradiates the sample in the cell 1 with excitation light having excitation wavelengths ⁇ 1, ⁇ 2, and ⁇ 3 corresponding to each of the plurality of types of fluorescent markers, and the resulting fluorescence is imaged by the imaging unit 3. .
- excitation light having excitation wavelengths ⁇ 1, ⁇ 2, and ⁇ 3 is sequentially irradiated.
- the first frame of the image data obtained by the imaging section 3 is set to the first frame, as shown in FIG.
- the excitation light switching timing and the frame length of the imaging unit 3 are not limited to the above-mentioned embodiments.
- the first group of image data consisting of multiple frames is A second group of image data consisting of a plurality of subsequent frames is obtained by irradiating excitation light with a second excitation wavelength ⁇ 2, and a third group of image data consisting of a subsequent plurality of frames.
- the image data may be obtained by irradiating excitation light with the third excitation wavelength ⁇ 3.
- three consecutive frames of image data include particles to which only the first fluorescent marker A has been added, particles to which only the second fluorescent marker B has been added, and particles to which only the second fluorescent marker B has been added.
- the particles are depicted as if they are stationary between each frame, but in reality, the excitation light with the first excitation wavelength ⁇ 1, the excitation light with the second excitation wavelength ⁇ 2,
- the time for irradiating each of the excitation lights with the third excitation wavelength ⁇ 3 is the time for the imaging unit 3 to acquire one frame of image data, and is a very short time, so the movement of the particles during this time is also slight. be.
- the first fluorescent marker A emits fluorescence when it is irradiated with excitation light of a first excitation wavelength
- the second fluorescent marker B emits fluorescence when it is irradiated with excitation light of a second excitation wavelength. shall emit fluorescence when irradiated with it.
- the particle identification unit 41 identifies particles emitting fluorescence from fluorescence image data obtained by the imaging unit 3. In other words, particles to which fluorescent markers have been added are identified.
- This particle identifying unit 41 uses multiple frames of image data to identify the position, size, or range of particles depicted in the image data. Specifically, the particle specifying unit 41 performs image processing on the image data to distinguish between particles to which a fluorescent marker emitting fluorescence is added and other areas, and specify the positions of the particles.
- the particle identification unit 41 identifies particles to which the first fluorescent marker A has been added from the image data of the first frame, and particles to which the second fluorescent marker B has been added from the image data of the second frame. Identify the particles that are present. On the other hand, in the image data of the third frame, no fluorescent marker emitting fluorescence is imaged, and there are no particles identified by the particle identifying unit 41.
- the light emission state shown in FIG. 5 may not necessarily be achieved depending on the types of the first fluorescent marker A and the second fluorescent marker B.
- the excitation wavelength of fluorescent marker A and the excitation wavelength of fluorescent marker B may If they overlap, as shown in FIG. 6, there may be a light emitting state in which fluorescence from different fluorescent markers is captured in the same frame. In this case, if the image data is monochrome, it is not possible to classify each particle.
- the fluorescence identifying section 42 uses the color discrimination ability of the imaging section 3 described above to identify fluorescence information, which is information regarding the fluorescence of the fluorescent marker added to the particles identified by the particle identifying section 41.
- this fluorescence information may be color information regarding the color of fluorescence, or may be information specified based on the color information (for example, the type of fluorescent marker).
- the fluorescence information may include the intensity of fluorescence in order to obtain information on the amount of fluorescent marker added to the particles.
- the fluorescence identifying unit 42 of this embodiment acquires the output value from the color CCD of the imaging unit 3, and calculates the color (hue) of the fluorescence reflected in the image data using, for example, RGB or HSV. It is converted into a numerical value based on a formula, etc., and the numerical value is obtained as fluorescence information of the fluorescent marker.
- the numerically expressed hue may be, for example, a hue angle expressed by a color space or the like.
- the fluorescence information may include numerical values of the brightness or chroma of fluorescence.
- the fluorescence identifying unit 42 When focusing on one of the particles identified by the particle identifying unit 41, the fluorescence identifying unit 42 adds to the particle the averaged color information of a plurality of pixels representing the one particle included in the image data. This is the fluorescence information of the fluorescent marker.
- the fluorescence identification unit 42 totals the numerical hue of each of a plurality of pixels representing one particle, and divides the total value by the number of pixels, thereby identifying the one particle. It may also be one that calculates fluorescence information.
- the fluorescence identifying unit 42 sums up the output values of the color CCDs corresponding to each of a plurality of pixels representing one particle, and divides the total value by the number of pixels, thereby determining the output value.
- an average value may be calculated, and a hue digitized by the average value may be calculated as fluorescence information.
- the center part of the pixel representing one particle included in the image data may be blown out.
- the fluorescence information is calculated using the color information of the central pixel, there is a concern that the reliability of the fluorescence information will decrease.
- the fluorescence identification unit 42 averages the color information of the pixels excluding at least the pixel located in the center among the plurality of pixels representing one particle to make the fluorescence information more reliable. It may be configured to acquire information.
- the information processing device 4 of this embodiment may further include a marker data storage unit that stores marker data that associates the hue of fluorescence emitted by a fluorescent marker with the type of the fluorescent marker.
- the fluorescence specifying section 42 is configured to add the fluorescent light added to the particles specified by the particle specifying section 41 based on the hue of the fluorescence obtained from the image data and the marker data stored in the marker data storage section.
- the type of fluorescent marker present may be specified as fluorescence information.
- the fluorescence information of each fluorescence that is, each It is possible to determine the hue of the fluorescence emitted by the fluorescent markers or the type of each fluorescent marker.
- the analysis unit 43 acquires imaging data from the imaging unit 3 and analyzes the physical properties of particles based on this imaging data. Specifically, for each fluorescence information identified by the fluorescence identification unit 42, The physical properties of the particles to which the fluorescent marker is added are analyzed. That is, the analysis section 43 analyzes the physical properties of particles contained in a sample by separating them into types of particles.
- the analysis unit 43 here calculates the particle size distribution using the PTA method, and more specifically, calculates the particle size distribution by calculating the diffusion rate due to Brownian motion of the particles based on the imaging data. It is something to do. Note that the analysis section 43 does not necessarily need to calculate the particle size distribution, and may instead calculate the particle size of the particles as a physical property, for example.
- the display section 44 displays the analysis results of the analysis section 43 on a display D or the like, and specifically displays the particle size distribution or particle diameter of the particles in a manner that can be identified by, for example, fluorescence information of a fluorescent marker. .
- a specific embodiment of the display section 44 displays a graph in which one axis is set to fluorescence information and the other axis is set to physical properties of particles, and each particle is displayed on the graph.
- An example of an embodiment is to display a plot showing .
- one axis represents fluorescence color information, which is fluorescence information, expressed as a color gradation using a color scale, and the other axis represents particle size (particle diameter). Note that the other axis may be the number of particles.
- a plurality of types of fluorescent markers are used, and the physical properties of particles can be analyzed for each excitation light having excitation wavelengths ⁇ 1, ⁇ 2, and ⁇ 3 corresponding to each fluorescent marker.
- a graph showing the third analysis result obtained by irradiation with wavelength ⁇ 3 is displayed on the same screen for comparison.
- the display unit 44 may display graphs indicating the respective analysis results in a switchable manner.
- An example of an embodiment is to display a graph set to fluorescence information obtained by irradiating excitation light with a different excitation wavelength, and to display a plot showing each particle on the graph.
- one axis and the other axis represent fluorescence color information, which is fluorescence information, using a color gradation based on a color scale.
- This display section 44 displays a graph corresponding to a combination of two types of excitation wavelengths selected from the excitation wavelengths corresponding to each fluorescent marker.
- three types of excitation wavelengths ⁇ 1 For example, three graphs corresponding to three combinations of two types from ⁇ 2 and ⁇ 3 are displayed on the same screen for comparison.
- the display section 44 may switchably display graphs showing the respective analysis results, or may display plots showing each particle on a three-dimensional graph using three axes. Note that in a graph using three axes, the first, second, and third axes may be appropriately combined from among various parameters such as hue, number of particles, and particle diameter.
- the display section 44 may display each of the above-mentioned plots in a selectable manner, as shown in FIG. 7, for example.
- the display unit 44 displays analysis results such as particle size distribution obtained for particles indicated by those plots. , may be configured to be displayed on the same screen as the above-mentioned graph or on a different screen.
- the display unit 44 displays an enlarged image obtained by cutting out particles shown by the selected one or more plots from the image data, which is the same as the above-mentioned graph. It may be configured to be displayed on a separate screen or on a separate screen.
- the band stop filter 5 is used to cut each of the excitation lights while transmitting fluorescence of a plurality of colors. Since the image is taken by the imaging unit 3 which has the ability to discriminate colors to image the fluorescent light that has passed through it, even if the excitation wavelengths of different fluorescent markers overlap, as shown in FIG. Even if they are different colors, you can distinguish between them. This makes it possible to analyze each particle by type without the need for pretreatment to separate particles by type, and while suppressing the increase in size and cost of the equipment. contribute to
- the bandstop filter 5 is formed by stacking a plurality of notch filters, and manufacturing costs can be kept low.
- the band stop filter 5 is configured so that in a wavelength range longer than the shortest excitation wavelength ⁇ 1, the wavelength range to be transmitted is wider than the wavelength range to be cut, it is possible to transmit fluorescence of various colors. can be done. This makes it possible to use the same bandstop filter 5 for various fluorescent markers, thereby reducing the number of parts and cost.
- the imaging unit 3 may have a configuration in which a plurality of combinations of a filter that transmits fluorescence of a certain color and a CCD camera are provided, but the imaging unit 3 of this embodiment has a color CCD, and the optical design is It can be made simpler.
- the light irradiation unit 2 sequentially switches excitation light having excitation wavelengths corresponding to multiple types of fluorescent markers and irradiates the sample, it is possible to accurately analyze each type of particle to which a fluorescent marker has been added. .
- the analysis unit 43 analyzes the physical properties of the particles to which the fluorescent marker is added for each fluorescence information of the fluorescent marker specified by the fluorescence identification unit 42, so the physical properties of the particles contained in the sample can be analyzed for each type of particle. It can be divided into parts and analyzed.
- the display unit 44 displays a graph in which one axis is set to fluorescence information and the other axis is set to physical properties of particles, and also displays a plot showing each particle on the graph, so that a certain fluorescent marker is added. Variations in physical properties such as particle size can be grasped at a glance.
- the display section 44 is set such that one axis is set to fluorescence information obtained by irradiating the sample with excitation light of a certain excitation wavelength, and the other axis is set to fluorescence information obtained by irradiating the sample with excitation light of a different excitation wavelength. Since a graph set for fluorescence information is displayed and a plot showing each particle is displayed on the graph, the fluorescence information of each of the various particles contained in the sample can be displayed with good visibility.
- the display section 44 displays each plot in a selectable manner, and when one or more plots are selected, displays the analysis results of the analysis section 43 for the particles indicated by those plots, so that the particles of interest can be checked. Analysis results can be easily displayed, improving operability.
- the display unit 44 displays an enlarged image of the particles indicated by those plots cut out from the image data, so by checking the enlarged image, you can For example, it is possible to check whether the size of the particles reflected in the image, the color of the fluorescence, etc. are within the expected range.
- the imaging unit 3 only needs to have color discrimination ability, and may have a configuration including a plurality of combinations of a CCD camera and a filter that transmits fluorescence of a certain color.
- the analysis section 43 is not limited to measuring the particle size distribution or particle size, but also measures various characteristics of particles, such as the number concentration of particles and gel properties such as the average lattice spacing of the gel from the autocorrelation function. I don't mind it as something to analyze.
- a plurality of filters cut each of the excitation lights while transmitting a plurality of colors of fluorescence emitted by a plurality of types of fluorescent markers, but a single filter cuts each of the excitation lights. While cutting, multiple colors of fluorescence emitted by multiple types of fluorescent markers may be transmitted.
- the display section 44 has a function of displaying each of the graphs described in the above embodiment, a function of displaying analysis results for the particles indicated by the selected plot, and a function of displaying an enlarged image of the particles indicated by the selected plot. It is not necessary to have all of the functions, and which functions are to be performed may be changed as appropriate.
- the imaging unit 3 detects fluorescence while cutting off the excitation light, but it is also possible to detect the fluorescence and also detect the scattered light that is scattered by hitting particles. good.
- a fourth light source is used to irradiate the sample with light having a fourth wavelength ⁇ 4 that passes through one or more filters.
- the analysis unit 43 may be configured to determine the diffusion rate due to Brownian motion of the particles contained in the sample from the image data of the scattered light obtained by the imaging unit 3, and analyze the physical properties of the particles. good. With this, it is possible to analyze the physical properties of particles using both fluorescence and scattered light, so you can analyze more diverse physical properties and a wider variety of particles (for example, particles to which no fluorescent marker has been added). It becomes possible to do so.
- the first frame of image data obtained by the imaging unit 3 is The one obtained by irradiating the excitation light with the first excitation wavelength ⁇ 1, the one obtained by irradiating the second frame with the excitation light with the second excitation wavelength ⁇ 2, and the one obtained by irradiating the third frame with the excitation light with the third excitation wavelength ⁇ 3. It can be obtained by irradiating light, and it can be obtained by irradiating the fourth frame with light of the fourth wavelength ⁇ 4.
- the light irradiation section 2 has a plurality of light sources 21, 22, and 23 in the embodiment, but as described with reference to FIG. 6, the excitation wavelengths of fluorescence of a plurality of colors overlap. If necessary, fluorescence of a plurality of colors may be observed using one light source that emits excitation light of a predetermined excitation wavelength.
- the information processing device 4 has a function as an analysis information storage section set in a predetermined area of the memory, and various information related to analysis may be stored in this analysis information storage section.
- the information stored in the analysis information storage section is information regarding the particles specified by the particle specifying section 41, and an example thereof is shown in FIG. 9. That is, this analysis information storage unit links the identification number indicating the particle specified by the particle identification unit 41, and determines the diameter of the particle and the color when the excitation light of each excitation wavelength ⁇ 1, ⁇ 2, ⁇ 3 is incident.
- the RGB output values output from the CCD, the hue information (in this case, hue angle) calculated using those output values, the X and Y coordinates of the center of gravity where the particle first appears in the image data, etc. can be mentioned. Of course, it is not necessary to store all of them, and you may select them as appropriate.
- the analysis information storage unit may store, for example, the first image data showing the particle in association with the above-mentioned identification number.
- the size and cost of the apparatus can be suppressed while being suppressed.
- Each particle can be analyzed by type.
Landscapes
- Chemical & Material Sciences (AREA)
- Life Sciences & Earth Sciences (AREA)
- Dispersion Chemistry (AREA)
- Physics & Mathematics (AREA)
- Health & Medical Sciences (AREA)
- Analytical Chemistry (AREA)
- Biochemistry (AREA)
- General Health & Medical Sciences (AREA)
- General Physics & Mathematics (AREA)
- Immunology (AREA)
- Pathology (AREA)
- Signal Processing (AREA)
- Engineering & Computer Science (AREA)
- Investigating, Analyzing Materials By Fluorescence Or Luminescence (AREA)
Priority Applications (3)
| Application Number | Priority Date | Filing Date | Title |
|---|---|---|---|
| EP23779198.3A EP4467962A4 (en) | 2022-03-31 | 2023-03-02 | PARTICLE ANALYSIS DEVICE, PARTICLE ANALYSIS METHOD AND PARTICLE ANALYSIS PROGRAM |
| US18/841,496 US20250180462A1 (en) | 2022-03-31 | 2023-03-02 | Particle analyzing device, particle analysis method, and particle analysis program |
| JP2024511541A JPWO2023189169A1 (cg-RX-API-DMAC7.html) | 2022-03-31 | 2023-03-02 |
Applications Claiming Priority (2)
| Application Number | Priority Date | Filing Date | Title |
|---|---|---|---|
| JP2022058172 | 2022-03-31 | ||
| JP2022-058172 | 2022-03-31 |
Publications (1)
| Publication Number | Publication Date |
|---|---|
| WO2023189169A1 true WO2023189169A1 (ja) | 2023-10-05 |
Family
ID=88201174
Family Applications (1)
| Application Number | Title | Priority Date | Filing Date |
|---|---|---|---|
| PCT/JP2023/007791 Ceased WO2023189169A1 (ja) | 2022-03-31 | 2023-03-02 | 粒子分析装置、粒子分析方法、及び粒子分析用プログラム |
Country Status (4)
| Country | Link |
|---|---|
| US (1) | US20250180462A1 (cg-RX-API-DMAC7.html) |
| EP (1) | EP4467962A4 (cg-RX-API-DMAC7.html) |
| JP (1) | JPWO2023189169A1 (cg-RX-API-DMAC7.html) |
| WO (1) | WO2023189169A1 (cg-RX-API-DMAC7.html) |
Citations (7)
| Publication number | Priority date | Publication date | Assignee | Title |
|---|---|---|---|---|
| JP2005245317A (ja) * | 2004-03-04 | 2005-09-15 | Mitsubishi Electric Corp | 微生物の計測装置及び計測方法 |
| US20080085550A1 (en) * | 2006-10-06 | 2008-04-10 | The Regents Of The University Of California | Apparatus and method for tracking a molecule or particle in three dimensions |
| JP2012088304A (ja) * | 2010-09-24 | 2012-05-10 | Shin Nippon Air Technol Co Ltd | 生物粒子評価装置及び生物粒子評価方法 |
| JP2014521967A (ja) * | 2011-08-05 | 2014-08-28 | ナノサイト・リミテッド | 粒子の光学的な検出および解析 |
| WO2019230636A1 (ja) * | 2018-06-01 | 2019-12-05 | 株式会社堀場製作所 | 粒子撮像装置、粒子径測定装置、複式粒子径測定装置、コンピュータプログラム、粒子観察方法、及び複式粒子測定装置 |
| JP2020204604A (ja) | 2019-06-12 | 2020-12-24 | 株式会社堀場製作所 | 粒子分析装置及び粒子分析方法 |
| WO2022185592A1 (ja) * | 2021-03-05 | 2022-09-09 | 株式会社堀場製作所 | ウィルス性粒子測定方法及びウィルス性粒子測定装置 |
Family Cites Families (7)
| Publication number | Priority date | Publication date | Assignee | Title |
|---|---|---|---|---|
| SE0003841D0 (sv) * | 2000-10-20 | 2000-10-20 | Daniel Chiu | A method and apparatus for penetration of lipid bilayer membranes |
| US7352900B2 (en) * | 2003-10-22 | 2008-04-01 | Sysmex Corporation | Apparatus and method for processing particle images and program product for same |
| CA2724933A1 (en) * | 2007-06-04 | 2008-12-11 | University Of Maryland, Baltimore County | Fluorescence microscope in a microwave cavity |
| JP5537347B2 (ja) * | 2009-11-30 | 2014-07-02 | シスメックス株式会社 | 粒子分析装置 |
| CN106716125B (zh) * | 2014-06-03 | 2020-10-09 | 加利福尼亚大学董事会 | 纳米颗粒分析器 |
| JP2021124397A (ja) * | 2020-02-05 | 2021-08-30 | 日本光電工業株式会社 | 粒子分析方法および粒子分析装置 |
| EP4502573A4 (en) * | 2022-03-31 | 2026-03-11 | Horiba Ltd | PARTICLE ANALYSIS DEVICE, PARTICLE ANALYSIS DEVICE PROGRAM, AND PARTICLE ANALYSIS METHOD |
-
2023
- 2023-03-02 JP JP2024511541A patent/JPWO2023189169A1/ja active Pending
- 2023-03-02 US US18/841,496 patent/US20250180462A1/en active Pending
- 2023-03-02 EP EP23779198.3A patent/EP4467962A4/en active Pending
- 2023-03-02 WO PCT/JP2023/007791 patent/WO2023189169A1/ja not_active Ceased
Patent Citations (7)
| Publication number | Priority date | Publication date | Assignee | Title |
|---|---|---|---|---|
| JP2005245317A (ja) * | 2004-03-04 | 2005-09-15 | Mitsubishi Electric Corp | 微生物の計測装置及び計測方法 |
| US20080085550A1 (en) * | 2006-10-06 | 2008-04-10 | The Regents Of The University Of California | Apparatus and method for tracking a molecule or particle in three dimensions |
| JP2012088304A (ja) * | 2010-09-24 | 2012-05-10 | Shin Nippon Air Technol Co Ltd | 生物粒子評価装置及び生物粒子評価方法 |
| JP2014521967A (ja) * | 2011-08-05 | 2014-08-28 | ナノサイト・リミテッド | 粒子の光学的な検出および解析 |
| WO2019230636A1 (ja) * | 2018-06-01 | 2019-12-05 | 株式会社堀場製作所 | 粒子撮像装置、粒子径測定装置、複式粒子径測定装置、コンピュータプログラム、粒子観察方法、及び複式粒子測定装置 |
| JP2020204604A (ja) | 2019-06-12 | 2020-12-24 | 株式会社堀場製作所 | 粒子分析装置及び粒子分析方法 |
| WO2022185592A1 (ja) * | 2021-03-05 | 2022-09-09 | 株式会社堀場製作所 | ウィルス性粒子測定方法及びウィルス性粒子測定装置 |
Non-Patent Citations (1)
| Title |
|---|
| See also references of EP4467962A4 |
Also Published As
| Publication number | Publication date |
|---|---|
| EP4467962A4 (en) | 2026-01-21 |
| JPWO2023189169A1 (cg-RX-API-DMAC7.html) | 2023-10-05 |
| EP4467962A1 (en) | 2024-11-27 |
| US20250180462A1 (en) | 2025-06-05 |
Similar Documents
| Publication | Publication Date | Title |
|---|---|---|
| JP6612050B2 (ja) | 血液分析装置、診断支援方法、およびコンピュータプログラム | |
| US11022537B2 (en) | Information processing apparatus, information processing method, and information processing system | |
| JP5433517B2 (ja) | 解析装置及び解析方法 | |
| CN109916802B (zh) | 血液分析方法及血液分析装置 | |
| CN109387492B (zh) | 试样分析装置及试样分析方法 | |
| EP3388820B1 (en) | Fluorescence image analyzing apparatus and method of analyzing fluorescence image | |
| WO2017046988A1 (en) | Information processing apparatus, information processing method, and information processing system | |
| CN103649717A (zh) | 细胞分析装置 | |
| CN114739958A (zh) | 荧光图像显示方法以及荧光图像分析装置 | |
| US9558551B2 (en) | Image measurement apparatus and image measurement method for determining a proportion of positive cell nuclei among cell nuclei included in a pathologic examination specimen | |
| JP5953195B2 (ja) | 撮影解析装置、その制御方法及び撮影解析装置用のプログラム | |
| JP2008185354A (ja) | 色識別装置および色識別方法 | |
| JP2019086524A (ja) | 蛍光画像分析装置及び蛍光画像の分析方法 | |
| EP4467962A1 (en) | Particle analyzing device, particle analysis method, and particle analysis program | |
| JP2007327928A (ja) | 細胞周期弁別方法、その画像処理システム、及びそのプログラム | |
| JP2012168085A (ja) | 特定生物成分検出方法 | |
| JP5975074B2 (ja) | データ表示方法、プログラム、データ解析装置及び微小粒子分析システム | |
| US20250164378A1 (en) | Particle analysis device, particle analysis device program, and particle analysis method | |
| JP2020165766A (ja) | 蛍光画像分析装置及び蛍光画像分析方法 | |
| JP2012168088A (ja) | 蛍光反応検出装置 | |
| JP2012193988A (ja) | 蛍光反応検出装置 | |
| JP7229312B2 (ja) | 蛍光画像の分析方法及び蛍光画像分析装置 | |
| JP2020165765A (ja) | 蛍光画像分析装置及び蛍光画像分析方法 | |
| JP2023149681A (ja) | 粒子分析装置 | |
| JPWO2023189169A5 (cg-RX-API-DMAC7.html) |
Legal Events
| Date | Code | Title | Description |
|---|---|---|---|
| 121 | Ep: the epo has been informed by wipo that ep was designated in this application |
Ref document number: 23779198 Country of ref document: EP Kind code of ref document: A1 |
|
| WWE | Wipo information: entry into national phase |
Ref document number: 2024511541 Country of ref document: JP |
|
| WWE | Wipo information: entry into national phase |
Ref document number: 2023779198 Country of ref document: EP |
|
| ENP | Entry into the national phase |
Ref document number: 2023779198 Country of ref document: EP Effective date: 20240821 |
|
| WWE | Wipo information: entry into national phase |
Ref document number: 18841496 Country of ref document: US |
|
| NENP | Non-entry into the national phase |
Ref country code: DE |
|
| WWP | Wipo information: published in national office |
Ref document number: 18841496 Country of ref document: US |