WO2023026523A1 - Procédé d'analyse spectroscopique raman et dispositif de spectroscopie raman microscopique - Google Patents
Procédé d'analyse spectroscopique raman et dispositif de spectroscopie raman microscopique Download PDFInfo
- Publication number
- WO2023026523A1 WO2023026523A1 PCT/JP2022/009071 JP2022009071W WO2023026523A1 WO 2023026523 A1 WO2023026523 A1 WO 2023026523A1 JP 2022009071 W JP2022009071 W JP 2022009071W WO 2023026523 A1 WO2023026523 A1 WO 2023026523A1
- Authority
- WO
- WIPO (PCT)
- Prior art keywords
- irradiation
- scattering intensity
- total scattering
- wavenumber range
- raman
- Prior art date
Links
- 238000001069 Raman spectroscopy Methods 0.000 title claims abstract description 136
- 238000000034 method Methods 0.000 title claims abstract description 29
- 238000004611 spectroscopical analysis Methods 0.000 title claims abstract description 28
- 238000005259 measurement Methods 0.000 claims abstract description 50
- 238000004458 analytical method Methods 0.000 claims abstract description 40
- 238000001228 spectrum Methods 0.000 claims description 23
- 238000004364 calculation method Methods 0.000 claims description 13
- 230000003287 optical effect Effects 0.000 claims description 12
- 238000012417 linear regression Methods 0.000 claims description 9
- 238000001514 detection method Methods 0.000 claims description 6
- 230000001678 irradiating effect Effects 0.000 claims description 5
- 238000012916 structural analysis Methods 0.000 description 10
- 238000010586 diagram Methods 0.000 description 8
- 239000000126 substance Substances 0.000 description 6
- 238000012634 optical imaging Methods 0.000 description 5
- 238000001237 Raman spectrum Methods 0.000 description 4
- 238000001530 Raman microscopy Methods 0.000 description 3
- 238000003763 carbonization Methods 0.000 description 3
- OKTJSMMVPCPJKN-UHFFFAOYSA-N Carbon Chemical compound [C] OKTJSMMVPCPJKN-UHFFFAOYSA-N 0.000 description 2
- 229910052799 carbon Inorganic materials 0.000 description 2
- 230000007423 decrease Effects 0.000 description 2
- 230000035508 accumulation Effects 0.000 description 1
- 238000009825 accumulation Methods 0.000 description 1
- 230000000295 complement effect Effects 0.000 description 1
- 239000012141 concentrate Substances 0.000 description 1
- 238000000354 decomposition reaction Methods 0.000 description 1
- 230000005284 excitation Effects 0.000 description 1
- 238000005286 illumination Methods 0.000 description 1
- 230000010365 information processing Effects 0.000 description 1
- 238000000691 measurement method Methods 0.000 description 1
- 229910044991 metal oxide Inorganic materials 0.000 description 1
- 150000004706 metal oxides Chemical class 0.000 description 1
- 238000001000 micrograph Methods 0.000 description 1
- 230000003647 oxidation Effects 0.000 description 1
- 238000007254 oxidation reaction Methods 0.000 description 1
- 238000010187 selection method Methods 0.000 description 1
- 239000004065 semiconductor Substances 0.000 description 1
- 238000005979 thermal decomposition reaction Methods 0.000 description 1
Images


Classifications
-
- G—PHYSICS
- G01—MEASURING; TESTING
- G01N—INVESTIGATING OR ANALYSING MATERIALS BY DETERMINING THEIR CHEMICAL OR PHYSICAL PROPERTIES
- G01N21/00—Investigating or analysing materials by the use of optical means, i.e. using sub-millimetre waves, infrared, visible or ultraviolet light
- G01N21/62—Systems in which the material investigated is excited whereby it emits light or causes a change in wavelength of the incident light
- G01N21/63—Systems in which the material investigated is excited whereby it emits light or causes a change in wavelength of the incident light optically excited
- G01N21/65—Raman scattering
Definitions
- the present invention relates to a Raman spectroscopic analysis method and a micro Raman spectroscopic device.
- a Raman spectrometer is a measurement method that realizes structural analysis of a sample by spectroscopically analyzing Raman scattered light with different wavelengths generated from the sample when irradiated with an excitation laser (for example, Patent Document 1).
- micro-Raman spectroscopy has been developed as a means for analyzing the chemical structure of minute parts, and has been widely applied in recent years.
- Raman scattered light has an extremely low intensity compared to laser light, so it is necessary to use high-intensity laser light.
- the S/N ratio of the spectrum obtained from the low intensity of Raman scattered light is also low. Therefore, it is necessary to obtain a high S/N ratio by irradiating a sample to be analyzed with a laser beam a plurality of times, measuring Raman scattered light a plurality of times, and integrating the results.
- the laser light will damage the sample to be analyzed.
- the sample to be analyzed is an organic substance
- the sample may be burnt out due to carbonization or thermal decomposition due to irradiation with laser light.
- the area irradiated with the laser beam concentrates on an extremely small area, so burning damage to the sample to be analyzed becomes significant.
- the present invention specifies the number of laser light irradiation times at which a sample to be analyzed is damaged by laser light during multiple Raman spectroscopic measurements, and uses Raman scattered light data obtained when the sample to be analyzed is in an undamaged state.
- An object of the present invention is to provide a Raman spectroscopic analysis method for structural analysis of a sample to be analyzed.
- a further object of the present invention is to provide a microscopic Raman spectroscopic apparatus for performing the Raman spectroscopic analysis method.
- the present invention irradiating a sample to be analyzed with an objective optical element with a laser beam emitted from a laser light source; Obtaining Raman scattered light from the sample to be analyzed, Spectroscopy the obtained Raman scattered light to determine the total scattered intensity in a specific wavenumber range, Repeating the step of obtaining the total scattering intensity in a specific wavenumber range from the irradiation of the laser light a plurality of times, Obtaining the ratio of the total scattering intensity in the specific wavenumber range of each irradiation to the total scattering intensity in the specific wavenumber range of the first irradiation, Obtaining a correlation coefficient between the total scattering intensity in the specific wavenumber range for the first time and the total scattering intensity in the specific wavenumber range for each irradiation, At least one of the number of measurements, the total scattering intensity for each of the irradiation times, or the ratio of the total scattering intensity in the specific wavenumber range for each irradiation
- the present invention laser light source, microscope optics, a plate for fixing the sample to be analyzed; having a spectrometer, and a Raman scattered light detection system, a storage unit that stores the number of times of laser light irradiation and the Raman scattered light spectrum at that time; A calculation unit that calculates the total scattering intensity of Raman scattered light in a specific wavenumber range for each laser light irradiation, A computing unit that obtains a ratio of the total scattering intensity in the specific wavenumber range of each irradiation to the total scattering intensity in the specific wavenumber range of the first irradiation; a calculation unit for obtaining a correlation coefficient between the first total scattering intensity in the specific wavenumber range and the total scattering intensity in the specific wavenumber range for each number of times of irradiation; and At least one of the relationship between the scattering intensity or the ratio of the total scattering intensity in the specific wavenumber range of each irradiation time to the total scattering intensity in the specific wavenumber
- the data of Raman scattered light obtained before the sample to be analyzed is damaged by laser light during Raman spectroscopy is identified, and the structure of the sample to be analyzed is analyzed only from the data of Raman scattered light before damage.
- a method of Raman spectroscopy is provided.
- a microscopic Raman spectroscopic apparatus for executing the Raman spectroscopic analysis method.
- FIG. 4 is a schematic diagram showing changes in Raman spectrum before and after a sample to be analyzed is damaged by laser light. It is a schematic diagram when Sn or sn is plotted with respect to n. It is a schematic diagram when r is plotted against n.
- BRIEF DESCRIPTION OF THE DRAWINGS It is a schematic diagram which shows one aspect
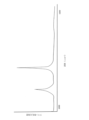
- FIG. 1 is a flow chart showing the Raman spectroscopic analysis method of the present invention using a microscopic Raman spectrometer. Steps 1 and 2 irradiate laser light onto a desired analysis target region of the analysis target sample with an objective optical element, obtain Raman scattered light from the analysis target sample, and spectroscopically obtain the obtained Raman scattered light. A Raman spectrum is obtained as shown schematically in FIG. 2 versus wavelength or wavenumber.
- the spectrum shown schematically in FIG. 2 can be obtained by repeating steps 1 to 3 multiple times.
- the sample to be analyzed is likely to be damaged by the laser light, such as decomposition, oxidation, and burning.
- the sample to be analyzed is an organic substance, burnout occurs and the damage caused by the laser beam becomes large.
- burning of the sample to be analyzed becomes significant.
- FIG. 3 schematically shows changes in the Raman scattering spectrum before and after the sample to be analyzed by laser light is burnt.
- the sample to be analyzed receives damage such as burnout due to laser light, the baseline of the Raman scattering spectrum rises.
- the sample to be analyzed is an organic substance, a D-band around 1350 cm ⁇ 1 and a G-band around 1590 cm ⁇ 1 appear due to carbonization of carbon.
- the originally obtained Raman scattering spectrum is small and broad, which may hinder structural analysis. Since the change in the Raman scattering spectrum due to damage progresses gradually, it is difficult to determine the number of times the laser light irradiation caused the damage, based only on the change in the spectrum. In addition, if it is found that the sample to be analyzed is damaged after the Raman analysis, the analysis may become useless, or the sample to be analyzed may need to be adjusted again.
- step 3 the total scattering intensity in a specific wavenumber range is obtained in the Raman scattering spectrum obtained in step 2.
- the wavenumber range does not need to obtain the total scattering intensity for all wavenumbers;
- step 4 Obtain the total scattering intensity, Sn, in the specific wavenumber range.
- the total scattering intensity corresponds to the area surrounded by the spectrum and the horizontal axis of the spectrum diagram in the specific wavenumber range. Expressed as an integral.
- Sn represents the total scattering intensity at the time of the n-th laser beam irradiation.
- steps 1 to 3 are repeated to obtain Sn for each irradiation of laser light.
- the number of times of irradiation, n, and the total scattering intensity, Sn may be stored so that it can be called up at an appropriate time, or n and Sn may be displayed on the display device for each number of times of irradiation.
- step 5 the intensity ratio of Sn to the total scattering intensity S1 at the time of the first laser beam irradiation, s n , is obtained.
- sn is represented by the following formula (1).
- Sn may be calculated each time Sn is obtained in step 4, or s2 to sn may be calculated collectively after the Raman spectroscopic measurement is completed.
- step 6 the correlation coefficient, r, between S1 and each Sn is determined.
- r is a coefficient used in statistical processing and is a value obtained by dividing covariance by standard deviation.
- the covariance is the value obtained by dividing the deviation of Sn by the number of measurements n
- the standard deviation is the square root of the sum of the squares of the differences between the average value of the total scattering intensity obtained by n laser beam irradiations and each Sn.
- s n and r may be stored so that they can be called up at an appropriate time, or s n and r may be displayed simultaneously with n and Sn on the display device for each irradiation.
- step 7 the upper limit of n at which the sample to be analyzed is not damaged is determined from the relationship between Sn or sn and n and the relationship with r.
- the baseline of the Raman scattering spectrum rises when the sample to be analyzed is damaged. That is, Sn is constant until damage occurs, but after damage occurs, Sn increases as the baseline rises. s n similarly increases after the sample to be analyzed is damaged. Therefore, if n is specified at which Sn or sn increases, n-1 immediately preceding it becomes the upper limit of the number of times the sample to be analyzed is undamaged.
- n at which r becomes small it is possible to specify n at which the organic substance was damaged by burning.
- the number n-1 immediately before that is the upper limit of the number of times the sample to be analyzed is not damaged by burning.
- n and Sn or sn and the relationship between n and r can be determined by calling and comparing each n, Sn or sn , r whose numerical values have been stored so far, so that the sample to be analyzed is not damaged. A maximum number of times can be specified. Plotting Sn or sn against n and plotting r against n is visually helpful.
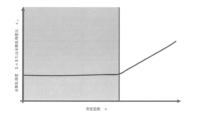
- FIGS. 4 and 5 schematically show the results when Sn or sn is plotted against n and r is plotted against n.
- Sn or sn when Sn or sn is plotted against n, the value of Sn or sn increases with respect to a certain n. n appears where the straight lines that were parallel change upward to the right. This n is the number of laser light irradiation times at which the sample to be analyzed was damaged.
- n is the number of times a new peak appears due to burnout or the like of the sample to be analyzed, and is the number of times the sample to be analyzed has been irradiated with laser light due to burnout.
- the analysis target It is possible to determine the number of laser light irradiation times at which the sample is burned, and to specify the upper limit number of times the sample to be analyzed is not burnt.
- n is the number of times of laser beam irradiation that causes Sn-Sn-1 ⁇ d or sn- s n-1 ⁇ d to cause burnout of the sample to be analyzed. A maximum number of times the sample has not suffered burnout may be specified. The same is true for r and n.
- FIG. 4 and FIG. 5 schematically show the results when Sn or sn is plotted against n and r is plotted against n, and in some cases the change is very small. Therefore, it is more accurate to identify the upper limit of the number of undamaged samples to be analyzed from the change in slope of the line by linear regression analysis of the plot of Sn or sn against n and the plot of r against n. It is preferable because the number of times can be specified.
- the number n of laser beam irradiations in which the sample to be analyzed is damaged is obtained by the above method, the number of laser beam irradiations in which the sample to be analyzed is not damaged can be specified up to the n ⁇ 1. Accurate analysis becomes possible by structural analysis of the sample to be analyzed using the data up to the first time. If each n and its Raman scattering spectrum are stored as described above, the Raman scattering spectrum up to the upper limit of the number of times of laser light irradiation at which the sample to be analyzed specified above is not damaged can be called up and analyzed.
- FIG. 6 shows a schematic diagram of a mode of a microscopic Raman spectrometer for carrying out the above analysis method.
- the microscopic Raman spectroscopic apparatus shown in FIG. 6 has a laser light source A, a microscope optical section 4, a plate 2 for fixing a sample to be analyzed, a spectroscope 5, and a Raman scattered light detection system 6.
- FIG. 6 further has a stage 3 for fixing the plate 2 and an optical imaging device 11 for displaying an image of the analysis field as a preferred embodiment.
- the microscopic Raman spectroscopic apparatus of the present invention includes a storage unit 7 for storing the number of times of laser light irradiation and the Raman scattered light spectrum at that time, and an operation for calculating the total scattering intensity of Raman scattered light in a specific wave number range for each laser light irradiation.
- Unit 81 computing unit 82 for calculating the ratio of the total scattering intensity in the specific wavenumber range of each irradiation to the total scattering intensity in the specific wavenumber range of the first irradiation, the total scattering intensity in the specific wavenumber range of the first irradiation
- a calculation unit 83 that obtains a correlation coefficient between the scattering intensity and the total scattering intensity in a specific wavenumber range for each number of times of irradiation, and the number of measurements and the total scattering intensity for each number of times of irradiation, or the A display unit that displays at least one of the relationship between the total scattering intensity in a specific wavenumber range and the ratio of the total scattering intensity in the specific wavenumber range of the number of irradiation times, and the relationship between the number of measurements and the correlation coefficient.
- the analysis unit 10 specifies the upper limit of the number of irradiations that does not damage the sample to be analyzed.
- a laser light source A is a light source for irradiating a laser beam for obtaining the Raman scattered light.
- the microscope optical part 4 can be exemplified by a structure in which an objective lens (not shown) that is a combination of a convex lens and a concave lens is combined as an objective optical element (not shown). 2 is focused on the sample to be measured.
- a Raman scattering hole reflected by the sample is guided to a spectroscope 5 and a Raman scattered light detection system 6 via a condenser lens (not shown) and a condenser spot (not shown).
- the Raman scattered light condensed by the condensing lens is focused on the condensed spot and guided to the spectroscope 5 .
- the microscope optical unit 4 which is a confocal optical system in which the positions of the light source A, the plate 2, and the focused spot are in a conjugate relationship, is preferable from the viewpoint of resolution.
- the optical imaging device 11 is, for example, a CCD (Charge Coupled Device) image sensor, a CMOS (Complementary Metal Oxide Semiconductor) image sensor, or the like, and is configured to be able to capture a still image or moving image of a sample.
- the optical imaging device can capture all or at least one of a bright-field image, a dark-field image, a phase-contrast image, a fluorescent image, a polarizing microscope image, etc. of the sample, depending on the configuration of the microscope optical unit 4 and transmitted illumination (not shown). can be imaged.
- the optical imaging device outputs the captured image to another information processing device or the like, if necessary.
- the microscopic Raman spectroscopy apparatus of the present invention has a storage unit 7 that stores the number of times of laser light irradiation, n, and the Raman scattering light spectrum at that time, Wn.
- the storage unit 7 is configured not only to store the values of n and Wn, but also to be able to call them when necessary.
- the storage unit 7 preferably stores n and Wn as a set of data.
- the microscopic Raman spectroscopic apparatus of the present invention has a computing unit 81, which is a part of the computing unit 8, for computing the total scattering intensity Sn of Raman scattered light in a specific wavenumber range for each laser beam irradiation.
- the method for obtaining Sn is as described above, and the calculation unit 81 is configured to calculate the Sn.
- the micro Raman spectroscopy apparatus of the present invention includes an arithmetic unit 82 which is a part of the arithmetic unit 8 for obtaining the ratio s n of the S 1 to Sn, and the arithmetic unit 8 for obtaining the correlation coefficient r between the S 1 and Sn has a computing unit 83 which is a part of.
- the computing units 81 to 83 may be the same computing device, or may be independent computing devices. s n and r are calculated as described above.
- Sn, s n , and r obtained by the calculation unit 8 may be sent to the storage unit 7 and stored therein.
- the display unit 9 displays the relationship between at least one of Sn or sn and the number of measurements n obtained by the arithmetic unit 8 and the relationship between n and r.
- Display methods include, for example, a method of displaying Sn or sn corresponding to n and n and r as a set, a method of displaying Sn or sn and r for n as a set, and the like. is preferably displayed by plotting Sn or sn against n and plotting r against n as described above. For example, when a diagram such as that schematically shown in FIG. 4 or 5 is displayed, it is easy to visually understand, and it is easy to determine the number of irradiation times in which the sample to be analyzed was damaged by the laser beam.
- the microscopic Raman spectroscopy apparatus of the present invention has a laser beam that does not damage the sample to be analyzed from the relationship between at least one of Sn or sn obtained by the arithmetic unit 8 and the number of measurements n, and the relationship between n and r. It has an analysis unit that specifies the upper limit of the number of times of irradiation.
- the method for specifying the upper limit of the number of times of laser light irradiation that does not damage the sample to be analyzed in the analysis unit 10 is as described above.
- the upper limit of the number of times of laser light irradiation that does not damage the obtained sample to be analyzed may be displayed on the display unit 9.
- the range of the number of times of laser light irradiation that does not damage the sample to be analyzed A plot of Sn or sn against displayed n or a plot of r against n may be displayed together.
- the plot of Sn or sn against n or the plot of r against n is displayed on the display unit 9 by displaying the range of the number of laser beam irradiations that does not damage the sample to be analyzed. You can select the range above.
- the storage unit 7 stores n, the Raman scattering spectrum, and Wn so that Wn corresponding to the range of n not damaged by the laser beam can be called from the storage unit 7.
- the display unit 9 and the analysis unit 10 may be linked with each other.
- the selection method may be such that the Raman scattering spectrum below the upper limit of the number of times of laser light irradiation that does not damage the sample to be analyzed specified by the analysis unit 10 can be automatically called from the storage unit 7, or the analyst can It may be called from the storage unit 7 by specifying the screen of the display unit 9 with a mouse or keyboard.
- the analyst selects the range, it is not necessary to specify the (n-1)th specified by the analysis unit 10, and the range may be selected by the analyst's judgment.
- the data of the Raman scattered light obtained before the sample to be analyzed is damaged by the laser light during the Raman spectroscopic measurement is determined, and only the data of the Raman scattered light before the damage is used to analyze the target Structural analysis of samples can be performed.
- the Raman spectroscopic analysis method of the present invention the data of the Raman scattered light obtained before the sample to be analyzed is damaged by the laser light during the Raman spectroscopic measurement is determined, and only the data of the Raman scattered light before the damage is obtained. Structural analysis of the sample to be analyzed can be performed. Further, according to the present invention, there is provided a microscopic Raman spectroscopic apparatus for executing the Raman spectroscopic analysis method.
- a laser light source irradiating a sample to be analyzed with an objective optical element with a laser beam emitted from a laser light source; Obtaining Raman scattered light from the sample to be analyzed, Spectroscopy the obtained Raman scattered light to determine the total scattered intensity in a specific wavenumber range, Repeating the step of obtaining the total scattering intensity in a specific wavenumber range from the irradiation of the laser light a plurality of times, Obtaining the ratio of the total scattering intensity in the specific wavenumber range of each irradiation to the total scattering intensity in the specific wavenumber range of the first irradiation, Obtaining a correlation coefficient between the total scattering intensity in the specific wavenumber range for the first time and the total scattering intensity in the specific wavenumber range for each irradiation, At least one of the number of measurements, the total scattering intensity for each of the irradiation times, or the ratio of the total scattering intensity in the specific wavenumber range for each
- the data of the Raman scattered light obtained before the sample to be analyzed is damaged by the laser light during the Raman spectroscopic measurement is determined, and only the data of the Raman scattered light before the damage is used to analyze the target.
- a method of Raman spectroscopy is provided for structural analysis of a sample.
- a laser light source ; microscope optics, a plate for fixing the sample to be analyzed; having a spectrometer, and a Raman scattered light detection system, a storage unit that stores the number of times of laser light irradiation and the Raman scattered light spectrum at that time;
- a calculation unit that calculates the total scattering intensity of Raman scattered light in a specific wavenumber range for each laser light irradiation,
- a computing unit that obtains a ratio of the total scattering intensity in the specific wavenumber range of each irradiation to the total scattering intensity in the specific wavenumber range of the first irradiation; a calculation unit for obtaining a correlation coefficient between the first total scattering intensity in the specific wavenumber range and the total scattering intensity in the specific wavenumber range for each number of times of irradiation; and At least one of the relationship between the scattering intensity or the ratio of the total scattering intensity in the
- the data of Raman scattered light obtained before the sample to be analyzed is damaged by the laser light during Mann spectrometry is determined, and only the data of Raman scattered light before damage is used to analyze the object
- a micro Raman spectroscopy apparatus capable of easily performing Raman spectroscopic analysis for structural analysis of a sample.
- the display unit indicates the number of times of measurement, the total scattering intensity for each of the irradiation times, or the total scattering intensity in the specific wavenumber range of each irradiation time with respect to the total scattering intensity in the specific wavenumber range of the first irradiation.
- the microscopic Raman spectroscopic device according to [6] above which plots and displays at least one of the ratio of intensities.
- the analysis unit measures the number of times of measurement, the total scattering intensity for each of the irradiation times, or the total scattering intensity in the specific wavenumber range of each irradiation time for the first irradiation, and the total scattering intensity in the specific wavenumber range of each irradiation time
- the microscopic Raman spectroscopic device according to any one of [6] to [8], wherein linear regression analysis is performed on at least one plot of the scattering intensity ratio to specify the upper limit of the number of irradiations without damaging the sample to be analyzed. .
Landscapes
- Health & Medical Sciences (AREA)
- Nuclear Medicine, Radiotherapy & Molecular Imaging (AREA)
- Physics & Mathematics (AREA)
- Life Sciences & Earth Sciences (AREA)
- Chemical & Material Sciences (AREA)
- Analytical Chemistry (AREA)
- Biochemistry (AREA)
- General Health & Medical Sciences (AREA)
- General Physics & Mathematics (AREA)
- Immunology (AREA)
- Pathology (AREA)
- Investigating, Analyzing Materials By Fluorescence Or Luminescence (AREA)
Abstract
Priority Applications (2)
| Application Number | Priority Date | Filing Date | Title |
|---|---|---|---|
| JP2023543648A JPWO2023026523A1 (fr) | 2021-08-26 | 2022-03-03 | |
| CN202280057636.2A CN117940763A (zh) | 2021-08-26 | 2022-03-03 | 拉曼分光分析方法以及显微拉曼分光装置 |
Applications Claiming Priority (2)
| Application Number | Priority Date | Filing Date | Title |
|---|---|---|---|
| JP2021-138263 | 2021-08-26 | ||
| JP2021138263 | 2021-08-26 |
Publications (1)
| Publication Number | Publication Date |
|---|---|
| WO2023026523A1 true WO2023026523A1 (fr) | 2023-03-02 |
Family
ID=85322615
Family Applications (1)
| Application Number | Title | Priority Date | Filing Date |
|---|---|---|---|
| PCT/JP2022/009071 WO2023026523A1 (fr) | 2021-08-26 | 2022-03-03 | Procédé d'analyse spectroscopique raman et dispositif de spectroscopie raman microscopique |
Country Status (3)
| Country | Link |
|---|---|
| JP (1) | JPWO2023026523A1 (fr) |
| CN (1) | CN117940763A (fr) |
| WO (1) | WO2023026523A1 (fr) |
Citations (6)
| Publication number | Priority date | Publication date | Assignee | Title |
|---|---|---|---|---|
| JP2001051202A (ja) * | 1999-06-04 | 2001-02-23 | Olympus Optical Co Ltd | 走査型顕微鏡の測定パラメータ決定方法及びコンピュータにより読み取り可能な記憶媒体 |
| JP2006113021A (ja) | 2004-10-18 | 2006-04-27 | Univ Waseda | ラマン分光装置、及び分光装置 |
| JP2010521662A (ja) * | 2007-03-15 | 2010-06-24 | ザ サイエンス アンド テクノロジー ファシリティーズ カウンシル | 散乱反射性媒体の照射 |
| JP2014153098A (ja) * | 2013-02-06 | 2014-08-25 | Jasco Corp | ノイズ除去方法及びノイズ除去装置 |
| JP2018518719A (ja) * | 2015-06-01 | 2018-07-12 | セルステック アーベー | 改良されたラマン分光法システム |
| US20200049627A1 (en) * | 2018-08-07 | 2020-02-13 | Synaptive Medical (Barbados) Inc. | Dynamic raman signal acquisition system, method and apparatus |
-
2022
- 2022-03-03 CN CN202280057636.2A patent/CN117940763A/zh active Pending
- 2022-03-03 JP JP2023543648A patent/JPWO2023026523A1/ja active Pending
- 2022-03-03 WO PCT/JP2022/009071 patent/WO2023026523A1/fr active Application Filing
Patent Citations (6)
| Publication number | Priority date | Publication date | Assignee | Title |
|---|---|---|---|---|
| JP2001051202A (ja) * | 1999-06-04 | 2001-02-23 | Olympus Optical Co Ltd | 走査型顕微鏡の測定パラメータ決定方法及びコンピュータにより読み取り可能な記憶媒体 |
| JP2006113021A (ja) | 2004-10-18 | 2006-04-27 | Univ Waseda | ラマン分光装置、及び分光装置 |
| JP2010521662A (ja) * | 2007-03-15 | 2010-06-24 | ザ サイエンス アンド テクノロジー ファシリティーズ カウンシル | 散乱反射性媒体の照射 |
| JP2014153098A (ja) * | 2013-02-06 | 2014-08-25 | Jasco Corp | ノイズ除去方法及びノイズ除去装置 |
| JP2018518719A (ja) * | 2015-06-01 | 2018-07-12 | セルステック アーベー | 改良されたラマン分光法システム |
| US20200049627A1 (en) * | 2018-08-07 | 2020-02-13 | Synaptive Medical (Barbados) Inc. | Dynamic raman signal acquisition system, method and apparatus |
Also Published As
| Publication number | Publication date |
|---|---|
| CN117940763A (zh) | 2024-04-26 |
| JPWO2023026523A1 (fr) | 2023-03-02 |
Similar Documents
| Publication | Publication Date | Title |
|---|---|---|
| US7557915B2 (en) | Automated acquisition of spectral data and image data | |
| US6281971B1 (en) | Method for adjusting spectral measurements to produce a standard Raman spectrum | |
| JP5706955B2 (ja) | レーザープラズマスペクトルを用いた試料内の測定対象元素の定量分析方法 | |
| US20030095266A1 (en) | Method and apparatus for three-dimensional compositional mapping of heterogeneous materials | |
| US20140204194A1 (en) | Defect observation method and device therefor | |
| KR20130138214A (ko) | 결함 검사 및 광발광 측정 시스템 | |
| Garcıa-Ayuso et al. | Characterization of jewellery products by laser-induced breakdown spectroscopy | |
| JP5235447B2 (ja) | X線分析装置及びx線分析方法 | |
| Bennett et al. | Calibration curves for commercial copper and aluminum alloys using handheld laser-induced breakdown spectroscopy | |
| CN114839145A (zh) | 一种激光损伤分析测试仪器 | |
| JP2009258030A (ja) | ラマンスペクトル取得法 | |
| WO2023026523A1 (fr) | Procédé d'analyse spectroscopique raman et dispositif de spectroscopie raman microscopique | |
| JP2010092041A (ja) | 顕微鏡を用いて試料を撮像するための方法、顕微鏡、およびデータ記憶キャリア | |
| WO2017175811A1 (fr) | Procédé de détection de cancer, dispositif de détection de cancer, et programme de détection de cancer | |
| JP6931681B2 (ja) | 分析装置 | |
| JP2007101476A (ja) | ラマンスペクトル取得方法 | |
| JP2008529091A (ja) | 可変視野照射のための方法および装置 | |
| JP2001007173A (ja) | 少数キャリアのライフタイム測定装置 | |
| JP2002005835A (ja) | ラマン分光測定装置及びそれを用いた生体試料分析方法 | |
| Al-Jeffery et al. | LIBS and LIFS for rapid detection of Rb traces in blood | |
| JP2006259326A (ja) | 赤外顕微鏡 | |
| JP2000055809A (ja) | 顕微ラマン分光装置及び顕微ラマン分光測定方法 | |
| JPWO2023026523A5 (fr) | ||
| Itoh et al. | Reliable evaluation of the lateral resolution of a confocal Raman microscope by using the tungsten-dot array certified reference material | |
| JPH0972848A (ja) | ラマン分光装置 |
Legal Events
| Date | Code | Title | Description |
|---|---|---|---|
| 121 | Ep: the epo has been informed by wipo that ep was designated in this application |
Ref document number: 22860821 Country of ref document: EP Kind code of ref document: A1 |
|
| WWE | Wipo information: entry into national phase |
Ref document number: 2023543648 Country of ref document: JP |
|
| WWE | Wipo information: entry into national phase |
Ref document number: 202280057636.2 Country of ref document: CN |
|
| WWE | Wipo information: entry into national phase |
Ref document number: 2022860821 Country of ref document: EP |
|
| NENP | Non-entry into the national phase |
Ref country code: DE |
|
| ENP | Entry into the national phase |
Ref document number: 2022860821 Country of ref document: EP Effective date: 20240326 |