WO2021240710A1 - クロマトグラフ質量分析データ処理方法、クロマトグラフ質量分析装置、及びクロマトグラフ質量分析データ処理用プログラム - Google Patents
クロマトグラフ質量分析データ処理方法、クロマトグラフ質量分析装置、及びクロマトグラフ質量分析データ処理用プログラム Download PDFInfo
- Publication number
- WO2021240710A1 WO2021240710A1 PCT/JP2020/021064 JP2020021064W WO2021240710A1 WO 2021240710 A1 WO2021240710 A1 WO 2021240710A1 JP 2020021064 W JP2020021064 W JP 2020021064W WO 2021240710 A1 WO2021240710 A1 WO 2021240710A1
- Authority
- WO
- WIPO (PCT)
- Prior art keywords
- mass
- component
- spectrum
- composition
- estimated
- Prior art date
Links
Images


Classifications
-
- H—ELECTRICITY
- H01—ELECTRIC ELEMENTS
- H01J—ELECTRIC DISCHARGE TUBES OR DISCHARGE LAMPS
- H01J49/00—Particle spectrometers or separator tubes
- H01J49/0027—Methods for using particle spectrometers
- H01J49/0036—Step by step routines describing the handling of the data generated during a measurement
-
- G—PHYSICS
- G01—MEASURING; TESTING
- G01N—INVESTIGATING OR ANALYSING MATERIALS BY DETERMINING THEIR CHEMICAL OR PHYSICAL PROPERTIES
- G01N27/00—Investigating or analysing materials by the use of electric, electrochemical, or magnetic means
- G01N27/62—Investigating or analysing materials by the use of electric, electrochemical, or magnetic means by investigating the ionisation of gases, e.g. aerosols; by investigating electric discharges, e.g. emission of cathode
-
- G—PHYSICS
- G01—MEASURING; TESTING
- G01N—INVESTIGATING OR ANALYSING MATERIALS BY DETERMINING THEIR CHEMICAL OR PHYSICAL PROPERTIES
- G01N30/00—Investigating or analysing materials by separation into components using adsorption, absorption or similar phenomena or using ion-exchange, e.g. chromatography or field flow fractionation
- G01N30/02—Column chromatography
- G01N30/62—Detectors specially adapted therefor
- G01N30/72—Mass spectrometers
- G01N30/7233—Mass spectrometers interfaced to liquid or supercritical fluid chromatograph
-
- G—PHYSICS
- G01—MEASURING; TESTING
- G01N—INVESTIGATING OR ANALYSING MATERIALS BY DETERMINING THEIR CHEMICAL OR PHYSICAL PROPERTIES
- G01N30/00—Investigating or analysing materials by separation into components using adsorption, absorption or similar phenomena or using ion-exchange, e.g. chromatography or field flow fractionation
- G01N30/02—Column chromatography
- G01N30/86—Signal analysis
- G01N30/8624—Detection of slopes or peaks; baseline correction
- G01N30/8631—Peaks
-
- G—PHYSICS
- G16—INFORMATION AND COMMUNICATION TECHNOLOGY [ICT] SPECIALLY ADAPTED FOR SPECIFIC APPLICATION FIELDS
- G16C—COMPUTATIONAL CHEMISTRY; CHEMOINFORMATICS; COMPUTATIONAL MATERIALS SCIENCE
- G16C20/00—Chemoinformatics, i.e. ICT specially adapted for the handling of physicochemical or structural data of chemical particles, elements, compounds or mixtures
- G16C20/20—Identification of molecular entities, parts thereof or of chemical compositions
-
- H—ELECTRICITY
- H01—ELECTRIC ELEMENTS
- H01J—ELECTRIC DISCHARGE TUBES OR DISCHARGE LAMPS
- H01J49/00—Particle spectrometers or separator tubes
- H01J49/004—Combinations of spectrometers, tandem spectrometers, e.g. MS/MS, MSn
-
- G—PHYSICS
- G01—MEASURING; TESTING
- G01N—INVESTIGATING OR ANALYSING MATERIALS BY DETERMINING THEIR CHEMICAL OR PHYSICAL PROPERTIES
- G01N30/00—Investigating or analysing materials by separation into components using adsorption, absorption or similar phenomena or using ion-exchange, e.g. chromatography or field flow fractionation
- G01N30/02—Column chromatography
- G01N30/86—Signal analysis
- G01N30/8675—Evaluation, i.e. decoding of the signal into analytical information
- G01N30/8679—Target compound analysis, i.e. whereby a limited number of peaks is analysed
Definitions
- the present invention is a chromatograph mass spectrometry data processing method for processing data collected by chromatograph mass spectrometry, a chromatograph mass spectrometer using the method, and a chromatograph for realizing the method using a computer.
- a program for processing mass spectrometric data is suitable for, for example, for detecting a large number of compounds contained in a sample to identify or confirm the target compound, or for screening for checking the presence or absence of a large number of target compounds. ..
- LC-MS liquid chromatograph mass spectrometer
- GC-MS gas chromatograph mass spectrometer
- various compounds contained in a sample are temporally separated by a chromatograph unit, and the separated compounds are separated by mass. It can be detected sequentially by the analysis unit.
- an apparatus such as LC-MS or GC-MS that combines a chromatograph unit and a mass spectrometer is referred to as a chromatograph mass spectrometer.
- LC-MS will be particularly taken as an example, but the situation is the same for GC-MS.
- mass-to-charge ratio is commonly used in the present specification as a predetermined mass-to-charge ratio (strictly, m / z in Italian notation) in the mass analyzer.
- mass-to-charge ratio By repeating scan measurements over a range (using), data with three dimensions of retention time, mass-to-charge ratio, and signal strength value can be collected.
- various software for data processing have been used in order to identify an unknown compound based on the above data and to investigate the presence / absence and content of a specific compound by using a computer.
- Non-Patent Document 1 discloses software named "Profiling Solution”. This software detects peaks on the mass spectrum and chromatogram by processing the unprocessed data (hereinafter, sometimes referred to as "raw data” according to convention) obtained by the chromatograph mass spectrometer, and mainly It is possible to create a peak list for multivariate analysis such as component analysis.
- the applicant proposes a new method for solving such a problem in Japanese Patent Application No. 2019-154820 which has been filed earlier, and is equipped with software (see Non-Patent Document 2) for carrying out processing by the proposed method. We sell equipment.
- This new method utilizes the fact that multiple peaks indicating isotope clusters are observed relatively well in the mass spectrum when an organic compound containing elements such as carbon, oxygen, and hydrogen is mass-analyzed, and each compound is used.
- the peak contained in the isotope cluster is identified from among the many peaks observed on the actually measured mass spectrum, and among them.
- Estimate the monoisotopic ion peak It also has a function of distinguishing a significant peak from noise based on a change in signal intensity in the time direction at a mass-to-charge ratio estimated to be a monoisotopic ion peak.
- LC-MS using a tandem mass spectrometer as a detector has been rapidly used in fields where qualitative and quantitative analysis of multiple samples and multiple components is required, such as inspection of residual pesticides in foods and inspection of pollutants in environmental water. It is progressing.
- the quadrupole-time-of-flight mass analyzer Q-TOF type mass analyzer
- the general triple quadrupole mass analyzer Since it is possible to measure with high mass accuracy and mass resolution, it is effective in identifying and quantifying compounds in complex samples.
- MS spectrum mass spectrum obtained by MS analysis
- MS analysis ordinary mass spectrometry
- MS / MS analysis is performed following the above MS analysis using an ion having a specific mass-charge ratio selected based on the signal intensity of the peak as a precursor ion, and an MS / MS spectrum in which various product ions are observed is acquired. It is a method. In DDA, MS / MS analysis is not performed if there is no peak in the MS spectrum that satisfies the appropriate conditions.
- the DIA divides the mass-to-charge ratio range to be measured into a plurality of parts, sets a mass window for each, and collectively treats the ions having the mass-to-charge ratio contained in each mass window as precursor ions. It is a method to obtain MS / MS spectrum for each mass window by comprehensively scanning and measuring product ions generated from.
- DIA performs MS / MS analysis using multiple ions contained in the mass window as precursor ions and has different mass. Since the MS / MS analysis is performed for each mass window in the charge ratio range within a time that can be regarded as substantially simultaneous, the comprehensiveness of the MS / MS spectrum is high. Therefore, DIA is a suitable method for comprehensively qualitatively and quantifying a large number of compounds contained in a sample.
- the mass-to-charge ratio width of one mass window is in the range of about 10 to 100 Da
- the MS / MS spectrum contains various product ions derived from multiple compounds and isotope clusters of one compound. Product ions derived from many ions are mixed and observed. Therefore, the amount of information in the MS / MS spectrum obtained by DIA is considerably larger than the amount of information in the MS spectrum. Since the proposed method according to the above-mentioned prior application mainly assumes MS spectrum data as the target of the data processing, the obtained information can be effectively used even if this method is used for processing MS / MS spectrum data. Therefore, it may not be possible to improve the analysis accuracy such as the estimation accuracy of the compound.
- the present invention has been made to solve these problems, and its main purpose is to appropriately utilize the information of the MS / MS spectrum obtained by DIA to identify and quantify the compound, or to obtain the compound.
- Chromatograph mass spectrometric data processing method chromatograph mass spectrometer, which can improve the accuracy of estimation of composition and structure, and can reduce the work burden of the analyst in such analysis and improve efficiency. And to provide a program for processing chromatograph mass spectrometric data.
- One aspect of the chromatograph mass spectrometric data processing method according to the present invention is to repeatedly perform MS / MS analysis by data-independent analysis on a sample containing a compound separated by a chromatograph.
- a component detection step that detects the component corresponding to The component detected in the component detection step is screened using prior information to narrow down the components to be analyzed, and the narrowing step.
- a composition estimation step for estimating the composition or chemical formula of the component by using the mass-to-charge ratio information corresponding to the component after being narrowed down in the narrowing step. It has.
- a mass spectrometric section includes a chromatograph section and a mass spectrometric section capable of MS / MS analysis, and the mass spectrometric section repeatedly performs MS / MS analysis by data-independent analysis on a sample containing a compound separated by the chromatograph section.
- a measurement unit that collects chromatograph mass spectrometric data having three dimensions of time, mass-to-charge ratio, and signal strength, Based on the chromatograph mass spectrometric data over a predetermined mass-to-charge ratio range for the target sample, the MS / MS spectra displayed in the bar graph are obtained, and the precursor ion peak is estimated in each MS / MS spectrum, and each MS / MS is estimated.
- a component detector that detects the component corresponding to A narrowing-down unit that narrows down the components to be analyzed by screening using prior information for the components detected by the component detection unit.
- a composition estimation unit that estimates the composition or chemical formula of the component by using the mass-to-charge ratio information corresponding to the component after being narrowed down by the narrowing unit. It is equipped with.
- one aspect of the chromatograph mass spectrometric data processing program according to the present invention made to solve the above problems is to perform MS / MS analysis by data-independent analysis on a sample containing a compound separated by a chromatograph.
- the component detection function unit that detects the component corresponding to A narrowing-down function unit that narrows down the components to be analyzed by screening using prior information for the components detected in the component detection function unit.
- a composition estimation function unit that estimates the composition or chemical formula of the component by using the mass-to-charge ratio information corresponding to the component after being narrowed down by the narrowing function unit.
- the chromatograph may be either a liquid chromatograph or a gas chromatograph.
- data-independent analysis is the above-mentioned method of MS / MS analysis called Data Independent Analysis or Data Independent Acquisition.
- MS / MS analysis is performed by dissociating all ions contained in a mass window having a predetermined mass-charge specific width as precursor ions by collision-induced dissociation, etc., and collision energy in the collision-induced dissociation.
- dissociation conditions such as, it is possible to perform mass spectrometry in the subsequent stage without dissociating some of the precursor ions.
- the prior information is, for example, a list of chemical formulas and masses of the compound to be analyzed, or On the contrary, it can be a list of chemical formulas and masses of compounds that do not need to be analyzed.
- Ion type can be calculated without troublesome work.
- the information obtained by MS / MS analysis by DIA can be effectively used to efficiently identify the compound contained in the sample while reducing the work load of the analyst, and to accurately determine the composition and the like. You can ask.
- the schematic block diagram of the LC-MS analysis system which is one Embodiment of this invention.
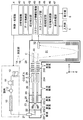
- FIG. 1 is a schematic configuration diagram of the LC-MS analysis system of the present embodiment.
- this LC-MS analysis system includes a measurement unit 1 including a liquid chromatograph unit 1A and a mass spectrometry unit 1B, a control / processing unit 4, an input unit 5, and a display unit 6. include.
- the liquid chromatograph unit 1A includes a mobile phase container 10 in which a mobile phase is stored, a liquid feed pump 11 that sucks the mobile phase and feeds it at a substantially constant flow rate, and an injector 12 that injects a sample liquid into the mobile phase. , A column 13 for temporally separating various compounds contained in the sample liquid, and the like.
- the mass spectrometer 1B is a quadrupole-time-of-flight (Q-TOF type) mass spectrometer, and includes an ionization chamber 201 having a substantially atmospheric pressure atmosphere and a vacuum chamber 20 whose inside is divided into four. ..
- a first intermediate vacuum chamber 202, a second intermediate vacuum chamber 203, a first high vacuum chamber 204, and a second high vacuum chamber 205 are provided, and each chamber has a higher degree of vacuum in this order. It is evacuated by a vacuum pump. That is, the mass spectrometric unit 1B adopts a configuration of a multi-stage differential exhaust system.
- an electrospray ionization (ESI) probe 21 to which an eluate is supplied from the outlet of the column 13 is arranged, and the ionization chamber 201 and the first intermediate vacuum chamber 202 are desolving tubes having a small diameter. It communicates through 22.
- the first intermediate vacuum chamber 202 and the second intermediate vacuum chamber 203 communicate with each other through an orifice formed at the top of the skimmer 24, and ions are formed in the first intermediate vacuum chamber 202 and the second intermediate vacuum chamber 203, respectively.
- Guides 23 and 25 are arranged.
- a quadrupole mass filter 26 and a collision cell 27 in which an ion guide 28 is arranged are provided in the first high vacuum chamber 204.
- a plurality of electrodes arranged so as to straddle the first high vacuum chamber 204 and the second high vacuum chamber 205 form an ion guide 29.
- a time-of-flight mass separator of the orthogonal acceleration system including an orthogonal acceleration unit 30 and an ion flight unit 31 having a reflector, and an ion detector 32 are provided. There is.
- the control / processing unit 4 has analysis control unit 40, data storage unit 41, component detection unit 42, screening information storage unit 43, screening unit 44, composition estimation unit 45, compound determination unit 46, and display processing as functional blocks. Part 47, is included.
- the substance of the control / processing unit 4 is a personal computer, a workstation, or the like, and by executing one or more dedicated software (computer programs) installed in such a computer on the computer, each of the above functional blocks can be obtained. It can be a structure that is embodied.
- Such computer programs may be stored and provided to the user on a computer-readable non-temporary recording medium such as a CD-ROM, DVD-ROM, memory card, USB memory (dongle). ..
- it can be provided to the user in the form of data transfer via a communication line such as the Internet.
- it can be pre-installed on a computer that is part of the system when the user purchases the system.
- the analysis control unit 40 controls the measurement unit 1 to perform LC / MS analysis on the prepared sample. Next, a typical measurement operation performed under the control of the analysis control unit 40 will be schematically described.
- normal mass spectrometry MS analysis
- MS / MS MS 2
- CID collision-induced dissociation
- the liquid feed pump 11 sucks the mobile phase from the mobile phase container 10 and sends it to the column 13 at a substantially constant flow rate.
- the injector 12 injects the sample into the mobile phase in response to an instruction from the analysis control unit 40.
- the sample is introduced into the column 13 on the mobile phase, and while passing through the column 13, the compounds contained in the sample are separated in time.
- the eluate from the outlet of the column 13 is introduced into the ESI probe 21, and the ESI probe 21 sprays the eluate as charged droplets into the ionization chamber 201.
- the compound in the droplet becomes a gas ion.
- the generated ions are sent to the first intermediate vacuum chamber 202 via the desolvation tube 22, pass through the ion guide 23, the skimmer 24, and the ion guide 25 in this order, and pass through the ion guide 23, and the quadrupole mass filter in the first high vacuum chamber 204. Introduced in 26.
- the ions pass substantially through the quadrupole mass filter 26 and the collision cell 27 and are transported to the orthogonal acceleration unit 30.
- a predetermined voltage is applied to each of a plurality of rod electrodes constituting the quadrupole mass filter 26, and an ion species having a specific mass-to-charge ratio according to the voltage, or an ion species thereof.
- Ion species included in a specific mass-to-charge ratio range depending on the voltage are selected as precursor ions and pass through the quadrupole mass filter 26.
- a collision gas such as Ar gas is introduced into the collision cell 27, and the precursor ions come into contact with the collision gas and are dissociated by CID to generate various product ions.
- the generated product ions are transported to the orthogonal acceleration unit 30 via the ion guide 29.
- the mode of dissociation of the precursor ion differs depending on the kinetic energy (collision energy) of the precursor ion when it is incident on the collision cell 27. Therefore, even if the precursor ions are the same, the type of product ions produced can be changed by appropriately adjusting the collision energy. Also, instead of dissociating all the precursor ions, some precursor ions can be left undissociated.
- the collision energy is generally a DC bias voltage applied to the quadrupole mass filter 26 and a DC voltage applied to the lens electrode arranged at the ion inlet of the collision cell 27. Determined by the voltage difference.
- the ions are accelerated substantially simultaneously in the direction (Z-axis direction) substantially orthogonal to the incident direction (X-axis direction).
- the accelerated ions fly at a speed corresponding to the mass-to-charge ratio, and fly back at the ion flight unit 31 as shown by the two-dot chain line in FIG. 1 to reach the ion detector 32.
- Various ions starting from the orthogonal accelerator 30 at substantially the same time reach the ion detector 32 in ascending order of mass-to-charge ratio and are detected, and the ion detector 32 controls the detection signal (ion intensity signal) according to the number of ions.
- the data storage unit 41 digitizes the detection signal and further converts the flight time from the time point when the ion is emitted from the orthogonal acceleration unit 30 into the mass-to-charge ratio to generate mass spectrum data (low). Data) is acquired and saved.
- the orthogonal acceleration unit 30 repeatedly ejects ions toward the ion flight unit 31 at a predetermined cycle. As a result, the data storage unit 41 can repeatedly acquire mass spectrum data over a predetermined mass-to-charge ratio range at a predetermined cycle.
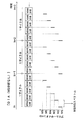
- FIG. 2 and 3 are explanatory views of analysis in the DIA mode.
- FIG. 2 is an example in which MS analysis is not performed
- FIG. 3 is an example in which MS analysis is performed periodically.
- the entire mass-to-charge ratio range to be measured is divided into a plurality of parts, a mass window is set for each, and ions having a mass-to-charge ratio contained in each mass window are collectively selected as precursor ions for MS. / Perform MS analysis.
- the mass-to-charge ratio range M1 to M6 is divided into five, and MS / MS analysis is performed targeting ions having a mass-to-charge ratio contained in each of the five mass windows. .. Since one MS / MS spectrum is obtained for each mass window, five MS / MS spectra are obtained in one cycle in the examples of FIGS. 3 and 4, and the five MS / MS spectra are included in the five MS / MS spectra. At that time, product ions derived from all the compounds introduced into the mass spectrometer 1B appear. That is, comprehensive product ion information for all compounds can be obtained.
- the collision energy at the time of CID is adjusted, for example, if the collision energy is adjusted to a relatively low value, it is possible to prevent the precursor ions from being completely dissociated. Therefore, MS / The peak of the precursor ion itself is also observed in the MS spectrum. Therefore, for example, in one cycle, the collision energy is changed to a plurality of values including a relatively high value and a low value, and the collision elgi is changed for each of the mass-to-charge ratio ranges M1 to M6.
- FIGS. 2 and 3 are simplified views for the sake of explanation.
- the number of mass windows is larger, and the mass-to-charge ratio width of one mass window is in the range of about 10 to 100 Da. For example, 20 Da.
- the MS spectrum data obtained by MS analysis and the MS / MS spectrum data obtained by MS / MS analysis can be stored in different data files for each analysis. Further, the MS spectrum data acquired at the same holding time (tn, tun + 1, ...) And a plurality of MS / MS spectrum data, or a plurality of MS / MS spectrum data are stored in the same data file. You may do so.
- the data storage unit 41 contains the MS spectrum data and / or the MS / MS spectrum corresponding to the LC / MS analysis.
- the data file containing the data is saved.
- FIG. 4 is a flowchart showing a schematic procedure of compound identification processing in the LC-MS analysis system of the present embodiment. After explaining the flow of the entire process according to FIG. 4, the process of each step will be described in detail. Here, it is assumed that the data in the DIA mode without MS analysis as shown in FIG. 2 is collected for the target sample.
- the component detection unit 42 reads the raw data collected by the analysis from the data storage unit 41, and performs centroid conversion processing for each data constituting one MS / MS spectrum to display the MS / MS as a bar graph. Obtain the spectrum (steps S1, S2). For example, in the example of FIG. 2, five MS / MS spectra are created for one cycle.
- the component detection unit 42 detects a compound contained in the sample and a significant component presumed to correspond to the partial structure of the compound from all the obtained MS / MS spectra (step S3).
- the "component” here basically corresponds to the peak observed in the three-dimensional graph of the mass-to-charge ratio axis, the time axis, and the signal intensity axis, but is derived from one compound or one compound. Peaks with different mass-to-charge ratios derived from one partial structure, that is, multiple peaks constituting an isotope cluster, are aggregated and regarded as one component.
- the component detection unit 42 estimates the precursor ion peak for each MS / MS spectrum (step S4). For example, it can be estimated that the peak having the highest signal intensity among the peaks existing in the mass-to-charge ratio range of the mass window corresponding to the MS / MS spectrum is the precursor ion peak.
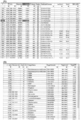
- FIG. 6 is a diagram showing an example of a display screen at the end of steps S3 and S4.
- “RT” is the holding time
- “m / z” is the mass-to-charge ratio
- “Response” is the signal strength. Details will be described later.
- the screening unit 44 collates the above component list with the target list stored in advance in the screening information storage unit 43 to select the component information posted on the component list. Then, either a positive list or a negative list is created from the component list as a list of compound candidates to be analyzed according to the screening result using the target list (step S5). That is, the positive list is a list of components corresponding to the compounds listed in the target list, and the negative list is a list of components corresponding to the compounds not listed in the target list. Whether to create a positive list or a negative list depends on the user's prior specification. In general, the process of step S5 significantly reduces the number of compound candidates to be analyzed.
- FIG. 7 is a diagram showing an example of a display screen at the end of step S5.
- “Target Name” is the name of the compound or its partial structure in the target list
- “Target m / z” is the mass-to-charge ratio of the molecular ion of the compound or the ion of the partial structure
- “Target Formula” is. It is a composition formula of the compound or a partial structure thereof.
- the composition estimation unit 45 corresponds to the component information listed in the designated list according to the predetermined composition estimation algorithm according to the prior designation of the positive list or the negative list by the user.
- the composition of the compound or partial structure to be used is estimated, and its chemical formula (including composition formula and ionic formula) is obtained (step S6).
- the display processing unit 47 displays the component list after composition estimation on the screen of the display unit 6 instead of the list displayed up to that point.
- FIG. 8 is a diagram showing an example of a display screen at the end of step S6.
- Predicted Formula is a composition formula of the estimated compound or its partial structure
- Score is a score value indicating the certainty of the composition estimation.
- the compound determination unit 46 performs in silico fragment mapping for precursor ions based on the component information listed in the designated positive list or negative list. That is, virtual fragmentation using theoretical calculation is performed, and the attribution of each fragment ion obtained by the fragmentation is attempted. Thereby, the identification of the compound corresponding to the precursoron is determined (step S7).
- the display processing unit 47 displays the component list after the compound is determined by in silico fragment mapping on the screen of the display unit 6 instead of the list displayed up to that point.
- FIG. 9 is a diagram showing an example of a display screen at the end of step S7, and the portion following the right side of the list shown in (A) is shown in (B).
- step S5 is not indispensable for performing the process of step S6, the process of step S5 is important for efficiently performing the process of step S6. Similarly, although the processes of steps S5 and S6 are not essential for performing the process of step S7, the processes of steps S5 and S6 are important for efficiently performing the process of step S7.
- a graph showing the component detection result in step S3 on a chromatogram or MS / MS spectrum can be drawn on the screen of the display unit 6.
- the deconvolution spectrum described later can be described together, and in the case of step S6 or later, the theoretical MS / MS spectrum can be described together.
- Steps S3 and S4 component detection process
- a compound or a component corresponding to its partial structure can be detected according to the following procedure.
- the component detection unit 42 extracts peaks (centroid peaks) from the MS / MS spectra displayed in the bar graph according to predetermined criteria.
- peaks presumed to be unnecessary or not derived from the compound are deleted by using the peaks and waveform characteristics in the mass-to-charge ratio axis direction and the time axis direction, respectively, and the same compound is used.
- the process of grouping the peaks that are presumed to be derived is performed. For example, as in the example shown in FIG. 5, even when the retention times are different, the peaks in which the mass-to-charge ratio falls within one mass-to-charge ratio width ⁇ M are regarded as ion peaks derived from the same group, that is, the same compound. be able to.
- unnecessary peaks are deleted based on criteria such as signal strength and continuity in the time axis direction. For example, when the signal strength of the peak having the maximum signal strength among a plurality of peaks aggregated in one group is equal to or less than a predetermined threshold value, the entire group including the peak is deleted. In addition, due to the nature of separation in the liquid chromatograph, one compound is detected over a certain period of time in the time axis direction, so some groups have consecutive peaks of less than a predetermined number in the time axis direction. delete.
- an extracted ion chromatogram is created for each peak grouped in all MS / MS spectra. That is, even if the mass-to-charge ratios are different, peaks in the same group are regarded as having the same mass-to-charge ratio, and an extracted ion chromatogram is created. Therefore, an extracted ion chromatogram is created for each group.
- the groups presumed to be unnecessary are deleted, and the groups are further aggregated or divided. For example, when a plurality of clearly different peaks appear on the extracted ion chromatogram, it is advisable to divide the group into groups for each peak.
- the components detected using all MS / MS spectra are displayed as a component list as shown in FIG. Since each component corresponds to a peak on the three-dimensional graph, the holding time, mass-to-charge ratio, and signal intensity value of the peak top of the peak can be obtained. These are “RT”, “m / z”, and “Response” in FIG. Further, in FIG. 6, since it is estimated that the peak observed at m / z 123.00566 is the precursor ion peak for all the components of # 1 to # 14, the m / z of “Precursor Ion” of these components is 123.00566. It has become. If a peak presumed to be a precursor ion peak is not observed in the MS / MS spectrum, the “Precursor Ion” column of the component list is blank.
- Step S5 Screening process
- a list of the mass-to-charge ratio, chemical formula, etc. of the compound is stored in a file in a predetermined format, and stored in the screening information storage unit 43 as a target list.
- the target list file may be read out, screening may be performed on the component detection results obtained in steps S3 and S4, and compound candidates may be narrowed down.
- a mass-to-charge ratio range having a predetermined allowable width centered on the mass-to-charge ratio value is determined, and the above component detection result is used.
- the screening of compound candidates can be carried out by searching for and leaving a mass-to-charge ratio value corresponding to the mass-to-charge ratio range.
- the mass-to-charge ratio range based on the specified mass-to-charge ratio value and allowable width is determined, and the above peak is obtained.
- the chemical formula of the compound to be analyzed is the target list
- the chemical formula in the list is converted into an ionic formula in consideration of the charge of metal or the like according to the ionic polarity at the time of data acquisition at that time.
- the screening can be performed in the same manner as when the mass-to-charge ratio of the compound is specified.
- a retention time range with a predetermined width is set around the retention time, and the retention time from the retention time range is determined. Can be excluded by screening from compound candidates that are out of the range.
- a list of compounds that do not require analysis may be prepared instead of the compounds that the user wants to analyze.
- Information on the compounds identified in MS analysis may be sequentially added to the target list, or conversely excluded from the target list.
- a plurality of target lists may be combined and used for screening. For example, a compound that is commonly listed in multiple target lists may be selected by screening, or a compound listed in one target list excluding a compound listed in another target list may be screened. You may be able to select with.
- Step S6 Composition estimation process
- the same algorithm as the software "Formula Prediction" described in Non-Patent Document 3 can be used for estimating the composition of the compound based on the component detection result.
- a combination of elements considering adduct is searched for the mass-to-charge ratio value of the target molecular ion peak observed in the MS spectrum.
- the ionic formula is fitted and multiple candidates are derived.
- a theoretical mass spectrum with an isotope cluster is calculated from each of the plurality of ion equations, and a score is calculated from the degree of coincidence between the theoretical mass spectrum and the actual mass spectrum.
- the composition estimation unit 45 determines whether or not the component to be the target of the composition estimation is a precursor ion. Then, when it is determined that the component whose composition is to be estimated is precursor ion, the MS spectrum analysis mode is selected, and when it is determined that the component is not precursor ion, the MS / MS spectrum analysis mode is selected.
- the ion formula based on the combination of elements in consideration of adduct is applied to the mass-to-charge ratio value of the precursor ion peak to be analyzed, as in the above-mentioned analysis based on the normal MS spectrum. Then, the theoretical mass spectrum with the isotope cluster calculated from the ion formula is calculated, the score is obtained from the degree of coincidence of the pattern between the theoretical mass spectrum and the actual MS spectrum, and the ion formula that gives the maximum score is selected. The composition and chemical formula of the compound are obtained.
- the MS spectrum analysis mode of "Formula Prediction" The composition can be determined with.
- the method disclosed in Patent Document 3 can also be used for the composition estimation based on the isotope distribution.
- the MS / MS spectrum analysis mode a combination of elements having the smallest difference from the mass-to-charge ratio value of the component to be analyzed is searched for using the masses of a plurality of predetermined elements.
- the type of element to be used may be determined according to the type of sample to be analyzed, etc. In general organic compounds, at least carbon, hydrogen, oxygen, and nitrogen are used as elements, and further, sulfur, phosphorus, and chlorine are used. , Bromine and other elements can be added, and various metals such as sodium and potassium can be added.
- Step S7 Identification of the final compound
- various known techniques for example, the method of in silico fragmentation described in Non-Patent Document 4
- the component detection results can be used as they are as a search key when searching the chemical structure database. That is, when the composition is estimated as described above, since the chemical formula is obtained as the result of the estimation, the known chemical structure database may be searched by using the chemical formula as a search key.
- a search for the chemical structure database is performed using the mass-to-charge ratio range to which a predetermined allowable range is applied to the mass-to-charge ratio of the components as a search key. Just do it.
- the MS / MS spectrum obtained in the DIA mode is usually observed with a mixture of product ion peaks derived from a plurality of precursor ions.
- each product ion can be assigned to the precursor ion in the peak detection result in step S3. Therefore, it is possible to create a deconvolution spectrum in which only the product ion peaks derived from a specific precursor ion are collected by using the attribution result.
- the deconvolution spectrum thus obtained is pure, that is, the MS / MS spectrum for the only precursor ion, the compound can be identified by directly subjecting this MS / MS spectrum to a library search. Is also possible.
- LC-MS analysis system of the present embodiment when a component list as shown in FIGS. 6 to 9 is displayed on the screen, when any one component is instructed to be selected on the list. , Measured MS or MS / MS spectra, extracted ion chromatograms, average MS / MS spectra (eg, average MS over the entire retention time in which the component is observed on the extracted ion chromatogram) associated with the indicated component. / MS spectrum), theoretical MS / MS spectrum, and even deconvolution spectrum may be displayed on the screen as appropriate.
- the quadrupole-flying time type mass spectrometer was used for the mass spectrometer 1B, but other devices such as a triple quadrupole mass spectrometer and an ion trap flight time type mass spectrometer are used.
- a tandem mass spectrometer of the method can also be used.
- a device with high mass accuracy such as a time-of-flight mass spectrometer or a Fourier transform ion cyclotron resonance mass spectrometer is used. Is desirable.
- One aspect of the chromatograph mass spectrometric data processing method according to the present invention is collected by repeatedly performing MS / MS analysis by data-independent analysis on a sample containing a compound separated by a chromatograph.
- the MS / MS spectra displayed in the bar graph are obtained, and the precursor ion peak is estimated in each MS / MS spectrum, and each MS / MS is estimated.
- a component detection step that detects the component corresponding to The component detected in the component detection step is screened using prior information to narrow down the components to be analyzed, and the narrowing step.
- a composition estimation step for estimating the composition or chemical formula of the component by using the mass-to-charge ratio information corresponding to the component after being narrowed down in the narrowing step. It has.
- a mass spectrometric section includes a chromatograph section and a mass spectrometric section capable of MS / MS analysis, and the mass spectrometric section repeatedly performs MS / MS analysis by data-independent analysis on a sample containing a compound separated by the chromatograph section.
- a measurement unit that collects chromatograph mass spectrometric data having three dimensions of time, mass-to-charge ratio, and signal strength, Based on the chromatograph mass spectrometric data over a predetermined mass-to-charge ratio range for the target sample, the MS / MS spectra displayed in the bar graph are obtained, and the precursor ion peak is estimated in each MS / MS spectrum, and each MS / MS is estimated.
- a component detector that detects the component corresponding to A narrowing-down unit that narrows down the components to be analyzed by screening using prior information for the components detected by the component detection unit.
- a composition estimation unit that estimates the composition or chemical formula of the component by using the mass-to-charge ratio information corresponding to the component after being narrowed down by the narrowing unit. It is equipped with.
- one aspect of the chromatograph mass spectrometric data processing program according to the present invention is to repeatedly perform MS / MS analysis by data-independent analysis on a sample containing a compound separated by a chromatograph.
- a chromatograph mass spectrometric data processing program for processing collected chromatograph mass spectrometric data having three dimensions of time, mass-to-charge ratio, and signal strength using a computer. Based on the chromatograph mass spectrometric data over a predetermined mass-to-charge ratio range for the target sample, the MS / MS spectra displayed in the bar graph are obtained, and the precursor ion peak is estimated in each MS / MS spectrum, and each MS / MS is estimated.
- the component detection function unit that detects the component corresponding to A narrowing-down function unit that narrows down the components to be analyzed by screening using prior information for the components detected in the component detection function unit.
- a composition estimation function unit that estimates the composition or chemical formula of the component by using the mass-to-charge ratio information corresponding to the component after being narrowed down by the narrowing function unit.
- the apparatus according to the fifth paragraph, and the program according to the ninth paragraph even if the amount of the compound contained in the sample is very large, the detection using the prior information is used.
- the candidates for a large number of compounds were narrowed down to those that the analyst should pay attention to, those that should be noted, or conversely those that are not expected to be contained in the sample, and then the composition formula, molecular formula, etc. of the compound. It is possible to calculate the ion formula without performing troublesome work.
- the information obtained by MS / MS analysis by DIA can be effectively used to efficiently identify the compound contained in the sample while reducing the work load of the analyst, and to accurately determine the composition and the like. You can ask.
- the prior information is a compound and its partial structure. It is a list of mass-to-charge ratios or chemical formulas for, and in the narrowing down step, it is possible to narrow down on the condition that it is listed or not listed.
- the apparatus of paragraph 6, and the program of paragraph 10 for example, only for compounds of interest or need to be analyzed by the user (analyzer). It is possible to confirm whether or not it is contained in the sample, and to grasp its composition and chemical formula.
- composition estimation step In the method according to paragraph 1, the apparatus according to paragraph 5, and the program according to paragraph 9, the composition estimation step, the composition estimation unit, or the composition estimation unit.
- the composition estimation function unit can determine whether the component whose composition is to be estimated is a precursor ion or a product ion, and estimate the composition or the chemical formula by a different procedure depending on the determination result.
- the component whose composition is to be estimated is the product ion.
- the composition or chemical formula is estimated by searching for a combination of the types and numbers of elements so that the difference from the mass-to-charge ratio value of the component is minimized, and the component whose composition is to be estimated is precursorion.
- a theoretical spectrum including isotope clusters is calculated based on a chemical formula estimated from the mass-to-charge ratio value of the component, and the composition or chemical formula is estimated using the degree of agreement between the spectrum and the measured spectrum. Can be.
Landscapes
- Chemical & Material Sciences (AREA)
- Analytical Chemistry (AREA)
- Physics & Mathematics (AREA)
- Life Sciences & Earth Sciences (AREA)
- Immunology (AREA)
- Pathology (AREA)
- Health & Medical Sciences (AREA)
- Biochemistry (AREA)
- General Health & Medical Sciences (AREA)
- General Physics & Mathematics (AREA)
- Spectroscopy & Molecular Physics (AREA)
- Crystallography & Structural Chemistry (AREA)
- Engineering & Computer Science (AREA)
- Bioinformatics & Cheminformatics (AREA)
- Bioinformatics & Computational Biology (AREA)
- Computing Systems (AREA)
- Theoretical Computer Science (AREA)
- Chemical Kinetics & Catalysis (AREA)
- Electrochemistry (AREA)
- Other Investigation Or Analysis Of Materials By Electrical Means (AREA)
Priority Applications (4)
| Application Number | Priority Date | Filing Date | Title |
|---|---|---|---|
| PCT/JP2020/021064 WO2021240710A1 (ja) | 2020-05-28 | 2020-05-28 | クロマトグラフ質量分析データ処理方法、クロマトグラフ質量分析装置、及びクロマトグラフ質量分析データ処理用プログラム |
| JP2022527380A JP7359302B2 (ja) | 2020-05-28 | 2020-05-28 | クロマトグラフ質量分析データ処理方法、クロマトグラフ質量分析装置、及びクロマトグラフ質量分析データ処理用プログラム |
| US17/999,004 US20230178348A1 (en) | 2020-05-28 | 2020-05-28 | Chromatograph mass spectrometry data processing method, chromatograph mass spectrometer, and chromatograph mass spectrometry data processing program |
| CN202080100607.0A CN115516301A (zh) | 2020-05-28 | 2020-05-28 | 色谱质量分析数据处理方法、色谱质量分析装置以及色谱质量分析数据处理用程序 |
Applications Claiming Priority (1)
| Application Number | Priority Date | Filing Date | Title |
|---|---|---|---|
| PCT/JP2020/021064 WO2021240710A1 (ja) | 2020-05-28 | 2020-05-28 | クロマトグラフ質量分析データ処理方法、クロマトグラフ質量分析装置、及びクロマトグラフ質量分析データ処理用プログラム |
Publications (1)
| Publication Number | Publication Date |
|---|---|
| WO2021240710A1 true WO2021240710A1 (ja) | 2021-12-02 |
Family
ID=78723114
Family Applications (1)
| Application Number | Title | Priority Date | Filing Date |
|---|---|---|---|
| PCT/JP2020/021064 WO2021240710A1 (ja) | 2020-05-28 | 2020-05-28 | クロマトグラフ質量分析データ処理方法、クロマトグラフ質量分析装置、及びクロマトグラフ質量分析データ処理用プログラム |
Country Status (4)
| Country | Link |
|---|---|
| US (1) | US20230178348A1 (zh) |
| JP (1) | JP7359302B2 (zh) |
| CN (1) | CN115516301A (zh) |
| WO (1) | WO2021240710A1 (zh) |
Cited By (1)
| Publication number | Priority date | Publication date | Assignee | Title |
|---|---|---|---|---|
| CN115236260A (zh) * | 2022-09-16 | 2022-10-25 | 华谱科仪(北京)科技有限公司 | 一种色谱数据储存方法、装置、电子设备及存储介质 |
Citations (5)
| Publication number | Priority date | Publication date | Assignee | Title |
|---|---|---|---|---|
| JP4848454B2 (ja) * | 2006-05-10 | 2011-12-28 | マイクロマス ユーケー リミテッド | 質量分析計 |
| JP2013537312A (ja) * | 2010-09-15 | 2013-09-30 | ディーエイチ テクノロジーズ デベロップメント プライベート リミテッド | 生成イオンスペクトルのデータ独立取得および参照スペクトルライブラリ照合 |
| JP2013231715A (ja) * | 2012-04-27 | 2013-11-14 | Shimadzu Corp | 質量分析データ処理方法及び質量分析データ処理装置 |
| WO2015107690A1 (ja) * | 2014-01-20 | 2015-07-23 | 株式会社島津製作所 | タンデム質量分析データ処理装置 |
| WO2019012589A1 (ja) * | 2017-07-10 | 2019-01-17 | 株式会社島津製作所 | 質量分析装置、質量分析方法、及び質量分析用プログラム |
Family Cites Families (7)
| Publication number | Priority date | Publication date | Assignee | Title |
|---|---|---|---|---|
| JP2005055370A (ja) * | 2003-08-06 | 2005-03-03 | Hitachi High-Technologies Corp | 液体クロマトグラフ質量分析データ解析装置 |
| EP2295958B1 (en) * | 2008-06-04 | 2018-04-04 | Shimadzu Corporation | Mass analysis data analyzing method and mass analysis data analyzing apparatus |
| JP5372623B2 (ja) * | 2009-07-03 | 2013-12-18 | 株式会社日立製作所 | 質量分析装置及び質量分析方法 |
| JP5810983B2 (ja) * | 2012-03-12 | 2015-11-11 | 株式会社島津製作所 | 質量分析を用いた化合物同定方法及び化合物同定システム |
| JP6149810B2 (ja) * | 2014-06-13 | 2017-06-21 | 株式会社島津製作所 | 代謝物解析システム及び代謝物解析方法 |
| JP6595922B2 (ja) * | 2016-01-22 | 2019-10-23 | 日本電子株式会社 | マススペクトル解析装置、マススペクトル解析方法、質量分析装置、およびプログラム |
| JP6718694B2 (ja) * | 2016-02-10 | 2020-07-08 | 日本電子株式会社 | マススペクトル解析装置、マススペクトル解析方法、および質量分析装置 |
-
2020
- 2020-05-28 CN CN202080100607.0A patent/CN115516301A/zh active Pending
- 2020-05-28 WO PCT/JP2020/021064 patent/WO2021240710A1/ja active Application Filing
- 2020-05-28 JP JP2022527380A patent/JP7359302B2/ja active Active
- 2020-05-28 US US17/999,004 patent/US20230178348A1/en active Pending
Patent Citations (5)
| Publication number | Priority date | Publication date | Assignee | Title |
|---|---|---|---|---|
| JP4848454B2 (ja) * | 2006-05-10 | 2011-12-28 | マイクロマス ユーケー リミテッド | 質量分析計 |
| JP2013537312A (ja) * | 2010-09-15 | 2013-09-30 | ディーエイチ テクノロジーズ デベロップメント プライベート リミテッド | 生成イオンスペクトルのデータ独立取得および参照スペクトルライブラリ照合 |
| JP2013231715A (ja) * | 2012-04-27 | 2013-11-14 | Shimadzu Corp | 質量分析データ処理方法及び質量分析データ処理装置 |
| WO2015107690A1 (ja) * | 2014-01-20 | 2015-07-23 | 株式会社島津製作所 | タンデム質量分析データ処理装置 |
| WO2019012589A1 (ja) * | 2017-07-10 | 2019-01-17 | 株式会社島津製作所 | 質量分析装置、質量分析方法、及び質量分析用プログラム |
Non-Patent Citations (5)
| Title |
|---|
| ANONYMOUS: "By mass spectrometry informatics Interpretation of MS / MS spectrum and estimation of natural product structure", MS/MS, vol. 37, no. 2, 21 October 2019 (2019-10-21), pages 45 - 50, XP055878017, Retrieved from the Internet <URL:https://doi.org/10.11546/cicsj.37.45> * |
| BOWLER RUSSELL P., WENDT CHRIS H., FESSLER MICHAEL B., FOSTER MATTHEW W., KELLY RACHEL S., LASKY-SU JESSICA, ROGERS ANGELA J., STR: "New Strategies and Challenges in Lung Proteomics and Metabolomics", ANN. AM. THORAC. SOC., vol. 14, no. 12, pages 1721 - 1743, XP055878020, Retrieved from the Internet <URL:https://doi.org/10.1513/AnnalsATS.201710-770WS> * |
| PERIS-DIAZ MANUEL D. ET AL.: "R-MetaboList 2: A Flexible Tool for Metabolite Annotation from High-Resolution Data-Independent Acquisition Mass Spectrometry Analysi s", METABOLITES, vol. 9, no. 187, 17 September 2019 (2019-09-17), pages 1 - 16, XP055784938, Retrieved from the Internet <URL:https://doi.org/10.3390/metabo9090187> * |
| SENTANDREU, ENRIQUE ET AL.: "A Survey of Orbitrap All Ion Fragmentation Analysis Assessed by an R MetaboList Package to Study Small-Molecule Metabolites", CHROMATOGRAPHIA, vol. 81, 11 May 2018 (2018-05-11), pages 981 - 994, XP036536960, Retrieved from the Internet <URL:https://doi.org/10.1007/s10337-018-3536-y> DOI: 10.1007/s10337-018-3536-y * |
| TSUGAWA HIROSHI, CAJKA TOMAS, KIND TOBIAS, MA YAN, HIGGINS BRENDAN, IKEDA KAZUTAKA, KANAZAWA MITSUHIRO, VANDERGHEYNST JEAN, FIEHN : "MS-DIAL: Data Independent MS/MS Deconvolution for Comprehensive Metabolome Analysis", NAT METHODS. AUTHOR MANUSCRIPT, vol. 12, no. 6, 1 December 2015 (2015-12-01), pages 523 - 526, XP055574922, Retrieved from the Internet <URL:http://ncbi.nlm.nih.gov/pmc/articles/PMC4449330/pdf/nihms680470.pdf> * |
Cited By (1)
| Publication number | Priority date | Publication date | Assignee | Title |
|---|---|---|---|---|
| CN115236260A (zh) * | 2022-09-16 | 2022-10-25 | 华谱科仪(北京)科技有限公司 | 一种色谱数据储存方法、装置、电子设备及存储介质 |
Also Published As
| Publication number | Publication date |
|---|---|
| JP7359302B2 (ja) | 2023-10-11 |
| US20230178348A1 (en) | 2023-06-08 |
| JPWO2021240710A1 (zh) | 2021-12-02 |
| CN115516301A (zh) | 2022-12-23 |
Similar Documents
| Publication | Publication Date | Title |
|---|---|---|
| US10658165B2 (en) | Isotopic pattern recognition | |
| EP2798664B1 (en) | Use of windowed mass spectrometry data for retention time determination or confirmation | |
| US11378560B2 (en) | Mass spectrum data acquisition and analysis method | |
| JP6065983B2 (ja) | クロマトグラフ質量分析用データ処理装置 | |
| US10408803B2 (en) | Mass spectrometer detection and analysis method | |
| US20200365237A1 (en) | Stable Label Isotope Tracing for Untargeted Data | |
| WO2013104004A1 (en) | Comprehensive interference treatment for icp-ms analysis | |
| JPWO2008035419A1 (ja) | 質量分析方法 | |
| US9947519B2 (en) | Computational method and system for deducing sugar chains using tandem MSn spectrometry data | |
| US7529630B2 (en) | Method of analyzing mass analysis data and apparatus for the method | |
| WO2020194582A1 (ja) | クロマトグラフ質量分析装置 | |
| WO2018163926A1 (ja) | タンデム型質量分析装置及び該装置用プログラム | |
| WO2021240710A1 (ja) | クロマトグラフ質量分析データ処理方法、クロマトグラフ質量分析装置、及びクロマトグラフ質量分析データ処理用プログラム | |
| US11094399B2 (en) | Method, system and program for analyzing mass spectrometoric data | |
| JP5056169B2 (ja) | 質量分析データ解析方法及び装置 | |
| US20220262610A1 (en) | Method of Performing IDA with CID-ECD | |
| WO2021240609A1 (ja) | クロマトグラフ質量分析データ処理方法、クロマトグラフ質量分析装置、及びクロマトグラフ質量分析データ処理用プログラム | |
| JP7380866B2 (ja) | クロマトグラフ質量分析データ処理方法、クロマトグラフ質量分析装置、及びクロマトグラフ質量分析データ処理用プログラム | |
| US20220301839A1 (en) | Method for analyzing mass spectrometry data, computer program medium, and device for analyzing mass spectrometry data | |
| JP7400698B2 (ja) | クロマトグラフ質量分析装置 | |
| US11587774B2 (en) | Using real time search results to dynamically exclude product ions that may be present in the master scan | |
| US20230384274A1 (en) | Methods, mediums, and systems for targeted isotope clustering |
Legal Events
| Date | Code | Title | Description |
|---|---|---|---|
| 121 | Ep: the epo has been informed by wipo that ep was designated in this application |
Ref document number: 20938045 Country of ref document: EP Kind code of ref document: A1 |
|
| ENP | Entry into the national phase |
Ref document number: 2022527380 Country of ref document: JP Kind code of ref document: A |
|
| NENP | Non-entry into the national phase |
Ref country code: DE |
|
| 122 | Ep: pct application non-entry in european phase |
Ref document number: 20938045 Country of ref document: EP Kind code of ref document: A1 |