WO2021014695A1 - 分析装置及び分析方法 - Google Patents
分析装置及び分析方法 Download PDFInfo
- Publication number
- WO2021014695A1 WO2021014695A1 PCT/JP2020/015773 JP2020015773W WO2021014695A1 WO 2021014695 A1 WO2021014695 A1 WO 2021014695A1 JP 2020015773 W JP2020015773 W JP 2020015773W WO 2021014695 A1 WO2021014695 A1 WO 2021014695A1
- Authority
- WO
- WIPO (PCT)
- Prior art keywords
- abnormality
- analyzer
- analysis
- parameter
- unit
- Prior art date
Links
Images


Classifications
-
- G—PHYSICS
- G01—MEASURING; TESTING
- G01N—INVESTIGATING OR ANALYSING MATERIALS BY DETERMINING THEIR CHEMICAL OR PHYSICAL PROPERTIES
- G01N27/00—Investigating or analysing materials by the use of electric, electrochemical, or magnetic means
- G01N27/26—Investigating or analysing materials by the use of electric, electrochemical, or magnetic means by investigating electrochemical variables; by using electrolysis or electrophoresis
- G01N27/416—Systems
- G01N27/4163—Systems checking the operation of, or calibrating, the measuring apparatus
-
- G—PHYSICS
- G01—MEASURING; TESTING
- G01N—INVESTIGATING OR ANALYSING MATERIALS BY DETERMINING THEIR CHEMICAL OR PHYSICAL PROPERTIES
- G01N27/00—Investigating or analysing materials by the use of electric, electrochemical, or magnetic means
- G01N27/26—Investigating or analysing materials by the use of electric, electrochemical, or magnetic means by investigating electrochemical variables; by using electrolysis or electrophoresis
- G01N27/28—Electrolytic cell components
- G01N27/30—Electrodes, e.g. test electrodes; Half-cells
- G01N27/333—Ion-selective electrodes or membranes
-
- G—PHYSICS
- G01—MEASURING; TESTING
- G01N—INVESTIGATING OR ANALYSING MATERIALS BY DETERMINING THEIR CHEMICAL OR PHYSICAL PROPERTIES
- G01N27/00—Investigating or analysing materials by the use of electric, electrochemical, or magnetic means
- G01N27/26—Investigating or analysing materials by the use of electric, electrochemical, or magnetic means by investigating electrochemical variables; by using electrolysis or electrophoresis
- G01N27/403—Cells and electrode assemblies
- G01N27/4035—Combination of a single ion-sensing electrode and a single reference electrode
Definitions
- This disclosure relates to an analyzer and an analysis method.
- ISE ion-selective electrodes
- An electrolyte analysis unit having an ion-selective electrode is mounted on, for example, an automatic analyzer.
- the automatic analyzer is preferably used alone or as an element of an automatic biochemical analyzer for performing automatic, rapid and continuous clinical examinations.
- the ion-selective electrode is used in combination with the reference electrode, and the activity (concentration) of the target ion can be obtained by measuring the potential difference generated between the ion-selective electrode and the reference electrode.
- concentration concentration of electrolytes contained in blood, which is a biological sample, particularly in samples such as serum, plasma, and urine.
- these samples are measured as they are by using an ion-selective electrode, that is, by using a so-called non-dilution method.
- a so-called dilution method in which a predetermined amount of a diluent is added to a predetermined amount of a sample, mixed, diluted, and then measured using an ion-selective electrode.
- the dilution method has the features that the required amount of sample is small, the concentration of coexisting substances such as proteins and lipids in the measuring solution is low, the influence of contamination by coexisting substances is small, and the stability of the ion-selective electrode is high. Therefore, in the analysis of electrolyte concentration using an automatic analyzer, the combination of a flow cell type ion-selective electrode and a dilution method is currently the mainstream.
- a container called a dilution tank is used for diluting the sample, and the diluted sample (measurement solution) prepared in the dilution tank is sent to the flow cell type ion-selective electrode through a pipe for measurement. Dispense the internal standard solution into the dilution tank alternately with the sample, and measure alternately with the sample.
- the electrolyte concentration in the living body is usually maintained in a narrow concentration range, and even a slight change in concentration is significant clinically and therapeutically. Therefore, the ion-selective electrode is required to have extremely high measurement accuracy, and various technological developments have been made to reduce the measurement error as much as possible.
- Patent Document 1 describes a method of identifying a defective component by referring to a potential at a driving timing of the component as a method of identifying the cause of an error in the measured value of the ion-selective electrode. There is.
- Causes of measurement error include air bubbles in the flow path between the ion-selective electrode and the reference electrode, vibration of the liquid in the flow path, and electrical noise in the measurement system. , Normal potential cannot be output due to these error causes. Further, it is considered that the cause of these errors is caused by a defect of a component of the analyzer or the installation environment of the analyzer, and the measurement error may reoccur unless the cause of the error is removed. Therefore, in order to obtain highly accurate analysis results, it is necessary to identify and improve the causes of these errors.
- Patent Document 1 it is necessary to identify the cause of the error due to the installation environment of the analyzer and the cause of the error due to the defect of the component whose drive timing signal cannot be acquired. Is difficult.
- the present disclosure provides a technique for analyzing an abnormality in an analyzer using an ion-selective electrode.
- the analyzer of the present disclosure is an analyzer that measures an ion concentration in a sample, and comprises an ion-selective electrode that obtains a potential based on the ion concentration, a reference electrode that obtains a potential based on a reference solution, and the ion selectivity.
- a measurement unit that measures the electromotive force between the electrode and the reference electrode, an analysis unit that analyzes the potential change of the electromotive force in a predetermined time region, and a relationship between the potential change and an abnormality of the analyzer.
- the analysis unit includes a storage unit for storing anomalous analysis data indicating the above, and the analysis unit acquires parameters for the potential change of the electromotive force measured by the measurement unit and stores the parameters and the storage unit. It is characterized in that the abnormality of the analyzer is analyzed based on the obtained abnormality analysis data.
- the analyzer according to the present disclosure can analyze an abnormality in an analyzer using an ion-selective electrode. Issues, configurations and effects other than those described above will be clarified by the description of the following embodiments.
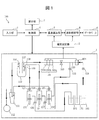
- FIG. 1 is a schematic view showing an analyzer 100 according to the first embodiment.
- the analyzer 100 includes an electrolyte analysis unit 1, a potential measurement unit 2 (measurement unit), an input unit 3, a control unit 4, a concentration calculation unit 5, a database 6, a display unit 7, and a waveform analysis unit 8. (Analysis unit) is provided.
- the electrolyte analysis unit 1 includes three types of ion-selective electrodes 101 (chlorine ion electrode 101a, potassium ion electrode 101b and sodium ion electrode 101c), a comparison electrode 104 (reference electrode), a pinch valve 105, a vacuum suction nozzle 106, and a shipper nozzle.
- ion-selective electrodes 101 chlorine ion electrode 101a, potassium ion electrode 101b and sodium ion electrode 101c
- a comparison electrode 104 reference electrode
- pinch valve 105 a vacuum suction nozzle 106
- shipper nozzle shipper nozzle
- Diluting liquid supply nozzle 108 Diluting liquid supply nozzle 108
- Internal standard liquid supply nozzle 109 Diluting tank 110
- Waste liquid tank 111 Waste liquid tank 111
- Vacuum pump 112 Electromagnetic valves 121 to 127
- Internal standard liquid syringe pump 131 Diluting liquid syringe pump 132
- Shipper syringe It includes a pump 133, an internal standard solution bottle 141, a diluent bottle 151 and a comparative electrode solution bottle 161.
- the ion-selective electrode 101 for example, a flow cell type ion-selective electrode can be used.
- the number of ion-selective electrodes 101 can be changed according to the number of ion species to be measured.
- the ion-selective electrode 101 is applicable to all ion species.
- the ion-selective electrode 101 generates an electric potential according to the ion concentration in the sample (sample).
- the comparative electrode solution bottle 161 contains the comparative electrode solution (reference solution), and the comparative electrode solution is introduced into the flow path of the comparative electrode 104 by the shipper syringe pump 133.
- the comparative electrode solution for example, an aqueous potassium chloride solution can be used.
- the comparison electrode 104 generates an electric potential according to the ion concentration in the comparison electrode solution.
- the internal standard solution bottle 141 contains the internal standard solution (IS), and the internal standard solution is dispensed into the dilution tank 110 by the internal standard solution syringe pump 131 and the internal standard solution supply nozzle 109.
- IS internal standard solution
- the sample is dispensed into the dilution tank 110 by a sampling mechanism (not shown).
- the diluent bottle 151 contains the diluent, and the diluent is dispensed into the diluent tank 110 by the diluent pump 132 and the diluent supply nozzle 108 and mixed with the sample.
- sample (S) the internal standard solution or the measurement solution in which the sample and the diluent are mixed
- the operation when the liquid filled in the dilution tank 110 is filled into the measurement flow path will be described.
- the solenoid valve 121 and the solenoid valve 125 are closed, the pinch valve 105 and the solenoid valve 122 are opened, and the shipper nozzle 107 is opened. It is lowered into the dilution tank 110 and the shipper syringe pump 133 is pulled.
- the comparison electrode solution is released from the comparison electrode solution bottle 161 by opening the solenoid valve 121, closing the pinch valve 105, and pulling the shipper syringe pump 133. It is introduced into the flow path of the comparison electrode 104. Further, in order to discharge the liquid accumulated in the shipper syringe pump 133, the solenoid valve 122 is closed, the solenoid valve 125 is opened, and the shipper syringe pump 133 is pushed.
- the comparative electrode solution introduced into the flow path of the comparative electrode 104 and the sample introduced into the ion-selective electrode 101 are in contact with each other at the liquid junction 120, and the ion-selective electrode 101 and the comparative electrode 104 are in contact with each other. It becomes electrically connected through.
- the vacuum suction nozzle 106 is lowered and the vacuum pump 112 is driven to drive the diluting tank 110.
- the liquid (sample or internal standard liquid) remaining inside is sucked and discarded in the waste liquid tank 111.
- the comparative electrode liquid introduced into the comparative electrode 104 is discarded in the waste liquid tank 111 by operating the solenoid valve 121, the vacuum pump 112, and the shipper syringe pump 133.
- the potential difference (electromotive force) between the comparative electrode 104 and each ion-selective electrode 101 changes depending on the ion concentration of the analysis target in the sample introduced into the flow path of the ion-selective electrode 101.
- the potential measurement unit 2 measures the electromotive force and outputs the measurement result (time transition of the electromotive force, etc.) to the concentration calculation unit 5 and the waveform analysis unit 8.
- electromotive force may be simply referred to as "potential”.
- a predetermined time width including a time for calculating the ion concentration may be referred to as a “predetermined time domain”.
- the predetermined acquisition start time of the time domain t i the acquisition end time t e can be arbitrarily set.
- the time interval (sampling rate) of the potential measurement by the potential measuring unit 2 can be, for example, 0.006 seconds or less.
- the concentration calculation unit 5 calculates the ion concentration based on the potential measurement result by the potential measurement unit 2. As a method for measuring the ion concentration, a known method can be adopted. Further, as will be described later, the concentration calculation unit 5 calculates the standard deviation ⁇ of the potential in a predetermined time domain, the difference ⁇ V between the maximum value and the minimum value, and the average value Vavg .
- the waveform analysis unit 8 performs regression analysis and frequency analysis (these may be referred to as “waveform analysis”) on the waveform of the potential change of the potential measured by the potential measurement unit 2, and the analyzer 100 Analyze the cause of the abnormality.
- the input unit 3 is an input device such as a mouse, keyboard, or touch panel, and is used by a user to input various data and instructions to the analyzer 100.
- the control unit 4 controls the entire analyzer 100. Specifically, the control unit 4 performs drive control of each configuration of the electrolyte analysis unit 1, processing control in the concentration calculation unit 5 and the waveform analysis unit 8, display control in the display unit 7, and the like. Further, the control unit 4 receives the input from the input unit 3. The processing in the control unit 4, the concentration calculation unit 5, and the waveform analysis unit 8 may be executed by one processor mounted on the analyzer 100.
- the display unit 7 displays the processing results of the density calculation unit 5 and the waveform analysis unit 8, the GUI screen, and the like.
- the database 6 stores data required for processing by the concentration calculation unit 5 and the waveform analysis unit 8, the results of processing by the concentration calculation unit 5 and the waveform analysis unit 8, and the like. As data necessary for processing by the waveform analysis unit 8, the database 6 stores data showing the relationship between the potential change measured by the potential measurement unit 2 and the cause of the abnormality of the analyzer 100.
- FIG. 1 shows a form in which the database 6 is built in the analyzer 100.
- the database 6 is not limited to this, and is used in all forms such as a form of connecting to the Internet, a form of being removable from the analyzer 100, a form of connecting a storage medium to the analyzer 100, or a form in which each is combined. be able to.
- the database 6, the concentration calculation unit 5, and the waveform analysis unit 8 are configured to be capable of transmitting and receiving data, respectively, and can be connected to the Internet, for example, to acquire measurement data online.
- the potential measurement unit 2, the input unit 3, the control unit 4, the concentration calculation unit 5, the display unit 7, and the waveform analysis unit 8 do not all need to be built in the analyzer 100, and one of them is required.
- the unit may be provided in another device, and data may be exchanged by communicating between the other device and the analyzer 100.
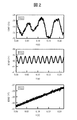
- FIG. 2 is a graph showing the potential change V (t) when a measurement error occurs.
- the graphs of FIG. 2 show the potential change V (t), which is the temporal change of the potential output by the potential measuring unit 2, the horizontal axis is the time t (seconds), and the vertical axis is the electromotive force EMF (V). Is.
- the potential change V (t) shows a potential waveform according to the cause of the measurement error (error cause), and a clear difference in gradient and frequency can be confirmed. Examples of the cause of the error include bubbles mixed in the flow path, vibration of the electrolyte analysis unit 1, electrical noise, and the like.
- the cause of the error can be identified by acquiring and analyzing the parameters related to the potential change V (t).
- V the potential change
- the potential waveform when no abnormality has occurred becomes a linear shape maintained at a certain electromotive force.
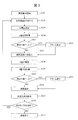
- FIG. 3 is a flowchart showing an analysis method according to a reference example.
- step S301 when the user inputs an operation start instruction from the input unit 3, the control unit 4 drives the electrolyte analysis unit 1 and starts the measurement operation.
- step S302 the electrolyte analysis unit 1 drives the syringe pump 131 for the internal standard solution, the solenoid valves 123 and 126, and introduces the internal standard solution (IS) from the internal standard solution supply nozzle 109 into the dilution tank 110. Introduce the internal standard solution into the measurement flow path.
- IS internal standard solution
- step S303 the potential measuring unit 2 measures the potential difference (electromotive force) between the comparison electrode 104 and each ion-selective electrode 101, and outputs the potential difference (electromotive force) to the concentration calculation unit 5 as an internal standard liquid potential.
- step S304 the concentration calculation unit 5 acquires the internal standard liquid potential (IS potential).
- the concentration calculation unit 5 calculates the standard deviation ⁇ (IS) of the internal standard liquid potential, the difference ⁇ V (IS) between the maximum value and the minimum value, and the mean value Vavg (IS), and refers to the database 6. Then, it is compared with these thresholds (abnormal thresholds) stored in the database 6. Thereby, it is determined whether or not there is an abnormality in the measured internal standard liquid potential.
- the maximum value and the range of values that can be determined that no abnormality has occurred are stored as the abnormality thresholds of ⁇ (IS), ⁇ V (IS), and Avg (IS). There is.
- the concentration calculation unit 5 sets each parameter (standard deviation ⁇ (IS), maximum value) calculated from the internal standard liquid potential in both the case where it is determined that there is an abnormality and the case where it is determined that there is no abnormality.
- the difference ⁇ V (IS) of the minimum value and the mean value Vavg (IS)) are stored in the database 6.
- step S306 the display unit 7 displays an alarm for notifying the user of the abnormality.
- the electrolyte analysis unit 1 discharges the remaining internal standard solution from the dilution tank 110 before carrying out the next step S307.
- step S307 the electrolyte analysis unit 1 introduces the sample into the dilution tank 110 by a sampling mechanism (not shown in FIG. 1), drives the syringe pump 132 for the diluent, and introduces the diluent from the diluent supply nozzle 108. , Obtain a sample that is a mixture.
- the solenoid valve 121 and the solenoid valve 125 are closed, the pinch valve 105 and the solenoid valve 122 are opened, the sipper nozzle 107 is lowered into the dilution tank 110, and the sipper syringe pump 133 is driven to drive a sample (sample) in the measurement flow path. S) is introduced.
- step S308 the potential measuring unit 2 measures the potential difference (electromotive force) between the comparison electrode 104 and each ion-selective electrode 101, and outputs the potential difference (electromotive force) to the concentration calculation unit 5 as a sample potential.
- step S309 the concentration calculation unit 5 acquires the sample potential (S potential).
- the electrolyte analysis unit 1 discharges the remaining sample in the dilution tank 110.
- step S310 the concentration calculation unit 5 calculates the standard deviation ⁇ (S) of the sample potential, the difference ⁇ V (S) between the maximum value and the minimum value, and the mean value Vavg (S), and stores them in the database 6. Compare with the abnormal threshold of. Thereby, it is determined whether or not there is an abnormality in the measured sample potential. Further, the concentration calculation unit 5 has calculated each parameter (standard deviation ⁇ (S), maximum value and minimum value) from the sample potential in both the case where it is determined that there is an abnormality and the case where it is determined that there is no abnormality. The difference ⁇ V (S) and the mean value Vavg (S)) are stored in the database 6.
- step S311 the display unit 7 displays an alarm for notifying the user of the abnormality.
- step S312 the concentration calculation unit 5 calculates the ion concentration in the sample based on the average value Vavg (IS) of the internal standard liquid potential and the average value Vavg (S) of the sample potential. Further, the concentration calculation unit 5 stores the calculated ion concentration in the database 6.
- step S313 the display unit 7 displays the calculated ion concentration (measurement result).
- step S314 the control unit 4 determines whether or not there is the next sample. For example, prior to step S301, the number of samples to be measured is input to the analyzer 100 in advance, and the control unit 4 compares the number of samples to be measured with the number of measured samples to obtain the next sample. The presence or absence can be determined.
- step S302 If there is a next sample (YES), return to step S302 and measure the ion concentration in the same manner. If there is no next sample (NO), the process proceeds to step S315 to end the measurement.
- the cause of the error may be unknown only by the alarm display based on the above-mentioned standard deviation ⁇ , the difference ⁇ V between the maximum value and the minimum value, and the average value Vavg , and the work for identifying the cause of the error or the recovery work It takes time.
- the potential waveform is analyzed by the waveform analysis unit 8 after the potential is measured by the potential measurement unit 2, and parameters related to the potential waveform are acquired. To identify the cause of the error.
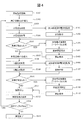
- FIG. 4 is a flowchart showing an analysis method according to the first embodiment.
- the same reference numbers are given to steps similar to the steps shown in FIG.
- only the differences from the flowchart of FIG. 3 will be described.
- steps S401 and S402 are executed by the waveform analysis unit 8 in parallel with the acquisition of the internal standard liquid potential (IS potential) by the potential measurement unit 2 (step S304).
- IS potential internal standard liquid potential
- step S401 the waveform analysis unit 8 acquires the internal standard liquid potential for waveform analysis from the potential measurement unit 2.
- the internal standard liquid potential for waveform analysis is the potential in a predetermined time domain. Acquisition start time t i the acquisition end time t e of the internal standard solution potential for waveform analysis can is arbitrarily set.
- step S402 the waveform analysis unit 8 acquires the parameters (gradient, etc.) of the potential change V (t) of the internal standard liquid potential and the parameters related to the frequency by the waveform analysis, and stores them in the database 6. Details of the acquisition method of these parameters will be described later.
- step S305 there is an abnormality in the internal standard liquid potential from the standard deviation ⁇ (IS) calculated by the concentration calculation unit 5, the difference ⁇ V (IS) between the maximum value and the minimum value, and the mean value Vavg (IS). If it is determined (YES), steps S403 to S405 are executed instead of step S306.
- an abnormal threshold of parameters related to the gradient and frequency of the potential change V (t), an error cause when a certain parameter exceeds the abnormal threshold, a description of a coping method for the error cause, and an error cause are caused.
- Error identification data error analysis data
- the abnormality identification data stored in the database 6 may be based on the waveform information of the potential change V (t) at the time of shipment of the device or continuous operation, or may be arbitrarily set. You may.
- the waveform analysis unit 8 refers to the database 6 and compares each parameter calculated in step S402 with the abnormality threshold value.
- step S404 the waveform analysis unit 8 identifies the cause of the error and the countermeasures thereof based on the comparison result between each parameter and the abnormality threshold value and the abnormality identification data of the database 6. Details of the method for identifying the cause of the error will be described later.
- step S405 the display unit 7 displays the identified cause of the error and the remedy for the error, and notifies the user.
- steps S307 and S308 are executed in the same manner as in the reference example.
- steps S406 and S407 are executed by the waveform analysis unit 8 in parallel with step S309.
- steps S401 and 402 described above the potential change V (t) of the internal standard liquid potential for waveform analysis was acquired, but in steps S406 and S407, the sample potential for waveform analysis was acquired and the sample potential was acquired.
- the parameters (gradient, etc.) of the potential change V (t) and the parameters related to the frequency are acquired and stored in the database 6.
- step S310 it is determined that there is an abnormality in the sample potential from the standard deviation ⁇ (S) calculated by the concentration calculation unit 5, the difference ⁇ V (S) between the maximum value and the minimum value, and the average value Vavg (S). If so (YES), steps S408 to S410 are executed instead of step S311.
- Steps S408 to S410 are different from steps S403 to S405 only in that the sample potential for waveform analysis is processed instead of the internal standard liquid potential for waveform analysis, and thus the description thereof will be omitted.
- steps S312 to S315 are executed in the same manner as in the reference example. In this way, by identifying the cause of the error in parallel with the calculation of the ion concentration by the concentration calculation unit 5, the processing time per measurement can be shortened and the measurement throughput can be improved.
- the analysis method of the present embodiment is not limited to the steps described above, and may include additional steps.
- the control unit 4 can determine the necessity of the remeasurement and execute the remeasurement if necessary.
- the display unit 7 may display a GUI screen for inputting the necessity of remeasurement to the user, and the input unit 3 may input the necessity of remeasurement to prompt the user to remeasure. ..
- the reliability of the measured value of the ion-selective electrode can be ensured.
- Method of acquiring parameters of potential change V (t) The method of acquiring parameters by regression analysis of the potential change V (t) of the internal standard liquid potential and the sample potential in steps S402 and S407 will be described more specifically.
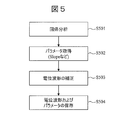
- FIG. 5 is a flowchart showing a method of acquiring the parameter of the potential change V (t).
- V (t) an example of the parameter of the potential change V (t)
- Slope which is an index of the gradient
- step S501 the waveform analysis unit 8, in order to obtain the Slope is indicative of the slope of the approximate formula (1) using the potential change V (t) (t i ⁇ t ⁇ t e), regression Perform the analysis.
- V 0 is the voltage at time t i.
- step S502 the waveform analysis unit 8 acquires Slope, which is an index of the gradient of the potential change V (t), as a parameter from the result of the regression analysis described above.
- step S503 the waveform analysis unit 8 obtains the corrected potential change V corr (t) by using the following mathematical formula (2). As a result, V corr (t) whose slope is close to 0 can be obtained. By performing this step S503, the slope of the potential change V (t) is corrected to a value close to 0, so that the frequency analysis of the potential change V (t) described later can be facilitated.
- step S504 the potential changes V (t) and V corr (t), and the parameters V 0 and Slope are stored in the database 6.
- Database 6 stores the abnormal threshold value of Slope.
- the waveform analysis unit 8 compares the Slope value obtained from the regression analysis for each of the internal standard liquid potential and the sample potential with the abnormal threshold value stored in the database 6.
- the potential change V (t) may use not only a linear approximate expression such as the equation (1) but also an approximate expression such as a polymorphic function, an exponential function, a logarithmic function, and a trigonometric function.
- the parameter of the potential change V (t) is not limited to Slope and can be freely set.
- V corr (t) can be freely set depending on the type of approximate expression used.
- the waveform analysis unit 8 further correlates the values regressed by each method of regression analysis (least squares method, maximum likelihood estimation method, Bayesian estimation, machine learning algorithm) with the measured values.
- Correlation parameters may be acquired as an index for evaluating.
- the correlation parameter is a coefficient of determination used in the least squares method or the like, a chi-square value, or the like, and is used as an index of reliability of regression analysis accuracy.
- the waveform analysis unit 8 can acquire the correlation parameter and evaluate the correlation between the result of the regression analysis and the potential change V (t).
- the waveform analysis unit 8 refers to a certain parameter A (Slope or the like) obtained by regression analysis and the correlation parameter, and determines that the parameter A is not adopted when the correlation parameter (reliability) is low. be able to.
- a plurality of correlation parameters can be acquired in each method of regression analysis, and each of them can be used in combination. Furthermore, since the correlation parameters used by each method of regression analysis are different, it is possible to acquire the correlation parameters for each method at the same time.
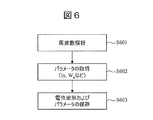
- FIG. 6 is a flowchart showing a method of acquiring a parameter related to the frequency of the potential change V (t).
- step S601 the waveform analysis unit 8, to the time domain of the potential change V (t) (t i ⁇ t ⁇ t e), to analyze the frequency components contained in the potential change V (t).
- step S502 the waveform analysis unit 8 to analyze the frequency components contained in the potential change V (t).
- step S502 if the value of Slope acquired in step S502 is large, the above-mentioned corrected potential change V corr (t) may be used.
- known methods such as fast Fourier transform (FFT) and spectral power density transform can be adopted.
- FFT fast Fourier transform
- spectral power density transform can be adopted.
- step S602 the waveform analysis unit 8, the intensity distribution of each frequency component analyzed calculated in step S601, the central value x n and the intensity I n each peak of the intensity distribution of the frequency, the information about the width W n parameters Extract as.
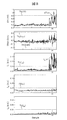
- FIG. 7 is a diagram showing an example of analysis of a frequency component included in the potential change V (t) by a fast Fourier transform.
- the potential change V of each of the data A and the data B showing two different potential changes V (t) (1 ms ⁇ t ⁇ 3000 ms) is subjected to a fast Fourier transform.
- the intensity distribution F (x) of the frequency component contained in (t) (lower part of FIG. 7) is extracted, and the intensity distribution F (x) is subjected to regression analysis by the following equation (3).
- the median x n for the k of the intensity distribution respectively, the intensity I n, the width W n, it is possible to determine the constant y n.
- the median x n for each peak of the intensity distribution F (x), intensity I n to extract the correlated to the width W n, or related parameter
- other methods may be used, not limited to the fast Fourier transform and the spectral power density transform.
- step S603 the parameter values (median x n for the k of the intensity distribution, respectively, the intensity I n, the width W n, constant y n) is stored into the database 6.
- the causes of the error are the standard deviation ⁇ of the potential change V (t), the difference ⁇ V between the maximum and minimum values, the mean value Vavg , the Slope obtained by regression analysis, and the median value x of the intensity distribution obtained by frequency analysis.
- n the interrelation of parameters, such as intensity I n and a width W n, is identified with the anomaly threshold provided in each parameter.
- FIG. 8 is a diagram illustrating a method of identifying the cause of the error.
- the vertical axis is used.
- the horizontal axis is the sample number assigned to each sample in the order of measurement.
- the anomaly threshold Th provided for each parameter is shown.
- an upper limit and a lower limit are provided as an abnormal threshold Th (Slope).
- the waveform analysis unit 8 identifies the cause of the abnormality based on each parameter, the abnormality threshold Th, and the relationship between the plurality of parameters (combination of a plurality of parameters). Further, for example, the waveform analysis unit 8 has a cause of abnormality in a certain component X when the value of aA + bB (a and b are coefficients) exceeds the abnormality threshold Th for two kinds of parameters A and B. It can also be specified as. When a plurality of parameters are combined in this way, not only the sum of the plurality of parameters but also the product of the plurality of parameters may be used to compare with the abnormality threshold Th. Of course, based on one kind of parameter A, when the value of aA exceeds the abnormality threshold Th, it is possible to identify that the cause of the abnormality is in a certain component Y.
- the abnormal threshold value Th of each parameter is stored in the database 6, and can be changed as appropriate.
- the method is not limited to the method for identifying the cause of the error by the abnormal threshold value Th as described above.
- the error cause may be specified by using a discriminant model in which the relationship between each parameter stored in the database 6 and the error cause is learned in steps S305, S310, S402, and S407 by a machine learning method.
- the waveform analysis unit 8 may use one of the parameters acquired by the waveform analysis or between a plurality of parameters.
- the components X have the cause of the abnormality
- the components X and Y have the cause of the abnormality
- the components X and Z have the cause of the abnormality, and so on.
- the cause of the abnormality of the components X, Y and Z is detected not only by the abnormality threshold Th related to one parameter but also by the abnormality threshold Th related to the relationship between a plurality of parameters. Therefore, a plurality of classifications of the causes of abnormalities may be set.
- the waveform of the potential change during the preliminary operation and the operation during the calibration does not have to be the continuous measurement. You may analyze it. Further, at the time of waveform analysis, not only the potential waveform of one type of ion-selective electrode 101 but also the potential waveform of a plurality of types of ion-selective electrode 101 may be combined and analyzed. Thereby, the analysis accuracy can be improved.
- the surface potential of the sensor (first sensor) for detecting air bubbles in the flow path, the sensor for detecting the vibration of the components of the electrolyte analysis unit 1 (second sensor), or the object is applied to the analyzer 100.
- a sensor for measuring (third sensor) or the like may be further provided, and the output values of these sensors may be used together in addition to the above parameters.
- the database 6 stores data showing the relationship between the output value of each sensor and the cause of the error
- the waveform analysis unit 8 has the above parameters and the output value of the sensor, and the abnormality identification data in the database 6.
- the cause of the error can be identified by comparing.
- the "surface potential of the object” refers to the surface potential of the component of the electrolyte analysis unit 1.
- a surface potential is present in the components of the electrolyte analysis unit 1
- a weak current may be mixed into the potential measuring unit 2 to fluctuate the measured value. Therefore, by monitoring the surface potential of the component of the electrolyte analysis unit 1 with a sensor (third sensor), it is possible to more easily determine whether or not the cause of the error is due to electrical noise.
- the analyzer 100 of the present embodiment obtains the parameters related to the potential change V (t) and the parameters related to the frequency of the potential change V (t), compares each parameter with the abnormal threshold value, and among the plurality of parameters.
- the cause of the measurement error can be identified by referring to the relationship between the above and the abnormality identification data.
- the analyzer 100 of the present embodiment can identify the cause when there is an abnormality in parallel with the measurement of the internal standard liquid potential, the measurement of the sample potential, and the calculation of the ion concentration. Therefore, the measurement throughput does not decrease.
- the parameter related to the potential change V (t) and the parameter related to the frequency of the potential change V (t) are obtained, and the abnormality is found based on the abnormality threshold for each parameter and the relationship between the plurality of parameters.
- the method of identifying the cause was explained.
- the abnormality is based on the parameter related to the potential change V (t), the threshold value (predictive threshold value) for the parameter related to the frequency of the potential change V (t), or the time-dependent change of the parameter.
- the method of detecting the sign of (error occurrence) and identifying the cause of the measurement error may be described.
- ⁇ Analyzer> As the analyzer of the second embodiment, the same analyzer as the analyzer 100 described in the first embodiment can be used.
- FIG. 9 is a flowchart showing an analysis method according to the second embodiment.
- the same reference numbers are given to the steps similar to the steps shown in FIGS. 3 and 4 (first embodiment).
- the differences from the flowchart of FIG. 4 will be described in detail.
- steps S401 to S403 are continuously executed by the waveform analysis unit 8 in parallel with steps S304 and S307 executed after step S303.
- step S305 by the concentration calculation unit 5 is omitted.
- steps S404 and S405 by the waveform analysis unit 8 are also omitted.
- the waveform analysis unit 8 acquires the internal standard liquid potential for waveform analysis in step S401.
- the waveform analysis unit 8 acquires the parameters (gradient, etc.) of the potential change V (t) and the parameters related to the frequency (parameters based on the intensity distribution F (x), etc.) and stores them in the database 6.
- the waveform analysis unit 8 refers to the database 6 and compares each calculated parameter with the predictive threshold value.
- the details of the predictive threshold value will be described later, but for example, it can be set to a maximum value or a range of values that can be determined to have a sign of abnormality, and is set to a value lower than the abnormal threshold value in the first embodiment. Can be done.
- steps S406 to S408 and S901 are continuously executed by the waveform analysis unit 8 in parallel with steps S309 and S313.
- step S310 by the concentration calculation unit 5 is omitted.
- steps S409 and S410 by the waveform analysis unit 8 are also omitted.
- Steps S406 to S408 are different from steps S401 to S403 only in that the sample potential for waveform analysis is processed instead of the internal standard liquid potential for waveform analysis, and thus the description thereof will be omitted.
- step S901 the waveform analysis unit 8 compares each parameter and the predictive threshold value for each parameter in steps S403 and S408, and the abnormality predictive data (abnormality analysis data) stored in the database 6. Determine if there is a sign of abnormality.
- one parameter may be compared with the predictive threshold value, or the relationship between a plurality of parameters (sum or product of a plurality of parameters, etc.) may be compared with the predictive threshold value. You may try to do it. Further, it may be determined whether or not there is a sign of abnormality from the combination of parameters exceeding the sign threshold.
- the predictive threshold can be set stepwise.
- the waveform analysis unit 8 can determine that there is a sign of abnormality when the speed at which the value of each parameter or the relationship between the parameters exceeds the stepwise sign threshold is greater than the predetermined speed.
- the sign threshold value may be set to a value that may cause an error in the future.
- the waveform analysis unit 8 states that there is a sign of abnormality when the parameter exceeds the sign threshold value. It can be determined.
- the database 6 contains a configuration that may cause an error or an abnormality in the future when the predictive threshold value for each parameter and the relationship between each parameter or the parameter exceed the predictive threshold value.
- Abnormality sign data showing information such as element information, causes outside the device, description of countermeasures, and predicted time such as the time of occurrence is stored.
- the abnormality sign data stored in the database 6 may be based on the potential waveform information at the time of shipment of the device or during continuous operation, or may be arbitrarily set.
- step S901 When it is determined in step S901 that there is a sign of abnormality (YES), in step S902, the display unit 7 displays the state of the sign of abnormality and the coping method based on the abnormality sign data of the database 6. When it is determined that there is no sign of abnormality (NO), in step S313, the display unit 7 displays only the ion concentration (measurement result) calculated by the concentration calculation unit 5. After that, steps S314 and S315 are executed in the same manner as described above.
- the waveform analysis unit 8 can also refer to the past potential waveforms and parameters stored in the database 6. At this time, a change point or an outlier of the time-series change of each parameter stored in the database 6 may be detected. Specifically, for example, the waveform analysis unit 8 acquires each parameter over time, calculates the amount of change in the parameter per unit time, and when the change point or outlier of the change amount is detected. , It can be determined that there is a sign of abnormality.
- the database 6 contains information on the causes that may cause errors in the future and the components that may cause abnormalities when a change point or an outlier is detected for the amount of change of each parameter. , Descriptions of causes outside the device, countermeasures, and abnormal sign data showing information such as the predicted time such as the time of occurrence are stored.
- the sign of abnormality may be detected by using a discrimination model in which the relationship between each parameter stored in the database 6 and the sign of abnormality is learned in steps S402 and S407 by a machine learning method.
- the waveform analysis unit 8 is based on the relationship between one or a plurality of parameters acquired by the waveform analysis. Therefore, the components X have an abnormality sign, the components X and Y have an abnormality sign, the components X and Z have an abnormality sign, and the like.
- the anomalous signs of the components X, Y, and Z are detected not only by the sign thresholds related to one parameter but also by the sign thresholds related to the relationship between a plurality of parameters. Therefore, a plurality of classifications of abnormal signs may be set.
- step S901 when it is determined in step S901 that there is a sign of an abnormality, the components that may cause the abnormality and the method for improving the cause of the disturbance are displayed on the display unit 7 and reported to the user and the maintenance manager. Not only that, replacement parts may be ordered, and support companies may be contacted automatically. As a result, the workload of users and maintenance managers can be reduced.
- the method for detecting a sign of abnormality in this embodiment may be used in combination with the identification of the cause of error described in the first embodiment.
- Steps S401 to S403, S406 to S408, and S901 in FIG. 9 can be measured every time, but the execution interval can be arbitrarily set by the user or the maintenance manager.
- setting the execution interval for example, a GUI screen for setting the execution interval is displayed on the display unit 7, and the user inputs a desired execution interval from the input unit 3, so that the control unit 4 is set.
- the processing by the density calculation unit 5 and the waveform analysis unit 8 is controlled according to the interval. For example, at the time of maintenance and inspection of the analyzer 100 (for example, once every one to two months), it is possible to detect a sign of abnormality of the present embodiment.
- the surface potential of the sensor for detecting air bubbles in the flow path, the sensor for detecting the vibration of the component of the electrolyte analysis unit 1, or the object is applied to the analyzer 100.
- a sensor or the like for measuring the above parameters may be further provided, and the output values of these sensors may be used together in addition to the above parameters.
- the database 6 stores data showing the relationship between the output value of each sensor and the sign of abnormality
- the waveform analysis unit 8 has the above parameters and the output value of the sensor and the sign of abnormality in the database 6. By comparing the data, it is possible to predict anomalies.
- the analyzer 100 of the present embodiment acquires the parameters related to the potential change V (t) and the parameters related to the frequency of the potential change V (t), and compares them with the predictive threshold stored in the database 6. Detect signs of anomalies by referring to relationships between multiple parameters and anomaly sign data. As a result, it is possible to notify the user of the cause location and the disturbance that may cause the abnormality in the future before the abnormality occurs. Since the maintenance time can be planned in advance, it is possible to avoid a sudden stop of the analyzer 100 and carry out the maintenance management work when the operation rate of the analyzer 100 is low. Therefore, it can contribute to the improvement of the measurement throughput.
- the cause of the measurement error is the mixing of air bubbles in the flow path. Therefore, in the third embodiment, a method is provided in which a mechanism for intentionally mixing bubbles into the flow path is provided, and the degree of influence of the potential change V (t) on the gradient and frequency when the bubbles are mixed in the flow path is evaluated. Will be described.
- FIG. 10 is a schematic view showing a partial configuration of the analyzer according to the third embodiment.
- FIG. 10 shows the dilution tank 110 and the shipper nozzle 107 of the electrolyte analysis unit 1 shown in FIG.
- the analyzer of the present embodiment further includes a flow path 1002 branching from the shipper nozzle 107 and an electromagnetic valve 1004 for controlling the opening and closing of the flow path 1002.
- One end of the flow path 1002 is open to the atmosphere.
- the dilution tank 110 contains the internal standard solution IS.
- the internal standard solution IS can be sent to the flow path of the shipper nozzle 107 by the suction operation of the shipper syringe pump 133 (not shown in FIG. 10).
- the air bubbles 1003 When air bubbles are mixed into the flow path of the shipper nozzle 107, the air bubbles 1003 can be sucked into the flow path by opening the solenoid valve 1004 and causing the shipper syringe pump 133 to perform a suction operation.
- the minimum diameter of the bubble 1003 can be such that the inner diameter of the flow path can be divided. For example, when the inner diameter of the flow path is 1 mm, the volume of the bubble 1003 is 0.52 ⁇ L.
- the size of the bubbles 1003 can be controlled according to the suction amount of the shipper syringe pump 133. Further, the moving distance (position) of the bubble 1003 can be changed by closing the solenoid valve 1004 and adjusting the suction amount of the shipper syringe pump 133.
- the solenoid valve 1004 and the shipper syringe pump 133 communicate with the control unit 4, respectively, and the control unit 4 can control the opening / closing operation of the solenoid valve 1004 and the suction / discharge operation by the shipper syringe pump 133.
- the flow path 1002 having the solenoid valve 1004 may be configured to be detachable from the shipper nozzle 107.
- ⁇ Analysis method> bubbles having a set size and position are mixed into the flow path and combined with, for example, the sample measurement operation described in the first embodiment.
- the waveform analysis unit 8 compares the analysis result of the potential change V (t) when the bubbles are intentionally mixed with the data stored in the database 6. This makes it possible to verify the degree of influence on the gradient and frequency of the potential change V (t) depending on the bubble size and the bubble mixing position.
- this embodiment is also useful when it is determined that there is some abnormality in the analyzer 100.
- the parameter of the potential change V (t) at the time of abnormality is acquired in the same manner as in the first embodiment, and further, a mechanism for mixing the bubbles of the present embodiment is attached to the analyzer 100 to mix the bubbles. After that, the parameter of the potential change V (t) is acquired, and the parameter at the time of abnormality and the parameter at the time of mixing bubbles are compared.
- the parameter at the time of abnormality and the parameter at the time of mixing air bubbles it can be determined that the abnormality occurring in the analyzer 100 is due to the mixing of air bubbles.
- the analyzer of the present embodiment has a configuration in which bubbles are introduced into the flow path of the electrolyte analysis unit 1, and tests the degree of influence of the potential change V (t) on the gradient and frequency when the bubbles are mixed. Can be evaluated. As a result, it is possible to grasp the state of the analyzer, perform maintenance and inspection of the analyzer before an abnormality occurs, and reduce sudden downtime.
- FIG. 11 is a schematic view showing a partial configuration of the analyzer according to the fourth embodiment.
- the analyzer of the present embodiment vibrates the ion-selective electrode 101, the comparison electrode 104, and the container 1101 and the container 1101 of the electrolyte analysis unit 1 shown in FIG.
- a vibrator 1102 is further provided.
- the vibrator 1102 has a function of arbitrarily setting an amplitude of 0.01 mm to 3 mm and a frequency of 10 Hz to 100 Hz in the three-dimensional direction to vibrate the accommodator 1101.
- vibration may be applied to the electrolyte analysis unit 1 by operating components such as various nozzles, solenoid valves, and pinch valves at intentional timings.
- the vibrator 1102 and various components communicate with the control unit 4, and it is possible to control the vibration conditions via the control unit 4.
- the vibrating device 1102 may be configured to be detachable from the accommodating device 1101.
- vibration in which the amplitude, frequency and vibration direction are set is intentionally applied to the electrolyte analysis unit 1, and is combined with, for example, the sample measurement operation described in the first embodiment.
- the waveform analysis unit 8 compares the analysis result of the potential change V (t) when vibration is intentionally applied with the data stored in the database 6. This makes it possible to verify the gradient of the potential change V (t) of the vibration amplitude and the vibration frequency and the degree of influence on the frequency.
- a parameter obtained by applying vibration to the electrolyte analysis unit 1 before measuring a normal sample and performing regression analysis or frequency analysis of the potential change V (t) at that time is used as a parameter abnormality threshold in the database 6. It can also be stored in.
- this embodiment is also useful when it is determined that there is some abnormality in the analyzer 100.
- the parameter of the potential change V (t) at the time of abnormality is acquired in the same manner as in the first embodiment, and further, a mechanism for applying the vibration of the present embodiment is attached to the analyzer 100 and the vibration is applied.
- the parameter of the potential change V (t) is acquired above, and the parameter at the time of abnormality and the parameter at the time of applying vibration are compared.
- the analyzer of the present embodiment includes a configuration in which vibration is applied to the electrolyte analysis unit 1, and tests and evaluates the degree of influence of the potential change V (t) on the gradient and frequency when vibration is applied. Can be done. As a result, it is possible to grasp the state of the analyzer, perform maintenance and inspection of the analyzer before an abnormality occurs, and reduce sudden downtime.
- the cause of measurement error is the generation of electrical noise. Therefore, in the fifth embodiment, a mechanism for intentionally applying electrical noise to the analyzer 100 is provided to evaluate the degree of influence of the potential change V (t) on the gradient and frequency when there is electrical noise. The configuration and analysis method will be described.
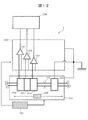
- FIG. 12 is a schematic view showing a partial configuration of the analyzer according to the fifth embodiment.
- the electrolyte analysis unit 1 further includes impedance conversion circuits 1201 to 1203, AD converter 1204, electromagnetic shields 1205 and 1206, power supply device 1207, and voltage generator 1208.
- Impedance conversion circuits 1201 to 1203 are based on OP amplifiers that output their respective potentials from the comparison electrode 104 and the ion-selective electrodes 101a to 101c.
- the AD converter 1204 digitally converts the output potentials of the impedance conversion circuits 1201 to 1203.
- the electromagnetic shield 1205 covers the ion-selective electrodes 101a to 101c, the comparison electrode 104, and the pinch valve 105 to avoid mixing of electrical noise from the outside.
- the electromagnetic shield 1206 covers the impedance conversion circuits 1201 to 1203 and avoids the mixing of electrical noise from the outside.
- the power supply device 1207 applies a variable current to the electromagnetic shields 1205 and 1206.
- the power supply device 1207 is equipped with a converter / inverter inside, and it is possible to change the frequency and current value of the alternating current.
- the voltage generator 1208 is provided inside the electromagnetic shield 1205 and is configured so that its position can be arbitrarily changed.
- the voltage generator 1208 applies a variable voltage to the electromagnetic shield 1205.
- the power supply device 1207 and the voltage generator 1208 communicate with the control unit 4, and the control unit 4 controls the current value and frequency of the power supply device 1207, the voltage value of the voltage generator 1208, and the position of the voltage generator 1208. Is possible. By controlling the power supply device 1207 and the voltage generator 1208 in this way, electrical noise can be applied to the electromagnetic shields 1205 and 1206.
- the electromagnetic shields 1205 and 1206, the power supply device 1207, and the voltage generator 1208 may be detachably configured from the electrolyte analysis unit 1.
- ⁇ Analysis method> electrical noise whose installation environment, voltage value, and current value are known (set) is intentionally applied to the electrolyte analysis unit 1, and for example, the sample measurement operation described in the first embodiment is performed. combine.
- the waveform analysis unit 8 compares the analysis result of the potential change V (t) when electrical noise is intentionally applied with the data stored in the database 6. This makes it possible to test the degree of influence of the potential change V (t) on the gradient and frequency due to the grounding environment and electrical noise.
- an electrical noise is applied to the electrolyte analysis unit 1 before the measurement of a normal sample, and the parameters obtained by the regression analysis or frequency analysis of the potential change V (t) at that time are used as the parameter abnormality threshold in the database. It can also be stored in 6.
- this embodiment is also useful when it is determined that there is some abnormality in the analyzer 100.
- the parameter of the potential change V (t) at the time of abnormality is acquired in the same manner as in the first embodiment, and further, a mechanism for applying the electrical noise of the present embodiment is attached to the analyzer 100 to reduce the electrical noise. After applying, the parameter of the potential change V (t) is acquired, and the parameter at the time of abnormality and the parameter at the time of applying electrical noise are compared. When there is a correlation between the parameter at the time of abnormality and the parameter at the time of applying electrical noise, it can be determined that the abnormality occurring in the analyzer 100 is due to electrical noise.
- the analyzer of the present embodiment includes a configuration in which electrical noise is applied to the electrolyte analysis unit 1, and tests and evaluates the degree of influence of the potential change V (t) on the gradient and frequency when the electrical noise is applied. can do. As a result, it is possible to grasp the state of the analyzer, perform maintenance and inspection of the analyzer before an abnormality occurs, and reduce sudden downtime.
- an automatic analyzer based on the principles of potential difference measurement (ion-selective electrode) and colorimetry (absorbance analysis).
- a latex agglutination analyzer based on turbidity or scattered light intensity
- an immunoanalyzer based on an antigen-antibody reaction, etc.
- It can be widely applied to automatic analyzers equipped with flow cells and piping.
Landscapes
- Chemical & Material Sciences (AREA)
- Life Sciences & Earth Sciences (AREA)
- Health & Medical Sciences (AREA)
- Biochemistry (AREA)
- Chemical Kinetics & Catalysis (AREA)
- Electrochemistry (AREA)
- Physics & Mathematics (AREA)
- Analytical Chemistry (AREA)
- Molecular Biology (AREA)
- General Health & Medical Sciences (AREA)
- General Physics & Mathematics (AREA)
- Immunology (AREA)
- Pathology (AREA)
- Automatic Analysis And Handling Materials Therefor (AREA)
- Other Investigation Or Analysis Of Materials By Electrical Means (AREA)
- Investigating Or Analyzing Materials By The Use Of Electric Means (AREA)
Priority Applications (3)
| Application Number | Priority Date | Filing Date | Title |
|---|---|---|---|
| US17/627,910 US20220404310A1 (en) | 2019-07-19 | 2020-04-08 | Analysis device and analysis method |
| CN202080049766.2A CN114127549B (zh) | 2019-07-19 | 2020-04-08 | 分析装置以及分析方法 |
| EP20842677.5A EP4001910A4 (en) | 2019-07-19 | 2020-04-08 | ANALYSIS DEVICE AND ANALYSIS METHOD |
Applications Claiming Priority (2)
| Application Number | Priority Date | Filing Date | Title |
|---|---|---|---|
| JP2019133863A JP7267865B2 (ja) | 2019-07-19 | 2019-07-19 | 分析装置及び分析方法 |
| JP2019-133863 | 2019-07-19 |
Publications (1)
| Publication Number | Publication Date |
|---|---|
| WO2021014695A1 true WO2021014695A1 (ja) | 2021-01-28 |
Family
ID=74194076
Family Applications (1)
| Application Number | Title | Priority Date | Filing Date |
|---|---|---|---|
| PCT/JP2020/015773 WO2021014695A1 (ja) | 2019-07-19 | 2020-04-08 | 分析装置及び分析方法 |
Country Status (5)
| Country | Link |
|---|---|
| US (1) | US20220404310A1 (zh) |
| EP (1) | EP4001910A4 (zh) |
| JP (1) | JP7267865B2 (zh) |
| CN (1) | CN114127549B (zh) |
| WO (1) | WO2021014695A1 (zh) |
Families Citing this family (4)
| Publication number | Priority date | Publication date | Assignee | Title |
|---|---|---|---|---|
| US20240165604A1 (en) * | 2021-03-19 | 2024-05-23 | Kyocera Corporation | Measurement system, analysis program and measurement method |
| JP2023120955A (ja) * | 2022-02-18 | 2023-08-30 | オムロンヘルスケア株式会社 | 電解液分析装置および電解液分析方法 |
| JP2023166170A (ja) * | 2022-05-09 | 2023-11-21 | 株式会社日立ハイテク | 分析装置および状態検知方法 |
| WO2024154466A1 (ja) * | 2023-01-16 | 2024-07-25 | 株式会社堀場アドバンスドテクノ | イオン濃度測定装置、イオン濃度測定プログラム、イオン濃度測定方法、測定装置、及び、測定方法 |
Citations (8)
| Publication number | Priority date | Publication date | Assignee | Title |
|---|---|---|---|---|
| US4532013A (en) * | 1981-04-16 | 1985-07-30 | Robert Bosch Gmbh | Method for monitoring operation of a current-limiting type gas sensor |
| JPH0376161U (zh) * | 1989-11-29 | 1991-07-30 | ||
| JP2006258800A (ja) * | 2005-02-16 | 2006-09-28 | Ngk Spark Plug Co Ltd | ガス濃度検出ユニットの異常診断方法及びガス濃度検出ユニットの異常診断装置 |
| JP2009121817A (ja) * | 2007-11-09 | 2009-06-04 | Olympus Corp | 分析装置 |
| JP2010530531A (ja) * | 2007-06-18 | 2010-09-09 | エフ.ホフマン−ラ ロシュ アーゲー | 電気化学的データ排除法 |
| JP2014041060A (ja) * | 2012-08-22 | 2014-03-06 | Hitachi High-Technologies Corp | 電解質分析装置 |
| JP2016114391A (ja) * | 2014-12-11 | 2016-06-23 | 凸版印刷株式会社 | 電気銅めっき液分析装置、及び電気銅めっき液分析方法 |
| JP2017536117A (ja) * | 2014-11-25 | 2017-12-07 | アイトゥ バイオサイエンス インコーポレイテッドAytu BioScience,Inc. | 生物学的サンプルの酸化還元電位に基づく受精能の判定方法 |
Family Cites Families (10)
| Publication number | Priority date | Publication date | Assignee | Title |
|---|---|---|---|---|
| EP1906178A1 (en) * | 2006-09-26 | 2008-04-02 | F.Hoffmann-La Roche Ag | Method for detecting erroneous measurement results obtained with ion-selective electrodes |
| JP4918846B2 (ja) * | 2006-11-22 | 2012-04-18 | 株式会社日立製作所 | 質量分析装置及び質量分析方法 |
| JP5297951B2 (ja) * | 2009-09-04 | 2013-09-25 | 株式会社日立製作所 | 防食データ解析システム |
| WO2011034169A1 (ja) * | 2009-09-18 | 2011-03-24 | 日立化成工業株式会社 | 自動分析装置 |
| JP5331669B2 (ja) * | 2009-12-08 | 2013-10-30 | 株式会社日立ハイテクノロジーズ | 電解質分析装置 |
| JP2012202948A (ja) * | 2011-03-28 | 2012-10-22 | Dkk Toa Corp | 自動測定装置 |
| EP3575796B1 (en) * | 2011-04-15 | 2020-11-11 | DexCom, Inc. | Advanced analyte sensor calibration and error detection |
| JP5845154B2 (ja) * | 2012-08-08 | 2016-01-20 | 国立研究開発法人農業・食品産業技術総合研究機構 | 生体数モデル生成装置、生体数モデル生成方法、サイトメーター、および、プログラム |
| US20150164385A1 (en) * | 2013-12-16 | 2015-06-18 | Medtronic Minimed, Inc. | Methods and systems for improving the reliability of orthogonally redundant sensors |
| JP6896684B2 (ja) * | 2018-09-13 | 2021-06-30 | 株式会社日立ハイテク | 電解質濃度測定装置 |
-
2019
- 2019-07-19 JP JP2019133863A patent/JP7267865B2/ja active Active
-
2020
- 2020-04-08 WO PCT/JP2020/015773 patent/WO2021014695A1/ja unknown
- 2020-04-08 US US17/627,910 patent/US20220404310A1/en active Pending
- 2020-04-08 EP EP20842677.5A patent/EP4001910A4/en active Pending
- 2020-04-08 CN CN202080049766.2A patent/CN114127549B/zh active Active
Patent Citations (8)
| Publication number | Priority date | Publication date | Assignee | Title |
|---|---|---|---|---|
| US4532013A (en) * | 1981-04-16 | 1985-07-30 | Robert Bosch Gmbh | Method for monitoring operation of a current-limiting type gas sensor |
| JPH0376161U (zh) * | 1989-11-29 | 1991-07-30 | ||
| JP2006258800A (ja) * | 2005-02-16 | 2006-09-28 | Ngk Spark Plug Co Ltd | ガス濃度検出ユニットの異常診断方法及びガス濃度検出ユニットの異常診断装置 |
| JP2010530531A (ja) * | 2007-06-18 | 2010-09-09 | エフ.ホフマン−ラ ロシュ アーゲー | 電気化学的データ排除法 |
| JP2009121817A (ja) * | 2007-11-09 | 2009-06-04 | Olympus Corp | 分析装置 |
| JP2014041060A (ja) * | 2012-08-22 | 2014-03-06 | Hitachi High-Technologies Corp | 電解質分析装置 |
| JP2017536117A (ja) * | 2014-11-25 | 2017-12-07 | アイトゥ バイオサイエンス インコーポレイテッドAytu BioScience,Inc. | 生物学的サンプルの酸化還元電位に基づく受精能の判定方法 |
| JP2016114391A (ja) * | 2014-12-11 | 2016-06-23 | 凸版印刷株式会社 | 電気銅めっき液分析装置、及び電気銅めっき液分析方法 |
Non-Patent Citations (3)
| Title |
|---|
| ANONYMOUS: "Maintenance equipment series Laser alignment equipment Condition monitoring equipment Catalog • Catalog No. 8011, Rev. 2/2020 - Condition Monitoring", TLV CATALOG, 25 February 2020 (2020-02-25), XP055784640, Retrieved from the Internet <URL:https://www.tlv.com/wp_tlv_handleWithCare/wp-content/themes/tlv/tlv_assets/product_v2/catalog/pdf/maintenance_apparatus_list.pdf> [retrieved on 20210311] * |
| ANONYMOUS: "VIBXPERT II", TLV PRODUCT CATALOG, 20 June 2019 (2019-06-20), pages 1 - 4, XP055784642, Retrieved from the Internet <URL:https://www.tlv.com/wp_tlv_handleWithCare/wp-content/themes/tlv/tlv_assets/product_v2/pdf/j-vbxp2-hp.pdf> [retrieved on 20210311] * |
| See also references of EP4001910A4 * |
Also Published As
| Publication number | Publication date |
|---|---|
| US20220404310A1 (en) | 2022-12-22 |
| CN114127549A (zh) | 2022-03-01 |
| JP2021018141A (ja) | 2021-02-15 |
| EP4001910A1 (en) | 2022-05-25 |
| JP7267865B2 (ja) | 2023-05-02 |
| EP4001910A4 (en) | 2023-08-02 |
| CN114127549B (zh) | 2024-08-16 |
Similar Documents
| Publication | Publication Date | Title |
|---|---|---|
| WO2021014695A1 (ja) | 分析装置及び分析方法 | |
| AU2018216105B2 (en) | Quality control method, quality control system, management apparatus, analyzer, and quality control abnormality determination method | |
| EP2187219B1 (en) | Sample analysis system comprising regent preparation device and sample treating device | |
| JP5193937B2 (ja) | 自動分析装置、及び分析方法 | |
| EP3264102B1 (en) | Automatic analysis apparatus | |
| US20150219680A1 (en) | Automatic analyzer | |
| JP2009204448A (ja) | 自動分析装置 | |
| JP6896684B2 (ja) | 電解質濃度測定装置 | |
| JP7330785B2 (ja) | 自動分析装置 | |
| US20240120082A1 (en) | Apparatus and methods of predicting faults in diagnostic laboratory systems | |
| JP7178208B2 (ja) | 分析システム | |
| US20240329628A1 (en) | Real-time sample aspiration fault detection and control | |
| WO2023218738A1 (ja) | 分析装置および状態検知方法 | |
| CN113574390B (zh) | 数据解析方法、数据解析系统以及计算机 | |
| WO2022185641A1 (ja) | 電解質測定装置、および電解質濃度測定ユニットの異常判定方法 | |
| EP4382898A1 (en) | Wettability evaluation device and method | |
| JP7299914B2 (ja) | 異常判定方法、および自動分析装置 | |
| JP7423752B2 (ja) | 自動分析装置 | |
| WO2022270267A1 (ja) | 診断システム、自動分析装置及び診断方法 | |
| WO2023153073A1 (ja) | 部品異常検知システム、自動分析装置、及び部品異常検知方法 | |
| EP4283288A1 (en) | Electrolyte analysis device and method for identifying abnormality in same | |
| JP2021067686A (ja) | 分析装置の状態をチェックする技術 | |
| JP2021117191A (ja) | 自動分析装置及び反応異常判定方法 |
Legal Events
| Date | Code | Title | Description |
|---|---|---|---|
| 121 | Ep: the epo has been informed by wipo that ep was designated in this application |
Ref document number: 20842677 Country of ref document: EP Kind code of ref document: A1 |
|
| NENP | Non-entry into the national phase |
Ref country code: DE |
|
| ENP | Entry into the national phase |
Ref document number: 2020842677 Country of ref document: EP Effective date: 20220221 |