WO2020158948A1 - 血液検体の血液凝固特性の分析方法 - Google Patents
血液検体の血液凝固特性の分析方法 Download PDFInfo
- Publication number
- WO2020158948A1 WO2020158948A1 PCT/JP2020/003796 JP2020003796W WO2020158948A1 WO 2020158948 A1 WO2020158948 A1 WO 2020158948A1 JP 2020003796 W JP2020003796 W JP 2020003796W WO 2020158948 A1 WO2020158948 A1 WO 2020158948A1
- Authority
- WO
- WIPO (PCT)
- Prior art keywords
- time
- coagulation
- weighted average
- calculation target
- sample
- Prior art date
Links
Images


Classifications
-
- G—PHYSICS
- G01—MEASURING; TESTING
- G01N—INVESTIGATING OR ANALYSING MATERIALS BY DETERMINING THEIR CHEMICAL OR PHYSICAL PROPERTIES
- G01N33/00—Investigating or analysing materials by specific methods not covered by groups G01N1/00 - G01N31/00
- G01N33/48—Biological material, e.g. blood, urine; Haemocytometers
- G01N33/483—Physical analysis of biological material
- G01N33/487—Physical analysis of biological material of liquid biological material
- G01N33/49—Blood
- G01N33/4905—Determining clotting time of blood
-
- G—PHYSICS
- G01—MEASURING; TESTING
- G01N—INVESTIGATING OR ANALYSING MATERIALS BY DETERMINING THEIR CHEMICAL OR PHYSICAL PROPERTIES
- G01N21/00—Investigating or analysing materials by the use of optical means, i.e. using sub-millimetre waves, infrared, visible or ultraviolet light
- G01N21/17—Systems in which incident light is modified in accordance with the properties of the material investigated
- G01N21/47—Scattering, i.e. diffuse reflection
-
- G—PHYSICS
- G01—MEASURING; TESTING
- G01N—INVESTIGATING OR ANALYSING MATERIALS BY DETERMINING THEIR CHEMICAL OR PHYSICAL PROPERTIES
- G01N33/00—Investigating or analysing materials by specific methods not covered by groups G01N1/00 - G01N31/00
- G01N33/48—Biological material, e.g. blood, urine; Haemocytometers
- G01N33/50—Chemical analysis of biological material, e.g. blood, urine; Testing involving biospecific ligand binding methods; Immunological testing
- G01N33/86—Chemical analysis of biological material, e.g. blood, urine; Testing involving biospecific ligand binding methods; Immunological testing involving blood coagulating time or factors, or their receptors
-
- G—PHYSICS
- G16—INFORMATION AND COMMUNICATION TECHNOLOGY [ICT] SPECIALLY ADAPTED FOR SPECIFIC APPLICATION FIELDS
- G16H—HEALTHCARE INFORMATICS, i.e. INFORMATION AND COMMUNICATION TECHNOLOGY [ICT] SPECIALLY ADAPTED FOR THE HANDLING OR PROCESSING OF MEDICAL OR HEALTHCARE DATA
- G16H50/00—ICT specially adapted for medical diagnosis, medical simulation or medical data mining; ICT specially adapted for detecting, monitoring or modelling epidemics or pandemics
- G16H50/20—ICT specially adapted for medical diagnosis, medical simulation or medical data mining; ICT specially adapted for detecting, monitoring or modelling epidemics or pandemics for computer-aided diagnosis, e.g. based on medical expert systems
Definitions
- the present invention relates to a method for analyzing blood coagulation characteristics of a blood sample.
- the present invention also relates to a program and an apparatus for analyzing the blood coagulation characteristics of the blood sample.
- a blood coagulation test is a test for examining a patient's hemostatic ability or fibrinolytic ability.
- a coagulation reaction that occurs after a reagent is added to a blood sample of a patient is optically measured.
- the time for which coagulation has progressed to a predetermined state is measured as blood coagulation time.
- Typical examples of blood coagulation time include prothrombin time (PT), activated partial thromboplastin time (APTT), thrombin time and the like.
- the prolongation of blood coagulation time reflects the tendency of bleeding in vivo.
- the causes of prolongation include 1) abnormal amount of blood coagulation factor, 2) presence of antibodies against blood components that make up the blood coagulation system and reagents for measuring blood coagulation time, and 3) administration of drugs that inhibit blood coagulation reaction. And so on.
- a coagulation reaction curve can be obtained by measuring the blood coagulation reaction amount after adding a reagent to a blood sample over time.
- This coagulation reaction curve has a different shape depending on the type of abnormality in the blood coagulation system (Non-Patent Document 1). Therefore, a method for determining abnormality of the blood coagulation system based on the coagulation reaction curve is disclosed.
- Patent Document 1 Patent Document 2 and Patent Document 3 parameters relating to the primary differential curve and the secondary differential curve of the coagulation reaction curve for the blood of the patient, such as maximum coagulation rate, maximum coagulation acceleration and maximum coagulation deceleration
- maximum coagulation rate maximum coagulation rate
- maximum coagulation acceleration maximum coagulation deceleration
- Hemophilia is a disease in which coagulation factor VIII (FVIII) or coagulation factor IX (FIX) is congenitally deficient or has a functional abnormality.
- a person with a FVIII activity of less than 40% is classified as hemophilia A, and a person with a FIX activity of less than 40% is classified as hemophilia B, based on the activity of a normal person as 100%. Further, the severity of hemophilia is classified according to the activity level.
- Patent Document 4 describes a method of determining the severity of hemophilia based on the average rate of change of the coagulation rate until the time when the coagulation reaction of the patient reaches the maximum coagulation rate or the maximum coagulation acceleration.
- JP, 2016-194426 A Japanese Patent Laid-Open No. 2016-118442 JP, 2017-106925, A JP, 2018-017619, A
- the first derivative curve of the actual blood sample coagulation reaction curve may not be unimodal due to the influence of the components contained in the sample, the reagents used for the test, or the difference in the measurement method. Therefore, in the methods of Patent Documents 1 to 4, in order to accurately obtain the parameters such as the maximum coagulation rate and the maximum coagulation rate time, the smoothing process for making the first-order differential curve monomodal is performed to perform the waveform analysis. ing. However, when the smoothing process for unimodalization is performed on the first-order differential curve in this way, the obtained curve reflects the clinical state of the patient in detail due to the loss of waveform information due to the smoothing process. It is supposed not to. Therefore, there is a demand for an analysis method that can accurately evaluate the blood coagulation characteristics of a sample from a first-order differential curve that is not unimodal, regardless of the smoothing process.
- the present inventor has found a parameter derived from a blood coagulation reaction curve and having a relationship with the activities of coagulation factor VIII (FVIII) and coagulation factor IX (FIX).
- the present inventor has also found a method for analyzing the activity level of FVIII or FIX in a blood sample and the presence or absence of FVIII or FIX activity abnormality in the blood sample based on the parameters.
- the present invention provides the following. [1] Acquiring a waveform relating to a coagulation rate or a coagulation acceleration of a sample in which a test blood sample and a coagulation time measuring reagent are mixed, Extracting a plurality of parameters characterizing a waveform relating to the solidification rate or solidification acceleration; Determining the activity level or activity abnormality of the coagulation factor in the test blood sample based on the plurality of parameters; A method for analyzing a blood sample, comprising: [2] Whether the plurality of parameters include a plurality of parameters that respectively characterize a plurality of calculation target areas of the waveform relating to the coagulation rate, or a plurality of parameters that respectively characterize a plurality of calculation target areas of the waveform relating to the coagulation acceleration.
- the plurality of parameters are as follows: About the weighted average time vT, the weighted average height vH, the peak width vB, the weighted average peak width vW, the weighted average peak width vW, the B flattening rate vAB about the weighted average height, and the weighted average height for the plurality of calculation target areas of the waveform related to the coagulation rate W flatness vAW, B hourly rate vTB for weighted average time, W hourly rate vTW for weighted average time, average time vTa, average height vHa, B flatness vABa for average height, average height W flatness vAWa, area start time vTs, area end time vTe, area center time vTm, area time width vTr, main peak start time vNs, main peak end time vNe, and main peak width vN; Weighted average time vT, the weighted average height vH, the peak width
- VB is a time length such that F(t) ⁇ x from t1 to t2
- the vW is a time length such that F(t) ⁇ vH from t1 to t2, VTs and vTe are t1 and t2, respectively
- the vTr is the length of time from vTs to vTe
- the vN is a time length from vNs to vNe
- Said vAB represents the ratio of said vH and said vB
- Said vAW represents the ratio of said vH and said vW
- Said vTB represents the ratio of said vT and said vB
- the vTW represents the ratio of the vT and the vW
- Said vABa represents the ratio of said vHa and said vB
- Said vAWa represents the ratio of said vHa and said vW
- the waveform relating to the coagulation acceleration is F′(t) (t is time) and the time when F′(t) is a predetermined value x is t1 and t2 (t1 ⁇ t2)
- the calculation target area is F'(t) is a region that satisfies x
- the pT and pH are represented by the following formula
- the pB is a time length such that F′(t) ⁇ x from t1 to t2
- the pW is the length of time that F′(t) ⁇ pH from t1 to t2
- the pN is the time length from pNs to pNe
- Said pAB represents the ratio of
- the waveform relating to the coagulation acceleration is F′(t) (t is time) and the time when F′(t) is a predetermined value x is t1 and t2 (t1 ⁇ t2)
- the calculation target area is F'(t) is a region that satisfies x
- mT and mH are represented by the following formula
- the mB is a time length such that F′(t) ⁇ x from t1 to t2
- the mW is a time length such that F′(t) ⁇ mH from t1 to t2
- the mN is a time length from m
- the predetermined value x is 0.5 to 99% of the maximum value of the F(t), 0.5 to 99% of the maximum value of the plus peak of the F′(t), or the F 'The analytical method according to any one of [4] to [6], which is 0.5 to 99% of the minimum value of the negative peak of (t).
- the determination compares the plurality of parameter groups with corresponding parameter groups for a plurality of template blood samples, and based on the result of the comparison, the activity level of the coagulation factor in the test blood sample.
- the template blood sample is a blood sample whose activity level of the coagulation factor or the presence or absence of abnormal activity is known.
- the analysis method according to any one of [1] to [8]. [10] The analysis according to [9], wherein the comparison includes obtaining a correlation between the parameter group for the test blood sample and each of the corresponding parameter groups for the plurality of template blood samples. Method. [11] The determination is to select a template blood sample in which the correlation satisfies a predetermined condition, and to determine the activity level or activity abnormality of the coagulation factor in the selected template blood sample as a coagulation factor of the test blood sample.
- the analysis method according to [10] which comprises determining an activity level or an activity abnormality.
- the present invention it is possible to analyze the FVIII or FIX activity level in a blood sample or the presence or absence of its activity abnormality (deficiency, etc.) based on the parameter derived from the coagulation reaction curve.
- INDUSTRIAL APPLICABILITY The present invention is useful for determining hemophilia A or hemophilia B, or determining the severity of hemophilia patients.
- FIG. An example of a coagulation reaction curve.
- the conceptual diagram of the parameter calculated from the waveform regarding a coagulation rate The conceptual diagram for demonstrating the calculation object threshold value, the range of the correction 0th-order curve and correction 1st-order curve used as an analysis target, and a weighted average point.
- the conceptual diagram of the parameter calculated from a quadratic curve A conceptual diagram showing vTs, vTe, vTr, vNs, vNe, vN.
- the dotted line indicates the 10% calculation target area of the linear curve.
- B A conceptual diagram for explaining a weighted average point when the calculation target range value is 80%.
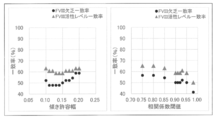
- the conceptual diagram which shows the structure of the automatic analyzer for performing the analysis method of the blood sample by this invention. Regression line for parameter group A-1.
- test sample (Sample AF) is derived from a severe hemophilia A patient with FVIII activity of less than 0.2%.
- the abscissa and the ordinate indicate the FVIII activity and APTT of the template sample and the test sample, respectively.
- the present invention relates to analyzing the properties of blood samples related to blood coagulation.
- the blood sample may be referred to as a sample. More specifically, the present invention relates to analyzing the presence or absence of an activity level of a blood coagulation time prolonging factor component or an abnormality in its activity in a sample having an extended blood coagulation time.
- the present invention relates to analyzing the activity level of coagulation factor VIII (hereinafter also referred to as FVIII) or coagulation factor IX (hereinafter also referred to as FIX), or the presence or absence of abnormal activity thereof.
- FVIII coagulation factor VIII
- FIX coagulation factor IX
- one aspect of the present invention is a method for analyzing a blood sample, more specifically, a blood coagulation time prolonging factor component in the blood sample, preferably FVIII and/or FIX activity level, or the presence or absence of activity abnormality thereof. Is a method of determining.
- a blood coagulation time prolonging factor component in the blood sample preferably FVIII and/or FIX activity level, or the presence or absence of activity abnormality thereof.
- Outline of Method A method for analyzing a blood sample according to the present invention acquires a waveform relating to a coagulation rate or a coagulation acceleration of a sample in which a test sample and a coagulation time measuring reagent are mixed. And extracting a plurality of parameters characterizing the waveform relating to the coagulation rate or coagulation acceleration, and determining the activity level or activity abnormality of the blood coagulation time extension factor component in the test sample based on the plurality of parameters Including and.
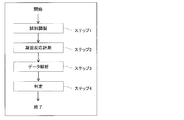
- One embodiment of the method of the present invention will be described with reference to FIG.
- a sample is prepared from a test sample (step 1), and then a coagulation reaction measurement for the sample is executed (step 2).
- a waveform relating to the coagulation rate or the coagulation acceleration of the sample is acquired from the obtained measurement data, and then the waveform is subjected to a predetermined analysis (step 3).
- the test sample is determined (determination of the activity level of the blood coagulation time extension factor component or its activity abnormality) (step 4).
- sample Preparation and Coagulation Reaction Measurement The preparation of a sample from the test sample in step 1 and the coagulation reaction measurement of the sample in step 2 will be described.
- the measurement of the activated partial thromboplastin time (APTT) will be described as an example of the measurement of the coagulation reaction, but a person skilled in the art can change the measurement to other coagulation reaction (for example, prothrombin time (PT) measurement). If there is, it can be implemented.
- APTT activated partial thromboplastin time
- test sample examples include a sample derived from a subject who is required to have a test regarding blood coagulation ability, such as a sample having blood coagulation abnormality, or a sample suspected of blood coagulation abnormality, More specifically, a sample having an extended blood coagulation time or a sample suspected of having an extended blood coagulation time can be mentioned.
- a sample having an extended blood coagulation time or a sample suspected of having an extended blood coagulation time can be mentioned.
- plasma of a subject is used as the sample.
- a well-known anticoagulant usually used for coagulation test may be added to the specimen. For example, blood is collected using a blood collection tube containing sodium citrate and then centrifuged to obtain plasma.
- the obtained test sample is mixed with the coagulation time measuring reagent to prepare a sample for measuring the coagulation reaction.
- the coagulation time measuring reagent may be any reagent for APTT measurement, and examples thereof include a contact factor activator and a phospholipid.
- activators include ellagic acid, celite, kaolin, silica, polyphenol compounds and the like.
- phospholipids include animal-derived, plant-derived, and synthetic-derived phospholipids. Examples of animal-derived phospholipids include those derived from rabbit brain, chicken, and pig. Examples of plant-derived phospholipids include those derived from soybean.
- a buffer such as Tris-hydrochloric acid may be added to the sample, if necessary.
- a commercially available APTT measurement reagent may be used as the reagent for the APTT measurement.
- Examples of commercially available APTT measurement reagents include Coagpia APTT-N (manufactured by Sekisui Medical Co., Ltd.).
- the prepared sample is heated and the contact factors in the sample are activated.
- the temperature at the time of heating is, for example, 30°C or higher and 40°C or lower, preferably 35°C or higher and 39°C or lower.
- a calcium chloride solution for example, Coagpia APTT-N calcium chloride solution; manufactured by Sekisui Medical Co., Ltd.
- the coagulation reaction of the mixed solution after adding the calcium chloride solution can be measured.
- general means for example, an optical means for measuring the amount of scattered light, transmittance, absorbance, etc., or a mechanical means for measuring the viscosity of plasma may be used.
- the measured period may be, for example, several tens of seconds to 5 minutes from the time of adding the calcium chloride solution. During the measurement period, the measurement can be repeatedly performed at predetermined intervals.
- the measurement may be performed at 0.1 second intervals.
- the temperature of the reaction solution during measurement is, for example, 30° C. or higher and 40° C. or lower, preferably 35° C. or higher and 39° C. or lower.
- the reaction start time of the coagulation reaction can be typically defined as the time when the calcium chloride solution is added to the sample containing the test sample, but other timing may be defined as the reaction start time. Further, various conditions for measurement can be appropriately set according to the test sample, reagent, measuring means, and the like.
- a series of operations in the above coagulation reaction measurement may be performed using an automatic analyzer.
- An example of an automatic analyzer is a blood coagulation automatic analyzer CP3000 (manufactured by Sekisui Medical Co., Ltd.).
- some operations may be performed manually.
- a test sample can be prepared by a human, and subsequent operations can be performed by an automatic analyzer.
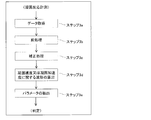
- step 3 Data analysis 1.4.1. Data Primary Processing and Correction Processing Next, the data analysis in step 3 will be described. The data analysis flow is shown in FIG. The data analysis in step 3 may be performed in parallel with the coagulation reaction measurement in step 2, or may be performed later using the data of the coagulation reaction measurement measured in advance.
- step 3a the measurement data of the above coagulation reaction measurement is acquired.
- This data is, for example, data that reflects the coagulation reaction process of the sample obtained by the APTT measurement in step 2 described above.
- data showing the time change of the progressing amount (for example, scattered light amount) of the coagulation reaction after the addition of the calcium chloride solution is obtained from the sample containing the test sample and the coagulation time measuring reagent.
- the data obtained by these coagulation reaction measurements are also referred to herein as coagulation reaction information.
- FIG. 3 is a coagulation reaction curve based on the amount of scattered light
- the horizontal axis shows the elapsed time (coagulation reaction time) after the addition of the calcium chloride solution
- the vertical axis shows the scattered light amount. Since the coagulation reaction of the mixed solution progresses with the passage of time, the amount of scattered light increases.
- a curve indicating the change in the coagulation reaction amount with respect to the coagulation reaction time which is represented by the amount of scattered light or the like, is referred to as a coagulation reaction curve.
- the coagulation reaction curve based on the amount of scattered light as shown in FIG. 3 is usually sigmoidal.
- the coagulation reaction curve based on the amount of transmitted light is usually in an inverse sigmoid shape.
- data analysis using a coagulation reaction curve based on the amount of scattered light as coagulation reaction information will be described. It is apparent to those skilled in the art that similar processing can be performed in the case of data analysis using a coagulation reaction curve based on the amount of transmitted light or absorbance as coagulation reaction information.
- a coagulation reaction curve obtained by a mechanical means such as a change in viscosity of the mixed liquid may be an analysis target.
- step 3b pretreatment of the coagulation reaction curve is performed.
- the preprocessing includes smoothing processing for removing noise and zero point adjustment.
- FIG. 4 shows an example of the coagulation reaction curve of FIG. 3 which has been subjected to the pretreatment (smoothing treatment and zero point adjustment).
- any known noise removal method can be used.
- the amount of scattered light at the measurement start point (time 0) is larger than 0.
- the zero point adjustment after the smoothing process the scattered light amount at time 0 is adjusted to 0 as shown in FIG. 5A and B show a partial enlargement of the coagulation reaction curve of FIG. 3 before and after pretreatment, respectively.
- smoothing processing and zero point adjustment are performed on the data of FIG. 5A.
- the height of the coagulation reaction curve depends on the fibrinogen concentration of the test sample. On the other hand, since the fibrinogen concentration varies from person to person, the height of the coagulation reaction curve differs depending on the test sample. Therefore, in this method, if necessary, a correction process for converting the pretreatment coagulation reaction curve into a relative value is performed in step 3c. By the correction process, a coagulation reaction curve that does not depend on the fibrinogen concentration can be obtained, and thus it becomes possible to quantitatively compare the difference in the shape of the coagulation reaction curve after pretreatment between samples.
- the coagulation reaction curve after the pretreatment is corrected so that the maximum value becomes a predetermined value.
- the corrected coagulation reaction curve P(t) is obtained from the coagulation reaction curve after the pretreatment according to the following formula (1).
- D(t) represents the coagulation reaction curve after pretreatment
- Dmax and Dmin represent the maximum value and the minimum value of D(t), respectively
- Drange represents the change width of D(t). (That is, Dmax-Dmin)
- A is an arbitrary value that represents the maximum value of the corrected coagulation reaction curve.
- P(t) [(D(t)-Dmin)/Drange] ⁇ A (1)
- FIG. 6 shows data corrected so that the coagulation reaction curve shown in FIG. 4 has a maximum value of 100.
- the above-described correction processing may be performed on a waveform relating to a coagulation velocity or a coagulation acceleration, which will be described later, or a parameter group extracted from the waveform.
- a waveform relating to the coagulation rate for the coagulation reaction curve D(t) after the pretreatment in which the correction process is not performed, and then convert this into a value corresponding to P(t).
- the value of each parameter included in the parameter group can be converted into a value corresponding to P(t).
- the corrected coagulation reaction curve and the correction-free coagulation reaction curve as described above are also referred to as a corrected 0th-order curve and an uncorrected 0th-order curve, respectively, and are collectively referred to as a “0th-order curve”. Also called.
- the first-order differential curves of the corrected zero-order curve and the uncorrected zero-order curve are referred to as a corrected first-order curve and an uncorrected first-order curve, respectively, and these are collectively referred to as "1. It is also called the "second curve".
- the second derivative curve of the corrected zero-order curve and the uncorrected zero-order curve, or the corrected first-order curve and the first-order derivative curve of the uncorrected first-order curve are respectively corrected 2 It is also called a quadratic curve and an uncorrected quadratic curve, and these are also collectively called "quadratic curve”.
- a waveform regarding coagulation speed or coagulation acceleration is calculated.
- the waveform related to the coagulation rate includes an uncorrected linear curve and a corrected linear curve.
- the uncorrected first-order curve represents a value obtained by first-order differentiating the coagulation reaction curve (uncorrected zero-order curve), that is, the rate of change of the coagulation reaction amount (coagulation rate) at any coagulation reaction time.
- the corrected linear curve represents a value obtained by linearly differentiating the corrected coagulation reaction curve (corrected zero-order curve), that is, the relative change rate of the coagulation reaction amount at an arbitrary coagulation reaction time. Therefore, the waveform relating to the coagulation rate may be a waveform representing the coagulation rate in the coagulation reaction of the sample or its relative value.
- a value representing the progress of blood coagulation including the coagulation rate represented by a linear curve and its relative value is collectively referred to as a primary differential value.
- the waveform relating to the coagulation acceleration includes an uncorrected quadratic curve and a corrected quadratic curve.
- the value represented by the waveform relating to the coagulation acceleration is generically referred to as the second derivative.
- the first derivative and the second derivative of the coagulation reaction curve or the corrected coagulation reaction curve can be performed using a known method.
- FIG. 7 shows a corrected first-order curve obtained by first-order differentiating the corrected zero-order curve shown in FIG.
- the horizontal axis of FIG. 7 represents the coagulation reaction time, and the vertical axis represents the first-order differential value.
- a plurality of parameters that characterize the waveform relating to the solidification rate or solidification acceleration for the sample are extracted.
- the plurality of parameters includes a plurality of parameters, each of which characterizes a waveform relating to a clotting rate.
- the plurality of parameters includes a plurality of parameters each characterizing a waveform related to coagulation acceleration.
- a plurality of parameters, each of which characterizes a waveform for coagulation rate, and a plurality of parameters, each of which characterize a waveform for coagulation acceleration are used in combination.
- a plurality of calculation target areas are extracted from the waveform relating to the coagulation velocity or the coagulation acceleration, while characterizing each of the plurality of calculation target areas.
- Parameters are extracted.
- a plurality of parameters that respectively characterize a plurality of calculation target areas for the waveform related to the coagulation velocity or the coagulation acceleration are extracted. Therefore, the plurality of parameters that characterize the waveform relating to the coagulation rate or the coagulation acceleration extracted by the present invention include a plurality of parameters that respectively characterize a plurality of calculation target regions of the waveform relating to the coagulation rate, or a waveform relating to the coagulation acceleration. Or a combination thereof.
- a parameter group including the obtained plurality of parameters is created.
- the parameter group reflects the shape of the waveform relating to the coagulation rate or coagulation acceleration and is associated with the blood coagulation characteristics of the sample.
- the parameter group is used for determination of the test sample (step 4). The parameters will be described below.
- the calculation target area and the parameters that characterize it will be explained below using the waveform related to the coagulation rate as an example.
- the calculation target region is a region (segment) in which the first-order differential value (y value) in the waveform (first-order curve) related to the coagulation rate is equal to or larger than a predetermined calculation target region value. More specifically, in the calculation target region, the first derivative value (y value) in the waveform relating to the coagulation rate is equal to or higher than a predetermined calculation target region value and equal to or lower than the maximum value (Vmax), and the maximum point of the waveform is It is an area (segment) that includes.
- the calculation target range value is a predetermined value that specifies the lower limit of the calculation target range, and is also referred to as a calculation target range value S in this specification.
- the calculation target threshold value S can be set to limit the range in which the peak shape of the waveform relating to the coagulation rate is reflected. In order to limit the peak shape relatively broadly, the calculation target threshold value S can be set to 0% to 20% of Vmax. On the other hand, when the calculation target threshold value S is increased, the influence of the upper shape of the peak is reflected in the analysis result relatively. To analyze the shape of the top of the peak, the threshold value S to be calculated can be set to 20% to 95% of Vmax. In one embodiment, the threshold value S to be calculated can be set to 0.5 to 99%, preferably 5 to 90% of Vmax.
- a plurality of calculation target areas are extracted based on a plurality of different calculation target area values S.
- the number of calculation target areas extracted in the method of the present invention is not necessarily limited, but when the number is small, the accuracy of determination of a blood sample may decrease, while when the number is too large, the calculation amount increases. Then, the calculation load becomes high.
- the plurality of calculation target areas are preferably three or more different areas, more preferably five or more different areas, further preferably 3 to 100 different areas, and further preferably 5 to 20. Are different areas.
- the number of calculation target range values S corresponds to the number of calculation target ranges.
- the calculation target range values S for extracting each calculation target range are different from each other.
- the interval of each S may be set according to the number of calculation target areas, but preferably 1/100 or more and 1/2 or less of Vmax, more preferably 1/33 or more and 1/5 or less of Vmax, further preferably It is 1/20 or more and 1/5 or less of Vmax, and more preferably 1/20 or more and 1/10 or less of Vmax.
- the interval between Vmax and each S may be the same or different.
- the threshold value S to be calculated can also be applied to a quadratic curve.
- the quadratic curve can have peaks in both the positive and negative directions.
- the calculation target threshold value S can be set for each of the plus peak and the minus peak of the quadratic curve.
- the threshold value S to be calculated may be set to 0.5 to 99%, preferably 5 to 90% of the maximum value of the plus peak of the quadratic curve. In another embodiment, the threshold S for calculation may be set to 0.5 to 99%, preferably 5 to 90% of the minimum value of the negative peak of the quadratic curve.
- the vB representing the peak width of the region is displayed.
- the weighted average point (vTx, vHx) corresponds to the “weighted average value” of the calculation target area of F(t).
- the weighted average time vT is the coagulation reaction time (t) at the weighted average point. That is, the weighted average time vT is the time from the coagulation reaction start time to the weighted average point, and is the x coordinate of the weighted average point.
- the weighted average height vH is the y coordinate of the weighted average point.
- the weighted average time vT and weighted average height vH for the primary curve can be obtained by the following procedure.
- the maximum value of the primary curve F(t) is Vmax
- the calculation target threshold value is S
- the data group at time t satisfying F(t) ⁇ Vmax ⁇ S ⁇ 0.01 is defined as t[t1, ...t2].
- the product sum value M is calculated by the following equation (2).
- Weighted average time vT and weighted average height vH are calculated by the following equations (3) and (4), respectively.
- a weighted average point (vTx, vHx) is derived from the obtained vT and vH.
- S calculation target range value
- vT and vH in the calculation target area in which S is 5% are vT5% and vH5%.
- the weighted average time vTx and the weighted average height vHx can be used as parameters that characterize the calculation target region.
- FIG. 9 shows the relationship between the calculation target threshold value S, the areas of the corrected 0th-order curve and the corrected primary curve (the calculation target area) that are analyzed and the weighted average points.
- the left shows the corrected zero-order curve
- the right shows the calculation target area of the corrected first-order curve
- the black circles show the weighted average points.
- the calculation target range value S changes, the positions of the calculation target range and the weighted average point change as shown in FIG.
- the parameters related to the calculation target area of the corrected linear curve are calculated, but similar parameters can be calculated for the uncorrected linear curve.
- a weighted average point, a weighted average time, and a weighted average height can be defined for a quadratic curve.
- the quadratic curve has peaks in both the plus and minus directions of the secondary differential value as shown in FIG. Therefore, the weighted average point of the quadratic curve can be calculated for both the positive and negative peaks.
- the time t[t1, ..., t2] (t1 ⁇ t2) is calculated, and the weighted average time pT of the plus peak and the weighted average height pH are calculated according to the above equations (2)' to (4)'.
- the position of the weighted average point changes with the change of the calculation target threshold value S.
- Peak width, average point, flatness and time rate Reaction time is longer than the weighted average time vT from the minimum reaction time when the first derivative value is more than the calculation target threshold value S in the area where the reaction time is shorter than the weighted average time vT.
- the time length for which the primary curve F(t) ⁇ S (the number of data points for F(t) ⁇ S The value obtained by multiplying the photometric time interval) is defined as the peak width vB of the primary curve.
- the peak width vB is from time vTs to time vTe.
- the minimum and maximum values of the reaction time at which the second-order derivative value at the positive peak of the quadratic curve F'(t) is greater than or equal to the calculation target threshold value S are pTs and pTe, respectively, and the time from pTs to pTe.
- the time length for F'(t) ⁇ S (the value obtained by multiplying the number of data points for F'(t) ⁇ S by the photometric time interval) is defined as the peak width pB of the positive peak of the quadratic curve.
- the minimum and maximum values of the reaction time at which the secondary differential value at the negative peak of the quadratic curve F'(t) is less than or equal to the calculation target threshold value S are mTs and mTe, respectively, and the time from mTs to mTe.
- the time length for F'(t) ⁇ S (the value obtained by multiplying the number of data points for F'(t) ⁇ S by the photometric time interval) is defined as the peak width mB of the negative peak of the quadratic curve.
- a further example of the parameter used in the present invention is the region time width vTr.
- Further examples of parameters used in the present invention include main peak start time vNs, main peak end time vNe, and main peak width vN.
- vNs and vNe are parameters for the main peak including the maximum value Vmax in the operation area of the primary curve, and are less affected by noise that may be included in the coagulation reaction curve, as compared with vTs and vTe described above. It is a parameter.
- vNs and vNe have the same values as vTs and vTe, respectively.
- vN is the width (time length) from vNs to vNe.
- pNs, pNe, pN, and mNs, mNe, mN can be similarly defined for the plus and minus peaks of the quadratic curve F'(t).
- FIG. 11 shows vTs, vTe, vTr, vNs, vNe, and vN.
- FIG. 12 shows the calculation target range (dotted line) of the linear curve when the calculation target range value S is 10%.
- Weighted average points (vT, vH) black circles
- vTs, and vTe are shown in the upper part of FIG. 12
- vB and vW are shown in the lower part of FIG.
- vW is the peak width that satisfies the primary curve F(t) ⁇ vH (the time that F(t) ⁇ vH is satisfied between the minimum time and the maximum time when F(t) ⁇ vH is satisfied. Long). Similar parameters can be calculated with an uncorrected linear curve.
- the peak width satisfying F′(t) ⁇ pH is defined as the weighted average peak width pW.
- the width of the coagulation reaction time that satisfies F′(t) ⁇ mH is defined as the weighted average peak width mW.
- parameters used in the present invention include average time vTa, average height vHa, and area central time vTm.
- the average point (vTa, vHa) (white diamonds), the weighted average point (vT, vH) (black circles), vTs, vTe of the linear curve when the calculation target threshold value S is 10%, and vTm is shown.
- vTa, vHa, and vTm are respectively expressed by the following equations when the number of data points from F(vTs) to F(vTe) is n.
- pTm which is the center point of pTs and pTe
- mTm which is the center point of mTs and mTe
- the flatness ratios vAB, vABa, and the weights based on the peak widths are used.
- the flattening ratios vAW and vAWa based on the average peak width are defined as in the following formulas (8a), (8b), (8c) and (8d).
- vAB vH/vB (8a)
- vAW vH/vW (8b)
- vABa vHa/vB (8c)
- vAWa vHa/vW (8d)
- the time rate vTB based on the peak width and the time rate vTW based on the weighted average peak width are expressed by the following formula ( Define as in 9a) and (9b).
- vTB vT/vB (9a)
- vTW vT/vW (9b)
- the flatness ratio and time ratio as described above can be obtained for a quadratic curve.
- the flatness ratio pAB based on the peak width or the flatness ratio pAW based on the weighted average peak width can be obtained as the ratio of pH and pB or pW, while pT and pB
- the time rate pTB based on the peak width or the time rate pTW based on the weighted average peak width can be obtained as a ratio with pW.
- the flatness mAB based on the peak width or the flatness mAW based on the weighted average peak width can be obtained as the ratio of mH and mB or mW, while mT and As a ratio with mB or mW, the time rate mTB based on the peak width or the time rate mTW based on the weighted average peak width can be obtained.
- peak width vB, pB, mB, weighted average peak width vW, pW, mW, average time vTa, average height vHa, area start time vTs, pTs, mTs, area end time vTe, pTe, mTe, Area central time vTm, pTm, mTm, area time width vTr, main peak start time vNs, pNs, mNs, main peak end time vNe, pNe, mNe, main peak width vN, pN, mN, flatness vAB, vAW, vABa , VAWa, pAB, pAW, mAB, mAW, and time rates vTB, vTW, pTW, pAW, mTB, mTW can also be parameters that characterize the calculation target range of the linear curve.
- each parameter may be displayed with the calculation target range value S from which it is derived.
- the parameters that characterize the calculation target area of the linear curve when S is x(%) may be referred to as vHx, vTx, vBx, vWx and the like.
- vABa, vAWa, vTB, vTW are vH10%, vT10%, vB10%, vW10%, vTa10%, vHa10%, vTs10%, vTe10%, vTm10%, vTr10%, vNs10%, vNe10%, vN10%, vAB10.
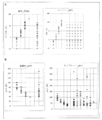
- FIG. 14A and FIG. 14B show parameters when the calculation target range value S is different for the same linear curve.
- 13A shows the case where the calculation target range value S is 10%
- FIG. 13B shows the case where the calculation target range value S is 80%.
- the weighted average height vH10% of the primary curve is 0.4
- the weighted average time vT10% is 149 seconds
- the peak width vB10% is 200 seconds.
- the weighted average height vH80% is 0.72
- the weighted average time vT80% is 119 seconds
- the peak width vB80% is 78 seconds. Is.
- AUC area under the curve
- pAUC the area under the curve
- mAUC the area under the curve
- S the calculation target range value
- vAUC, pAUC, and mAUC in the calculation target region where S is 5% are vAUC5%, pAUC5%, and mAUC5%, respectively.
- parameters other than the above-mentioned parameters characterizing the calculation target range may be included in the parameters for determining the activity level or activity abnormality of the coagulation factor according to the present invention.
- the parameters include a maximum first-order differential value Vmax, a maximum second-order differential value Amax, a minimum second-order differential value Amin, and VmaxT, AmaxT, AminT which represent the time to reach them.
- the series of parameters described above may include a parameter derived from a corrected coagulation reaction curve (corrected 0th to quadratic curve) and a parameter derived from an uncorrected coagulation reaction curve (uncorrected 0th to 2nd curve).
- parameters characterizing the calculation target area are extracted.
- parameters related to the weighted average point of the linear curve shown in Table A described later weighted average time vT, weighted average height vH, average time vTa, average height vHa, peak Width vB, weighted average peak width vW, flattening ratios vAB, vAW, vABa, vAWa, and time rates vTB, vTW, and vAUC, vTs, vTe, vTr, vTm, vNs, vNe, vN), 2 Parameters related to the weighted average point of the following curve (weighted average time pT, mT, weighted average height pH, mH, peak width pB, mB,
- any one or more of these parameters may be extracted, but a parameter set including two or more of these parameters may be extracted.
- the parameter may be at least one selected from the group consisting of vT, vH, vB, vAB, and vTB, but may be a parameter set including two or more of these.
- the parameter is a parameter set including vT, vH, vB, vAB and vTB.
- the parameter is a parameter set including vB, vAB and vTB.
- the parameter is a parameter set including vB and vAB.
- the parameter is pH, pAB, or vH.
- the parameters are pAB and pNe parameter sets, pTW and vT parameter sets, pTB and vABa parameter sets, pAB and vNs parameter sets, or pTW and vTs and vW parameter sets. is there.
- the configuration of the parameters that characterize each calculation target area used in the method of the present invention is not limited to these embodiments.
- the plurality of parameters (parameter group) used in the determination of the test sample in the method of the present invention include a plurality of parameters characterizing a plurality of calculation target regions of one waveform.
- the parameter group is a set of a plurality of parameters extracted from a plurality of calculation target areas of one waveform.
- the parameter group includes one or more sets of the same kind of parameters extracted from different calculation target regions of one waveform (linear curve or quadratic curve). For example, when L calculation target areas are extracted and the adopted parameter is vHx, the parameter group is composed of L vHx.
- 10 calculation target ranges based on 10 calculation target range values S (5%, 10%, 20%, 30%, 40%, 50%, 60%, 70%, 80%, and 90%) Is extracted and the parameter vHx is extracted from each calculation target area
- the parameter group is a set of 10 vHx [vH5%, vH10%, vH20%, vH30%, vH40%, vH50%, vH60%, vH70%, vH80%, vH90%].
- the parameter vHx is extracted from each calculation target area.
- the parameter group is a set of 5 vHx [vH5%, vH20%, vH40%, vH60%, vH80%].
- the parameter group includes M sets of [vBx, vABx, vTBx].
- the parameter group includes N sets of [vTx, vHx, vBx, vABx, vTBx]. Composed of.
- a plurality of parameters each characterizing the calculation target area may be combined with other parameters. For example, at least one selected from the group consisting of a maximum first-order differential value Vmax, a maximum second-order differential value Amax, a minimum second-order differential value Amin, and VmaxT, AmaxT, and AminT representing the time to reach them, shown in Table A described later.
- Vmax maximum first-order differential value
- Amax maximum second-order differential value
- AminT VmaxT, AmaxT, and AminT representing the time to reach them
- Target blood coagulation time prolonging factor component The target blood coagulation time prolonging factor component for which the activity level or activity abnormality is determined by the method of the present invention includes any intrinsic or extrinsic coagulation reaction that causes prolongation of blood coagulation time. Ingredients are included.
- the target blood coagulation time prolonging factor component is a coagulation factor.
- the coagulation factor is preferably at least one selected from coagulation factors including FVIII and FIX, and more preferably at least FVIII. Both FVIII and FIX may be targeted.
- a parameter group (hereinafter, referred to as a test parameter group) including a plurality of parameters respectively extracted from a plurality of calculation target regions of the waveform related to the coagulation velocity or coagulation acceleration of the test sample described above, It is compared with a corresponding parameter group (also referred to as template parameter group in the present specification) for the template blood sample (hereinafter, also simply referred to as template sample). Based on the result of the comparison, the coagulation characteristics of the test sample, preferably the activity level or activity abnormality of the blood coagulation time prolonging factor component in the test sample is determined.
- one or more template analytes are prepared.
- the template specimen is a blood specimen whose activity level or presence/absence of activity abnormality of the target blood coagulation time prolonging factor component in the method of the present invention is known.
- the one or more template samples include one or more blood samples with normal FVIII activity levels (normal FVIII samples) and blood samples with abnormal FVIII activity levels (FVIII abnormal samples).
- One or more specimens eg FVIII deficient specimens.
- the one or more template samples include one or more blood samples with normal FIX activity levels (normal FIX samples) and blood samples with abnormal FIX activity levels (FIX abnormalities).
- One or more specimens eg, FIX-deficient specimens).
- the one or more template specimens have one or more blood specimens (FVIII/FIX normal specimen) with neither FVIII nor FIX activity level abnormal, and FVIII activity level is abnormal. It includes one or more blood samples (FVIII abnormal samples, eg, FVIII deficient samples) and one or more blood samples having abnormal FIX activity levels (FIX abnormal samples, eg, FIX deficient samples).
- FVIII abnormal samples eg, FVIII deficient samples
- FIX abnormal samples eg, FIX deficient samples
- the FVIII abnormal sample includes blood samples derived from severe, moderate and mild hemophilia A patients.
- the blood samples from the severe, moderate, and mild hemophilia A patients have FVIII activity of less than 1%, 1% or more and less than 5%, and 5% or more and less than 40% (of normal subjects, respectively). The value is the value when the activity is 100%, and the same applies hereinafter).
- multiple samples from patients with severe hemophilia A having different FVIII activity levels may be prepared, if necessary.
- the derived sample may be prepared.
- VS-HA patients with particularly low FVIII activity FVIII activity of less than 0.2%)
- MS-HA patients without FVIII activity FVIII activity of 0.2% or more and less than 1%) Reported that there is a difference in clinical severity (Mitsumoto Matsumoto, Midori Shima, Application to coagulation waveform analysis and micromeasurement of factor VIII, 2003, Vol. 14, No. 2, p.122- 127).
- Differentiating patients with VS-HA is useful for providing appropriate treatment to the patients.
- the FIX abnormal sample preferably includes blood samples derived from severe, moderate and mild hemophilia B patients.
- the specimens from the severe, moderate and mild hemophilia B patients have a FIX activity of less than 1%, 1% or more and less than 5%, and 5% or more and less than 40% (the activity of a normal person is The value is 100%, the same hereinafter).
- multiple samples from patients with severe hemophilia B having different FIX activity levels may be prepared, if necessary. For example, a sample having a FIX activity of 0.2% or more and less than 1% and a sample having a FIX activity of less than 0.2% may be prepared.
- regression analysis is performed between the test parameter group and each template parameter group derived from each template sample.
- the template parameter group used for regression analysis is 1.3. It was obtained by performing the data analysis described in. In this data analysis, the number of calculation target areas to be extracted and the series of calculation target area values S used to extract a plurality of calculation target areas are set to the same values as in the data analysis of the test sample.
- the types of parameters included in the template parameter group are the same as those of the test parameter group. For example, if the test parameter group is L vHx, the template parameter group for the template sample is also L vHx. Further, for example, if the test parameter group is M sets of [vBx, vABx, vTBx], the template parameter group of the template sample is also M sets of [vBx, vABx, vTBx].
- the template parameter group of the template sample is also N sets of [vTx, vHx, vBx, vABx, vTBx] Is. Therefore, the template parameter group is a parameter group for the template sample corresponding to the test parameter group. That is, the individual parameters included in each template parameter group correspond to the individual parameters included in the test parameter group.
- the parameter of the template parameter group and the parameter of the test parameter group are the same kind of parameter.
- vTx, vHx, vBx, vABx and vTBx of the test parameter group correspond to vTx, vHx, vBx, vABx and vTBx (x is a predetermined value) of the template parameter group, respectively.
- a template parameter group including all parameters of the test parameter group and parameters corresponding to the test parameter group corresponds to the test parameter group.
- each template parameter group may be a synthetic parameter group obtained by processing a parameter group obtained from a plurality of template samples.
- one or more synthetic parameter groups representing a standard template sample are created by obtaining parameter groups for a plurality of template samples having the same activity level of the target blood coagulation time prolonging factor component and statistically processing them. Good.
- the method of regression analysis is not particularly limited, and examples thereof include linear regression by the least squares method.
- the value of each parameter in the test parameter group is plotted on the y-axis, and the value of the corresponding parameter in any one of the template parameter groups is plotted on the x-axis to obtain a regression line.
- the correlation between the test parameter group and each template parameter group is examined based on the slope, intercept, correlation (correlation coefficient, determination coefficient, etc.) of the regression line.
- the correlation between the test parameter group and the template parameter group reflects the correlation (approximate state) of the coagulation characteristics between the test sample and the template sample from which the template parameter group is derived.
- the coagulation characteristics of the test sample are determined based on the results of the regression analysis.
- the determination of the coagulation property is determination of the activity level of the target blood coagulation time prolonging factor component or its activity abnormality.
- the determination procedure will be described, taking the case where the target blood coagulation time extension factor component is FVIII as an example. Other factors such as FIX may be judged by the same procedure.
- the correlation is the correlation of the regression line (eg, slope, intercept, correlation coefficient, coefficient of determination, etc.).
- Template specimens include one or more normal FVIII specimens and one or more abnormal FVIII specimens with varying levels of FVIII activity.
- the template sample comprises one or more normal FVIII samples and one FVIII abnormal sample from severe (moderate VS-HA and MS-HA if necessary), moderate and mild hemophilia A patients, respectively. Including the above. At least one sample whose correlation between the test parameter group and the template parameter group satisfies a predetermined condition is selected from all the template samples used for the regression analysis.
- template samples whose correlation is equal to or greater than a preset threshold value are selected.
- the template sample having the highest correlation with the correlation being equal to or higher than a preset threshold value is selected.
- the slope of the regression line between the test parameter group and the template parameter group is within a predetermined range (for example, 0.70 or more and 1.30 or less, preferably 0.75 or more and 1.25 or less, more preferably 0.80 or more and 1.20 or less, further preferably Is 0.85 or more and 1.15 or less, and more preferably 0.87 or more and 1.13 or less).
- the slope of the regression line between the test parameter group and the template parameter group is within the predetermined range, and the correlation coefficient of the regression line is a predetermined value or more (for example, larger than 0.75, preferably A template analyte is selected that is greater than 0.80, more preferably greater than 0.85, and even more preferably greater than 0.90).
- the predetermined condition may be changed and the template sample may be selected again, or “no template sample selection” may be evaluated. ..
- the slope of the regression line is within a predetermined range (for example, 0.70 or more and 1.30 or less, preferably 0.75 or more and 1.25 or less, more preferably 0.80 or more and 1.20 or less, more preferably 0.85 or more and 1.15 or less, and further preferably 0.87.
- Template samples that are above 1.13) are selected.
- the slope of the regression line is within the predetermined range, and the correlation coefficient of the regression line is a predetermined value or more (for example, larger than 0.75, preferably larger than 0.80, more preferably larger than 0.85, further preferably 0.90 Greater than) is selected. From the selected template samples, the template sample having the highest correlation coefficient of the regression is selected.
- one template sample may be selected from them based on further criteria. Then, the FVIII state in the selected template sample (that is, the FVIII activity level or activity abnormality) is determined as the FVIII state in the test sample.
- the state of FVIII in the test sample may be determined to correspond to any of the states in the plurality of template samples, or the average of the plurality of template samples. Such a state may be determined as the FVIII state in the test sample.
- the selected template sample is a FVIII normal sample
- the state of FVIII in the test sample can be determined to be normal
- the test sample Can be determined to have abnormal FVIII activity.
- the selected template sample is a sample derived from a patient with severe, moderate, and mild hemophilia A
- the test sample is severe, moderate, and mild hemophilia A, respectively.
- the template sample contains a sample from a patient with severe hemophilia A of VS-HA and MS-HA
- the template sample is It can be determined to be VS-HA or MS-HA.
- the FVIII activity level of the selected template sample can be determined as the FVIII activity level in the test sample.
- the template sample includes samples from patients with severe, moderate, and mild hemophilia A, and if the above-mentioned correlation evaluation indicates “no template sample is selected”, the sample to be tested has “abnormal FVIII activity”. It is possible to determine that “there is no”, or that “the factor that prolongs the blood coagulation time is not due to abnormal FVIII activity” of the test sample.
- the slope of the regression line is within a predetermined range (for example, 0.70 or more and 1.30 or less, preferably 0.75 or more and 1.25 or less, more preferably 0.80 or more and 1.20 or less, still more preferably 0.85 or more and 1.15 or less, further preferably All template specimens that are 0.87 or more and 1.13 or less) are selected.
- the slope of the regression line is within the predetermined range, and the correlation coefficient of the regression line is a predetermined value or more (for example, larger than 0.75, preferably larger than 0.80, more preferably larger than 0.85, further preferably 0.90 Greater than) are selected.
- the state of FVIII found most frequently among the selected template specimens is determined as the FVIII state in the test specimen. For example, if the number of normal FVIII specimens is the largest among the selected template specimens, the FVIII state in the test specimen can be determined to be normal. On the other hand, when the number of FVIII abnormal samples is the largest among the selected template samples, it can be determined that the test sample has an abnormal FVIII activity. Further, for example, when the sample from the patients with severe, moderate, and mild hemophilia A is the most among the selected template samples, the test sample has severe, moderate, and mild hemophilia, respectively. A may be determined.
- the sample to be tested is determined to be an abnormal sample other than the hemophilia A patient (severe, moderate, and mild). Can be done.
- the FVIII activity level found most frequently in the selected template samples can be determined as the FVIII activity level in the test sample.
- the slope of the regression line is within a predetermined range (for example, 0.70 or more and 1.30 or less, preferably 0.75 or more and 1.25 or less, more preferably 0.80 or more and 1.20 or less, still more preferably 0.85 or more and 1.15 or less, further preferably All template specimens that are 0.87 or more and 1.13 or less) are selected.
- the slope of the regression line is within the above predetermined range, and the correlation coefficient of the regression line is a predetermined value or more (for example, larger than 0.75, preferably larger than 0.80, more preferably larger than 0.85, further preferably All template specimens that are greater than 0.90) are selected.
- the selected template specimens are divided into specimens from hemophilia A patients (severe, moderate, and mild) having low FVIII activity and specimens other than those according to the FVIII activity level.
- the severity either severe, moderate, or mild
- the more severe one may be judged as the state of the subject specimen, or the template specimen may be selected again by changing the predetermined condition. ..
- the number of the latter is larger than the number of the former, the subject is determined to be other than the hemophilia A patient (severe, moderate, and mild).
- the method of the present invention can determine the FVIII activity level in a test sample or the presence or absence of its activity abnormality.
- the presence or absence of FVIII activity abnormality in the subject is determined, and the determination provides information about determining whether the subject is a hemophilia A patient.
- the level of FVIII activity in the subject is determined and the determination provides information about determining the severity of hemophilia A in the patient who provided the subject. Therefore, one embodiment of the method for analyzing a blood sample according to the present invention is: determination of hemophilia A, severity of hemophilia A, for example, severe (VS-HA and MS-HA as appropriate), moderate and It may be a method for determining mildness and the like.
- the other blood coagulation time prolonging factor component is FIX.
- the test sample determined to be "not the factor for prolonging blood coagulation time due to abnormal FVIII activity" or "a patient with hemophilia A (severe, moderate, and mild)" For, the activity level of FIX or the presence or absence of its activity abnormality may be determined.
- the procedure for determining the FIX activity level or the presence or absence of its activity abnormality can be carried out by the same procedure as the above-described determination procedure for FVIII.
- the template sample used for the determination regarding the FIX may be the same as or different from the one used in the evaluation regarding FVIII.
- the test parameter group and the template parameter group used for the determination regarding the FIX may be the same as or different from those used for the determination regarding FVIII.
- the presence or absence of FIX activity abnormality in the test sample is determined, and the determination provides information on whether the test sample is a sample of a hemophilia B patient. To do.
- the FIX activity level in the subject is determined, and the determination provides information about determining the severity of hemophilia B in the patient who provided the subject.
- the present embodiment enables determination of hemophilia B and determination of severity of hemophilia B (eg, severe, moderate and mild). Furthermore, by combining the above-described evaluation of FVIII and evaluation of FIX, the coagulation characteristics of the test sample can be analyzed more comprehensively.
- the above-described blood sample analysis method of the present invention can be automatically performed using a computer program. Therefore, one aspect of the present invention is a program for performing the above-described blood sample analysis method of the present invention.
- the series of steps of the above-described method of the present invention including preparation of a sample from a test sample and measurement of coagulation time, can be automatically performed by an automatic analyzer. Therefore, one aspect of the present invention is an apparatus for performing the above-described blood sample analysis method of the present invention.
- the automatic analyzer 1 includes a control unit 10, an operation unit 20, a measurement unit 30, and an output unit 40.
- the control unit 10 controls the overall operation of the automatic analyzer 1.
- the control unit 10 may be composed of, for example, a personal computer (PC).
- the control unit 10 includes a CPU, a memory, a storage, a communication interface (I/F), etc., and processes commands from the operation unit 20, controls the operation of the measurement unit 30, saves measurement data received from the measurement unit 30, and the like. Data analysis, storage of analysis results, output of measurement data and analysis results by the output unit 40, and the like are performed. Further, the control unit 10 may be connected to other devices such as an external medium and a host computer. In the control unit 10, the PC that controls the operation of the measurement unit 30 and the PC that analyzes the measurement data may be the same or different.
- the operation unit 20 acquires an input from the operator and transmits the obtained input information to the control unit 10.
- the operation unit 20 includes a user interface (UI) such as a keyboard and a touch panel.
- UI user interface
- the output unit 40 outputs the measurement data of the measurement unit 30 and the analysis result of the data under the control of the control unit 10.
- the output unit 40 includes a display device such as a display.
- the measurement unit 30 executes a series of operations for a blood coagulation test and acquires measurement data of the coagulation reaction of a sample including a blood sample.
- the measurement unit 30 includes various equipments and analysis modules necessary for blood coagulation tests, such as a sample container containing a blood sample, a reagent container containing a test reagent, a reaction container for reacting the sample with the reagent, a blood sample, and Probe for dispensing reagent to reaction container, light source, detector for detecting scattered light or transmitted light from sample in reaction container, data processing circuit for sending data from detector to control unit 10, control A control circuit that receives an instruction from the unit 10 and controls the operation of the measurement unit 30 is provided.
- the control unit 10 analyzes the coagulation characteristics of the sample based on the data measured by the measurement unit 30. In this analysis, acquisition of a waveform relating to the above-mentioned coagulation reaction curve or coagulation rate or coagulation acceleration, extraction of a parameter group for a test sample, extraction of a template parameter group for a template sample, regression analysis of those parameter groups, and The determination of the activity level or the activity abnormality of the target blood coagulation time extension factor component in the test sample based on the result of the regression analysis may be included. This analysis can be carried out by a program for carrying out the method of the invention. Therefore, the control unit 10 may comprise a program for carrying out the method of the invention.
- the coagulation reaction curve and the waveform regarding the coagulation rate or the coagulation acceleration used in the analysis may be created by the control unit 10 based on the measurement data from the measurement unit 30, or separately. Device, for example, it may be created by the measurement unit 30 and sent to the control unit 10. Alternatively, the coagulation reaction curve may be created by the measurement unit 30 and sent to the control unit 10, and the control unit 10 may create a waveform relating to the coagulation rate or the coagulation acceleration.
- the data of the template parameter group regarding the template sample may be created by previously measuring the template sample with the measurement unit 30 and analyzing the obtained measurement data with the control unit 10, or may be imported from the outside. The data of the template parameter group can be stored in the memory of the control unit 10 or an external device.
- the regression analysis method and the criteria for analyzing the coagulation characteristics of the test sample based on the results of the regression analysis can be controlled by the program of the present invention.
- the analysis result of the control unit 10 is sent to the output unit 40 and output.
- the output may take any form such as display on a screen, transmission to a host computer, printing, etc.
- the output information from the output unit includes a determination result (for example, FVIII activity level, determination result of hemophilia A or its severity, etc.) about the target blood coagulation time extension factor component in the test sample, and It includes further information such as the result of regression analysis between the test sample and the template sample (for example, regression linear equation or correlation), the coagulation reaction curve of the test sample or the template sample, and the waveform related to the coagulation rate or coagulation acceleration. You may stay.
- the type of output information from the output unit can be controlled by the program of the present invention.
- the automatic analyzer 1 has a general structure such as that conventionally used for measuring blood coagulation time such as APTT and PT. A configuration of an automatic analyzer for blood coagulation test can be adopted.
- the parameters used in the following examples represent parameters derived from a corrected 0th-order quadratic curve unless otherwise specified.
- the parameters derived from the uncorrected 0th to quadratic curves are represented by prefixing the name of each parameter with R.
- R the weighted average height of the corrected linear curve
- RvH the weighted average height of the uncorrected linear curve
- pH the weighted average height of the corrected quadratic curve
- the weighted average height of the quadratic curve is expressed as RpH.
- Table A list of parameters is shown in Table A below.
- Example 1 Calculation of Test Parameter (1) Method As a measuring reagent, Coagpia APTT-N (manufactured by Sekisui Medical Co., Ltd.), which is an APTT measuring reagent, and as a calcium chloride solution, Coagpia APTT-N calcium chloride solution (Sekisui Water) Medical Co., Ltd.) was used. The measurement of the coagulation reaction of the sample including the sample was performed using an automatic blood coagulation analyzer CP3000 (manufactured by Sekisui Medical Co., Ltd.). 50 ⁇ L of a reagent for measurement at about 37° C. was added to 50 ⁇ L of a sample heated at 37° C.
- test parameter group A (parameter group A) From the obtained corrected linear curve, 10 calculation target areas were extracted.
- the calculation target range value S is 5%, 10%, 20%, 30%, 40%, 50%, 60%, 70%, 80 with respect to the maximum height value Vmax (100%) of the corrected primary curve. % And 90% respectively.
- the peak width vB and the weighted average time vT and the weighted average height vH were calculated using the above formulas (2), (3) and (4). From the obtained vT and vH, the flatness ratio vAB and the time ratio vTB were calculated by the following formulas.
- test parameter group as follows: (Parameter group A-1) vB [vB5%, vB10%, ..., vB90%], vT [vT5%, vT10%, ..., vT90%], vH [vH5%, vH10%, ..., vH90%], vAB Parameter group consisting of 50 parameters of [vAB5%, vAB10%, ..., vAB90%] and vTB [vTB5%, vTB10%, ..., vTB90%]; (Parameter group A-2) of vB [vB5%, vB10%, ..., vB90%], vAB [vAB5%, vAB10%, ..., vAB90%], and vTB [vTB5%, vTB10%, ..., vTB90%] Parameter group consisting of 30 parameters; (Parameter group A-3) A parameter group consisting of
- test parameter group was further created as follows: (Parameter group A-4) Parameter group consisting of 54 parameters obtained by adding Vmax, Amax, VmaxT and AmaxT to the parameter A-1; (Comparative parameter group 1) A parameter group consisting of four parameters Vmax, Amax, VmaxT and AmaxT.
- a test parameter group is created as follows. did: (Parameter group B-1) vB [vB5%, vB20%, vB40%, vB60%, vB80%], vT [vT5%, vT20%, vT40%, vT60%, vT80%], vH [vH5%, vH20% , vH40%, vH60%, vH80%], vAB [vAB5%, vAB20%, vAB40%, vAB60%, vAB80%], and vTB [vTB5%, vTB20%, vTB40%, vTB60%, vTB80%] 25 parameters Parameter group consisting of; (Parameter group B-2) vB [vB5%, vB20%, vB40%, vB60%, vTB80%] 25 parameters Parameter group consisting of; (Parameter group B-2) vB [vB5%, vB2
- Table 2 shows the composition of the created parameters.
- Example 2 Judgment of FVIII activity or abnormality of test sample using parameter group
- FIG. 16 shows the results of regression analysis with a test sample (Sample AF, APTT time: 118.1 seconds, FVIII ⁇ 0.2%) derived from a patient with severe hemophilia A (VS-HA) whose FVIII activity is less than 0.2%. Of these, the top 5 results are shown in descending order of correlation coefficient.
- FIG. 17A shows a regression line with the sample (Template A) having the highest correlation coefficient in FIG.
- FIG. 17B shows the corrected primary curve of the test sample (Sample AF) and Template A.
- the corrected primary curves of the test sample (Sample AF) and Template A have very similar shapes, indicating that the blood coagulation characteristics of both samples are similar. From these results, it became clear that this analysis can be used to determine FVIII activity in blood samples. Furthermore, it was revealed that this analysis is also effective for the detection of VS-HA patient samples.
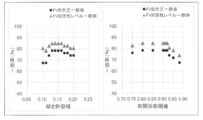
- the FVIII activity level of the test sample was classified into four stages (FVIII activity: ⁇ 1%, 1-5%, 5-40%, and Other). Based on the FVIII activity level of the classified test sample and the actual FVIII activity level of the test sample obtained by the one-step coagulation method, the FVIII activity level agreement rate and the FVIII deficiency agreement rate in this determination were calculated by the following formulas.
- the FVIII activity level agreement rate indicates the rate at which the FVIII activity level of the test sample according to the determination matches the FVIII activity level of the actual test sample, and the FVIII deficiency agreement rate indicates the presence or absence of FVIII deficiency in the test sample according to the determination. The percentages that correspond to the actual presence or absence of FVIII deficiency in the test sample are shown.
- Tables 3 to 5 are comparison tables of the determined FVIII activity of the test sample and the actual FVIII activity of the test sample.
- a comparison table using the parameter groups A-1 to A-4 is shown in Table 3
- a comparison table using the parameter groups B-1 to B-4 is shown in Table 4
- a comparison parameter group 1 is used.
- Table 5 shows a comparison table of
- Table 6 summarizes the types of parameter groups used in the analysis and the FVIII deficiency agreement rate and FVIII activity level agreement rate.
- the method using the parameter group A or B was able to determine the FVIII activity level of the test sample with a high concordance rate.
- Example 3 Differences in Judgment Results Due to Differences in Correlation Evaluation Criteria
- the parameter group used was A-4.
- Correlation Evaluation Criteria 1 A linear regression equation for a parameter group is obtained between all template specimens and test specimens, and template specimens whose regression line slopes are included in the range of 0.87 to 1.13 are selected from them. The template sample with the highest correlation coefficient was selected from the selected samples (the same evaluation criteria as in Example 2).
- Correlation evaluation criterion 2 A linear regression equation for a parameter group was obtained between all template specimens and test specimens, and the template specimen having the highest correlation coefficient was selected from them.
- Table 7 Table 7-1 is the same as Table 3A-4.
- Table 8 summarizes the types of parameters used in the analysis and the FVIII deficiency agreement rate and the FVIII activity level agreement rate.
- Example 4 Determination of FIX activity level Among the test specimens, 8 specimens which were determined to be Other (FVIII>40%) but lack FIX were subjected to FIX activity determination.
- the template sample used was that shown in Table 9.
- the parameter group A-1 acquired in Example 1 was used as the parameter group, and the correlation evaluation criterion 1 of Example 3 was used for the evaluation of the correlation.
- the FIX activity level agreement rate and the FIX deficiency agreement rate were calculated by the same procedure as in Example 2(2). The evaluation results are shown in Table 10. It was possible to determine the FIX activity level of the test sample with a high concordance rate.
- Example 5 Determination of FVIII Activity or Abnormality
- coagulation factor-deficient plasma and LA plasma or normal plasma were mixed at various ratios
- FVIII-deficient plasma in which FVIII preparation was added
- Factor VIII Deficient Plasma Factor IX Deficient Plasma
- Factor V Deficient Plasma Factor V Deficient Plasma
- Factor Xlas DefectiveientPlasma George King Bio-Medical, Inc.
- FVIII preparation a recombinant blood coagulation factor VIII preparation Advate (manufactured by Shire Japan) was used.
- normal plasma normal pool plasma in which each factor concentration can be regarded as 100% was used.
- Normal plasma and each coagulation factor deficient plasma are mixed at various ratios to prepare mixed plasma with factor concentrations of 0.25%, 0.5, 0.75%, 1%, 2.5%, 5%, 10%, 25% and 50% respectively. did.
- FVIII preparations were added to FVIII-deficient plasma to prepare FVIII-added plasma having FVIII concentrations of 0.625%, 1.25%, 2.5%, 5%, 10%, 20%, 40%, 80% and 160%.
- FVIII preparations were added to another FVIII-deficient plasma and the FVIII concentration was 0.3%, 0.6%, 1%, 2%, 4%, 8%, 16%, 32%, 64%, 128% FVIII-added plasma.
- test specimens were from FVIII-deficient patients (hemophilia A) or FIX-deficient patients (hemophilia B), while template specimens were hemophilia A. It was prepared based on commercially available factor-deficient plasma and LA-positive plasma without using a patient sample of hemophilia B. With such a structure of the sample, in this example, as compared with Example 2, conditions were set in which it was difficult to correctly determine the state of the coagulation factor of the test sample. Table 11 shows the configurations of the test sample and the template sample used in this example.
- FIG. 18 shows the distribution of FVIII activity and APTT for the test sample and the template sample.
- -FVIII activity or abnormality of the test sample was determined by regression analysis using the parameter group.
- a linear regression analysis was performed between the test parameter group obtained from the test sample and the corresponding template parameter group obtained from each template sample.
- a template sample having a slope of the linear regression equation of 1 ⁇ 0.15 or less obtained by the regression analysis and a correlation coefficient of the linear regression equation larger than 0.90 was extracted. Among the extracted template samples, the template sample having the largest correlation coefficient was selected. When a plurality of samples with the same correlation coefficient existed, template samples having a regression equation with a slope closer to 1 were selected.
- the FVIII deficiency concordance rate and the FVIII activity level concordance rate were calculated by the same procedure as in Example 2 based on the determination results for all the test samples.
- Tables 13 and 14 show the parameter groups used and the matching rates of FVIII deficiency and FVIII activity level obtained.
- the parameter at which the FVIII deficiency concordance rate was maximum (63.0%) was the quadratic curve parameter pHx.
- the parameter at which the FVIII activity level coincidence rate was maximum (76.1%) was the quadratic curve parameter mTx.
- the FVIII deficiency agreement and the high FVIII activity level agreement were not correlated.
- the FVIII deficiency concordance rate using the conventional parameters (combination of VmaxT, AmaxT, Vmax, Amax) was 52.2%.
- the set of [vT5%, vT10%, vT20%, vT30%, vT40%, vT50%, vT60%, vT70%, vT80%, vT90%] A set of [vB5%, vB10%, vB20%, vB30%, vB40%, vB50%, vB60%, vB70%, vB80%, vB90%] was used in combination as a parameter group.
- Tables 15 and 16 show the combination parameter groups with a high FVIII deficiency concordance rate and the obtained FVIII deficiency concordance rate and FVIII activity level concordance rate.
- Table 15 shows the result when two kinds of parameters are combined, and Table 16 shows the result when three kinds of parameters are combined.
- Table 16 also shows the results of the parameter group (pNs_pNe_vTB) in which the FVIII activity level coincidence rate was the maximum.
- Table 17 shows the results of FVIII activity level determination for the parameter groups that resulted in the high FVIII deficiency agreement rate or FVIII activity level agreement rate in (3-1) and (3-2) above. As the number of parameter species used increased, both the FVIII deficiency concordance rate and the FVIII activity level concordance rate tended to increase. From these results, it was shown that the parameters related to the quadratic curve are useful for the judgment.
- Example 6 Determination of FVIII Activity or Abnormality Based on Different Criteria (1) Method Using the sample used in Example 5, a procedure similar to that in Example 5 was performed to perform primary analysis between the test parameter group and the template parameter group. A regression analysis was performed. Then, the FVIII activity status of the test sample was determined according to the following different criteria. Criterion 1: Similar to Example 5, among the template specimens having a linear regression equation with a slope of 1 ⁇ 0.15 or less and a correlation coefficient of the regression equation of more than 0.90, the FVIII activity in the template specimen having the highest correlation coefficient was measured. The state was determined to be the state of FVIII activity of the test sample.
- the test sample was determined to be Other.
- Criterion 2 the most selected method: Of the template samples having a linear regression equation with a slope of 1 ⁇ 0.15 or less and a correlation coefficient of the regression equation of greater than 0.90, five template samples with the highest correlation coefficient were extracted. The state of FVIII activity most frequently observed among these 5 samples was determined as the state of FVIII activity of the test sample. When the same number of specimens in different states existed, the more severe state was determined as the state of the test specimen. If there is no template sample that meets the conditions of the slope and correlation coefficient of the above linear regression equation, the test sample was determined to be Other.
- the most frequently observed condition severe, moderate, or mild was determined as the condition of the test sample.
- severe, moderate, or mild was determined as the condition of the test sample.
- the more severe state was determined as the state of the test specimen.
- the state of the test sample was determined to be Other.
- Table 18 shows an example of the judgment procedure.
- the FVIII activity of the template sample having the correlation coefficient rank ⁇ 1> and the determination result of the determination criterion 1 match.
- the FVIII activity of the template sample that occupies the maximum number agrees with the judgment result of judgment criterion 2. If the total number of L1 to L3 in the template sample is larger, the judgment criterion 3 is any of L1 to L3, and if the total number of Other and ND is larger, the judgment criterion 3 is Other.
- Table 19 shows examples of the FVIII deficiency concordance rate, FVIII activity level concordance rate, and average concordance rate (collectively referred to as concordance rate) determined according to each criterion.
- Table 20 shows the number of combination parameter groups that achieved the level of agreement rate.
- the FVIII deficiency concordance rate was up to 78.3% for all criteria.
- the criterion 1 was 12, and the criterions 2 and 3 were 17.
- the FVIII activity level concordance rate was 91.3% at maximum in all criteria.
- the number of parameter groups satisfying the maximum concordance level was one in criterion 1 and 3 and two in criterion 2.
- the maximum average matching rate was 81.5% according to criterion 1 and 84.8% according to criteria 2 and 3.
- the number of parameter groups satisfying the maximum concordance level was 9 for criterion 1, and 13 for criterion 2 and 3.
- Example 7 Determination of FVIII Activity or Abnormality Based on Different Thresholds
- the test was performed.
- the state of FVIII activity of the sample was determined.
- the parameter group the combination parameter group pTW_vTs_vW showing the maximum FVIII deficiency agreement rate and the FVIII activity level agreement rate in Example 5 was used.
- the slope of the linear regression equation was changed stepwise from 1 ⁇ 0.05 to 1 ⁇ 0.25 (that is, the tolerance width was 0.05 to 0.25).
- the threshold of the correlation coefficient was changed stepwise from >0.75 to >0.98.
- the FVIII deficiency agreement rate and FVIII activity level agreement rate under each condition were calculated. The results are shown in Figures 19-21.
Landscapes
- Health & Medical Sciences (AREA)
- Life Sciences & Earth Sciences (AREA)
- Engineering & Computer Science (AREA)
- Hematology (AREA)
- Chemical & Material Sciences (AREA)
- Biomedical Technology (AREA)
- Immunology (AREA)
- Urology & Nephrology (AREA)
- Physics & Mathematics (AREA)
- Molecular Biology (AREA)
- Analytical Chemistry (AREA)
- Biochemistry (AREA)
- General Health & Medical Sciences (AREA)
- General Physics & Mathematics (AREA)
- Pathology (AREA)
- Food Science & Technology (AREA)
- Medicinal Chemistry (AREA)
- Microbiology (AREA)
- Cell Biology (AREA)
- Biotechnology (AREA)
- Ecology (AREA)
- Biophysics (AREA)
- Investigating Or Analysing Biological Materials (AREA)
Priority Applications (4)
| Application Number | Priority Date | Filing Date | Title |
|---|---|---|---|
| JP2020568645A JP7402468B2 (ja) | 2019-01-31 | 2020-01-31 | 血液検体の血液凝固特性の分析方法 |
| US17/427,000 US20220146537A1 (en) | 2019-01-31 | 2020-01-31 | Method for analyzing blood coagulation characteristics of blood specimen |
| CN202080011260.2A CN113366319A (zh) | 2019-01-31 | 2020-01-31 | 血液检体的凝血特性的分析方法 |
| EP20749235.6A EP3919913A4 (en) | 2019-01-31 | 2020-01-31 | PROCEDURE FOR ANALYZING BLOOD COAGULATION PROPERTIES OF A BLOOD SAMPLE |
Applications Claiming Priority (2)
| Application Number | Priority Date | Filing Date | Title |
|---|---|---|---|
| JP2019016474 | 2019-01-31 | ||
| JP2019-016474 | 2019-01-31 |
Publications (1)
| Publication Number | Publication Date |
|---|---|
| WO2020158948A1 true WO2020158948A1 (ja) | 2020-08-06 |
Family
ID=71841047
Family Applications (1)
| Application Number | Title | Priority Date | Filing Date |
|---|---|---|---|
| PCT/JP2020/003796 WO2020158948A1 (ja) | 2019-01-31 | 2020-01-31 | 血液検体の血液凝固特性の分析方法 |
Country Status (5)
| Country | Link |
|---|---|
| US (1) | US20220146537A1 (zh) |
| EP (1) | EP3919913A4 (zh) |
| JP (1) | JP7402468B2 (zh) |
| CN (1) | CN113366319A (zh) |
| WO (1) | WO2020158948A1 (zh) |
Cited By (5)
| Publication number | Priority date | Publication date | Assignee | Title |
|---|---|---|---|---|
| WO2022054819A1 (ja) * | 2020-09-08 | 2022-03-17 | 積水メディカル株式会社 | 血液凝固反応の分析方法 |
| WO2022092248A1 (ja) * | 2020-10-29 | 2022-05-05 | 積水メディカル株式会社 | 血液凝固反応の検出方法 |
| WO2022186381A1 (ja) * | 2021-03-05 | 2022-09-09 | 積水メディカル株式会社 | 凝固時間延長要因の推定方法 |
| EP4060348A2 (en) | 2021-03-19 | 2022-09-21 | Sysmex Corporation | Analysis method, analysis device, analysis system, and analysis program for analyzing a bleeding tendency of a subject |
| WO2023032978A1 (ja) * | 2021-08-31 | 2023-03-09 | 積水メディカル株式会社 | 血液凝固反応異常の検出方法 |
Families Citing this family (1)
| Publication number | Priority date | Publication date | Assignee | Title |
|---|---|---|---|---|
| EP4116714A4 (en) * | 2020-03-06 | 2024-01-10 | Sekisui Medical Co Ltd | METHOD FOR MEASURING BLOOD COAGULATION DURATION |
Citations (6)
| Publication number | Priority date | Publication date | Assignee | Title |
|---|---|---|---|---|
| US6524861B1 (en) * | 1999-01-22 | 2003-02-25 | Medical Laboratory Automation, Inc. | Blood coagulation analyzer |
| JP2016118442A (ja) | 2014-12-19 | 2016-06-30 | 公立大学法人奈良県立医科大学 | 血液検体を判定するための方法、システム及びコンピュータプログラム、並びに血液検体分析装置 |
| JP2016194426A (ja) | 2015-03-31 | 2016-11-17 | 学校法人東日本学園 | 血液検体を判定するための方法、装置及びコンピュータプログラム、並びに血液検体分析装置 |
| JP2017106925A (ja) | 2015-04-24 | 2017-06-15 | 公立大学法人奈良県立医科大学 | 血液検体の凝固能の評価方法、並びにその方法に用いるための試薬、試薬キット及び装置 |
| JP2018017619A (ja) | 2016-07-28 | 2018-02-01 | 公立大学法人奈良県立医科大学 | 血友病の重症度の判定方法及び血液検体分析装置 |
| JP2019086518A (ja) * | 2017-11-07 | 2019-06-06 | 積水メディカル株式会社 | 血液凝固機能の評価方法 |
Family Cites Families (5)
| Publication number | Priority date | Publication date | Assignee | Title |
|---|---|---|---|---|
| US7957793B2 (en) * | 2004-12-22 | 2011-06-07 | Wisconsin Alumni Research Foundation | Methods for identifying neuronal spikes |
| WO2012173260A1 (ja) * | 2011-06-17 | 2012-12-20 | 学校法人東日本学園・北海道医療大学 | ループスアンチコアグラント検出用血液凝固時間の測定方法 |
| US20130344519A1 (en) * | 2012-06-25 | 2013-12-26 | Bayer Healthcare Llc | Methods and systems for assessment of turbidity kinetics (waveform analysis) in coagulation testing |
| US9739733B2 (en) * | 2012-12-07 | 2017-08-22 | T2 Biosystems, Inc. | Methods for monitoring tight clot formation |
| JP7002718B2 (ja) * | 2017-04-24 | 2022-02-10 | シスメックス株式会社 | 血液検体の分析方法、分析装置及びコンピュータプログラム |
-
2020
- 2020-01-31 CN CN202080011260.2A patent/CN113366319A/zh active Pending
- 2020-01-31 US US17/427,000 patent/US20220146537A1/en active Pending
- 2020-01-31 EP EP20749235.6A patent/EP3919913A4/en active Pending
- 2020-01-31 WO PCT/JP2020/003796 patent/WO2020158948A1/ja unknown
- 2020-01-31 JP JP2020568645A patent/JP7402468B2/ja active Active
Patent Citations (6)
| Publication number | Priority date | Publication date | Assignee | Title |
|---|---|---|---|---|
| US6524861B1 (en) * | 1999-01-22 | 2003-02-25 | Medical Laboratory Automation, Inc. | Blood coagulation analyzer |
| JP2016118442A (ja) | 2014-12-19 | 2016-06-30 | 公立大学法人奈良県立医科大学 | 血液検体を判定するための方法、システム及びコンピュータプログラム、並びに血液検体分析装置 |
| JP2016194426A (ja) | 2015-03-31 | 2016-11-17 | 学校法人東日本学園 | 血液検体を判定するための方法、装置及びコンピュータプログラム、並びに血液検体分析装置 |
| JP2017106925A (ja) | 2015-04-24 | 2017-06-15 | 公立大学法人奈良県立医科大学 | 血液検体の凝固能の評価方法、並びにその方法に用いるための試薬、試薬キット及び装置 |
| JP2018017619A (ja) | 2016-07-28 | 2018-02-01 | 公立大学法人奈良県立医科大学 | 血友病の重症度の判定方法及び血液検体分析装置 |
| JP2019086518A (ja) * | 2017-11-07 | 2019-06-06 | 積水メディカル株式会社 | 血液凝固機能の評価方法 |
Non-Patent Citations (7)
| Title |
|---|
| BRITISH JOURNAL OF HAEMATOLOGY, vol. 98, 1997, pages 68 - 73 |
| NISHIYAMA, ATSUKO ET AL.: "O-056 / P-080 Detection of trace amount of factor IX in severe hemophilia B by clot waveform analysis", JAPANESE JOURNAL OF THROMBOSIS AND HEMOSTASIS, vol. 29, no. 2, 30 November 2017 (2017-11-30), JP, pages 184, XP009529129, ISSN: 0915-7441 * |
| OGIWARA, KEN'ICHI: "O-038 / P069: Development of a diagnostic algorithm for hemophilia A by template matching of APTT clot waveform", JAPANESE JOURNAL OF THROMBOSIS AND HEMOSTASIS, vol. 30, no. 2, 1 May 2019 (2019-05-01), JP, pages 411, XP009527869, ISSN: 0915-7441 * |
| See also references of EP3919913A4 |
| TOMOKO MATSUMOTOMIDORI SHIMA, CLOT WAVEFORM ANALYSIS AND ITS APPLICATION TO THE DETECTION OF VERY LOW LEVELS OF FACTOR VIII ACTIVITY, vol. 14, no. 2, 2003, pages 122 - 127 |
| WADA, HIDEO: "APTT waveform", JAPANESE JOURNAL OF THROMBOSIS AND HEMOSTASIS, vol. 29, no. 4, 10 August 2018 (2018-08-10), pages 413 - 420, XP055809543 * |
| YAMASAKI, NAOYA: "PS2-37-7 Is the result of Colt Waveform Analysis (CWA) different in hemophilia A and B?", RINSHO KETSUEKI - JAPANESE JOURNAL OF CLINICAL HEMATOLOGY,, vol. 58, no. 9, 30 November 2016 (2016-11-30), JP , pages 1754, XP009529130, ISSN: 0485-1439 * |
Cited By (6)
| Publication number | Priority date | Publication date | Assignee | Title |
|---|---|---|---|---|
| WO2022054819A1 (ja) * | 2020-09-08 | 2022-03-17 | 積水メディカル株式会社 | 血液凝固反応の分析方法 |
| WO2022092248A1 (ja) * | 2020-10-29 | 2022-05-05 | 積水メディカル株式会社 | 血液凝固反応の検出方法 |
| WO2022186381A1 (ja) * | 2021-03-05 | 2022-09-09 | 積水メディカル株式会社 | 凝固時間延長要因の推定方法 |
| EP4060348A2 (en) | 2021-03-19 | 2022-09-21 | Sysmex Corporation | Analysis method, analysis device, analysis system, and analysis program for analyzing a bleeding tendency of a subject |
| EP4060348A3 (en) * | 2021-03-19 | 2022-09-28 | Sysmex Corporation | Analysis method, analysis device, analysis system, and analysis program for analyzing a bleeding tendency of a subject |
| WO2023032978A1 (ja) * | 2021-08-31 | 2023-03-09 | 積水メディカル株式会社 | 血液凝固反応異常の検出方法 |
Also Published As
| Publication number | Publication date |
|---|---|
| CN113366319A (zh) | 2021-09-07 |
| EP3919913A4 (en) | 2022-11-09 |
| JPWO2020158948A1 (ja) | 2021-12-02 |
| EP3919913A1 (en) | 2021-12-08 |
| JP7402468B2 (ja) | 2023-12-21 |
| US20220146537A1 (en) | 2022-05-12 |
Similar Documents
| Publication | Publication Date | Title |
|---|---|---|
| WO2020158948A1 (ja) | 血液検体の血液凝固特性の分析方法 | |
| JP2019086517A (ja) | 血液凝固機能の評価方法 | |
| WO2020101025A1 (ja) | 分析方法、分析装置及び分析プログラム | |
| JP6811975B2 (ja) | Aptt延長要因推定システム | |
| JP2019086518A (ja) | 血液凝固機能の評価方法 | |
| JP7458037B2 (ja) | 凝固因子インヒビター力価の測定方法 | |
| Marija et al. | Blood-gas vs. Central-Laboratory analyzers: interchangeability and reference intervals for sodium, potassium, glucose, lactate and hemoglobin | |
| EP3136104B1 (en) | Blood sample analyzing method and blood sample analyzer | |
| EP4212880A1 (en) | Blood coagulation reaction analysis method | |
| CN109073662A (zh) | 用于鉴定与抗磷脂综合征相关的狼疮抗凝物(la)的方法和试剂盒 | |
| JP7491638B2 (ja) | 血液分析方法 | |
| CA2514743C (en) | Performance improvement for hematology analysis | |
| WO2021229556A1 (ja) | 血液分析方法 | |
| US20230213497A1 (en) | Method for measuring blood coagulation time | |
| EP4116714A1 (en) | Blood coagulation time measurement method | |
| EP4303586A1 (en) | Method for estimating factor of prolonged coagulation time | |
| Lim et al. | Between and within calibration variation: implications for internal quality control rules | |
| Tantanate | Performance Evaluation of the Coapresta® 2000 Automated Coagulation analyzer for Screening Coagulogram |
Legal Events
| Date | Code | Title | Description |
|---|---|---|---|
| 121 | Ep: the epo has been informed by wipo that ep was designated in this application |
Ref document number: 20749235 Country of ref document: EP Kind code of ref document: A1 |
|
| ENP | Entry into the national phase |
Ref document number: 2020568645 Country of ref document: JP Kind code of ref document: A |
|
| NENP | Non-entry into the national phase |
Ref country code: DE |
|
| ENP | Entry into the national phase |
Ref document number: 2020749235 Country of ref document: EP Effective date: 20210831 |