WO2020158948A1 - 血液検体の血液凝固特性の分析方法 - Google Patents
血液検体の血液凝固特性の分析方法 Download PDFInfo
- Publication number
- WO2020158948A1 WO2020158948A1 PCT/JP2020/003796 JP2020003796W WO2020158948A1 WO 2020158948 A1 WO2020158948 A1 WO 2020158948A1 JP 2020003796 W JP2020003796 W JP 2020003796W WO 2020158948 A1 WO2020158948 A1 WO 2020158948A1
- Authority
- WO
- WIPO (PCT)
- Prior art keywords
- time
- coagulation
- weighted average
- calculation target
- sample
- Prior art date
Links
Images


Classifications
-
- G—PHYSICS
- G01—MEASURING; TESTING
- G01N—INVESTIGATING OR ANALYSING MATERIALS BY DETERMINING THEIR CHEMICAL OR PHYSICAL PROPERTIES
- G01N33/00—Investigating or analysing materials by specific methods not covered by groups G01N1/00 - G01N31/00
- G01N33/48—Biological material, e.g. blood, urine; Haemocytometers
- G01N33/483—Physical analysis of biological material
- G01N33/487—Physical analysis of biological material of liquid biological material
- G01N33/49—Blood
- G01N33/4905—Determining clotting time of blood
-
- G—PHYSICS
- G01—MEASURING; TESTING
- G01N—INVESTIGATING OR ANALYSING MATERIALS BY DETERMINING THEIR CHEMICAL OR PHYSICAL PROPERTIES
- G01N21/00—Investigating or analysing materials by the use of optical means, i.e. using sub-millimetre waves, infrared, visible or ultraviolet light
- G01N21/17—Systems in which incident light is modified in accordance with the properties of the material investigated
- G01N21/47—Scattering, i.e. diffuse reflection
-
- G—PHYSICS
- G01—MEASURING; TESTING
- G01N—INVESTIGATING OR ANALYSING MATERIALS BY DETERMINING THEIR CHEMICAL OR PHYSICAL PROPERTIES
- G01N33/00—Investigating or analysing materials by specific methods not covered by groups G01N1/00 - G01N31/00
- G01N33/48—Biological material, e.g. blood, urine; Haemocytometers
- G01N33/50—Chemical analysis of biological material, e.g. blood, urine; Testing involving biospecific ligand binding methods; Immunological testing
- G01N33/86—Chemical analysis of biological material, e.g. blood, urine; Testing involving biospecific ligand binding methods; Immunological testing involving blood coagulating time or factors, or their receptors
-
- G—PHYSICS
- G16—INFORMATION AND COMMUNICATION TECHNOLOGY [ICT] SPECIALLY ADAPTED FOR SPECIFIC APPLICATION FIELDS
- G16H—HEALTHCARE INFORMATICS, i.e. INFORMATION AND COMMUNICATION TECHNOLOGY [ICT] SPECIALLY ADAPTED FOR THE HANDLING OR PROCESSING OF MEDICAL OR HEALTHCARE DATA
- G16H50/00—ICT specially adapted for medical diagnosis, medical simulation or medical data mining; ICT specially adapted for detecting, monitoring or modelling epidemics or pandemics
- G16H50/20—ICT specially adapted for medical diagnosis, medical simulation or medical data mining; ICT specially adapted for detecting, monitoring or modelling epidemics or pandemics for computer-aided diagnosis, e.g. based on medical expert systems
Definitions
- the present invention relates to a method for analyzing blood coagulation characteristics of a blood sample.
- the present invention also relates to a program and an apparatus for analyzing the blood coagulation characteristics of the blood sample.
- a blood coagulation test is a test for examining a patient's hemostatic ability or fibrinolytic ability.
- a coagulation reaction that occurs after a reagent is added to a blood sample of a patient is optically measured.
- the time for which coagulation has progressed to a predetermined state is measured as blood coagulation time.
- Typical examples of blood coagulation time include prothrombin time (PT), activated partial thromboplastin time (APTT), thrombin time and the like.
- the prolongation of blood coagulation time reflects the tendency of bleeding in vivo.
- the causes of prolongation include 1) abnormal amount of blood coagulation factor, 2) presence of antibodies against blood components that make up the blood coagulation system and reagents for measuring blood coagulation time, and 3) administration of drugs that inhibit blood coagulation reaction. And so on.
- a coagulation reaction curve can be obtained by measuring the blood coagulation reaction amount after adding a reagent to a blood sample over time.
- This coagulation reaction curve has a different shape depending on the type of abnormality in the blood coagulation system (Non-Patent Document 1). Therefore, a method for determining abnormality of the blood coagulation system based on the coagulation reaction curve is disclosed.
- Patent Document 1 Patent Document 2 and Patent Document 3 parameters relating to the primary differential curve and the secondary differential curve of the coagulation reaction curve for the blood of the patient, such as maximum coagulation rate, maximum coagulation acceleration and maximum coagulation deceleration
- maximum coagulation rate maximum coagulation rate
- maximum coagulation acceleration maximum coagulation deceleration
- Hemophilia is a disease in which coagulation factor VIII (FVIII) or coagulation factor IX (FIX) is congenitally deficient or has a functional abnormality.
- a person with a FVIII activity of less than 40% is classified as hemophilia A, and a person with a FIX activity of less than 40% is classified as hemophilia B, based on the activity of a normal person as 100%. Further, the severity of hemophilia is classified according to the activity level.
- Patent Document 4 describes a method of determining the severity of hemophilia based on the average rate of change of the coagulation rate until the time when the coagulation reaction of the patient reaches the maximum coagulation rate or the maximum coagulation acceleration.
- JP, 2016-194426 A Japanese Patent Laid-Open No. 2016-118442 JP, 2017-106925, A JP, 2018-017619, A
- the first derivative curve of the actual blood sample coagulation reaction curve may not be unimodal due to the influence of the components contained in the sample, the reagents used for the test, or the difference in the measurement method. Therefore, in the methods of Patent Documents 1 to 4, in order to accurately obtain the parameters such as the maximum coagulation rate and the maximum coagulation rate time, the smoothing process for making the first-order differential curve monomodal is performed to perform the waveform analysis. ing. However, when the smoothing process for unimodalization is performed on the first-order differential curve in this way, the obtained curve reflects the clinical state of the patient in detail due to the loss of waveform information due to the smoothing process. It is supposed not to. Therefore, there is a demand for an analysis method that can accurately evaluate the blood coagulation characteristics of a sample from a first-order differential curve that is not unimodal, regardless of the smoothing process.
- the present inventor has found a parameter derived from a blood coagulation reaction curve and having a relationship with the activities of coagulation factor VIII (FVIII) and coagulation factor IX (FIX).
- the present inventor has also found a method for analyzing the activity level of FVIII or FIX in a blood sample and the presence or absence of FVIII or FIX activity abnormality in the blood sample based on the parameters.
- the present invention provides the following. [1] Acquiring a waveform relating to a coagulation rate or a coagulation acceleration of a sample in which a test blood sample and a coagulation time measuring reagent are mixed, Extracting a plurality of parameters characterizing a waveform relating to the solidification rate or solidification acceleration; Determining the activity level or activity abnormality of the coagulation factor in the test blood sample based on the plurality of parameters; A method for analyzing a blood sample, comprising: [2] Whether the plurality of parameters include a plurality of parameters that respectively characterize a plurality of calculation target areas of the waveform relating to the coagulation rate, or a plurality of parameters that respectively characterize a plurality of calculation target areas of the waveform relating to the coagulation acceleration.
- the plurality of parameters are as follows: About the weighted average time vT, the weighted average height vH, the peak width vB, the weighted average peak width vW, the weighted average peak width vW, the B flattening rate vAB about the weighted average height, and the weighted average height for the plurality of calculation target areas of the waveform related to the coagulation rate W flatness vAW, B hourly rate vTB for weighted average time, W hourly rate vTW for weighted average time, average time vTa, average height vHa, B flatness vABa for average height, average height W flatness vAWa, area start time vTs, area end time vTe, area center time vTm, area time width vTr, main peak start time vNs, main peak end time vNe, and main peak width vN; Weighted average time vT, the weighted average height vH, the peak width
- VB is a time length such that F(t) ⁇ x from t1 to t2
- the vW is a time length such that F(t) ⁇ vH from t1 to t2, VTs and vTe are t1 and t2, respectively
- the vTr is the length of time from vTs to vTe
- the vN is a time length from vNs to vNe
- Said vAB represents the ratio of said vH and said vB
- Said vAW represents the ratio of said vH and said vW
- Said vTB represents the ratio of said vT and said vB
- the vTW represents the ratio of the vT and the vW
- Said vABa represents the ratio of said vHa and said vB
- Said vAWa represents the ratio of said vHa and said vW
- the waveform relating to the coagulation acceleration is F′(t) (t is time) and the time when F′(t) is a predetermined value x is t1 and t2 (t1 ⁇ t2)
- the calculation target area is F'(t) is a region that satisfies x
- the pT and pH are represented by the following formula
- the pB is a time length such that F′(t) ⁇ x from t1 to t2
- the pW is the length of time that F′(t) ⁇ pH from t1 to t2
- the pN is the time length from pNs to pNe
- Said pAB represents the ratio of
- the waveform relating to the coagulation acceleration is F′(t) (t is time) and the time when F′(t) is a predetermined value x is t1 and t2 (t1 ⁇ t2)
- the calculation target area is F'(t) is a region that satisfies x
- mT and mH are represented by the following formula
- the mB is a time length such that F′(t) ⁇ x from t1 to t2
- the mW is a time length such that F′(t) ⁇ mH from t1 to t2
- the mN is a time length from m
- the predetermined value x is 0.5 to 99% of the maximum value of the F(t), 0.5 to 99% of the maximum value of the plus peak of the F′(t), or the F 'The analytical method according to any one of [4] to [6], which is 0.5 to 99% of the minimum value of the negative peak of (t).
- the determination compares the plurality of parameter groups with corresponding parameter groups for a plurality of template blood samples, and based on the result of the comparison, the activity level of the coagulation factor in the test blood sample.
- the template blood sample is a blood sample whose activity level of the coagulation factor or the presence or absence of abnormal activity is known.
- the analysis method according to any one of [1] to [8]. [10] The analysis according to [9], wherein the comparison includes obtaining a correlation between the parameter group for the test blood sample and each of the corresponding parameter groups for the plurality of template blood samples. Method. [11] The determination is to select a template blood sample in which the correlation satisfies a predetermined condition, and to determine the activity level or activity abnormality of the coagulation factor in the selected template blood sample as a coagulation factor of the test blood sample.
- the analysis method according to [10] which comprises determining an activity level or an activity abnormality.
- the present invention it is possible to analyze the FVIII or FIX activity level in a blood sample or the presence or absence of its activity abnormality (deficiency, etc.) based on the parameter derived from the coagulation reaction curve.
- INDUSTRIAL APPLICABILITY The present invention is useful for determining hemophilia A or hemophilia B, or determining the severity of hemophilia patients.
- FIG. An example of a coagulation reaction curve.
- the conceptual diagram of the parameter calculated from the waveform regarding a coagulation rate The conceptual diagram for demonstrating the calculation object threshold value, the range of the correction 0th-order curve and correction 1st-order curve used as an analysis target, and a weighted average point.
- the conceptual diagram of the parameter calculated from a quadratic curve A conceptual diagram showing vTs, vTe, vTr, vNs, vNe, vN.
- the dotted line indicates the 10% calculation target area of the linear curve.
- B A conceptual diagram for explaining a weighted average point when the calculation target range value is 80%.
- the conceptual diagram which shows the structure of the automatic analyzer for performing the analysis method of the blood sample by this invention. Regression line for parameter group A-1.
- test sample (Sample AF) is derived from a severe hemophilia A patient with FVIII activity of less than 0.2%.
- the abscissa and the ordinate indicate the FVIII activity and APTT of the template sample and the test sample, respectively.
- the present invention relates to analyzing the properties of blood samples related to blood coagulation.
- the blood sample may be referred to as a sample. More specifically, the present invention relates to analyzing the presence or absence of an activity level of a blood coagulation time prolonging factor component or an abnormality in its activity in a sample having an extended blood coagulation time.
- the present invention relates to analyzing the activity level of coagulation factor VIII (hereinafter also referred to as FVIII) or coagulation factor IX (hereinafter also referred to as FIX), or the presence or absence of abnormal activity thereof.
- FVIII coagulation factor VIII
- FIX coagulation factor IX
- one aspect of the present invention is a method for analyzing a blood sample, more specifically, a blood coagulation time prolonging factor component in the blood sample, preferably FVIII and/or FIX activity level, or the presence or absence of activity abnormality thereof. Is a method of determining.
- a blood coagulation time prolonging factor component in the blood sample preferably FVIII and/or FIX activity level, or the presence or absence of activity abnormality thereof.
- Outline of Method A method for analyzing a blood sample according to the present invention acquires a waveform relating to a coagulation rate or a coagulation acceleration of a sample in which a test sample and a coagulation time measuring reagent are mixed. And extracting a plurality of parameters characterizing the waveform relating to the coagulation rate or coagulation acceleration, and determining the activity level or activity abnormality of the blood coagulation time extension factor component in the test sample based on the plurality of parameters Including and.
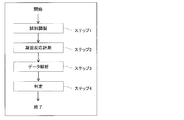
- One embodiment of the method of the present invention will be described with reference to FIG.
- a sample is prepared from a test sample (step 1), and then a coagulation reaction measurement for the sample is executed (step 2).
- a waveform relating to the coagulation rate or the coagulation acceleration of the sample is acquired from the obtained measurement data, and then the waveform is subjected to a predetermined analysis (step 3).
- the test sample is determined (determination of the activity level of the blood coagulation time extension factor component or its activity abnormality) (step 4).
- sample Preparation and Coagulation Reaction Measurement The preparation of a sample from the test sample in step 1 and the coagulation reaction measurement of the sample in step 2 will be described.
- the measurement of the activated partial thromboplastin time (APTT) will be described as an example of the measurement of the coagulation reaction, but a person skilled in the art can change the measurement to other coagulation reaction (for example, prothrombin time (PT) measurement). If there is, it can be implemented.
- APTT activated partial thromboplastin time
- test sample examples include a sample derived from a subject who is required to have a test regarding blood coagulation ability, such as a sample having blood coagulation abnormality, or a sample suspected of blood coagulation abnormality, More specifically, a sample having an extended blood coagulation time or a sample suspected of having an extended blood coagulation time can be mentioned.
- a sample having an extended blood coagulation time or a sample suspected of having an extended blood coagulation time can be mentioned.
- plasma of a subject is used as the sample.
- a well-known anticoagulant usually used for coagulation test may be added to the specimen. For example, blood is collected using a blood collection tube containing sodium citrate and then centrifuged to obtain plasma.
- the obtained test sample is mixed with the coagulation time measuring reagent to prepare a sample for measuring the coagulation reaction.
- the coagulation time measuring reagent may be any reagent for APTT measurement, and examples thereof include a contact factor activator and a phospholipid.
- activators include ellagic acid, celite, kaolin, silica, polyphenol compounds and the like.
- phospholipids include animal-derived, plant-derived, and synthetic-derived phospholipids. Examples of animal-derived phospholipids include those derived from rabbit brain, chicken, and pig. Examples of plant-derived phospholipids include those derived from soybean.
- a buffer such as Tris-hydrochloric acid may be added to the sample, if necessary.
- a commercially available APTT measurement reagent may be used as the reagent for the APTT measurement.
- Examples of commercially available APTT measurement reagents include Coagpia APTT-N (manufactured by Sekisui Medical Co., Ltd.).
- the prepared sample is heated and the contact factors in the sample are activated.
- the temperature at the time of heating is, for example, 30°C or higher and 40°C or lower, preferably 35°C or higher and 39°C or lower.
- a calcium chloride solution for example, Coagpia APTT-N calcium chloride solution; manufactured by Sekisui Medical Co., Ltd.
- the coagulation reaction of the mixed solution after adding the calcium chloride solution can be measured.
- general means for example, an optical means for measuring the amount of scattered light, transmittance, absorbance, etc., or a mechanical means for measuring the viscosity of plasma may be used.
- the measured period may be, for example, several tens of seconds to 5 minutes from the time of adding the calcium chloride solution. During the measurement period, the measurement can be repeatedly performed at predetermined intervals.
- the measurement may be performed at 0.1 second intervals.
- the temperature of the reaction solution during measurement is, for example, 30° C. or higher and 40° C. or lower, preferably 35° C. or higher and 39° C. or lower.
- the reaction start time of the coagulation reaction can be typically defined as the time when the calcium chloride solution is added to the sample containing the test sample, but other timing may be defined as the reaction start time. Further, various conditions for measurement can be appropriately set according to the test sample, reagent, measuring means, and the like.
- a series of operations in the above coagulation reaction measurement may be performed using an automatic analyzer.
- An example of an automatic analyzer is a blood coagulation automatic analyzer CP3000 (manufactured by Sekisui Medical Co., Ltd.).
- some operations may be performed manually.
- a test sample can be prepared by a human, and subsequent operations can be performed by an automatic analyzer.
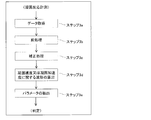
- step 3 Data analysis 1.4.1. Data Primary Processing and Correction Processing Next, the data analysis in step 3 will be described. The data analysis flow is shown in FIG. The data analysis in step 3 may be performed in parallel with the coagulation reaction measurement in step 2, or may be performed later using the data of the coagulation reaction measurement measured in advance.
- step 3a the measurement data of the above coagulation reaction measurement is acquired.
- This data is, for example, data that reflects the coagulation reaction process of the sample obtained by the APTT measurement in step 2 described above.
- data showing the time change of the progressing amount (for example, scattered light amount) of the coagulation reaction after the addition of the calcium chloride solution is obtained from the sample containing the test sample and the coagulation time measuring reagent.
- the data obtained by these coagulation reaction measurements are also referred to herein as coagulation reaction information.
- FIG. 3 is a coagulation reaction curve based on the amount of scattered light
- the horizontal axis shows the elapsed time (coagulation reaction time) after the addition of the calcium chloride solution
- the vertical axis shows the scattered light amount. Since the coagulation reaction of the mixed solution progresses with the passage of time, the amount of scattered light increases.
- a curve indicating the change in the coagulation reaction amount with respect to the coagulation reaction time which is represented by the amount of scattered light or the like, is referred to as a coagulation reaction curve.
- the coagulation reaction curve based on the amount of scattered light as shown in FIG. 3 is usually sigmoidal.
- the coagulation reaction curve based on the amount of transmitted light is usually in an inverse sigmoid shape.
- data analysis using a coagulation reaction curve based on the amount of scattered light as coagulation reaction information will be described. It is apparent to those skilled in the art that similar processing can be performed in the case of data analysis using a coagulation reaction curve based on the amount of transmitted light or absorbance as coagulation reaction information.
- a coagulation reaction curve obtained by a mechanical means such as a change in viscosity of the mixed liquid may be an analysis target.
- step 3b pretreatment of the coagulation reaction curve is performed.
- the preprocessing includes smoothing processing for removing noise and zero point adjustment.
- FIG. 4 shows an example of the coagulation reaction curve of FIG. 3 which has been subjected to the pretreatment (smoothing treatment and zero point adjustment).
- any known noise removal method can be used.
- the amount of scattered light at the measurement start point (time 0) is larger than 0.
- the zero point adjustment after the smoothing process the scattered light amount at time 0 is adjusted to 0 as shown in FIG. 5A and B show a partial enlargement of the coagulation reaction curve of FIG. 3 before and after pretreatment, respectively.
- smoothing processing and zero point adjustment are performed on the data of FIG. 5A.
- the height of the coagulation reaction curve depends on the fibrinogen concentration of the test sample. On the other hand, since the fibrinogen concentration varies from person to person, the height of the coagulation reaction curve differs depending on the test sample. Therefore, in this method, if necessary, a correction process for converting the pretreatment coagulation reaction curve into a relative value is performed in step 3c. By the correction process, a coagulation reaction curve that does not depend on the fibrinogen concentration can be obtained, and thus it becomes possible to quantitatively compare the difference in the shape of the coagulation reaction curve after pretreatment between samples.
- the coagulation reaction curve after the pretreatment is corrected so that the maximum value becomes a predetermined value.
- the corrected coagulation reaction curve P(t) is obtained from the coagulation reaction curve after the pretreatment according to the following formula (1).
- D(t) represents the coagulation reaction curve after pretreatment
- Dmax and Dmin represent the maximum value and the minimum value of D(t), respectively
- Drange represents the change width of D(t). (That is, Dmax-Dmin)
- A is an arbitrary value that represents the maximum value of the corrected coagulation reaction curve.
- P(t) [(D(t)-Dmin)/Drange] ⁇ A (1)
- FIG. 6 shows data corrected so that the coagulation reaction curve shown in FIG. 4 has a maximum value of 100.
- the above-described correction processing may be performed on a waveform relating to a coagulation velocity or a coagulation acceleration, which will be described later, or a parameter group extracted from the waveform.
- a waveform relating to the coagulation rate for the coagulation reaction curve D(t) after the pretreatment in which the correction process is not performed, and then convert this into a value corresponding to P(t).
- the value of each parameter included in the parameter group can be converted into a value corresponding to P(t).
- the corrected coagulation reaction curve and the correction-free coagulation reaction curve as described above are also referred to as a corrected 0th-order curve and an uncorrected 0th-order curve, respectively, and are collectively referred to as a “0th-order curve”. Also called.
- the first-order differential curves of the corrected zero-order curve and the uncorrected zero-order curve are referred to as a corrected first-order curve and an uncorrected first-order curve, respectively, and these are collectively referred to as "1. It is also called the "second curve".
- the second derivative curve of the corrected zero-order curve and the uncorrected zero-order curve, or the corrected first-order curve and the first-order derivative curve of the uncorrected first-order curve are respectively corrected 2 It is also called a quadratic curve and an uncorrected quadratic curve, and these are also collectively called "quadratic curve”.
- a waveform regarding coagulation speed or coagulation acceleration is calculated.
- the waveform related to the coagulation rate includes an uncorrected linear curve and a corrected linear curve.
- the uncorrected first-order curve represents a value obtained by first-order differentiating the coagulation reaction curve (uncorrected zero-order curve), that is, the rate of change of the coagulation reaction amount (coagulation rate) at any coagulation reaction time.
- the corrected linear curve represents a value obtained by linearly differentiating the corrected coagulation reaction curve (corrected zero-order curve), that is, the relative change rate of the coagulation reaction amount at an arbitrary coagulation reaction time. Therefore, the waveform relating to the coagulation rate may be a waveform representing the coagulation rate in the coagulation reaction of the sample or its relative value.
- a value representing the progress of blood coagulation including the coagulation rate represented by a linear curve and its relative value is collectively referred to as a primary differential value.
- the waveform relating to the coagulation acceleration includes an uncorrected quadratic curve and a corrected quadratic curve.
- the value represented by the waveform relating to the coagulation acceleration is generically referred to as the second derivative.
- the first derivative and the second derivative of the coagulation reaction curve or the corrected coagulation reaction curve can be performed using a known method.
- FIG. 7 shows a corrected first-order curve obtained by first-order differentiating the corrected zero-order curve shown in FIG.
- the horizontal axis of FIG. 7 represents the coagulation reaction time, and the vertical axis represents the first-order differential value.
- a plurality of parameters that characterize the waveform relating to the solidification rate or solidification acceleration for the sample are extracted.
- the plurality of parameters includes a plurality of parameters, each of which characterizes a waveform relating to a clotting rate.
- the plurality of parameters includes a plurality of parameters each characterizing a waveform related to coagulation acceleration.
- a plurality of parameters, each of which characterizes a waveform for coagulation rate, and a plurality of parameters, each of which characterize a waveform for coagulation acceleration are used in combination.
- a plurality of calculation target areas are extracted from the waveform relating to the coagulation velocity or the coagulation acceleration, while characterizing each of the plurality of calculation target areas.
- Parameters are extracted.
- a plurality of parameters that respectively characterize a plurality of calculation target areas for the waveform related to the coagulation velocity or the coagulation acceleration are extracted. Therefore, the plurality of parameters that characterize the waveform relating to the coagulation rate or the coagulation acceleration extracted by the present invention include a plurality of parameters that respectively characterize a plurality of calculation target regions of the waveform relating to the coagulation rate, or a waveform relating to the coagulation acceleration. Or a combination thereof.
- a parameter group including the obtained plurality of parameters is created.
- the parameter group reflects the shape of the waveform relating to the coagulation rate or coagulation acceleration and is associated with the blood coagulation characteristics of the sample.
- the parameter group is used for determination of the test sample (step 4). The parameters will be described below.
- the calculation target area and the parameters that characterize it will be explained below using the waveform related to the coagulation rate as an example.
- the calculation target region is a region (segment) in which the first-order differential value (y value) in the waveform (first-order curve) related to the coagulation rate is equal to or larger than a predetermined calculation target region value. More specifically, in the calculation target region, the first derivative value (y value) in the waveform relating to the coagulation rate is equal to or higher than a predetermined calculation target region value and equal to or lower than the maximum value (Vmax), and the maximum point of the waveform is It is an area (segment) that includes.
- the calculation target range value is a predetermined value that specifies the lower limit of the calculation target range, and is also referred to as a calculation target range value S in this specification.
- the calculation target threshold value S can be set to limit the range in which the peak shape of the waveform relating to the coagulation rate is reflected. In order to limit the peak shape relatively broadly, the calculation target threshold value S can be set to 0% to 20% of Vmax. On the other hand, when the calculation target threshold value S is increased, the influence of the upper shape of the peak is reflected in the analysis result relatively. To analyze the shape of the top of the peak, the threshold value S to be calculated can be set to 20% to 95% of Vmax. In one embodiment, the threshold value S to be calculated can be set to 0.5 to 99%, preferably 5 to 90% of Vmax.
- a plurality of calculation target areas are extracted based on a plurality of different calculation target area values S.
- the number of calculation target areas extracted in the method of the present invention is not necessarily limited, but when the number is small, the accuracy of determination of a blood sample may decrease, while when the number is too large, the calculation amount increases. Then, the calculation load becomes high.
- the plurality of calculation target areas are preferably three or more different areas, more preferably five or more different areas, further preferably 3 to 100 different areas, and further preferably 5 to 20. Are different areas.
- the number of calculation target range values S corresponds to the number of calculation target ranges.
- the calculation target range values S for extracting each calculation target range are different from each other.
- the interval of each S may be set according to the number of calculation target areas, but preferably 1/100 or more and 1/2 or less of Vmax, more preferably 1/33 or more and 1/5 or less of Vmax, further preferably It is 1/20 or more and 1/5 or less of Vmax, and more preferably 1/20 or more and 1/10 or less of Vmax.
- the interval between Vmax and each S may be the same or different.
- the threshold value S to be calculated can also be applied to a quadratic curve.
- the quadratic curve can have peaks in both the positive and negative directions.
- the calculation target threshold value S can be set for each of the plus peak and the minus peak of the quadratic curve.
- the threshold value S to be calculated may be set to 0.5 to 99%, preferably 5 to 90% of the maximum value of the plus peak of the quadratic curve. In another embodiment, the threshold S for calculation may be set to 0.5 to 99%, preferably 5 to 90% of the minimum value of the negative peak of the quadratic curve.
- the vB representing the peak width of the region is displayed.
- the weighted average point (vTx, vHx) corresponds to the “weighted average value” of the calculation target area of F(t).
- the weighted average time vT is the coagulation reaction time (t) at the weighted average point. That is, the weighted average time vT is the time from the coagulation reaction start time to the weighted average point, and is the x coordinate of the weighted average point.
- the weighted average height vH is the y coordinate of the weighted average point.
- the weighted average time vT and weighted average height vH for the primary curve can be obtained by the following procedure.
- the maximum value of the primary curve F(t) is Vmax
- the calculation target threshold value is S
- the data group at time t satisfying F(t) ⁇ Vmax ⁇ S ⁇ 0.01 is defined as t[t1, ...t2].
- the product sum value M is calculated by the following equation (2).
- Weighted average time vT and weighted average height vH are calculated by the following equations (3) and (4), respectively.
- a weighted average point (vTx, vHx) is derived from the obtained vT and vH.
- S calculation target range value
- vT and vH in the calculation target area in which S is 5% are vT5% and vH5%.
- the weighted average time vTx and the weighted average height vHx can be used as parameters that characterize the calculation target region.
- FIG. 9 shows the relationship between the calculation target threshold value S, the areas of the corrected 0th-order curve and the corrected primary curve (the calculation target area) that are analyzed and the weighted average points.
- the left shows the corrected zero-order curve
- the right shows the calculation target area of the corrected first-order curve
- the black circles show the weighted average points.
- the calculation target range value S changes, the positions of the calculation target range and the weighted average point change as shown in FIG.
- the parameters related to the calculation target area of the corrected linear curve are calculated, but similar parameters can be calculated for the uncorrected linear curve.
- a weighted average point, a weighted average time, and a weighted average height can be defined for a quadratic curve.
- the quadratic curve has peaks in both the plus and minus directions of the secondary differential value as shown in FIG. Therefore, the weighted average point of the quadratic curve can be calculated for both the positive and negative peaks.
- the time t[t1, ..., t2] (t1 ⁇ t2) is calculated, and the weighted average time pT of the plus peak and the weighted average height pH are calculated according to the above equations (2)' to (4)'.
- the position of the weighted average point changes with the change of the calculation target threshold value S.
- Peak width, average point, flatness and time rate Reaction time is longer than the weighted average time vT from the minimum reaction time when the first derivative value is more than the calculation target threshold value S in the area where the reaction time is shorter than the weighted average time vT.
- the time length for which the primary curve F(t) ⁇ S (the number of data points for F(t) ⁇ S The value obtained by multiplying the photometric time interval) is defined as the peak width vB of the primary curve.
- the peak width vB is from time vTs to time vTe.
- the minimum and maximum values of the reaction time at which the second-order derivative value at the positive peak of the quadratic curve F'(t) is greater than or equal to the calculation target threshold value S are pTs and pTe, respectively, and the time from pTs to pTe.
- the time length for F'(t) ⁇ S (the value obtained by multiplying the number of data points for F'(t) ⁇ S by the photometric time interval) is defined as the peak width pB of the positive peak of the quadratic curve.
- the minimum and maximum values of the reaction time at which the secondary differential value at the negative peak of the quadratic curve F'(t) is less than or equal to the calculation target threshold value S are mTs and mTe, respectively, and the time from mTs to mTe.
- the time length for F'(t) ⁇ S (the value obtained by multiplying the number of data points for F'(t) ⁇ S by the photometric time interval) is defined as the peak width mB of the negative peak of the quadratic curve.
- a further example of the parameter used in the present invention is the region time width vTr.
- Further examples of parameters used in the present invention include main peak start time vNs, main peak end time vNe, and main peak width vN.
- vNs and vNe are parameters for the main peak including the maximum value Vmax in the operation area of the primary curve, and are less affected by noise that may be included in the coagulation reaction curve, as compared with vTs and vTe described above. It is a parameter.
- vNs and vNe have the same values as vTs and vTe, respectively.
- vN is the width (time length) from vNs to vNe.
- pNs, pNe, pN, and mNs, mNe, mN can be similarly defined for the plus and minus peaks of the quadratic curve F'(t).
- FIG. 11 shows vTs, vTe, vTr, vNs, vNe, and vN.
- FIG. 12 shows the calculation target range (dotted line) of the linear curve when the calculation target range value S is 10%.
- Weighted average points (vT, vH) black circles
- vTs, and vTe are shown in the upper part of FIG. 12
- vB and vW are shown in the lower part of FIG.
- vW is the peak width that satisfies the primary curve F(t) ⁇ vH (the time that F(t) ⁇ vH is satisfied between the minimum time and the maximum time when F(t) ⁇ vH is satisfied. Long). Similar parameters can be calculated with an uncorrected linear curve.
- the peak width satisfying F′(t) ⁇ pH is defined as the weighted average peak width pW.
- the width of the coagulation reaction time that satisfies F′(t) ⁇ mH is defined as the weighted average peak width mW.
- parameters used in the present invention include average time vTa, average height vHa, and area central time vTm.
- the average point (vTa, vHa) (white diamonds), the weighted average point (vT, vH) (black circles), vTs, vTe of the linear curve when the calculation target threshold value S is 10%, and vTm is shown.
- vTa, vHa, and vTm are respectively expressed by the following equations when the number of data points from F(vTs) to F(vTe) is n.
- pTm which is the center point of pTs and pTe
- mTm which is the center point of mTs and mTe
- the flatness ratios vAB, vABa, and the weights based on the peak widths are used.
- the flattening ratios vAW and vAWa based on the average peak width are defined as in the following formulas (8a), (8b), (8c) and (8d).
- vAB vH/vB (8a)
- vAW vH/vW (8b)
- vABa vHa/vB (8c)
- vAWa vHa/vW (8d)
- the time rate vTB based on the peak width and the time rate vTW based on the weighted average peak width are expressed by the following formula ( Define as in 9a) and (9b).
- vTB vT/vB (9a)
- vTW vT/vW (9b)
- the flatness ratio and time ratio as described above can be obtained for a quadratic curve.
- the flatness ratio pAB based on the peak width or the flatness ratio pAW based on the weighted average peak width can be obtained as the ratio of pH and pB or pW, while pT and pB
- the time rate pTB based on the peak width or the time rate pTW based on the weighted average peak width can be obtained as a ratio with pW.
- the flatness mAB based on the peak width or the flatness mAW based on the weighted average peak width can be obtained as the ratio of mH and mB or mW, while mT and As a ratio with mB or mW, the time rate mTB based on the peak width or the time rate mTW based on the weighted average peak width can be obtained.
- peak width vB, pB, mB, weighted average peak width vW, pW, mW, average time vTa, average height vHa, area start time vTs, pTs, mTs, area end time vTe, pTe, mTe, Area central time vTm, pTm, mTm, area time width vTr, main peak start time vNs, pNs, mNs, main peak end time vNe, pNe, mNe, main peak width vN, pN, mN, flatness vAB, vAW, vABa , VAWa, pAB, pAW, mAB, mAW, and time rates vTB, vTW, pTW, pAW, mTB, mTW can also be parameters that characterize the calculation target range of the linear curve.
- each parameter may be displayed with the calculation target range value S from which it is derived.
- the parameters that characterize the calculation target area of the linear curve when S is x(%) may be referred to as vHx, vTx, vBx, vWx and the like.
- vABa, vAWa, vTB, vTW are vH10%, vT10%, vB10%, vW10%, vTa10%, vHa10%, vTs10%, vTe10%, vTm10%, vTr10%, vNs10%, vNe10%, vN10%, vAB10.
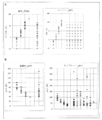
- FIG. 14A and FIG. 14B show parameters when the calculation target range value S is different for the same linear curve.
- 13A shows the case where the calculation target range value S is 10%
- FIG. 13B shows the case where the calculation target range value S is 80%.
- the weighted average height vH10% of the primary curve is 0.4
- the weighted average time vT10% is 149 seconds
- the peak width vB10% is 200 seconds.
- the weighted average height vH80% is 0.72
- the weighted average time vT80% is 119 seconds
- the peak width vB80% is 78 seconds. Is.
- AUC area under the curve
- pAUC the area under the curve
- mAUC the area under the curve
- S the calculation target range value
- vAUC, pAUC, and mAUC in the calculation target region where S is 5% are vAUC5%, pAUC5%, and mAUC5%, respectively.
- parameters other than the above-mentioned parameters characterizing the calculation target range may be included in the parameters for determining the activity level or activity abnormality of the coagulation factor according to the present invention.
- the parameters include a maximum first-order differential value Vmax, a maximum second-order differential value Amax, a minimum second-order differential value Amin, and VmaxT, AmaxT, AminT which represent the time to reach them.
- the series of parameters described above may include a parameter derived from a corrected coagulation reaction curve (corrected 0th to quadratic curve) and a parameter derived from an uncorrected coagulation reaction curve (uncorrected 0th to 2nd curve).
- parameters characterizing the calculation target area are extracted.
- parameters related to the weighted average point of the linear curve shown in Table A described later weighted average time vT, weighted average height vH, average time vTa, average height vHa, peak Width vB, weighted average peak width vW, flattening ratios vAB, vAW, vABa, vAWa, and time rates vTB, vTW, and vAUC, vTs, vTe, vTr, vTm, vNs, vNe, vN), 2 Parameters related to the weighted average point of the following curve (weighted average time pT, mT, weighted average height pH, mH, peak width pB, mB,
- any one or more of these parameters may be extracted, but a parameter set including two or more of these parameters may be extracted.
- the parameter may be at least one selected from the group consisting of vT, vH, vB, vAB, and vTB, but may be a parameter set including two or more of these.
- the parameter is a parameter set including vT, vH, vB, vAB and vTB.
- the parameter is a parameter set including vB, vAB and vTB.
- the parameter is a parameter set including vB and vAB.
- the parameter is pH, pAB, or vH.
- the parameters are pAB and pNe parameter sets, pTW and vT parameter sets, pTB and vABa parameter sets, pAB and vNs parameter sets, or pTW and vTs and vW parameter sets. is there.
- the configuration of the parameters that characterize each calculation target area used in the method of the present invention is not limited to these embodiments.
- the plurality of parameters (parameter group) used in the determination of the test sample in the method of the present invention include a plurality of parameters characterizing a plurality of calculation target regions of one waveform.
- the parameter group is a set of a plurality of parameters extracted from a plurality of calculation target areas of one waveform.
- the parameter group includes one or more sets of the same kind of parameters extracted from different calculation target regions of one waveform (linear curve or quadratic curve). For example, when L calculation target areas are extracted and the adopted parameter is vHx, the parameter group is composed of L vHx.
- 10 calculation target ranges based on 10 calculation target range values S (5%, 10%, 20%, 30%, 40%, 50%, 60%, 70%, 80%, and 90%) Is extracted and the parameter vHx is extracted from each calculation target area
- the parameter group is a set of 10 vHx [vH5%, vH10%, vH20%, vH30%, vH40%, vH50%, vH60%, vH70%, vH80%, vH90%].
- the parameter vHx is extracted from each calculation target area.
- the parameter group is a set of 5 vHx [vH5%, vH20%, vH40%, vH60%, vH80%].
- the parameter group includes M sets of [vBx, vABx, vTBx].
- the parameter group includes N sets of [vTx, vHx, vBx, vABx, vTBx]. Composed of.
- a plurality of parameters each characterizing the calculation target area may be combined with other parameters. For example, at least one selected from the group consisting of a maximum first-order differential value Vmax, a maximum second-order differential value Amax, a minimum second-order differential value Amin, and VmaxT, AmaxT, and AminT representing the time to reach them, shown in Table A described later.
- Vmax maximum first-order differential value
- Amax maximum second-order differential value
- AminT VmaxT, AmaxT, and AminT representing the time to reach them
- Target blood coagulation time prolonging factor component The target blood coagulation time prolonging factor component for which the activity level or activity abnormality is determined by the method of the present invention includes any intrinsic or extrinsic coagulation reaction that causes prolongation of blood coagulation time. Ingredients are included.
- the target blood coagulation time prolonging factor component is a coagulation factor.
- the coagulation factor is preferably at least one selected from coagulation factors including FVIII and FIX, and more preferably at least FVIII. Both FVIII and FIX may be targeted.
- a parameter group (hereinafter, referred to as a test parameter group) including a plurality of parameters respectively extracted from a plurality of calculation target regions of the waveform related to the coagulation velocity or coagulation acceleration of the test sample described above, It is compared with a corresponding parameter group (also referred to as template parameter group in the present specification) for the template blood sample (hereinafter, also simply referred to as template sample). Based on the result of the comparison, the coagulation characteristics of the test sample, preferably the activity level or activity abnormality of the blood coagulation time prolonging factor component in the test sample is determined.
- one or more template analytes are prepared.
- the template specimen is a blood specimen whose activity level or presence/absence of activity abnormality of the target blood coagulation time prolonging factor component in the method of the present invention is known.
- the one or more template samples include one or more blood samples with normal FVIII activity levels (normal FVIII samples) and blood samples with abnormal FVIII activity levels (FVIII abnormal samples).
- One or more specimens eg FVIII deficient specimens.
- the one or more template samples include one or more blood samples with normal FIX activity levels (normal FIX samples) and blood samples with abnormal FIX activity levels (FIX abnormalities).
- One or more specimens eg, FIX-deficient specimens).
- the one or more template specimens have one or more blood specimens (FVIII/FIX normal specimen) with neither FVIII nor FIX activity level abnormal, and FVIII activity level is abnormal. It includes one or more blood samples (FVIII abnormal samples, eg, FVIII deficient samples) and one or more blood samples having abnormal FIX activity levels (FIX abnormal samples, eg, FIX deficient samples).
- FVIII abnormal samples eg, FVIII deficient samples
- FIX abnormal samples eg, FIX deficient samples
- the FVIII abnormal sample includes blood samples derived from severe, moderate and mild hemophilia A patients.
- the blood samples from the severe, moderate, and mild hemophilia A patients have FVIII activity of less than 1%, 1% or more and less than 5%, and 5% or more and less than 40% (of normal subjects, respectively). The value is the value when the activity is 100%, and the same applies hereinafter).
- multiple samples from patients with severe hemophilia A having different FVIII activity levels may be prepared, if necessary.
- the derived sample may be prepared.
- VS-HA patients with particularly low FVIII activity FVIII activity of less than 0.2%)
- MS-HA patients without FVIII activity FVIII activity of 0.2% or more and less than 1%) Reported that there is a difference in clinical severity (Mitsumoto Matsumoto, Midori Shima, Application to coagulation waveform analysis and micromeasurement of factor VIII, 2003, Vol. 14, No. 2, p.122- 127).
- Differentiating patients with VS-HA is useful for providing appropriate treatment to the patients.
- the FIX abnormal sample preferably includes blood samples derived from severe, moderate and mild hemophilia B patients.
- the specimens from the severe, moderate and mild hemophilia B patients have a FIX activity of less than 1%, 1% or more and less than 5%, and 5% or more and less than 40% (the activity of a normal person is The value is 100%, the same hereinafter).
- multiple samples from patients with severe hemophilia B having different FIX activity levels may be prepared, if necessary. For example, a sample having a FIX activity of 0.2% or more and less than 1% and a sample having a FIX activity of less than 0.2% may be prepared.
- regression analysis is performed between the test parameter group and each template parameter group derived from each template sample.
- the template parameter group used for regression analysis is 1.3. It was obtained by performing the data analysis described in. In this data analysis, the number of calculation target areas to be extracted and the series of calculation target area values S used to extract a plurality of calculation target areas are set to the same values as in the data analysis of the test sample.
- the types of parameters included in the template parameter group are the same as those of the test parameter group. For example, if the test parameter group is L vHx, the template parameter group for the template sample is also L vHx. Further, for example, if the test parameter group is M sets of [vBx, vABx, vTBx], the template parameter group of the template sample is also M sets of [vBx, vABx, vTBx].
- the template parameter group of the template sample is also N sets of [vTx, vHx, vBx, vABx, vTBx] Is. Therefore, the template parameter group is a parameter group for the template sample corresponding to the test parameter group. That is, the individual parameters included in each template parameter group correspond to the individual parameters included in the test parameter group.
- the parameter of the template parameter group and the parameter of the test parameter group are the same kind of parameter.
- vTx, vHx, vBx, vABx and vTBx of the test parameter group correspond to vTx, vHx, vBx, vABx and vTBx (x is a predetermined value) of the template parameter group, respectively.
- a template parameter group including all parameters of the test parameter group and parameters corresponding to the test parameter group corresponds to the test parameter group.
- each template parameter group may be a synthetic parameter group obtained by processing a parameter group obtained from a plurality of template samples.
- one or more synthetic parameter groups representing a standard template sample are created by obtaining parameter groups for a plurality of template samples having the same activity level of the target blood coagulation time prolonging factor component and statistically processing them. Good.
- the method of regression analysis is not particularly limited, and examples thereof include linear regression by the least squares method.
- the value of each parameter in the test parameter group is plotted on the y-axis, and the value of the corresponding parameter in any one of the template parameter groups is plotted on the x-axis to obtain a regression line.
- the correlation between the test parameter group and each template parameter group is examined based on the slope, intercept, correlation (correlation coefficient, determination coefficient, etc.) of the regression line.
- the correlation between the test parameter group and the template parameter group reflects the correlation (approximate state) of the coagulation characteristics between the test sample and the template sample from which the template parameter group is derived.
- the coagulation characteristics of the test sample are determined based on the results of the regression analysis.
- the determination of the coagulation property is determination of the activity level of the target blood coagulation time prolonging factor component or its activity abnormality.
- the determination procedure will be described, taking the case where the target blood coagulation time extension factor component is FVIII as an example. Other factors such as FIX may be judged by the same procedure.
- the correlation is the correlation of the regression line (eg, slope, intercept, correlation coefficient, coefficient of determination, etc.).
- Template specimens include one or more normal FVIII specimens and one or more abnormal FVIII specimens with varying levels of FVIII activity.
- the template sample comprises one or more normal FVIII samples and one FVIII abnormal sample from severe (moderate VS-HA and MS-HA if necessary), moderate and mild hemophilia A patients, respectively. Including the above. At least one sample whose correlation between the test parameter group and the template parameter group satisfies a predetermined condition is selected from all the template samples used for the regression analysis.
- template samples whose correlation is equal to or greater than a preset threshold value are selected.
- the template sample having the highest correlation with the correlation being equal to or higher than a preset threshold value is selected.
- the slope of the regression line between the test parameter group and the template parameter group is within a predetermined range (for example, 0.70 or more and 1.30 or less, preferably 0.75 or more and 1.25 or less, more preferably 0.80 or more and 1.20 or less, further preferably Is 0.85 or more and 1.15 or less, and more preferably 0.87 or more and 1.13 or less).
- the slope of the regression line between the test parameter group and the template parameter group is within the predetermined range, and the correlation coefficient of the regression line is a predetermined value or more (for example, larger than 0.75, preferably A template analyte is selected that is greater than 0.80, more preferably greater than 0.85, and even more preferably greater than 0.90).
- the predetermined condition may be changed and the template sample may be selected again, or “no template sample selection” may be evaluated. ..
- the slope of the regression line is within a predetermined range (for example, 0.70 or more and 1.30 or less, preferably 0.75 or more and 1.25 or less, more preferably 0.80 or more and 1.20 or less, more preferably 0.85 or more and 1.15 or less, and further preferably 0.87.
- Template samples that are above 1.13) are selected.
- the slope of the regression line is within the predetermined range, and the correlation coefficient of the regression line is a predetermined value or more (for example, larger than 0.75, preferably larger than 0.80, more preferably larger than 0.85, further preferably 0.90 Greater than) is selected. From the selected template samples, the template sample having the highest correlation coefficient of the regression is selected.
- one template sample may be selected from them based on further criteria. Then, the FVIII state in the selected template sample (that is, the FVIII activity level or activity abnormality) is determined as the FVIII state in the test sample.
- the state of FVIII in the test sample may be determined to correspond to any of the states in the plurality of template samples, or the average of the plurality of template samples. Such a state may be determined as the FVIII state in the test sample.
- the selected template sample is a FVIII normal sample
- the state of FVIII in the test sample can be determined to be normal
- the test sample Can be determined to have abnormal FVIII activity.
- the selected template sample is a sample derived from a patient with severe, moderate, and mild hemophilia A
- the test sample is severe, moderate, and mild hemophilia A, respectively.
- the template sample contains a sample from a patient with severe hemophilia A of VS-HA and MS-HA
- the template sample is It can be determined to be VS-HA or MS-HA.
- the FVIII activity level of the selected template sample can be determined as the FVIII activity level in the test sample.
- the template sample includes samples from patients with severe, moderate, and mild hemophilia A, and if the above-mentioned correlation evaluation indicates “no template sample is selected”, the sample to be tested has “abnormal FVIII activity”. It is possible to determine that “there is no”, or that “the factor that prolongs the blood coagulation time is not due to abnormal FVIII activity” of the test sample.
- the slope of the regression line is within a predetermined range (for example, 0.70 or more and 1.30 or less, preferably 0.75 or more and 1.25 or less, more preferably 0.80 or more and 1.20 or less, still more preferably 0.85 or more and 1.15 or less, further preferably All template specimens that are 0.87 or more and 1.13 or less) are selected.
- the slope of the regression line is within the predetermined range, and the correlation coefficient of the regression line is a predetermined value or more (for example, larger than 0.75, preferably larger than 0.80, more preferably larger than 0.85, further preferably 0.90 Greater than) are selected.
- the state of FVIII found most frequently among the selected template specimens is determined as the FVIII state in the test specimen. For example, if the number of normal FVIII specimens is the largest among the selected template specimens, the FVIII state in the test specimen can be determined to be normal. On the other hand, when the number of FVIII abnormal samples is the largest among the selected template samples, it can be determined that the test sample has an abnormal FVIII activity. Further, for example, when the sample from the patients with severe, moderate, and mild hemophilia A is the most among the selected template samples, the test sample has severe, moderate, and mild hemophilia, respectively. A may be determined.
- the sample to be tested is determined to be an abnormal sample other than the hemophilia A patient (severe, moderate, and mild). Can be done.
- the FVIII activity level found most frequently in the selected template samples can be determined as the FVIII activity level in the test sample.
- the slope of the regression line is within a predetermined range (for example, 0.70 or more and 1.30 or less, preferably 0.75 or more and 1.25 or less, more preferably 0.80 or more and 1.20 or less, still more preferably 0.85 or more and 1.15 or less, further preferably All template specimens that are 0.87 or more and 1.13 or less) are selected.
- the slope of the regression line is within the above predetermined range, and the correlation coefficient of the regression line is a predetermined value or more (for example, larger than 0.75, preferably larger than 0.80, more preferably larger than 0.85, further preferably All template specimens that are greater than 0.90) are selected.
- the selected template specimens are divided into specimens from hemophilia A patients (severe, moderate, and mild) having low FVIII activity and specimens other than those according to the FVIII activity level.
- the severity either severe, moderate, or mild
- the more severe one may be judged as the state of the subject specimen, or the template specimen may be selected again by changing the predetermined condition. ..
- the number of the latter is larger than the number of the former, the subject is determined to be other than the hemophilia A patient (severe, moderate, and mild).
- the method of the present invention can determine the FVIII activity level in a test sample or the presence or absence of its activity abnormality.
- the presence or absence of FVIII activity abnormality in the subject is determined, and the determination provides information about determining whether the subject is a hemophilia A patient.
- the level of FVIII activity in the subject is determined and the determination provides information about determining the severity of hemophilia A in the patient who provided the subject. Therefore, one embodiment of the method for analyzing a blood sample according to the present invention is: determination of hemophilia A, severity of hemophilia A, for example, severe (VS-HA and MS-HA as appropriate), moderate and It may be a method for determining mildness and the like.
- the other blood coagulation time prolonging factor component is FIX.
- the test sample determined to be "not the factor for prolonging blood coagulation time due to abnormal FVIII activity" or "a patient with hemophilia A (severe, moderate, and mild)" For, the activity level of FIX or the presence or absence of its activity abnormality may be determined.
- the procedure for determining the FIX activity level or the presence or absence of its activity abnormality can be carried out by the same procedure as the above-described determination procedure for FVIII.
- the template sample used for the determination regarding the FIX may be the same as or different from the one used in the evaluation regarding FVIII.
- the test parameter group and the template parameter group used for the determination regarding the FIX may be the same as or different from those used for the determination regarding FVIII.
- the presence or absence of FIX activity abnormality in the test sample is determined, and the determination provides information on whether the test sample is a sample of a hemophilia B patient. To do.
- the FIX activity level in the subject is determined, and the determination provides information about determining the severity of hemophilia B in the patient who provided the subject.
- the present embodiment enables determination of hemophilia B and determination of severity of hemophilia B (eg, severe, moderate and mild). Furthermore, by combining the above-described evaluation of FVIII and evaluation of FIX, the coagulation characteristics of the test sample can be analyzed more comprehensively.
- the above-described blood sample analysis method of the present invention can be automatically performed using a computer program. Therefore, one aspect of the present invention is a program for performing the above-described blood sample analysis method of the present invention.
- the series of steps of the above-described method of the present invention including preparation of a sample from a test sample and measurement of coagulation time, can be automatically performed by an automatic analyzer. Therefore, one aspect of the present invention is an apparatus for performing the above-described blood sample analysis method of the present invention.
- the automatic analyzer 1 includes a control unit 10, an operation unit 20, a measurement unit 30, and an output unit 40.
- the control unit 10 controls the overall operation of the automatic analyzer 1.
- the control unit 10 may be composed of, for example, a personal computer (PC).
- the control unit 10 includes a CPU, a memory, a storage, a communication interface (I/F), etc., and processes commands from the operation unit 20, controls the operation of the measurement unit 30, saves measurement data received from the measurement unit 30, and the like. Data analysis, storage of analysis results, output of measurement data and analysis results by the output unit 40, and the like are performed. Further, the control unit 10 may be connected to other devices such as an external medium and a host computer. In the control unit 10, the PC that controls the operation of the measurement unit 30 and the PC that analyzes the measurement data may be the same or different.
- the operation unit 20 acquires an input from the operator and transmits the obtained input information to the control unit 10.
- the operation unit 20 includes a user interface (UI) such as a keyboard and a touch panel.
- UI user interface
- the output unit 40 outputs the measurement data of the measurement unit 30 and the analysis result of the data under the control of the control unit 10.
- the output unit 40 includes a display device such as a display.
- the measurement unit 30 executes a series of operations for a blood coagulation test and acquires measurement data of the coagulation reaction of a sample including a blood sample.
- the measurement unit 30 includes various equipments and analysis modules necessary for blood coagulation tests, such as a sample container containing a blood sample, a reagent container containing a test reagent, a reaction container for reacting the sample with the reagent, a blood sample, and Probe for dispensing reagent to reaction container, light source, detector for detecting scattered light or transmitted light from sample in reaction container, data processing circuit for sending data from detector to control unit 10, control A control circuit that receives an instruction from the unit 10 and controls the operation of the measurement unit 30 is provided.
- the control unit 10 analyzes the coagulation characteristics of the sample based on the data measured by the measurement unit 30. In this analysis, acquisition of a waveform relating to the above-mentioned coagulation reaction curve or coagulation rate or coagulation acceleration, extraction of a parameter group for a test sample, extraction of a template parameter group for a template sample, regression analysis of those parameter groups, and The determination of the activity level or the activity abnormality of the target blood coagulation time extension factor component in the test sample based on the result of the regression analysis may be included. This analysis can be carried out by a program for carrying out the method of the invention. Therefore, the control unit 10 may comprise a program for carrying out the method of the invention.
- the coagulation reaction curve and the waveform regarding the coagulation rate or the coagulation acceleration used in the analysis may be created by the control unit 10 based on the measurement data from the measurement unit 30, or separately. Device, for example, it may be created by the measurement unit 30 and sent to the control unit 10. Alternatively, the coagulation reaction curve may be created by the measurement unit 30 and sent to the control unit 10, and the control unit 10 may create a waveform relating to the coagulation rate or the coagulation acceleration.
- the data of the template parameter group regarding the template sample may be created by previously measuring the template sample with the measurement unit 30 and analyzing the obtained measurement data with the control unit 10, or may be imported from the outside. The data of the template parameter group can be stored in the memory of the control unit 10 or an external device.
- the regression analysis method and the criteria for analyzing the coagulation characteristics of the test sample based on the results of the regression analysis can be controlled by the program of the present invention.
- the analysis result of the control unit 10 is sent to the output unit 40 and output.
- the output may take any form such as display on a screen, transmission to a host computer, printing, etc.
- the output information from the output unit includes a determination result (for example, FVIII activity level, determination result of hemophilia A or its severity, etc.) about the target blood coagulation time extension factor component in the test sample, and It includes further information such as the result of regression analysis between the test sample and the template sample (for example, regression linear equation or correlation), the coagulation reaction curve of the test sample or the template sample, and the waveform related to the coagulation rate or coagulation acceleration. You may stay.
- the type of output information from the output unit can be controlled by the program of the present invention.
- the automatic analyzer 1 has a general structure such as that conventionally used for measuring blood coagulation time such as APTT and PT. A configuration of an automatic analyzer for blood coagulation test can be adopted.
- the parameters used in the following examples represent parameters derived from a corrected 0th-order quadratic curve unless otherwise specified.
- the parameters derived from the uncorrected 0th to quadratic curves are represented by prefixing the name of each parameter with R.
- R the weighted average height of the corrected linear curve
- RvH the weighted average height of the uncorrected linear curve
- pH the weighted average height of the corrected quadratic curve
- the weighted average height of the quadratic curve is expressed as RpH.
- Table A list of parameters is shown in Table A below.
- Example 1 Calculation of Test Parameter (1) Method As a measuring reagent, Coagpia APTT-N (manufactured by Sekisui Medical Co., Ltd.), which is an APTT measuring reagent, and as a calcium chloride solution, Coagpia APTT-N calcium chloride solution (Sekisui Water) Medical Co., Ltd.) was used. The measurement of the coagulation reaction of the sample including the sample was performed using an automatic blood coagulation analyzer CP3000 (manufactured by Sekisui Medical Co., Ltd.). 50 ⁇ L of a reagent for measurement at about 37° C. was added to 50 ⁇ L of a sample heated at 37° C.
- test parameter group A (parameter group A) From the obtained corrected linear curve, 10 calculation target areas were extracted.
- the calculation target range value S is 5%, 10%, 20%, 30%, 40%, 50%, 60%, 70%, 80 with respect to the maximum height value Vmax (100%) of the corrected primary curve. % And 90% respectively.
- the peak width vB and the weighted average time vT and the weighted average height vH were calculated using the above formulas (2), (3) and (4). From the obtained vT and vH, the flatness ratio vAB and the time ratio vTB were calculated by the following formulas.
- test parameter group as follows: (Parameter group A-1) vB [vB5%, vB10%, ..., vB90%], vT [vT5%, vT10%, ..., vT90%], vH [vH5%, vH10%, ..., vH90%], vAB Parameter group consisting of 50 parameters of [vAB5%, vAB10%, ..., vAB90%] and vTB [vTB5%, vTB10%, ..., vTB90%]; (Parameter group A-2) of vB [vB5%, vB10%, ..., vB90%], vAB [vAB5%, vAB10%, ..., vAB90%], and vTB [vTB5%, vTB10%, ..., vTB90%] Parameter group consisting of 30 parameters; (Parameter group A-3) A parameter group consisting of
- test parameter group was further created as follows: (Parameter group A-4) Parameter group consisting of 54 parameters obtained by adding Vmax, Amax, VmaxT and AmaxT to the parameter A-1; (Comparative parameter group 1) A parameter group consisting of four parameters Vmax, Amax, VmaxT and AmaxT.
- a test parameter group is created as follows. did: (Parameter group B-1) vB [vB5%, vB20%, vB40%, vB60%, vB80%], vT [vT5%, vT20%, vT40%, vT60%, vT80%], vH [vH5%, vH20% , vH40%, vH60%, vH80%], vAB [vAB5%, vAB20%, vAB40%, vAB60%, vAB80%], and vTB [vTB5%, vTB20%, vTB40%, vTB60%, vTB80%] 25 parameters Parameter group consisting of; (Parameter group B-2) vB [vB5%, vB20%, vB40%, vB60%, vTB80%] 25 parameters Parameter group consisting of; (Parameter group B-2) vB [vB5%, vB2
- Table 2 shows the composition of the created parameters.
- Example 2 Judgment of FVIII activity or abnormality of test sample using parameter group
- FIG. 16 shows the results of regression analysis with a test sample (Sample AF, APTT time: 118.1 seconds, FVIII ⁇ 0.2%) derived from a patient with severe hemophilia A (VS-HA) whose FVIII activity is less than 0.2%. Of these, the top 5 results are shown in descending order of correlation coefficient.
- FIG. 17A shows a regression line with the sample (Template A) having the highest correlation coefficient in FIG.
- FIG. 17B shows the corrected primary curve of the test sample (Sample AF) and Template A.
- the corrected primary curves of the test sample (Sample AF) and Template A have very similar shapes, indicating that the blood coagulation characteristics of both samples are similar. From these results, it became clear that this analysis can be used to determine FVIII activity in blood samples. Furthermore, it was revealed that this analysis is also effective for the detection of VS-HA patient samples.
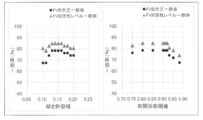
- the FVIII activity level of the test sample was classified into four stages (FVIII activity: ⁇ 1%, 1-5%, 5-40%, and Other). Based on the FVIII activity level of the classified test sample and the actual FVIII activity level of the test sample obtained by the one-step coagulation method, the FVIII activity level agreement rate and the FVIII deficiency agreement rate in this determination were calculated by the following formulas.
- the FVIII activity level agreement rate indicates the rate at which the FVIII activity level of the test sample according to the determination matches the FVIII activity level of the actual test sample, and the FVIII deficiency agreement rate indicates the presence or absence of FVIII deficiency in the test sample according to the determination. The percentages that correspond to the actual presence or absence of FVIII deficiency in the test sample are shown.
- Tables 3 to 5 are comparison tables of the determined FVIII activity of the test sample and the actual FVIII activity of the test sample.
- a comparison table using the parameter groups A-1 to A-4 is shown in Table 3
- a comparison table using the parameter groups B-1 to B-4 is shown in Table 4
- a comparison parameter group 1 is used.
- Table 5 shows a comparison table of
- Table 6 summarizes the types of parameter groups used in the analysis and the FVIII deficiency agreement rate and FVIII activity level agreement rate.
- the method using the parameter group A or B was able to determine the FVIII activity level of the test sample with a high concordance rate.
- Example 3 Differences in Judgment Results Due to Differences in Correlation Evaluation Criteria
- the parameter group used was A-4.
- Correlation Evaluation Criteria 1 A linear regression equation for a parameter group is obtained between all template specimens and test specimens, and template specimens whose regression line slopes are included in the range of 0.87 to 1.13 are selected from them. The template sample with the highest correlation coefficient was selected from the selected samples (the same evaluation criteria as in Example 2).
- Correlation evaluation criterion 2 A linear regression equation for a parameter group was obtained between all template specimens and test specimens, and the template specimen having the highest correlation coefficient was selected from them.
- Table 7 Table 7-1 is the same as Table 3A-4.
- Table 8 summarizes the types of parameters used in the analysis and the FVIII deficiency agreement rate and the FVIII activity level agreement rate.
- Example 4 Determination of FIX activity level Among the test specimens, 8 specimens which were determined to be Other (FVIII>40%) but lack FIX were subjected to FIX activity determination.
- the template sample used was that shown in Table 9.
- the parameter group A-1 acquired in Example 1 was used as the parameter group, and the correlation evaluation criterion 1 of Example 3 was used for the evaluation of the correlation.
- the FIX activity level agreement rate and the FIX deficiency agreement rate were calculated by the same procedure as in Example 2(2). The evaluation results are shown in Table 10. It was possible to determine the FIX activity level of the test sample with a high concordance rate.
- Example 5 Determination of FVIII Activity or Abnormality
- coagulation factor-deficient plasma and LA plasma or normal plasma were mixed at various ratios
- FVIII-deficient plasma in which FVIII preparation was added
- Factor VIII Deficient Plasma Factor IX Deficient Plasma
- Factor V Deficient Plasma Factor V Deficient Plasma
- Factor Xlas DefectiveientPlasma George King Bio-Medical, Inc.
- FVIII preparation a recombinant blood coagulation factor VIII preparation Advate (manufactured by Shire Japan) was used.
- normal plasma normal pool plasma in which each factor concentration can be regarded as 100% was used.
- Normal plasma and each coagulation factor deficient plasma are mixed at various ratios to prepare mixed plasma with factor concentrations of 0.25%, 0.5, 0.75%, 1%, 2.5%, 5%, 10%, 25% and 50% respectively. did.
- FVIII preparations were added to FVIII-deficient plasma to prepare FVIII-added plasma having FVIII concentrations of 0.625%, 1.25%, 2.5%, 5%, 10%, 20%, 40%, 80% and 160%.
- FVIII preparations were added to another FVIII-deficient plasma and the FVIII concentration was 0.3%, 0.6%, 1%, 2%, 4%, 8%, 16%, 32%, 64%, 128% FVIII-added plasma.
- test specimens were from FVIII-deficient patients (hemophilia A) or FIX-deficient patients (hemophilia B), while template specimens were hemophilia A. It was prepared based on commercially available factor-deficient plasma and LA-positive plasma without using a patient sample of hemophilia B. With such a structure of the sample, in this example, as compared with Example 2, conditions were set in which it was difficult to correctly determine the state of the coagulation factor of the test sample. Table 11 shows the configurations of the test sample and the template sample used in this example.
- FIG. 18 shows the distribution of FVIII activity and APTT for the test sample and the template sample.
- -FVIII activity or abnormality of the test sample was determined by regression analysis using the parameter group.
- a linear regression analysis was performed between the test parameter group obtained from the test sample and the corresponding template parameter group obtained from each template sample.
- a template sample having a slope of the linear regression equation of 1 ⁇ 0.15 or less obtained by the regression analysis and a correlation coefficient of the linear regression equation larger than 0.90 was extracted. Among the extracted template samples, the template sample having the largest correlation coefficient was selected. When a plurality of samples with the same correlation coefficient existed, template samples having a regression equation with a slope closer to 1 were selected.
- the FVIII deficiency concordance rate and the FVIII activity level concordance rate were calculated by the same procedure as in Example 2 based on the determination results for all the test samples.
- Tables 13 and 14 show the parameter groups used and the matching rates of FVIII deficiency and FVIII activity level obtained.
- the parameter at which the FVIII deficiency concordance rate was maximum (63.0%) was the quadratic curve parameter pHx.
- the parameter at which the FVIII activity level coincidence rate was maximum (76.1%) was the quadratic curve parameter mTx.
- the FVIII deficiency agreement and the high FVIII activity level agreement were not correlated.
- the FVIII deficiency concordance rate using the conventional parameters (combination of VmaxT, AmaxT, Vmax, Amax) was 52.2%.
- the set of [vT5%, vT10%, vT20%, vT30%, vT40%, vT50%, vT60%, vT70%, vT80%, vT90%] A set of [vB5%, vB10%, vB20%, vB30%, vB40%, vB50%, vB60%, vB70%, vB80%, vB90%] was used in combination as a parameter group.
- Tables 15 and 16 show the combination parameter groups with a high FVIII deficiency concordance rate and the obtained FVIII deficiency concordance rate and FVIII activity level concordance rate.
- Table 15 shows the result when two kinds of parameters are combined, and Table 16 shows the result when three kinds of parameters are combined.
- Table 16 also shows the results of the parameter group (pNs_pNe_vTB) in which the FVIII activity level coincidence rate was the maximum.
- Table 17 shows the results of FVIII activity level determination for the parameter groups that resulted in the high FVIII deficiency agreement rate or FVIII activity level agreement rate in (3-1) and (3-2) above. As the number of parameter species used increased, both the FVIII deficiency concordance rate and the FVIII activity level concordance rate tended to increase. From these results, it was shown that the parameters related to the quadratic curve are useful for the judgment.
- Example 6 Determination of FVIII Activity or Abnormality Based on Different Criteria (1) Method Using the sample used in Example 5, a procedure similar to that in Example 5 was performed to perform primary analysis between the test parameter group and the template parameter group. A regression analysis was performed. Then, the FVIII activity status of the test sample was determined according to the following different criteria. Criterion 1: Similar to Example 5, among the template specimens having a linear regression equation with a slope of 1 ⁇ 0.15 or less and a correlation coefficient of the regression equation of more than 0.90, the FVIII activity in the template specimen having the highest correlation coefficient was measured. The state was determined to be the state of FVIII activity of the test sample.
- the test sample was determined to be Other.
- Criterion 2 the most selected method: Of the template samples having a linear regression equation with a slope of 1 ⁇ 0.15 or less and a correlation coefficient of the regression equation of greater than 0.90, five template samples with the highest correlation coefficient were extracted. The state of FVIII activity most frequently observed among these 5 samples was determined as the state of FVIII activity of the test sample. When the same number of specimens in different states existed, the more severe state was determined as the state of the test specimen. If there is no template sample that meets the conditions of the slope and correlation coefficient of the above linear regression equation, the test sample was determined to be Other.
- the most frequently observed condition severe, moderate, or mild was determined as the condition of the test sample.
- severe, moderate, or mild was determined as the condition of the test sample.
- the more severe state was determined as the state of the test specimen.
- the state of the test sample was determined to be Other.
- Table 18 shows an example of the judgment procedure.
- the FVIII activity of the template sample having the correlation coefficient rank ⁇ 1> and the determination result of the determination criterion 1 match.
- the FVIII activity of the template sample that occupies the maximum number agrees with the judgment result of judgment criterion 2. If the total number of L1 to L3 in the template sample is larger, the judgment criterion 3 is any of L1 to L3, and if the total number of Other and ND is larger, the judgment criterion 3 is Other.
- Table 19 shows examples of the FVIII deficiency concordance rate, FVIII activity level concordance rate, and average concordance rate (collectively referred to as concordance rate) determined according to each criterion.
- Table 20 shows the number of combination parameter groups that achieved the level of agreement rate.
- the FVIII deficiency concordance rate was up to 78.3% for all criteria.
- the criterion 1 was 12, and the criterions 2 and 3 were 17.
- the FVIII activity level concordance rate was 91.3% at maximum in all criteria.
- the number of parameter groups satisfying the maximum concordance level was one in criterion 1 and 3 and two in criterion 2.
- the maximum average matching rate was 81.5% according to criterion 1 and 84.8% according to criteria 2 and 3.
- the number of parameter groups satisfying the maximum concordance level was 9 for criterion 1, and 13 for criterion 2 and 3.
- Example 7 Determination of FVIII Activity or Abnormality Based on Different Thresholds
- the test was performed.
- the state of FVIII activity of the sample was determined.
- the parameter group the combination parameter group pTW_vTs_vW showing the maximum FVIII deficiency agreement rate and the FVIII activity level agreement rate in Example 5 was used.
- the slope of the linear regression equation was changed stepwise from 1 ⁇ 0.05 to 1 ⁇ 0.25 (that is, the tolerance width was 0.05 to 0.25).
- the threshold of the correlation coefficient was changed stepwise from >0.75 to >0.98.
- the FVIII deficiency agreement rate and FVIII activity level agreement rate under each condition were calculated. The results are shown in Figures 19-21.
Landscapes
- Health & Medical Sciences (AREA)
- Life Sciences & Earth Sciences (AREA)
- Engineering & Computer Science (AREA)
- Hematology (AREA)
- Chemical & Material Sciences (AREA)
- Biomedical Technology (AREA)
- Immunology (AREA)
- Urology & Nephrology (AREA)
- Physics & Mathematics (AREA)
- Molecular Biology (AREA)
- Analytical Chemistry (AREA)
- Biochemistry (AREA)
- General Health & Medical Sciences (AREA)
- General Physics & Mathematics (AREA)
- Pathology (AREA)
- Food Science & Technology (AREA)
- Medicinal Chemistry (AREA)
- Microbiology (AREA)
- Cell Biology (AREA)
- Biotechnology (AREA)
- Ecology (AREA)
- Biophysics (AREA)
- Investigating Or Analysing Biological Materials (AREA)
Abstract
血液検体の凝固特性を分析する方法の提供。被検血液検体と凝固時間測定試薬とが混和されてなる試料についての凝固速度又は凝固加速度に関する波形を取得することと、該凝固速度又は凝固加速度に関する波形を特徴付ける複数のパラメータを抽出することと、該複数のパラメータに基づいて、該被検血液検体における凝固因子の活性レベル又は活性異常を判定することとを含む、血液検体の分析方法。
Description
本発明は、血液検体の血液凝固特性の分析方法に関する。また、本発明は、該血液検体の血液凝固特性の分析を行うためのプログラム及び装置に関する。
血液凝固検査は、患者の止血能力又は線溶能力を調べるための検査である。一般的な血液凝固検査では、患者の血液検体に試薬を添加した後に起こる凝固反応を光学的に測定する。所定の状態まで凝固が進んだ時間は血液凝固時間として測定される。血液凝固時間の典型的な例としては、プロトロンビン時間(PT)、活性化部分トロンボプラスチン時間(APTT)、トロンビン時間などがある。血液凝固時間の延長は、生体内での出血傾向を反映している。延長の原因としては、1)血液凝固因子の量の異常、2)血液凝固系を構成する血液成分や血液凝固時間測定用試薬等に対する抗体の存在、3)血液凝固反応を阻害する薬剤の投与などが考えられる。
血液凝固検査においては、血液検体への試薬添加後の血液凝固反応量を経時的に測定することにより、凝固反応曲線を求めることができる。この凝固反応曲線は、血液凝固系の異常のタイプに応じてそれぞれ異なる形状を有する(非特許文献1)。そのため、凝固反応曲線に基づいて血液凝固系の異常を判定する方法が開示されている。例えば、特許文献1、特許文献2及び特許文献3には、患者の血液についての凝固反応曲線の一次微分曲線及び二次微分曲線に関するパラメータ、例えば最大凝固速度、最大凝固加速度及び最大凝固減速度などに基づいて、該患者における凝固因子の異常の有無を評価する方法が記載されている。
血友病は、凝固第VIII因子(FVIII)又は凝固第IX因子(FIX)が先天的に欠損しているか、機能的な異常がある疾患である。正常者の活性を100%として、FVIIIの活性が40%未満である者は血友病A、FIXの活性が40%未満である者は血友病Bに分類される。さらに活性レベルに従って、血友病の重症度が分類される。特許文献4には、患者の凝固反応が最大凝固速度又は最大凝固加速度に達する時間までの凝固速度の平均変化率に基づいて、血友病の重症度を判定する方法が記載されている。
British Journal of Haematology, 1997, 98:68-73
実際の血液検体の凝固反応曲線の一次微分曲線は、検体に含まれる成分や検査に用いる試薬の影響あるいは計測方法の違いによって単峰性にならない場合がある。そのため、特許文献1~4の方法では、最大凝固速度や最大凝固速度時間などのパラメータを正確に求めるため、一次微分曲線を単峰性にするための平滑化処理を行って波形解析を実施している。しかし、このように一次微分曲線に対して単峰化するための平滑化処理を行った場合、得られた曲線は、平滑化処理による波形情報の喪失のため、患者の臨床状態を詳細に反映しないことが想定される。そのため、平滑化処理によらず、単峰性でない一次微分曲線からでも検体の血液凝固特性を精度良く評価することができる分析方法が求められている。
本発明者は、血液の凝固反応曲線に由来する、凝固第VIII因子(FVIII)及び凝固第IX因子(FIX)の活性との関連性を有するパラメータを見出した。また本発明者は、該パラメータに基づいて血液検体におけるFVIII又はFIXの活性レベル、及び該血液検体におけるFVIII又はFIXの活性異常の有無を分析する方法を見出した。
したがって、本発明は、以下を提供する。
〔1〕被検血液検体と凝固時間測定試薬とが混和されてなる試料についての凝固速度又は凝固加速度に関する波形を取得することと、
該凝固速度又は凝固加速度に関する波形を特徴付ける複数のパラメータを抽出することと、
該複数のパラメータに基づいて、該被検血液検体における凝固因子の活性レベル又は活性異常を判定することと、
を含む、血液検体の分析方法。
〔2〕前記複数のパラメータが、前記凝固速度に関する波形の複数の演算対象域をそれぞれ特徴付ける複数のパラメータを含むか、前記凝固加速度に関する波形の複数の演算対象域をそれぞれ特徴付ける複数のパラメータを含むか、又はそれらの組み合わせを含む、〔1〕記載の分析方法。
〔3〕前記複数のパラメータが、下記:
前記凝固速度に関する波形の複数の演算対象域についての加重平均時間vT、加重平均高さvH、ピーク幅vB、加重平均ピーク幅vW、加重平均高さについてのB扁平率vAB、加重平均高さについてのW扁平率vAW、加重平均時間についてのB時間率vTB、加重平均時間についてのW時間率vTW、平均時間vTa、平均高さvHa、平均高さについてのB扁平率vABa、平均高さについてのW扁平率vAWa、領域始点時間vTs、領域終点時間vTe、領域中央時間vTm、領域時間幅vTr、主ピーク始点時間vNs、主ピーク終点時間vNe、及び主ピーク幅vN;
前記凝固加速度に関する波形のプラスピークの複数の演算対象域についての加重平均時間pT、加重平均高さpH、ピーク幅pB、加重平均ピーク幅pW、加重平均高さについてのB扁平率pAB、加重平均高さについてのW扁平率pAW、加重平均時間についてのB時間率pTB、加重平均時間についてのW時間率pTW、主ピーク始点時間pNs、主ピーク終点時間pNe、及び主ピーク幅pN;ならびに、
前記凝固加速度に関する波形のマイナスピークの複数の演算対象域についての加重平均時間mT、加重平均高さmH、ピーク幅mB、加重平均ピーク幅mW、加重平均高さについてのB扁平率mAB、加重平均高さについてのW扁平率mAW、加重平均時間についてのB時間率mTB、加重平均時間についてのW時間率mTW、主ピーク始点時間mNs、主ピーク終点時間mNe、及び主ピーク幅mN、
からなる群より選択される1つ以上を含む、〔2〕記載の分析方法。
〔4〕前記凝固速度に関する波形をF(t)(tは時間)、F(t)が所定値xである時間をt1、t2(t1<t2)とするとき、前記演算対象域はF(t)≧xを満たす領域であり、前記vT及びvHは下記式で表され、
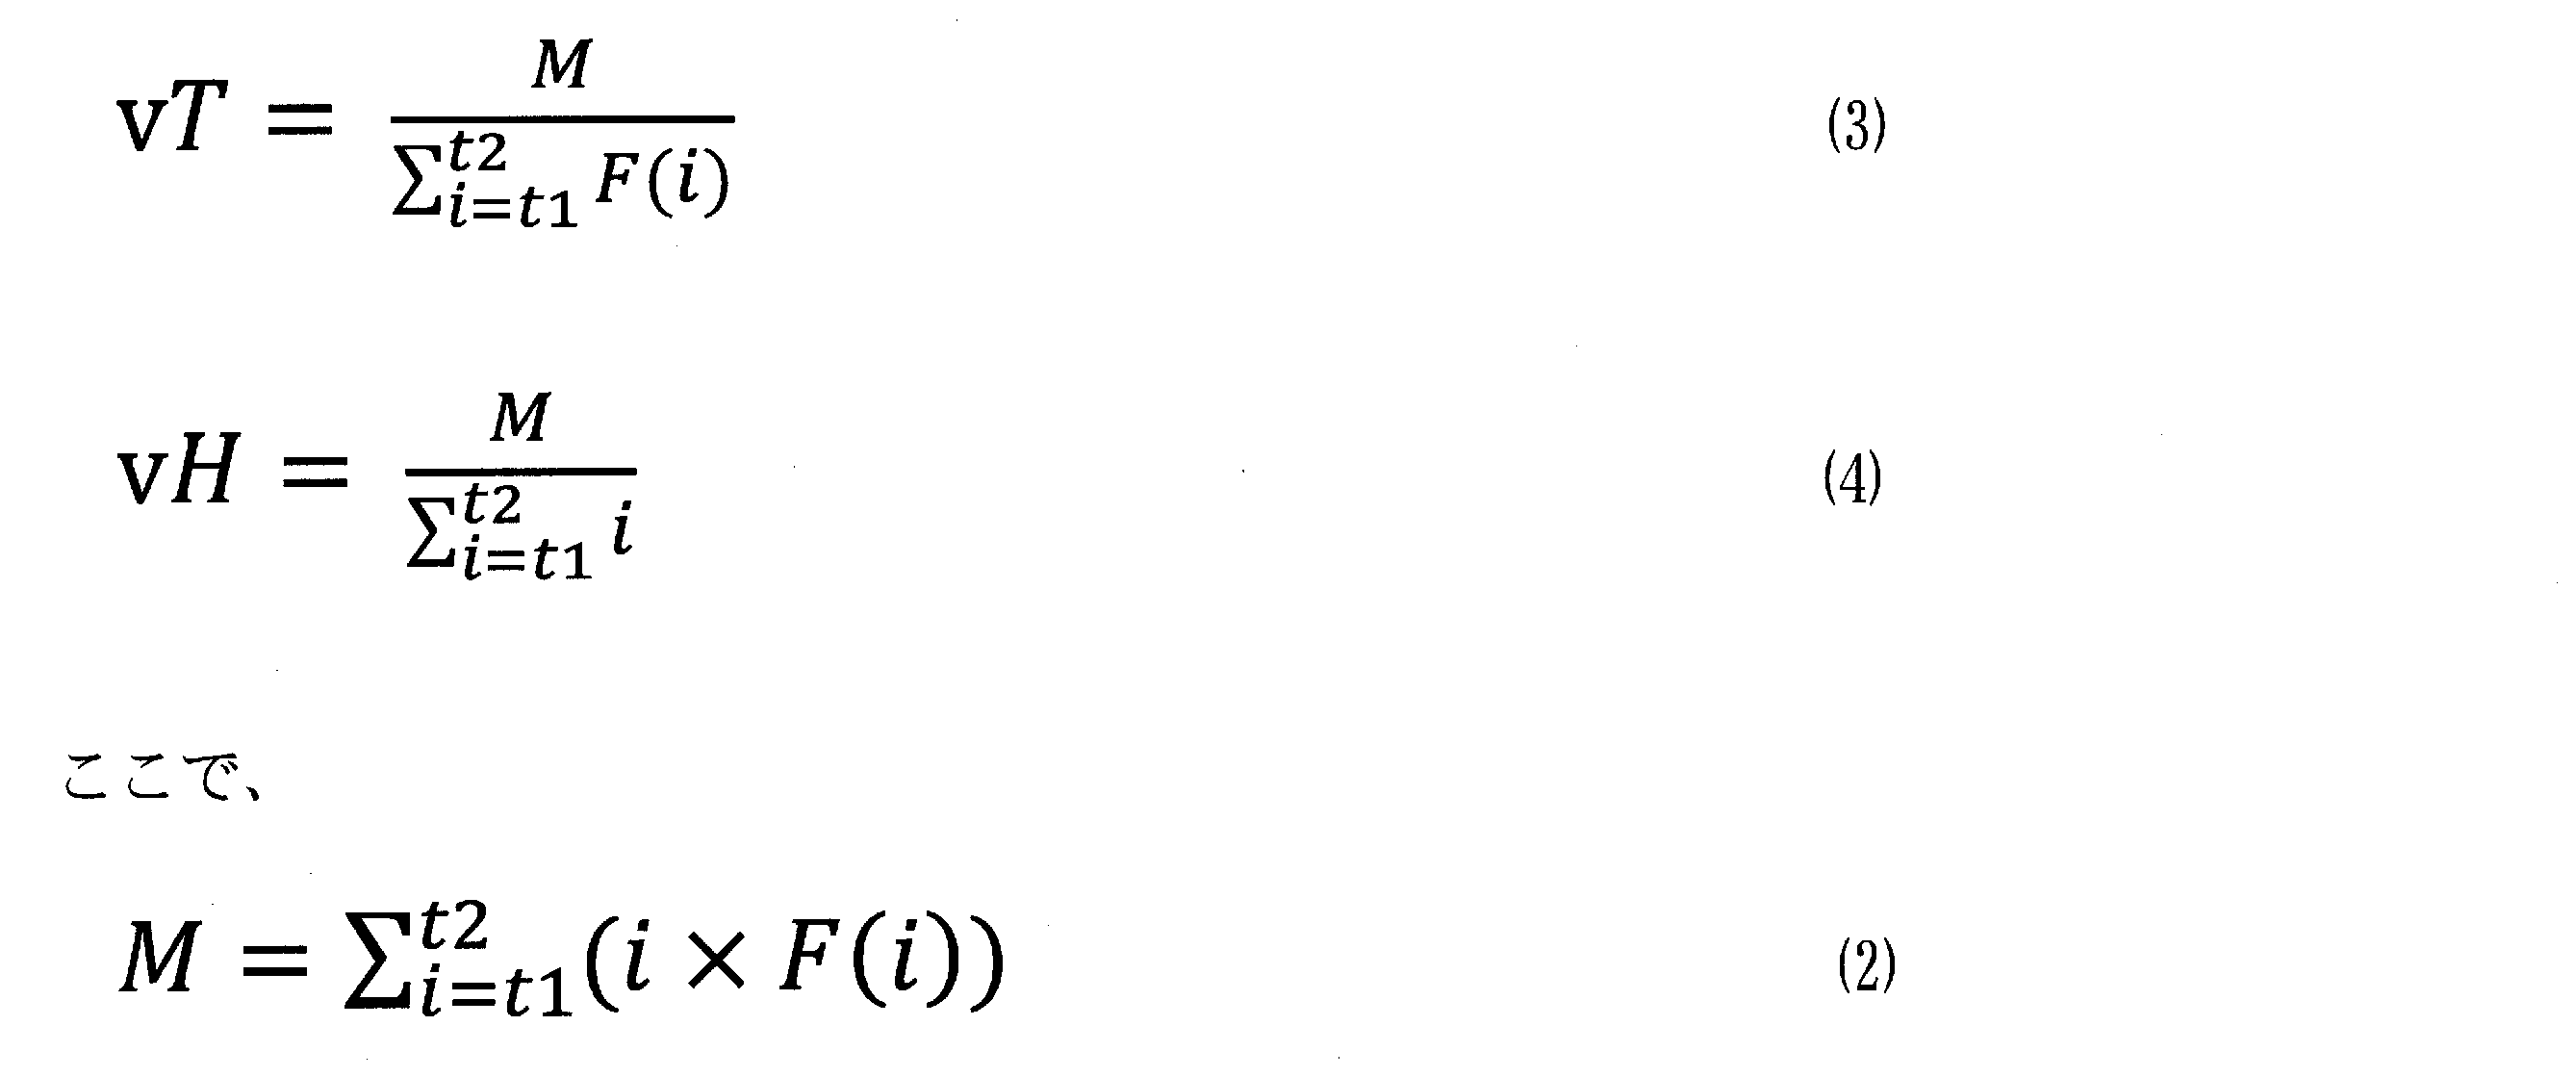
前記vTa、vHa、及びvTmは、F(t)、t1及びt2が前記と同じ定義であり、F(t1)からF(t2)までのデータ点数をnとするとき、それぞれ下記式で表され、
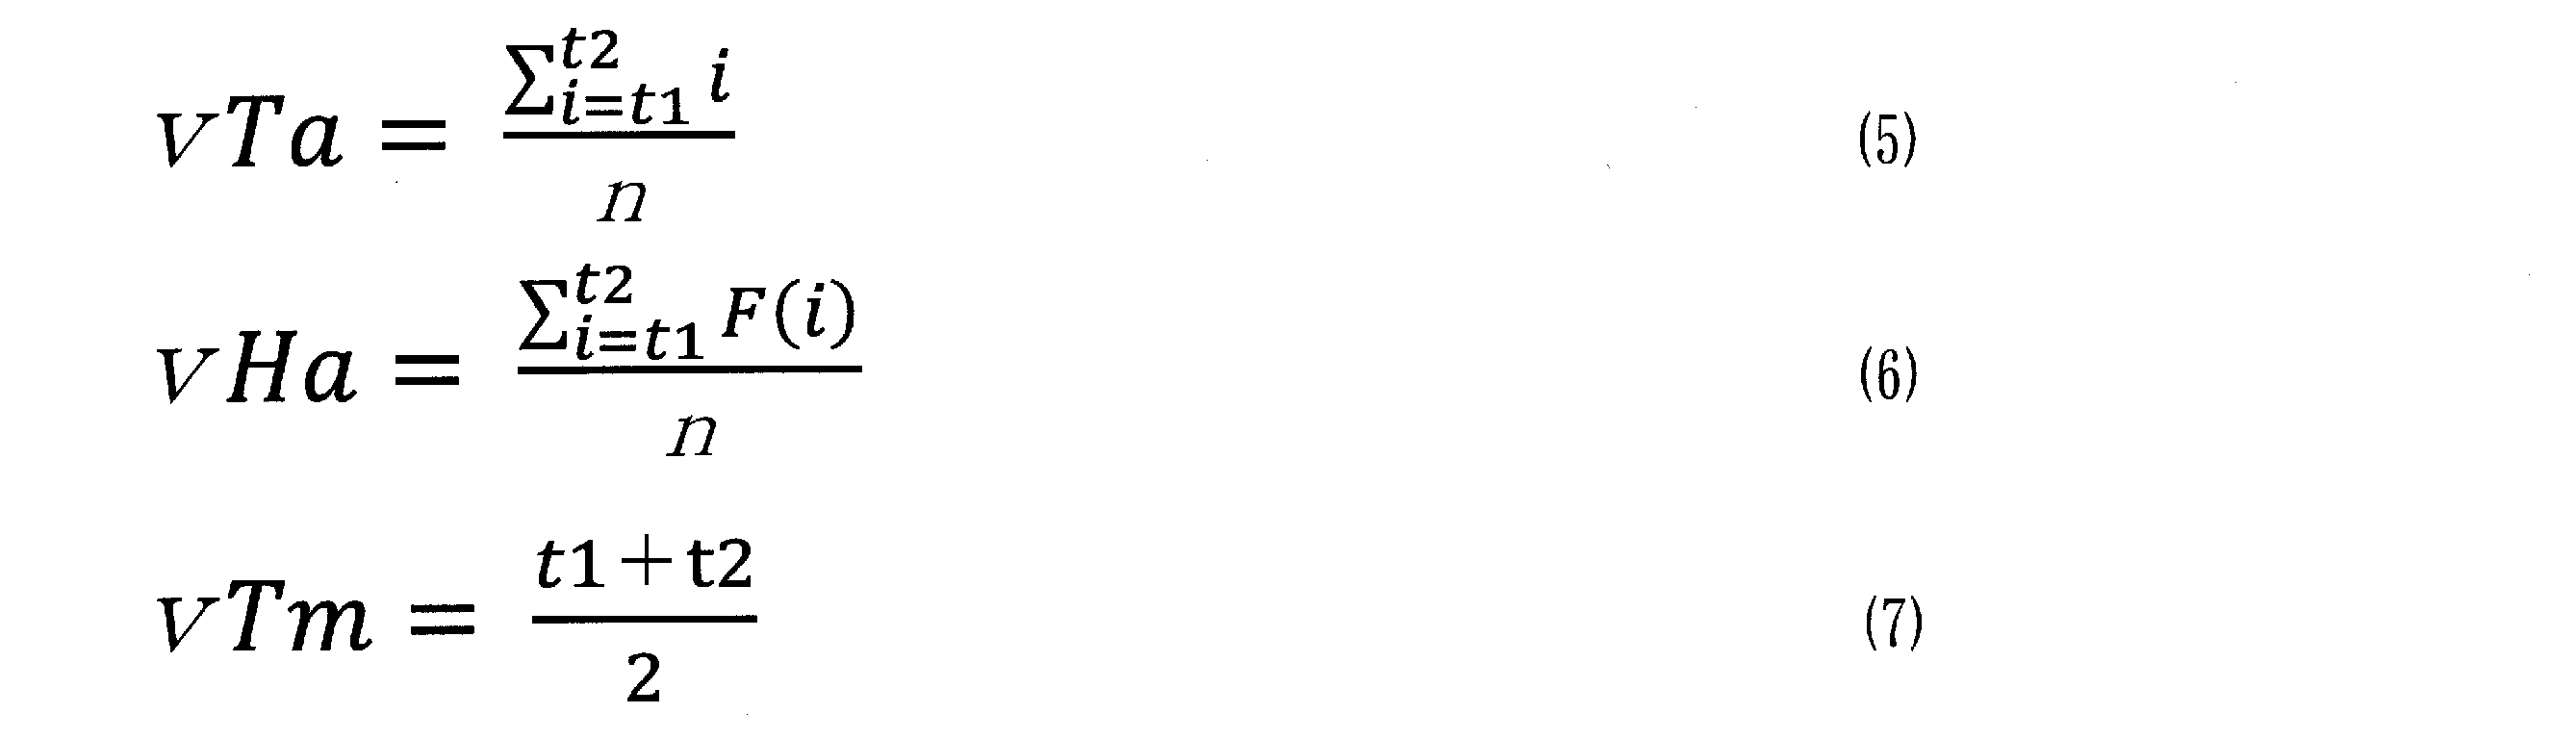
前記vBが、前記t1からt2までのF(t)≧xとなる時間長であり、
前記vWが、前記t1からt2までのF(t)≧vHとなる時間長であり、
前記vTs、vTeが、それぞれt1、t2であり、
前記vTrが、vTsからvTeまでの時間長であり、
前記vNsが、該演算対象域中で、F(t)が最大値を示す時間よりも小さく且つF(t)=xを示す時間のうち、最大の時間であり、
前記vNeが、該演算対象域中で、F(t)が最大値を示す時間よりも大きく且つF(t)=xを示す時間のうち、最小の時間であり、
前記vNが、vNsからvNeまでの時間長であり、
前記vABが、該vHと該vBとの比を表し、
前記vAWが、該vHと該vWとの比を表し、
前記vTBが、該vTと該vBとの比を表し、
前記vTWが、該vTと該vWとの比を表し、
前記vABaが、該vHaと該vBとの比を表し、
前記vAWaが、該vHaと該vWとの比を表す、
〔3〕記載の分析方法。
〔5〕前記凝固加速度に関する波形をF’(t)(tは時間)、F’(t)が所定値xである時間をt1、t2(t1<t2)とするとき、前記演算対象域はF’(t)≧xを満たす領域であり、前記pT及びpHは下記式で表され、

前記pBが、前記t1からt2までのF’(t)≧xとなる時間長であり、
前記pWが、前記t1からt2までのF’(t)≧pHとなる時間長であり、
前記pNsが、該演算対象域中で、F’(t)が最大値を示す時間よりも小さく且つF’(t)=xを示す時間のうち、最大の時間であり、
前記pNeが、該演算対象域中で、F’(t)が最大値を示す時間よりも大きく且つF’(t)=xを示す時間のうち、最小の時間であり、
前記pNが、pNsからpNeまでの時間長であり、
前記pABが、該pHと該pBとの比を表し、
前記pAWが、該pHと該pWとの比を表し、
前記pTBが、該pTと該pBとの比を表し、
前記pTWが、該pTと該pWとの比を表す、
〔3〕記載の分析方法。
〔6〕前記凝固加速度に関する波形をF’(t)(tは時間)、F’(t)が所定値xである時間をt1、t2(t1<t2)とするとき、前記演算対象域はF’(t)≦xを満たす領域であり、前記mT及びmHは下記式で表され、
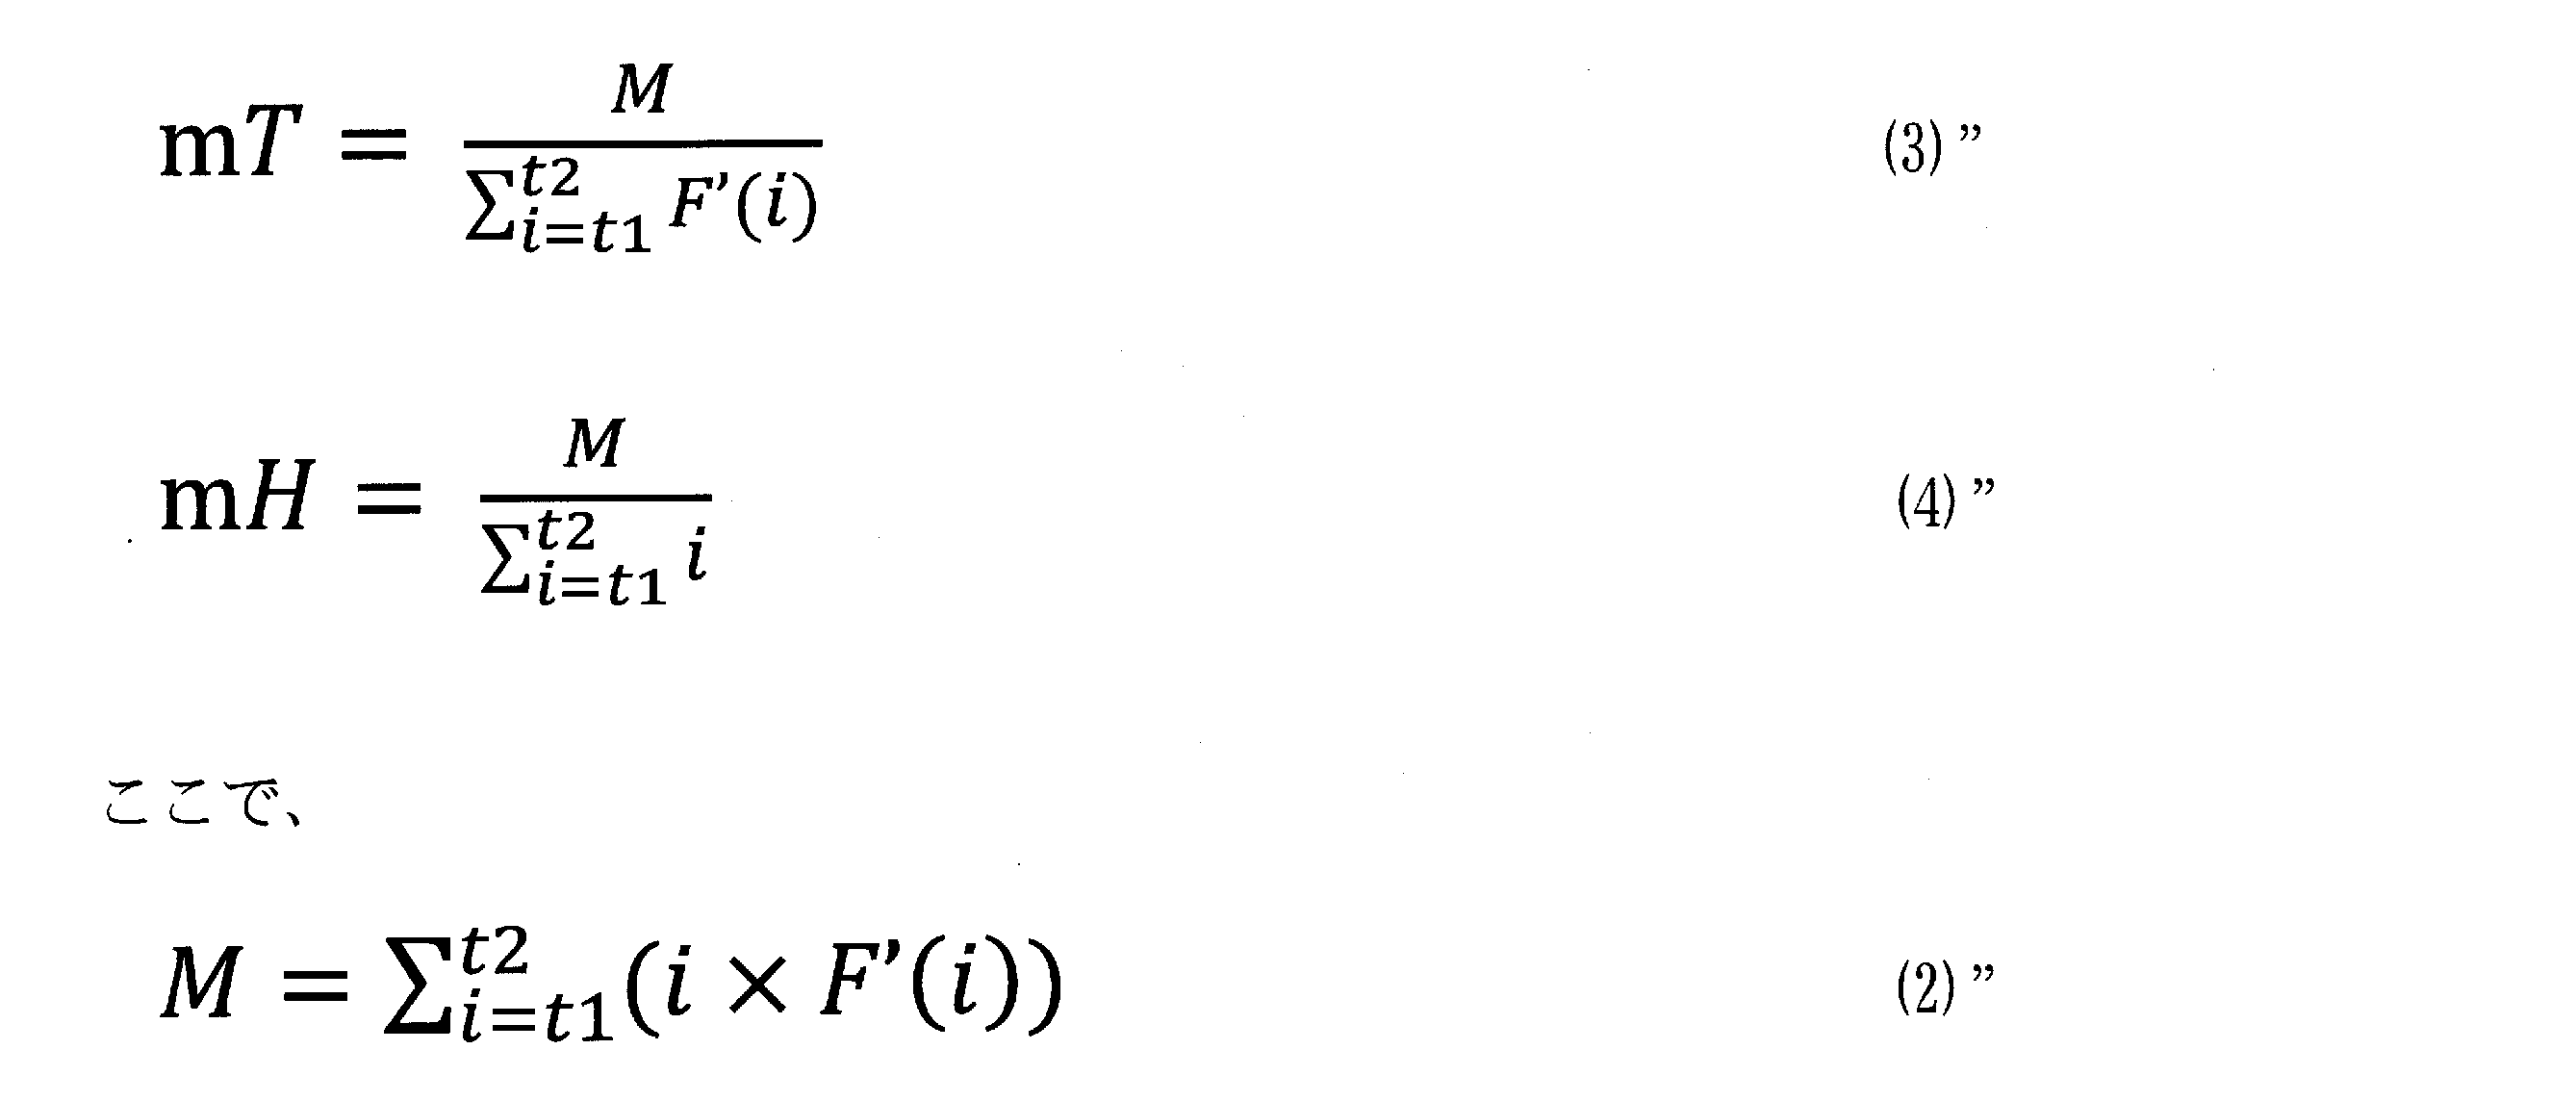
前記mBが、前記t1からt2までのF’(t)≦xとなる時間長であり、
前記mWが、前記t1からt2までのF’(t)≦mHとなる時間長であり、
前記mNsが、該演算対象域中で、F’(t)が最小値を示す時間よりも小さく且つF’(t)=xを示す時間のうち、最大の時間であり、
前記mNeが、該演算対象域中で、F’(t)が最小値を示す時間よりも大きく且つF’(t)=xを示す時間のうち、最小の時間であり、
前記mNが、mNsからmNeまでの時間長であり、
前記mABが、該mHと該mBとの比を表し、
前記mAWが、該mHと該mWとの比を表し、
前記mTBが、該mTと該mBとの比を表し、
前記mTWが、該mTと該mWとの比を表す、
〔3〕記載の分析方法。
〔7〕前記所定値xが、前記F(t)の最大値の0.5~99%であるか、前記F’(t)のプラスピークの最大値の0.5~99%であるか、又は前記F’(t)のマイナスピークの最小値の0.5~99%である〔4〕~〔6〕のいずれか1項記載の分析方法。
〔8〕前記複数の演算対象域が5~20個の異なる領域である、〔2〕~〔7〕のいずれか1項記載の分析方法。
〔9〕前記判定が、前記複数のパラメータ群を、複数のテンプレート血液検体についての対応するパラメータ群と比較することと、該比較の結果に基づいて、前記被検血液検体における凝固因子の活性レベル又は活性異常を判定することとを含み、
該テンプレート血液検体が、該凝固因子の活性レベル又は活性異常の有無が既知である血液検体である、
〔1〕~〔8〕のいずれか1項記載の分析方法。
〔10〕前記比較が、前記被検血液検体についてのパラメータ群と、前記複数のテンプレート血液検体についての対応するパラメータ群の各々との間での相関を求めることを含む、〔9〕記載の分析方法。
〔11〕前記判定が、前記相関が所定の条件を満たすテンプレート血液検体を選出することと、選出したテンプレート血液検体における前記凝固因子の活性レベル又は活性異常を、前記被検血液検体における凝固因子の活性レベル又は活性異常と判定することを含む、〔10〕記載の分析方法。
〔12〕前記凝固因子が血液凝固第VIII因子または血液凝固第IX因子である、〔1〕~〔11〕のいずれか1項記載の分析方法。
〔13〕前記判定が、前記血友病A患者由来の被検血液検体を判定することを含む、〔12〕記載の分析方法。
〔14〕前記判定が、重症、中等症又は軽症の血友病A患者由来の被検血液検体を判定することを含む、〔12〕記載の分析方法。
〔15〕前記判定が、Very-Severe Haemophilia A、Modestly-Severe Haemophilia A、中等症又は軽症の血友病A患者由来の被検血液検体を判定することを含む、〔12〕記載の分析方法。
〔16〕前記判定が、前記血友病B患者由来の被検血液検体を判定することを含む、〔12〕記載の分析方法。
〔17〕前記判定が、重症、中等症又は軽症の血友病B患者由来の被検血液検体を判定することを含む、〔12〕記載の分析方法。
〔18〕血液凝固第VIII因子が異常ではないと判定された被検血液検体における血液凝固第IX因子の活性レベル又は活性異常を判定することを含む第2の判定工程をさらに含み、
該第2の判定工程が、該被検血液検体についての前記パラメータ群を、血液凝固第IX因子の活性レベル又は活性異常の有無が既知である複数のテンプレート血液検体についての対応するパラメータ群と比較することと、該比較の結果に基づいて、前記被検血液検体における血液凝固第IX因子の活性レベル又は活性異常を判定することとを含む、
〔12〕記載の分析方法。
〔19〕前記判定が、前記血友病B患者由来の被検血液検体を判定することを含む、〔18〕記載の分析方法。
〔20〕前記判定が、重症、中等症又は軽症の血友病B患者由来の被検血液検体を判定することを含む、〔18〕記載の分析方法。
〔21〕〔1〕~〔20〕のいずれか1項記載の血液検体の分析方法を行うためのプログラム。
〔22〕〔1〕~〔20〕のいずれか1項記載の血液検体の分析方法を行うための装置。
〔1〕被検血液検体と凝固時間測定試薬とが混和されてなる試料についての凝固速度又は凝固加速度に関する波形を取得することと、
該凝固速度又は凝固加速度に関する波形を特徴付ける複数のパラメータを抽出することと、
該複数のパラメータに基づいて、該被検血液検体における凝固因子の活性レベル又は活性異常を判定することと、
を含む、血液検体の分析方法。
〔2〕前記複数のパラメータが、前記凝固速度に関する波形の複数の演算対象域をそれぞれ特徴付ける複数のパラメータを含むか、前記凝固加速度に関する波形の複数の演算対象域をそれぞれ特徴付ける複数のパラメータを含むか、又はそれらの組み合わせを含む、〔1〕記載の分析方法。
〔3〕前記複数のパラメータが、下記:
前記凝固速度に関する波形の複数の演算対象域についての加重平均時間vT、加重平均高さvH、ピーク幅vB、加重平均ピーク幅vW、加重平均高さについてのB扁平率vAB、加重平均高さについてのW扁平率vAW、加重平均時間についてのB時間率vTB、加重平均時間についてのW時間率vTW、平均時間vTa、平均高さvHa、平均高さについてのB扁平率vABa、平均高さについてのW扁平率vAWa、領域始点時間vTs、領域終点時間vTe、領域中央時間vTm、領域時間幅vTr、主ピーク始点時間vNs、主ピーク終点時間vNe、及び主ピーク幅vN;
前記凝固加速度に関する波形のプラスピークの複数の演算対象域についての加重平均時間pT、加重平均高さpH、ピーク幅pB、加重平均ピーク幅pW、加重平均高さについてのB扁平率pAB、加重平均高さについてのW扁平率pAW、加重平均時間についてのB時間率pTB、加重平均時間についてのW時間率pTW、主ピーク始点時間pNs、主ピーク終点時間pNe、及び主ピーク幅pN;ならびに、
前記凝固加速度に関する波形のマイナスピークの複数の演算対象域についての加重平均時間mT、加重平均高さmH、ピーク幅mB、加重平均ピーク幅mW、加重平均高さについてのB扁平率mAB、加重平均高さについてのW扁平率mAW、加重平均時間についてのB時間率mTB、加重平均時間についてのW時間率mTW、主ピーク始点時間mNs、主ピーク終点時間mNe、及び主ピーク幅mN、
からなる群より選択される1つ以上を含む、〔2〕記載の分析方法。
〔4〕前記凝固速度に関する波形をF(t)(tは時間)、F(t)が所定値xである時間をt1、t2(t1<t2)とするとき、前記演算対象域はF(t)≧xを満たす領域であり、前記vT及びvHは下記式で表され、
前記vWが、前記t1からt2までのF(t)≧vHとなる時間長であり、
前記vTs、vTeが、それぞれt1、t2であり、
前記vTrが、vTsからvTeまでの時間長であり、
前記vNsが、該演算対象域中で、F(t)が最大値を示す時間よりも小さく且つF(t)=xを示す時間のうち、最大の時間であり、
前記vNeが、該演算対象域中で、F(t)が最大値を示す時間よりも大きく且つF(t)=xを示す時間のうち、最小の時間であり、
前記vNが、vNsからvNeまでの時間長であり、
前記vABが、該vHと該vBとの比を表し、
前記vAWが、該vHと該vWとの比を表し、
前記vTBが、該vTと該vBとの比を表し、
前記vTWが、該vTと該vWとの比を表し、
前記vABaが、該vHaと該vBとの比を表し、
前記vAWaが、該vHaと該vWとの比を表す、
〔3〕記載の分析方法。
〔5〕前記凝固加速度に関する波形をF’(t)(tは時間)、F’(t)が所定値xである時間をt1、t2(t1<t2)とするとき、前記演算対象域はF’(t)≧xを満たす領域であり、前記pT及びpHは下記式で表され、
前記pWが、前記t1からt2までのF’(t)≧pHとなる時間長であり、
前記pNsが、該演算対象域中で、F’(t)が最大値を示す時間よりも小さく且つF’(t)=xを示す時間のうち、最大の時間であり、
前記pNeが、該演算対象域中で、F’(t)が最大値を示す時間よりも大きく且つF’(t)=xを示す時間のうち、最小の時間であり、
前記pNが、pNsからpNeまでの時間長であり、
前記pABが、該pHと該pBとの比を表し、
前記pAWが、該pHと該pWとの比を表し、
前記pTBが、該pTと該pBとの比を表し、
前記pTWが、該pTと該pWとの比を表す、
〔3〕記載の分析方法。
〔6〕前記凝固加速度に関する波形をF’(t)(tは時間)、F’(t)が所定値xである時間をt1、t2(t1<t2)とするとき、前記演算対象域はF’(t)≦xを満たす領域であり、前記mT及びmHは下記式で表され、
前記mWが、前記t1からt2までのF’(t)≦mHとなる時間長であり、
前記mNsが、該演算対象域中で、F’(t)が最小値を示す時間よりも小さく且つF’(t)=xを示す時間のうち、最大の時間であり、
前記mNeが、該演算対象域中で、F’(t)が最小値を示す時間よりも大きく且つF’(t)=xを示す時間のうち、最小の時間であり、
前記mNが、mNsからmNeまでの時間長であり、
前記mABが、該mHと該mBとの比を表し、
前記mAWが、該mHと該mWとの比を表し、
前記mTBが、該mTと該mBとの比を表し、
前記mTWが、該mTと該mWとの比を表す、
〔3〕記載の分析方法。
〔7〕前記所定値xが、前記F(t)の最大値の0.5~99%であるか、前記F’(t)のプラスピークの最大値の0.5~99%であるか、又は前記F’(t)のマイナスピークの最小値の0.5~99%である〔4〕~〔6〕のいずれか1項記載の分析方法。
〔8〕前記複数の演算対象域が5~20個の異なる領域である、〔2〕~〔7〕のいずれか1項記載の分析方法。
〔9〕前記判定が、前記複数のパラメータ群を、複数のテンプレート血液検体についての対応するパラメータ群と比較することと、該比較の結果に基づいて、前記被検血液検体における凝固因子の活性レベル又は活性異常を判定することとを含み、
該テンプレート血液検体が、該凝固因子の活性レベル又は活性異常の有無が既知である血液検体である、
〔1〕~〔8〕のいずれか1項記載の分析方法。
〔10〕前記比較が、前記被検血液検体についてのパラメータ群と、前記複数のテンプレート血液検体についての対応するパラメータ群の各々との間での相関を求めることを含む、〔9〕記載の分析方法。
〔11〕前記判定が、前記相関が所定の条件を満たすテンプレート血液検体を選出することと、選出したテンプレート血液検体における前記凝固因子の活性レベル又は活性異常を、前記被検血液検体における凝固因子の活性レベル又は活性異常と判定することを含む、〔10〕記載の分析方法。
〔12〕前記凝固因子が血液凝固第VIII因子または血液凝固第IX因子である、〔1〕~〔11〕のいずれか1項記載の分析方法。
〔13〕前記判定が、前記血友病A患者由来の被検血液検体を判定することを含む、〔12〕記載の分析方法。
〔14〕前記判定が、重症、中等症又は軽症の血友病A患者由来の被検血液検体を判定することを含む、〔12〕記載の分析方法。
〔15〕前記判定が、Very-Severe Haemophilia A、Modestly-Severe Haemophilia A、中等症又は軽症の血友病A患者由来の被検血液検体を判定することを含む、〔12〕記載の分析方法。
〔16〕前記判定が、前記血友病B患者由来の被検血液検体を判定することを含む、〔12〕記載の分析方法。
〔17〕前記判定が、重症、中等症又は軽症の血友病B患者由来の被検血液検体を判定することを含む、〔12〕記載の分析方法。
〔18〕血液凝固第VIII因子が異常ではないと判定された被検血液検体における血液凝固第IX因子の活性レベル又は活性異常を判定することを含む第2の判定工程をさらに含み、
該第2の判定工程が、該被検血液検体についての前記パラメータ群を、血液凝固第IX因子の活性レベル又は活性異常の有無が既知である複数のテンプレート血液検体についての対応するパラメータ群と比較することと、該比較の結果に基づいて、前記被検血液検体における血液凝固第IX因子の活性レベル又は活性異常を判定することとを含む、
〔12〕記載の分析方法。
〔19〕前記判定が、前記血友病B患者由来の被検血液検体を判定することを含む、〔18〕記載の分析方法。
〔20〕前記判定が、重症、中等症又は軽症の血友病B患者由来の被検血液検体を判定することを含む、〔18〕記載の分析方法。
〔21〕〔1〕~〔20〕のいずれか1項記載の血液検体の分析方法を行うためのプログラム。
〔22〕〔1〕~〔20〕のいずれか1項記載の血液検体の分析方法を行うための装置。
本発明によれば、凝固反応曲線に由来するパラメータに基づいて、血液検体におけるFVIII又はFIXの活性レベル、又はその活性異常(欠乏等)の有無を分析することができる。本発明は、血友病Aの判定又は血友病Bの判定、あるいは血友病患者の重症度の判定に有用である。
本発明は、血液検体の血液凝固に関連する特性を分析することに関する。以下、血液検体を検体と称する場合がある。より詳細には、本発明は、血液凝固時間が延長した検体における血液凝固時間延長要因成分の活性レベル又はその活性異常の有無を分析することに関する。好適には、本発明は、凝固第VIII因子(以下、FVIIIとも称する)又は凝固第IX因子(以下、FIXとも称する)の活性レベル、又はその活性異常の有無を分析することに関する。したがって、本発明の一態様は、血液検体の分析方法であり、より詳細には、血液検体における血液凝固時間延長要因成分、好適にはFVIII及び/又はFIXの活性レベル、又はその活性異常の有無を判定する方法である。本発明の方法の手順の一実施形態について、図面を参照して以下に説明する。
1.血液検体の分析方法
1.1.方法の概要
本発明による血液検体の分析方法(以下、本発明の方法ともいう)は、被検検体と凝固時間測定試薬とが混和されてなる試料についての凝固速度又は凝固加速度に関する波形を取得することと、該凝固速度又は凝固加速度に関する波形を特徴付ける複数のパラメータを抽出することと、該複数のパラメータに基づいて、該被検検体における血液凝固時間延長要因成分の活性レベル又は活性異常を判定することとを含む。本発明の方法の一実施形態を、図1を参照して説明する。本方法では、まず被検検体から試料が調製され(ステップ1)、次いで該試料についての凝固反応計測が実行される(ステップ2)。得られた計測データから、該試料について凝固速度又は凝固加速度に関する波形が取得され、次いで波形に対して所定の解析が行われる(ステップ3)。解析で得られたパラメータに基づいて、被検検体の判定(血液凝固時間延長要因成分の活性レベル又はその活性異常の判定)が行われる(ステップ4)。
1.2.試料調製及び凝固反応計測
ステップ1における被検検体からの試料の調製と、ステップ2における該試料についての凝固反応計測について説明する。ここでは、凝固反応計測として、活性化部分トロンボプラスチン時間(APTT)の測定を例に挙げて説明するが、それ以外の凝固反応計測(例えばプロトロンビン時間(PT)測定)への変更は、当業者であれば実施可能である。
ステップ1における被検検体からの試料の調製と、ステップ2における該試料についての凝固反応計測について説明する。ここでは、凝固反応計測として、活性化部分トロンボプラスチン時間(APTT)の測定を例に挙げて説明するが、それ以外の凝固反応計測(例えばプロトロンビン時間(PT)測定)への変更は、当業者であれば実施可能である。
当該被検検体の例としては、血液凝固能に関する検査が要求されている被検者に由来する検体が挙げられ、例えば血液凝固異常を有する検体、又は血液凝固異常が疑われる検体が挙げられ、より詳細には、血液凝固時間が延長した検体、又は血液凝固時間の延長が疑われる検体が挙げられる。好ましくは、該検体としては、被検者の血漿が用いられる。該検体には、凝固検査に通常用いられる周知の抗凝固剤が添加され得る。例えば、クエン酸ナトリウム入り採血管を用いて採血された後、遠心分離されることで血漿が得られる。
得られた被検検体は凝固時間測定試薬と混和されて、凝固反応計測のための試料が調製される。該凝固時間測定試薬の例としては、APTT測定のための試薬であればよく、例えば接触因子系の活性化剤とリン脂質とが挙げられる。活性化剤の例としては、エラグ酸、セライト、カオリン、シリカ、ポリフェノール化合物などが挙げられる。リン脂質の例としては、動物由来、植物由来、合成由来のリン脂質などが挙げられる。動物由来のリン脂質の例としては、ウサギ脳由来、ニワトリ由来、ブタ由来のものが挙げられる。植物由来のリン脂質の例としては、大豆由来のものが挙げられる。また、当該試料には、必要に応じて、トリス塩酸等の緩衝液が添加されてもよい。あるいは、該APTT測定のための試薬には、市販のAPTT測定試薬を用いてもよい。市販のAPTT測定試薬の例としては、コアグピア APTT-N(積水メディカル株式会社製)が挙げられる。調製された試料は加温され、該試料中の接触因子は活性化される。加温の際の温度は、例えば30℃以上40℃以下、好ましくは35℃以上39℃以下である。
その後、該被検検体と凝固時間測定試薬とを含む試料に塩化カルシウム液(例えば、コアグピアAPTT-N 塩化カルシウム液;積水メディカル株式会社製)が添加され、血液凝固反応を開始させる。塩化カルシウム液添加後の混合液の凝固反応が計測され得る。凝固反応の計測には、一般的な手段、例えば、散乱光量、透過度、吸光度等を計測する光学的な手段、又は血漿の粘度を計測する力学的な手段などを用いればよい。計測される期間は、例えば、塩化カルシウム液の添加時点から数十秒~5分程度であり得る。計測期間の間、所定の間隔で計測が繰り返し行われ得る。例えば、0.1秒間隔で計測が行われればよい。計測中の反応液の温度は、例えば30℃以上40℃以下、好ましくは35℃以上39℃以下である。凝固反応の反応開始時間は、典型的には被検検体を含む試料に塩化カルシウム液が添加された時点として定義され得るが、他のタイミングが反応開始時間として定義されてもよい。また、計測の各種条件は、被検検体や試薬、計測手段等に応じて適宜設定され得る。
上述の凝固反応計測における一連の操作は、自動分析装置を用いて行われてもよい。自動分析装置の一例として、血液凝固自動分析装置CP3000(積水メディカル株式会社製)が挙げられる。あるいは、一部の操作が手作業で行われてもよい。例えば、被検検体の調製を人間が行い、それ以降の操作は自動分析装置で行うことができる。
1.3.データ解析
1.3.1.データの1次処理及び補正処理
次に、ステップ3のデータ解析について説明する。データ解析のフローを図2に示す。ステップ3でのデータ解析は、ステップ2の凝固反応計測と並行して行われてもよく、又は予め測定した凝固反応計測のデータを用いて、後から行われてもよい。
1.3.1.データの1次処理及び補正処理
次に、ステップ3のデータ解析について説明する。データ解析のフローを図2に示す。ステップ3でのデータ解析は、ステップ2の凝固反応計測と並行して行われてもよく、又は予め測定した凝固反応計測のデータを用いて、後から行われてもよい。
ステップ3aにおいて、上記凝固反応計測での計測データが取得される。このデータは、例えば上述のステップ2でのAPTT測定で得られる試料の凝固反応過程を反映するデータである。例えば、被検検体と凝固時間測定試薬とを含む試料からの、塩化カルシウム液添加後の凝固反応の進行量(例えば散乱光量)の時間変化を示すデータが取得される。これら凝固反応計測で得られたデータを、本明細書において凝固反応情報とも称する。
ステップ3aで取得される凝固反応情報の一例を図3に示す。図3は散乱光量に基づく凝固反応曲線であり、横軸は塩化カルシウム液の添加後の経過時間(凝固反応時間)を示し、縦軸は散乱光量を示す。時間経過とともに、混合液の凝固反応が進むため、散乱光量は増加している。本明細書では、このような散乱光量等で示される凝固反応時間に対する凝固反応量の変化を示す曲線を、凝固反応曲線と称する。
図3に示すような散乱光量に基づく凝固反応曲線は、通常、シグモイド状である。一方、透過光量に基づく凝固反応曲線は、通常、逆シグモイド状である。以降の本明細書では、凝固反応情報として散乱光量に基づく凝固反応曲線を用いたデータ解析について説明する。凝固反応情報として透過光量や吸光度に基づく凝固反応曲線を用いたデータ解析の場合にも同様の処理が行われ得ることは、当業者に明らかである。あるいは、凝固反応情報として、混合液の粘度変化等の力学的な手段で得られた凝固反応曲線が解析対象にされてもよい。
ステップ3bにおいて、凝固反応曲線の前処理が行われる。該前処理には、ノイズを除去するための平滑化処理と、ゼロ点調整とが含まれる。図4は、前処理(平滑化処理及びゼロ点調整)された図3の凝固反応曲線の一例を示す。平滑化処理には、公知のノイズ除去方法の何れかが用いられ得る。また図3に示すように、被検検体を含む混合液は元々光を散乱させるため、測定開始時点(時間0)での散乱光量は0より大きい。平滑化処理後のゼロ点調整により、図4に示すように時間0での散乱光量が0に調整される。図5A及びBは、それぞれ、前処理前及び後の図3の凝固反応曲線の部分拡大図を示す。図5Bでは、図5Aのデータに対して、平滑化処理及びゼロ点調整が行われている。
凝固反応曲線の高さは、被検検体のフィブリノゲン濃度に依存する。一方、フィブリノゲン濃度には個人差があるため、該凝固反応曲線の高さは被検検体によって異なる。したがって、本方法では、必要に応じて、ステップ3cにおいて前処理後の凝固反応曲線を相対値化するための補正処理が行われる。該補正処理によって、フィブリノゲン濃度に依存しない凝固反応曲線を得ることができ、それにより検体間での前処理後の凝固反応曲線の形状の差異を定量的に比較することができるようになる。
一実施形態において、当該補正処理では、前処理後の凝固反応曲線を、最大値が所定値となるように補正する。好適には、当該補正処理では、下記式(1)に従って、前処理後の凝固反応曲線から補正凝固反応曲線P(t)を求める。式(1)中、D(t)は前処理後の凝固反応曲線を表し、Dmax及びDminは、それぞれD(t)の最大値及び最小値を表し、Drangeは、D(t)の変化幅(すなわちDmax-Dmin)を表し、Aは、補正凝固反応曲線の最大値を表す任意の値である。
P(t)=[(D(t)-Dmin)/Drange]×A (1)
P(t)=[(D(t)-Dmin)/Drange]×A (1)
一例として、図6に、図4に示す凝固反応曲線が最大値100となるように補正されたデータを示す。なお、図6では補正後の値が0から100までとなるように補正したが、他の値(例えば0から10000まで、すなわち式(1)でA=10000)であってもよい。また、この補正処理は必ずしも行われなくてもよい。
あるいは、上述のような補正処理は、後述する凝固速度又は凝固加速度に関する波形、又は該波形から抽出したパラメータ群に対して行われてもよい。例えば、補正処理が行われない前処理後の凝固反応曲線D(t)について凝固速度に関する波形を算出した後、これをP(t)に相当する値に変換することができる。あるいは、該凝固速度に関する波形からパラメータ群を抽出した後、該パラメータ群に含まれる個々のパラメータの値をP(t)に相当する値に変換することができる。
本明細書においては、上記のような補正凝固反応曲線、及び補正処理なし凝固反応曲線を、それぞれ補正0次曲線、及び未補正0次曲線ともいい、またこれらを総称して「0次曲線」ともいう。また本明細書においては、該補正0次曲線、及び該未補正0次曲線の1次微分曲線を、それぞれ補正1次曲線、及び未補正1次曲線ともいい、またこれらを総称して「1次曲線」ともいう。また本明細書においては、該補正0次曲線、及び該未補正0次曲線の2次微分曲線、あるいは該補正1次曲線、及び該未補正1次曲線の1次微分曲線を、それぞれ補正2次曲線、及び未補正2次曲線ともいい、またこれらを総称して「2次曲線」ともいう。
1.3.2.凝固速度又は凝固加速度に関する波形の算出
ステップ3dでは、凝固速度又は凝固加速度に関する波形が算出される。本明細書において、該凝固速度に関する波形には、未補正1次曲線と、補正1次曲線とが含まれる。未補正1次曲線は、凝固反応曲線(未補正0次曲線)を1次微分して得られる値、すなわち任意の凝固反応時間における凝固反応量の変化率(凝固速度)を表す。補正1次曲線は、補正凝固反応曲線(補正0次曲線)を1次微分して得られる値、すなわち任意の凝固反応時間における凝固反応量の相対変化率を表す。したがって、該凝固速度に関する波形は、試料の凝固反応における凝固速度又はその相対値を表す波形であり得る。本明細書では、1次曲線で表される該凝固速度及びその相対値を含む血液凝固の進行を表す値を、1次微分値と総称する。また本明細書において、該凝固加速度に関する波形には、未補正2次曲線及び補正2次曲線が含まれる。本明細書では、該凝固加速度に関する波形で表される値を、2次微分値と総称する。凝固反応曲線又は補正凝固反応曲線(未補正及び補正0次曲線)の1次微分及び2次微分は、公知の手法を用いて行うことができる。図7は、図6に示す補正0次曲線を一次微分して得られる補正1次曲線を示す。図7の横軸は凝固反応時間を表し、縦軸は1次微分値を表す。
ステップ3dでは、凝固速度又は凝固加速度に関する波形が算出される。本明細書において、該凝固速度に関する波形には、未補正1次曲線と、補正1次曲線とが含まれる。未補正1次曲線は、凝固反応曲線(未補正0次曲線)を1次微分して得られる値、すなわち任意の凝固反応時間における凝固反応量の変化率(凝固速度)を表す。補正1次曲線は、補正凝固反応曲線(補正0次曲線)を1次微分して得られる値、すなわち任意の凝固反応時間における凝固反応量の相対変化率を表す。したがって、該凝固速度に関する波形は、試料の凝固反応における凝固速度又はその相対値を表す波形であり得る。本明細書では、1次曲線で表される該凝固速度及びその相対値を含む血液凝固の進行を表す値を、1次微分値と総称する。また本明細書において、該凝固加速度に関する波形には、未補正2次曲線及び補正2次曲線が含まれる。本明細書では、該凝固加速度に関する波形で表される値を、2次微分値と総称する。凝固反応曲線又は補正凝固反応曲線(未補正及び補正0次曲線)の1次微分及び2次微分は、公知の手法を用いて行うことができる。図7は、図6に示す補正0次曲線を一次微分して得られる補正1次曲線を示す。図7の横軸は凝固反応時間を表し、縦軸は1次微分値を表す。
1.3.3.パラメータの抽出
ステップ3eでは、当該試料についての凝固速度又は凝固加速度に関する波形を特徴付ける複数のパラメータの抽出が行われる。一実施形態において、該複数のパラメータは、各々が凝固速度に関する波形を特徴付ける、複数のパラメータを含む。別の一実施形態において、該複数のパラメータは、各々が凝固加速度に関する波形を特徴付ける、複数のパラメータを含む。別の一実施形態においては、該各々が凝固速度に関する波形を特徴付ける複数のパラメータと、該各々が凝固加速度に関する波形を特徴付ける複数のパラメータとが、組み合わせて使用される。
ステップ3eでは、当該試料についての凝固速度又は凝固加速度に関する波形を特徴付ける複数のパラメータの抽出が行われる。一実施形態において、該複数のパラメータは、各々が凝固速度に関する波形を特徴付ける、複数のパラメータを含む。別の一実施形態において、該複数のパラメータは、各々が凝固加速度に関する波形を特徴付ける、複数のパラメータを含む。別の一実施形態においては、該各々が凝固速度に関する波形を特徴付ける複数のパラメータと、該各々が凝固加速度に関する波形を特徴付ける複数のパラメータとが、組み合わせて使用される。
好ましくは、本発明の方法におけるパラメータの抽出工程においては、該凝固速度又は凝固加速度に関する波形から複数の演算対象域が抽出される一方、これら複数の演算対象域の各々に対して、それを特徴付けるパラメータが抽出される。結果、該凝固速度又は凝固加速度に関する波形についての複数の演算対象域をそれぞれ特徴付ける複数のパラメータが抽出される。したがって、本発明で抽出される、該凝固速度又は凝固加速度に関する波形を特徴付ける複数のパラメータは、該凝固速度に関する波形の複数の演算対象域をそれぞれ特徴付ける複数のパラメータを含むか、該凝固加速度に関する波形の複数の演算対象域をそれぞれ特徴付ける複数のパラメータを含むか、又はそれらの組み合わせを含む。本発明の方法においては、得られた該複数のパラメータを含むパラメータ群が作成される。該パラメータ群は、該凝固速度又は凝固加速度に関する波形の形状を反映し、検体の血液凝固特性と関連する。該パラメータ群は、被検検体の判定(ステップ4)に用いられる。該パラメータについて以下に説明する。
1.3.3.2.演算対象域の抽出
本発明の方法におけるパラメータの抽出に関し、凝固速度又は凝固加速度に関する波形から複数の演算対象域を抽出する手順を説明する。
本発明の方法におけるパラメータの抽出に関し、凝固速度又は凝固加速度に関する波形から複数の演算対象域を抽出する手順を説明する。
演算対象域と、それを特徴付けるパラメータについて、以下に、凝固速度に関する波形を例として説明する。該演算対象域は、凝固速度に関する波形(1次曲線)における、1次微分値(y値)が所定の演算対象域値以上である領域(セグメント)である。より詳細には、該演算対象域は、凝固速度に関する波形における、1次微分値(y値)が所定の演算対象域値以上且つ最大値(Vmax)以下であり、且つ該波形の最大点を含む領域(セグメント)である。演算対象域値は、演算対象域の下限を指定する所定値であり、本明細書において演算対象域値Sとも称される。演算対象域値Sは、凝固速度に関する波形のピーク形状を反映する範囲を限定するために設定され得る。ピーク形状を相対的に広く限定するためには、演算対象域値SはVmaxの0%~20%に設定され得る。一方、演算対象域値Sを大きくするとピークの上部形状の影響が相対的に大きく解析結果に反映される。ピーク上部の形状を解析するためには、演算対象域値SはVmaxの20%~95%に設定され得る。一実施形態において、演算対象域値SはVmaxの0.5~99%、好ましくは5~90%に設定され得る。
本発明の方法では、複数の異なる演算対象域値Sに基づいて複数の演算対象域を抽出する。本発明の方法において抽出される演算対象域の数は、必ずしも限定されないが、数が少ない場合、血液検体の判定の精度が低下することがあり、一方、数が多すぎると、計算量が増大して演算負荷が高くなる。該複数の演算対象域は、好ましくは3つ以上の異なる領域であり、より好ましくは5つ以上の異なる領域であり、さらに好ましくは3~100個の異なる領域であり、さらに好ましくは5~20個の異なる領域である。演算対象域値Sの数は、演算対象域の数に対応する。各演算対象域の抽出のための演算対象域値Sは互いに異なる。分析精度の観点からは、各Sは近接していないことが好ましい。各Sの間隔は、演算対象域の数に応じて設定すればよいが、好ましくはVmaxの1/100以上1/2以下、より好ましくはVmaxの1/33以上1/5以下、さらに好ましくはVmaxの1/20以上1/5以下、さらに好ましくはVmaxの1/20以上1/10以下である。Vmaxと各Sの間隔は、同じであっても異なっていてもよい。演算対象域値Sはまた、2次曲線にも適用され得る。2次曲線は、プラス方向及びマイナス方向の双方にピークを有し得る。演算対象域値Sは、2次曲線のプラスピーク及びマイナスピークのそれぞれに対して設定され得る。一実施形態において、演算対象域値Sは2次曲線のプラスピークの最大値の0.5~99%、好ましくは5~90%に設定され得る。別の一実施形態において、演算対象域値Sは2次曲線のマイナスピークの最小値の0.5~99%、好ましくは5~90%に設定され得る。
1.3.3.3.加重平均点
演算対象域、及び該演算対象域の加重平均点について、図8を参照して説明する。図8には、補正1次曲線F(t)(t=時間)が示されている。また図8には、F(t)の最大値Vmax、ならびに下記に説明するパラメータである、演算対象域値SがVmaxのx%であるときの加重平均点(vTx, vHx)、及び演算対象域のピーク幅を表すvBが表示されている。演算対象域は、F(t)の値が演算対象域値S以上且つ1次微分値の最大値Vmax以下(F(t)≧S(S=x%)である)領域である。加重平均点(vTx, vHx)は、F(t)の演算対象域の「重み付き平均値」に相当する。
演算対象域、及び該演算対象域の加重平均点について、図8を参照して説明する。図8には、補正1次曲線F(t)(t=時間)が示されている。また図8には、F(t)の最大値Vmax、ならびに下記に説明するパラメータである、演算対象域値SがVmaxのx%であるときの加重平均点(vTx, vHx)、及び演算対象域のピーク幅を表すvBが表示されている。演算対象域は、F(t)の値が演算対象域値S以上且つ1次微分値の最大値Vmax以下(F(t)≧S(S=x%)である)領域である。加重平均点(vTx, vHx)は、F(t)の演算対象域の「重み付き平均値」に相当する。
該加重平均点での凝固反応時間(t)を加重平均時間vTとする。すなわち、加重平均時間vTは、凝固反応開始時間から加重平均点までの時間であり、加重平均点のx座標である。加重平均高さvHは、加重平均点のy座標である。
1次曲線についての加重平均時間vTと加重平均高さvHは、以下の手順で求めることができる。まず、1次曲線F(t)の最大値がVmax、演算対象域値がSであり、F(t)≧Vmax×S×0.01を満たす時間tのデータ群をt[t1, …t2]とする(t1<t2)。すなわち、F(t1)=Vmax×S×0.01、F(t2)=Vmax×S×0.01、時刻t1~t2のデータ群がt[t1, …t2](t1<t2)である。このとき、積和値Mを下記式(2)により求める。

加重平均時間vT及び加重平均高さvHは、それぞれ次式(3)及び(4)で算出される。求めたvTとvHから、加重平均点(vTx, vHx)が導かれる。

本明細書においては、異なる演算対象域に由来するvT及びvHを識別するため、それが由来する演算対象域値S(S=x%)に従って、それぞれvTx及びvHxと称することがある。例えば、Sが5%である演算対象域のvT及びvHは、vT5%及びvH5%である。これら加重平均時間vTx及び加重平均高さvHxは、演算対象域を特徴付けるパラメータとして用いられ得る。なお、上記のF(t1)=Vmax×S×0.01、F(t2)=Vmax×S×0.01を満たすt1及びt2(t1<t2)もパラメータとなり得、以下、該1次曲線に関するt1及びt2を、それぞれ領域始点時間vTs、及び領域終点時間vTe(vTs<vTe)と呼ぶことがある。これらも演算対象域値S(S=x%)に従って、それぞれvTsx及びvTexと称されることがある。
図9に、演算対象域値Sと、その際の解析対象となる補正0次曲線及び補正1次曲線の領域(演算対象域)と、加重平均点との関係を示す。図9において、上段、中段、及び下段は、演算対象域値SがそれぞれVmax(=100%)の10%、50%及び80%の場合を示す。左は補正0次曲線を示し、右は補正1次曲線の演算対象域を示し、黒丸印は加重平均点を示す。演算対象域値Sの変化に伴って、演算対象域及び加重平均点の位置は、図9に示すように変化する。上述の説明では、図8、9のとおり、補正1次曲線の演算対象域に関するパラメータを算出したが、未補正1次曲線でも同様のパラメータが算出され得る。
同様に、2次曲線についても、加重平均点、加重平均時間、及び加重平均高さが定義され得る。2次曲線は、図10に示すように2次微分値のプラス方向及びマイナス方向の双方にピークを有する。そのため、2次曲線の加重平均点は、プラスピーク及びマイナスピークの両方に対して算出され得る。例えば、プラスピークについては、2次曲線A=F'(t)の最大値がAmaxであり、演算対象域値がS(%)のとき、F'(t)≧Amax×S×0.01を満たす時間t[t1, …, t2](t1<t2)を求め、上式(2)'~(4)'に従って、プラスピークの加重平均時間pT、及び加重平均高さpHを算出する。マイナスピークについては、2次曲線A=F'(t)の最小値がAminであり、演算対象域値がS(%)のとき、F'(t)≦Amin×S×0.01を満たす時間t[t1, …, t2](t1<t2)を求め、上式(2)'、(3)“及び(4)”に従って、マイナスピークの加重平均時間mT、及び加重平均高さmHを算出する。演算対象域値Sの変化に伴って、加重平均点の位置は変化する。

1.3.3.4.ピーク幅、平均点、扁平率及び時間率
反応時間が加重平均時間vTより短い領域において1次微分値が演算対象域値S以上となる最少の反応時間から、反応時間が加重平均時間vTより長い領域において1次微分値が演算対象域値S以上となる最大の反応時間までの時間のうち、1次曲線F(t)≧Sとなる時間長(F(t)≧Sとなるデータ点数に測光時間間隔を乗じて得られた値)を、1次曲線のピーク幅vBとする。図8に示す例では、時間vTsから時間vTeまでがピーク幅vBとなる。同様に、2次曲線F’(t)のプラスピークにおける2次微分値が演算対象域値S以上となる反応時間の最小値及び最大値はそれぞれpTs、pTeであり、pTsからpTeまでの時間のうち、F’(t)≧Sとなる時間長(F’(t)≧Sとなるデータ点数に測光時間間隔を乗じて得られた値)を2次曲線のプラスピークのピーク幅pBとする。同様に、2次曲線F’(t)のマイナスピークにおける2次微分値が演算対象域値S以下となる反応時間の最小値及び最大値はそれぞれmTs、mTeであり、mTsからmTeまでの時間のうち、F’(t)≦Sとなる時間長(F’(t)≦Sとなるデータ点数に測光時間間隔を乗じて得られた値)を2次曲線のマイナスピークのピーク幅mBとする。
反応時間が加重平均時間vTより短い領域において1次微分値が演算対象域値S以上となる最少の反応時間から、反応時間が加重平均時間vTより長い領域において1次微分値が演算対象域値S以上となる最大の反応時間までの時間のうち、1次曲線F(t)≧Sとなる時間長(F(t)≧Sとなるデータ点数に測光時間間隔を乗じて得られた値)を、1次曲線のピーク幅vBとする。図8に示す例では、時間vTsから時間vTeまでがピーク幅vBとなる。同様に、2次曲線F’(t)のプラスピークにおける2次微分値が演算対象域値S以上となる反応時間の最小値及び最大値はそれぞれpTs、pTeであり、pTsからpTeまでの時間のうち、F’(t)≧Sとなる時間長(F’(t)≧Sとなるデータ点数に測光時間間隔を乗じて得られた値)を2次曲線のプラスピークのピーク幅pBとする。同様に、2次曲線F’(t)のマイナスピークにおける2次微分値が演算対象域値S以下となる反応時間の最小値及び最大値はそれぞれmTs、mTeであり、mTsからmTeまでの時間のうち、F’(t)≦Sとなる時間長(F’(t)≦Sとなるデータ点数に測光時間間隔を乗じて得られた値)を2次曲線のマイナスピークのピーク幅mBとする。
本発明で用いられるパラメータのさらなる例としては、領域時間幅vTrが挙げられる。vTrは、vTsからvTeまでの幅(時間長)である。1次曲線の演算対象域が単峰性のピークである場合、vTr=vBであるが、1次曲線がF(t)<Sとなる谷を含む複峰性である場合、vTr>vBである。本発明で用いられるパラメータのさらなる例としては、主ピーク始点時間vNs、主ピーク終点時間vNe、及び主ピーク幅vNが挙げられる。vNs、vNeは、1次曲線の演算対象域中の最大値Vmaxを含む主ピークについてのパラメータであり、上述のvTs、vTe等と比べて、凝固反応曲線に含まれ得るノイズの影響を受けにくいパラメータである。vNsは、1次曲線F(t)の演算対象域中で、最大値Vmaxを示す時間(後述するVmaxT)よりも小さく且つF(t)=Sを示す時間のうち、最大の時間である。vNeは、1次曲線F(t)の演算対象域中で、VmaxTよりも大きく且つF(t)=Sを示す時間のうち、最小の時間である。演算対象域が単峰性のピークである場合、vNs及びvNeは、それぞれvTs及びvTeと同じ値である。vNは、vNsからvNeまでの幅(時間長)である。同様に、2次曲線F’(t)のプラスピーク及びマイナスピークについて、同様にpNs、pNe、pN、及びmNs、mNe、mNを定義することができる。図11にvTs、vTe、vTr、vNs、vNe、vNを示す。
本発明で用いられるパラメータのさらなる例としては、加重平均ピーク幅vWが挙げられる。図12は、演算対象域値Sが10%のときの1次曲線の演算対象域(点線)を示す。図12の上には加重平均点(vT, vH)(黒丸印)、vTs、vTeが、図12の下には、vB、vWが示されている。図12に示すとおり、vWは、1次曲線F(t)≧vHを満たすピーク幅(F(t)≧vHを満たす最小時間から最大時間までの間で、F(t)≧vHとなる時間長)である。未補正1次曲線でも同様のパラメータが算出され得る。同様に、2次曲線のプラスピークについては、F'(t)≧pHを満たすピーク幅を加重平均ピーク幅pWとする。2次曲線のマイナスピークについては、F'(t)≦mHを満たす凝固反応時間の幅を加重平均ピーク幅mWとする。
本発明で用いられるパラメータのさらなる例としては、平均時間vTa、平均高さvHa、及び領域中央時間vTmが挙げられる。図13には、演算対象域値Sが10%のときの1次曲線の平均点(vTa, vHa)(白菱印)、加重平均点(vT, vH)(黒丸印)、vTs、vTe、及びvTmが示されている。vTa、vHa、及びvTmは、F(vTs)からF(vTe)までのデータ点数をnとしたときにそれぞれ以下の式で表される。

同様に2次曲線についても、式(7)を参考に、pTsとpTeの中央点であるpTm、mTsとmTeの中央点であるmTmを求めることができる。
本発明で用いられる1次曲線についてのパラメータとして、加重平均高さvH、平均高さvHa、ピーク幅vB、及び加重平均ピーク幅vWを用いて、ピーク幅に基づく扁平率vAB、vABa、及び加重平均ピーク幅に基づく扁平率vAW、vAWaを下記式(8a)、(8b)、(8c)、(8d)のように定義する。
vAB=vH/vB (8a)
vAW=vH/vW (8b)
vABa=vHa/vB (8c)
vAWa=vHa/vW (8d)
vAB=vH/vB (8a)
vAW=vH/vW (8b)
vABa=vHa/vB (8c)
vAWa=vHa/vW (8d)
また、1次曲線についてのパラメータとして、加重平均時間vT、ピーク幅vB、及び加重平均ピーク幅vWを用いて、ピーク幅に基づく時間率vTB及び加重平均ピーク幅に基づく時間率vTWを下記式(9a)、(9b)のように定義する。
vTB=vT/vB (9a)
vTW=vT/vW (9b)
vTB=vT/vB (9a)
vTW=vT/vW (9b)
なお、扁平率は、vAB=vB/vH、vAW=vW/vHであってもよく、またvABa=vB/vHa、vAWa=vW/vHaであってもよい。すなわち、扁平率は、加重平均高さvT又は平均高さvHaと、ピーク幅vB又はvWとの比であればよい。同様に、時間率は、vTB=vB/vT、vTW=vW/vTであってもよい。すなわち、時間率は、加重平均時間vTとピーク幅vB又はvWとの比であればよい。また、これら比に定数Kを乗じてもよい。すなわち、例えば、扁平率は、vAB=(vH/vB)K、vAB=(vB/vH)K、vAW=(vH/vW)K、又はvAW=(vW/vH)Kであってもよく、又は、vABa=(vHa/vB)K、vABa=(vB/vHa)K、vAWa=(vHa/vW)K、又はvAWa=(vW/vHa)Kであってもよく、時間率は、vTB=(vT/vB)K、vTB=(vB/vT)K、vTW=(vT/vW)K、又はvTW=(vW/vT)Kであってもよい。
また、上記のような扁平率及び時間率は、2次曲線についても求めることができる。例えば、2次曲線のプラスピークについて、pHと、pB又はpWとの比として、ピーク幅に基づく扁平率pAB又は加重平均ピーク幅に基づく扁平率pAWを求めることができ、一方、pTと、pB又はpWとの比として、ピーク幅に基づく時間率pTB又は加重平均ピーク幅に基づく時間率pTWを求めることができる。同様に、2次曲線のマイナスピークについて、mHと、mB又はmWとの比として、ピーク幅に基づく扁平率mAB又は加重平均ピーク幅に基づく扁平率mAWを求めることができ、一方、mTと、mB又はmWとの比として、ピーク幅に基づく時間率mTB又は加重平均ピーク幅に基づく時間率mTWを求めることができる。
以上のような、ピーク幅vB、pB、mB、加重平均ピーク幅vW、pW、mW、平均時間vTa、平均高さvHa、領域始点時間vTs、pTs、mTs、領域終点時間vTe、pTe、mTe、領域中央時間vTm、pTm、mTm、領域時間幅vTr、主ピーク始点時間vNs、pNs、mNs、主ピーク終点時間vNe、pNe、mNe、主ピーク幅vN、pN、mN、扁平率vAB、vAW、vABa、vAWa、pAB、pAW、mAB、mAW、及び時間率vTB、vTW、pTW、pAW、mTB、mTWも1次曲線の演算対象域を特徴付けるパラメータになり得る。
本明細書においては、異なる演算対象域に由来するパラメータを識別するため、各パラメータに、それが由来する演算対象域値Sを付けて表示することがある。例えば、Sがx(%)のときの1次曲線の演算対象域を特徴付けるパラメータは、vHx、vTx、vBx、vWxなどと称されることがある。例えば、Sが10%のときの1次曲線の加重平均点に関係するパラメータvH、vT、vB、vW、vTa、vHa、vTs、vTe、vTm、vTr、vNs、vNe、vN、vAB、vAW、vABa、vAWa、vTB、vTWは、それぞれvH10%、vT10%、vB10%、vW10%、vTa10%、vHa10%、vTs10%、vTe10%、vTm10%、vTr10%、vNs10%、vNe10%、vN10%、vAB10%、vAW10%、vABa10%、vAWa10%、vTB10%、vTW10%と称されることがある。2次曲線の演算対象域を特徴付けるパラメータについても同様である。
図14A及び図14Bは、同一の1次曲線に関して、演算対象域値Sが異なる場合のパラメータを示す。図13Aは、演算対象域値Sが10%の場合を示し、図13Bは、演算対象域値Sが80%の場合を示す。演算対象域値Sが10%の図13Aの場合には、1次曲線の加重平均高さvH10%は0.4であり、加重平均時間vT10%は149秒であり、ピーク幅vB10%は200秒である。これに対して、演算対象域値Sが80%の図13Bの場合には、加重平均高さvH80%は0.72であり、加重平均時間vT80%は119秒であり、ピーク幅vB80%は78秒である。
1.3.3.5.その他
本発明で用いられる該演算対象域を特徴付けるパラメータのさらなる例としては、1次曲線又は2次曲線の演算対象域における曲線下面積(AUC)が挙げられる。2次曲線はプラスピークとマイナスピークを有するため、演算対象域における曲線下面積(AUC)は、プラスピークについての演算対象域におけるAUC(pAUC)とマイナスピークの演算対象域におけるAUC(mAUC)があり得る。本明細書においては、異なる演算対象域に由来するAUCを識別するため、それが由来する演算対象域値Sに従って、AUCxと称することがある。例えば、Sが5%である演算対象域のvAUC、pAUC、及びmAUCは、それぞれvAUC5%、pAUC5%、及びmAUC5%である。
本発明で用いられる該演算対象域を特徴付けるパラメータのさらなる例としては、1次曲線又は2次曲線の演算対象域における曲線下面積(AUC)が挙げられる。2次曲線はプラスピークとマイナスピークを有するため、演算対象域における曲線下面積(AUC)は、プラスピークについての演算対象域におけるAUC(pAUC)とマイナスピークの演算対象域におけるAUC(mAUC)があり得る。本明細書においては、異なる演算対象域に由来するAUCを識別するため、それが由来する演算対象域値Sに従って、AUCxと称することがある。例えば、Sが5%である演算対象域のvAUC、pAUC、及びmAUCは、それぞれvAUC5%、pAUC5%、及びmAUC5%である。
さらに、上述の演算対象域を特徴付けるパラメータ以外のさらなるパラメータが、本発明による凝固因子の活性レベル又は活性異常の判定のためのパラメータに含まれ得る。該パラメータの例としては、最大1次微分値Vmax、最大2次微分値Amax、最小2次微分値Amin、及びそれらに到達する時間を表すVmaxT、AmaxT、AminTなどが挙げられる。
上述した一連のパラメータは、補正処理済み凝固反応曲線(補正0次~2次曲線)由来のパラメータと、補正処理なし凝固反応曲線(未補正0次~2曲線)由来のパラメータとを含み得る。
以上、散乱光量に基づく凝固反応曲線に基づいて、凝固速度又は凝固加速度に関する波形を特徴付けるパラメータについて説明した。一方、他の凝固計測手段(例えば透過光量や吸光度)に基づく凝固反応曲線から同等のパラメータが取得できることは、当業者に明らかである。例えば、透過光量に基づくような逆シグモイド状の凝固反応曲線から得られる1次曲線F(t)は、上述した散乱光量に基づくものに対して正負が逆になる。このような場合に、パラメータの計算においてF(t)の符号が逆転すること、例えば、最大値Vmaxは最小値Vminに置き換えられ、演算対象域はF(t)≦Sを満たす領域であり、vB及びvWがそれぞれt1からt2までのF(t)≦x及びF(t)≦vHとなる時間長であること等は、当業者に明らかである。
1.4.検体の判定
ステップ4で行われる判定の一例について説明する。
ステップ4で行われる判定の一例について説明する。
1.4.1.パラメータ群の作成
上記のとおり、凝固速度又は凝固加速度に関する波形の演算対象域の各々について、該演算対象域を特徴付けるパラメータが抽出される。該演算対象域を特徴付けるパラメータとしては、後述する表Aに示す、1次曲線の加重平均点に関係するパラメータ(加重平均時間vT、加重平均高さvH、平均時間vTa、平均高さvHa、ピーク幅vB、加重平均ピーク幅vW、それらから求められた扁平率vAB、vAW、vABa、vAWa、及び時間率vTB、vTW、ならびにvAUC、vTs、vTe、vTr、vTm、vNs、vNe、vN)、2次曲線の加重平均点に関係するパラメータ(加重平均時間pT、mT、加重平均高さpH、mH、ピーク幅pB、mB、加重平均ピーク幅pW、mW、それらから求められた扁平率pAB、pAW、mAB、mAW及び時間率pTB、pTW、mTB、mTW、ならびにpAUC、mAUC、pNs、pNe、pN、mNs、mNe、mN、pTs、pTe、pTm、mTs、mTe、mTm、)が挙げられる。本発明においては、これらのパラメータのいずれか1つ以上が抽出されればよいが、これらの2つ以上を含むパラメータセットが抽出されてもよい。例えば、該パラメータは、vT、vH、vB、vAB及びvTBからなる群より選択される少なくとも1つであればよいが、これらの2つ以上を含むパラメータセットであってもよい。好ましい一実施形態において、該パラメータは、vT、vH、vB、vAB及びvTBを含むパラメータセットである。別の好ましい一実施形態において、該パラメータは、vB、vAB及びvTBを含むパラメータセットである。別の好ましい一実施形態において、該パラメータは、vB及びvABを含むパラメータセットである。別の好ましい一実施形態において、該パラメータは、pH、pAB、又はvHである。別の好ましい一実施形態において、該パラメータは、pABとpNeのパラメータセット、pTWとvTのパラメータセット、pTBとvABaのパラメータセット、pABとvNsのパラメータセット、又はpTWとvTsとvWのパラメータセットである。但し、本発明の方法で用いられる各演算対象域を特徴付けるパラメータの構成は、これらの実施形態に限定されない。
上記のとおり、凝固速度又は凝固加速度に関する波形の演算対象域の各々について、該演算対象域を特徴付けるパラメータが抽出される。該演算対象域を特徴付けるパラメータとしては、後述する表Aに示す、1次曲線の加重平均点に関係するパラメータ(加重平均時間vT、加重平均高さvH、平均時間vTa、平均高さvHa、ピーク幅vB、加重平均ピーク幅vW、それらから求められた扁平率vAB、vAW、vABa、vAWa、及び時間率vTB、vTW、ならびにvAUC、vTs、vTe、vTr、vTm、vNs、vNe、vN)、2次曲線の加重平均点に関係するパラメータ(加重平均時間pT、mT、加重平均高さpH、mH、ピーク幅pB、mB、加重平均ピーク幅pW、mW、それらから求められた扁平率pAB、pAW、mAB、mAW及び時間率pTB、pTW、mTB、mTW、ならびにpAUC、mAUC、pNs、pNe、pN、mNs、mNe、mN、pTs、pTe、pTm、mTs、mTe、mTm、)が挙げられる。本発明においては、これらのパラメータのいずれか1つ以上が抽出されればよいが、これらの2つ以上を含むパラメータセットが抽出されてもよい。例えば、該パラメータは、vT、vH、vB、vAB及びvTBからなる群より選択される少なくとも1つであればよいが、これらの2つ以上を含むパラメータセットであってもよい。好ましい一実施形態において、該パラメータは、vT、vH、vB、vAB及びvTBを含むパラメータセットである。別の好ましい一実施形態において、該パラメータは、vB、vAB及びvTBを含むパラメータセットである。別の好ましい一実施形態において、該パラメータは、vB及びvABを含むパラメータセットである。別の好ましい一実施形態において、該パラメータは、pH、pAB、又はvHである。別の好ましい一実施形態において、該パラメータは、pABとpNeのパラメータセット、pTWとvTのパラメータセット、pTBとvABaのパラメータセット、pABとvNsのパラメータセット、又はpTWとvTsとvWのパラメータセットである。但し、本発明の方法で用いられる各演算対象域を特徴付けるパラメータの構成は、これらの実施形態に限定されない。
好ましくは、本発明の方法において被検検体の判定に用いられる複数のパラメータ(パラメータ群)は、1つの波形の複数の演算対象域をそれぞれ特徴付ける複数のパラメータを含む。いいかえると、該パラメータ群は、1つの波形の複数の演算対象域からそれぞれ抽出された、複数のパラメータの集合である。好ましくは、該パラメータ群は、1つの波形(1次曲線又は2次曲線)の異なる演算対象域から抽出された同種のパラメータのセットを1つ以上含む。例えば、演算対象域がL個抽出されており、採用するパラメータがvHxである場合、該パラメータ群は、L個のvHxから構成される。例えば、10個の演算対象域値S(5%、10%、20%、30%、40%、50%、60%、70%、80%、及び90%)に基づく10個の演算対象域が抽出され、各演算対象域からパラメータvHxを抽出した場合、パラメータ群は10個のvHxの集合[vH5%, vH10%, vH20%, vH30%, vH40%, vH50%, vH60%, vH70%, vH80%, vH90%]である。また例えば、5個の演算対象域値S(5%、20%、40%、60%及び80%)に基づく5個の演算対象域が抽出され、各演算対象域からパラメータvHxを抽出した場合、パラメータ群は5個のvHxの集合[vH5%, vH20%, vH40%, vH60%, vH80%]である。同様に、演算対象域がM個抽出されており、採用するパラメータがvBx、vABx及びvTBxである場合、該パラメータ群は、Mセット分の[vBx, vABx, vTBx]から構成される。あるいは、演算対象域がN個抽出されており、採用するパラメータがvTx、vHx、vBx、vABx及びvTBxである場合、該パラメータ群は、Nセット分の[vTx, vHx, vBx, vABx, vTBx]から構成される。
さらに、該演算対象域をそれぞれ特徴付ける複数のパラメータと、その他のパラメータを組み合わせてもよい。例えば、後述する表Aに示す最大1次微分値Vmax、最大2次微分値Amax、最小2次微分値Amin、及びそれらに到達する時間を表すVmaxT、AmaxT、AminTからなる群より選択される少なくとも1つを、上記の演算対象域を特徴付ける複数のパラメータと組み合わせてもよい。
1.4.2.標的血液凝固時間延長要因成分
本発明の方法で活性レベル又は活性異常が判定される標的の血液凝固時間延長要因成分としては、血液凝固時間の延長をもたらす内因性又は外因性の任意の凝固反応関与成分が挙げられる。好ましくは、該標的の血液凝固時間延長要因成分は凝固因子である。該凝固因子は、好ましくはFVIII及びFIXを含む凝固因子から選択される少なくとも1種であり、より好ましくは少なくともFVIIIである。FVIIIとFIXを共に標的としてもよい。
本発明の方法で活性レベル又は活性異常が判定される標的の血液凝固時間延長要因成分としては、血液凝固時間の延長をもたらす内因性又は外因性の任意の凝固反応関与成分が挙げられる。好ましくは、該標的の血液凝固時間延長要因成分は凝固因子である。該凝固因子は、好ましくはFVIII及びFIXを含む凝固因子から選択される少なくとも1種であり、より好ましくは少なくともFVIIIである。FVIIIとFIXを共に標的としてもよい。
1.4.3.テンプレート検体
本発明の方法では、上述した被検検体の凝固速度又は凝固加速度に関する波形の複数の演算対象域からそれぞれ抽出された複数のパラメータを含むパラメータ群(以下、被検パラメータ群という)を、テンプレート血液検体(以下、単にテンプレート検体とも称する)についての対応するパラメータ群(本明細書において、テンプレートパラメータ群とも称する)と比較する。該比較の結果に基づいて、被検検体の凝固特性、好ましくは被検検体における血液凝固時間延長要因成分の活性レベル又は活性異常が判定される。好ましくは、本発明では、1つ以上のテンプレート検体が準備される。該テンプレート検体は、本発明の方法における標的の血液凝固時間延長要因成分の活性レベル又は活性異常の有無が既知の血液検体である。
本発明の方法では、上述した被検検体の凝固速度又は凝固加速度に関する波形の複数の演算対象域からそれぞれ抽出された複数のパラメータを含むパラメータ群(以下、被検パラメータ群という)を、テンプレート血液検体(以下、単にテンプレート検体とも称する)についての対応するパラメータ群(本明細書において、テンプレートパラメータ群とも称する)と比較する。該比較の結果に基づいて、被検検体の凝固特性、好ましくは被検検体における血液凝固時間延長要因成分の活性レベル又は活性異常が判定される。好ましくは、本発明では、1つ以上のテンプレート検体が準備される。該テンプレート検体は、本発明の方法における標的の血液凝固時間延長要因成分の活性レベル又は活性異常の有無が既知の血液検体である。
例えば、FVIIIについて評価する場合、該1つ以上のテンプレート検体は、FVIIIの活性レベルが異常でない血液検体(FVIII正常検体)を1つ以上と、FVIIIの活性レベルが異常である血液検体(FVIII異常検体、例えばFVIII欠乏検体)を1つ以上含む。例えば、FIXについて評価する場合、該1つ以上のテンプレート検体は、FIXの活性レベルが異常でない血液検体(FIX正常検体)を1つ以上と、FIXの活性レベルが異常である血液検体(FIX異常検体、例えばFIX欠乏検体)を1つ以上含む。例えば、FVIII及びFIXについて評価する場合、該1つ以上のテンプレート検体は、FVIIIもFIXも活性レベルが異常でない血液検体(FVIII/FIX正常検体)を1つ以上と、FVIIIの活性レベルが異常である血液検体(FVIII異常検体、例えばFVIII欠乏検体)を1つ以上と、FIXの活性レベルが異常である血液検体(FIX異常検体、例えばFIX欠乏検体)を1つ以上とを含む。
好ましくは、該FVIII異常検体は、重症、中等症及び軽症の血友病A患者由来の血液検体を含む。好ましくは、該重症、中等症及び軽症の血友病A患者由来の血液検体は、それぞれ、FVIII活性が、1%未満、1%以上5%未満、及び5%以上40%未満(正常者の活性を100%としたときの値、以下同じ)である血液検体である。より詳細な解析を求める場合、必要に応じて、FVIII活性レベルが異なる重症血友病A患者由来の検体を複数準備してもよい。例えば、FVIII活性が0.2%以上1%未満のModestly-Severe Haemophilia A(MS-HA)患者由来の検体と、FVIII活性が0.2%未満のVery-Severe Haemophilia A(VS-HA)患者由来の検体を準備してもよい。近年、重症血友病A患者の中でも特にFVIII活性が低いVS-HAの患者(FVIII活性0.2%未満)と、そうでないMS-HAの患者(FVIII活性0.2%以上1%未満)では、臨床的な重症度に差があることが報告されている(松本 智子,嶋 緑倫,凝固波形解析と第VIII因子微量測定への応用,2003年,14巻2号,p.122-127)。VS-HAの患者を鑑別することは、患者に適切な治療を施すために有用である。
同様に、該FIX異常検体は、好ましくは重症、中等症及び軽症の血友病B患者由来の血液検体を含む。好ましくは、該重症、中等症及び軽症の血友病B患者由来の検体は、それぞれ、FIX活性が1%未満、1%以上5%未満、及び5%以上40%未満(正常者の活性を100%としたときの値、以下同じ)である検体である。より詳細な解析を実施する場合、必要に応じて、FIX活性レベルが異なる重症血友病B患者由来の検体を複数準備してもよい。例えば、FIX活性が0.2%以上1%未満の検体と、FIX活性が0.2%未満の検体を準備してもよい。
1.4.4.回帰分析
本発明の方法においては、被検パラメータ群と、各テンプレート検体由来のテンプレートパラメータ群それぞれとの間で、対応するパラメータの回帰分析を行う。
本発明の方法においては、被検パラメータ群と、各テンプレート検体由来のテンプレートパラメータ群それぞれとの間で、対応するパラメータの回帰分析を行う。
回帰分析に用いられるテンプレートパラメータ群は、各テンプレート検体に対して上記1.3.で述べたデータ解析を行うことによって得られたものである。このデータ解析において、抽出する演算対象域の数、及び複数の演算対象域の抽出に用いる一連の演算対象域値Sは、被検検体のデータ解析と同じ値に設定する。またテンプレートパラメータ群に含まれるパラメータの種類は、被検パラメータ群と同様にする。例えば、被検パラメータ群がL個のvHxであれば、テンプレート検体についてのテンプレートパラメータ群もL個のvHxである。また例えば、被検パラメータ群がMセット分の[vBx, vABx, vTBx]であれば、テンプレート検体についてのテンプレートパラメータ群もMセット分の[vBx, vABx, vTBx]である。また例えば、被検パラメータ群がNセット分の[vTx, vHx, vBx, vABx, vTBx]であれば、テンプレート検体についてのテンプレートパラメータ群もNセット分の[vTx, vHx, vBx, vABx, vTBx]である。したがって、テンプレートパラメータ群は、被検パラメータ群に対応する、テンプレート検体についてのパラメータ群である。すなわち、各テンプレートパラメータ群に含まれる個々のパラメータは、被検パラメータ群に含まれる個々のパラメータと相互に対応する。なお本明細書において、テンプレートパラメータ群のパラメータが、被検パラメータ群のパラメータと対応する場合、該テンプレートパラメータ群のパラメータと、該被検パラメータ群のパラメータは同じ種類のパラメータである。例えば、被検パラメータ群のvTx、vHx、vBx、vABx及びvTBxと、テンプレートパラメータ群のvTx、vHx、vBx、vABx及びvTBx(xは所定値)は、それぞれ対応する。被検パラメータ群の全てのパラメータと各々対応するパラメータからなるテンプレートパラメータ群は、該被検パラメータ群に対応している。
該テンプレートパラメータ群は、予め取得しておくことが望ましい。また、各テンプレートパラメータ群は、複数のテンプレート検体から得たパラメータ群を加工して得られた合成パラメータ群であってもよい。例えば、標的血液凝固時間延長要因成分の活性レベルが同等である複数のテンプレート検体についてパラメータ群を取得し、それらを統計処理することによって、標準テンプレート検体を表す合成パラメータ群を1つ以上作成してもよい。
回帰分析の手法は、特に限定されず、例えば最小二乗法による直線回帰が挙げられる。例えば、被検パラメータ群中の各パラメータの値をy軸とし、いずれか1つのテンプレートパラメータ群中の対応するパラメータの値をx軸としてプロットし、回帰直線を求める。該回帰直線の傾き、切片や相関性(相関係数、決定係数等)などに基づいて被検パラメータ群と、各テンプレートパラメータ群との相関性を調べる。被検パラメータ群とテンプレートパラメータ群との相関性は、被検検体と、該テンプレートパラメータ群が由来するテンプレート検体との間での凝固特性の相関性(近似状態)を反映する。
1.4.5.血液凝固特性の判定
次いで、回帰分析の結果に基づいて、被検検体における凝固特性を判定する。好ましくは、該凝固特性の判定は、標的の血液凝固時間延長要因成分の活性レベル、又はその活性異常についての判定である。以下、標的の血液凝固時間延長要因成分がFVIIIである場合を例にして、判定の手順を説明する。FIX等の他の因子についても同様の手順による判定を行えばよい。
次いで、回帰分析の結果に基づいて、被検検体における凝固特性を判定する。好ましくは、該凝固特性の判定は、標的の血液凝固時間延長要因成分の活性レベル、又はその活性異常についての判定である。以下、標的の血液凝固時間延長要因成分がFVIIIである場合を例にして、判定の手順を説明する。FIX等の他の因子についても同様の手順による判定を行えばよい。
上記回帰分析で求めた被検検体と1つ以上のテンプレート検体との相関性に基づいて、被検検体のFVIII活性レベルや、活性異常(欠乏等)を判定する。好ましくは、該相関性は、回帰直線の相関性(例えば傾き、切片、相関係数、決定係数等)である。
該相関性に基づく被検検体のFVIII活性レベル又は活性異常の判定の一実施形態について、以下に説明する。テンプレート検体は、1つ以上のFVIII正常検体と、FVIII活性レベルが様々に異なる1つ以上のFVIII異常検体とを含む。好ましくは、テンプレート検体は、1つ以上のFVIII正常検体と、重症(必要に応じてVS-HA及びMS-HA)、中等症及び軽症の血友病A患者由来のFVIII異常検体をそれぞれ1つ以上含む。回帰分析に用いた全てのテンプレート検体の中から、被検パラメータ群とテンプレートパラメータ群との相関性が所定の条件を満たす、少なくとも1つの検体を選出する。
一実施形態においては、当該相関性が予め設定した閾値以上であるテンプレート検体が選出される。別の一実施形態においては、当該相関性が予め設定した閾値以上であり、且つ当該相関性が最も高いテンプレート検体が選出される。別の一実施形態においては、被検パラメータ群とテンプレートパラメータ群との回帰直線の傾きが所定範囲内(例えば0.70以上1.30以下、好ましくは0.75以上1.25以下、より好ましくは0.80以上1.20以下、さらに好ましくは0.85以上1.15以下、さらに好ましくは0.87以上1.13以下)であるテンプレート検体が選出される。別の一実施形態においては、被検パラメータ群とテンプレートパラメータ群との回帰直線の傾きが上記所定範囲内であり、且つ該回帰直線の相関係数が所定値以上(例えば0.75より大きい、好ましくは0.80より大きい、より好ましくは0.85より大きい、さらに好ましくは0.90より大きい)であるテンプレート検体が選出される。一方、該所定の条件を満たすテンプレート検体が選出されなかった場合は、該所定の条件を変更して再度テンプレート検体の選出を行ってもよく、あるいは「テンプレート検体選出なし」と評価してもよい。
好ましい一実施形態においては、当該回帰直線の傾きが所定範囲内(例えば0.70以上1.30以下、好ましくは0.75以上1.25以下、より好ましくは0.80以上1.20以下、さらに好ましくは0.85以上1.15以下、さらに好ましくは0.87以上1.13以下)であるテンプレート検体が選出される。好ましくは該回帰直線の傾きが上記所定範囲内であり、且つ該回帰直線の相関係数が所定値以上(例えば0.75より大きい、好ましくは0.80より大きい、より好ましくは0.85より大きい、さらに好ましくは0.90より大きい)であるテンプレート検体が選出される。選出されたテンプレート検体の中から、該回帰の相関係数が最も高いテンプレート検体が選出される。該所定の条件を満たすテンプレート検体が複数選出された場合は、その中から、さらなる基準に基づいて1つのテンプレート検体を選出してもよい。
次いで、該選出されたテンプレート検体におけるFVIIIの状態(すなわち、FVIIIの活性レベル又は活性異常)を、該被検検体におけるFVIIIの状態と判定する。複数のテンプレート検体が選出された場合は、被検検体におけるFVIIIの状態が、該複数のテンプレート検体における状態のいずれかに相当すると判定してもよく、又は、該複数のテンプレート検体についての平均的な状態を、被検検体におけるFVIIIの状態と判定してもよい。
例えば、選出されたテンプレート検体がFVIII正常検体であれば、該被検検体におけるFVIIIの状態は異常なしと判定され得、一方、選出されたテンプレート検体がFVIII異常検体であれば、該被検検体はFVIII活性の異常を有すると判定され得る。また例えば、選出されたテンプレート検体が重症、中等症、及び軽症の血友病A患者由来の検体であれば、該被検検体はそれぞれ、重症、中等症、及び軽症の血友病Aであると判定され得る。さらに、テンプレート検体がVS-HA及びMS-HAの重症血友病A患者由来の検体を含む場合に、VS-HA又はMS-HA患者由来のテンプレート検体が選出されれば、該被検検体はVS-HA又はMS-HAであると判定され得る。あるいは、該被検検体におけるFVIII活性レベルを判定する場合、選出されたテンプレート検体のFVIII活性レベルが、該被検検体におけるFVIII活性レベルとして判定され得る。
一方、テンプレート検体が重症、中等症及び軽症の血友病A患者由来の検体を含み、且つ上記相関性の評価で「テンプレート検体選出なし」であれば、該被検検体は「FVIII活性異常を有さない」、又は被検検体の「血液凝固時間の延長要因がFVIII活性異常によるものではない」と判定され得る。
別の好ましい一実施形態においては、当該回帰直線の傾きが所定範囲内(例えば0.70以上1.30以下、好ましくは0.75以上1.25以下、より好ましくは0.80以上1.20以下、さらに好ましくは0.85以上1.15以下、さらに好ましくは0.87以上1.13以下)であるテンプレート検体が全て選出される。好ましくは該回帰直線の傾きが上記所定範囲内であり、且つ該回帰直線の相関係数が所定値以上(例えば0.75より大きい、好ましくは0.80より大きい、より好ましくは0.85より大きい、さらに好ましくは0.90より大きい)であるテンプレート検体が全て選出される。選出されたテンプレート検体の間で最も高頻度に見出されるFVIIIの状態(すなわち、FVIIIの活性レベル又は活性異常)を、該被検検体におけるFVIIIの状態と判定する。
例えば、選出されたテンプレート検体のなかでFVIII正常検体の数が最も多ければ、該被検検体におけるFVIIIの状態は異常なしと判定され得る。一方、選出されたテンプレート検体のなかでFVIII異常検体の数が最も多ければ、該被検検体はFVIII活性の異常を有すると判定され得る。また例えば、選出されたテンプレート検体のなかで重症、中等症、及び軽症の血友病A患者由来の検体が最も多いとき、該被検検体はそれぞれ、重症、中等症、及び軽症の血友病Aであると判定され得る。また例えば、選出されたテンプレート検体のなかでVS-HA及びMS-HAの重症血友病A患者由来の検体が最も多いとき、該被検検体はそれぞれ、VS-HA及びMS-HAであると判定され得る。また例えば、選出されたテンプレート検体のなかでFVIII異常でない血液凝固時間延長検体が最も多いとき、該被検検体は、血友病A患者(重症、中等症、及び軽症)以外の異常検体と判定され得る。あるいは、該被検検体におけるFVIII活性レベルを判定する場合、選出されたテンプレート検体の中で最も高頻度に見出されるFVIII活性レベルが、該被検検体におけるFVIII活性レベルとして判定され得る。
例えば、選出されたテンプレート検体のなかでFVIII正常検体の数が最も多ければ、該被検検体におけるFVIIIの状態は異常なしと判定され得る。一方、選出されたテンプレート検体のなかでFVIII異常検体の数が最も多ければ、該被検検体はFVIII活性の異常を有すると判定され得る。また例えば、選出されたテンプレート検体のなかで重症、中等症、及び軽症の血友病A患者由来の検体が最も多いとき、該被検検体はそれぞれ、重症、中等症、及び軽症の血友病Aであると判定され得る。また例えば、選出されたテンプレート検体のなかでVS-HA及びMS-HAの重症血友病A患者由来の検体が最も多いとき、該被検検体はそれぞれ、VS-HA及びMS-HAであると判定され得る。また例えば、選出されたテンプレート検体のなかでFVIII異常でない血液凝固時間延長検体が最も多いとき、該被検検体は、血友病A患者(重症、中等症、及び軽症)以外の異常検体と判定され得る。あるいは、該被検検体におけるFVIII活性レベルを判定する場合、選出されたテンプレート検体の中で最も高頻度に見出されるFVIII活性レベルが、該被検検体におけるFVIII活性レベルとして判定され得る。
別の好ましい一実施形態においては、当該回帰直線の傾きが所定範囲内(例えば0.70以上1.30以下、好ましくは0.75以上1.25以下、より好ましくは0.80以上1.20以下、さらに好ましくは0.85以上1.15以下、さらに好ましくは0.87以上1.13以下)であるテンプレート検体が全て選出される。好ましくは該回帰直線の傾きが上記の所定範囲内であり、且つ該回帰直線の相関係数が所定値以上(例えば0.75より大きい、好ましくは0.80より大きい、より好ましくは0.85より大きい、さらに好ましくは0.90より大きい)であるテンプレート検体が全て選出される。
選出されたテンプレート検体を、FVIII活性レベルに従って、FVIII活性の低い血友病A患者(重症、中等症、及び軽症)由来の検体と、それ以外の検体に分ける。前者の数が後者の数より多い場合、前者の検体のなかで最も多く見られる重症度(重症、中等症、及び軽症のいずれか)を、該被検検体の状態と判定する。異なる重症度の検体が同数存在する場合には、より重症な方を該被検検体の状態と判定してもよく、又は該所定の条件を変更して再度テンプレート検体の選出を行ってもよい。一方、後者の数が前者の数より多い場合、該被検検体は血友病A患者(重症、中等症、及び軽症)以外のものと判定される。
選出されたテンプレート検体を、FVIII活性レベルに従って、FVIII活性の低い血友病A患者(重症、中等症、及び軽症)由来の検体と、それ以外の検体に分ける。前者の数が後者の数より多い場合、前者の検体のなかで最も多く見られる重症度(重症、中等症、及び軽症のいずれか)を、該被検検体の状態と判定する。異なる重症度の検体が同数存在する場合には、より重症な方を該被検検体の状態と判定してもよく、又は該所定の条件を変更して再度テンプレート検体の選出を行ってもよい。一方、後者の数が前者の数より多い場合、該被検検体は血友病A患者(重症、中等症、及び軽症)以外のものと判定される。
上述のように、本発明の方法により、被検検体におけるFVIII活性レベル、又はその活性異常の有無が判定され得る。別の実施形態において、被検検体におけるFVIIIの活性異常の有無が判定され、該判定は、該被検検体が血友病A患者の検体であるか否かの判定についての情報を提供する。別の実施形態においては、被検検体におけるFVIII活性レベルが判定され、該判定は、該被検検体を提供した患者における血友病Aの重症度の判定についての情報を提供する。したがって、本発明の血液検体の分析方法の一実施形態は、血友病Aの判定、血友病Aの重症度、例えば重症(必要に応じてVS-HA及びMS-HA)、中等症及び軽症の判定等のための方法であり得る。
一実施形態において、被検検体に対して、上述したFVIIIについての判定に加えて、他の血液凝固時間延長要因成分についての判定を行ってもよい。好ましくは、当該他の血液凝固時間延長要因成分は、FIXである。例えば、上述したFVIIIについての判定において「血液凝固時間の延長要因がFVIII活性異常によるものではない」又は「血友病A患者(重症、中等症、及び軽症)以外」と判定された被検検体について、FIXの活性レベル、又はその活性異常の有無を判定してもよい。FIXの活性レベル、又はその活性異常の有無の判定の手順は、上述したFVIIIについての判定手順と同様の手順で実施することができる。該FIXについての判定に用いるテンプレート検体は、FVIIIについての評価で用いたものと同じであっても異なっていてもよい。また該FIXについての判定に用いる被検パラメータ群及びテンプレートパラメータ群は、FVIIIについての判定で用いたものと同じであっても異なっていてもよい。本実施形態の一例においては、被検検体におけるFIXの活性異常の有無が判定され、該判定は、該被検検体が血友病B患者の検体であるか否かの判定についての情報を提供する。本実施形態の別の一例においては、被検検体におけるFIX活性レベルが判定され、該判定は、該被検検体を提供した患者における血友病Bの重症度の判定についての情報を提供する。本実施形態は、血友病Bの判定、血友病Bの重症度の(例えば重症、中等症及び軽症の)判定を可能にする。さらに、上述したFVIIIについての評価とFIXについての評価とを組み合わせることで、より包括的に被検検体における凝固特性を分析することができる。
2.本発明の方法のためのプログラム及び装置
上述の本発明の血液検体の分析方法は、コンピュータプログラムを用いて自動的に行われ得る。したがって、本発明の一態様は、上述の本発明の血液検体の分析方法を行うためのプログラムである。また、被検検体からの試料の調製及び凝固時間の測定も含め、上述した本発明の方法の一連の工程は、自動分析装置によって自動的に行われ得る。したがって、本発明の一態様は、上述の本発明の血液検体の分析方法を行うための装置である。
上述の本発明の血液検体の分析方法は、コンピュータプログラムを用いて自動的に行われ得る。したがって、本発明の一態様は、上述の本発明の血液検体の分析方法を行うためのプログラムである。また、被検検体からの試料の調製及び凝固時間の測定も含め、上述した本発明の方法の一連の工程は、自動分析装置によって自動的に行われ得る。したがって、本発明の一態様は、上述の本発明の血液検体の分析方法を行うための装置である。
本発明の装置の一実施形態について、以下に説明する。本発明の装置の一実施形態は、図15に示すような自動分析装置1である。自動分析装置1は、制御ユニット10と、操作ユニット20と、測定ユニット30と、出力ユニット40とを備える。
制御ユニット10は、自動分析装置1の全体の動作を制御する。制御ユニット10は、例えばパーソナルコンピュータ(PC)によって構成され得る。制御ユニット10は、CPU、メモリ、ストレージ、通信インターフェース(I/F)などを備え、操作ユニット20からのコマンドの処理、測定ユニット30の動作の制御、測定ユニット30から受けた測定データの保存やデータ分析、分析結果の保存、出力ユニット40による測定データや分析結果の出力の制御、などを行う。さらに制御ユニット10は、外部メディア、ホストコンピュータなどの他の機器と接続されてもよい。なお、制御ユニット10において、測定ユニット30の動作を制御するPCと、計測データの分析を行うPCとは、同一であっても、異なっていてもよい。
操作ユニット20は、操作者からの入力を取得し、得られた入力情報を制御ユニット10へと伝達する。例えば、操作ユニット20は、キーボード、タッチパネル等のユーザーインターフェース(UI)を備える。出力ユニット40は、制御ユニット10の制御下で、測定ユニット30の計測データや、該データの分析結果を出力する。例えば、出力ユニット40は、ディスプレイ等の表示装置を備える。
測定ユニット30は、血液凝固検査のための一連の操作を実行し、血液検体を含む試料の凝固反応の計測データを取得する。測定ユニット30は、血液凝固検査に必要な各種の器材や分析モジュール、例えば、血液検体を収める検体容器、検査用試薬を収める試薬容器、検体と試薬との反応のための反応容器、血液検体及び試薬を反応容器に分注するためのプローブ、光源、反応容器内の試料からの散乱光又は透過光を検出するための検出器、検出器からのデータを制御ユニット10に送るデータ処理回路、制御ユニット10の指令を受けて測定ユニット30の操作を制御する制御回路、などを備える。
制御ユニット10は、測定ユニット30が計測したデータに基づいて、検体の凝固特性の分析を行う。本分析には、上述した凝固反応曲線や凝固速度又は凝固加速度に関する波形の取得、被検検体についてのパラメータ群の抽出、テンプレート検体についてのテンプレートパラメータ群の抽出、それらのパラメータ群の回帰分析、及び回帰分析の結果に基づく被検検体における標的の血液凝固時間延長要因成分の活性レベル又は活性異常についての判定、などが含まれ得る。本分析は、本発明の方法を行うためのプログラムによって実施され得る。したがって、制御ユニット10は、本発明の方法を行うためのプログラムを備え得る。
上述の制御ユニット10での分析において、該分析に用いる凝固反応曲線や凝固速度又は凝固加速度に関する波形は、測定ユニット30からの計測データに基づいて制御ユニット10で作成されてもよく、又は、別の機器、例えば測定ユニット30で作成し、制御ユニット10に送られてもよい。あるいは、測定ユニット30で凝固反応曲線が作成されて制御ユニット10に送られ、制御ユニット10で凝固速度又は凝固加速度に関する波形が作成されてもよい。テンプレート検体についてのテンプレートパラメータ群のデータは、予めテンプレート検体を測定ユニット30で測定し、得られた計測データを制御ユニット10で解析することによって作成されてもよく、又は外部から取り込んでもよい。テンプレートパラメータ群のデータは、制御ユニット10のメモリや外部機器に保存しておくことができる。回帰分析の手法や、回帰分析の結果に基づく被検検体の凝固特性の分析のための判定基準は、本発明のプログラムによって制御され得る。
制御ユニット10での分析結果は、出力ユニット40に送られ、出力される。出力は、画面への表示、ホストコンピュータへの送信、印刷など、任意の形態をとり得る。出力ユニットからの出力情報は、被検検体における標的の血液凝固時間延長要因成分についての判定結果(例えば、FVIII活性レベル、血友病A又はその重症度の判定結果、等)を含み、且つ所望により、被検検体とテンプレート検体との回帰分析の結果(例えば回帰直線式や相関性)、被検検体やテンプレート検体の凝固反応曲線や凝固速度又は凝固加速度に関する波形、などのさらなる情報を含んでいてもよい。出力ユニットからの出力情報の種類は、本発明のプログラムによって制御され得る。
一実施形態において、本発明の方法を行うためのプログラムを備えていること以外は、自動分析装置1は、APTT、PT等の血液凝固時間の測定に従来使用されているような、一般的な血液凝固検査用の自動分析装置の構成をとり得る。
以下、実施例により本発明を詳細に説明するが、本発明は以下の実施例に限定されるものではない。
以下の実施例に用いられるパラメータは、特に言及しない限り、補正0次~2次曲線由来のパラメータを表す。一方、未補正0次~2次曲線由来のパラメータは、各パラメータの名称の頭にRを付けて表される。例えば、補正1次曲線の加重平均高さがvHであるとき、未補正1次曲線の加重平均高さはRvHで表され、補正2次曲線の加重平均高さがpHであるとき、未補正2次曲線の加重平均高さはRpHで表される。パラメータの一覧を下記の表Aに示す。

実施例1 被検パラメータの算出
(1)方法
測定用試薬として、APTT測定用試薬であるコアグピアAPTT-N(積水メディカル株式会社製)を、塩化カルシウム液として、コアグピアAPTT-N 塩化カルシウム液(積水メディカル株式会社製)を用いた。検体を含む試料の凝固反応計測は、血液凝固自動分析装置CP3000(積水メディカル株式会社製)を用いて行った。キュベット内にて37℃で45秒間加温した検体50μLに、約37℃の測定用試薬50μLを添加し、さらに171秒経過後に25mM塩化カルシウム液50μLを添加して凝固反応を開始させた。反応は37℃で行った。凝固反応の測定では、キュベットにLEDを光源とする波長660nmの光を照射し、0.1秒間隔で90度側方散乱光の散乱光量を計測した。計測時間は360秒間とした。得られた経時的計測データから、凝固反応曲線を得た。
(2)被検血液検体
34検体(血漿)を分析した。該34検体は、24件のFVIII欠乏検体(重症(FVIII<1%)13件、中等症(FVIII=1-5%)8件、軽症(FVIII=5-40%)3件)、及び10件のVIII欠乏検体以外の検体(Other)を含んでいた。(1)の手順に従って、各検体についての凝固反応曲線を得た。
34検体(血漿)を分析した。該34検体は、24件のFVIII欠乏検体(重症(FVIII<1%)13件、中等症(FVIII=1-5%)8件、軽症(FVIII=5-40%)3件)、及び10件のVIII欠乏検体以外の検体(Other)を含んでいた。(1)の手順に従って、各検体についての凝固反応曲線を得た。
(3)テンプレート検体
分析に用いたテンプレート検体の構成を表1に示す。FVIII活性が異なる43検体、及びFVIII活性は正常であるが他の要因によって血液凝固時間が延長する88検体を調製した。前者43検体のFVIII活性は、血友病A重症(FVIII<1%)、中等症(FVIII=1-5%)、及び軽症(FVIII=5-40%)、ならびにその他(FVIII>40%はOther)のいずれかに属している。後者88検体は、FVIII活性が異常ではないため、表1の分類では「Other」に属する。これらの計131検体をテンプレート検体として分析に用い、(1)の手順に従って、各検体についての凝固反応曲線を得た。
分析に用いたテンプレート検体の構成を表1に示す。FVIII活性が異なる43検体、及びFVIII活性は正常であるが他の要因によって血液凝固時間が延長する88検体を調製した。前者43検体のFVIII活性は、血友病A重症(FVIII<1%)、中等症(FVIII=1-5%)、及び軽症(FVIII=5-40%)、ならびにその他(FVIII>40%はOther)のいずれかに属している。後者88検体は、FVIII活性が異常ではないため、表1の分類では「Other」に属する。これらの計131検体をテンプレート検体として分析に用い、(1)の手順に従って、各検体についての凝固反応曲線を得た。

(4)データ解析
(4-1)1次曲線の算出
(2)で得られた被検検体由来の凝固反応曲線から補正1次曲線を算出した。まず、凝固反応曲線に対して前処理を行った。すなわち、凝固反応曲線に対してノイズ除去を含む平滑化処理を行い、測定開始時点の散乱光量が0となるように調整した。続いて、凝固反応曲線の最大高さが100となるように補正し、得られた補正凝固反応曲線(補正0次曲線)を一次微分して、補正1次曲線を算出した。
(4-1)1次曲線の算出
(2)で得られた被検検体由来の凝固反応曲線から補正1次曲線を算出した。まず、凝固反応曲線に対して前処理を行った。すなわち、凝固反応曲線に対してノイズ除去を含む平滑化処理を行い、測定開始時点の散乱光量が0となるように調整した。続いて、凝固反応曲線の最大高さが100となるように補正し、得られた補正凝固反応曲線(補正0次曲線)を一次微分して、補正1次曲線を算出した。
(4-2)被検パラメータ群の作成
(パラメータ群A)
得られた補正1次曲線から、10個の演算対象域を抽出した。演算対象域値Sは、補正1次曲線の最大高さ値Vmax(100%)に対して、5%、10%、20%、30%、40%、50%、60%、70%、80%、及び90%にそれぞれ設定した。各Sでの演算対象域について、ピーク幅vB、ならびに上記式(2)、(3)及び(4)を用いて加重平均時間vT及び加重平均高さvHを算出した。求めたvT及びvHから、下記式により扁平率vAB及び時間率vTBを算出した。
vAB=(vH/vB)K1(K1=100)
vTB=(vT/vB)K2(K2=1)
以上の手順で、10個の演算対象域(S=5%、10%、20%、30%、40%、50%、60%、70%、80%及び90%)についてのパラメータ:vB [vB5%, vB10%, vB20%, vB30%, vB40%, vB50%, vB60%, vB70%, vB80%, vB90%]、vT [vT5%, vT10%, vT20%, vT30%, vT40%, vT50%, vT60%, vT70%, vT80%, vT90%]、vH [vH5%, vH10%, vH20%, vH30%, vH40%, vH50%, vH60%, vH70%, vH80%, vH90%]、vAB [vAB5%, vAB10%, vAB20%, vAB30%, vAB40%, vAB50%, vAB60%, vAB70%, vAB80%, vAB90%]、及びvTB [vTB5%, vTB10%, vTB20%, vTB30%, vTB40%, vTB50%, vTB60%, vTB70%, vTB80%, vTB90%]を算出した。
算出した被検検体についてのパラメータを組み合わせて、以下のとおり被検パラメータ群を作成した:
(パラメータ群A-1)vB [vB5%, vB10%, …, vB90%]、vT [vT5%, vT10%, …, vT90%]、vH [vH5%, vH10%, …, vH90%]、vAB [vAB5%, vAB10%, …, vAB90%]、及びvTB [vTB5%, vTB10%, …, vTB90%]の50パラメータからなるパラメータ群;
(パラメータ群A-2)vB [vB5%, vB10%, …, vB90%]、vAB [vAB5%, vAB10%, …, vAB90%]、及びvTB [vTB5%, vTB10%, …, vTB90%]の30パラメータからなるパラメータ群;
(パラメータ群A-3)vB [vB5%, vB10%, …, vB90%]及びvAB [vAB5%, vAB10%, …, vAB90%]の20パラメータからなるパラメータ群。
比較のため、補正0次曲線を1回微分して得られる曲線の最大値(Vmax)とそれに到達するまでの時間(VmaxT)、2回微分して得られる曲線の最大値(Amax)とそれに到達するまでの時間(AmaxT)を算出した。これらは、従来の凝固反応曲線についての波形解析に使用されていたパラメータに準じるパラメータである(特許文献1及び2参照)。これらの従来パラメータを加えて、さらに以下のとおり被検パラメータ群を作成した:
(パラメータ群A-4)パラメータA-1に、Vmax、Amax、VmaxT及びAmaxTを追加した54パラメータからなるパラメータ群;
(比較パラメータ群1)Vmax、Amax、VmaxT及びAmaxTの4パラメータからなるパラメータ群。
(パラメータ群A-4)パラメータA-1に、Vmax、Amax、VmaxT及びAmaxTを追加した54パラメータからなるパラメータ群;
(比較パラメータ群1)Vmax、Amax、VmaxT及びAmaxTの4パラメータからなるパラメータ群。
(パラメータ群B)
さらに、5個の演算対象域(S=5%、20%、40%、60%及び80%)についてのvB、vT、vH、vAB及びvTBを用いて、以下のとおり被検パラメータ群を作成した:
(パラメータ群B-1)vB [vB5%, vB20%, vB40%, vB60%, vB80%]、vT [vT5%, vT20%, vT40%, vT60%, vT80%]、vH [vH5%, vH20%, vH40%, vH60%, vH80%]、vAB [vAB5%, vAB20%, vAB40%, vAB60%, vAB80%]、及びvTB [vTB5%, vTB20%, vTB40%, vTB60%, vTB80%]の25パラメータからなるパラメータ群;
(パラメータ群B-2)vB [vB5%, vB20%, vB40%, vB60%, vB80%]、 [vAB5%, vAB20%, vAB40%, vAB60%, vAB80%]、及びvTB [vTB5%, vTB20%, vTB40%, vTB60%, vTB80%]の15パラメータからなるパラメータ群;
(パラメータ群B-3)vB [vB5%, vB20%, vB40%, vB60%, vB80%]及びvAB [vAB5%, vAB20%, vAB40%, vAB60%, vAB80%]の10パラメータからなるパラメータ群;
(パラメータ群B-4)パラメータB-1に、Vmax、Amax、VmaxT及びAmaxTを追加した29パラメータからなるパラメータ群。
(4-3)テンプレート検体の解析
(3)で得られた各テンプレート検体由来の凝固反応曲線から、(4-1)~(4-2)の手順に従って、補正1次曲線を算出し、次いで上述したパラメータ群A-1~A-4、B-1~B-4、及び比較パラメータ群1の構成をそれぞれ有するテンプレートパラメータ群A-1~A-4、B-1~B-4、及び比較テンプレートパラメータ群1を作成した。
(3)で得られた各テンプレート検体由来の凝固反応曲線から、(4-1)~(4-2)の手順に従って、補正1次曲線を算出し、次いで上述したパラメータ群A-1~A-4、B-1~B-4、及び比較パラメータ群1の構成をそれぞれ有するテンプレートパラメータ群A-1~A-4、B-1~B-4、及び比較テンプレートパラメータ群1を作成した。
作成したパラメータ群の構成内容を表2に示す。

実施例2 パラメータ群を用いた被検検体のFVIII活性又は異常の判定
(1)FVIII活性の判定
被検検体から得られた被検パラメータ群と、各テンプレート検体から得られた対応するテンプレートパラメータ群との間で回帰分析を行った。パラメータ群には実施例1で取得したパラメータ群A-1を用いた。図16に、FVIII活性が0.2%未満である重症血友病A(VS-HA)患者に由来する被検検体(Sample AF、APTT時間:118.1秒、FVIII<0.2%)との回帰分析結果のうち、相関係数が高い順に上位5件の結果を示す。また、図16の各図の横軸と縦軸のラベルには、それぞれテンプレート検体及び被検検体のFVIII活性及びAPTT時間を示す。この5件の相関係数は0.98以上であることから、被検検体Sample AFとの間でパラメータ群に関して高い相関性を有するテンプレート検体の存在が確認された。また、選出された5つのテンプレート検体(Template A~Template E)は、いずれもFVIII活性が0.2%未満であるVS-HA患者に由来する検体であることが確認された。
図17Aには、図16中で相関係数が最も高かった検体(Template A)との回帰直線を示す。図17Bには被検検体(Sample AF)とTemplate Aの補正1次曲線を示す。被検検体(Sample AF)とTemplate Aの補正1次曲線は、非常に似た形状を有しており、両検体の血液凝固特性が近似していることが示された。これらの結果から、本分析が、血液検体におけるFVIII活性の判定に利用できることが明らかとなった。さらに本分析が、VS-HA患者検体の検出にも有効であることが明らかとなった。
(2)血友病Aの重症度の判定
実施例1で取得したパラメータ群A-1~A-4、B-1~B-4、及び比較パラメータ群1のそれぞれについて、34個の被検検体と、各テンプレート検体との回帰分析を行った。被検検体と全てのテンプレート検体との間でパラメータ群についての直線回帰式を求め、その中から回帰直線の傾きが0.87から1.13の範囲であったテンプレート検体を選出した。次に選出したテンプレート検体の中から、最も相関係数の高いものを相関性が最も高いテンプレート検体として選出した。選出したテンプレート検体のFVIII活性を、被検検体のFVIII活性と判定した。判定結果をもとに、被検検体のFVIII活性レベルを4段階(FVIII活性:<1%、1-5%、5-40%、及びOther)に分類した。分類された被検検体のFVIII活性レベルと、凝固一段法で求めた実際の被検検体のFVIII活性レベルから、本判定におけるFVIII活性レベル一致率及びFVIII欠乏一致率を次式により計算した。FVIII活性レベル一致率は、判定による被検検体のFVIII活性レベルが実際の被検検体のFVIII活性レベルと一致した割合を示し、FVIII欠乏一致率は、判定による被検検体のFVIII欠乏の有無が実際の被検検体のFVIII欠乏の有無と一致した割合を示す。
実施例1で取得したパラメータ群A-1~A-4、B-1~B-4、及び比較パラメータ群1のそれぞれについて、34個の被検検体と、各テンプレート検体との回帰分析を行った。被検検体と全てのテンプレート検体との間でパラメータ群についての直線回帰式を求め、その中から回帰直線の傾きが0.87から1.13の範囲であったテンプレート検体を選出した。次に選出したテンプレート検体の中から、最も相関係数の高いものを相関性が最も高いテンプレート検体として選出した。選出したテンプレート検体のFVIII活性を、被検検体のFVIII活性と判定した。判定結果をもとに、被検検体のFVIII活性レベルを4段階(FVIII活性:<1%、1-5%、5-40%、及びOther)に分類した。分類された被検検体のFVIII活性レベルと、凝固一段法で求めた実際の被検検体のFVIII活性レベルから、本判定におけるFVIII活性レベル一致率及びFVIII欠乏一致率を次式により計算した。FVIII活性レベル一致率は、判定による被検検体のFVIII活性レベルが実際の被検検体のFVIII活性レベルと一致した割合を示し、FVIII欠乏一致率は、判定による被検検体のFVIII欠乏の有無が実際の被検検体のFVIII欠乏の有無と一致した割合を示す。

表3~表5は、判定された被検検体のFVIII活性と実際の被検検体のFVIII活性との対比表である。パラメータ群A-1~A-4を用いた場合の対比表を表3に、パラメータ群B-1~B-4を用いた場合の対比表を表4に、比較パラメータ群1を用いた場合の対比表を表5に示す。


分析に使用したパラメータ群の種類と、FVIII欠乏一致率及びFVIII活性レベル一致率について表6にまとめた。パラメータ群A又はBを用いた方法では、高い一致率で被検検体のFVIII活性レベルを判定することができた。

実施例3 相関性の評価基準の違いによる判定結果の差異
相関性の評価基準の違いによる判定結果の差異を確認するため、相関性の評価基準のみが異なる比較検討を以下の2条件で実施した。パラメータ群はA-4を使用した。
相関性評価基準1:全てのテンプレート検体と被検検体との間でパラメータ群についての直線回帰式を求め、その中から回帰直線の傾きが0.87から1.13の範囲に含まれるテンプレート検体を選出し、選出した中から最も相関係数の高いテンプレート検体を選出した(実施例2と同じ評価基準)。
相関性評価基準2:全てのテンプレート検体と被検検体との間でパラメータ群についての直線回帰式を求め、その中から最も相関係数の高いテンプレート検体を選出した。
相関性の評価基準の違いによる判定結果の差異を確認するため、相関性の評価基準のみが異なる比較検討を以下の2条件で実施した。パラメータ群はA-4を使用した。
相関性評価基準1:全てのテンプレート検体と被検検体との間でパラメータ群についての直線回帰式を求め、その中から回帰直線の傾きが0.87から1.13の範囲に含まれるテンプレート検体を選出し、選出した中から最も相関係数の高いテンプレート検体を選出した(実施例2と同じ評価基準)。
相関性評価基準2:全てのテンプレート検体と被検検体との間でパラメータ群についての直線回帰式を求め、その中から最も相関係数の高いテンプレート検体を選出した。
判定結果を表7に示す(表7-1は表3A-4と同じ)。分析に使用したパラメータの種類と、FVIII欠乏一致率及びFVIII活性レベル一致率について表8にまとめた。


実施例4 FIX活性レベルの判定
被検検体のうちOther(FVIII>40%)と判定されたがFIX欠乏である8件の検体について、FIX活性の判定を実施した。テンプレート検体には表9のものを用いた。パラメータ群に実施例1で取得したパラメータ群A-1を、相関性の評価には実施例3の相関性評価基準1を用いた。実施例2(2)と同様の手順で、FIX活性レベル一致率及びFIX欠乏一致率を計算した。評価結果を表10に示す。高い一致率で被検検体のFIX活性レベルを判定することができた。
被検検体のうちOther(FVIII>40%)と判定されたがFIX欠乏である8件の検体について、FIX活性の判定を実施した。テンプレート検体には表9のものを用いた。パラメータ群に実施例1で取得したパラメータ群A-1を、相関性の評価には実施例3の相関性評価基準1を用いた。実施例2(2)と同様の手順で、FIX活性レベル一致率及びFIX欠乏一致率を計算した。評価結果を表10に示す。高い一致率で被検検体のFIX活性レベルを判定することができた。


実施例5 FVIII活性又は異常の判定
(1)被検血液検体及びテンプレート検体
被検血液検体として、FVIII活性又はFIX活性が低下している患者血漿46検体を用いた。該46検体は、30件のFVIII欠乏検体(重症(FVIII<1%)10件、中等症(FVIII=1-5%)10件、軽症(FVIII=5-40%)10件)、FVIII>40%検体(Other)の1件、及び15件のFIX欠乏検体(Other)からなるものであった。
(1)被検血液検体及びテンプレート検体
被検血液検体として、FVIII活性又はFIX活性が低下している患者血漿46検体を用いた。該46検体は、30件のFVIII欠乏検体(重症(FVIII<1%)10件、中等症(FVIII=1-5%)10件、軽症(FVIII=5-40%)10件)、FVIII>40%検体(Other)の1件、及び15件のFIX欠乏検体(Other)からなるものであった。
テンプレート検体には、市販の凝固因子欠乏血漿とLA血漿又は正常血漿とを種々の割合で混合した混合血漿、及び市販のFVIII欠乏血漿にFVIII製剤を添加したFVIII添加血漿を用いた。凝固因子欠乏血漿とLA血漿には、Factor VIII Deficient Plasma、Factor IX Deficient Plasma、Factor V Deficient Plasma、Factor X Deficient Plasma、Factor XI Deficient Plasma、Factor XII Deficient Plasma、Prekallikrein Deficient Plasma、Positive Lupus Anticoagulant Plasma(いずれもGeorge King Bio-Medical, Inc.製)を用いた。FVIII製剤には、遺伝子組換え型血液凝固第VIII因子製剤アドベイト(シャイヤージャパン製)を用いた。正常血漿として各因子濃度が100%とみなせる正常プール血漿を用いた。正常血漿と各凝固因子欠乏血漿を種々の割合で混合し、因子濃度が0.25%、0.5、0.75%、1%、2.5%、5%、10%、25%、50%の混合血漿をそれぞれ調製した。また、FVIII欠乏血漿にFVIII製剤を添加してFVIII濃度が、0.625%、1.25%、2.5%、5%、10%、20%、40%、80%、160%のFVIII添加血漿を調製した。さらに別のFVIII欠乏血漿にFVIII製剤を添加してFVIII濃度が、0.3%、0.6%、1%、2%、4%、8%、16%、32%、64%、128%のFVIII添加血漿を調製した。以上の手順で、FVIII活性異常の59検体、FVIII活性は正常であるが他の凝固因子が低下した因子欠乏検体80検体、及びLA陽性4検体の計143のテンプレート検体を調製した。該FVIII活性異常の59検体は、FVIII活性のレベルが、血友病A重症(FVIII<1%)、中等症(FVIII=1-5%)、及び軽症(FVIII=5-40%)、ならびにその他(FVIII>40%はOther)のいずれかに属していた。残りの84検体は、FVIII活性が異常ではないため「Other」に属していた。
本実施例では、全ての被検検体はFVIII欠乏患者(血友病A)からの検体か又はFIX欠乏患者(血友病B)からの検体であり、一方、テンプレート検体は、血友病Aや血友病Bの患者検体を用いずに、市販の因子欠乏血漿やLA陽性血漿を基に調製された。このような検体の構成により、本実施例では、実施例2と比べて、被検検体の凝固因子の状態を正しく判定することが困難な条件を設定した。本実施例で用いた被検検体及びテンプレート検体の構成を表11に示す。

実施例1(1)の手順に従って、各被検検体及びテンプレート検体についての凝固反応曲線を得た。被検検体及びテンプレート検体についてのFVIII活性及びAPTTの分布を図18に示す。
(2)パラメータ群の作成
各検体について、凝固反応曲線から未補正1次曲線、未補正2次曲線、補正1次曲線、及び補正2次曲線を算出した。各曲線について、10個の演算対象域値S(該曲線の最大高さの5%、10%、20%、30%、40%、50%、60%、70%、80%、及び90%)に基づく10個の演算対象域を抽出し、各演算対象域を特徴づけるパラメータを取得した。さらに、従来パラメータである曲線の最大値とそれに到達するまでの時間(Vmax、RVmax、VmaxT、Amax、RAmax、AmaxT)を取得した。取得したパラメータを表12に示す。
各検体について、凝固反応曲線から未補正1次曲線、未補正2次曲線、補正1次曲線、及び補正2次曲線を算出した。各曲線について、10個の演算対象域値S(該曲線の最大高さの5%、10%、20%、30%、40%、50%、60%、70%、80%、及び90%)に基づく10個の演算対象域を抽出し、各演算対象域を特徴づけるパラメータを取得した。さらに、従来パラメータである曲線の最大値とそれに到達するまでの時間(Vmax、RVmax、VmaxT、Amax、RAmax、AmaxT)を取得した。取得したパラメータを表12に示す。

(3)パラメータ群を用いた被検検体のFVIII活性又は異常の判定
(3-1)単一パラメータを用いた判定
表12に示したパラメータからパラメータ群を構成した。演算対象域を特徴づけるパラメータを用いる場合は、10個の演算対象域値(x=5%、10%、20%、30%、40%、50%、60%、70%、80%、及び90%)に基づく10個の演算対象域から抽出された同種のパラメータのセットをパラメータ群として用いた。例えば、パラメータ「vHx」を用いる場合、[vH5%、vH10%、vH20%、vH30%、vH40%、vH50%、vH60%、vH70%、vH80%、vH90%]のセットをパラメータ群として用いた。従来パラメータを用いる場合は、実施例2の比較例と同じパラメータ群を用いた。
該パラメータ群を用いた回帰分析により、被検検体のFVIII活性又は異常の判定を行った。被検検体から得られた被検パラメータ群と、各テンプレート検体から得られた対応するテンプレートパラメータ群との間で一次回帰分析を行った。回帰分析で得られた一次回帰式の傾きが1±0.15以内であり、且つ該一次回帰式の相関係数が0.90より大きいテンプレート検体を抽出した。抽出されたテンプレート検体の中で相関係数が最大のテンプレート検体を選別した。相関係数が同じ検体が複数存在した場合は、回帰式の傾きがより1に近いテンプレート検体を選別した。選別したテンプレート検体におけるFVIII活性の状態(血友病A重症(FVIII<1%)、中等症(FVIII=1-5%)、及び軽症(FVIII=5-40%)、又はその他(Other))を、被検検体のFVIII活性の状態と判定した。全被検検体についての判定結果に基づいて、実施例2と同様の手順でFVIII欠乏一致率及びFVIII活性レベル一致率を計算した。
用いたパラメータ群と、得られたFVIII欠乏一致率及びFVIII活性レベル一致率を表13及び14に示す。FVIII欠乏一致率が最大(63.0%)となるパラメータは2次曲線のパラメータpHxであった。FVIII活性レベル一致率が最大(76.1%)となるパラメータは2次曲線のパラメータmTxであった。FVIII欠乏一致率とFVIII活性レベル一致率の高さは相関していなかった。従来パラメータ(VmaxT、AmaxT、Vmax、Amaxの組み合わせ)を用いた場合のFVIII欠乏一致率は52.2%であった。


(3-1)組み合わせパラメータを用いた判定
表12に示した演算対象域を特徴づけるパラメータを複数種組み合わせて、組み合わせパラメータ群を構成した。10個の演算対象域値(x=5%、10%、20%、30%、40%、50%、60%、70%、80%、及び90%)に基づく10個の演算対象域から抽出された同種のパラメータのセットを2個以上組み合わせて、パラメータ群として用いた。例えば、パラメータ「vT」と「vB」の組み合わせを用いる場合、[vT5%、vT10%、vT20%、vT30%、vT40%、vT50%、vT60%、vT70%、vT80%、vT90%]のセットと[vB5%、vB10%、vB20%、vB30%、vB40%、vB50%、vB60%、vB70%、vB80%、vB90%]のセットを組み合わせてパラメータ群として用いた。
表12に示した演算対象域を特徴づけるパラメータを複数種組み合わせて、組み合わせパラメータ群を構成した。10個の演算対象域値(x=5%、10%、20%、30%、40%、50%、60%、70%、80%、及び90%)に基づく10個の演算対象域から抽出された同種のパラメータのセットを2個以上組み合わせて、パラメータ群として用いた。例えば、パラメータ「vT」と「vB」の組み合わせを用いる場合、[vT5%、vT10%、vT20%、vT30%、vT40%、vT50%、vT60%、vT70%、vT80%、vT90%]のセットと[vB5%、vB10%、vB20%、vB30%、vB40%、vB50%、vB60%、vB70%、vB80%、vB90%]のセットを組み合わせてパラメータ群として用いた。
FVIII欠乏一致率が高かった組み合わせパラメータ群と、得られたFVIII欠乏一致率及びFVIII活性レベル一致率を表15及び16に示す。表15には、2種のパラメータを組み合わせた場合の結果が、表16には、3種のパラメータを組み合わせた場合の結果が、それぞれ示されている。表16には、FVIII活性レベル一致率が最大であったパラメータ群(pNs_pNe_vTB)の結果も記載されている。


上記(3-1)及び(3-2)で高いFVIII欠乏一致率又はFVIII活性レベル一致率をもたらしたパラメータ群についてのFVIII活性レベル判定の結果を表17に示す。使用するパラメータ種の数が増えると、FVIII欠乏一致率又はFVIII活性レベル一致率のいずれも高くなる傾向がみられた。またこれらの結果から、2次曲線に関するパラメータが判定に有用であることが示された。
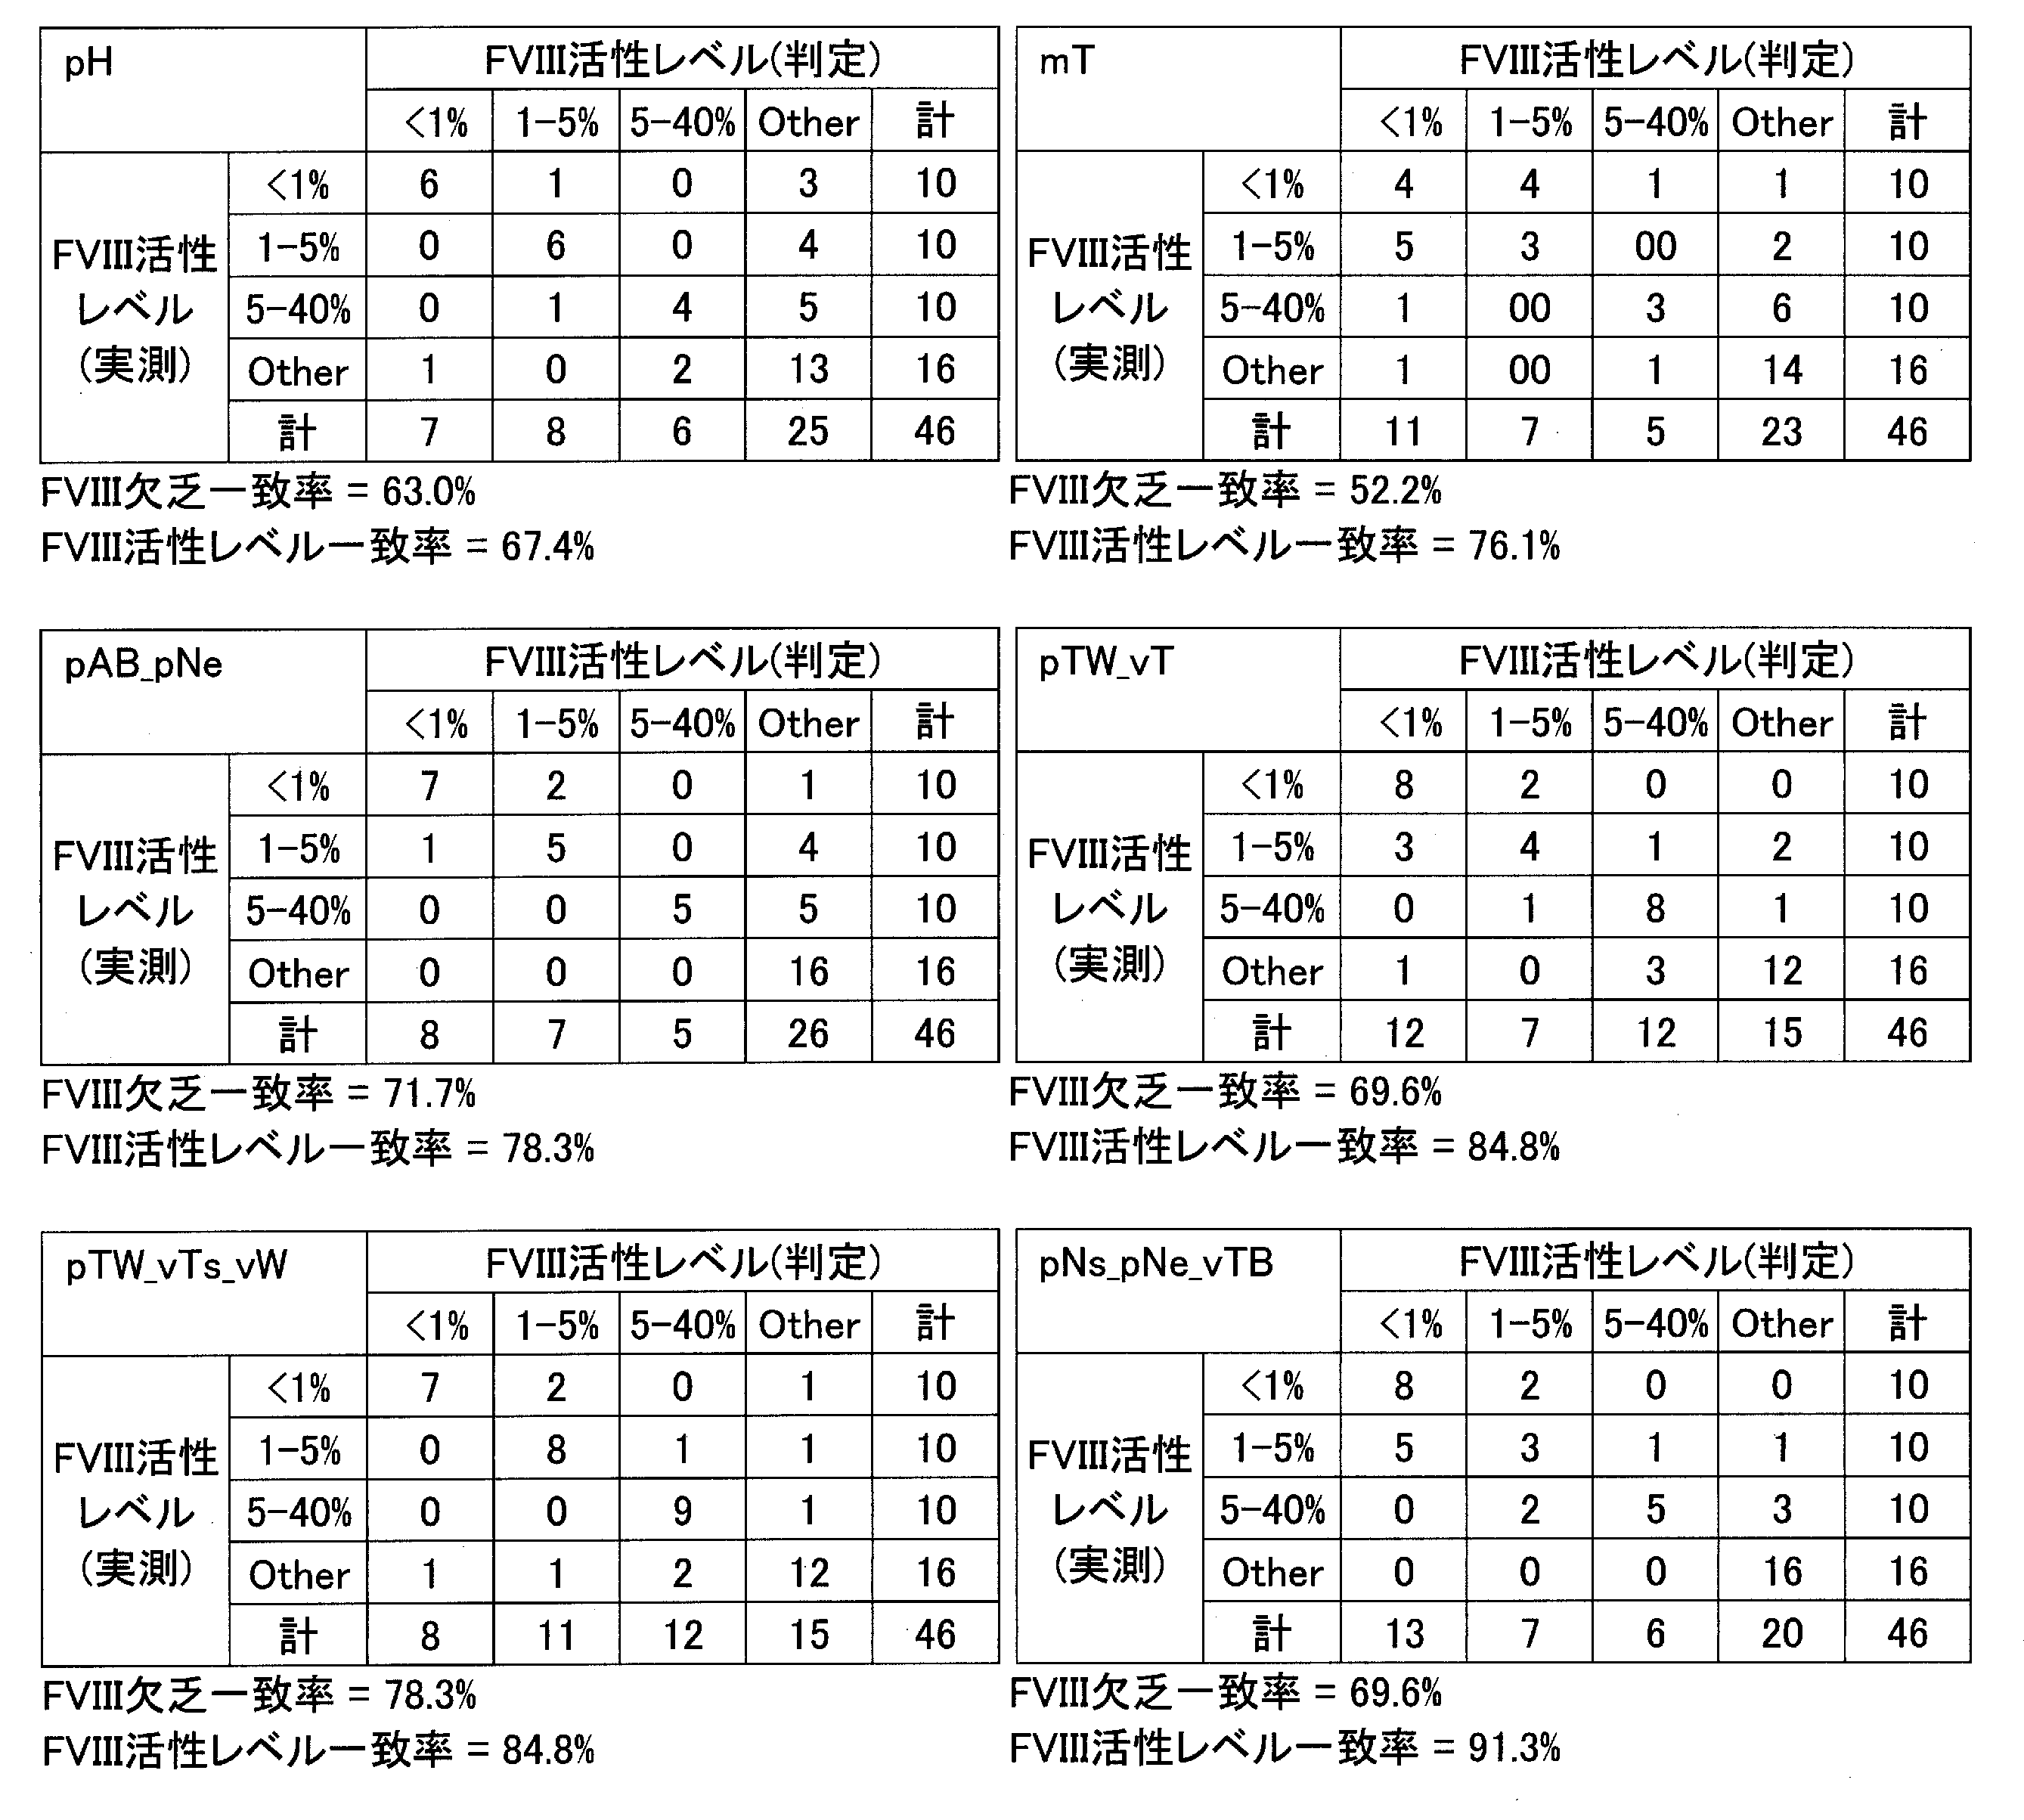
実施例6 異なる判定基準によるFVIII活性又は異常の判定
(1)方法
実施例5で用いた検体を用いて、実施例5と同様の手順で、被検パラメータ群とテンプレートパラメータ群との間で一次回帰分析を行った。次いで、以下の異なる判定基準に従って、被検検体のFVIII活性の状態を判定した。
判定基準1:
実施例5と同様に、一次回帰式の傾きが1±0.15以内であり、且つ該回帰式の相関係数が0.90より大きいテンプレート検体のうち、相関係数が最も高かったテンプレート検体におけるFVIII活性の状態を、被検検体のFVIII活性の状態と判定した。上記一次回帰式の傾き及び相関係数の条件に適合するテンプレート検体がない場合、被検検体はOtherと判定された。
判定基準2(最多選出法):
一次回帰式の傾きが1±0.15以内であり、且つ該回帰式の相関係数が0.90より大きいテンプレート検体のうち、相関係数が最も高い5件のテンプレート検体を抽出した。これら5件の検体の中で最も高頻度に見られたFVIII活性の状態を、被検検体のFVIII活性の状態と判定した。異なる状態の検体が同数存在する場合には、より重症な状態を該被検検体の状態と判定した。上記一次回帰式の傾き及び相関係数の条件に適合するテンプレート検体がない場合、被検検体はOtherと判定された。
判定基準3(2段階選出法):
血友病A患者(重症、中等症、及び軽症)由来の検体一次回帰式の傾きが1±0.15以内であり、且つ該回帰式の相関係数が0.90より大きいテンプレート検体のうち、相関係数が最も高い5件のテンプレート検体を抽出した。上記一次回帰式の傾き及び相関係数の条件に適合するテンプレート検体が5件に満たない場合は、満たない件数分をNDとした(表18参照)。これら5件における血友病A患者(重症[L1]:FVIII<1%、中等症[L2]:FVIII=1-5%、及び軽症[L3]:FVIII=5-40%)の合計数、及びその他(Other及びND)の合計数を求めた。血友病A患者の合計数がより多い場合、最も高頻度に見られた状態(重症、中等症、又は軽症)を被検検体の状態と判定した。異なる状態の検体が同数存在する場合には、より重症な状態を被検検体の状態と判定した。その他の合計数がより多い場合、被検検体の状態をOtherと判定した。
判定手順の例を表18に示す。相関係数順位の<1>のテンプレート検体のFVIII活性と判定基準1での判定結果は一致する。最大数を占めるテンプレート検体のFVIII活性と判定基準2での判定結果は一致する。テンプレート検体中のL1~L3の合計数がより多ければ、判定基準3はL1~L3のいずれかになり、OtherとNDの合計数がより多ければ、判定基準3はOtherになる。
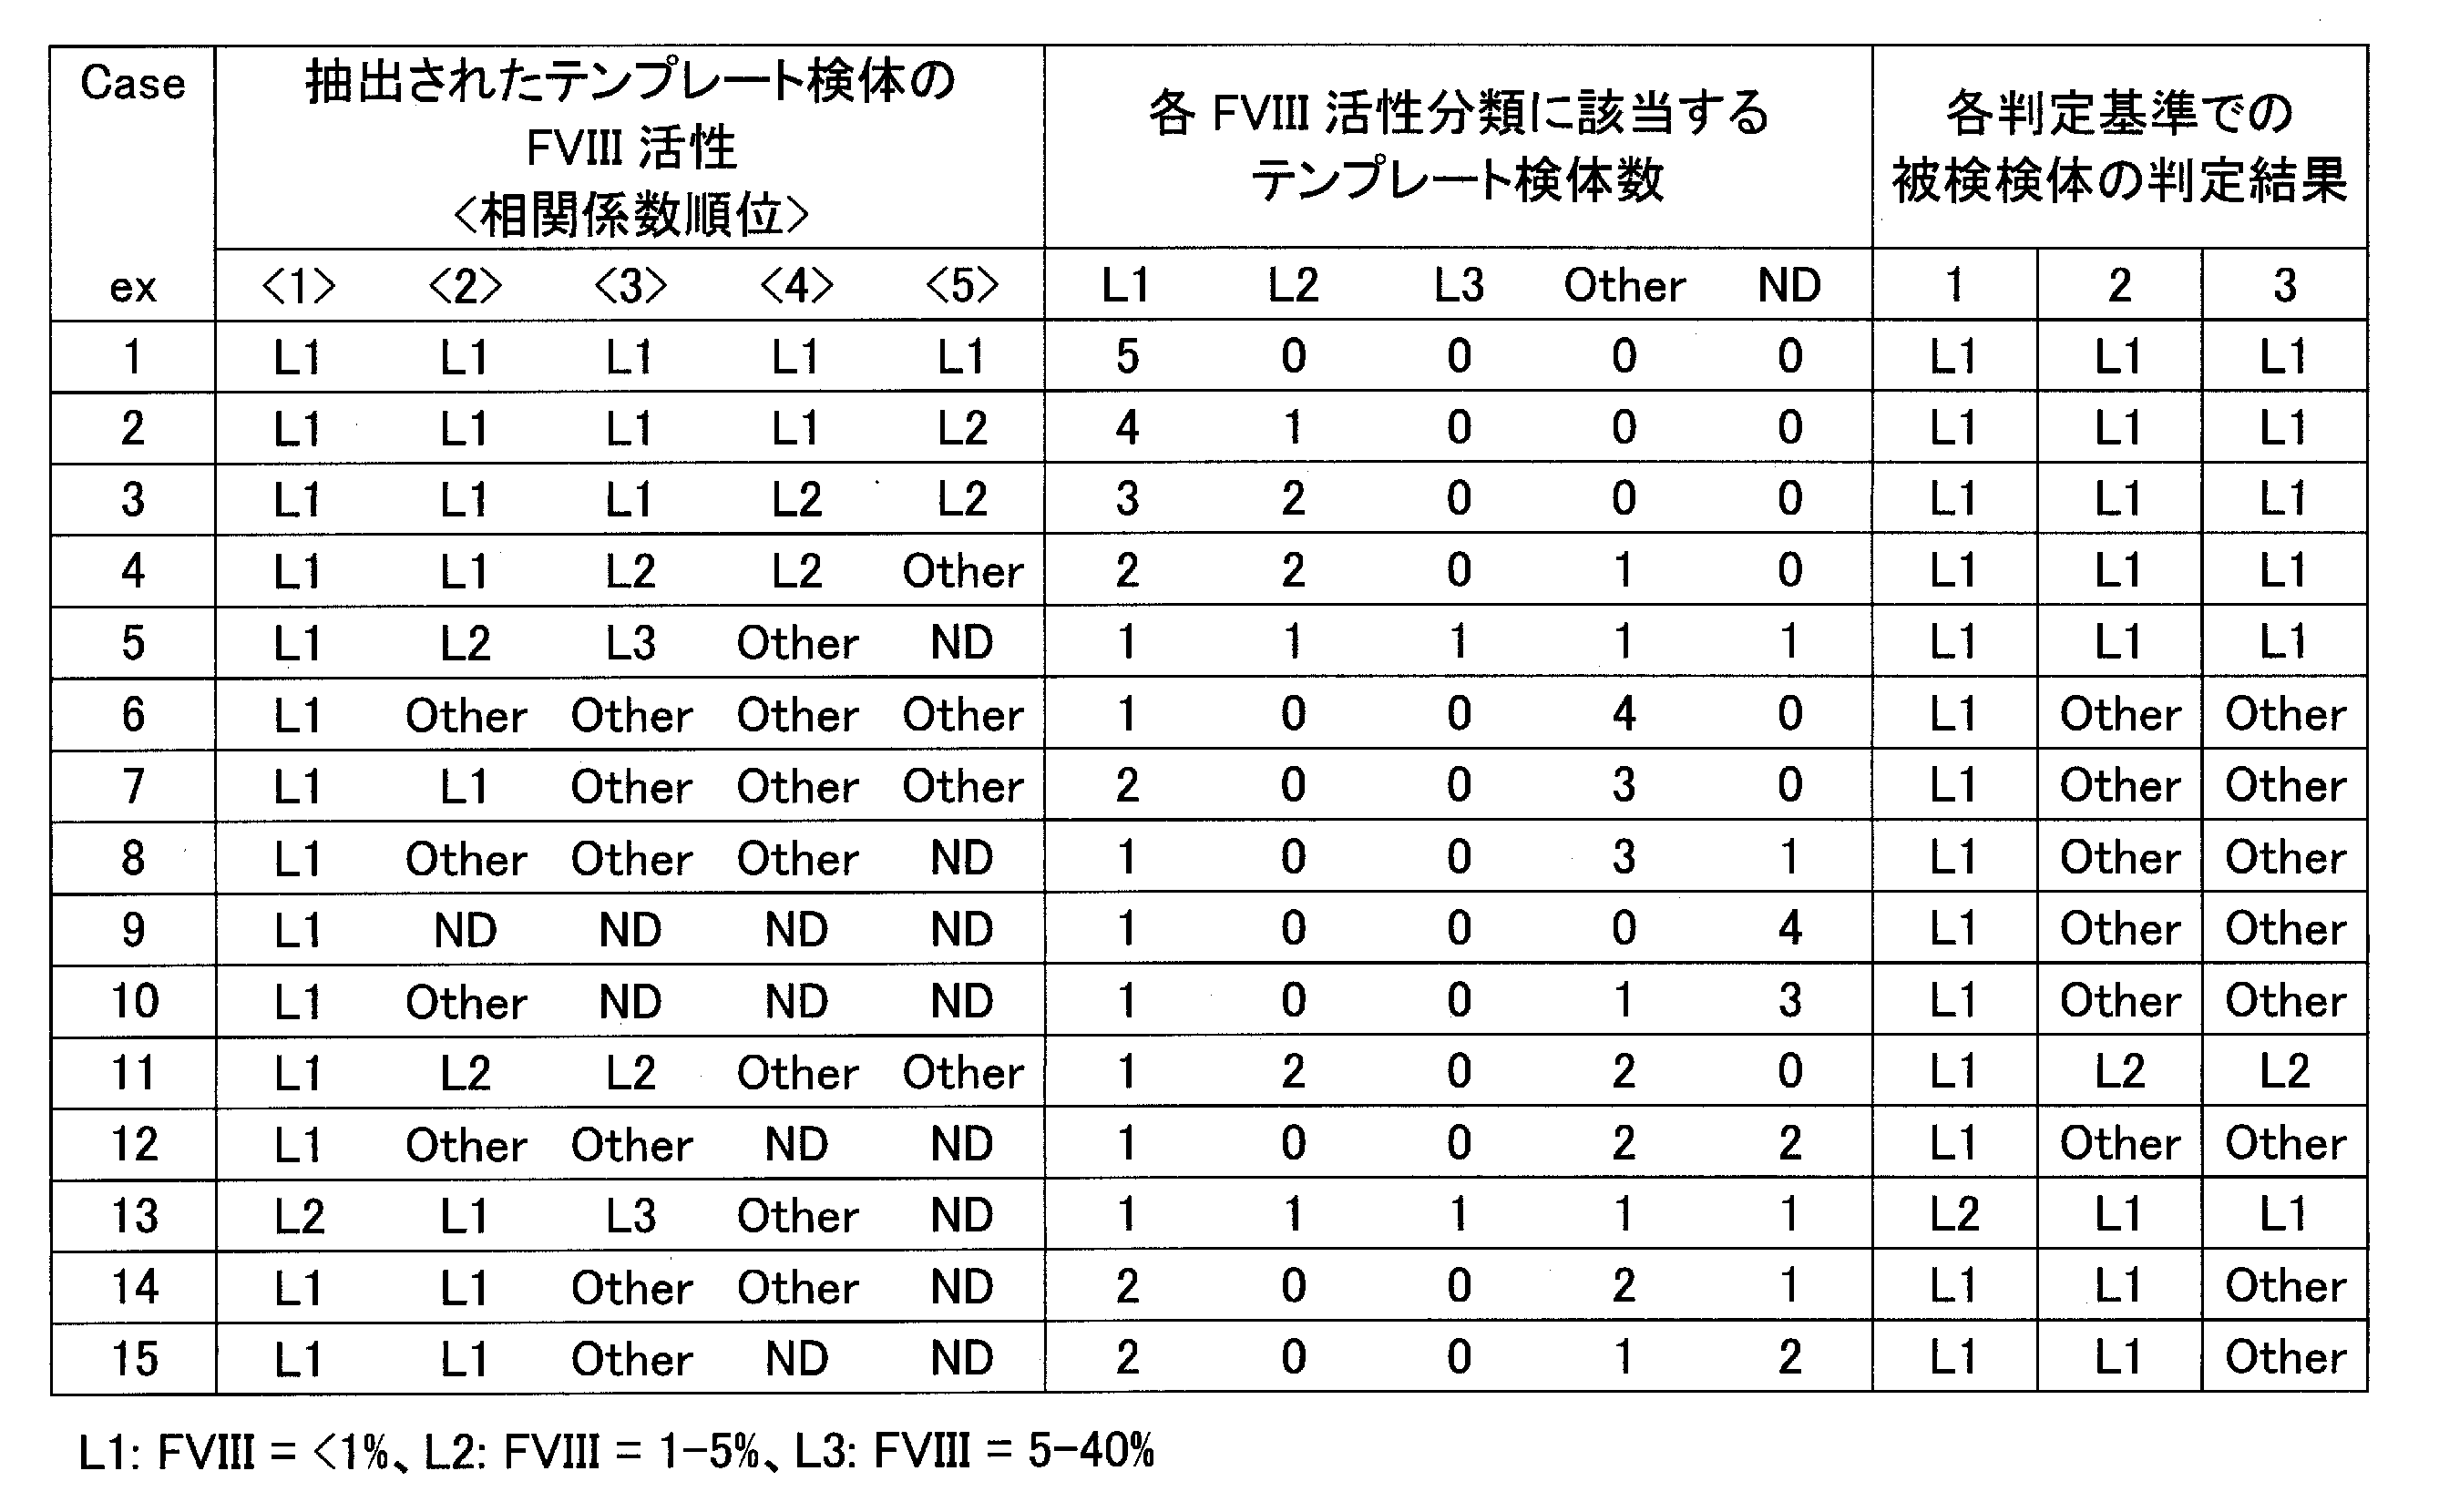
(2)判定
表12に示す55種の演算対象域を特徴づけるパラメータから3種のパラメータを任意に組み合わせて、26235通りの組み合わせパラメータ群を構成した。各々の組み合わせパラメータ群を用いて、被検パラメータ群とテンプレートパラメータ群との間で用いた一次回帰分析を行い、次いで判定基準1~3に従って被検検体のFVIII活性の状態を判定した。実施例2と同様の手順でFVIII欠乏一致率又はFVIII活性レベル一致率を計算した。さらにFVIII欠乏一致率又はFVIII活性レベル一致率の平均(平均一致率)を計算した。
表12に示す55種の演算対象域を特徴づけるパラメータから3種のパラメータを任意に組み合わせて、26235通りの組み合わせパラメータ群を構成した。各々の組み合わせパラメータ群を用いて、被検パラメータ群とテンプレートパラメータ群との間で用いた一次回帰分析を行い、次いで判定基準1~3に従って被検検体のFVIII活性の状態を判定した。実施例2と同様の手順でFVIII欠乏一致率又はFVIII活性レベル一致率を計算した。さらにFVIII欠乏一致率又はFVIII活性レベル一致率の平均(平均一致率)を計算した。
各判定基準に従って求めたFVIII欠乏一致率、FVIII活性レベル一致率、及び平均一致率(まとめて一致率ともいう)の例を表19に示す。
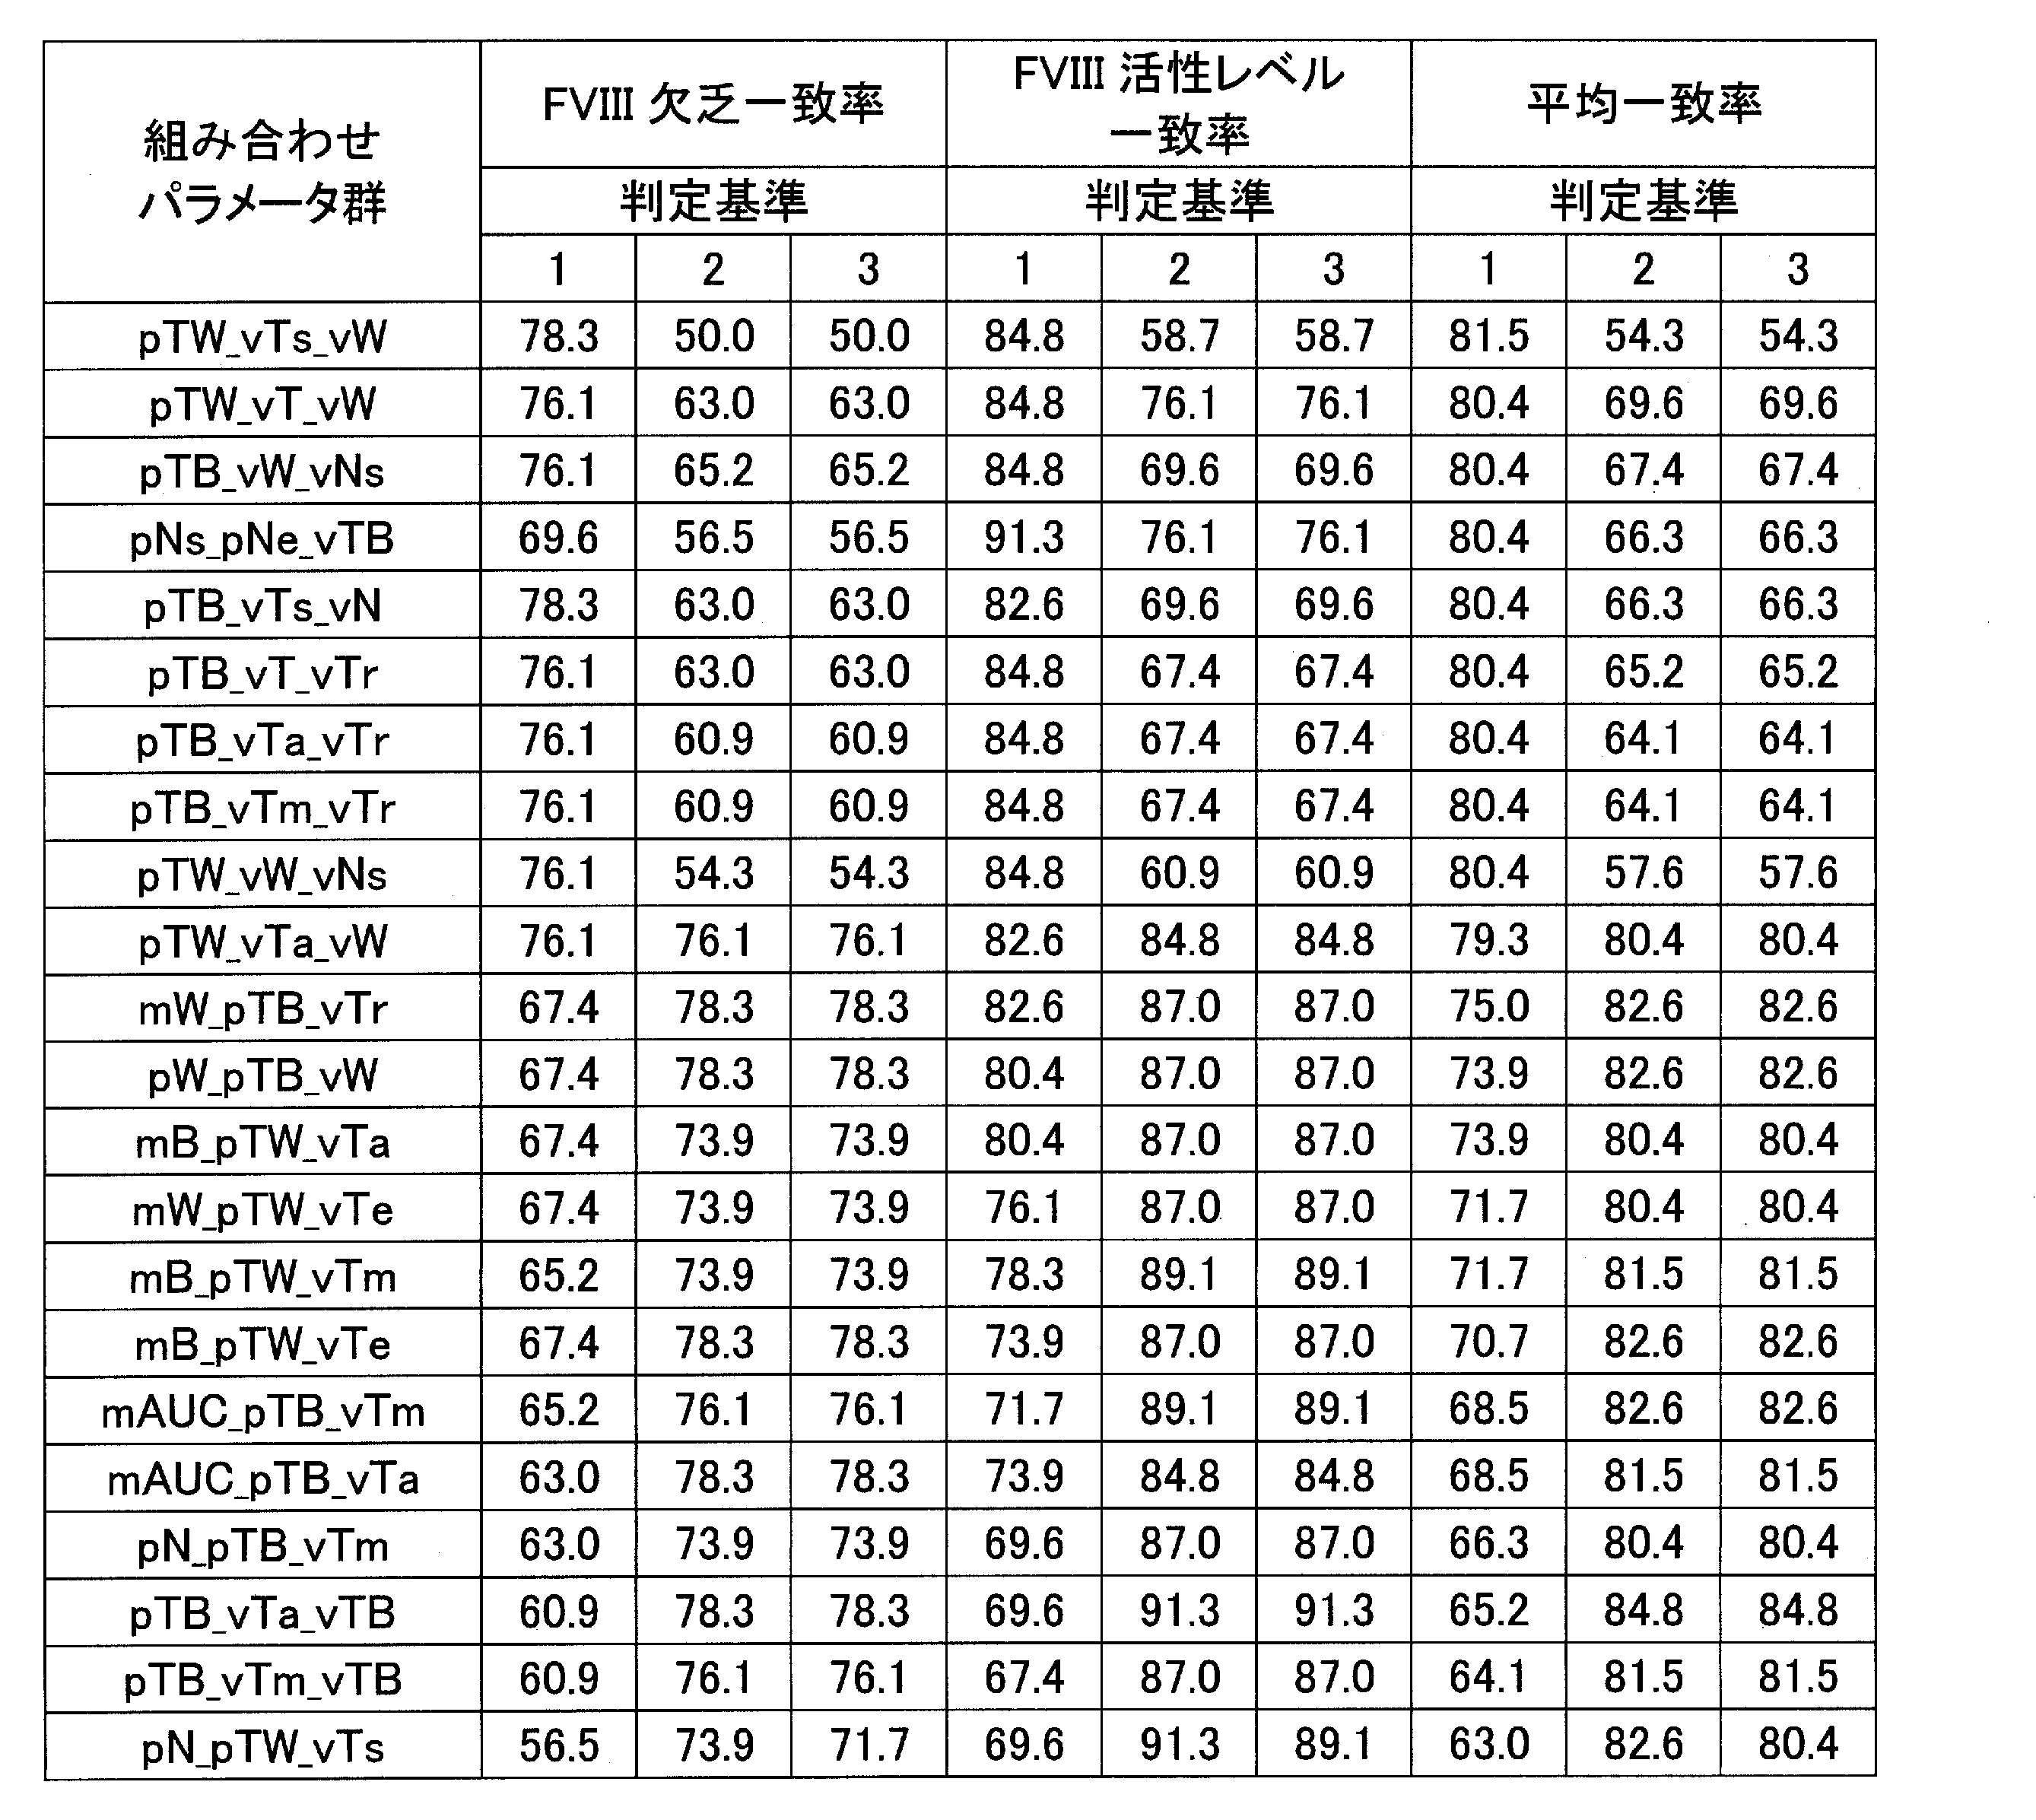
表20は、一致率のレベルを達成した組み合わせパラメータ群の数を示す。表20の最下行には、各判定基準での一致率の最大値を示した。FVIII欠乏一致率は、いずれの基準でも最大78.3%であった。最大の一致率レベル(75%超-80%以下)を満たす組み合わせパラメータ群の数は、判定基準1が12、判定基準2と3が17であった。FVIII活性レベル一致率は、いずれの基準でも最大91.3%であった。最大の一致率レベル(90%超-95%以下)を満たすパラメータ群の数は、判定基準1と3が1つ、判定基準2が2つであった。平均一致率の最大値は、判定基準1で81.5%、判定基準2と3で84.8%であった。最大の一致率レベル(80%超-85%以下)を満たすパラメータ群の数は、判定基準1が9、判定基準2と判定3が13であった。

実施例7 異なる閾値によるFVIII活性又は異常の判定
実施例6と同様の手順で、判定基準1~3に従って、ただし一次回帰式の傾きの許容幅及び相関係数の閾値を変更して、被検検体のFVIII活性の状態を判定した。パラメータ群には、実施例5で最大のFVIII欠乏一致率及びFVIII活性レベル一致率を示した組み合わせパラメータ群pTW_vTs_vWを用いた。一次回帰式の傾きは、1±0.05から1±0.25まで(すなわち、許容幅0.05から0.25まで)段階的に変更した。また相関係数の閾値は、>0.75から>0.98まで段階的に変更した。各条件でのFVIII欠乏一致率及びFVIII活性レベル一致率を計算した。結果を図19~21に示す。
実施例6と同様の手順で、判定基準1~3に従って、ただし一次回帰式の傾きの許容幅及び相関係数の閾値を変更して、被検検体のFVIII活性の状態を判定した。パラメータ群には、実施例5で最大のFVIII欠乏一致率及びFVIII活性レベル一致率を示した組み合わせパラメータ群pTW_vTs_vWを用いた。一次回帰式の傾きは、1±0.05から1±0.25まで(すなわち、許容幅0.05から0.25まで)段階的に変更した。また相関係数の閾値は、>0.75から>0.98まで段階的に変更した。各条件でのFVIII欠乏一致率及びFVIII活性レベル一致率を計算した。結果を図19~21に示す。
Claims (22)
- 被検血液検体と凝固時間測定試薬とが混和されてなる試料についての凝固速度又は凝固加速度に関する波形を取得することと、
該凝固速度又は凝固加速度に関する波形を特徴付ける複数のパラメータを抽出することと、
該複数のパラメータに基づいて、該被検血液検体における凝固因子の活性レベル又は活性異常を判定することと、
を含む、血液検体の分析方法。 - 前記複数のパラメータが、前記凝固速度に関する波形の複数の演算対象域をそれぞれ特徴付ける複数のパラメータを含むか、前記凝固加速度に関する波形の複数の演算対象域をそれぞれ特徴付ける複数のパラメータを含むか、又はそれらの組み合わせを含む、請求項1記載の分析方法。
- 前記複数のパラメータが、下記:
前記凝固速度に関する波形の複数の演算対象域についての加重平均時間vT、加重平均高さvH、ピーク幅vB、加重平均ピーク幅vW、加重平均高さについてのB扁平率vAB、加重平均高さについてのW扁平率vAW、加重平均時間についてのB時間率vTB、加重平均時間についてのW時間率vTW、平均時間vTa、平均高さvHa、平均高さについてのB扁平率vABa、平均高さについてのW扁平率vAWa、領域始点時間vTs、領域終点時間vTe、領域中央時間vTm、領域時間幅vTr、主ピーク始点時間vNs、主ピーク終点時間vNe、及び主ピーク幅vN;
前記凝固加速度に関する波形のプラスピークの複数の演算対象域についての加重平均時間pT、加重平均高さpH、ピーク幅pB、加重平均ピーク幅pW、加重平均高さについてのB扁平率pAB、加重平均高さについてのW扁平率pAW、加重平均時間についてのB時間率pTB、加重平均時間についてのW時間率pTW、主ピーク始点時間pNs、主ピーク終点時間pNe、及び主ピーク幅pN;ならびに、
前記凝固加速度に関する波形のマイナスピークの複数の演算対象域についての加重平均時間mT、加重平均高さmH、ピーク幅mB、加重平均ピーク幅mW、加重平均高さについてのB扁平率mAB、加重平均高さについてのW扁平率mAW、加重平均時間についてのB時間率mTB、加重平均時間についてのW時間率mTW、主ピーク始点時間mNs、主ピーク終点時間mNe、及び主ピーク幅mN、
からなる群より選択される1つ以上を含む、請求項2記載の分析方法。 - 前記凝固速度に関する波形をF(t)(tは時間)、F(t)が所定値xである時間をt1、t2(t1<t2)とするとき、前記演算対象域はF(t)≧xを満たす領域であり、前記vT及びvHは下記式で表され、


前記vWが、前記t1からt2までのF(t)≧vHとなる時間長であり、
前記vTs、vTeが、それぞれt1、t2であり、
前記vTrが、vTsからvTeまでの時間長であり、
前記vNsが、該演算対象域中で、F(t)が最大値を示す時間よりも小さく且つF(t)=xを示す時間のうち、最大の時間であり、
前記vNeが、該演算対象域中で、F(t)が最大値を示す時間よりも大きく且つF(t)=xを示す時間のうち、最小の時間であり、
前記vNが、vNsからvNeまでの時間長であり、
前記vABが、該vHと該vBとの比を表し、
前記vAWが、該vHと該vWとの比を表し、
前記vTBが、該vTと該vBとの比を表し、
前記vTWが、該vTと該vWとの比を表し、
前記vABaが、該vHaと該vBとの比を表し、
前記vAWaが、該vHaと該vWとの比を表す、
請求項3記載の分析方法。 - 前記凝固加速度に関する波形をF’(t)(tは時間)、F’(t)が所定値xである時間をt1、t2(t1<t2)とするとき、前記演算対象域はF’(t)≧xを満たす領域であり、前記pT及びpHは下記式で表され、
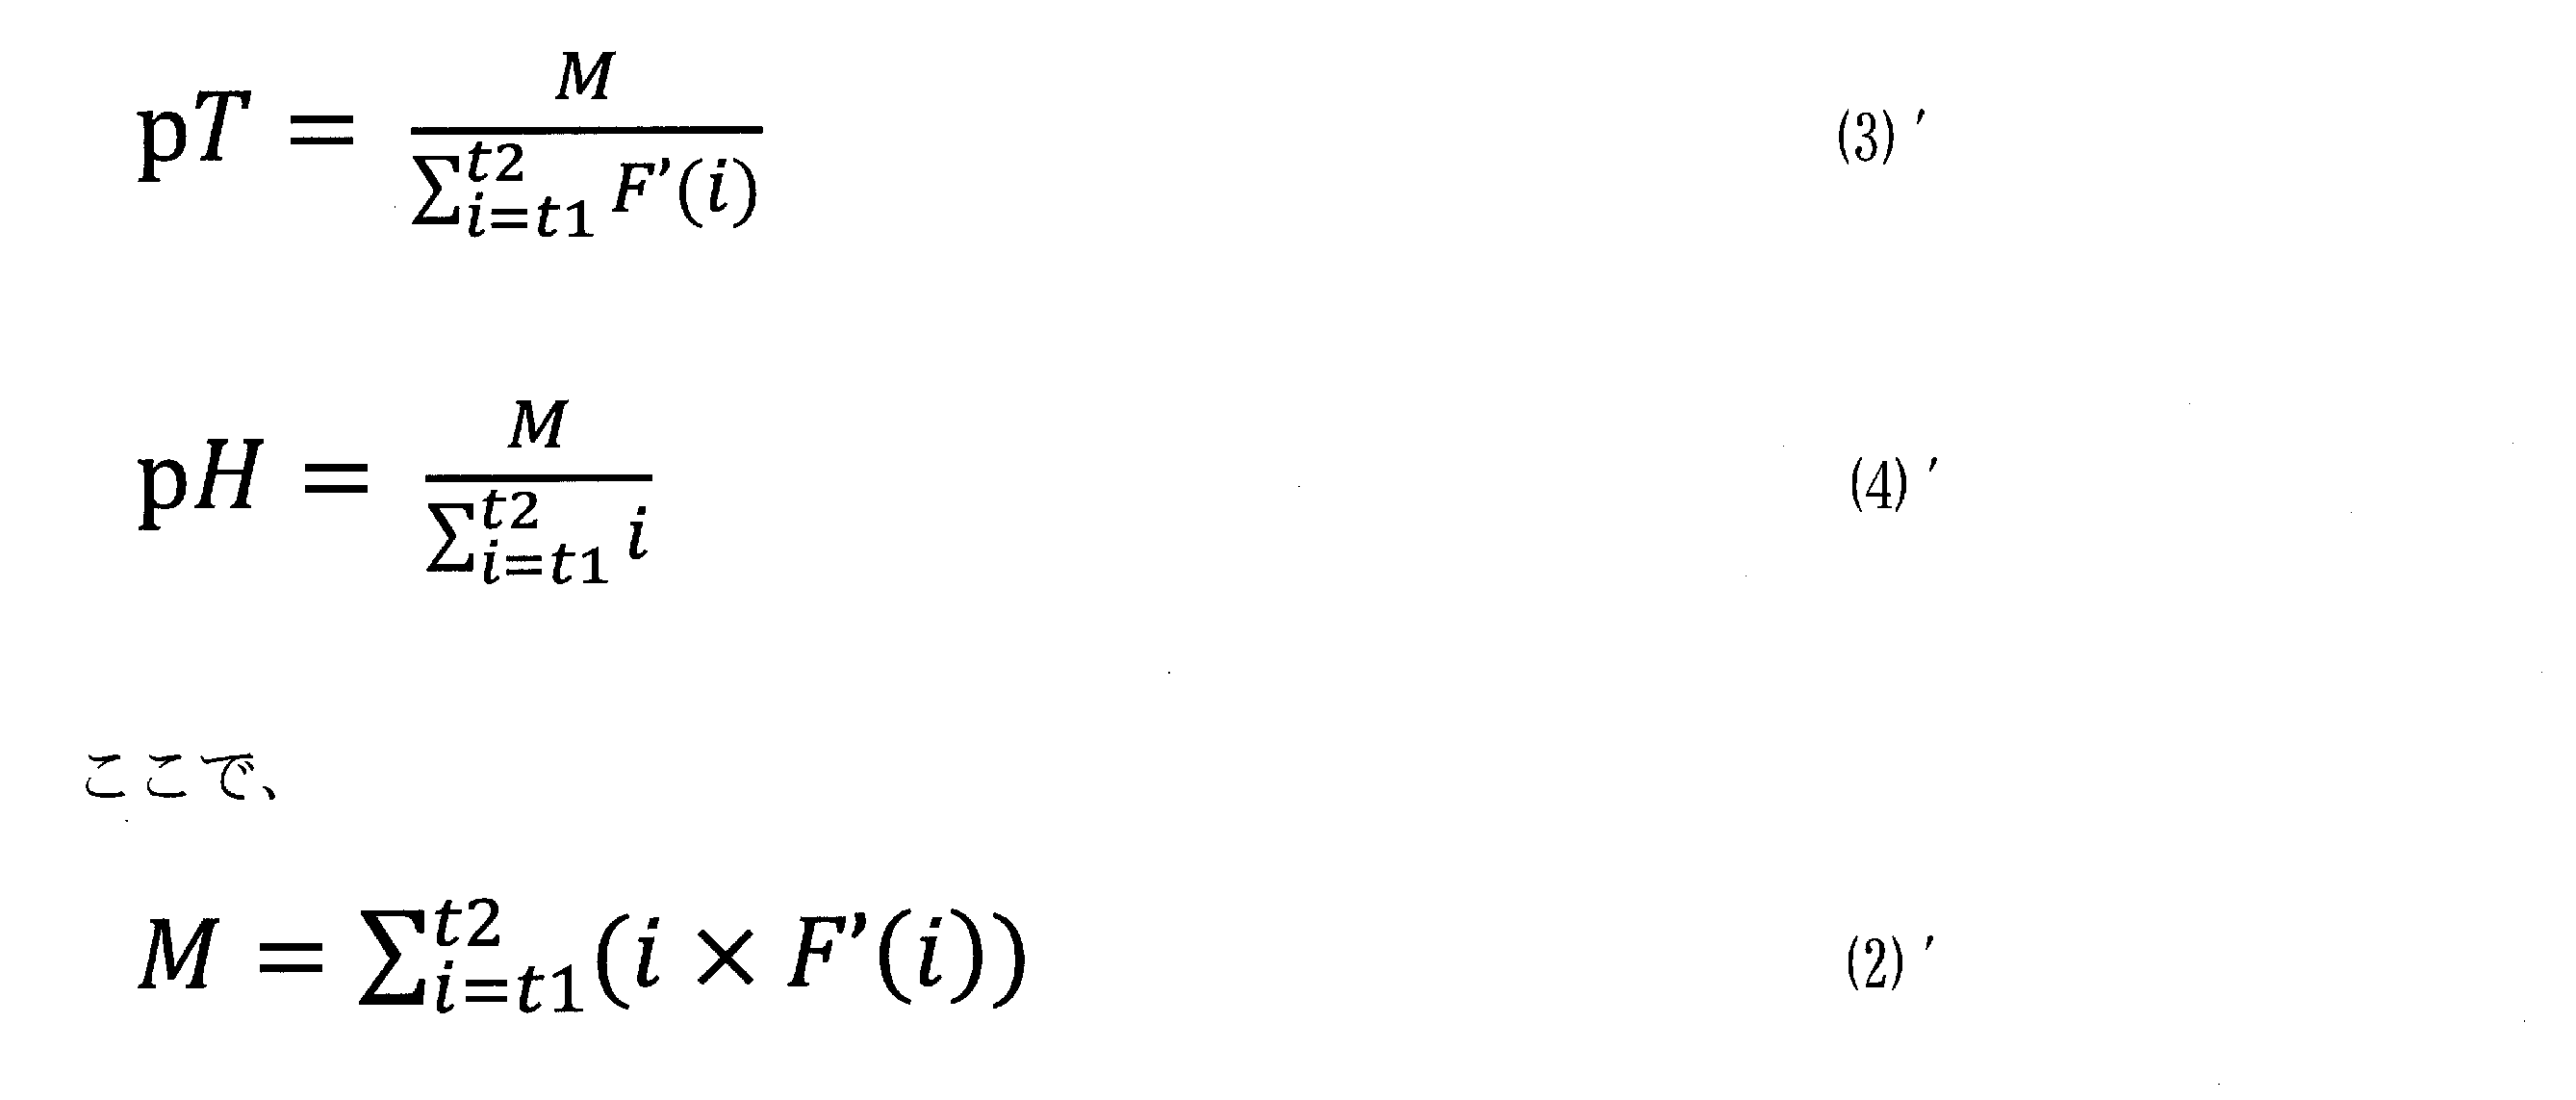
前記pWが、前記t1からt2までのF’(t)≧pHとなる時間長であり、
前記pNsが、該演算対象域中で、F’(t)が最大値を示す時間よりも小さく且つF’(t)=xを示す時間のうち、最大の時間であり、
前記pNeが、該演算対象域中で、F’(t)が最大値を示す時間よりも大きく且つF’(t)=xを示す時間のうち、最小の時間であり、
前記pNが、pNsからpNeまでの時間長であり、
前記pABが、該pHと該pBとの比を表し、
前記pAWが、該pHと該pWとの比を表し、
前記pTBが、該pTと該pBとの比を表し、
前記pTWが、該pTと該pWとの比を表す、
請求項3記載の分析方法。 - 前記凝固加速度に関する波形をF’(t)(tは時間)、F’(t)が所定値xである時間をt1、t2(t1<t2)とするとき、前記演算対象域はF’(t)≦xを満たす領域であり、前記mT及びmHは下記式で表され、

前記mWが、前記t1からt2までのF’(t)≦mHとなる時間長であり、
前記mNsが、該演算対象域中で、F’(t)が最小値を示す時間よりも小さく且つF’(t)=xを示す時間のうち、最大の時間であり、
前記mNeが、該演算対象域中で、F’(t)が最小値を示す時間よりも大きく且つF’(t)=xを示す時間のうち、最小の時間であり、
前記mNが、mNsからmNeまでの時間長であり、
前記mABが、該mHと該mBとの比を表し、
前記mAWが、該mHと該mWとの比を表し、
前記mTBが、該mTと該mBとの比を表し、
前記mTWが、該mTと該mWとの比を表す、
請求項3記載の分析方法。 - 前記所定値xが、前記F(t)の最大値の0.5~99%であるか、前記F’(t)のプラスピークの最大値の0.5~99%であるか、又は前記F’(t)のマイナスピークの最小値の0.5~99%である請求項4~6のいずれか1項記載の分析方法。
- 前記複数の演算対象域が5~20個の異なる領域である、請求項2~7のいずれか1項記載の分析方法。
- 前記判定が、前記複数のパラメータ群を、複数のテンプレート血液検体についての対応するパラメータ群と比較することと、該比較の結果に基づいて、前記被検血液検体における凝固因子の活性レベル又は活性異常を判定することとを含み、
該テンプレート血液検体が、該凝固因子の活性レベル又は活性異常の有無が既知である血液検体である、
請求項1~8のいずれか1項記載の分析方法。 - 前記比較が、前記被検血液検体についてのパラメータ群と、前記複数のテンプレート血液検体についての対応するパラメータ群の各々との間での相関を求めることを含む、請求項9記載の分析方法。
- 前記判定が、前記相関が所定の条件を満たすテンプレート血液検体を選出することと、選出したテンプレート血液検体における前記凝固因子の活性レベル又は活性異常を、前記被検血液検体における凝固因子の活性レベル又は活性異常と判定することを含む、請求項10記載の分析方法。
- 前記凝固因子が血液凝固第VIII因子または血液凝固第IX因子である、請求項1~11のいずれか1項記載の分析方法。
- 前記判定が、前記血友病A患者由来の被検血液検体を判定することを含む、請求項12記載の分析方法。
- 前記判定が、重症、中等症又は軽症の血友病A患者由来の被検血液検体を判定することを含む、請求項12記載の分析方法。
- 前記判定が、Very-Severe Haemophilia A、Modestly-Severe Haemophilia A、中等症又は軽症の血友病A患者由来の被検血液検体を判定することを含む、請求項12記載の分析方法。
- 前記判定が、前記血友病B患者由来の被検血液検体を判定することを含む、請求項12記載の分析方法。
- 前記判定が、重症、中等症又は軽症の血友病B患者由来の被検血液検体を判定することを含む、請求項12記載の分析方法。
- 血液凝固第VIII因子が異常ではないと判定された被検血液検体における血液凝固第IX因子の活性レベル又は活性異常を判定することを含む第2の判定工程をさらに含み、
該第2の判定工程が、該被検血液検体についての前記パラメータ群を、血液凝固第IX因子の活性レベル又は活性異常の有無が既知である複数のテンプレート血液検体についての対応するパラメータ群と比較することと、該比較の結果に基づいて、前記被検血液検体における血液凝固第IX因子の活性レベル又は活性異常を判定することとを含む、
請求項12記載の分析方法。 - 前記判定が、前記血友病B患者由来の被検血液検体を判定することを含む、請求項18記載の分析方法。
- 前記判定が、重症、中等症又は軽症の血友病B患者由来の被検血液検体を判定することを含む、請求項18記載の分析方法。
- 請求項1~20のいずれか1項記載の血液検体の分析方法を行うためのプログラム。
- 請求項1~20のいずれか1項記載の血液検体の分析方法を行うための装置。
Priority Applications (4)
| Application Number | Priority Date | Filing Date | Title |
|---|---|---|---|
| JP2020568645A JP7402468B2 (ja) | 2019-01-31 | 2020-01-31 | 血液検体の血液凝固特性の分析方法 |
| US17/427,000 US20220146537A1 (en) | 2019-01-31 | 2020-01-31 | Method for analyzing blood coagulation characteristics of blood specimen |
| CN202080011260.2A CN113366319A (zh) | 2019-01-31 | 2020-01-31 | 血液检体的凝血特性的分析方法 |
| EP20749235.6A EP3919913A4 (en) | 2019-01-31 | 2020-01-31 | PROCEDURE FOR ANALYZING BLOOD COAGULATION PROPERTIES OF A BLOOD SAMPLE |
Applications Claiming Priority (2)
| Application Number | Priority Date | Filing Date | Title |
|---|---|---|---|
| JP2019016474 | 2019-01-31 | ||
| JP2019-016474 | 2019-01-31 |
Publications (1)
| Publication Number | Publication Date |
|---|---|
| WO2020158948A1 true WO2020158948A1 (ja) | 2020-08-06 |
Family
ID=71841047
Family Applications (1)
| Application Number | Title | Priority Date | Filing Date |
|---|---|---|---|
| PCT/JP2020/003796 WO2020158948A1 (ja) | 2019-01-31 | 2020-01-31 | 血液検体の血液凝固特性の分析方法 |
Country Status (5)
| Country | Link |
|---|---|
| US (1) | US20220146537A1 (ja) |
| EP (1) | EP3919913A4 (ja) |
| JP (1) | JP7402468B2 (ja) |
| CN (1) | CN113366319A (ja) |
| WO (1) | WO2020158948A1 (ja) |
Cited By (5)
| Publication number | Priority date | Publication date | Assignee | Title |
|---|---|---|---|---|
| WO2022054819A1 (ja) * | 2020-09-08 | 2022-03-17 | 積水メディカル株式会社 | 血液凝固反応の分析方法 |
| WO2022092248A1 (ja) * | 2020-10-29 | 2022-05-05 | 積水メディカル株式会社 | 血液凝固反応の検出方法 |
| WO2022186381A1 (ja) * | 2021-03-05 | 2022-09-09 | 積水メディカル株式会社 | 凝固時間延長要因の推定方法 |
| EP4060348A2 (en) | 2021-03-19 | 2022-09-21 | Sysmex Corporation | Analysis method, analysis device, analysis system, and analysis program for analyzing a bleeding tendency of a subject |
| WO2023032978A1 (ja) * | 2021-08-31 | 2023-03-09 | 積水メディカル株式会社 | 血液凝固反応異常の検出方法 |
Families Citing this family (1)
| Publication number | Priority date | Publication date | Assignee | Title |
|---|---|---|---|---|
| EP4116714A4 (en) * | 2020-03-06 | 2024-01-10 | Sekisui Medical Co Ltd | METHOD FOR MEASURING BLOOD COAGULATION DURATION |
Citations (6)
| Publication number | Priority date | Publication date | Assignee | Title |
|---|---|---|---|---|
| US6524861B1 (en) * | 1999-01-22 | 2003-02-25 | Medical Laboratory Automation, Inc. | Blood coagulation analyzer |
| JP2016118442A (ja) | 2014-12-19 | 2016-06-30 | 公立大学法人奈良県立医科大学 | 血液検体を判定するための方法、システム及びコンピュータプログラム、並びに血液検体分析装置 |
| JP2016194426A (ja) | 2015-03-31 | 2016-11-17 | 学校法人東日本学園 | 血液検体を判定するための方法、装置及びコンピュータプログラム、並びに血液検体分析装置 |
| JP2017106925A (ja) | 2015-04-24 | 2017-06-15 | 公立大学法人奈良県立医科大学 | 血液検体の凝固能の評価方法、並びにその方法に用いるための試薬、試薬キット及び装置 |
| JP2018017619A (ja) | 2016-07-28 | 2018-02-01 | 公立大学法人奈良県立医科大学 | 血友病の重症度の判定方法及び血液検体分析装置 |
| JP2019086518A (ja) * | 2017-11-07 | 2019-06-06 | 積水メディカル株式会社 | 血液凝固機能の評価方法 |
Family Cites Families (5)
| Publication number | Priority date | Publication date | Assignee | Title |
|---|---|---|---|---|
| US7957793B2 (en) * | 2004-12-22 | 2011-06-07 | Wisconsin Alumni Research Foundation | Methods for identifying neuronal spikes |
| WO2012173260A1 (ja) * | 2011-06-17 | 2012-12-20 | 学校法人東日本学園・北海道医療大学 | ループスアンチコアグラント検出用血液凝固時間の測定方法 |
| US20130344519A1 (en) * | 2012-06-25 | 2013-12-26 | Bayer Healthcare Llc | Methods and systems for assessment of turbidity kinetics (waveform analysis) in coagulation testing |
| US9739733B2 (en) * | 2012-12-07 | 2017-08-22 | T2 Biosystems, Inc. | Methods for monitoring tight clot formation |
| JP7002718B2 (ja) * | 2017-04-24 | 2022-02-10 | シスメックス株式会社 | 血液検体の分析方法、分析装置及びコンピュータプログラム |
-
2020
- 2020-01-31 CN CN202080011260.2A patent/CN113366319A/zh active Pending
- 2020-01-31 US US17/427,000 patent/US20220146537A1/en active Pending
- 2020-01-31 EP EP20749235.6A patent/EP3919913A4/en active Pending
- 2020-01-31 WO PCT/JP2020/003796 patent/WO2020158948A1/ja unknown
- 2020-01-31 JP JP2020568645A patent/JP7402468B2/ja active Active
Patent Citations (6)
| Publication number | Priority date | Publication date | Assignee | Title |
|---|---|---|---|---|
| US6524861B1 (en) * | 1999-01-22 | 2003-02-25 | Medical Laboratory Automation, Inc. | Blood coagulation analyzer |
| JP2016118442A (ja) | 2014-12-19 | 2016-06-30 | 公立大学法人奈良県立医科大学 | 血液検体を判定するための方法、システム及びコンピュータプログラム、並びに血液検体分析装置 |
| JP2016194426A (ja) | 2015-03-31 | 2016-11-17 | 学校法人東日本学園 | 血液検体を判定するための方法、装置及びコンピュータプログラム、並びに血液検体分析装置 |
| JP2017106925A (ja) | 2015-04-24 | 2017-06-15 | 公立大学法人奈良県立医科大学 | 血液検体の凝固能の評価方法、並びにその方法に用いるための試薬、試薬キット及び装置 |
| JP2018017619A (ja) | 2016-07-28 | 2018-02-01 | 公立大学法人奈良県立医科大学 | 血友病の重症度の判定方法及び血液検体分析装置 |
| JP2019086518A (ja) * | 2017-11-07 | 2019-06-06 | 積水メディカル株式会社 | 血液凝固機能の評価方法 |
Non-Patent Citations (7)
| Title |
|---|
| BRITISH JOURNAL OF HAEMATOLOGY, vol. 98, 1997, pages 68 - 73 |
| NISHIYAMA, ATSUKO ET AL.: "O-056 / P-080 Detection of trace amount of factor IX in severe hemophilia B by clot waveform analysis", JAPANESE JOURNAL OF THROMBOSIS AND HEMOSTASIS, vol. 29, no. 2, 30 November 2017 (2017-11-30), JP, pages 184, XP009529129, ISSN: 0915-7441 * |
| OGIWARA, KEN'ICHI: "O-038 / P069: Development of a diagnostic algorithm for hemophilia A by template matching of APTT clot waveform", JAPANESE JOURNAL OF THROMBOSIS AND HEMOSTASIS, vol. 30, no. 2, 1 May 2019 (2019-05-01), JP, pages 411, XP009527869, ISSN: 0915-7441 * |
| See also references of EP3919913A4 |
| TOMOKO MATSUMOTOMIDORI SHIMA, CLOT WAVEFORM ANALYSIS AND ITS APPLICATION TO THE DETECTION OF VERY LOW LEVELS OF FACTOR VIII ACTIVITY, vol. 14, no. 2, 2003, pages 122 - 127 |
| WADA, HIDEO: "APTT waveform", JAPANESE JOURNAL OF THROMBOSIS AND HEMOSTASIS, vol. 29, no. 4, 10 August 2018 (2018-08-10), pages 413 - 420, XP055809543 * |
| YAMASAKI, NAOYA: "PS2-37-7 Is the result of Colt Waveform Analysis (CWA) different in hemophilia A and B?", RINSHO KETSUEKI - JAPANESE JOURNAL OF CLINICAL HEMATOLOGY,, vol. 58, no. 9, 30 November 2016 (2016-11-30), JP , pages 1754, XP009529130, ISSN: 0485-1439 * |
Cited By (6)
| Publication number | Priority date | Publication date | Assignee | Title |
|---|---|---|---|---|
| WO2022054819A1 (ja) * | 2020-09-08 | 2022-03-17 | 積水メディカル株式会社 | 血液凝固反応の分析方法 |
| WO2022092248A1 (ja) * | 2020-10-29 | 2022-05-05 | 積水メディカル株式会社 | 血液凝固反応の検出方法 |
| WO2022186381A1 (ja) * | 2021-03-05 | 2022-09-09 | 積水メディカル株式会社 | 凝固時間延長要因の推定方法 |
| EP4060348A2 (en) | 2021-03-19 | 2022-09-21 | Sysmex Corporation | Analysis method, analysis device, analysis system, and analysis program for analyzing a bleeding tendency of a subject |
| EP4060348A3 (en) * | 2021-03-19 | 2022-09-28 | Sysmex Corporation | Analysis method, analysis device, analysis system, and analysis program for analyzing a bleeding tendency of a subject |
| WO2023032978A1 (ja) * | 2021-08-31 | 2023-03-09 | 積水メディカル株式会社 | 血液凝固反応異常の検出方法 |
Also Published As
| Publication number | Publication date |
|---|---|
| CN113366319A (zh) | 2021-09-07 |
| EP3919913A4 (en) | 2022-11-09 |
| JPWO2020158948A1 (ja) | 2021-12-02 |
| EP3919913A1 (en) | 2021-12-08 |
| JP7402468B2 (ja) | 2023-12-21 |
| US20220146537A1 (en) | 2022-05-12 |
Similar Documents
| Publication | Publication Date | Title |
|---|---|---|
| WO2020158948A1 (ja) | 血液検体の血液凝固特性の分析方法 | |
| JP2019086517A (ja) | 血液凝固機能の評価方法 | |
| WO2020101025A1 (ja) | 分析方法、分析装置及び分析プログラム | |
| JP6811975B2 (ja) | Aptt延長要因推定システム | |
| JP2019086518A (ja) | 血液凝固機能の評価方法 | |
| JP7458037B2 (ja) | 凝固因子インヒビター力価の測定方法 | |
| Marija et al. | Blood-gas vs. Central-Laboratory analyzers: interchangeability and reference intervals for sodium, potassium, glucose, lactate and hemoglobin | |
| EP3136104B1 (en) | Blood sample analyzing method and blood sample analyzer | |
| EP4212880A1 (en) | Blood coagulation reaction analysis method | |
| CN109073662A (zh) | 用于鉴定与抗磷脂综合征相关的狼疮抗凝物(la)的方法和试剂盒 | |
| JP7491638B2 (ja) | 血液分析方法 | |
| CA2514743C (en) | Performance improvement for hematology analysis | |
| WO2021229556A1 (ja) | 血液分析方法 | |
| US20230213497A1 (en) | Method for measuring blood coagulation time | |
| EP4116714A1 (en) | Blood coagulation time measurement method | |
| EP4303586A1 (en) | Method for estimating factor of prolonged coagulation time | |
| Lim et al. | Between and within calibration variation: implications for internal quality control rules | |
| Tantanate | Performance Evaluation of the Coapresta® 2000 Automated Coagulation analyzer for Screening Coagulogram |
Legal Events
| Date | Code | Title | Description |
|---|---|---|---|
| 121 | Ep: the epo has been informed by wipo that ep was designated in this application |
Ref document number: 20749235 Country of ref document: EP Kind code of ref document: A1 |
|
| ENP | Entry into the national phase |
Ref document number: 2020568645 Country of ref document: JP Kind code of ref document: A |
|
| NENP | Non-entry into the national phase |
Ref country code: DE |
|
| ENP | Entry into the national phase |
Ref document number: 2020749235 Country of ref document: EP Effective date: 20210831 |