WO2020137147A1 - 元素分析装置、元素分析装置用プログラム、及び元素分析方法 - Google Patents
元素分析装置、元素分析装置用プログラム、及び元素分析方法 Download PDFInfo
- Publication number
- WO2020137147A1 WO2020137147A1 PCT/JP2019/042786 JP2019042786W WO2020137147A1 WO 2020137147 A1 WO2020137147 A1 WO 2020137147A1 JP 2019042786 W JP2019042786 W JP 2019042786W WO 2020137147 A1 WO2020137147 A1 WO 2020137147A1
- Authority
- WO
- WIPO (PCT)
- Prior art keywords
- point
- signal intensity
- peak
- end point
- strength
- Prior art date
- Legal status (The legal status is an assumption and is not a legal conclusion. Google has not performed a legal analysis and makes no representation as to the accuracy of the status listed.)
- Ceased
Links
Images



Classifications
-
- G—PHYSICS
- G01—MEASURING; TESTING
- G01N—INVESTIGATING OR ANALYSING MATERIALS BY DETERMINING THEIR CHEMICAL OR PHYSICAL PROPERTIES
- G01N31/00—Investigating or analysing non-biological materials by the use of the chemical methods specified in the subgroup; Apparatus specially adapted for such methods
-
- G—PHYSICS
- G01—MEASURING; TESTING
- G01N—INVESTIGATING OR ANALYSING MATERIALS BY DETERMINING THEIR CHEMICAL OR PHYSICAL PROPERTIES
- G01N31/00—Investigating or analysing non-biological materials by the use of the chemical methods specified in the subgroup; Apparatus specially adapted for such methods
- G01N31/12—Investigating or analysing non-biological materials by the use of the chemical methods specified in the subgroup; Apparatus specially adapted for such methods using combustion
Definitions
- the present invention relates to an elemental analyzer, a program for the elemental analyzer, and an elemental analysis method.
- Patent Document 1 As a conventional elemental analysis device, as shown in Patent Document 1, a sample contained in a graphite crucible is heated and melted, and a gas generated at that time is analyzed to measure an element contained in the sample. There is.
- the temporal change of the signal intensity obtained by the gas detector that is, the spectrum of the signal intensity is based on the signal intensity due to the gas generated from the graphite crucible, and the gas due to the gas generated from the sample thereon. Since the signal intensities are superimposed, the baseline correction is necessary to calculate the concentrations of various components contained in the sample.
- the spectrum of the above-mentioned signal intensity becomes lower after the end point of falling of the peak than before before the rising point of the peak, as shown in FIG. This is because when the sample melts, the resistance of the sample and the graphite crucible to the current flowing in the graphite crucible changes, the temperature of the graphite crucible changes, and the amount of gas generated from the graphite crucible changes. Is. Depending on the type of sample and the element to be measured, there may be a case where the peak after the peak end point is higher than before the peak rise point in the signal intensity spectrum.
- the straight line L shown in FIG. 6, that is, the straight line L connecting the rising point and the falling end point of the peak is regarded as the change with time of the signal intensity due to the gas generated from the graphite crucible, and the straight line L is used as a base.
- Baseline correction was made as a line.
- the present inventor has diligently studied in order to further improve the analysis accuracy, and the melting of the sample is actually not a linear progression phenomenon as shown by a straight line L in FIG.
- the conventional baseline that is, the straight line L in FIG. 6
- the straight line L in FIG. 6 shows a temporal change in the signal intensity due to the gas generated from the graphite crucible. I found that there is no.
- the present invention has been made by the above-mentioned earnest studies, and by making it possible to perform baseline correction by using a baseline simulating a temporal change in the signal intensity due to the gas generated from the graphite crucible, it is possible to further improve the analysis accuracy.
- the main issue is to improve.
- the elemental analysis device is an elemental analysis device that analyzes a gas generated by heating a sample contained in a graphite crucible, and a signal intensity reception unit that receives a signal intensity obtained by a gas detector. And, using a correction function with a starting point strength that is the signal strength of the rising point of the peak of the spectrum showing the change over time of the signal strength, and an end point strength that is the signal strength of the falling end point of the peak, as a parameter, A baseline correction unit that performs baseline correction of the spectrum, wherein the correction function converges to the start point intensity and the end point intensity, and a straight line connecting these two points between the rising point and the falling end point. It is characterized in that it is a function having a portion having a different inclination from the inclination of.
- the correction function has a portion between the rising point and the falling end point of the peak that is different from the inclination of the straight line connecting these two points.
- the part can represent a baseline simulating a temporal change in the signal intensity due to the gas generated from the graphite crucible.
- the change in the actual gas amount generated from the graphite crucible is monotonically decreasing with the melting of the sample
- the end point strength is lower than the start point strength
- the correction function is more inclined than the straight line.
- it is a monotonically decreasing function with a small portion of.
- the correction function is preferably a function having an inflection point between the rising point and the falling end point. ..
- the inflection point is closer to the rising point side than the peak of the spectrum. It is preferable that
- the correction function is more than the peak of the spectrum or the peak. It is preferable that the rising point side converges to the end point strength.
- the program for elemental analysis device is a program used for an elemental analysis device for analyzing a gas generated by heating a sample contained in a graphite crucible, and a signal intensity obtained by a gas detector. And a signal strength acceptance unit that accepts the signal strength, a starting strength that is a signal strength at a rising point of a peak of a spectrum showing a temporal change of the signal strength, and a correction using an end strength that is a signal strength at a falling end point of the peak as a parameter.
- a function is used to cause a computer to perform a baseline correction of the spectrum as a baseline correction unit, wherein the correction function converges to the start point strength and the end point strength, and the rising point and the falling end. It is characterized in that it is a function having a portion having an inclination different from the inclination of the straight line connecting these two points between the points.
- the elemental analysis method according to the present invention is an elemental analysis method for analyzing a gas generated by heating a sample contained in a graphite crucible, and a signal strength receiving step of receiving a signal strength obtained by a gas detector. And a starting point intensity that is the signal intensity of the rising point of the peak of the spectrum showing the change over time of the signal intensity, and an end point intensity that is the signal intensity of the falling end point of the peak, using a correction function with the parameter, A baseline correction step of baseline-correcting the spectrum, wherein the correction function converges to the start point intensity and the end point intensity, and a straight line connecting these two points between the rising point and the falling end point.
- the method is characterized in that the function has a portion having a different inclination from the inclination of.
- the baseline can be corrected by using the baseline simulating the temporal change in the signal intensity due to the gas generated from the graphite crucible, and the analysis accuracy can be further improved.
- FIG. 3 is a diagram for explaining a function of a baseline correction unit according to the same embodiment.
- FIG. 3 is a diagram for explaining a correction function according to the same embodiment.
- FIG. 3 is a diagram for explaining a correction function according to the same embodiment.
- the element analysis device 100 of the present embodiment heats and melts a metal sample or a ceramic sample (hereinafter, also simply referred to as a sample) housed in the crucible R, and analyzes the gas component generated at that time to analyze the gas component. The element contained in the sample is measured.
- the elemental analysis device 100 has a gas flow passage 2 through which a sample gas generated in the heating furnace 1 is circulated together with a carrier gas (for example, He gas).
- a carrier gas for example, He gas.
- the CO detector 3, the oxidizing unit 4, the CO 2 detector 5, the H 2 O detector 6, the CO 2 removing unit 7, the H 2 O removing unit 8 and the N 2 detector 9 are provided in series in this order. There is. In addition, it is not always necessary to include all of these detectors, and the number and arrangement of the detectors may be changed appropriately.
- the CO detector 3 detects carbon monoxide (CO) contained in the sample gas and measures (detects) its concentration, and is composed of a non-dispersive infrared gas analyzer (NDIR).
- CO carbon monoxide
- the oxidizing unit 4 is provided on the downstream side of the CO detector 3, oxidizes carbon monoxide (CO) contained in the sample gas into carbon dioxide (CO 2 ), and hydrogen (H) into water (H 2 O). It is oxidized to form water vapor.
- the oxidation part 4 of the present embodiment is configured by using, for example, copper oxide (CuO), and specifically, is configured by filling a quartz tube with copper oxide (CuO), and the copper oxide (CuO) Is heated to about 600 degrees. As a heating method of this copper oxide (CuO), a method of heating with a heating resistor can be considered.
- the CO 2 detector 5 detects carbon dioxide (CO 2 ) contained in the sample gas and measures the concentration thereof, and is composed of a non-dispersive infrared gas analyzer (NDIR).
- NDIR non-dispersive infrared gas analyzer
- the H 2 O detector 6 detects water (water vapor) contained in the sample gas and measures the concentration thereof, and is composed of a non-dispersive infrared gas analyzer (NDIR).
- NDIR non-dispersive infrared gas analyzer
- the CO 2 removing unit 7 adsorbs and removes carbon dioxide (CO 2 ) from the sample gas that has passed through the oxidizing unit 6, and does not react with or adsorb nitrogen (N 2 ) contained in the sample gas.
- CO 2 carbon dioxide
- N 2 adsorb nitrogen
- ascarite or zeolite-based molecular sieve or the like can be used.
- the H 2 O removing unit 8 adsorbs and removes water (water vapor) from the sample gas that has passed through the oxidizing unit 6, and does not react with or adsorb nitrogen (N 2 ) contained in the sample gas.
- N 2 nitrogen
- magnesium perchlorate or calcium chloride can be used.
- the N 2 detector 9 detects nitrogen (N 2 ) contained in the sample gas and measures the concentration thereof, and is composed of a thermal conductivity type analyzer (TCD).
- TCD thermal conductivity type analyzer
- the measurement signal (measurement value indicating the concentration of each gas component) obtained by each detector is output to the arithmetic unit 10.
- the arithmetic unit 10 is a general-purpose or dedicated computer including, for example, a CPU, an internal memory, an input/output interface, an AD converter, and the like.
- the arithmetic unit 10 may be configured using a discrete analog circuit using a buffer, an amplifier, a comparator, etc. instead of using a computer.
- the arithmetic unit 10 operates the CPU and its peripheral devices based on a program stored in a predetermined area of the internal memory to output measurement signals obtained by the detectors.
- a signal intensity receiving unit 11 that receives the signal
- a baseline correction unit 12 that baseline-corrects a spectrum showing a change in the measured signal intensity over time
- the concentrations of various components contained in the gas are calculated based on the baseline-corrected measured signal intensity. It is configured to exert the functions of the concentration calculating unit 13 and the like.
- the measurement spectrum S of the measurement signal intensity (hereinafter, also referred to as the measurement spectrum S), as shown in FIG. 3, a peak having a height corresponding to the concentration of the detection component contained in the gas appears.
- the signal intensity receiving unit 11 receives the measurement signal intensity from the non-dispersive infrared gas analyzer (NDIR) configuring the CO detector 3 and the CO 2 detector 5
- the measurement spectrum S is graphite.
- the signal intensity due to the gas generated from the crucible is used as a base, and the signal intensity due to the gas generated from the sample is superimposed on it.
- the baseline correction unit 12 removes the influence of the signal intensity due to the gas generated from the graphite crucible from the measurement spectrum S. Specifically, as shown in FIG. The baseline BL that simulates the temporal change of the signal intensity of is created, and the baseline BL is subtracted from the measurement spectrum S to perform the baseline correction.
- the baseline correction here is to remove the influence of the signal intensity due to the gas generated from the graphite crucible from the measurement spectrum S, and specifically, according to the distance from the baseline BL to the measurement spectrum S.
- the signal strength and the time series change of the signal strength are obtained as correction result data.
- a value obtained by subtracting the signal intensity of the baseline BL from the signal intensity of the measurement spectrum S at each time may be calculated as the correction result data, or may be calculated in a predetermined section (for example, from the rising point A).
- a value obtained by subtracting the integrated value of the signal intensity of the baseline BL in the section up to the end point B of fall) from the integrated value of the signal intensity of the measurement spectrum S in the same section may be calculated as the correction result data.
- the baseline correction unit 12 of the present embodiment is configured to create a correction function representing the baseline BL and perform the baseline correction using the correction function.
- the correction function is a function that represents the signal intensity with time as a variable.
- the measured spectrum S is lower after the falling end point B of the peak than before the rising point A of the peak, and is lower than the starting strength which is the signal strength of the rising point A.
- the end point strength which is the signal strength at the falling end point B, is lower.
- the gas generated from the graphite crucible include CO and CO 2 generated by the reaction between oxygen contained in the graphite crucible and carbon which is the material of the graphite crucible.
- the baseline correction unit 12 first identifies the rising point A of the peak of the measurement spectrum S and the falling end point B of the peak lower than the rising point A, and coordinates of these points, that is, the time of the rising point A. And the start point strength and the time and end point strength of the falling end point B are acquired.
- the baseline correction unit 12 creates a correction function that represents the baseline BL using the start point strength and the end point strength as parameters.
- the baseline correction unit 12 is configured to create, as a correction function, a function representing the signal intensity in at least the section from the rising point A to the falling end point B of the peak.
- the correction function here is a non-linear function that monotonically decreases.
- the baseline correction unit 12 of the present embodiment causes the baseline correction unit 12 to converge to the start point intensity and the end point intensity, in other words, the peak.
- the correction function is created so that the pre-peak line L1 before the rising point A and the post-peak line L2 after the falling end point B of FIG.
- this correction function has a steep portion X between the rising point A and the falling end point B, which has a smaller inclination than the straight line Z connecting these two points.
- the correction function has a value that is larger than the straight line Z on the rising point A side of the steep portion X and smaller than the straight line Z on the lower end point B side of the steep portion X.
- the inflection point is included in the steep portion X described above, and is set to the rising point A side of the peak of the measurement spectrum S here.
- the baseline correction unit 12 creates a correction function that represents the baseline BL, calculates the signal intensity corresponding to the distance from the baseline BL to the measurement spectrum S as correction result data, and then outputs the correction result. Based on the data, the concentration calculation unit 13 calculates the concentration of the component contained in the gas.
- the baseline correction unit 12 forms the steep portion X having a smaller slope than the straight line connecting these two points between the rising point A and the falling end point B of the peak. Since the baseline correction is performed using the correction function that is provided, the steep portion X makes it possible to create the baseline BL simulating the temporal change in the signal intensity due to the gas generated from the graphite crucible due to the gas. Since the baseline correction using the baseline BL created in this way is performed, the analysis accuracy can be further improved.
- the correction function has an inflection point on the rising point A side of the peak of the measurement spectrum S, it is possible to more likely simulate the temporal change in the signal intensity due to the gas generated from the graphite crucible.
- the present invention is not limited to the above embodiment.
- the correction function of the above-described embodiment uses an arctangent function having an inflection point on the rising point A side of the peak of the measurement spectrum S, but as shown in FIG. It may be a combined function, or a function having an inflection point on the side of the end point B lower than the peak of the measurement spectrum S as shown in FIG.
- the correction function may use one or more trigonometric functions such as a sine function, a cosine function, and a tangent function.
- the baseline correction unit 12 is configured to create the correction function in the above-described embodiment, but is configured to acquire the correction function from the correction function storage unit in which one or more correction functions are stored in advance. It may be done. Specifically, if the correction function storage unit stores a plurality of correction functions created in advance according to, for example, the type of sample, in association with the type of sample, the baseline correction unit As 12 there may be mentioned a configuration in which the type of sample is received and the correction function associated with that type is acquired. Further, as another aspect, the baseline correction unit 12 may be configured to acquire the one selected by the operator from the plurality of correction functions stored in the correction function storage unit.
- the plurality of correction functions in addition to the function representing the baseline having the steep portion X described in the above embodiment, for example, a function representing a straight line passing through the rising point A or the falling end point B and parallel to the horizontal axis. Or a function representing a straight line Z connecting the rising point A and the falling end point B.
- the signal intensity receiving part 11 demonstrated the case where the measured signal intensity from a non-dispersion type infrared gas analyzer (NDIR) was received, as the signal intensity receiving part 11, from other optical analyzers. It may be one that receives the measurement signal of.
- the signal strength acceptance unit 11 does not necessarily accept the measurement signal strengths from the CO detector 3 and the CO 2 detector 5, but accepts the signal strengths from the detectors that detect other components. Is also good. That is, the baseline correction of the above-described embodiment can be used not only for the non-dispersive infrared gas analyzer (NDIR) but also for other optical analyzers, and not only for the CO detector 3 and the CO 2 detector 5.
- the correction function is set to the starting point strength and the ending point strength. It may be a function that has a portion having a larger slope between the rising point A and the falling end point B while converging than the straight line connecting these two points.
- Elemental analysis device 10 Elemental analysis device 10
- Arithmetic device 11 Signal intensity acceptance unit 12
- Baseline correction unit S Measurement spectrum A
- Rising point B During Falling end point BL. ..Base line L1
- Pre-peak line L2 Pre-peak line
- the baseline can be corrected by using the baseline simulating the temporal change in the signal intensity due to the gas generated from the graphite crucible, and the analysis accuracy can be further improved.
Landscapes
- Life Sciences & Earth Sciences (AREA)
- Health & Medical Sciences (AREA)
- Chemical & Material Sciences (AREA)
- Biochemistry (AREA)
- Physics & Mathematics (AREA)
- Analytical Chemistry (AREA)
- Molecular Biology (AREA)
- General Health & Medical Sciences (AREA)
- General Physics & Mathematics (AREA)
- Immunology (AREA)
- Pathology (AREA)
- Engineering & Computer Science (AREA)
- Combustion & Propulsion (AREA)
- Investigating Or Analysing Materials By Optical Means (AREA)
- Investigating Or Analyzing Non-Biological Materials By The Use Of Chemical Means (AREA)
Abstract
黒鉛るつぼから発生するガス起因の信号強度の経時変化を模擬したベースラインを用いてベースライン補正をすることで、分析精度のさらなる向上を図るべく、黒鉛るつぼ内に収容された試料を加熱して生じるガスを分析する元素分析装置100であって、ガス検出器により得られた信号強度を受け付ける信号強度受付部11と、信号強度の経時変化を示すスペクトルSのピークの立ち上がり点Aの信号強度である始点強度、及び、当該ピークの下がり終わり点Bの信号強度である終点強度をパラメータとした補正関数を用いて、スペクトルSをベースライン補正するベースライン補正部12とを有し、補正関数を、始点強度及び終点強度に収束するとともに、立ち上がり点A及び下がり終わり点Bの間に、これら2点を結ぶ直線Zの傾きとは異なる傾きの部分Xを有する関数とした。
Description
本発明は、元素分析装置、元素分析装置用プログラム、及び元素分析方法に関するものである。
従来の元素分析装置としては、特許文献1に示すように、黒鉛るつぼ内に収容された試料を加熱溶融し、その際に発生するガスを分析することによって、試料に含まれる元素を測定するものがある。
かかる元素分析装置において、ガス検出器により得られた信号強度の経時変化、すなわち信号強度のスペクトルは、黒鉛るつぼから発生するガス起因の信号強度をベースとし、その上に試料から発生するガス起因の信号強度が重畳されたものであるから、試料に含まれる各種成分の濃度等の算出にはベースライン補正が必要である。
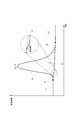
ところで、上述した信号強度のスペクトルは、図6に示すように、ピークの立ち上がり点の前よりも、ピークの下がり終わり点の後の方が低くなる。これは、試料が溶融することで、試料と黒鉛るつぼとが反応して黒鉛るつぼに流れる電流への抵抗値が変化し、黒鉛るつぼの温度が変わり、黒鉛るつぼから発生するガス量が変化するからである。なお、試料の種類や測定する元素によっては、信号強度スペクトルにおけるピークの立ち上がり点の前よりも、ピークの下がり終わり点の後の方が高くなる場合もある。
そこで、これまでは、同図6に示す直線L、すなわちピークの立ち上がり点及び下がり終わり点を結んだ直線Lを黒鉛るつぼから発生するガス起因の信号強度の経時変化とみなし、その直線Lをベースラインとしたベースライン補正がなされていた。
このような中で、本発明者は、分析精度のさらなる向上を図るべく鋭意検討を重ね、試料の溶融が図6の直線Lに示されるような線形的に進行する現象ではなく、実際には、例えばあるタイミングで非線形的に進行する現象であることに初めて着目し、従来のベースライン(すなわち、図6の直線L)では、黒鉛るつぼから発生するガス起因の信号強度の経時変化を表せていないことを見出した。
本発明は、上述した鋭意検討によりなされたものであり、黒鉛るつぼから発生するガス起因の信号強度の経時変化を模擬したベースラインを用いてベースライン補正できるようにすることで、分析精度のさらなる向上を図ることを主な課題とするものである。
すなわち、本発明に係る元素分析装置は、黒鉛るつぼ内に収容された試料を加熱して生じるガスを分析する元素分析装置であって、ガス検出器により得られた信号強度を受け付ける信号強度受付部と、前記信号強度の経時変化を示すスペクトルのピークの立ち上がり点の信号強度である始点強度、及び、当該ピークの下がり終わり点の信号強度である終点強度をパラメータとした補正関数を用いて、前記スペクトルをベースライン補正するベースライン補正部とを有し、前記補正関数が、前記始点強度及び前記終点強度に収束するとともに、前記立ち上がり点及び前記下がり終わり点の間に、これら2点を結ぶ直線の傾きとは異なる傾きの部分を有する関数であることを特徴とするものである。
このように構成された元素分析装置であれば、補正関数が、ピークの立ち上がり点及び下がり終わり点の間に、これら2点を結ぶ直線の傾きとは異なる傾きの部分を有するので、その異なる傾き部分によって、黒鉛るつぼから発生するガス起因の信号強度の経時変化を模擬したベースラインを表すことができる。これにより、この補正関数を用いてベースライン補正することで、分析精度のさらなる向上を図れる。
黒鉛るつぼから発生する実際のガス量の変化が試料の溶融に伴って単調減少であることに鑑みれば、前記始点強度よりも前記終点強度の方が低く、前記補正関数が、前記直線よりも傾きの小さい部分を有する単調減少関数であることが好ましい。
黒鉛るつぼから発生するガス起因の信号強度の経時変化をより尤もらしく模擬するためには、前記補正関数が、前記立ち上がり点及び前記下がり終わり点の間に変曲点を有する関数であることが好ましい。
溶融した試料と黒鉛るつぼとの反応は、試料の燃焼により生じるガス量がピークになるタイミングの手前で収束する傾向にあることから、前記変曲点が、前記スペクトルのピークよりも前記立ち上がり点側にあることが好ましい。
上述したように、試料と黒鉛るつぼとの反応が、試料の燃焼により生じるガス量がピークになるタイミングの手前で収束することに鑑みれば、前記補正関数が、前記スペクトルのピーク又は当該ピークよりも前記立ち上がり点側において、前記終点強度に収束することが好ましい。
また、本発明に係る元素分析装置用プログラムは、黒鉛るつぼ内に収容された試料を加熱して生じるガスを分析する元素分析装置に用いられるプログラムであって、ガス検出器により得られた信号強度を受け付ける信号強度受付部と、前記信号強度の経時変化を示すスペクトルのピークの立ち上がり点の信号強度である始点強度、及び、当該ピークの下がり終わり点の信号強度である終点強度をパラメータとした補正関数を用いて、前記スペクトルをベースライン補正するベースライン補正部としてのコンピュータに発揮させるものであり、前記補正関数が、前記始点強度及び前記終点強度に収束するとともに、前記立ち上がり点及び前記下がり終わり点の間に、これら2点を結ぶ直線の傾きとは異なる傾きの部分を有する関数であることを特徴とするものである。
さらに、本発明に係る元素分析方法は、黒鉛るつぼ内に収容された試料を加熱して生じるガスを分析する元素分析方法であって、ガス検出器により得られた信号強度を受け付ける信号強度受付ステップと、前記信号強度の経時変化を示すスペクトルのピークの立ち上がり点の信号強度である始点強度、及び、当該ピークの下がり終わり点の信号強度である終点強度をパラメータとした補正関数を用いて、前記スペクトルをベースライン補正するベースライン補正ステップとを有し、前記補正関数が、前記始点強度及び前記終点強度に収束するとともに、前記立ち上がり点及び前記下がり終わり点の間に、これら2点を結ぶ直線の傾きとは異なる傾きの部分を有する関数であることを特徴とする方法である。
このような元素分析装置用プログラムや元素分析方法であっても、上述した元素分析装置と同様の作用効果を奏し得る。
このように構成した本発明によれば、黒鉛るつぼから発生するガス起因の信号強度の経時変化を模擬したベースラインを用いてベースライン補正をすることができ、分析精度のさらなる向上を図れる。
以下に、本発明に係る元素分析装置を図面に基づいて説明する。
本実施形態の元素分析装置100は、るつぼR内に収容された金属試料又はセラミック試料(以下、単に試料ともいう。)を加熱溶融し、その際に発生するガス成分を分析することによって、当該試料内部に含まれている元素を測定するものである。
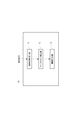
具体的に元素分析装置100は、図1に示すように、加熱炉1内に発生した試料ガスをキャリアガス(例えばHeガス等)とともに流通させるガス流路2を有し、当該ガス流路2にCO検出器3、酸化部4、CO2検出器5、H2O検出器6、CO2除去部7、H2O除去部8及びN2検出器9が、この順に直列に設けられている。なお、必ずしもこれらの検出器を全て備えている必要はなく、検出器の数や配置は適宜変更して構わない。
CO検出器3は、試料ガスに含まれる一酸化炭素(CO)を検出してその濃度を測定(検出)するものであり、非分散型赤外線ガス分析計(NDIR)により構成されている。
酸化部4は、CO検出器3の下流側に設けられ、試料ガスに含まれる一酸化炭素(CO)を二酸化炭素(CO2)に酸化するとともに、水素(H)を水(H2O)に酸化して水蒸気を生成するものである。本実施形態の酸化部4は、例えば酸化銅(CuO)を用いて構成されており、具体的には、石英管内に酸化銅(CuO)を充填することにより構成され、その酸化銅(CuO)は、約600度程度に加熱されている。この酸化銅(CuO)の加熱方法は、発熱抵抗体により加熱する方法等が考えられる。
CO2検出器5は、試料ガスに含まれる二酸化炭素(CO2)を検出してその濃度を測定するものであり、非分散型赤外線ガス分析計(NDIR)により構成されている。
H2O検出器6は、試料ガスに含まれる水(水蒸気)を検出してその濃度を測定するものであり、非分散型赤外線ガス分析計(NDIR)により構成されている。
CO2除去部7は、酸化部6を通過した試料ガスから二酸化炭素(CO2)を吸着して除去するものであり、試料ガスに含まれる窒素(N2)に対して反応及び吸着等しないものであり、例えば、アスカライト又はゼオライト系モレキュラーシーブ等を用いることができる。
H2O除去部8は、酸化部6を通過した試料ガスから水(水蒸気)を吸着して除去するものであり、試料ガスに含まれる窒素(N2)に対して反応及び吸着等しないものであり、例えば、過塩素酸マグネシウム又は塩化カルシウム等を用いることができる。
N2検出器9は、試料ガスに含まれる窒素(N2)を検出してその濃度を測定するものであり、熱伝導度型分析計(TCD)により構成されている。
各検出器により得られた測定信号(各ガス成分の濃度を示す測定値)は、演算装置10に出力される。
演算装置10は、例えばCPU、内部メモリ、入出力インタフェース、AD変換器等からなる汎用又は専用のコンピュータである。なお、演算装置10は、コンピュータによることなくバッファや増幅器、比較器等を用いたディスクリートアナログ回路を用いて構成しても構わない。
この演算装置10は、前記内部メモリの所定領域に格納してあるプログラムに基づいてCPUやその周辺機器等が作動することにより、図2に示すように、各検出器により得られた測定信号を受け付ける信号強度受付部11と、測定信号強度の経時変化を示すスペクトルをベースライン補正するベースライン補正部12と、ベースライン補正された測定信号強度に基づいてガスに含まれる各種成分の濃度を算出する濃度算出部13などの機能を発揮するように構成されている。
ここではベースライン補正部12が特徴的であるので、以下に詳述する。
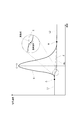
まず、測定信号強度のスペクトルS(以下、測定スペクトルSともいう)は、図3に示すように、ガスに含まれる検出成分の濃度に応じた高さのピークが現れるものである。ここで、例えばCO検出器3やCO2検出器5を構成する非分散型赤外線ガス分析計(NDIR)からの測定信号強度を信号強度受付部11が受け付けた場合、その測定スペクトルSは、黒鉛るつぼから発生するガス起因の信号強度をベースとし、その上に試料から発生するガス起因の信号強度が重畳されたものとなる。
そこで、ベースライン補正部12は、黒鉛るつぼから発生するガス起因の信号強度の影響を測定スペクトルSから除くものであり、具体的には、図3に示すように、黒鉛るつぼから発生するガス起因の信号強度の経時変化を模擬したベースラインBLを作成し、そのベースラインBLを測定スペクトルSから差し引くことでベースライン補正するように構成されている。
つまり、ここでいうベースライン補正とは、黒鉛るつぼから発生するガス起因の信号強度の影響を測定スペクトルSから除くことであり、具体的には、ベースラインBLから測定スペクトルSまでの距離に応じた信号強度やその信号強度の時系列変化を補正結果データとして得ることである。
なお、このベースライン補正としては、各時間それぞれにおいてベースラインBLの信号強度を測定スペクトルSの信号強度から差し引いた値を補正結果データとして算出しても良いし、所定区間(例えば立ち上がり点Aから下がり終わり点Bまでの区間)におけるベースラインBLの信号強度の積算値を同区間における測定スペクトルSの信号強度の積算値から差し引いた値を補正結果データとして算出しても良い。
なお、このベースライン補正としては、各時間それぞれにおいてベースラインBLの信号強度を測定スペクトルSの信号強度から差し引いた値を補正結果データとして算出しても良いし、所定区間(例えば立ち上がり点Aから下がり終わり点Bまでの区間)におけるベースラインBLの信号強度の積算値を同区間における測定スペクトルSの信号強度の積算値から差し引いた値を補正結果データとして算出しても良い。
本実施形態のベースライン補正部12は、ベースラインBLを表す補正関数を作成し、その補正関数を用いてベースライン補正するように構成されている。なお、補正関数は、時間を変数として信号強度を表す関数である。
ここで、測定スペクトルSは、図3に示すように、ピークの立ち上がり点Aの前よりも、ピークの下がり終わり点Bの後の方が低く、立ち上がり点Aの信号強度である始点強度よりも、下がり終わり点Bの信号強度である終点強度の方が低い。これは、試料が溶融することで、溶融した試料と黒鉛るつぼとが反応し、黒鉛るつぼに流れる電流に対する抵抗値が変化し、黒鉛るつぼの温度が変わり、黒鉛るつぼから発生するガス量が変化するからである。なお、この場合に黒鉛るつぼから発生するガスとしては、黒鉛るつぼに含まれる酸素と黒鉛るつぼの材質である炭素とが反応して生じるCOやCO2が挙げられる。
そこで、ベースライン補正部12は、まず測定スペクトルSのピークの立ち上がり点Aと、その立ち上がり点Aよりも低いピークの下がり終わり点Bを特定し、これらの点の座標、すなわち立ち上がり点Aの時間及び始点強度と、下がり終わり点Bの時間及び終点強度とを取得する。
そして、ベースライン補正部12は、始点強度及び終点強度をパラメータとしてベースラインBLを表す補正関数を作成する。
より詳細に説明すると、ベースライン補正部12は、図3に示すように、少なくともピークの立ち上がり点Aから下がり終わり点Bまでの区間における信号強度を表す関数を補正関数として作成するように構成されており、ここでの補正関数は、単調減少する非線形関数である。
ここで、測定スペクトルSのピーク前後は測定信号強度が殆ど変化せず安定していることから、本実施形態のベースライン補正部12は、始点強度及び終点強度に収束するように、言い換えればピークの立ち上がり点Aより前のピーク前ラインL1、及び、下がり終わり点Bより後のピーク後ラインL2が漸近線となるように補正関数を作成する。
そして、この補正関数は、図3に示すように、立ち上がり点A及び下がり終わり点Bの間に、これら2点を結ぶ直線Zよりも傾きが小さい部分である急峻部Xを有する。
より具体的に説明すると、補正関数は、急峻部Xよりも立ち上がり点A側では直線Zよりも値が大きくなり、急峻部Xよりも下がり終わり点B側では直線Zよりも値が小さくなるように作成されており、ここでは例えばアークタンジェント関数を含む関数である。なお、変曲点は、上述した急峻部Xに含まれており、ここでは測定スペクトルSのピークよりも立ち上がり点A側に設定されている。
このように、ベースライン補正部12は、ベースラインBLを表す補正関数を作成するとともに、そのベースラインBLから測定スペクトルSまでの距離に応じた信号強度を補正結果データとして算出し、その補正結果データに基づいて、ガスに含まれる成分の濃度等が濃度算出部13によって算出される。
このように構成された元素分析装置100によれば、ベースライン補正部12が、ピークの立ち上がり点A及び下がり終わり点Bの間に、これら2点を結ぶ直線よりも傾きが小さい急峻部Xを有する補正関数を用いてベースライン補正するので、その急峻部Xによって、黒鉛るつぼから発生するガス起因の信号強度の経時変化を模擬したベースラインBLを作成ることができる。そして、このように作成されたベースラインBLを用いたベースライン補正がなされるので、分析精度のさらなる向上を図れる。
また、補正関数が測定スペクトルSのピークよりも立ち上がり点A側に変曲点を有するので、黒鉛るつぼから発生するガス起因の信号強度の経時変化をより尤もらしく模擬することができる。
なお、本発明は前記実施形態に限られるものではない。
例えば、前記実施形態の補正関数は、測定スペクトルSのピークよりも立ち上がり点A側に変曲点を有するアークタンジェント関数を用いたものであったが、図4に示すように、複数の直線を組み合わせた関数であっても良いし、図5に示すように、測定スペクトルSのピークよりも下がり終わり点B側に変曲点を有する関数であっても良い。
また、補正関数は、サイン関数、コサイン関数、タンジェント関数などの1又は複数の三角関数を用いたものであっても良い。
また、補正関数は、サイン関数、コサイン関数、タンジェント関数などの1又は複数の三角関数を用いたものであっても良い。
さらに、ベースライン補正部12は、前記実施形態では補正関数を作成するように構成されていたが、1又は複数の補正関数を予め格納させた補正関数格納部から補正関数を取得するように構成されていても良い。
具体的には、補正関数格納部が、例えば試料の種類等に応じて予め作成された複数の補正関数を、その試料の種類と紐付けて格納している場合であれば、ベースライン補正部12としては、試料の種類を受け付けるとともに、その種類に紐付けられている補正関数を取得する構成が挙げられる。また、別の態様としては、ベースライン補正部12が、補正関数格納部に格納されている複数の補正関数の中から、オペレータが選択したものを取得するように構成されていても良い。
なお、複数の補正関数としては、前記実施形態で述べた急峻部Xを有するベースラインを表す関数の他、例えば立ち上がり点A又は下がり終わり点Bを通過し、横軸に平行な直線を表す関数や、立ち上がり点A及び下がり終わり点Bを結ぶ直線Zを表す関数などが挙げられる。
具体的には、補正関数格納部が、例えば試料の種類等に応じて予め作成された複数の補正関数を、その試料の種類と紐付けて格納している場合であれば、ベースライン補正部12としては、試料の種類を受け付けるとともに、その種類に紐付けられている補正関数を取得する構成が挙げられる。また、別の態様としては、ベースライン補正部12が、補正関数格納部に格納されている複数の補正関数の中から、オペレータが選択したものを取得するように構成されていても良い。
なお、複数の補正関数としては、前記実施形態で述べた急峻部Xを有するベースラインを表す関数の他、例えば立ち上がり点A又は下がり終わり点Bを通過し、横軸に平行な直線を表す関数や、立ち上がり点A及び下がり終わり点Bを結ぶ直線Zを表す関数などが挙げられる。
また、前記実施形態では、信号強度受付部11が非分散型赤外線ガス分析計(NDIR)からの測定信号強度を受け付ける場合について説明したが、信号強度受付部11としては、その他の光学分析計からの測定信号を受け付けるものであっても良い。
さらに、信号強度受付部11は、必ずしもCO検出器3及びCO2検出器5からの測定信号強度を受け付けるものに限らず、その他の成分を検出する検出器からの信号強度を受け付けるものであっても良い。
つまり、前記実施形態のベースライン補正は、非分散型赤外線ガス分析計(NDIR)のみならず、その他の光学分析計に用いることができるし、CO検出器3及びCO2検出器5のみならず、その他の成分を検出する検出器にも用いることができる。
なお、試料の種類や測定する元素によっては、立ち上がり点Aの信号強度よりも下がり終わり点Bの方が高くなる場合があり、このような場合においては、補正関数が、始点強度及び終点強度に収束するとともに、立ち上がり点A及び下がり終わり点Bの間に、これら2点を結ぶ直線よりも傾きの大きい部分を有する関数であっても良い。
さらに、信号強度受付部11は、必ずしもCO検出器3及びCO2検出器5からの測定信号強度を受け付けるものに限らず、その他の成分を検出する検出器からの信号強度を受け付けるものであっても良い。
つまり、前記実施形態のベースライン補正は、非分散型赤外線ガス分析計(NDIR)のみならず、その他の光学分析計に用いることができるし、CO検出器3及びCO2検出器5のみならず、その他の成分を検出する検出器にも用いることができる。
なお、試料の種類や測定する元素によっては、立ち上がり点Aの信号強度よりも下がり終わり点Bの方が高くなる場合があり、このような場合においては、補正関数が、始点強度及び終点強度に収束するとともに、立ち上がり点A及び下がり終わり点Bの間に、これら2点を結ぶ直線よりも傾きの大きい部分を有する関数であっても良い。
その他、本発明は前記各実施形態に限られず、その趣旨を逸脱しない範囲で種々の変形が可能であるのは言うまでもない。
100・・・元素分析装置
10 ・・・演算装置
11 ・・・信号強度受付部
12 ・・・ベースライン補正部
S ・・・測定スペクトル
A ・・・立ち上がり点
B ・・・下がり終わり点
BL ・・・ベースライン
L1 ・・・ピーク前ライン
L2 ・・・ピーク後ライン
X ・・・急峻部
Z ・・・直線
10 ・・・演算装置
11 ・・・信号強度受付部
12 ・・・ベースライン補正部
S ・・・測定スペクトル
A ・・・立ち上がり点
B ・・・下がり終わり点
BL ・・・ベースライン
L1 ・・・ピーク前ライン
L2 ・・・ピーク後ライン
X ・・・急峻部
Z ・・・直線
本発明によれば、黒鉛るつぼから発生するガス起因の信号強度の経時変化を模擬したベースラインを用いてベースライン補正をすることができ、分析精度のさらなる向上を図れる。
Claims (7)
- 黒鉛るつぼ内に収容された試料を加熱して生じるガスを分析する元素分析装置であって、
ガス検出器により得られた信号強度を受け付ける信号強度受付部と、
前記信号強度の経時変化を示すスペクトルのピークの立ち上がり点の信号強度である始点強度、及び、当該ピークの下がり終わり点の信号強度である終点強度をパラメータとした補正関数を用いて、前記スペクトルをベースライン補正するベースライン補正部とを有し、
前記補正関数が、前記始点強度及び前記終点強度に収束するとともに、前記立ち上がり点及び前記下がり終わり点の間に、これら2点を結ぶ直線の傾きとは異なる傾きの部分を有する関数である、元素分析装置。 - 前記始点強度よりも前記終点強度の方が低く、
前記補正関数が、前記直線よりも傾きの小さい部分を有する単調減少関数である、請求項1記載の元素分析装置。 - 前記補正関数が、前記立ち上がり点及び前記下がり終わり点の間に変曲点を有する関数である、請求項2記載の元素分析装置。
- 前記変曲点が、前記スペクトルのピークよりも前記立ち上がり点側にある、請求項3記載の元素分析装置。
- 前記補正関数が、前記スペクトルのピーク又は当該ピークよりも前記立ち上がり点側において、前記終点強度に収束する、請求項4記載の元素分析装置。
- 黒鉛るつぼ内に収容された試料を加熱して生じるガスを分析する元素分析装置に用いられるプログラムであって、
ガス検出器により得られた信号強度を受け付ける信号強度受付部と、
前記信号強度の経時変化を示すスペクトルのピークの立ち上がり点の信号強度である始点強度、及び、当該ピークの下がり終わり点の信号強度である終点強度をパラメータとした補正関数を用いて、前記スペクトルをベースライン補正するベースライン補正部としてのコンピュータに発揮させるものであり、
前記補正関数が、前記始点強度及び前記終点強度に収束するとともに、前記立ち上がり点及び前記下がり終わり点の間に、これら2点を結ぶ直線の傾きとは異なる傾きの部分を有する関数である、元素分析装置用プログラム。 - 黒鉛るつぼ内に収容された試料を加熱して生じるガスを分析する元素分析方法であって、
ガス検出器により得られた信号強度を受け付ける信号強度受付ステップと、
前記信号強度の経時変化を示すスペクトルのピークの立ち上がり点の信号強度である始点強度、及び、当該ピークの下がり終わり点の信号強度である終点強度をパラメータとした補正関数を用いて、前記スペクトルをベースライン補正するベースライン補正ステップとを有し、
前記補正関数が、前記始点強度及び前記終点強度に収束するとともに、前記立ち上がり点及び前記下がり終わり点の間に、これら2点を結ぶ直線の傾きとは異なる傾きの部分を有する関数である、元素分析方法。
Applications Claiming Priority (2)
| Application Number | Priority Date | Filing Date | Title |
|---|---|---|---|
| JP2018-242173 | 2018-12-26 | ||
| JP2018242173A JP2022065206A (ja) | 2018-12-26 | 2018-12-26 | 元素分析装置、元素分析装置用プログラム、及び元素分析方法 |
Publications (1)
| Publication Number | Publication Date |
|---|---|
| WO2020137147A1 true WO2020137147A1 (ja) | 2020-07-02 |
Family
ID=71128955
Family Applications (1)
| Application Number | Title | Priority Date | Filing Date |
|---|---|---|---|
| PCT/JP2019/042786 Ceased WO2020137147A1 (ja) | 2018-12-26 | 2019-10-31 | 元素分析装置、元素分析装置用プログラム、及び元素分析方法 |
Country Status (2)
| Country | Link |
|---|---|
| JP (1) | JP2022065206A (ja) |
| WO (1) | WO2020137147A1 (ja) |
Cited By (2)
| Publication number | Priority date | Publication date | Assignee | Title |
|---|---|---|---|---|
| WO2022091748A1 (ja) * | 2020-11-02 | 2022-05-05 | 株式会社堀場製作所 | 元素分析方法、元素分析装置、及び、元素分析装置用プログラム |
| CN120232823A (zh) * | 2025-05-29 | 2025-07-01 | 北京视酷科技有限公司 | 一种检验科用血液涂片质量智能检测方法 |
Families Citing this family (1)
| Publication number | Priority date | Publication date | Assignee | Title |
|---|---|---|---|---|
| WO2025062997A1 (ja) * | 2023-09-21 | 2025-03-27 | 株式会社堀場製作所 | 分析装置及び分析方法 |
Citations (11)
| Publication number | Priority date | Publication date | Assignee | Title |
|---|---|---|---|---|
| US4409336A (en) * | 1981-02-17 | 1983-10-11 | Standard Oil Company (Indiana) | Method of analysis for determining very low sulfur levels in volatilizable samples |
| JPS639861A (ja) * | 1986-06-30 | 1988-01-16 | Nippon Steel Corp | 固体試料の炭素分析方法および装置 |
| JPH0645883Y2 (ja) * | 1989-02-20 | 1994-11-24 | トキコ株式会社 | 炭素量測定装置 |
| JPH076969B2 (ja) * | 1985-06-07 | 1995-01-30 | 株式会社島津製作所 | 全炭素測定装置 |
| JPH07103900A (ja) * | 1993-10-07 | 1995-04-21 | Dkk Corp | 化学発光式窒素酸化物計におけるコンバータ変換効率の測定方法 |
| JP2745122B2 (ja) * | 1990-03-03 | 1998-04-28 | 株式会社 堀場製作所 | 加熱による試料分析方法 |
| JP2000275233A (ja) * | 1999-03-26 | 2000-10-06 | Horiba Ltd | 形態別窒素および全窒素の分析方法 |
| JP2007121319A (ja) * | 2002-05-29 | 2007-05-17 | Horiba Ltd | 含有酸素分析装置および含有酸素分析方法 |
| JP2012127806A (ja) * | 2010-12-15 | 2012-07-05 | Shimadzu Corp | 水質分析計 |
| WO2012093482A1 (ja) * | 2011-01-06 | 2012-07-12 | 株式会社島津製作所 | 全有機体炭素測定装置 |
| JP2013250061A (ja) * | 2012-05-30 | 2013-12-12 | Horiba Ltd | 元素分析装置 |
-
2018
- 2018-12-26 JP JP2018242173A patent/JP2022065206A/ja active Pending
-
2019
- 2019-10-31 WO PCT/JP2019/042786 patent/WO2020137147A1/ja not_active Ceased
Patent Citations (11)
| Publication number | Priority date | Publication date | Assignee | Title |
|---|---|---|---|---|
| US4409336A (en) * | 1981-02-17 | 1983-10-11 | Standard Oil Company (Indiana) | Method of analysis for determining very low sulfur levels in volatilizable samples |
| JPH076969B2 (ja) * | 1985-06-07 | 1995-01-30 | 株式会社島津製作所 | 全炭素測定装置 |
| JPS639861A (ja) * | 1986-06-30 | 1988-01-16 | Nippon Steel Corp | 固体試料の炭素分析方法および装置 |
| JPH0645883Y2 (ja) * | 1989-02-20 | 1994-11-24 | トキコ株式会社 | 炭素量測定装置 |
| JP2745122B2 (ja) * | 1990-03-03 | 1998-04-28 | 株式会社 堀場製作所 | 加熱による試料分析方法 |
| JPH07103900A (ja) * | 1993-10-07 | 1995-04-21 | Dkk Corp | 化学発光式窒素酸化物計におけるコンバータ変換効率の測定方法 |
| JP2000275233A (ja) * | 1999-03-26 | 2000-10-06 | Horiba Ltd | 形態別窒素および全窒素の分析方法 |
| JP2007121319A (ja) * | 2002-05-29 | 2007-05-17 | Horiba Ltd | 含有酸素分析装置および含有酸素分析方法 |
| JP2012127806A (ja) * | 2010-12-15 | 2012-07-05 | Shimadzu Corp | 水質分析計 |
| WO2012093482A1 (ja) * | 2011-01-06 | 2012-07-12 | 株式会社島津製作所 | 全有機体炭素測定装置 |
| JP2013250061A (ja) * | 2012-05-30 | 2013-12-12 | Horiba Ltd | 元素分析装置 |
Cited By (9)
| Publication number | Priority date | Publication date | Assignee | Title |
|---|---|---|---|---|
| WO2022091748A1 (ja) * | 2020-11-02 | 2022-05-05 | 株式会社堀場製作所 | 元素分析方法、元素分析装置、及び、元素分析装置用プログラム |
| JPWO2022091748A1 (ja) * | 2020-11-02 | 2022-05-05 | ||
| CN115667916A (zh) * | 2020-11-02 | 2023-01-31 | 株式会社堀场制作所 | 元素分析方法、元素分析装置和元素分析装置用程序 |
| US20230221291A1 (en) * | 2020-11-02 | 2023-07-13 | Horiba, Ltd. | Element analysis method, element analysis device, and non-transitory computer readable medium storing program for element analysis device |
| JP7322303B2 (ja) | 2020-11-02 | 2023-08-07 | 株式会社堀場製作所 | 元素分析方法、元素分析装置、及び、元素分析装置用プログラム |
| EP4145126A4 (en) * | 2020-11-02 | 2024-06-05 | HORIBA, Ltd. | ELEMENTAL ANALYSIS METHOD, ELEMENTAL ANALYSIS APPARATUS AND PROGRAM FOR THE ELEMENTAL ANALYSIS APPARATUS |
| US12467912B2 (en) * | 2020-11-02 | 2025-11-11 | Horiba, Ltd. | Element analysis method, element analysis device, and non-transitory computer readable medium storing program for element analysis device |
| CN115667916B (zh) * | 2020-11-02 | 2026-02-24 | 株式会社堀场制作所 | 元素分析方法、元素分析装置和存储介质 |
| CN120232823A (zh) * | 2025-05-29 | 2025-07-01 | 北京视酷科技有限公司 | 一种检验科用血液涂片质量智能检测方法 |
Also Published As
| Publication number | Publication date |
|---|---|
| JP2022065206A (ja) | 2022-04-27 |
Similar Documents
| Publication | Publication Date | Title |
|---|---|---|
| WO2020137147A1 (ja) | 元素分析装置、元素分析装置用プログラム、及び元素分析方法 | |
| Chao et al. | Absorption sensor for CO in combustion gases using 2.3 µm tunable diode lasers | |
| JP5211753B2 (ja) | クロマトグラフ用データ処理装置 | |
| EP3553491B1 (en) | Gas analyzing device and gas analyzing method | |
| JP5968083B2 (ja) | 元素分析装置 | |
| JP6530575B1 (ja) | 組成分析装置および組成分析方法 | |
| JP2010032264A (ja) | 元素分析装置 | |
| JP3656231B2 (ja) | 高精度窒素測定用分析システム | |
| JP2014085215A (ja) | 有機化合物による検量線を用いる各態炭素と窒素の統一分析測定システム | |
| JP6754687B2 (ja) | 元素分析装置及び元素分析方法 | |
| US20210318267A1 (en) | Element analysis device and element analysis method | |
| CN104458630A (zh) | 一种紫外差分气体分析仪的数据处理方法及系统 | |
| JP2010256268A (ja) | ガス分析装置 | |
| JP2024085507A (ja) | 分析装置及び分析方法 | |
| JP2008261865A (ja) | 揮発性有機化合物測定装置 | |
| JP2007024717A (ja) | 水質分析計 | |
| WO2015005074A1 (ja) | ガス成分測定装置 | |
| JP7322303B2 (ja) | 元素分析方法、元素分析装置、及び、元素分析装置用プログラム | |
| CN113466398A (zh) | 元素分析检测方法、元素分析检测系统及存储介质 | |
| CN114965836A (zh) | 基于紫外红外sf6分解气体检测方法的背景气体修正方法 | |
| JP4486837B2 (ja) | 燃料油中の特定成分濃度測定装置 | |
| Srivastava et al. | Temporal Behavior Analysis for the Impact of Combined Temperature and Humidity Variations on a Photoacoustic CO₂ Sensor | |
| JP3129840U (ja) | 揮発性有機化合物測定装置 | |
| Hermouet et al. | Determination of the fire behaviour of an acrylonitrile butadiene styrene material using a controlled atmosphere cone calorimeter | |
| JP4671607B2 (ja) | ガス成分計測装置および排ガス排出設備 |
Legal Events
| Date | Code | Title | Description |
|---|---|---|---|
| 121 | Ep: the epo has been informed by wipo that ep was designated in this application |
Ref document number: 19904643 Country of ref document: EP Kind code of ref document: A1 |
|
| NENP | Non-entry into the national phase |
Ref country code: DE |
|
| 122 | Ep: pct application non-entry in european phase |
Ref document number: 19904643 Country of ref document: EP Kind code of ref document: A1 |
|
| NENP | Non-entry into the national phase |
Ref country code: JP |