WO2020071237A1 - 水素脆化進行度の評価方法及び水素脆化進行度評価装置 - Google Patents
水素脆化進行度の評価方法及び水素脆化進行度評価装置Info
- Publication number
- WO2020071237A1 WO2020071237A1 PCT/JP2019/037857 JP2019037857W WO2020071237A1 WO 2020071237 A1 WO2020071237 A1 WO 2020071237A1 JP 2019037857 W JP2019037857 W JP 2019037857W WO 2020071237 A1 WO2020071237 A1 WO 2020071237A1
- Authority
- WO
- WIPO (PCT)
- Prior art keywords
- hydrogen embrittlement
- progress
- transition probability
- time
- rupture
- Prior art date
- Legal status (The legal status is an assumption and is not a legal conclusion. Google has not performed a legal analysis and makes no representation as to the accuracy of the status listed.)
- Ceased
Links
Images



Classifications
-
- G—PHYSICS
- G01—MEASURING; TESTING
- G01N—INVESTIGATING OR ANALYSING MATERIALS BY DETERMINING THEIR CHEMICAL OR PHYSICAL PROPERTIES
- G01N17/00—Investigating resistance of materials to the weather, to corrosion, or to light
- G01N17/006—Investigating resistance of materials to the weather, to corrosion, or to light of metals
-
- E—FIXED CONSTRUCTIONS
- E04—BUILDING
- E04C—STRUCTURAL ELEMENTS; BUILDING MATERIALS
- E04C5/00—Reinforcing elements, e.g. for concrete; Auxiliary elements therefor
- E04C5/01—Reinforcing elements of metal, e.g. with non-structural coatings
-
- G—PHYSICS
- G01—MEASURING; TESTING
- G01N—INVESTIGATING OR ANALYSING MATERIALS BY DETERMINING THEIR CHEMICAL OR PHYSICAL PROPERTIES
- G01N33/00—Investigating or analysing materials by specific methods not covered by groups G01N1/00 - G01N31/00
- G01N33/20—Metals
- G01N33/204—Structure thereof, e.g. crystal structure
Definitions
- the present invention relates to a method and an apparatus for evaluating the degree of progress of hydrogen embrittlement.
- the conventional method of evaluating the hydrogen embrittlement resistance properties of steel materials based on the rupture time is mainly for the qualitative evaluation between steel materials, and it is possible to know the degree of hydrogen embrittlement progress in the course of fracture. Did not.
- the present invention has been made in view of the above, and an object of the present invention is to know the degree of hydrogen embrittlement progress in the course of a steel material being broken by hydrogen embrittlement.
- the method for evaluating the degree of hydrogen embrittlement progress includes a first step of obtaining a cumulative distribution function of rupture time from hydrogen embrittlement rupture test data measured under test conditions assuming reinforcing bars in prestressed concrete; A second step of calculating the transition probability from the cumulative distribution function of the rupture time, and treating the transition probability as a hydrogen embrittlement progress degree And a third step of determining
- the hydrogen embrittlement progress evaluation apparatus is a cumulative distribution function calculation unit for obtaining a cumulative distribution function of rupture time from hydrogen embrittlement rupture test data measured under test conditions assuming rebar in prestressed concrete, hydrogen
- the embrittlement rupture is regarded as a stochastic process in which the deterioration state sequentially changes and leads to rupture, a transition probability calculation unit that calculates the transition probability from the cumulative distribution function of the rupture time, and hydrogen embrittlement by integrating the transition probability with time.
- FIG. 3 is a diagram in which hydrogen embrittlement rupture time data of FIG. 2 is plotted on Weibull probability paper. It is a graph which shows the time change of transition probability. 4 is a graph showing a change over time in the degree of hydrogen embrittlement. 5 is a graph showing a temporal change of a transition probability obtained by another method from the graph of FIG. 4. It is a graph which shows the time change of the hydrogen embrittlement progress calculated using the transition probability calculated
- FIG. 9 is a graph showing transition probabilities obtained from the degree of hydrogen embrittlement progression in FIG. 8.
- FIG. 10 is a diagram illustrating a cumulative rupture probability predicted using the transition probabilities in FIG. 9 and a result when an experiment is actually performed under the same conditions. It is a flowchart which shows the flow of a process of the hydrogen embrittlement progress evaluation apparatus in this Embodiment. It is a figure showing an example of hardware constitutions of a hydrogen embrittlement progress evaluation device.
- FIG. 1 is a functional block diagram illustrating a configuration of a hydrogen embrittlement progress evaluation apparatus 1 according to the present embodiment.
- the hydrogen embrittlement progress evaluation apparatus 1 shown in FIG. 1 includes a cumulative distribution function calculator 11, a transition probability calculator 12, and a hydrogen embrittlement progress calculator 13.
- Each unit included in the hydrogen embrittlement progress evaluation apparatus 1 may be configured by a computer including an arithmetic processing unit, a storage device, and the like, and the processing of each unit may be executed by a program.
- This program is stored in a storage device included in the hydrogen embrittlement progress evaluation apparatus 1, and can be recorded on a recording medium such as a magnetic disk, an optical disk, or a semiconductor memory, or can be provided through a network.
- the storage device 2 and the display device 3 are connected to the hydrogen embrittlement progress evaluation device 1.
- the hydrogen embrittlement progress evaluation device 1 may include a storage device 2 and a display device 3.
- the cumulative distribution function calculation unit 11 calculates the cumulative distribution function of the rupture time from a large number of hydrogen embrittlement rupture test data measured under the test conditions assuming the reinforcing steel in the prestressed concrete.
- the hydrogen embrittlement rupture test data is stored in the storage device 2.
- the cumulative distribution function calculation unit 11 reads out the hydrogen embrittlement fracture test data from the storage device 2 and calculates the cumulative distribution function of the fracture time.
- the hydrogen embrittlement rupture time data shown in FIG. 2 is obtained by repeating a test of measuring the rupture time by charging hydrogen to the steel material while applying a constant tensile stress to the high-strength steel material, and obtaining a large number of rupture times. is there.
- the rupture times are arranged in ascending order and plotted using the average rank method.
- the test conditions are as follows.
- the test piece used was a round bar having a length of 50 cm and a diameter of 7 mm.
- the tensile stress was 0.9 times the tensile strength (0.9 ⁇ b).
- a cathode charging method in which a steel material was immersed in an aqueous electrolyte solution and a negative potential was applied was used.
- electrolyte aqueous solution a 1 mol / L sodium bicarbonate aqueous solution + 0.13 mol / L thiocyanate ammonium aqueous solution was used.
- the applied potential is -1V @ vs. SSE was used.
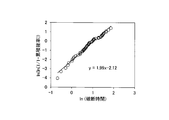
- the cumulative distribution function F (t) is estimated using, for example, general Weibull probability paper.
- the cumulative distribution function F (t) was calculated for the hydrogen embrittlement rupture time data of FIG. 2 using Weibull probability paper as shown in FIG. 3, the following equation (1) was obtained.
- the transition probability calculating unit 12 regards the hydrogen embrittlement rupture as a stochastic process in which the deterioration state sequentially transitions to the fracture state, and calculates the transition probability thereof. .
- the inventors have found that by making the following two assumptions, it is possible to calculate the transition probability of the deterioration state in hydrogen embrittlement, and to estimate the degree of hydrogen embrittlement from the transition probability. .
- Transition probability is the probability that the deterioration state changes only once per unit time, and represents the average value of the rate of increase in deterioration. That is, it is considered that the value H (t) obtained by integrating the transition probability (rate of increase in deterioration) with time represents the degree of progress of hydrogen embrittlement.
- transition of the degradation state due to hydrogen embrittlement can be considered to be the same mechanism as the transition of the equipment to the spare equipment due to the failure of the equipment in the standby system. That is, the transition probability ⁇ (t) of hydrogen embrittlement can be obtained by using the expressions (1) and (2).
- equation (2) cannot be solved analytically, but can be accurately approximated by setting the transition probability ⁇ (t) to the following equation (3).
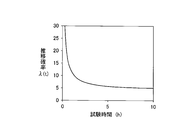
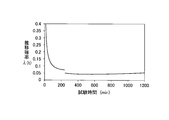
- Equation (4) shows a graph of the change over time of the transition probability expressed by the equation (4).
- n may be any sufficiently large value.
- the hydrogen embrittlement progress calculating unit 13 calculates the hydrogen embrittlement progress by integrating the transition probability with time. There is no particular definition of the method, and a general method may be used.
- the hydrogen embrittlement progress calculating unit 13 causes the display device 3 to display the obtained hydrogen embrittlement progress.
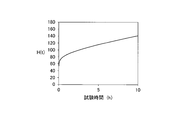
- FIG. 5 shows the time change of the hydrogen embrittlement progress H (t) calculated by the hydrogen embrittlement progress evaluation apparatus 1 of the present embodiment.
- the hydrogen embrittlement progress evaluation apparatus 1 associates the hydrogen embrittlement rupture test data used in the calculation of the hydrogen embrittlement progress with the life data of the steel material of the actual equipment, and calculates the actual hydrogen embrittlement progress from the obtained hydrogen embrittlement progress.
- transition probability ⁇ (t) can be obtained more accurately by using the following method.
- the cumulative distribution function F (t) of the rupture time in equation (1) By substituting the cumulative distribution function F (t) of the rupture time in equation (1) into equation (2) and rearranging the equation for t, the following equation (6) is obtained.
- a value from 1 to 100 is sequentially substituted for the hydrogen embrittlement progression H (t) in the equation (6), and the value of t corresponding to the value of H (t) is obtained, whereby the change over time of H (t) is obtained.
- Ask for. ⁇ (t) can be approximately expressed by the slope of H (t).
- the slope of H (t) is obtained by the difference method using the following equation (7), and is set as ⁇ (t).
- t1 and t2 are arbitrary times, and t1 ⁇ t2.
- ⁇ (t) is directly calculated without using an approximation formula, so that ⁇ (t) can be obtained more accurately.
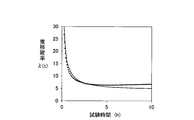
- FIG. 6 shows a comparison between ⁇ (t) obtained by the above-described method of calculating the slope of H (t) and a method using the approximation formula (4).
- the result obtained by the method of obtaining the slope of H (t) is shown by a plot, and the result obtained by the method using the approximate expression of Expression (4) is shown by a solid line. From FIG. 6, it can be seen that, particularly in the latter half of the test, the method of obtaining the slope of H (t) has a remarkable difference in accuracy as compared with the method using the approximate expression of Expression (4).
- FIG. 7 shows the time change of the hydrogen embrittlement progression H (t) calculated using ⁇ (t) obtained by using the method for obtaining the slope of H (t) in the hydrogen embrittlement progression evaluation apparatus 1. .
- the hydrogen embrittlement when environmental conditions change, for example, the hydrogen embrittlement when the environmental conditions change such that the hydrogen generation condition due to the corrosion reaction or the progress rate of the hydrogen embrittlement changes according to the season. It can predict the degree of progress.
- the degree of hydrogen embrittlement progress H (t) is obtained for different environmental conditions by the method described above.
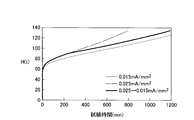
- the degree of hydrogen embrittlement in the case where electrochemical hydrogen charging is performed at 0.025 mA / mm 2 simulating a state in which hydrogen embrittlement progresses rapidly is indicated by a dashed line.
- the broken line indicates the degree of hydrogen embrittlement when electrochemical hydrogen charging is performed at 0.015 mA / mm 2 simulating a slow state.
- H (t) indicated by a solid line changes in the same manner as the hydrogen embrittlement progression of 0.025 mA / mm 2 until 240 minutes, and the hydrogen embrittlement of 0.015 mA / mm 2 after 240 minutes. It changes as well as the degree of progress.
- ⁇ Whether the prediction of hydrogen embrittlement progression when environmental conditions change is correct can be confirmed by a probabilistic simulation (Monte Carlo simulation).
- the cumulative rupture probability is obtained by repeating the simulation from the start of the test to the rupture under the condition that the rupture occurs.
- the cumulative fracture probability obtained by the simulation is compared with the result obtained when an experiment is actually performed under the same conditions. If the two values agree with each other, it can be said that the prediction of the degree of hydrogen embrittlement progression is correct.
- FIG. 9 shows ⁇ (t) obtained from the slope of H (t) in FIG.
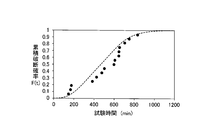
- FIG. 10 shows the cumulative fracture probability obtained by repeating the above simulation 1000 times using ⁇ (t) in FIG. 9 and the result of an experiment actually performed under the same conditions.
- the simulation result is indicated by a dotted line
- the experimental result is indicated by a plot.
- the cumulative rupture probability obtained by the experiment and the cumulative rupture probability obtained by the simulation using ⁇ (t) are almost the same, and it can be seen that the experimental result can be predicted by the simulation. Therefore, it can be said that the degree of hydrogen embrittlement progress when environmental conditions change can be predicted correctly.
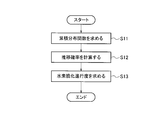
- FIG. 11 is a flowchart showing the flow of processing of the hydrogen embrittlement progress evaluation apparatus 1 in the present embodiment. It is assumed that the hydrogen embrittlement rupture test data measured under the test conditions assuming the reinforcing steel in the prestressed concrete has been acquired and stored in the storage device 2.
- the cumulative distribution function calculator 11 calculates a cumulative distribution function of the rupture time from the hydrogen embrittlement test data (step S11).
- the transition probability calculation unit 12 regards the hydrogen embrittlement rupture as a probability process in which the deterioration state sequentially transitions to the fracture, and calculates the transition probability from the cumulative distribution function of the rupture time (step S12).
- the hydrogen embrittlement progress calculating unit 13 calculates the hydrogen embrittlement progress by integrating the transition probability with time (step S13).
- the renewal time estimation unit uses the hydrogen embrittlement progress degree based on the life data in the actual equipment of the reinforcing bar used for measuring the hydrogen embrittlement fracture test data. Estimate the renewal time of the actual equipment from the
- a cumulative distribution function of rupture time is calculated from a large number of hydrogen embrittlement rupture test data measured under test conditions assuming a reinforcing bar in prestressed concrete, and hydrogen embrittlement is calculated.
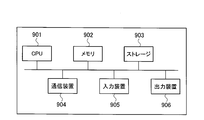
- the hydrogen embrittlement progress evaluation apparatus 1 described above includes, for example, a central processing unit (CPU) 901, a memory 902, a storage 903, a communication device 904, and an input device 905 as shown in FIG. , An output device 906 can be used.
- the hydrogen embrittlement progress evaluation apparatus 1 is realized by the CPU 901 executing a predetermined program loaded on the memory 902.
Landscapes
- Engineering & Computer Science (AREA)
- Life Sciences & Earth Sciences (AREA)
- Architecture (AREA)
- Chemical & Material Sciences (AREA)
- Health & Medical Sciences (AREA)
- Physics & Mathematics (AREA)
- Immunology (AREA)
- Pathology (AREA)
- Analytical Chemistry (AREA)
- Biochemistry (AREA)
- General Health & Medical Sciences (AREA)
- General Physics & Mathematics (AREA)
- Ecology (AREA)
- Environmental & Geological Engineering (AREA)
- Environmental Sciences (AREA)
- Biodiversity & Conservation Biology (AREA)
- Civil Engineering (AREA)
- Structural Engineering (AREA)
- Crystallography & Structural Chemistry (AREA)
- Food Science & Technology (AREA)
- Medicinal Chemistry (AREA)
- Testing Resistance To Weather, Investigating Materials By Mechanical Methods (AREA)
- Investigating And Analyzing Materials By Characteristic Methods (AREA)
Abstract
プレストレストコンクリート内の鉄筋を想定した試験条件により測定された、多数の水素脆化破断試験データから破断時間の累積分布関数を計算し、水素脆化破断を劣化状態が逐次推移して破断状態に至る確率過程とみなし、破断時間の累積分布関数から推移確率を計算し、推移確率を時間で積分して水素脆化進行度を求める。
Description
本発明は、水素脆化進行度の評価方法および装置に関する。
近年、建築資材としてプレストレストコンクリート内の鉄筋に使用される高強度鋼材の需要が高まっている。高強度鋼材は水素脆化感受性が高く、鋼材中に経時的に水素が含まれることにより延性が失われ、強度が著しく低下する。この現象は水素脆化と呼ばれている(非特許文献1参照)。鋼材の水素脆化に関し、鋼材の性能として耐水素脆化特性の評価が行われている。例えば、鋼材に一定の引張応力を付与(定荷重試験)しながら鋼材中に電気化学的に水素チャージし、鋼材の破断時間を測定する評価方法が広く用いられている(非特許文献2参照)。
白神哲夫、「鉄鋼材料における水素脆化」、材料と環境、公益社団法人腐食防食学会、2011年、第60巻、第5号、pp. 236-420
20%チオシアン酸アンモニウム溶液中でのPC鋼材の水素脆化試験方法、JSCE S 1201、社団法人腐食防食協会、2012年
塩見弘著、「信頼性工学入門」、改訂二版、丸善株式会社、1971年、p. 103
実際に設備等に適用される鋼材について、鋼材が水素脆化によって破断に至る途中の水素脆化進行度を知ることができれば、鋼材の使用期間中にどの程度水素脆化が進行しているのかを予想でき、鋼材が破断する前の適切なタイミングで設備の更改を行う判断が可能となる。
しかしながら、従来用いられてきた破断時間による鋼材の耐水素脆化特性の評価方法は、鋼材間の定性的評価が主な目的であり、破断に至る途中の水素脆化進行度を知ることはできなかった。
本発明は、上記に鑑みてなされたものであり、鋼材が水素脆化によって破断に至る途中の水素脆化進行度を知ることを目的とする。
本発明に係る水素脆化進行度の評価方法は、プレストレストコンクリート内の鉄筋を想定した試験条件により測定された水素脆化破断試験データから破断時間の累積分布関数を求める第1工程と、水素脆化破断を劣化状態が逐次推移して破断に至る確率過程とみなし、前記破断時間の累積分布関数から推移確率を計算する第2工程と、前記推移確率を時間で積分して水素脆化進行度を求める第3工程と、を有することを特徴とする。
本発明に係る水素脆化進行度評価装置は、プレストレストコンクリート内の鉄筋を想定した試験条件により測定された水素脆化破断試験データから破断時間の累積分布関数を求める累積分布関数計算部と、水素脆化破断を劣化状態が逐次推移して破断に至る確率過程とみなし、前記破断時間の累積分布関数から推移確率を計算する推移確率計算部と、前記推移確率を時間で積分して水素脆化進行度を求める水素脆化進行度計算部と、を有することを特徴とする。
本発明によれば、鋼材が水素脆化によって破断に至る途中の水素脆化進行度を知ることができる。
以下、本発明の実施の形態について図面を用いて説明する。
(水素脆化進行度評価装置の構成)
図1は、本実施の形態における水素脆化進行度評価装置1の構成を示す機能ブロック図である。同図に示す水素脆化進行度評価装置1は、累積分布関数計算部11、推移確率計算部12、及び水素脆化進行度計算部13を備える。水素脆化進行度評価装置1が備える各部は、演算処理装置、記憶装置等を備えたコンピュータにより構成して、各部の処理がプログラムによって実行されるものとしてもよい。このプログラムは水素脆化進行度評価装置1が備える記憶装置に記憶されており、磁気ディスク、光ディスク、半導体メモリ等の記録媒体に記録することも、ネットワークを通して提供することも可能である。
図1は、本実施の形態における水素脆化進行度評価装置1の構成を示す機能ブロック図である。同図に示す水素脆化進行度評価装置1は、累積分布関数計算部11、推移確率計算部12、及び水素脆化進行度計算部13を備える。水素脆化進行度評価装置1が備える各部は、演算処理装置、記憶装置等を備えたコンピュータにより構成して、各部の処理がプログラムによって実行されるものとしてもよい。このプログラムは水素脆化進行度評価装置1が備える記憶装置に記憶されており、磁気ディスク、光ディスク、半導体メモリ等の記録媒体に記録することも、ネットワークを通して提供することも可能である。
水素脆化進行度評価装置1には、記憶装置2および表示装置3が接続される。水素脆化進行度評価装置1が記憶装置2および表示装置3を備えてもよい。
累積分布関数計算部11は、プレストレストコンクリート内の鉄筋を想定した試験条件により測定された、多数の水素脆化破断試験データから破断時間の累積分布関数を計算する。水素脆化破断試験データは、記憶装置2に記憶させておく。累積分布関数計算部11は、記憶装置2から水素脆化破断試験データを読み出して破断時間の累積分布関数を計算する。
水素脆化破断時間データは、例えば図2に示すようなものを用いる。図2に示した水素脆化破断時間データは、高強度鋼材に一定の引張応力を付与しながら鋼材中に水素チャージして破断時間を測定する試験を繰り返し、多数の破断時間を取得したものである。図2では、破断時間を小さい方から順に並べ平均ランク法を用いてプロットしている。試験条件は以下の通りである。試験片は長さ50cmで直径7mmの丸棒平滑材を用いた。引張応力は引張強さの0.9倍の応力(0.9σb)とした。水素チャージ方法は鋼材を電解質水溶液に浸漬させて負電位を印加する陰極チャージ法を用いた。電解質水溶液には1mol/Lの炭酸水素ナトリウム水溶液+0.13mol/Lのチオシアン線アンモニウム水溶液を用いた。印加電位には-1V vs. SSEを用いた。試験数はN=55とした。これらの試験条件はプレストレストコンクリート内の鉄筋を想定しており、鋼材中に含まれる水素量を実際の環境よりも極端に増やして水素脆化を加速させている。
水素脆化破断時間データから破断時間の累積分布関数を求めるには、特に方法の規定はなく、一般的な方法を用いれば良い。水素脆化の破断時間はワイブル分布に従うと考えられることから、例えば一般的なワイブル確率紙を用いて累積分布関数F(t)を推定する。図2の水素脆化破断時間データに対し、図3に示すようにワイブル確率紙を用いて累積分布関数F(t)を計算したところ、以下の(1)式が得られた。

推移確率計算部12は、累積分布関数計算部11の計算した累積分布関数を用いて、水素脆化破断を劣化状態が逐次推移して破断状態に至る確率過程とみなしてその推移確率を計算する。
発明者らは、以下の2つの仮定を置くことで、水素脆化における劣化状態の推移確率を計算することが可能となり、推移確率から水素脆化の進行度を推定可能であることを見出した。
仮定1:水素脆化では劣化が時間とともに蓄積し、一定値を超えたところで破断が発生する。
仮定2:ある劣化状態から次の劣化状態への変化は推移確率λ(t)に従って確率的に発生する。
仮定2:ある劣化状態から次の劣化状態への変化は推移確率λ(t)に従って確率的に発生する。
推移確率は単位時間あたりに劣化状態が1回だけ推移する確率であり、これは劣化の増加速度の平均値を表している。すなわち、推移確率(劣化の増加速度)を時間で積分した値H(t)が水素脆化の進行度を表していると考えられる。
劣化が確率的に進行し、破断に至るという考え方は金属材料の疲労破壊においても用いられているが、疲労破壊の場合は推移確率λを時間変化しない一定値としているため、水素脆化のように推移確率(劣化の増加速度)が時間変化すると考えられる現象に対してはそのまま適用することができない。一方、信頼性工学の分野では、装置が故障した際に順次予備の装置に切り替わっていく待機系と呼ばれるシステムにおいて、装置1個の故障率λ(t)とシステム全体が故障する累積分布関数F(t)の関係は、予備の装置がn個の場合は下記の(2)式で表されることが知られている(非特許文献3参照)。

水素脆化における劣化状態の推移は、待機系において装置が故障し予備の装置へ推移することと同様の機構であると考えることができる。すなわち、(1)式と(2)式を用いることで、水素脆化の推移確率λ(t)を求めることができる。また、累積分布関数F(t)がワイブル分布に従うとき、(2)式は解析的に解くことができないが、推移確率λ(t)を以下の(3)式とすることで精度良く近似可能となる。

上記の方法に従い、劣化状態が100回推移したところで破断が発生する(n=100)とし、(2)式に(3)式を代入し、(1)式の累積分布関数F(t)に適合するように(3)式のA,B,Cの値を求めると、推移確率λ(t)は以下の(4)式のように計算される。図4に(4)式で示される推移確率の時間変化のグラフを示す。

なお、破断が発生するnの値は任意に取っているが、nの値が十分に大きければnを変えても推移確率λ(t)の曲線はほぼ相似形となることから、破断に至るまでの水素脆化進行度を知る上ではnは十分に大きな任意の値で良いこととなる。
水素脆化進行度計算部13は、推移確率を時間で積分して水素脆化進行度を求める。特に方法の規定はなく、一般的な方法を用いれば良い。水素脆化進行度計算部13は、求めた水素脆化進行度を表示装置3に表示させる。
(4)式から水素脆化進行度H(t)を計算すると、水素脆化進行度H(t)は以下の(5)式のように計算される。

図5に、本実施形態の水素脆化進行度評価装置1により計算した水素脆化進行度H(t)の時間変化を示す。
劣化状態が100回推移したところ(H(t)=100)で破断が発生するとしているため、H(t)=100となるt(t=2.6時間)は平均破断時間を表している。また、図5から破断の90%の水素脆化進行度(H(t)=90)となる時間tを読み取るとt=1.4時間である。
水素脆化進行度評価装置1は、水素脆化進行度の計算に用いた水素脆化破断試験データと実設備の鋼材の寿命データとを対応付けておき、求めた水素脆化進行度から実設備の更改時期を推定する更改時期推定部を備えてもよい。例えば、今回用いた水素脆化破断時間データの取得に使用した鋼材の実環境での平均寿命が20年の場合、H(t)=100となるt=2.6時間が実環境での20年に相当する。水素脆化進行度が破断に至る90%で実設備を更改する場合、H(t)=90となるt=1.4時間に相当する実環境での約11年で実設備を更改すればよいことになる。
(推移確率の別の求め方)
推移確率λ(t)は以下の方法を用いればさらに正確に求めることができる。(1)式の破断時間の累積分布関数F(t)を(2)式に代入し、tについて式を整理すると以下の(6)式が得られる。
推移確率λ(t)は以下の方法を用いればさらに正確に求めることができる。(1)式の破断時間の累積分布関数F(t)を(2)式に代入し、tについて式を整理すると以下の(6)式が得られる。

この(6)式の水素脆化進行度H(t)に1から100までの値を順次代入し、H(t)の値と対応するtの値を求めることでH(t)の経時変化を求める。λ(t)は近似的にH(t)の傾きで表すことができる。以下の(7)式を用いて差分法によりH(t)の傾きを求めてλ(t)とする。

ここで、t1、t2は任意の時間であり、t1<t2である。この方法は近似式を用いずに直接λ(t)を算出しているため、より正確にλ(t)を求めることができる。
上記のH(t)の傾きを求める方法と(4)式の近似式を用いた方法のそれぞれにより求めたλ(t)を比較すると図6のようになる。図6では、H(t)の傾きを求める方法で求めた結果をプロットで示し、(4)式の近似式を用いた方法で求めた結果を実線で示している。図6から、特に試験後半においては、H(t)の傾きを求める方法は(4)式の近似式を用いた方法に比べて精度の違いが顕著であることがわかる。
図7に、水素脆化進行度評価装置1においてH(t)の傾きを求める方法を用いて求めたλ(t)を用いて計算した水素脆化進行度H(t)の時間変化を示す。図7から、H(t)=100となる平均破断時間tは2.5時間であることがわかる。また、H(t)=90となる時間tは1.2時間であることがわかる。
(環境条件が変化する場合)
本実施形態では、環境条件が異なる水素脆化進行度を組み合わせることで、例えば腐食反応による水素発生条件または水素脆化の進行速度が季節により変化するような、環境条件が変化する場合の水素脆化進行度を予測できる。
本実施形態では、環境条件が異なる水素脆化進行度を組み合わせることで、例えば腐食反応による水素発生条件または水素脆化の進行速度が季節により変化するような、環境条件が変化する場合の水素脆化進行度を予測できる。
まず、これまでに説明した方法により、異なる環境条件について水素脆化進行度H(t)を求めておく。図8では、水素脆化の進行が速い状態を模擬する0.025mA/mm2で電気化学的な水素チャージを行った場合の水素脆化進行度を一点鎖線で示し、水素脆化の進行が遅い状態を模擬する0.015mA/mm2で電気化学的な水素チャージを行った場合の水素脆化進行度を破線で示している。
試験開始時は水素チャージが0.025mA/mm2で行われ、試験開始から240分経過後に水素チャージが0.015mA/mm2で行われるという環境条件を考えた場合、H(t)は図8の実線に示すような挙動となる。図8の例では、実線で示すH(t)は240分までは0.025mA/mm2の水素脆化進行度と同様に変化し、240分以降は0.015mA/mm2の水素脆化進行度と同様に変化する。水素脆化進行度計算部13が、異なる環境条件に基づいて求めた水素脆化進行度を組み合わせることで、環境条件が変化する場合の水素脆化進行度が求められる。
環境条件が変化する場合の水素脆化進行度の予測が正しいかは、確率的シミュレーション(モンテカルロシミュレーション)により確認することができる。時間tからΔt経過する間に劣化状態が次の状態へ遷移する確率Pは、λ(t)を用いてP=λ(t)Δtとして表される。例えば、P=0.01となるようΔtを適宜設定し、時間tからΔt経過する間に劣化状態がP=0.01で次の劣化状態に推移し、劣化状態が100に達すると破断が発生するという条件で、試験開始から破断までシミュレーションを繰り返し行うことで累積破断確率が求められる。シミュレーションにより求めた累積破断確率と、実際に同条件で実験を行った場合の結果を比較し、両者が一致すれば水素脆化進行度の予測は正しいと言える。
図8のH(t)の傾きから求めたλ(t)を図9に示す。図9のλ(t)を用いて上記のシミュレーションを1000回繰り返し行って求めた累積破断確率と、実際に同条件で実験を行った場合の結果を図10に示す。図10では、シミュレーション結果を点線で示し、実験結果をプロットで示している。実験により求めた累積破断確率とλ(t)を用いたシミュレーションにより求めた累積破断確率は概ね一致し、シミュレーションによって実験結果を予測できていることがわかる。したがって、環境条件が変化する場合の水素脆化進行度は正しく予測できていると言える。
このように、環境条件が変化しない場合の水素脆化進行度をいくつか把握しておけば、環境条件が変化する場合の水素脆化進行度を予測できるようになる。実際の環境では、環境条件が変化する場合が多いことから、この方法を用いれば簡易な実験によって実際の環境での水素脆化進行度の予測が可能となる。
(水素脆化進行度評価装置の動作)
次に、本実施の形態における水素脆化進行度評価装置1の処理の流れについて説明する。
次に、本実施の形態における水素脆化進行度評価装置1の処理の流れについて説明する。
図11は、本実施の形態における水素脆化進行度評価装置1の処理の流れを示すフローチャートである。プレストレストコンクリート内の鉄筋を想定した試験条件により測定された水素脆化破断試験データは取得済みであり、記憶装置2に記憶されているとする。
累積分布関数計算部11は、水素脆化試験データから破断時間の累積分布関数を求める(ステップS11)。
推移確率計算部12は、水素脆化破断を劣化状態が逐次推移して破断に至る確率過程とみなし、破断時間の累積分布関数から推移確率を計算する(ステップS12)。
水素脆化進行度計算部13は、推移確率を時間で積分して水素脆化進行度を求める(ステップS13)。
水素脆化進行度評価装置1が更改時期推定部を備える場合、更改時期推定部は、水素脆化破断試験データの測定に使用した鉄筋の実設備における寿命データに基づいて、水素脆化進行度から実設備の更改時期を推定する。
以上説明したように、本実施の形態によれば、プレストレストコンクリート内の鉄筋を想定した試験条件により測定された、多数の水素脆化破断試験データから破断時間の累積分布関数を計算し、水素脆化破断を劣化状態が逐次推移して破断状態に至る確率過程とみなし、破断時間の累積分布関数から推移確率を計算し、推移確率を時間で積分して水素脆化進行度を求めることで、鋼材が水素脆化によって破断に至る途中の水素脆化進行度を知ることができる。これによって、事前に鋼材の水素脆化進行度を評価しておけば、鋼材の使用期間中にどの程度水素脆化が進行するのかを予想することができ、鋼材を使用した設備の更改の判断材料とすることができる。
上記説明した水素脆化進行度評価装置1には、例えば、図12に示すような、中央演算処理装置(CPU)901と、メモリ902と、ストレージ903と、通信装置904と、入力装置905と、出力装置906とを備える汎用的なコンピュータシステムを用いることができる。このコンピュータシステムにおいて、CPU901がメモリ902上にロードされた所定のプログラムを実行することにより、水素脆化進行度評価装置1が実現される。
1…水素脆化進行度評価装置
11…累積分布関数計算部
12…推移確率計算部
13…水素脆化進行度計算部
2…記憶装置
3…表示装置
11…累積分布関数計算部
12…推移確率計算部
13…水素脆化進行度計算部
2…記憶装置
3…表示装置
Claims (10)
- プレストレストコンクリート内の鉄筋を想定した試験条件により測定された水素脆化破断試験データから破断時間の累積分布関数を求める第1工程と、
水素脆化破断を劣化状態が逐次推移して破断に至る確率過程とみなし、前記破断時間の累積分布関数から推移確率を計算する第2工程と、
前記推移確率を時間で積分して水素脆化進行度を求める第3工程と、
を有することを特徴とする水素脆化進行度の評価方法。 - 前記第2工程では、前記推移確率をλ(t)=At-B+Cと近似して求めることを特徴とする請求項1に記載の水素脆化進行度の評価方法。
- 前記第2工程では、前記水素脆化進行度のそれぞれに対応する時間の値を求め、前記水素脆化進行度の変化の割合を前記推移確率とすることを特徴とする請求項1に記載の水素脆化進行度の評価方法。
- 前記第3工程では、さらに、異なる環境条件に基づいて求めた水素脆化進行度を組み合わせて環境条件が変化する場合の水素脆化進行度を求めることを特徴とする1ないし3のいずれかに記載の水素脆化進行度の評価方法。
- 前記水素脆化破断試験データの測定に使用した鉄筋の実設備における寿命データに基づいて、前記水素脆化進行度から実設備の更改時期を推定する第4工程を有することを特徴とする請求項1ないし4のいずれかに記載の水素脆化進行度の評価方法。
- プレストレストコンクリート内の鉄筋を想定した試験条件により測定された水素脆化破断試験データから破断時間の累積分布関数を求める累積分布関数計算部と、
水素脆化破断を劣化状態が逐次推移して破断に至る確率過程とみなし、前記破断時間の累積分布関数から推移確率を計算する推移確率計算部と、
前記推移確率を時間で積分して水素脆化進行度を求める水素脆化進行度計算部と、
を有することを特徴とする水素脆化進行度評価装置。 - 前記推移確率計算部は、前記推移確率をλ(t)=At-B+Cと近似して求めることを特徴とする請求項6に記載の水素脆化進行度評価装置。
- 前記推移確率計算部は、前記水素脆化進行度のそれぞれに対応する時間の値を求め、前記水素脆化進行度の変化の割合を前記推移確率とすることを特徴とする請求項6に記載の水素脆化進行度評価装置。
- 前記水素脆化進行度計算部は、さらに、異なる環境条件に基づいて求めた水素脆化進行度を組み合わせて環境条件が変化する場合の水素脆化進行度を求めることを特徴とする6ないし8のいずれかに記載の水素脆化進行度評価装置。
- 前記水素脆化破断試験データの測定に使用した鉄筋の実設備における寿命データに基づいて、前記水素脆化進行度から実設備の更改時期を推定する更改時期推定部を有することを特徴とする請求項6ないし9のいずれかに記載の水素脆化進行度評価装置。
Priority Applications (2)
| Application Number | Priority Date | Filing Date | Title |
|---|---|---|---|
| JP2020550356A JP7108214B2 (ja) | 2018-10-01 | 2019-09-26 | 水素脆化進行度の評価方法及び水素脆化進行度評価装置 |
| US17/275,144 US20220042901A1 (en) | 2018-10-01 | 2019-09-26 | Hydrogen Embrittlement Progress Evaluation Method and Hydrogen Embrittlement Progress Evaluation Device |
Applications Claiming Priority (2)
| Application Number | Priority Date | Filing Date | Title |
|---|---|---|---|
| JP2018-186637 | 2018-10-01 | ||
| JP2018186637 | 2018-10-01 |
Publications (1)
| Publication Number | Publication Date |
|---|---|
| WO2020071237A1 true WO2020071237A1 (ja) | 2020-04-09 |
Family
ID=70054622
Family Applications (1)
| Application Number | Title | Priority Date | Filing Date |
|---|---|---|---|
| PCT/JP2019/037857 Ceased WO2020071237A1 (ja) | 2018-10-01 | 2019-09-26 | 水素脆化進行度の評価方法及び水素脆化進行度評価装置 |
Country Status (3)
| Country | Link |
|---|---|
| US (1) | US20220042901A1 (ja) |
| JP (1) | JP7108214B2 (ja) |
| WO (1) | WO2020071237A1 (ja) |
Cited By (1)
| Publication number | Priority date | Publication date | Assignee | Title |
|---|---|---|---|---|
| WO2022097205A1 (ja) * | 2020-11-04 | 2022-05-12 | 日本電信電話株式会社 | 破断確率推定方法 |
Families Citing this family (4)
| Publication number | Priority date | Publication date | Assignee | Title |
|---|---|---|---|---|
| WO2020261422A1 (ja) * | 2019-06-26 | 2020-12-30 | 日本電信電話株式会社 | 鉄筋の水素脆化破断リスクの評価方法 |
| CN116296798B (zh) * | 2023-02-15 | 2024-10-08 | 中国铁道科学研究院集团有限公司铁道建筑研究所 | 一种基于dic技术测定受拉混凝土本构关系的方法及系统 |
| KR20240149991A (ko) | 2023-04-07 | 2024-10-15 | 주식회사 피레타 | 듀얼 감도 방식의 ae 신호감지를 이용한 수소 이송관 안정성 측정장치 |
| CN121024910B (zh) * | 2025-10-31 | 2026-01-30 | 厚普智慧物联科技有限公司 | 一种适用于氢能压缩机的状态监测及故障预测系统 |
Citations (3)
| Publication number | Priority date | Publication date | Assignee | Title |
|---|---|---|---|---|
| JP2004340817A (ja) * | 2003-05-16 | 2004-12-02 | Mitsubishi Heavy Ind Ltd | 金属の水素脆化予測法及び水素脆化予測法を用いた金属部材設計方法 |
| US20120024077A1 (en) * | 2010-07-29 | 2012-02-02 | Kyushu University, National University Corporation | Inclusion rating method |
| JP2017219532A (ja) * | 2016-06-03 | 2017-12-14 | 日本電信電話株式会社 | 水素脆化特性評価試験における試験片面積の算出方法および試験セルサイズの算出方法 |
Family Cites Families (4)
| Publication number | Priority date | Publication date | Assignee | Title |
|---|---|---|---|---|
| JP2002365202A (ja) * | 2001-06-07 | 2002-12-18 | Kawasaki Heavy Ind Ltd | ボルトの水素脆化割れ予測方法 |
| JP2004309197A (ja) | 2003-04-03 | 2004-11-04 | Sumitomo Metal Ind Ltd | 耐遅れ破壊性の評価方法 |
| JP5986126B2 (ja) * | 2014-03-05 | 2016-09-06 | 日本電信電話株式会社 | 水素脆化評価方法 |
| JP6225087B2 (ja) | 2014-08-26 | 2017-11-01 | 日本電信電話株式会社 | 材料評価のための前処理方法 |
-
2019
- 2019-09-26 US US17/275,144 patent/US20220042901A1/en not_active Abandoned
- 2019-09-26 WO PCT/JP2019/037857 patent/WO2020071237A1/ja not_active Ceased
- 2019-09-26 JP JP2020550356A patent/JP7108214B2/ja active Active
Patent Citations (3)
| Publication number | Priority date | Publication date | Assignee | Title |
|---|---|---|---|---|
| JP2004340817A (ja) * | 2003-05-16 | 2004-12-02 | Mitsubishi Heavy Ind Ltd | 金属の水素脆化予測法及び水素脆化予測法を用いた金属部材設計方法 |
| US20120024077A1 (en) * | 2010-07-29 | 2012-02-02 | Kyushu University, National University Corporation | Inclusion rating method |
| JP2017219532A (ja) * | 2016-06-03 | 2017-12-14 | 日本電信電話株式会社 | 水素脆化特性評価試験における試験片面積の算出方法および試験セルサイズの算出方法 |
Non-Patent Citations (1)
| Title |
|---|
| IZUMI, MASANORI ET AL.: "Transactions of the Architectural Institute of Japan", CONCRETE FRACTURE THEORY BASED ON STOCHASTIC PROCESS THEORY, vol. 287, 30 January 1980 (1980-01-30), pages 1 - 13, Retrieved from the Internet <URL:https://jstage.jst.go.jp/article/aijsaxx/287/0/287_KJ00003748923/_article/-char/ja> [retrieved on 20191028] * |
Cited By (4)
| Publication number | Priority date | Publication date | Assignee | Title |
|---|---|---|---|---|
| WO2022097205A1 (ja) * | 2020-11-04 | 2022-05-12 | 日本電信電話株式会社 | 破断確率推定方法 |
| JPWO2022097314A1 (ja) * | 2020-11-04 | 2022-05-12 | ||
| WO2022097314A1 (ja) * | 2020-11-04 | 2022-05-12 | 日本電信電話株式会社 | 破断確率推定方法 |
| JP7464888B2 (ja) | 2020-11-04 | 2024-04-10 | 日本電信電話株式会社 | 破断確率推定方法 |
Also Published As
| Publication number | Publication date |
|---|---|
| JP7108214B2 (ja) | 2022-07-28 |
| JPWO2020071237A1 (ja) | 2021-09-02 |
| US20220042901A1 (en) | 2022-02-10 |
Similar Documents
| Publication | Publication Date | Title |
|---|---|---|
| JP7108214B2 (ja) | 水素脆化進行度の評価方法及び水素脆化進行度評価装置 | |
| Lin et al. | Integrating random shocks into multi-state physics models of degradation processes for component reliability assessment | |
| CN110197288B (zh) | 故障影响下设备的剩余使用寿命预测方法 | |
| US20090271235A1 (en) | Apparatus and method for generating survival curve used to calculate failure probability | |
| JP6352851B2 (ja) | 水素脆化感受性評価方法 | |
| CN102980806A (zh) | 一种预测多步加载条件下金属材料低周疲劳寿命的方法 | |
| KR20150057553A (ko) | 피로수명 예측방법 | |
| CN109117566A (zh) | 一种基于产品寿命预测模型的混合维修规划方法 | |
| CN109522517B (zh) | 一种电表失效率计算方法和系统 | |
| JP5064259B2 (ja) | 劣化評価装置及び劣化評価方法 | |
| JP6470716B2 (ja) | 水素脆化特性評価試験における試験片面積の算出方法および試験セルサイズの算出方法 | |
| Chen et al. | Stochastic modelling and lifecycle performance assessment of bond strength of corroded reinforcement in concrete | |
| JP7029061B2 (ja) | 亀裂等発生検知方法、亀裂等発生検知装置及び亀裂等発生検知プログラム | |
| JP2003004599A (ja) | 構造物の疲労損傷度の評価方法及び表示方法 | |
| JP6940774B2 (ja) | 水素侵入挙動推定方法、水素侵入挙動推定装置及び水素侵入挙動推定プログラム | |
| Bayane et al. | Quantification of the conditional value of SHM data for the fatigue safety evaluation of a road viaduct | |
| JP7464888B2 (ja) | 破断確率推定方法 | |
| US20190250890A1 (en) | Testing of physical random number generators | |
| CN117725664A (zh) | 开孔板连接件的极限承载力计算方法、装置、设备及介质 | |
| CN119670882B (zh) | 一种桥梁时变可靠度评估方法、装置、设备及介质 | |
| CN109992875B (zh) | 一种切换设备剩余寿命的确定方法及系统 | |
| US11946856B2 (en) | Method for estimating steel rupture starting point, device for estimating steel rupture starting point, and program for estimating steel rupture starting point | |
| KR20180078112A (ko) | 저장 장치의 수명 예측 장치 및 방법 | |
| Al-Osta et al. | Probability of failure of corroding reinforced concrete columns under eccentric loading | |
| Nepal et al. | Gamma process modelling for lifecycle performance assessment of corrosion affected concrete structures |
Legal Events
| Date | Code | Title | Description |
|---|---|---|---|
| 121 | Ep: the epo has been informed by wipo that ep was designated in this application |
Ref document number: 19868799 Country of ref document: EP Kind code of ref document: A1 |
|
| ENP | Entry into the national phase |
Ref document number: 2020550356 Country of ref document: JP Kind code of ref document: A |
|
| NENP | Non-entry into the national phase |
Ref country code: DE |
|
| 122 | Ep: pct application non-entry in european phase |
Ref document number: 19868799 Country of ref document: EP Kind code of ref document: A1 |