WO2019097694A1 - 商品配置システム、商品配置方法、及び商品配置プログラム - Google Patents
商品配置システム、商品配置方法、及び商品配置プログラム Download PDFInfo
- Publication number
- WO2019097694A1 WO2019097694A1 PCT/JP2017/041549 JP2017041549W WO2019097694A1 WO 2019097694 A1 WO2019097694 A1 WO 2019097694A1 JP 2017041549 W JP2017041549 W JP 2017041549W WO 2019097694 A1 WO2019097694 A1 WO 2019097694A1
- Authority
- WO
- WIPO (PCT)
- Prior art keywords
- product
- shipping
- shipment
- products
- goods
- Prior art date
Links
Images


Classifications
-
- G—PHYSICS
- G06—COMPUTING; CALCULATING OR COUNTING
- G06Q—INFORMATION AND COMMUNICATION TECHNOLOGY [ICT] SPECIALLY ADAPTED FOR ADMINISTRATIVE, COMMERCIAL, FINANCIAL, MANAGERIAL OR SUPERVISORY PURPOSES; SYSTEMS OR METHODS SPECIALLY ADAPTED FOR ADMINISTRATIVE, COMMERCIAL, FINANCIAL, MANAGERIAL OR SUPERVISORY PURPOSES, NOT OTHERWISE PROVIDED FOR
- G06Q10/00—Administration; Management
- G06Q10/08—Logistics, e.g. warehousing, loading or distribution; Inventory or stock management
- G06Q10/087—Inventory or stock management, e.g. order filling, procurement or balancing against orders
-
- G—PHYSICS
- G06—COMPUTING; CALCULATING OR COUNTING
- G06Q—INFORMATION AND COMMUNICATION TECHNOLOGY [ICT] SPECIALLY ADAPTED FOR ADMINISTRATIVE, COMMERCIAL, FINANCIAL, MANAGERIAL OR SUPERVISORY PURPOSES; SYSTEMS OR METHODS SPECIALLY ADAPTED FOR ADMINISTRATIVE, COMMERCIAL, FINANCIAL, MANAGERIAL OR SUPERVISORY PURPOSES, NOT OTHERWISE PROVIDED FOR
- G06Q10/00—Administration; Management
- G06Q10/04—Forecasting or optimisation specially adapted for administrative or management purposes, e.g. linear programming or "cutting stock problem"
Definitions
- the present invention relates to a product arrangement system, a product arrangement method, and a product arrangement program. Specifically, the present invention relates to a product placement system, a product placement method, and a product placement program that improve the efficiency of the process from the arrival of goods to the shipping at the site of distribution.
- the forecast of shipment time and shipment quantity of goods will also increase the amount of calculation as the number of goods increases. Furthermore, in order to efficiently ship products, not only the forecast of shipping time and shipping quantity but also efficient arrangement of products in containers, shelves, boxes, etc. for storing and moving products (storage) There is a need to. That is, for efficient shipping of goods, it is necessary to appropriately combine the goods according to their weight, package size, etc. (hereinafter, also referred to as “packing”). When the number of products increases, a large amount of calculation is required to pack the products.
- the present invention has been made in view of the above-described circumstances, and an exemplary object of the present invention is to provide a product arrangement system, a product arrangement method, and a product arrangement program capable of efficiently calculating the product arrangement.
- the present invention has the following composition.
- a plurality of feature amounts are obtained for each of the products from shipment data of a plurality of products, and the features corresponding to each of the feature amounts obtained for a certain product and each of the feature amounts obtained for another product
- a grouping unit configured to compare the quantities of each other, calculate the amount of change between the corresponding feature amounts, and classify the plurality of products into a plurality of product groups based on the calculated magnitude of the amount of change;
- Shipping forecasting means for acquiring a past shipping record for each of the products from the shipping data, and predicting shipping quantities of the plurality of products based on the obtained shipping records, and shipping forecasting by the shipping forecasting means;
- a goods arrangement system comprising: an arrangement place for each of the classified goods groups, and an arrangement place determining means for determining an arrangement place of the plurality of goods.
- FIG. 1 is an explanatory view showing an outline of the distribution warehouse 1 and the product arrangement system 10. As shown in FIG. 1
- the product arrangement system 10 at least includes a grouping module 11 as grouping means, a shipment prediction module 12 as shipment prediction means, and an arrangement place determination module 13 as arrangement place determination means.
- the commodity placement system 10 can realize the commodity placement method according to the present invention by the functions of these modules. Further, the product arrangement system 10 can be operated by causing the computer to function as the above respective units by the product arrangement program according to the present invention.
- the distribution warehouse 1 goods received from the arrival source are stored. Then, for example, based on an order from a shipping orderer such as an electronic commerce (EC) trader, the stored goods are shipped to a predetermined shipping destination.
- the product arrangement system 10 acquires product information from the arrival source, performs grouping and shipment prediction based on the product information, and determines the optimal arrangement of products in the distribution warehouse 1.
- the arrival source may be the same as the shipping orderer.
- the warehouse control system 15 is communicably connected to the product arrangement system 10, the distribution robot 16, the handy terminal 17, and the information input terminal 18.
- a plurality of distribution robots 16 and handy terminals 17 are introduced, which receive the product arrangement instruction generated by the warehouse control system 15 based on the product arrangement determined by the product arrangement system 10.
- Communication between the warehouse control system 15 and the physical distribution robot 16 or the handy terminal 17 can be wireless communication such as a wireless LAN.
- the warehouse control system 15 is configured to be able to grasp the position of the distribution robot 16 and the handy terminal 17 in the distribution warehouse 1 through a communication facility, a GPS or the like.
- the distribution robot 16 is configured to be able to move and arrange goods based on the goods arrangement instruction.
- the distribution robot 16 is, for example, self-propelled, lifts a shelf or pallet on which goods are arranged, moves in a lifted state, and is configured to place the shelf or pallet at a predetermined place. Good.
- the distribution robot 16 may be configured to lift one or more articles by various means such as gripping and suctioning with an arm.
- the handy terminal 17 is a terminal carried by a worker who moves and arranges goods in the distribution warehouse 1.
- the handy terminal 17 notifies the worker of a product arrangement instruction, and the worker performs operations such as movement and arrangement of the product based on the product arrangement instruction.
- the worker can transmit information on work completion such as movement and placement of goods to the warehouse control system 15 via the handy terminal 17.
- the warehouse control system 15 can also acquire the location of merchandise, merchandise information, and the like from the information input terminal 18.
- the information input terminal 18 can be, for example, an information processing terminal such as a smartphone, a tablet terminal, a mobile phone, or a computer.
- an information processing terminal such as a smartphone, a tablet terminal, a mobile phone, or a computer.
- the information input terminal 18 is transmitted from the information input terminal 18 to the warehouse control system 15 by the worker inputting the information described in the form or the like into the information input terminal 18 such as a smartphone or a computer.
- the information on the location where the product is located in the actual warehouse is It can be sent to the warehouse control system 15.
- the storage area is a shelf (nesting box), a pallet, a rack or the like.
- the housing area since a certain size and load capacity exist, goods to be stored are limited.
- sorting to consider a combination for efficiently storing the goods in the storage area is referred to as "sorting”.
- the commodity placement system 10 makes it possible to efficiently calculate this packing problem (sorting optimization).
- the product arrangement system 10 calculates a product arrangement for shipping products more efficiently in the distribution warehouse 1 (product arrangement optimization). It instructs the warehouse control system 15 on the optimized product arrangement.
- the product arrangement for shipping products more efficiently means, for example, placing a product whose shipping time is near or a product whose shipping frequency is high near the outlet. As a result, the moving distance and man-hours of the physical distribution robot 16 and the workers in the warehouse can be further reduced.
- the placement location determination module 13 of the product placement system 10 determines the placement location of each product.
- the placement location determination module 13 may decide the placement of the merchandise for each merchandise group at the time of product placement optimization, or place the merchandise placement with a part of the plurality of merchandise included in the merchandise group as one unit. You may decide.
- a part of the plurality of articles included in the article group may be, for example, a combination of articles stored in one storage area by the packing optimization. For example, when a plurality of products are arranged on one shelf by the packing optimization, the product arrangement system 10 can determine the product arrangement with the one shelf as one unit.
- the commodity placement system 10 may be communicably connected to the external server 3 outside the distribution warehouse 1, the delivery source server 5, and the delivery destination server 7.
- the connection with the outside of the product arrangement system 10 may be a connection through the Internet, and the communication may be communicable in a state of being concealed by various encryption means as needed.
- the external server 3 is configured to be able to perform various processes such as shipment prediction, commodity placement optimization, packing optimization, etc. in cooperation with the commodity placement system 10.
- Multiple external servers 3 may be connected.
- the external server 3 can be made to perform the various processes described above in units of product groups classified by the product arrangement system 10. As a result, processing can be performed even if the number of products increases, without being limited by the processing capacity of the terminal that operates the product arrangement system 10 installed in the distribution warehouse 1. That is, the commodity placement system 10 and the large number of external servers 3 can cooperate with each other to perform various processes such as shipment prediction, commodity placement optimization, and packing optimization by so-called distributed computing.
- the product arrangement system 10 can receive product information from the arrival source server 5. As the product information, product ID, product name, shipping date, shipping quantity, weight including package of product, size of packaged state of product, number, storage area volume, number of days in warehouse, average period shipping frequency, Average period shipment quantity etc. are included.
- the product placement system 10 predicts future shipment quantities from the information such as the past shipment date and shipment quantity acquired as product information (shipment forecast).
- the product arrangement system 10 can perform various processes such as shipment prediction, product arrangement optimization, and packing optimization while appropriately using the information and the shipment prediction.
- the product ID can be a product ID corresponding to a detailed feature or a minimum management unit (SKU) such as size difference or color difference of the same product name, not for each product name.
- SKU minimum management unit
- the placement location determination module 13 of the product placement system 10 determines placement locations in order from a product group having a large shipment quantity and / or representative value of the shipping frequency among the plurality of product groups when optimizing the placement position. can do. As a result, it is possible to preferentially arrange a group of products including products having a large shipping quantity and a high shipping frequency. By arranging products with a large shipment quantity or a high shipment frequency first, it is possible to preferentially arrange a high shipment frequency product group with a high shipment efficiency near an outlet with high shipment efficiency. .
- the shipping quantity for each product group and / or the representative value of the shipping frequency is a value representing the product group calculated based on the shipping quantity of each product included in the product group and the shipping frequency. For example, based on the shipment quantity and the shipment frequency of each product, it can be a representative value calculated as its arithmetic mean, median value, total value and the like.
- the placement location determination module 13 can also determine the placement location in consideration of the number of days of stay in the warehouse of the product at the placement location optimization. For example, it can be determined that a product having a large number of days in the warehouse is unlikely or likely to be shipped in the future, and the priority can be lowered or raised in optimizing the placement location.
- the product arrangement system 10 can receive the product information of the returned product from the shipping destination server 7.
- the returned product is a product which is returned from the shipping destination after being shipped from the distribution warehouse 1 and stored in the distribution warehouse 1.
- the reason for the return is not particularly limited, and examples thereof include a defective product, an unknown disposal address, a mistake in designation of a delivery destination, and an order mistake of the orderer.
- the product information received from the shipping destination server 7 includes, in addition to the above-mentioned product information received from the receiving server 5, a return date, a return reason, and the like.
- the returned goods are combined with the goods received from the arrival source, and grouping, shipment forecasting, and placement location determination are performed by the goods placement system 10.
- the commodity placement system 10 may transmit the result of shipping prediction, the result of placement location determination, and the like to the arrival source server 5 and the delivery destination server 7, and may share information with the arrival source and the delivery destination. In this way, it is possible to inform the delivery source or destination of more accurate shipping time, notify the delivery source of the delivery date to more accurate delivery time, or notify the shipping person of the delivery date of more accurate shipping time. By doing this, it is possible to shorten the waiting time for receiving goods and to streamline the distribution.
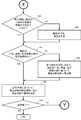
- FIGS. 2A and 2B are flowcharts showing the outline of the processing of the commodity placement system 10.
- FIG. X and Y in FIG. 2A correspond to X and Y in FIG. 2B.
- the product arrangement system 10 acquires product information from the arrival source server 5 (S01).
- the shipment prediction module 12 predicts future shipment quantity and shipment timing (shipment forecast) based on the past shipment results included in the product information (S02).
- the past shipping results are, for example, the past shipping quantity, shipping date, etc. included in the product information.
- the shipping quantity and shipping time in a predetermined future period can be determined, and using these, the shipping quantity pattern in a future predetermined period can be determined. The shipping amount pattern will be described later.
- the grouping module 11 obtains the shipment quantity, the shipment quantity pattern, and the shipment quantity peak position as the feature quantity among the product information obtained by the shipment prediction, and compares the products with each other to calculate the variation (S03). That is, the grouping module 11 compares the shipment quantity of a certain product, the shipment quantity pattern, the shipment quantity peak position with the shipment quantity of another product, the shipment quantity pattern, and the shipment quantity peak position, and obtains each variation. Then, the grouping module 11 integrates the amounts of change of the shipment quantity, the shipment amount pattern, and the shipment amount peak position to calculate the total amount of change between the products. Further, the grouping module 11 classifies a plurality of products into a plurality of product groups based on the calculated amount of change (S04). The calculation of the change amount and the total change amount by the grouping module 11 will be described later.
- the commodity placement system 10 confirms whether or not the commodity information acquired from the arrival server 5 in S01 contains information on dimensions and weight of the commodity in each of the classified commodity groups (S05).
- the determination of S05 may be performed at any timing as long as the product information is acquired from the arrival source server 5 in S01.
- the product arrangement system 10 measures the product size and weight, and writes the measured size and weight data to the product information (S06). If the product information includes size and weight information (YES in S05), or after writing the data of the size and weight measured in S06 to the product information, the product arrangement system 10 determines the size and weight of the product. , And whether the number of staying days is within a predetermined range (S07).
- the product placement system 10 adds the size of the amount of change calculated in S03 to the size, weight, and number of days of retention of the product. Based on the above, the classification of the goods into the goods group is recalculated, and the classification into the goods group is performed again (S08). At this time, it is needless to say that as a result of reclassifying each product into a product group, there may be products classified into the same product group as before reclassification.
- the placement location determination module 13 determines the product group based on the shipping forecast. The placement location of each product and the placement location of the product are determined (S09).
- the product arrangement system 10 repeatedly performs the above processing (NO in S10).
- the repeated timing for example, when the product information is updated at predetermined time intervals, the processing can be restarted from S01 at an appropriate timing.
- the grouping function has a feature amount acquisition function of acquiring a plurality of feature amounts related to each product.
- the feature amount means a value that can represent the tendency or feature of arrival and shipment of the product.
- shipment quantity pattern the change with time of the shipment quantity
- delivery quantity peak position the position of the maximum peak in the change with time of the shipment quantity
- the shipment quantity can be a shipment quantity within a predetermined period.
- the predetermined period may be, for example, any period such as the past one month, the past three months, the past one year, or the like.
- the change over time in shipment quantity means an increase or decrease in shipment quantity that changes with the passage of time. That is, when the ordinate represents the shipment quantity and the abscissa represents the time, the change over time of the shipment quantity can be represented as a pattern (shape) of the graph.
- the shipping amount pattern can be the pattern (shape) of the above graph in a predetermined period.
- the position of the maximum peak (shipment peak position) in the change with time of shipment quantity (shipment pattern) means the position of the peak within a predetermined time in the change with time of shipment quantity (shipment pattern). That is, when the ordinate represents the shipment quantity, and the abscissa represents the time, the shipment amount peak position can be expressed as the position (time point) of the largest peak in the pattern.
- the feature quantity is the shipment quantity, the shipment quantity pattern, and the maximum peak position of the shipment quantity pattern.
- the feature quantity is not limited to these. It is possible to use shipping quantities, past sales promotion activities for products, implementation timing of marketing activities, expected effects, weather conditions such as temperature and humidity, daylight hours, and precipitation.
- the feature amount acquisition function may optionally obtain these feature amounts according to the situation.
- the number (type) of feature amounts acquired by the feature amount acquisition function is not particularly limited.
- the grouping function has a feature amount comparison function that compares each feature amount acquired by the feature amount acquisition function with each feature amount related to another product and calculates a change amount for each feature amount.
- the shipment quantity of a certain product (product A) within a predetermined period can be compared with the shipment quantity of another product (product B) within a predetermined period.
- the comparison result can calculate the difference between the shipment quantities of the product A and the product B as a variation.
- the predetermined periods during which comparative shipment quantities can be obtained may be the same or different for the product A and the product B. That is, depending on the situation, shipment quantities of the same predetermined period may be compared between the product A and the product B, or shipment quantities of different predetermined periods may be compared. There may be a plurality of predetermined periods when comparing shipment quantities.
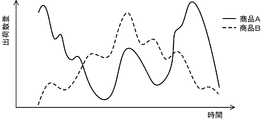
- FIG. 3 is an explanatory view showing an example of feature amount comparison when the feature amount is a shipment quantity.
- the shipment quantity of the product A is indicated by a solid line
- the shipment quantity of the product B is indicated by a broken line.
- the vertical axis is shipment quantity
- the horizontal axis is time.
- the variation is calculated as, for example, the difference D1, D2, D3, D4, etc. of the shipment quantity in each of the predetermined periods P1, P2, P3, P4 in the graph of FIG. be able to.
- the predetermined period P1 can be, for example, one day, and P2 can be the next one day or the like.
- the amount of change can be calculated, for example, by the following equation (1).
- D1, D2, D3, and D4 are the differences in the shipment quantity in each of predetermined period P1, P2, P3, and P4 as mentioned above.
- the shipment amount patterns of the product A and the product B in a predetermined period can be compared with each other.
- the predetermined period may be the same period or different periods for the product A and the product B.
- the length of the predetermined period can be arbitrarily determined.
- a plurality of predetermined periods can be provided at any time (position) of the shipping amount pattern.
- the predetermined period can be determined to include the shipment amount pattern portion having the characteristic shape so that the characteristic shape portion of the shipment amount pattern can be selectively compared.
- FIG. 4 is an explanatory view showing an example of feature amount comparison in the case where the feature amount is a shipping amount pattern.
- the shipping amount pattern of the product A is shown by a solid line
- the shipping amount pattern of the product B is shown by a broken line.
- the vertical axis is shipment quantity
- the horizontal axis is time.
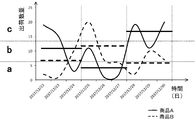
- FIG. 5 is an explanatory view showing a method of analyzing a shipping amount pattern.
- the shipping amount pattern of the product A is indicated by a solid line.
- the vertical axis is shipment quantity
- the horizontal axis is time.
- the shipment amount pattern of the product A is divided at regular intervals.
- the fixed time period is not particularly limited, but it is preferable that the length of each fixed time period separating the shipping amount pattern is the same.
- the predetermined period is 100 days
- the fixed period is 20 days.
- the shipping amount pattern is divided into five periods of every 20 days.
- the shipment amount pattern divided at a fixed period is smoothed at each divided fixed period.
- a representative value of the shipment quantity in each fixed period is determined for the shipment amount pattern in each divided fixed period, and the shipment amount pattern in each fixed period is determined by the representative value (fixed value). It means to approximate as there is.
- the representative value can be determined by any method, and can be determined, for example, by obtaining a moving average, an arithmetic average of shipment quantities within a fixed period, a median, a total value, and the like.
- the assigned label is assigned to the zone determined according to the distribution of the shipment quantity.
- the distribution of the shipment quantity is the distribution of the shipment quantity in an arbitrary period, and the zone can be appropriately determined according to the distribution form.
- the arbitrary period may be a predetermined period or all past periods including the predetermined period.
- the target products may be limited to the same product, or the target may be expanded to similar products.
- the deviation from the average ⁇ can be determined as a zone such as 1 ⁇ , 1 / 2 ⁇ , 2 ⁇ , etc., and a zone out of the zone including the average ⁇ Can be in the range of 1 ⁇ , 2 ⁇ , etc.
- the labels assigned to the above-mentioned zones for example, as shown in FIG. 5, arbitrary labels such as a, b, c, etc. can be assigned in order from the one with the smallest shipment quantity.
- the label allocated to the zone in which the value (representative value) smoothed in each fixed period is given is given as the label of the fixed period of the shipment amount pattern.
- the label "c" is given in a period of 1 to 20 days, the label "a” in a period of 21 to 40 days, and the label “b” in a period of 41 to 60 days.
- the label "b” is given for the period of 61 to 80 days, and the label "c” is given for the period of 81 to 100 days.
- the shipping amount pattern of FIG. 5 can be expressed as a character string such as "cabbc".
- labels in corresponding fixed periods can be compared.
- any numerical value can be given in advance. For example, a small value can be given when the similarity is high, and a large value can be given when the similarity is low.
- the similarity of the shipping amount pattern can be indicated by a change amount (numerical value) according to the closeness of the shipping amount to which the label is attached. Similarity can be expressed by the numerical value of each other in the corresponding fixed period of time. By adding the amount of change given to each fixed period, the similarity of the shipment amount patterns in the predetermined period can be expressed by the numerical value.
- the feature amount is the shipping amount peak position
- the predetermined period be the same period for the product A and the product B.
- the time (distance) between the peak position of the product A and the peak position of the product B can be used as the amount of change.
- FIG. 6 is an explanatory view showing an example of feature amount comparison in the case where the feature amount is a shipping amount peak position.
- the shipment amount pattern of the product A is indicated by a solid line
- the shipment amount pattern of the product B is indicated by a broken line.
- the vertical axis is shipment quantity
- the horizontal axis is time.
- the shipment quantity as the feature quantity, the shipment quantity pattern, and the shipment quantity peak position can be compared, and the similarity can be expressed by the change quantity.
- Each of these change amounts can be multiplied by a coefficient and then added to obtain the total change amount between the two products.
- Goods can be classified into a plurality of goods groups based on the total amount of change.
- the coefficient by which each change amount is multiplied in obtaining the total change amount is not particularly limited, and any real number may be adopted. These coefficients can be determined using artificial intelligence, and artificial intelligence can determine more appropriate coefficients by learning from comparison between the shipping prediction based on the determined coefficients and the actual shipping situation. It may be configured to be able to.
- the product arrangement system 10 acquires past shipment data from an electronic commerce (EC) vendor who is the arrival source.
- EC electronic commerce
- the product placement system 10 acquires shipping data from the arrival source server 5 of the EC vendor, it analyzes the shipping results included in the shipping data, and creates a shipping amount pattern for each product.
- the product arrangement system 10 classifies a plurality of groups based on shipping data and shipping amount patterns generated based on the shipping data. Specifically, for each product, the shipment quantity as a feature quantity, the shipment quantity pattern, and the shipment quantity peak position are compared with all the other goods, and the similarity is calculated as a total change quantity.
- FIG. 7 is a table showing shipping data of this embodiment.
- the shipping data stores values such as a product ID, a product name, a shipping date, and a shipping quantity (quantity).
- columns of “product ID”, “product name”, “shipment date”, and “shipment quantity” are provided from the left.
- the product name of the product ID "A0001” is "T-shirt (red)"
- 11 items are shipped on January 1, 2017.
- the same product is also shipped 11 points on January 2, 2017 and one point on January 3, 2017.
- the product name of the product ID "A0002" is "T-shirt (blue)", and eight items are shipped on January 1, 2017.
- the shipment quantity is predicted by a conventionally known method based on the shipment data shown in the table of FIG.
- FIG. 8 is a table showing shipping forecast results based on shipping data.
- the table in FIG. 8 shows the forecasted shipment quantities for products A 0001 and A 0002 from December 22, 2017 to March 30, 2017.
- the shipment quantity in a predetermined period can be predicted based on not only the past shipment data acquired from the arrival source but also any information on the same product. For example, prediction can be made based on past shipping data acquired from other shipping sources as well as specific shipping sources, shipping data of similar products, sales of products, trends, various advertisements, and the like.
- FIG. 9 is a graph showing shipping amount patterns of the product A 0001 and the product A 0002 in the vicinity of a predetermined period.
- the vertical axis is the shipment quantity
- the horizontal axis is time.
- FIG. 10 is an explanatory view of the analysis result of the shipping amount pattern of the product A 0001 and the product A 0002.
- the shipping amount pattern of the product A 0001 is labeled based on the shipping quantity in each fixed period, and can be expressed as “bac”.
- the shipping amount pattern of the product A 0002 is labeled based on the shipping quantity in each fixed period, and can be expressed as “bbc”.
- the shipping quantity peak position (date) of the product A 0001 in the shipping quantity pattern from December 22, 2017 to December 30, 2017 as the predetermined period is December 28, 2017.
- the shipment volume peak position (date) of the product A 0002 is December 25, 2017. Therefore, the distance between the product A 0001 and the product A 0002, that is, the amount of change of the shipping amount peak position between the product A 0001 and the product A 0002 is determined to be 3.
- Each variation of the shipping quantity, shipping quantity pattern, and shipping quantity peak position determined above is multiplied by the optimal coefficient determined by artificial intelligence based on comparison learning between past shipping forecast and actual shipping situation, and the overall The amount of change is determined.
- the one-to-one comparison of the commodities is performed for all the commodity combinations, and the total variation thus obtained is associated with each combination. Then, based on the value of the value of the total change amount, a large number of products are classified (grouped) into a plurality of product groups.
- the products classified for each product group are subjected to calculation of placement location determination and packing optimization for each product group.
- the product arrangement system 10 transmits the product information for each product group to the external server 3 and performs calculation in the external server 3.
- the external server 3 is connected to the product arrangement system 10 via the Internet.
- the external server 3 is present in a number corresponding to the number of product groups, and the product information of each product included in one product group is transmitted to each external server 3, and the external server 3 performs packing optimization Calculation is performed.
- the product information here specifically includes a product ID, a product name, a shipping date, a shipping quantity, a weight including a product package, dimensions of the packaged state of the product, the number, the volume of the storage box, and the retention in the warehouse. It includes information such as the number of days, the average period shipment frequency, and the average period shipment volume.
- Each external server 3 optimizes (combining optimization) the combination of products to be stored in each storage box based on the information, and calculates an optimal product arrangement for efficient shipping. The calculation result is transmitted to the product placement system 10.
- the product placement system 10 predicts (shipment forecast) the shipment quantity and shipping date of the product for each of the classified product groups. Then, the product placement system 10 determines the placement location for each product group and the placement location of the products based on the shipping forecast so that the shipping is most efficient.
- the present invention includes the following gist.
- a plurality of feature amounts are obtained for each of the products from shipment data of a plurality of products, and the feature amounts obtained for a certain product and the feature amounts obtained for another product are respectively obtained.
- the amount of change between corresponding feature amounts is calculated by comparing the corresponding feature amounts, and the plurality of products are classified into a plurality of product groups based on the calculated magnitude of the change amount.
- Shipment forecasting means for acquiring shipping shipment results for each of the products from the shipping data, and for predicting shipment quantities of the plurality of products based on the obtained shipping results;
- a product arrangement system having an arrangement place for each of the classified product groups and an arrangement place determining means for determining an arrangement place of the plurality of goods based on To.
- the characteristic amount may be two or more of the position of the maximum peak in the shipment quantity of the product, the temporal change of the shipment quantity of the product, and the temporal change of the shipment quantity of the product.
- the grouping unit is based on the size and / or weight of the product in addition to the calculated magnitude of the amount of change when the size and / or weight of the product is outside the predetermined range.
- the plurality of products may be classified into a plurality of product groups.
- the placement location determination means has a configuration in which a plurality of computers are connected, and the computer is configured for one or more of the plurality of goods groups among the plurality of goods groups classified by the grouping means, The arrangement location of each of the product groups and the arrangement location of the plurality of products may be determined.
- the arrangement place determination means determines the arrangement place of the goods in order from the goods group having a large shipment quantity and / or representative value of the shipment frequency for each goods group among a plurality of goods groups. It may be
- a plurality of feature amounts are obtained for each of the products from the shipment data of a plurality of products, and the feature amounts obtained for a certain product and the feature amounts obtained for other products are respectively obtained.
- the amount of change between corresponding feature amounts is calculated by comparing the corresponding feature amounts, and the plurality of products are classified into a plurality of product groups based on the calculated magnitude of the change amount.
- the product arrangement method including the arrangement place determination step of determining the arrangement place is also the meaning.
- a plurality of feature amounts are obtained for each of the products from the shipment data of a plurality of products, and the feature amounts obtained for a certain product and the feature amounts obtained for another product are respectively obtained.
- the amount of change between corresponding feature amounts is calculated by comparing the corresponding feature amounts, and the plurality of products are classified into a plurality of product groups based on the calculated magnitude of the change amount.
- Grouping means, shipment forecasting means for forecasting shipment quantities and shipping times of the plurality of articles, arrangement location for each of the commodity groups classified based on the shipment forecast by the shipment forecasting means, and arrangement location of the plurality of articles A product placement program that causes a computer to function as placement location determination means for determining
- Distribution warehouse 3 External server 5: Receiving server 7: Shipping server 10: Product placement system 11: Grouping module 12: Delivery prediction module 13: Placement location determination module 15: Warehouse control system 16: Logistics robot 17: Handy terminal 18: Information input terminal
Abstract
商品配置システム10は、グルーピングモジュール11と、出荷予測モジュール12と、配置場所決定モジュール13とを有する。グルーピングモジュール11は、出荷データから取得した特徴量について、ある商品について取得した各特徴量と、他の商品について取得した各特徴量と、をそれぞれ対応する特徴量どうしで比較して、その間の変化量を算出し、変化量の大きさに基づいて複数の商品を複数の商品群へと分類する。出荷予測モジュール12は、過去の出荷実績に基づいて商品の出荷数量を予測する。配置場所決定モジュール13は、出荷予測手段による出荷予測に基づいて、分類された商品群毎の配置場所、及び複数の商品の配置場所を決定する。
Description
本発明は、商品配置システム、商品配置方法、及び商品配置プログラムに関する。具体的には、物流の現場における商品の入荷から出荷までのプロセスの効率を向上させる商品配置システム、商品配置方法、及び商品配置プログラムに関する。
物流倉庫等の物流の現場においては、頻繁に多数の商品が入出荷され、時々刻々と商品の配置が変更される。多数の商品を効率良く入出荷させるために、入荷された商品の出荷時期や出荷数量を予測し、その予測に基づいて商品の配置の最適化が試みられている(例えば、特許文献1)。
商品の出荷時期や出荷数量の予測は、商品の数が増えるに連れて、計算量も増えることになる。さらに、商品を効率良く出荷させるためには、出荷時期や出荷数量の予測だけでなく、商品を保管したり移動させたりするためのコンテナや棚、ボックス等に、効率良く商品を配置(格納)する必要がある。すなわち、商品の効率的な出荷には、商品をその重量やパッケージ寸法等に応じて適当に組み合わせること(以下「荷合せ」ともいう)が必要である。商品数が多くなると、商品の荷合せを行うためには、膨大な計算量が必要となる。
本発明は、上記の事情に鑑みてなされたもので、商品配置の計算を効率化することが可能な商品配置システム、商品配置方法、及び商品配置プログラムを提供することを例示的課題とする。
上記の課題を解決するために、本発明は以下の構成を有する。
複数の商品に関する出荷データから、各前記商品についてそれぞれ複数の特徴量を取得し、ある商品について取得した各前記特徴量と、他の商品について取得した各前記特徴量と、をそれぞれ対応する前記特徴量どうしで比較して、対応する前記特徴量どうしの間の変化量を算出し、算出した前記変化量の大きさに基づいて前記複数の商品を複数の商品群へと分類するグルーピング手段と、前記出荷データから各前記商品について過去の出荷実績を取得し、取得した前記出荷実績に基づいて前記複数の商品の出荷数量を予測する出荷予測手段と、前記出荷予測手段による出荷予測に基づいて、分類された前記商品群毎の配置場所、及び前記複数の商品の配置場所を決定する配置場所決定手段と、を有する商品配置システム。
複数の商品に関する出荷データから、各前記商品についてそれぞれ複数の特徴量を取得し、ある商品について取得した各前記特徴量と、他の商品について取得した各前記特徴量と、をそれぞれ対応する前記特徴量どうしで比較して、対応する前記特徴量どうしの間の変化量を算出し、算出した前記変化量の大きさに基づいて前記複数の商品を複数の商品群へと分類するグルーピング手段と、前記出荷データから各前記商品について過去の出荷実績を取得し、取得した前記出荷実績に基づいて前記複数の商品の出荷数量を予測する出荷予測手段と、前記出荷予測手段による出荷予測に基づいて、分類された前記商品群毎の配置場所、及び前記複数の商品の配置場所を決定する配置場所決定手段と、を有する商品配置システム。
本発明の更なる目的又はその他の特徴は、以下添付図面を参照して説明される好ましい実施の形態によって明らかにされるであろう。
本発明によれば、商品配置の計算を効率化することが可能な商品配置システム、商品配置方法、及び商品配置プログラムを提供することができる。
[実施形態1]
以下、実施形態1に係る商品配置システム10について、図面を参照しながら説明する。図1は、物流倉庫1及び商品配置システム10の概要を示す説明図である。
以下、実施形態1に係る商品配置システム10について、図面を参照しながら説明する。図1は、物流倉庫1及び商品配置システム10の概要を示す説明図である。
物流倉庫1には、商品配置システム10と、倉庫制御システム15と、が少なくとも設置されている。商品配置システム10は、グルーピング手段としてのグルーピングモジュール11と、出荷予測手段としての出荷予測モジュール12と、配置場所決定手段としての配置場所決定モジュール13と、を少なくとも備えている。商品配置システム10は、これら各モジュールが機能することによって、本発明に係る商品配置方法を実現することができる。また、商品配置システム10は、本発明に係る商品配置プログラムによってコンピュータを上記各手段として機能させることによって、動作させることができる。
物流倉庫1には、入荷元から入荷した商品が備蓄される。そして、例えば、電子商取引(EC)業者等の出荷発注者からの発注に基づき、備蓄された商品を所定の出荷先へ向けて商品が出荷される。商品配置システム10は、入荷元から商品情報を取得し、この商品情報に基づいてグルーピング、出荷予測を行い、物流倉庫1内での商品の最適な配置を決定する。なお、入荷元は、出荷発注者と同一であってもよい。
倉庫制御システム15は、商品配置システム10と、物流ロボット16と、ハンディターミナル17と、情報入力端末18と、相互に通信可能に接続されている。物流倉庫1には、商品配置システム10によって決定された商品配置に基づき倉庫制御システム15が生成した商品配置指示を受信する、物流ロボット16やハンディターミナル17が複数導入されている。倉庫制御システム15と、物流ロボット16やハンディターミナル17との通信は、無線LAN等の無線通信とすることができる。倉庫制御システム15は、物流ロボット16やハンディターミナル17が、物流倉庫1内でどの位置にあるか、通信設備、GPS等を介して把握できるよう構成されている。
物流ロボット16は、商品配置指示に基づき、商品を移動、配置することができるよう構成されている。物流ロボット16は、例えば、自走可能であり、商品が配置された棚やパレットを持ち上げ、持ち上げた状態のまま移動し、所定の場所に当該棚やパレットを載置するよう構成されていてもよい。物流ロボット16は、例えば、1つ又は複数の商品をアームで把持、吸引等の各種手段によって持ち上げるよう構成されていてもよい。
ハンディターミナル17は、物流倉庫1内で商品の移動、配置を行う作業員が携帯する端末である。ハンディターミナル17は、商品配置指示を作業員に対して通知し、作業員はその商品配置指示に基づき、商品の移動、配置等の作業を行う。作業員は、ハンディターミナル17を介して、商品の移動、配置等の作業完了の情報を倉庫制御システム15へと送信することができる。
倉庫制御システム15は、情報入力端末18から商品の場所、商品情報等を取得することもできる。情報入力端末18は、例えば、スマートフォン、タブレット型端末、携帯電話機や、コンピュータ等の情報処理端末とすることができる。これにより、商品の場所や商品情報が帳票等の電子化されていない情報であった場合、それらの情報をより効率的に倉庫制御システム15へ登録することができる。具体的には、帳票等に記載の情報を、作業員がスマートフォンやコンピュータ等の情報入力端末18へと入力することで、情報入力端末18から倉庫制御システム15へ情報が送信されるよう構成しておくことができる。また、倉庫制御システム15が管理している商品の場所が、実際の倉庫内で商品が配置されている場所と異なっていたとしても、実際の倉庫内で商品が配置されている場所の情報を倉庫制御システム15へ送信することができる。
物流倉庫1内において、商品は、収容領域に収容される。収容領域としては、具体的には、棚(巣箱)や、パレット、ラック等である。収容領域には、一定の寸法や耐荷重量が存在するため、収容する商品が限定される。また、商品を有限の収容領域に効率良く収容するためには、商品どうしの組合せを考慮し、計算する必要がある。このような最適化の計算は、特に商品数が多い場合、処理を実行する端末に高い処理能力が求められる。本明細書において、商品を収容領域に効率良く収容するための組合せを検討することを「荷合せ」ということとする。商品配置システム10は、この荷合せの問題を効率良く計算すること(荷合せ最適化)を可能とするものである。
商品配置システム10は、物流倉庫1内において、より効率良く商品を出荷するための商品配置を計算する(商品配置最適化)。これにより最適化された商品配置を、倉庫制御システム15へ向けて指示する。より効率良く商品を出荷するための商品配置とは、例えば、出荷時期が近い商品や、出荷頻度が高い商品を、搬出口の近くに配置する等である。これにより、倉庫内における物流ロボット16や作業員の移動距離や工数を、より削減することになる。
商品配置システム10の配置場所決定モジュール13は、各商品の配置場所を決定する。配置場所決定モジュール13は、商品配置最適化に際して、商品群毎に商品の配置を決定してもよいし、商品群に含まれる複数の商品のうちの一部の商品を1単位として商品配置を決定してもよい。商品群に含まれる複数の商品のうちの一部の商品とは、例えば、荷合せ最適化により、1つの収容領域に収容された商品の組合せとすることができる。例えば、商品配置システム10は、荷合せ最適化により1つの棚に複数の商品が配置された場合、当該1つの棚を1単位として、商品配置を決定することができる。
商品配置システム10は、物流倉庫1の外部にある外部サーバ3や、入荷元サーバ5、出荷先サーバ7と相互に通信可能に接続されていてもよい。商品配置システム10の外部との接続は、インターネットを介した接続であってもよく、必要に応じて、通信は各種の暗号化手段によって秘匿された状態で通信可能なものであってもよい。
外部サーバ3は、商品配置システム10と連係して出荷予測、商品配置最適化、荷合せ最適化等の各種処理を行うことができるよう構成されている。外部サーバ3は、複数接続されていてもよい。例えば、商品配置システム10によって分類された商品群単位で、外部サーバ3に上述の各種処理を行わせることができる。これにより、物流倉庫1に設置される商品配置システム10を稼働させる端末の処理能力に制限されることなく、商品数が増えても処理することができる。すなわち、商品配置システム10と多数の外部サーバ3が連係して、出荷予測、商品配置最適化、荷合せ最適等の各種処理を、いわゆる分散コンピューティングにより行うことができる。
商品配置システム10は、入荷元サーバ5から商品情報を受信することができる。商品情報としては、商品ID、商品名、出荷日付、出荷数量、商品のパッケージ込みの重量、商品のパッケージされた状態の寸法、個数、収容領域の容積、倉庫内滞留日数、期間平均出荷頻度、期間平均出荷数量等が含まれる。商品配置システム10は、商品情報として取得した過去の出荷日付、出荷数量等の情報から、将来の出荷数量を予測(出荷予測)する。商品配置システム10は、これら情報や出荷予測を適宜利用しつつ、出荷予測、商品配置最適化、荷合せ最適化等の各種処理を行うことができる。なお、商品IDは、商品名毎ではなく、同一商品名のサイズ違いや色違い等、詳細な特徴、又は最小管理単位(SKU)に対応した商品IDとすることができる。
商品配置システム10の配置場所決定モジュール13は、配置場所最適化に際して、複数の商品群のうち、商品群毎の出荷数量及び/又は出荷頻度の代表値が大きい商品群から順に、配置場所を決定することができる。これにより、出荷数量が大きく、出荷頻度が高い商品を含む商品群を優先的に商品配置することができる。出荷数量が大きい、又は出荷頻度が高い商品群を先に商品配置することで、出荷数量が大きく、出荷頻度が高い商品群を出荷効率が高い搬出口の近くに優先的に配置することができる。ここで、商品群毎の出荷数量及び/又は出荷頻度の代表値とは、商品群に含まれる各商品の出荷数量、出荷頻度に基づいて算出した商品群を代表する値である。例えば、各商品の出荷数量、出荷頻度に基づいて、その相加平均や、中央値、合計値等として算出された代表値とすることができる。
配置場所決定モジュール13は、配置場所最適化に際して、商品の倉庫内滞留日数を考慮して、配置場所を決定することもできる。例えば、倉庫内滞留日数が大きい商品は、今後出荷される可能性が低い又は高いと判断し、配置場所最適化に際して、優先順位を下げる又は上げることができる。
商品配置システム10は、出荷先サーバ7から返品された商品の商品情報を受信することができる。ここで、返品された商品とは、物流倉庫1から商品が出荷された後、出荷先から返品され、物流倉庫1で保管することとなった商品である。返品理由としては、特に限定されず、例えば、不良品、あて処不明、配送先指定の間違い、発注者の発注ミス等が挙げられる。出荷先サーバ7から受信する商品情報としては、入荷元サーバ5から受信する上述の商品情報に加え、返品日、返品理由等が含まれる。返品された商品は、入荷元から入荷された商品と併せて、商品配置システム10により、グルーピング、出荷予測、配置場所決定が行われる。
商品配置システム10は、入荷元サーバ5、出荷先サーバ7へ、出荷予測の結果や、配置場所決定の結果等を送信し、入荷元、出荷先と情報を共有してもよい。これにより、より正確な出荷時期を入荷元や出荷先へ知らせることができ、入荷元から発注者へより正確な配送時期を通知したり、出荷先の配送担当者へより正確な出荷時期を通知したりすることによって、荷受け待ちの時間を短縮し、物流を効率化することができる。
以下、商品配置システム10の処理の流れを、図2A及び図2Bを参照しながら説明する。図2A及び図2Bは、商品配置システム10の処理の概要を示すフロー図である。図2A中のX及びYは、図2B中のX及びYに対応している。
商品配置システム10は、処理が開始されると(START)、入荷元サーバ5から商品情報を取得する(S01)。出荷予測モジュール12は、商品情報に含まれる過去の出荷実績に基づき、将来の出荷数量及び出荷時期を予測(出荷予測)する(S02)。このとき、過去の出荷実績としては、例えば、商品情報に含まれる過去の出荷数量や出荷日付等である。このような出荷予測により、将来の所定期間における出荷数量及び出荷時期が求められ、これらを用いて、将来の所定期間における出荷量パターンを求めることができる。出荷量パターンについては後述する。
グルーピングモジュール11は、出荷予測により求められた商品情報のうち、特徴量として出荷数量、出荷量パターン、出荷量ピーク位置を求め、商品どうしで比較して変化量を算出する(S03)。すなわち、グルーピングモジュール11は、ある商品の出荷数量、出荷量パターン、出荷量ピーク位置と他の商品の出荷数量、出荷量パターン、出荷量ピーク位置とをそれぞれ比較し、各変化量を求める。そして、グルーピングモジュール11は、出荷数量、出荷量パターン、出荷量ピーク位置の各変化量を総合して、商品どうしの間の総合変化量を算出する。さらに、グルーピングモジュール11は、算出された変化量に基づいて、複数の商品を複数の商品群へと分類する(S04)。グルーピングモジュール11による変化量、総合変化量の算出については、後述する。
商品配置システム10は、分類された各商品群において、S01において入荷元サーバ5から取得した商品情報に、商品の寸法及び重量の情報が含まれているか確認する(S05)。なお、S05の判断は、S01で入荷元サーバ5から商品情報を取得後であれば、どのタイミングで行われてもよい。
商品情報に商品の寸法及び重量の情報が含まれていなかった場合(S05でNO)、商品配置システム10は、商品の寸法及び重量を測定し、測定した寸法及び重量のデータを商品情報へ書き込む(S06)。商品情報に寸法及び重量の情報が含まれていた場合(S05でYES)、又は、S06で測定した寸法及び重量のデータを商品情報へ書き込んだ後、商品配置システム10は、商品の寸法、重量、及び滞留日数が所定範囲内であるか確認する(S07)。
商品の寸法、重量、及び滞留日数が所定範囲外である場合(S07でNO)、商品配置システム10は、S03で算出した変化量の大きさに加えて、商品の寸法、重量、及び滞留日数に基づいて、商品の商品群への分類を再計算し、商品群への分類を再度行う(S08)。このとき、各商品を商品群へ再分類した結果、再分類前と同じ商品群へと分類される商品が存在してもよいことは言うまでもない。
商品の寸法、重量、及び滞留日数が所定範囲内である場合(S07でYES)、又は、S08で商品の再分類を行った後、配置場所決定モジュール13は、出荷予測に基づいて、商品群毎の配置場所、及び商品の配置場所を決定する(S09)。
商品配置システム10は、以上の処理を繰り返し行う(S10でNO)。繰り返しのタイミングとしては、例えば、一定時間毎に、所定時間に、商品情報が更新された際に、等適宜のタイミングで処理をS01から再開することができる。
以下、商品配置システム10が備えるグルーピングモジュール11、出荷予測モジュール12、配置場所決定モジュール13の各モジュールが有するグルーピング機能、出荷予測機能、配置場所決定機能の各機能について詳細に説明する。
<グルーピング機能>
グルーピング機能は、各商品に関する複数の特徴量を取得する特徴量取得機能を有する。
グルーピング機能は、各商品に関する複数の特徴量を取得する特徴量取得機能を有する。
ここで、特徴量とは、商品の入荷及び出荷の傾向や特徴を表し得る値を意味する。具体的には、物流倉庫1における商品の出荷数量、出荷数量の経時変化(以下「出荷量パターン」ともいう)、及び、出荷数量の経時変化における最大ピークの位置(以下「出荷量ピーク位置」ともいう)を挙げることができる。
出荷数量としては、所定期間内での出荷数量とすることができる。所定期間としては、例えば、過去1ヶ月間、過去3ヶ月間、過去1年間等、任意の期間とすることができる。
出荷数量の経時変化(出荷量パターン)とは、時間の経過に連れて変化する出荷数量の増減を意味する。すなわち、縦軸を出荷数量、横軸を時間とするグラフで表現した場合、出荷数量の経時変化は、当該グラフのパターン(形状)として表すことができる。出荷量パターンは、所定期間内における、上記グラフのパターン(形状)とすることができる。
出荷数量の経時変化(出荷量パターン)における最大ピークの位置(出荷量ピーク位置)とは、出荷数量の経時変化(出荷量パターン)における、所定時間内でのピークの位置を意味する。すなわち、縦軸を出荷数量、横軸を時間とするグラフで表現した場合、出荷量ピーク位置は、当該パターンにおける最大ピークの位置(時点)として表すことができる。
以下、特徴量が、出荷数量、出荷量パターン、出荷量パターンの最大ピーク位置である場合について説明するが、特徴量としては、これらに限定されず、例えば、過去にグルーピングされた商品群についての出荷数量、商品についての過去の販売促進活動やマーケティング活動の実施時期や予想される効果、気温や湿度、日照時間、降水量等の天候状態等とすることもできる。特徴量取得機能は、状況に応じて、これら特徴量を任意選択的に取得するものであってもよい。特徴量取得機能が取得する特徴量の数(種類)は、特に限定されない。
グルーピング機能は、特徴量取得機能によって取得された各特徴量を、他の商品に関する各特徴量とそれぞれ比較し、各特徴量についての変化量を算出する特徴量比較機能を有する。
特徴量が出荷数量である場合、ある商品(商品A)の所定期間内での出荷数量と、他の商品(商品B)の所定期間内での出荷数量と、を比較することができる。この比較結果は、商品Aと商品Bとの出荷数量の差を変化量として算出することができる。商品Aと商品Bとで、比較対称となる出荷数量が得られる所定期間は同一であっても、異なっていてもよい。すなわち、状況に応じて、商品Aと商品Bとで、同一の所定期間の出荷数量を比較してもよいし、異なる所定期間の出荷数量を比較してもよい。出荷数量の比較に際して、所定期間は複数あってもよい。
図3は、特徴量が出荷数量である場合の特徴量比較の一例を示す説明図である。図3に示すグラフにおいて、商品Aの出荷数量を実線で、商品Bの出荷数量を破線で示している。このグラフにおいて、縦軸が出荷数量であり、横軸が時間である。
所定期間における商品Aと商品Bの比較により、図3のグラフ中、例えば、所定期間P1、P2、P3、P4のそれぞれにおける出荷数量の差D1、D2、D3、D4等として変化量を算出することができる。所定期間P1は、例えば、とある1日間とすることができ、P2はその次の1日間等とすることができる。このように所定期間が複数存在する場合、変化量は、例えば、下記式(1)により算出することができる。
[(D1)2+(D2)2+(D3)2+(D4)2+・・・]1/2 式(1)
式(1)中、D1、D2、D3、D4は、上述のように、所定期間P1、P2、P3、P4のそれぞれにおける出荷数量の差である。
[(D1)2+(D2)2+(D3)2+(D4)2+・・・]1/2 式(1)
式(1)中、D1、D2、D3、D4は、上述のように、所定期間P1、P2、P3、P4のそれぞれにおける出荷数量の差である。
特徴量が出荷数量の経時変化(出荷量パターン)である場合、商品Aと商品Bの所定期間内における出荷量パターン同士を比較することができる。このとき、所定期間は、商品Aと商品Bとで、同一の期間であっても、異なる期間であってもよい。異なる期間における商品Aの出荷量パターンと商品Bの出荷量パターンとを比較することにより、時期は異なるが、似たような出荷量パターンを示す商品を同じグループに分類することができる。また、所定期間の長さは、任意に決定することができる。所定期間は、出荷量パターンの任意の時期(位置)に、複数設けることができる。例えば、人工知能を用いることにより、出荷量パターンの特徴的な形状部分を選択的に比較できるよう、特徴的な形状を有する出荷量パターン部分を含むように所定期間を決定することができる。
図4は、特徴量が出荷量パターンである場合の特徴量比較の一例を示す説明図である。図4に示すグラフにおいて、商品Aの出荷量パターンを実線で、商品Bの出荷量パターンを破線で示している。このグラフにおいて、縦軸が出荷数量であり、横軸が時間である。図4のグラフが示すパターンの形状を比較することで、特徴量としての出荷量パターンを比較することができる。
次に、特徴量としての出荷量パターン同士を比較するために出荷量パターンを分析する方法の一例について説明する。図5は、出荷量パターンの分析方法を示す説明図である。図5に示すグラフにおいて、商品Aの出荷量パターンを実線で示している。このグラフにおいて、縦軸が出荷数量であり、横軸が時間である。
図5のグラフにおいて、商品Aの出荷量パターンは、一定期間毎に区切られている。一定期間としては、特に制限されないが、出荷量パターンを区切る各一定期間の長さは同一であることが好ましい。例えば、図5においては、所定期間が100日であり、一定期間が20日である。これにより、出荷量パターンは、20日毎の5つの期間に区切られる。
一定期間で区切られた出荷量パターンは、区切られた一定期間毎に平滑化される。ここで、平滑化とは、区切られた各一定期間における出荷量パターンについて、各一定期間内における出荷数量の代表値を決定し、各一定期間における出荷量パターンを当該代表値(一定値)であるとして近似することを意味するものとする。代表値は、任意の方法によって決定することができ、例えば、移動平均、一定期間内の出荷数量の相加平均、中央値、合計値等を求めることで決定することができる。
次いで、各一定期間において平滑化された値(代表値)に基づいて、出荷数量の分布に応じて決定されたゾーンに割り当てられたラベルを付与する。ここで、出荷数量の分布は、任意の期間における出荷数量の分布であり、その分布形態に応じて、適宜ゾーンを決定することができる。ここで、任意の期間とは、所定期間であってもよいし、所定期間を含めた過去の全期間であってもよい。また、対象とする商品は、同一の商品に限定されていてもよく、類似した商品にまで対象が拡大されていてもよい。例えば、出荷数量の分布が正規分布であった場合、平均μからのずれが1σや1/2σ、2σ等の範囲を1つのゾーンと決定することができ、平均μを含むゾーンから外れたゾーンは、1σ、2σ等の範囲とすることができる。
上述のゾーンに割り当てられるラベルとしては、たとえば、図5に示すように、出荷数量が少ない方から順にa、b、c等と任意のラベルを割り当てることができる。そして、各一定期間において平滑化された値(代表値)が含まれるゾーンに割り当てられたラベルが、出荷量パターンの当該一定期間のラベルとして付与される。例えば、図5の出荷量パターンにおいて、1~20日の期間にはラベル「c」が付与され、21~40日の期間にはラベル「a」、41~60日の期間にはラベル「b」、61~80日の期間にはラベル「b」、81~100日の期間にはラベル「c」が付与されている。これにより、図5の出荷量パターンは、「cabbc」のような文字列として表現することができる。
このように出荷量パターンを分析し、一定期間毎にラベルを付与することにより、出荷量パターンの概形を文字列で表現することができる。特徴量としての出荷量パターン同士を比較する際には、この文字列同士を比較することもできる。
文字列同士の比較においては、対応する一定期間におけるラベル同士を比較することができる。ラベル間の類似性については、予め任意の数値を付与しておくことができ、例えば、類似性が高い場合に小さな値を、類似性が低い場合に大きな値を付与しておくことができる。これにより、2つのラベルを比較した場合に、ラベルが付与された出荷数量の近似性に応じて出荷量パターンの類否を変化量(数値)で示すことができる。対応する一定期間におけるラベル同士について、それぞれその類否を数値の大小で表現することができる。各一定期間に対して付与された変化量を加算することで、所定期間における出荷量パターン同士の類否を数値の大小で表現することができる。
例えば、商品Aの出荷量パターン(図5)が「cabbc」であり、商品Bの出荷量パターン(比較対象、図示せず)が「abcba」であった場合、各文字列の1桁目から順に「c」と「a」、「a」と「b」、「c」と「c」、「b」と「b」、「c」と「c」のように5桁目までそれぞれ比較し、ラベルの類否に応じて予め決定された数値が付与される。得られた5つの数値を加算して商品Aと商品Bの出荷量パターンの類否を数値で表現することができる。
特徴量が出荷量ピーク位置である場合、商品Aと商品Bの所定期間内における出荷量パターンのピーク位置同士を比較することができる。このとき、所定期間は、商品Aと商品Bとで、同一の期間であることが好ましい。商品Aと商品Bの出荷量パターンのピーク位置同士の比較に際しては、具体的には、商品Aのピーク位置と商品Bのピーク位置の間の時間(距離)を変化量とすることができる。
図6は、特徴量が出荷量ピーク位置である場合の特徴量比較の一例を示す説明図である。図6に示すグラフにおいて、商品Aの出荷量パターンを実線で、商品Bの出荷量パターンを破線で示している。このグラフにおいて、縦軸が出荷数量であり、横軸が時間である。図6のグラフが示すパターンのピーク位置を比較することで、特徴量としての出荷量ピーク位置を比較することができる。具体的には、図6中に示す距離Dpが、商品Aのピーク位置と商品Bのピーク位置の間の距離である。
以上のような方法によって、特徴量としての出荷数量、出荷量パターン、出荷量ピーク位置を比較し、それぞれ類似度を変化量で表現することができる。これら変化量のそれぞれに、係数を乗じた上で加算して、2つの商品間の総合変化量を求めることができる。この総合変化量に基づき、商品を複数の商品群へと分類することができる。
総合変化量を求めるに際して、各変化量に乗じる係数は、特に制限されず、任意の実数を採用することができる。これら係数は、人工知能を用いて決定することができ、決定した係数に基づく出荷予測と、実際の出荷状況との比較から、人工知能が学習することによって、より適切な係数を決定することができるよう構成されていてもよい。
以下、実施例を用いて本発明の商品配置システム10について説明する。なお、本発明は、この実施例に限定されるものではない。
本実施例においては、入荷元である電子商取引(EC)業者から過去の出荷データを商品配置システム10が取得する場合について説明する。商品配置システム10は、EC業者の入荷元サーバ5から出荷データを取得すると、出荷データに含まれる出荷実績を解析し、各商品について、出荷量パターンを作成する。
商品配置システム10は、出荷データ、及び出荷データを基に生成された出荷量パターンに基づいて、複数のグループに分類を行う。具体的には、各商品について、特徴量としての出荷数量、出荷量パターン、出荷量ピーク位置をそれぞれ他の全ての商品と比較し、その類似度を総合変化量として算出する。
図7は、本実施例の出荷データを示す表である。出荷データには、商品ID、商品名、出荷日、及び出荷数量(数量)等の各値が格納されている。図7の表中、左から「商品ID」、「商品名」、「出荷日」、「出荷数量」の列が設けられている。例えば、商品ID『A0001』の商品名は『Tシャツ(赤)』であり、2017年1月1日に11点出荷されている。また、同じ商品が、2017年1月2日に11点、2017年1月3日に1点出荷されている。商品ID『A0002』の商品名は『Tシャツ(青)』であり、2017年1月1日に8点出荷されている。
ここで、代表例として、商品A0001と、商品A0002との比較について説明する。出荷数量は、図7の表に示す出荷データに基づき、従来公知の方法により予測する。図8は、出荷データに基づく出荷予想結果を示す表である。図8の表には、商品A0001及び商品A0002について、2017年12月22日から同30日までの出荷数量の予測結果が示されている。このとき、所定期間における出荷数量は、入荷元から取得した過去の出荷データだけでなく、同一商品に関するあらゆる情報に基づいて予測することができる。例えば、特定の入荷元だけでなく、他の入荷元から取得した過去の出荷データや、類似商品の出荷データ、商品の売れ行き、トレンド、各種広告等に基づいても予測することができる。
図9は、商品A0001及び商品A0002の所定期間近傍における出荷量パターンを示すグラフである。図9において、縦軸が出荷数量であり、横軸が時間である。
(出荷数量の比較)
商品A0001及び商品A0002について、所定期間としての2017年12月25日から27日までの各日における予想出荷数量の差D1、D2、D3に基づいて、出荷数量の変化量を以下のように求める。
[(D1)2+(D2)2+(D3)2]1/2
=[|11-20|2+|1-7|2+|2-6|2]1/2
≒11.5
商品A0001及び商品A0002について、所定期間としての2017年12月25日から27日までの各日における予想出荷数量の差D1、D2、D3に基づいて、出荷数量の変化量を以下のように求める。
[(D1)2+(D2)2+(D3)2]1/2
=[|11-20|2+|1-7|2+|2-6|2]1/2
≒11.5
(出荷量パターンの比較)
商品A0001及び商品A0002について、所定期間としての2017年12月22日から2017年12月30日までの出荷量パターンを比較する。ここでは、出荷量パターンを分析する場合の一定期間は、3日間である。図10は、商品A0001及び商品A0002の出荷量パターンの分析結果の説明図である。図10に示すように、商品A0001の出荷量パターンは、各一定期間における出荷数量に基づいてラベルが付与され、「bac」として表現することができる。図10に示すように、商品A0002の出荷量パターンは、各一定期間における出荷数量に基づいてラベルが付与され、「bbc」として表現することができる。
商品A0001及び商品A0002について、所定期間としての2017年12月22日から2017年12月30日までの出荷量パターンを比較する。ここでは、出荷量パターンを分析する場合の一定期間は、3日間である。図10は、商品A0001及び商品A0002の出荷量パターンの分析結果の説明図である。図10に示すように、商品A0001の出荷量パターンは、各一定期間における出荷数量に基づいてラベルが付与され、「bac」として表現することができる。図10に示すように、商品A0002の出荷量パターンは、各一定期間における出荷数量に基づいてラベルが付与され、「bbc」として表現することができる。
図11は、出荷量パターンの比較におけるラベル間の類似度を示すチャートである。商品A0001と商品A0002とで、各一定期間において対応するラベルは「b」と「ba」、「a」と「b」、「c」と「a」であり、これらの類似度を加算することで、以下のように、商品A0001と商品A0002との間の出荷量パターンの変化量が求められる。
(b,b)+(a,b)+(c,a)
=0+0.53+1.39
=1.92
(b,b)+(a,b)+(c,a)
=0+0.53+1.39
=1.92
(出荷量ピーク位置の比較)
所定期間としての2017年12月22日から2017年12月30日までの出荷量パターンにおける商品A0001の出荷量ピーク位置(日付)は、2017年12月28日である。同様に、商品A0002の出荷量ピーク位置(日付)は、2017年12月25日である。したがって、商品A0001と商品A0002との間の距離、すなわち商品A0001と商品A0002との間の出荷量ピーク位置の変化量は3と求められる。
所定期間としての2017年12月22日から2017年12月30日までの出荷量パターンにおける商品A0001の出荷量ピーク位置(日付)は、2017年12月28日である。同様に、商品A0002の出荷量ピーク位置(日付)は、2017年12月25日である。したがって、商品A0001と商品A0002との間の距離、すなわち商品A0001と商品A0002との間の出荷量ピーク位置の変化量は3と求められる。
以上求めた出荷数量、出荷量パターン、出荷量ピーク位置の各変化量に対し、過去の出荷予測と実際の出荷状況との比較学習に基づいて人工知能が決定した最適な係数を乗じて、総合変化量が求められる。
以上のように商品の1対1の比較を全ての商品の組合せに対して行い、各組合せに対して、それぞれ求められた総合変化量を関連付ける。そして、総合変化量の値の大きさに基づき、多数の商品を、複数の商品群へと分類(グルーピング)する。
商品群毎に分類された商品は、それぞれ商品群毎に、配置場所決定及び荷合せ最適化の演算を行う。このとき、商品配置システム10は、商品情報を商品群毎に外部サーバ3へ送信し、当該外部サーバ3において演算を行う。外部サーバ3は、商品配置システム10とインターネットを介して接続されている。外部サーバ3は、商品群の数に対応した数だけ存在しており、各外部サーバ3へは、1つの商品群に含まれる各商品の商品情報が送信され、各外部サーバ3において荷合せ最適化の演算が行われる。
ここでの商品情報には、具体的に、商品ID、商品名、出荷日付、出荷数量、商品のパッケージ込みの重量、商品のパッケージされた状態の寸法、個数、収容ボックスの容積、倉庫内滞留日数、期間平均出荷頻度、期間平均出荷数量等の各情報が含まれる。各外部サーバ3は、これらの情報に基づき、各収容ボックスに収容させる商品の組合せを最適化(荷合せ最適化)すると共に、出荷を効率化させるための最適な商品配置を演算する。演算結果は、商品配置システム10へと送信される。
次いで、商品配置システム10は、分類された商品群毎に、商品の出荷数量及び出荷時期を予測(出荷予測)する。そして、商品配置システム10は、出荷予測に基づいて、出荷が最も効率良くなるよう商品群毎の配置場所、及び商品の配置場所を決定する。
以上、本発明の好ましい実施の形態を説明したが、本発明はこれらに限定されるものではなく、その要旨の範囲内で様々な変形や変更が可能である。例えば、本発明は以下の趣旨を含むものとする。
(趣旨1)複数の商品に関する出荷データから、各前記商品についてそれぞれ複数の特徴量を取得し、ある商品について取得した各前記特徴量と、他の商品について取得した各前記特徴量と、をそれぞれ対応する前記特徴量どうしで比較して、対応する前記特徴量どうしの間の変化量を算出し、算出した前記変化量の大きさに基づいて前記複数の商品を複数の商品群へと分類するグルーピング手段と、前記出荷データから各前記商品について過去の出荷実績を取得し、取得した前記出荷実績に基づいて前記複数の商品の出荷数量を予測する出荷予測手段と、前記出荷予測手段による出荷予測に基づいて、分類された前記商品群毎の配置場所、及び前記複数の商品の配置場所を決定する配置場所決定手段と、を有する商品配置システムを趣旨とする。
これによれば、商品配置の計算を効率化することを可能とすることができる。
(趣旨2)前記特徴量が、前記商品の出荷数量、前記商品の出荷数量の経時変化、及び前記商品の出荷数量の経時変化における最大ピークの位置のうちの2つ以上であってもよい。
(趣旨3)前記複数の特徴量のうちの1つが、前記出荷数量の経時変化である場合、ある商品についての出荷数量の経時変化と、他の商品についての出荷数量の経時変化との比較において、取得した出荷数量の経時変化パターンを一定期間毎に平滑化し、前記一定期間毎に平滑化した値に応じて、前記一定期間毎に複数の区分に区分けし、対応する前記一定期間毎に、ある商品についての出荷数量の経時変化の区分と、他の商品についての出荷数量の経時変化の区分とを比較し、比較した前記区分同士の類否に応じて決定された変化量の合計を、前記特徴量としての前記出荷数量の経時変化の変化量として求めるものであってもよい。
(趣旨4)前記特徴量の変化量のそれぞれに、係数を乗じた上で加算して、商品間の前記特徴量の総合変化量を求め、当該総合変化量に基づき複数の前記商品を複数の前記商品群へと分類するものであってもよい。
(趣旨5)前記グルーピング手段は、前記商品の寸法及び/又は重量が所定範囲外であった場合に、算出した前記変化量の大きさに加えて、前記商品の寸法及び/又は重量にも基づいて、前記複数の商品を複数の商品群へと分類するものであってもよい。
(趣旨6)前記配置場所決定手段が、コンピュータが複数接続された構成を有し、前記コンピュータは、前記グルーピング手段によって分類された複数の前記商品群のうちの1つ以上の前記商品群について、前記商品群毎の配置場所、及び前記複数の商品の配置場所を決定するものであってもよい。
(趣旨7)前記配置場所決定手段は、複数の前記商品群のうち、前記商品群毎の出荷数量及び/又は出荷頻度の代表値が大きい商品群から順に、前記商品の配置場所を決定するものであってもよい。
(趣旨8)複数の商品に関する出荷データから、各前記商品についてそれぞれ複数の特徴量を取得し、ある商品について取得した各前記特徴量と、他の商品について取得した各前記特徴量と、をそれぞれ対応する前記特徴量どうしで比較して、対応する前記特徴量どうしの間の変化量を算出し、算出した前記変化量の大きさに基づいて前記複数の商品を複数の商品群へと分類するグルーピング工程と、前記複数の商品の出荷数量及び出荷時期を予測する出荷予測工程と、前記出荷予測工程における出荷予測に基づいて、分類された前記商品群毎の配置場所、及び前記複数の商品の配置場所を決定する配置場所決定工程と、を含む商品配置方法も趣旨とする。
(趣旨9)複数の商品に関する出荷データから、各前記商品についてそれぞれ複数の特徴量を取得し、ある商品について取得した各前記特徴量と、他の商品について取得した各前記特徴量と、をそれぞれ対応する前記特徴量どうしで比較して、対応する前記特徴量どうしの間の変化量を算出し、算出した前記変化量の大きさに基づいて前記複数の商品を複数の商品群へと分類するグルーピング手段、前記複数の商品の出荷数量及び出荷時期を予測する出荷予測手段、前記出荷予測手段による出荷予測に基づいて、分類された前記商品群毎の配置場所、及び前記複数の商品の配置場所を決定する配置場所決定手段、としてコンピュータを機能させる商品配置プログラムも趣旨とする。
1:物流倉庫 3:外部サーバ
5:入荷元サーバ 7:出荷先サーバ
10:商品配置システム 11:グルーピングモジュール
12:出荷予測モジュール 13:配置場所決定モジュール
15:倉庫制御システム 16:物流ロボット
17:ハンディターミナル 18:情報入力端末
5:入荷元サーバ 7:出荷先サーバ
10:商品配置システム 11:グルーピングモジュール
12:出荷予測モジュール 13:配置場所決定モジュール
15:倉庫制御システム 16:物流ロボット
17:ハンディターミナル 18:情報入力端末
Claims (9)
- 複数の商品に関する出荷データから、各前記商品についてそれぞれ複数の特徴量を取得し、
ある商品について取得した各前記特徴量と、他の商品について取得した各前記特徴量と、をそれぞれ対応する前記特徴量どうしで比較して、対応する前記特徴量どうしの間の変化量を算出し、
算出した前記変化量の大きさに基づいて前記複数の商品を複数の商品群へと分類するグルーピング手段と、
前記出荷データから各前記商品について過去の出荷実績を取得し、取得した前記出荷実績に基づいて前記複数の商品の出荷数量を予測する出荷予測手段と、
前記出荷予測手段による出荷予測に基づいて、分類された前記商品群毎の配置場所、及び前記複数の商品の配置場所を決定する配置場所決定手段と、を有する商品配置システム。 - 前記特徴量が、
前記商品の出荷数量、前記商品の出荷数量の経時変化、及び前記商品の出荷数量の経時変化における最大ピークの位置のうちの2つ以上である、請求項1に記載の商品配置システム。 - 前記複数の特徴量のうちの1つが、前記出荷数量の経時変化である場合、ある商品についての出荷数量の経時変化と、他の商品についての出荷数量の経時変化との比較において、
取得した出荷数量の経時変化パターンを一定期間毎に平滑化し、
前記一定期間毎に平滑化した値に応じて、前記一定期間毎に複数の区分に区分けし、
対応する前記一定期間毎に、ある商品についての出荷数量の経時変化の区分と、他の商品についての出荷数量の経時変化の区分とを比較し、
比較した前記区分同士の類否に応じて決定された変化量の合計を、前記特徴量としての前記出荷数量の経時変化の変化量として求める請求項2に記載の商品配置システム。 - 前記特徴量の変化量のそれぞれに、係数を乗じた上で加算して、商品間の前記特徴量の総合変化量を求め、当該総合変化量に基づき複数の前記商品を複数の前記商品群へと分類する、請求項1から請求項3のうちいずれか1項に記載の商品配置システム。
- 前記グルーピング手段は、前記商品の寸法及び/又は重量が所定範囲外であった場合に、算出した前記変化量の大きさに加えて、前記商品の寸法及び/又は重量にも基づいて、前記複数の商品を複数の商品群へと分類する、請求項1から請求項4のうちいずれか1項に記載の商品配置システム。
- 前記配置場所決定手段が、コンピュータが複数接続された構成を有し、
前記コンピュータは、前記グルーピング手段によって分類された複数の前記商品群のうちの1つ以上の前記商品群について、前記商品群毎の配置場所、及び前記複数の商品の配置場所を決定する、請求項1から請求項5のうちいずれか1項に記載の商品配置システム。 - 前記配置場所決定手段は、複数の前記商品群のうち、前記商品群毎の出荷数量及び/又は出荷頻度の代表値が大きい商品群から順に、前記商品の配置場所を決定する、請求項1から請求項6のうちいずれか1項に記載の商品配置システム。
- 複数の商品に関する出荷データから、各前記商品についてそれぞれ複数の特徴量を取得し、
ある商品について取得した各前記特徴量と、他の商品について取得した各前記特徴量と、をそれぞれ対応する前記特徴量どうしで比較して、対応する前記特徴量どうしの間の変化量を算出し、
算出した前記変化量の大きさに基づいて前記複数の商品を複数の商品群へと分類するグルーピング工程と、
前記複数の商品の出荷数量及び出荷時期を予測する出荷予測工程と、
前記出荷予測工程における出荷予測に基づいて、分類された前記商品群毎の配置場所、及び前記複数の商品の配置場所を決定する配置場所決定工程と、を含む商品配置方法。 - 複数の商品に関する出荷データから、各前記商品についてそれぞれ複数の特徴量を取得し、
ある商品について取得した各前記特徴量と、他の商品について取得した各前記特徴量と、をそれぞれ対応する前記特徴量どうしで比較して、対応する前記特徴量どうしの間の変化量を算出し、
算出した前記変化量の大きさに基づいて前記複数の商品を複数の商品群へと分類するグルーピング手段、
前記複数の商品の出荷数量及び出荷時期を予測する出荷予測手段、
前記出荷予測手段による出荷予測に基づいて、分類された前記商品群毎の配置場所、及び前記複数の商品の配置場所を決定する配置場所決定手段、としてコンピュータを機能させる商品配置プログラム。
Priority Applications (5)
| Application Number | Priority Date | Filing Date | Title |
|---|---|---|---|
| PCT/JP2017/041549 WO2019097694A1 (ja) | 2017-11-17 | 2017-11-17 | 商品配置システム、商品配置方法、及び商品配置プログラム |
| CN201780032855.4A CN110050288A (zh) | 2017-11-17 | 2017-11-17 | 商品配置系统、商品配置方法以及商品配置程序 |
| SG11202004554WA SG11202004554WA (en) | 2017-11-17 | 2017-11-17 | Inventory Placement System, Inventory Placement Method, And Inventory Placement Program |
| EP17932412.4A EP3712833A4 (en) | 2017-11-17 | 2017-11-17 | PRODUCT PLACEMENT SYSTEM, PROCESS AND PROGRAM |
| JP2018541233A JP6457705B1 (ja) | 2017-11-17 | 2017-11-17 | 商品配置システム、商品配置方法、及び商品配置プログラム |
Applications Claiming Priority (1)
| Application Number | Priority Date | Filing Date | Title |
|---|---|---|---|
| PCT/JP2017/041549 WO2019097694A1 (ja) | 2017-11-17 | 2017-11-17 | 商品配置システム、商品配置方法、及び商品配置プログラム |
Publications (1)
| Publication Number | Publication Date |
|---|---|
| WO2019097694A1 true WO2019097694A1 (ja) | 2019-05-23 |
Family
ID=65037157
Family Applications (1)
| Application Number | Title | Priority Date | Filing Date |
|---|---|---|---|
| PCT/JP2017/041549 WO2019097694A1 (ja) | 2017-11-17 | 2017-11-17 | 商品配置システム、商品配置方法、及び商品配置プログラム |
Country Status (5)
| Country | Link |
|---|---|
| EP (1) | EP3712833A4 (ja) |
| JP (1) | JP6457705B1 (ja) |
| CN (1) | CN110050288A (ja) |
| SG (1) | SG11202004554WA (ja) |
| WO (1) | WO2019097694A1 (ja) |
Cited By (2)
| Publication number | Priority date | Publication date | Assignee | Title |
|---|---|---|---|---|
| JP7406447B2 (ja) | 2020-04-30 | 2023-12-27 | ロジスティード株式会社 | 計算機システム及びアイテムの需要予測方法 |
| CN117699318A (zh) * | 2024-02-05 | 2024-03-15 | 四川嘉智生态科技有限公司 | 一种货物智能入库装置及方法 |
Families Citing this family (2)
| Publication number | Priority date | Publication date | Assignee | Title |
|---|---|---|---|---|
| JP6884169B2 (ja) * | 2019-04-17 | 2021-06-09 | 株式会社日立製作所 | 物品配置最適化システム及び方法 |
| CN112036958B (zh) * | 2020-09-10 | 2023-09-22 | 青岛网信信息科技有限公司 | 基于数字营销订单大数据的商品优化配置方法 |
Citations (3)
| Publication number | Priority date | Publication date | Assignee | Title |
|---|---|---|---|---|
| JP2004075319A (ja) * | 2002-08-20 | 2004-03-11 | Murata Mach Ltd | 入出荷管理システム |
| JP2012071974A (ja) | 2010-09-29 | 2012-04-12 | Jfe Steel Corp | 製品置場の置場運用支援方法および置場運用支援処理装置 |
| JP2016222455A (ja) * | 2015-06-04 | 2016-12-28 | Jfeスチール株式会社 | 荷役作業決定装置および荷役作業決定方法 |
Family Cites Families (13)
| Publication number | Priority date | Publication date | Assignee | Title |
|---|---|---|---|---|
| JP3613383B2 (ja) * | 1999-06-09 | 2005-01-26 | 富士通株式会社 | 商品配置計画支援システム及びそのシステムでの処理をコンピュータに行わせるためのプログラムを格納した記憶媒体 |
| CN1463243A (zh) * | 2001-06-06 | 2003-12-24 | 本田技研工业株式会社 | 物品保管棚的保管费的设定方法 |
| JP4594977B2 (ja) * | 2001-12-28 | 2010-12-08 | 株式会社日立製作所 | 卸売方法 |
| JP2003296419A (ja) * | 2002-04-02 | 2003-10-17 | Yappa Corp | 棚割り支援システム |
| JP4153257B2 (ja) * | 2002-07-26 | 2008-09-24 | 株式会社アマダ | ワークのグループ化集積処理システム |
| JP2006185079A (ja) * | 2004-12-27 | 2006-07-13 | Biznet Corp | 商品の販売及び預かり管理システム |
| JP5065170B2 (ja) * | 2008-06-13 | 2012-10-31 | 西部電機株式会社 | 仕分け方法 |
| JP5434204B2 (ja) * | 2009-04-03 | 2014-03-05 | 新日鐵住金株式会社 | 製品搬送作業量予測装置、製品搬送作業量予測方法、及びコンピュータプログラム |
| US8930235B2 (en) * | 2012-04-17 | 2015-01-06 | Oracle International Corporation | Shelf space product placement optimizer |
| EP2672445A1 (en) * | 2012-06-04 | 2013-12-11 | CVDM Solutions | Method, system and computer program for assigning an assortment of products to an existing planogram |
| JP5965332B2 (ja) * | 2013-01-29 | 2016-08-03 | 株式会社野村総合研究所 | 棚割管理システム |
| JP6204627B2 (ja) * | 2015-02-26 | 2017-09-27 | 株式会社日立物流 | 商品棚レイアウト設計装置 |
| CN106779567A (zh) * | 2017-01-17 | 2017-05-31 | 嘉曼服饰(天津)有限公司 | 入货区域划分方法及其装置 |
-
2017
- 2017-11-17 EP EP17932412.4A patent/EP3712833A4/en not_active Withdrawn
- 2017-11-17 SG SG11202004554WA patent/SG11202004554WA/en unknown
- 2017-11-17 CN CN201780032855.4A patent/CN110050288A/zh active Pending
- 2017-11-17 JP JP2018541233A patent/JP6457705B1/ja not_active Expired - Fee Related
- 2017-11-17 WO PCT/JP2017/041549 patent/WO2019097694A1/ja unknown
Patent Citations (3)
| Publication number | Priority date | Publication date | Assignee | Title |
|---|---|---|---|---|
| JP2004075319A (ja) * | 2002-08-20 | 2004-03-11 | Murata Mach Ltd | 入出荷管理システム |
| JP2012071974A (ja) | 2010-09-29 | 2012-04-12 | Jfe Steel Corp | 製品置場の置場運用支援方法および置場運用支援処理装置 |
| JP2016222455A (ja) * | 2015-06-04 | 2016-12-28 | Jfeスチール株式会社 | 荷役作業決定装置および荷役作業決定方法 |
Non-Patent Citations (1)
| Title |
|---|
| See also references of EP3712833A4 * |
Cited By (3)
| Publication number | Priority date | Publication date | Assignee | Title |
|---|---|---|---|---|
| JP7406447B2 (ja) | 2020-04-30 | 2023-12-27 | ロジスティード株式会社 | 計算機システム及びアイテムの需要予測方法 |
| CN117699318A (zh) * | 2024-02-05 | 2024-03-15 | 四川嘉智生态科技有限公司 | 一种货物智能入库装置及方法 |
| CN117699318B (zh) * | 2024-02-05 | 2024-04-16 | 四川嘉智生态科技有限公司 | 一种货物智能入库装置及方法 |
Also Published As
| Publication number | Publication date |
|---|---|
| EP3712833A1 (en) | 2020-09-23 |
| SG11202004554WA (en) | 2020-06-29 |
| EP3712833A4 (en) | 2021-06-23 |
| JPWO2019097694A1 (ja) | 2019-11-21 |
| JP6457705B1 (ja) | 2019-01-23 |
| CN110050288A (zh) | 2019-07-23 |
Similar Documents
| Publication | Publication Date | Title |
|---|---|---|
| US10956862B2 (en) | Perpetual batch order fulfillment | |
| Alyahya et al. | Application and integration of an RFID-enabled warehousing management system–a feasibility study | |
| JP6457705B1 (ja) | 商品配置システム、商品配置方法、及び商品配置プログラム | |
| JP6650508B2 (ja) | 倉庫管理システム及び倉庫管理方法 | |
| JP7370747B2 (ja) | 持続的バッチ注文履行 | |
| JP6677858B1 (ja) | 自動化倉庫最適化システム | |
| US11288539B1 (en) | Tiered processing for item identification | |
| CN110751441A (zh) | 一种优化物流仓储系统中储位的方法及装置 | |
| JP2021516803A (ja) | コンピュータで実行される人工知能バッチピッキング最適化および通信のためのシステムおよび方法 | |
| US20230281556A1 (en) | Systems and methods of decanting inventory products from cases at a retail facility | |
| US10713614B1 (en) | Weight and vision based item tracking | |
| Zhou et al. | A data-driven business intelligence system for large-scale semi-automated logistics facilities | |
| US11164147B2 (en) | Computer storage system for generating warehouse management orders | |
| US20180374031A1 (en) | Transportation adjustments based on recommended shipping packages | |
| Damayanti et al. | Intelligent warehouse picking improvement model for e-logistics warehouse using single picker routing problem and wave picking | |
| JP2017165502A (ja) | 集品作業装置、集品作業方法および集品作業プログラム | |
| KR20210001706A (ko) | 온라인 주문 최적화를 기반으로 직접수령 고객에게 상품을 제공하기 위한 물류서비스 제공 방법 및 시스템 | |
| JPWO2018193586A1 (ja) | 物品管理システムおよび物品管理方法 | |
| Alιm et al. | Smart warehouses in logistics 4.0 | |
| JP2023533621A (ja) | 製品割当て検証を使用したインバウンド製品のインテリジェントな分配による製品在庫の最適化のためのコンピュータ実装システム及び方法 | |
| Shukla et al. | Application of operation research in logistics and warehouse optimization | |
| Karasek et al. | Logistic warehouse process optimization through genetic programming algorithm | |
| WO2024056006A1 (zh) | 一种仓储管理方法、装置、设备及存储介质 | |
| Usuki et al. | GERT and Petri net Analysis for Performance Evaluation of Distribution Centers | |
| JP2024030102A (ja) | 情報処理方法、情報処理プログラムおよび情報処理装置 |
Legal Events
| Date | Code | Title | Description |
|---|---|---|---|
| ENP | Entry into the national phase |
Ref document number: 2018541233 Country of ref document: JP Kind code of ref document: A |
|
| 121 | Ep: the epo has been informed by wipo that ep was designated in this application |
Ref document number: 17932412 Country of ref document: EP Kind code of ref document: A1 |
|
| NENP | Non-entry into the national phase |
Ref country code: DE |
|
| ENP | Entry into the national phase |
Ref document number: 2017932412 Country of ref document: EP Effective date: 20200617 |