WO2017006383A1 - 蛍光x線分析装置及びそれに用いられるスペクトル表示方法 - Google Patents
蛍光x線分析装置及びそれに用いられるスペクトル表示方法 Download PDFInfo
- Publication number
- WO2017006383A1 WO2017006383A1 PCT/JP2015/069264 JP2015069264W WO2017006383A1 WO 2017006383 A1 WO2017006383 A1 WO 2017006383A1 JP 2015069264 W JP2015069264 W JP 2015069264W WO 2017006383 A1 WO2017006383 A1 WO 2017006383A1
- Authority
- WO
- WIPO (PCT)
- Prior art keywords
- ray
- rays
- identification information
- sample
- spectrum
- Prior art date
- Legal status (The legal status is an assumption and is not a legal conclusion. Google has not performed a legal analysis and makes no representation as to the accuracy of the status listed.)
- Ceased
Links
Images
Classifications
-
- G—PHYSICS
- G01—MEASURING; TESTING
- G01N—INVESTIGATING OR ANALYSING MATERIALS BY DETERMINING THEIR CHEMICAL OR PHYSICAL PROPERTIES
- G01N23/00—Investigating or analysing materials by the use of wave or particle radiation, e.g. X-rays or neutrons, not covered by groups G01N3/00 – G01N17/00, G01N21/00 or G01N22/00
- G01N23/22—Investigating or analysing materials by the use of wave or particle radiation, e.g. X-rays or neutrons, not covered by groups G01N3/00 – G01N17/00, G01N21/00 or G01N22/00 by measuring secondary emission from the material
- G01N23/223—Investigating or analysing materials by the use of wave or particle radiation, e.g. X-rays or neutrons, not covered by groups G01N3/00 – G01N17/00, G01N21/00 or G01N22/00 by measuring secondary emission from the material by irradiating the sample with X-rays or gamma-rays and by measuring X-ray fluorescence
-
- G—PHYSICS
- G01—MEASURING; TESTING
- G01N—INVESTIGATING OR ANALYSING MATERIALS BY DETERMINING THEIR CHEMICAL OR PHYSICAL PROPERTIES
- G01N2223/00—Investigating materials by wave or particle radiation
- G01N2223/07—Investigating materials by wave or particle radiation secondary emission
- G01N2223/076—X-ray fluorescence
Definitions
- the present invention relates to a fluorescent X-ray analyzer for acquiring information on elements contained in a sample and a spectrum display method used therefor.
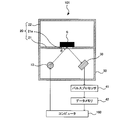
- FIG. 4 is a schematic configuration diagram showing a configuration of a conventional general energy dispersive X-ray fluorescence spectrometer.
- the energy dispersive X-ray fluorescence analyzer 101 includes an analysis chamber 20 in which a sample S is disposed, an apparatus housing 50 in which an X-ray tube 10 and a detector 30 are disposed, a pulse processor 41, A data memory 42 and a computer 160 for controlling the X-ray tube 10 and the detector 30 are provided.
- the analysis chamber 20 includes a rectangular plate-shaped sample base 21 and a rectangular tube-shaped upper chamber 22 having a rectangular plate-shaped upper surface.
- a circular opening 21 a is formed at the center of the sample base 21.
- the upper chamber 22 is rotatably attached to the sample base 21 so that the lower surface of one side wall of the upper chamber 22 and one side of the upper surface side of the sample base 21 serve as axes.
- the inside of the upper chamber 22 is connected to a vacuum pump (not shown) and is evacuated to a vacuum by the vacuum pump.
- a vacuum pump not shown
- the sample S can be arranged so that the analysis surface of the sample S closes the opening 21 a.
- the interior of the upper chamber 21 can be evacuated to a vacuum by closing.
- the apparatus housing 50 has a rectangular tube shape having a rectangular plate-shaped lower surface, and a peripheral portion on the lower surface side of the sample base 21 is attached to the upper surface of the rectangular tube-shaped side wall.
- the X-ray tube 10 and the detector 30 are disposed inside the apparatus housing 50.
- the X-ray tube 10 is, for example, a point-focused X-ray tube, and has a casing, and a target (not shown) as an anode and a filament (not shown) as a cathode are inside the casing. Has been placed. As a result, a high voltage is applied to the target, and a low voltage is applied to the filament, so that the thermal electrons emitted from the filament collide with the end surface of the target and emit primary X-rays generated on the end surface of the target. It is supposed to be.
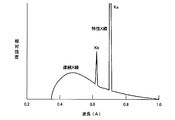
- FIG. 5 is a diagram showing the energy distribution of the primary X-rays thus obtained. In the energy distribution, characteristic X-rays corresponding to the material of the target are superimposed on continuous X-rays.
- the X-ray tube 10 is fixedly attached to the lower left of the opening 21a of the sample base 21 so that primary X-rays emitted from the X-ray tube 10 enter the opening 21a at an incident angle ⁇ . It is configured. Therefore, the analysis surface of the sample S is brought into contact with the opening 21a so that the analysis surface of the sample S is irradiated to the primary X-ray at the incident angle ⁇ .
- the detector 30 has, for example, a casing in which an introduction window is formed, and a detection element (semiconductor element) that detects fluorescent X-rays is disposed inside the casing.
- the detector 30 is fixedly attached to the lower right of the opening 21a of the sample base 21 and is configured such that fluorescent X-rays generated on the analysis surface of the sample S enter the introduction window. Therefore, when the analysis surface of the sample S is irradiated with primary X-rays, the detector 30 detects fluorescent X-rays generated on the analysis surface of the sample S.
- the output signal from the detector 30 has a stepped wave shape, indicating that each step of the stepped wave shape detects fluorescent X-rays, and the height of each step is the wavelength ⁇ , that is, the X-rays. It represents energy E.
- the pulse processor 41 that receives such an output signal converts it into a pulse having a height proportional to the height of each stage (X-ray energy E).
- the data memory 42 adds the intensity “1” to the X-ray energy position E corresponding to the height of the pulse, and as a result, the horizontal axis indicates the fluorescent X-ray energy E.
- a spectrum representing the element content (intensity) is created on the vertical axis.
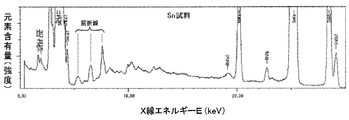
- FIG. 6 is an example of a spectrum created when the sample S of the element Sn is measured.
- each element Since each element generates a fluorescent X-ray having a specific X-ray energy E, the measurer observes the spectrum as shown in FIG. 6 so that each peak in the spectrum is caused by the fluorescent X-ray of which element. And the type of element contained in the sample S is specified. For example, in FIG. 6, a certain peak is at 28.5 keV, and fluorescent X-rays having an X-ray energy E of 28.5 keV are examined, and determined to be Kb lines in the fluorescent X-rays of the element “Sn”. Then, a certain peak is at 25.0 keV, and the fluorescent X-ray having the X-ray energy E of 25.0 keV is examined to determine that it is the Ka line in the fluorescent X-ray of the element “Sn”.
- the primary X-rays include continuous X-rays as shown in FIG. 5, and the created spectrum satisfies the Bragg condition in addition to the fluorescent X-rays emitted from the sample S as shown in FIG. Diffraction X-rays are included.
- a peak of 5 keV, a peak of 6 keV, and a peak of 7 keV appear as the diffraction X-ray peak.
- diffracted X-rays tend to appear as broader peaks than fluorescent X-ray peaks, and that the intensity of the peak, the X-ray energy position E, and the like change when the arrangement direction of the sample S is changed. Based on this information, the measurer distinguishes a peak due to fluorescent X-rays from a peak due to diffracted X-rays.
- JP 2001-349851 A Japanese Patent Laid-Open No. 5-52775
- the intensity of the primary X-ray is greatly reduced.
- the intensity of the primary X-rays emitted from the X-ray tube 10 must be increased several times to several tens of times. Therefore, the size and cost of the apparatus itself cannot be avoided.
- the X-ray tube 10 and the detection are used to change the incident angle ⁇ and the extraction angle.
- the present invention distinguishes fluorescent X-rays and diffracted X-rays by software without changing the apparatus configuration, and displays the fluorescent X-ray information and the diffracted X-ray information at the peak in the spectrum.
- An object of the present invention is to provide an X-ray analyzer and a spectrum display method used therefor.
- An X-ray fluorescence analyzer of the present invention made to solve the above problems comprises an X-ray tube for emitting X-rays to a sample, and a detector for detecting X-rays from the sample, A fluorescent X-ray analyzer for generating and displaying a spectrum indicating the relationship between X-ray energy and element content based on detected X-rays, and a peak due to diffracted X-rays generated by the crystal structure of the sample An identification information creating unit that creates identification information specifying a position, and a display control unit that displays diffracted X-ray information at a peak in the spectrum based on the identification information.
- the “diffraction X-ray information” includes the plane orientation (Miller index; h, k, l) of the crystal plane, and is, for example, “110” or “310”.
- the measurer can recognize the possibility that the peak is a Miller index “110” or “310”.
- diffraction X-rays such as “110” and “310” are identified by specifying diffraction X-rays by software without changing the apparatus configuration. Is displayed on the peak in the spectrum. As a result, erroneous identification on the measurer side is prevented, and the reliability of the analysis result is improved.
- the identification information includes information specifying a peak position due to fluorescent X-rays generated by an element included in the sample
- the display control unit includes the information in the spectrum based on the identification information. X-ray fluorescence information and diffraction X-ray information may be displayed.
- fluorescent X-ray information includes information on the type of element, and is, for example, “FeKa” or “CuKa”.
- the measurer can recognize the possibility that the peak is a peak of “FeKa” or “CuKa”.
- X-ray fluorescence is specified by software, and along with diffraction X-ray information such as “110” and “310”, “FeKa” and “CuKa”. ”Or the like is displayed at the peak in the spectrum.
- the measurer can more accurately discriminate between the fluorescent X-ray and the diffracted X-ray.
- the identification information creating unit may specify a peak position by the diffracted X-ray based on the type of crystal structure of the sample input by the input device.
- the “type of crystal structure (crystal system) of the sample” include “sodium chloride type structure”, “cesium chloride type structure”, “low alloy steel”, and the like.
- the identification information creating unit creates identification information based on a plurality of types of crystal structures
- the display control unit is at least one selected from the plurality of identification information.
- diffraction X-ray information may be displayed at a peak in the spectrum.
- the spectrum display method of the present invention comprises an X-ray tube for emitting X-rays to a sample, and a detector for detecting X-rays from the sample, and based on the X-rays detected by the detector,
- a spectrum display method used in a fluorescent X-ray analyzer that creates and displays a spectrum indicating the relationship between X-ray energy and element content, and identifies a peak position by diffracted X-rays generated by the crystal structure of the sample
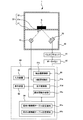
- FIG. 1 is a schematic configuration diagram showing an example of an energy dispersive X-ray fluorescence spectrometer according to an embodiment of the present invention.
- the schematic block diagram which shows the conventional general energy dispersion type
- the figure which shows the energy distribution of a primary X-ray.
- FIG. 1 is a schematic configuration diagram illustrating an example of an energy dispersive X-ray fluorescence spectrometer according to an embodiment of the present invention.
- the energy dispersive X-ray fluorescence spectrometer 1 includes an analysis chamber 20 in which a sample S is disposed, an apparatus housing 50 in which an X-ray tube 10 and a detector 30 are disposed, a pulse processor 41, A data memory 42 and a computer 60 for controlling the X-ray tube 10 and the detector 30 are provided. That is, the energy dispersive X-ray fluorescence spectrometer 1 according to the embodiment of the present invention differs from the conventional energy dispersive X-ray fluorescence analyzer 101 only in the configuration of the computer.
- the computer 60 includes a CPU (control unit) 61, a memory 64, an input device 62, and a display device 63.
- the memory 64 has a fluorescent X-ray information table storage area 64a for storing in advance a fluorescent X-ray information table indicating the correspondence between the element type and the X-ray energy E, the crystal structure type, the lattice constant a, and the crystal plane surface. It has a diffraction X-ray information table storage area 64b that stores in advance the following formula (5) indicating the correspondence between the azimuth (h, k, l) and the X-ray energy E.
- the “fluorescence X-ray information table” is the same as that used in the conventional energy dispersive X-ray fluorescence analyzer, and indicates which element has a peak having which X-ray energy E. If the X-ray energy E is known, the type of element (fluorescent X-ray information) can be known.
- h, k, and l are the crystal plane orientations of the portion of the sample S irradiated with the primary X-rays. Further, a is a lattice constant, and ⁇ is an incident angle of the primary X-ray.
- the following formula (2) is established, and the following formula (3) is obtained by substituting the formula (2) into the formula (1).
- the energy distribution of the primary X-ray is such that the characteristic X-ray is superimposed on the continuous X-ray, so that the incident angle ⁇ is arbitrary. Even at an angle, diffracted X-rays are generated.
- the interplanar spacing d of the crystal plane is expressed by the following formula (4), and the formula (5) is obtained by substituting the formula (4) into the formula (3).
- An X-ray source control unit 61a that emits primary X-rays from the X-ray tube 10, a detector control unit 61b that acquires a spectrum from the detector 30, and an identification It has an identification information creation unit 61c that creates information and a display control unit 61d that displays a spectrum.
- the identification information creating unit 61 c specifies the type of element contained in the sample S based on the peak position (X-ray energy E), and further the input device 62.
- the peak having the X-ray energy E is the “crystal plane orientation (h, k, l) ”is specified, and the possibility of being a peak due to diffracted X-rays is specified, and control for creating identification information is performed.
- the display control unit 61d performs control to display the fluorescent X-ray information and the diffracted X-ray information on the display device 63 based on the identification information.
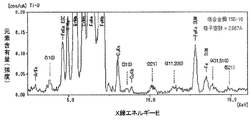
- FIG. 2 is an example of the displayed spectrum.
- the spectrum is the fluorescent X-ray energy E on the horizontal axis and the element content (intensity) on the vertical axis.
- “FeKa” is displayed as fluorescent X-ray information above the 6.4 keV peak, and the measurer observes “FeKa” so that the 6.4 keV peak is the fluorescent X-ray of the element “Fe”. It can be determined that the line is the Ka line.
- “321” is displayed as diffraction X-ray information above the 10.0 keV peak, and the measurer observes “321”, so that the 10.0 keV peak is a diffraction X-ray having a plane orientation of “321”. It can be judged that.
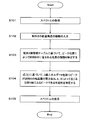
- FIG. 3 is a flowchart for explaining the spectrum display method.
- the detector control unit 61 b acquires a spectrum from the detector 30.
- the measurer inputs “the type of crystal structure of the sample S” using the input device 62.
- the measurer inputs “low alloy steel 155-10” and “lattice constant 2.867 A (angstrom)” as “kind of crystal structure of sample S”.
- the identification information creating unit 61c identifies the element type included in the sample S by the peak position (X-ray energy E) based on the “fluorescence X-ray information table”. Create At this time, the identification information creation unit 61c cannot determine whether the peak is due to fluorescent X-rays or the peak due to diffracted X-rays. We will identify as much as possible. For example, the peak of 6.4 keV is identified as the Ka line in the fluorescent X-ray of the element “Fe”, and the peak of 8.0 keV is the Ka line in the fluorescent X-ray of the element “Cu”. To identify each.
- the identification information creating unit 61c substitutes “2.867A” for “lattice constant a” in equation (5) and “45 °” for “incident angle ⁇ ”.
- identification information specifying the possibility that the peak having the X-ray energy E is a peak due to the diffracted X-ray generated by the “plane orientation (h, k, l) of the crystal plane” of the sample S is created (identification information) Creation step).
- the peaks due to diffraction X-rays in the spectrum have specified element types, but the possibility of being a peak of “plane orientation (h, k, l) of crystal plane” is specified.
- the peak at 12.0 keV is determined to be due to “the crystal plane orientation (411)” and “the crystal plane orientation (330)”, and the 10.0 keV peak is “the crystal plane orientation ( 321) ”, and so on.
- the display control unit 61d displays fluorescent X-ray information and diffracted X-ray information in the spectrum on the display device 63 based on the identification information (display step). For example, as shown in FIG. 2, “FeKa” is displayed as the fluorescent X-ray information above the 6.4 keV peak, and “321” is displayed as the diffracted X-ray information above the 10.0 keV peak. Is displayed. At this time, for a certain peak, both the fluorescent X-ray information and the diffracted X-ray information are displayed, but the measurer is based on the displayed fluorescent X-ray information and diffracted X-ray information. Therefore, it is distinguished whether the peak is due to fluorescent X-rays or the peak due to diffracted X-rays.
- diffracted X-rays are specified by software without changing the apparatus configuration, and “411, 330” or “321”.
- X-ray fluorescence information such as “FeKa” and “CuKa” is displayed at the peak in the spectrum together with diffraction X-ray information such as, and as a result, erroneous identification on the measurer side is prevented, and the reliability of the analysis results Will improve.
- the measurer has shown a configuration in which the “type of crystal structure of the sample S” is input using the input device 62.
- the identification information creation unit creates the identification information based on the plurality of crystal structure types without inputting the “crystal structure type”, and the measurer uses the input device to select from the plurality of identification information. It is good also as a structure which selects one identification information.
- the measurer selects the optimum identification information from a plurality of pieces of identification information without understanding the measured “type of crystal structure of the sample”. Therefore, fluorescent X-rays and diffracted X-rays can be accurately identified.
- a system for obtaining a coincidence with the actual spectrum by a peak fitting method using a resolution parameter based on the characteristics of the detector may be used.
- the influence can be observed by confirming whether or not the diffracted X-rays are displayed on a peak having a poor coincidence during element identification.
- the present invention can be used in a fluorescent X-ray analyzer or the like that acquires information on elements contained in a sample.
Landscapes
- Physics & Mathematics (AREA)
- Health & Medical Sciences (AREA)
- Life Sciences & Earth Sciences (AREA)
- Chemical & Material Sciences (AREA)
- Analytical Chemistry (AREA)
- Biochemistry (AREA)
- General Health & Medical Sciences (AREA)
- General Physics & Mathematics (AREA)
- Immunology (AREA)
- Pathology (AREA)
- Analysing Materials By The Use Of Radiation (AREA)
Abstract
Description
図4は、従来の一般的なエネルギー分散型蛍光X線分析装置の構成を示す概略構成図である。エネルギー分散型蛍光X線分析装置101は、試料Sが内部に配置される分析チャンバ20と、X線管10と検出器30とが内部に配置された装置筐体50と、パルスプロセッサ41と、データメモリ42と、X線管10と検出器30とを制御するコンピュータ160とを備える。
そこで、本発明は、装置構成を変更することなく、ソフトウエア的に蛍光X線と回折X線とを識別して、蛍光X線情報と回折X線情報とをスペクトル中のピークに表示する蛍光X線分析装置及びそれに用いられるスペクトル表示方法を提供することを目的とする。
また、上記の発明において、前記識別情報は、前記試料に含まれる元素によって生じる蛍光X線によるピーク位置を特定した情報を含み、前記表示制御部は、前記識別情報に基づいて、前記スペクトル中に蛍光X線情報及び回折X線情報を表示するようにしてもよい。
以上のように、本発明の蛍光X線分析装置によれば、ソフトウエア的に蛍光X線が特定されて、「110」や「310」等の回折X線情報とともに、「FeKa」や「CuKa」等の蛍光X線情報がスペクトル中のピークに表示されるので、その結果、測定者は、蛍光X線と回折X線とを、より正確に識別することができる。
ここで、「試料の結晶構造(結晶系)の種類」としては、例えば「塩化ナトリウム型構造」や「塩化セシウム型構造」や「低合金鋼」等が挙げられる。
以上のように、本発明の蛍光X線分析装置によれば、測定者が、測定した「試料の結晶構造の種類」を理解していなくても、複数の識別情報の内から最適な識別情報を選択して表示させることができる。
エネルギー分散型蛍光X線分析装置1は、試料Sが内部に配置される分析チャンバ20と、X線管10と検出器30とが内部に配置された装置筐体50と、パルスプロセッサ41と、データメモリ42と、X線管10と検出器30とを制御するコンピュータ60とを備える。すなわち、本発明の実施形態に係るエネルギー分散型蛍光X線分析装置1と、従来のエネルギー分散型蛍光X線分析装置101とでは、コンピュータの構成のみが異なっている。

2d×sinθ=nλ ・・・(1)
ただし、nは整数である。
E=12.4/λ ・・・(2)
12.4/(2d×sinθ)=E ・・・(3)
なお、エネルギー分散型蛍光X線分析装置1では、図5に示すように、一次X線のエネルギー分布は特性X線が連続X線に重畳したものとなっているので、入射角θが任意の角度であっても回折X線が発生することになる。

まず、ステップS101の処理において、検出器制御部61bは検出器30からスペクトルを取得する。
次に、ステップS102の処理において、測定者は入力装置62を用いて「試料Sの結晶構造の種類」を入力する。例えば、測定者は「試料Sの結晶構造の種類」として「低合金鋼155-10」と「格子定数2.867A(オングストローム)」とを入力する。
(1)上述したエネルギー分散型蛍光X線分析装置1では、式(5)を用いる構成を示したが、結晶系や格子定数aや面方位(h,k,l)等のパラメータが格納された記憶媒体を用いて回折X線情報テーブル記憶領域64bに記憶させるような構成としてもよい。なお、パラメータは、独自に作成されてもよいし、市販のデータベースが利用されたものであってもよい。
10 X線管
20 分析チャンバ
30 検出器
61c 識別情報作成部
61d 表示制御部
S 試料
Claims (5)
- X線を試料に出射するX線管と、
前記試料からのX線を検出する検出器とを備え、
前記検出器で検出されたX線に基づいて、X線エネルギーと元素の含有量との関係を示すスペクトルを作成して表示する蛍光X線分析装置であって、
前記試料の結晶構造によって生じる回折X線によるピーク位置を特定した識別情報を作成する識別情報作成部と、
前記識別情報に基づいて、前記スペクトル中のピークに回折X線情報を表示する表示制御部とを備えることを特徴とする蛍光X線分析装置。 - 前記識別情報は、前記試料に含まれる元素によって生じる蛍光X線によるピーク位置を特定した情報を含み、
前記表示制御部は、前記識別情報に基づいて、前記スペクトル中に蛍光X線情報及び回折X線情報を表示することを特徴とする請求項1に記載の蛍光X線分析装置。 - 前記識別情報作成部は、入力装置によって入力された試料の結晶構造の種類に基づいて、前記回折X線によるピーク位置を特定することを特徴とする請求項1又は請求項2に記載の蛍光X線分析装置。
- 前記識別情報作成部は、複数の結晶構造の種類に基づいて、識別情報をそれぞれ作成して、
前記表示制御部は、複数の識別情報の内から選択された少なくとも1つの識別情報に基づいて、前記スペクトル中のピークに回折X線情報を表示することを特徴とする請求項1又は請求項2に記載の蛍光X線分析装置。 - X線を試料に出射するX線管と、
前記試料からのX線を検出する検出器とを備え、
前記検出器で検出されたX線に基づいて、X線エネルギーと元素の含有量との関係を示すスペクトルを作成して表示する蛍光X線分析装置に用いられるスペクトル表示方法であって、
前記試料の結晶構造によって生じる回折X線によるピーク位置を特定した識別情報を作成する識別情報作成ステップと、
前記識別情報に基づいて、前記スペクトル中のピークに回折X線情報を表示する表示ステップとを含むことを特徴とするスペクトル表示方法。
Priority Applications (4)
| Application Number | Priority Date | Filing Date | Title |
|---|---|---|---|
| JP2017526793A JP6493531B2 (ja) | 2015-07-03 | 2015-07-03 | 蛍光x線分析装置及びそれに用いられるスペクトル表示方法 |
| PCT/JP2015/069264 WO2017006383A1 (ja) | 2015-07-03 | 2015-07-03 | 蛍光x線分析装置及びそれに用いられるスペクトル表示方法 |
| CN201580082847.1A CN108027331B (zh) | 2015-07-03 | 2015-07-03 | 荧光x射线分析装置及其中使用的光谱显示方法 |
| US15/741,390 US10948435B2 (en) | 2015-07-03 | 2015-07-03 | X-ray fluorescence analysis device, and spectrum display method used in same |
Applications Claiming Priority (1)
| Application Number | Priority Date | Filing Date | Title |
|---|---|---|---|
| PCT/JP2015/069264 WO2017006383A1 (ja) | 2015-07-03 | 2015-07-03 | 蛍光x線分析装置及びそれに用いられるスペクトル表示方法 |
Publications (1)
| Publication Number | Publication Date |
|---|---|
| WO2017006383A1 true WO2017006383A1 (ja) | 2017-01-12 |
Family
ID=57686115
Family Applications (1)
| Application Number | Title | Priority Date | Filing Date |
|---|---|---|---|
| PCT/JP2015/069264 Ceased WO2017006383A1 (ja) | 2015-07-03 | 2015-07-03 | 蛍光x線分析装置及びそれに用いられるスペクトル表示方法 |
Country Status (4)
| Country | Link |
|---|---|
| US (1) | US10948435B2 (ja) |
| JP (1) | JP6493531B2 (ja) |
| CN (1) | CN108027331B (ja) |
| WO (1) | WO2017006383A1 (ja) |
Cited By (1)
| Publication number | Priority date | Publication date | Assignee | Title |
|---|---|---|---|---|
| CN114705708A (zh) * | 2022-06-07 | 2022-07-05 | 四川大学 | 一种样品表面成分智能分析方法及系统 |
Families Citing this family (6)
| Publication number | Priority date | Publication date | Assignee | Title |
|---|---|---|---|---|
| US11592407B2 (en) | 2018-05-18 | 2023-02-28 | Enersoft Inc. | Systems, devices, and methods for x-ray fluorescence analysis of geological samples |
| JP2020201037A (ja) * | 2019-06-05 | 2020-12-17 | 株式会社島津製作所 | 試料解析システム、試料解析装置、及び試料解析方法 |
| JP7302504B2 (ja) * | 2020-02-27 | 2023-07-04 | 株式会社島津製作所 | 蛍光x線分析装置 |
| JP7380421B2 (ja) * | 2020-05-27 | 2023-11-15 | 株式会社島津製作所 | X線分析装置およびx線分析方法 |
| WO2022058912A1 (en) | 2020-09-16 | 2022-03-24 | Enersoft Inc. | Multiple-sensor analysis of geological samples |
| WO2022266779A1 (en) | 2021-06-25 | 2022-12-29 | Enersoft Inc. | Laser induced breakdown spectroscopy for geological analysis |
Citations (3)
| Publication number | Priority date | Publication date | Assignee | Title |
|---|---|---|---|---|
| JPH10318836A (ja) * | 1997-05-22 | 1998-12-04 | Shimadzu Corp | 分析装置 |
| JPH11271246A (ja) * | 1998-03-25 | 1999-10-05 | Jeol Ltd | 電子プローブマイクロアナライザ |
| JP2013053872A (ja) * | 2011-09-01 | 2013-03-21 | Jeol Ltd | 蛍光x線分析装置、蛍光x線分析方法、およびプログラム |
Family Cites Families (10)
| Publication number | Priority date | Publication date | Assignee | Title |
|---|---|---|---|---|
| JPH0247543A (ja) * | 1988-08-09 | 1990-02-16 | Jeol Ltd | 波長分散型x線分光器における表示方式 |
| JP2634464B2 (ja) * | 1989-05-23 | 1997-07-23 | 株式会社島津製作所 | 自動定性分析装置 |
| JPH0552775A (ja) | 1991-08-27 | 1993-03-02 | Toshiba Corp | 蛍光x線分析装置 |
| US6130931A (en) * | 1998-09-17 | 2000-10-10 | Process Control, Inc. | X-ray fluorescence elemental analyzer |
| JP2001349851A (ja) | 2000-06-12 | 2001-12-21 | Rigaku Industrial Co | 蛍光x線分析装置 |
| CN2583668Y (zh) | 2002-12-02 | 2003-10-29 | 中国科学技术大学 | 对组合样品的结构和成分进行测量分析的装置 |
| US7298817B2 (en) * | 2003-12-01 | 2007-11-20 | X-Ray Optical Systems, Inc. | Portable and on-line arsenic analyzer for drinking water |
| JP4794848B2 (ja) * | 2004-09-24 | 2011-10-19 | 富士通株式会社 | 分析装置 |
| CN1800811B (zh) * | 2005-08-24 | 2010-04-28 | 袁家义 | 用于x射线荧光光谱分析的熔剂 |
| CN101446563A (zh) * | 2007-11-26 | 2009-06-03 | 北京有色金属研究总院 | 一种鉴别和测量半导体材料中掺杂元素的方法 |
-
2015
- 2015-07-03 WO PCT/JP2015/069264 patent/WO2017006383A1/ja not_active Ceased
- 2015-07-03 JP JP2017526793A patent/JP6493531B2/ja active Active
- 2015-07-03 US US15/741,390 patent/US10948435B2/en active Active
- 2015-07-03 CN CN201580082847.1A patent/CN108027331B/zh active Active
Patent Citations (3)
| Publication number | Priority date | Publication date | Assignee | Title |
|---|---|---|---|---|
| JPH10318836A (ja) * | 1997-05-22 | 1998-12-04 | Shimadzu Corp | 分析装置 |
| JPH11271246A (ja) * | 1998-03-25 | 1999-10-05 | Jeol Ltd | 電子プローブマイクロアナライザ |
| JP2013053872A (ja) * | 2011-09-01 | 2013-03-21 | Jeol Ltd | 蛍光x線分析装置、蛍光x線分析方法、およびプログラム |
Cited By (2)
| Publication number | Priority date | Publication date | Assignee | Title |
|---|---|---|---|---|
| CN114705708A (zh) * | 2022-06-07 | 2022-07-05 | 四川大学 | 一种样品表面成分智能分析方法及系统 |
| CN114705708B (zh) * | 2022-06-07 | 2022-08-23 | 四川大学 | 一种样品表面成分智能分析方法及系统 |
Also Published As
| Publication number | Publication date |
|---|---|
| CN108027331A (zh) | 2018-05-11 |
| JP6493531B2 (ja) | 2019-04-03 |
| US20190391091A1 (en) | 2019-12-26 |
| JPWO2017006383A1 (ja) | 2018-04-19 |
| US10948435B2 (en) | 2021-03-16 |
| CN108027331B (zh) | 2023-09-15 |
Similar Documents
| Publication | Publication Date | Title |
|---|---|---|
| JP6493531B2 (ja) | 蛍光x線分析装置及びそれに用いられるスペクトル表示方法 | |
| CN104487829B (zh) | 自动化eds标准校准 | |
| US7592591B2 (en) | X-ray analyzer using electron beam | |
| US9752997B2 (en) | Charged-particle-beam analysis device and analysis method | |
| JP6009975B2 (ja) | 放射線検出装置および試料分析装置 | |
| JP2016017823A (ja) | X線分析用試料板及び蛍光x線分析装置 | |
| US20090052620A1 (en) | Apparatus and Method for X-Ray Analysis of Chemical State | |
| US20190187080A1 (en) | Method and Apparatus for Sample Analysis | |
| JP6503145B2 (ja) | 置換サイト計測装置および置換サイト計測方法 | |
| JP7018365B2 (ja) | 荷電粒子線装置および分析方法 | |
| JP5328264B2 (ja) | 元素マッピング装置及び元素マッピング画像表示方法 | |
| US10145809B2 (en) | X-ray diffraction device and sensitivity calibration method for X-ray diffraction device | |
| JP6336881B2 (ja) | 散布図表示装置、散布図表示方法、および表面分析装置 | |
| JP6010547B2 (ja) | X線分析装置 | |
| JP5245299B2 (ja) | 蛍光x線分析装置 | |
| WO2018100873A1 (ja) | 蛍光x線分析装置 | |
| JP3208200U (ja) | 蛍光x線分析装置 | |
| JP6357794B2 (ja) | X線回折装置およびx線回折装置の感度補正方法 | |
| JP7123741B2 (ja) | X線検出装置及びx線検出方法 | |
| JP2021156744A (ja) | 分析方法および蛍光x線分析装置 | |
| JP6416199B2 (ja) | 検出器及び電子検出装置 | |
| JP2014196925A (ja) | 蛍光x線分析装置及びそれに用いられる深さ方向分析方法 | |
| JP4365687B2 (ja) | 分析方法及び分析装置 | |
| CN114839213A (zh) | 表面分析装置 | |
| CN121986258A (en) | Data processing method, analysis system, and program |
Legal Events
| Date | Code | Title | Description |
|---|---|---|---|
| 121 | Ep: the epo has been informed by wipo that ep was designated in this application |
Ref document number: 15897646 Country of ref document: EP Kind code of ref document: A1 |
|
| ENP | Entry into the national phase |
Ref document number: 2017526793 Country of ref document: JP Kind code of ref document: A |
|
| NENP | Non-entry into the national phase |
Ref country code: DE |
|
| WWE | Wipo information: entry into national phase |
Ref document number: 201580082847.1 Country of ref document: CN |
|
| 122 | Ep: pct application non-entry in european phase |
Ref document number: 15897646 Country of ref document: EP Kind code of ref document: A1 |