WO2013145836A1 - マイクロチップ型光学測定装置及び該装置における光学位置調整方法 - Google Patents
マイクロチップ型光学測定装置及び該装置における光学位置調整方法 Download PDFInfo
- Publication number
- WO2013145836A1 WO2013145836A1 PCT/JP2013/051800 JP2013051800W WO2013145836A1 WO 2013145836 A1 WO2013145836 A1 WO 2013145836A1 JP 2013051800 W JP2013051800 W JP 2013051800W WO 2013145836 A1 WO2013145836 A1 WO 2013145836A1
- Authority
- WO
- WIPO (PCT)
- Prior art keywords
- microchip
- detection
- maximum
- integrated value
- optical
- Prior art date
- Legal status (The legal status is an assumption and is not a legal conclusion. Google has not performed a legal analysis and makes no representation as to the accuracy of the status listed.)
- Ceased
Links
Images


Classifications
-
- G—PHYSICS
- G05—CONTROLLING; REGULATING
- G05B—CONTROL OR REGULATING SYSTEMS IN GENERAL; FUNCTIONAL ELEMENTS OF SUCH SYSTEMS; MONITORING OR TESTING ARRANGEMENTS FOR SUCH SYSTEMS OR ELEMENTS
- G05B19/00—Program-control systems
- G05B19/02—Program-control systems electric
- G05B19/18—Numerical control [NC], i.e. automatically operating machines, in particular machine tools, e.g. in a manufacturing environment, so as to execute positioning, movement or co-ordinated operations by means of program data in numerical form
- G05B19/19—Numerical control [NC], i.e. automatically operating machines, in particular machine tools, e.g. in a manufacturing environment, so as to execute positioning, movement or co-ordinated operations by means of program data in numerical form characterised by positioning or contouring control systems, e.g. to control position from one programmed point to another or to control movement along a programmed continuous path
- G05B19/27—Numerical control [NC], i.e. automatically operating machines, in particular machine tools, e.g. in a manufacturing environment, so as to execute positioning, movement or co-ordinated operations by means of program data in numerical form characterised by positioning or contouring control systems, e.g. to control position from one programmed point to another or to control movement along a programmed continuous path using an absolute digital measuring device
-
- G—PHYSICS
- G01—MEASURING; TESTING
- G01N—INVESTIGATING OR ANALYSING MATERIALS BY DETERMINING THEIR CHEMICAL OR PHYSICAL PROPERTIES
- G01N15/00—Investigating characteristics of particles; Investigating permeability, pore-volume or surface-area of porous materials
- G01N15/10—Investigating individual particles
- G01N15/14—Optical investigation techniques, e.g. flow cytometry
- G01N15/1434—Optical arrangements
-
- G—PHYSICS
- G01—MEASURING; TESTING
- G01N—INVESTIGATING OR ANALYSING MATERIALS BY DETERMINING THEIR CHEMICAL OR PHYSICAL PROPERTIES
- G01N15/00—Investigating characteristics of particles; Investigating permeability, pore-volume or surface-area of porous materials
- G01N15/10—Investigating individual particles
- G01N15/14—Optical investigation techniques, e.g. flow cytometry
- G01N15/1484—Optical investigation techniques, e.g. flow cytometry microstructural devices
-
- G—PHYSICS
- G06—COMPUTING OR CALCULATING; COUNTING
- G06N—COMPUTING ARRANGEMENTS BASED ON SPECIFIC COMPUTATIONAL MODELS
- G06N7/00—Computing arrangements based on specific mathematical models
- G06N7/01—Probabilistic graphical models, e.g. probabilistic networks
-
- G—PHYSICS
- G01—MEASURING; TESTING
- G01N—INVESTIGATING OR ANALYSING MATERIALS BY DETERMINING THEIR CHEMICAL OR PHYSICAL PROPERTIES
- G01N15/00—Investigating characteristics of particles; Investigating permeability, pore-volume or surface-area of porous materials
- G01N15/10—Investigating individual particles
- G01N15/14—Optical investigation techniques, e.g. flow cytometry
- G01N15/1434—Optical arrangements
- G01N2015/1452—Adjustment of focus; Alignment
Definitions
- the present technology relates to a microchip optical measuring device and an optical position adjusting method in the device. More specifically, the present invention relates to a microchip type optical measuring apparatus that automatically optimizes the optical position of a microchip and enables high-precision measurement.
- a fine particle measuring device for example, a flow cytometer
- optically measures characteristics of fine particles such as cells is known.
- a sample solution containing cells is sent to a flow path formed in a flow cell or microchip, and the cells flowing through the flow path are irradiated with a laser to detect fluorescence or scattered light generated from the cells.
- the optical properties of the cells are measured by detecting with a vessel.
- the population (group) determined to satisfy a predetermined condition as a result of the measurement of optical characteristics is also collected separately from the cells.
- Patent Document 1 as a microchip type flow cytometer, “a flow path through which a liquid containing microparticles flows, an orifice for discharging the liquid flowing through the flow path to a space outside the chip, , A vibrating element for ejecting liquid droplets at an orifice, a charging means for imparting electric charges to the ejected liquid droplets, and a microparticle flowing through the flow path Optical detection means for detecting optical characteristics, a counter electrode disposed opposite to the moving liquid droplet in the direction of movement of the liquid droplet discharged to the space outside the chip, and passing between the counter electrodes And a microparticle sorting device including two or more containers for collecting the droplets.
- the microparticle measurement device In order to accurately measure the optical characteristics of the microparticles, the microparticle measurement device accurately aligns the flow position of the microparticles in the flow channel formed in the flow cell or microchip with the optical axis of the laser. There is a need to. Conventionally, this alignment has been performed manually by a user using calibration particles (calibration beads), which requires proficiency and has a problem in reliability and stability. In particular, the microchip-type fine particle measuring apparatus is very complicated because the optical position needs to be adjusted each time the microchip is replaced or analyzed.
- the main object of the present technology is to provide a microchip type optical measuring apparatus capable of automatically and highly accurately adjusting the position of the microchip with respect to the optical axis of the laser.
- the present technology provides an irradiation detection unit that detects light generated by irradiating a laser on a microchip, a position adjustment unit that changes a relative position of the microchip with respect to the irradiation detection unit, and a preset setting. And a control unit that outputs a movement signal to a position where the integrated value or average value of the detected intensity of the light becomes large in the region to be output to the position adjustment unit.
- the control unit assumes that the relationship between the integrated value or average value of the detection position and the detection intensity of the light follows a pre-stored probability distribution, and a distribution parameter in the probability distribution.
- the control unit may select the probability distribution according to an irradiation profile of the laser.
- the control unit may output a movement signal to a position where the integrated value or average value variation coefficient of the light detection intensity becomes a minimum at a plurality of preset points.
- the control unit may output a movement signal to an area where the area average of the integrated values of the detected intensities is maximized in a plurality of preset areas to the position adjustment unit.
- control unit may output a movement signal to a position where the integrated value of the detected intensity is maximum at the plurality of preset points, to the position adjusting unit. Further, the control unit has a first optimum position where the integrated value of the detected intensity is maximum in an area where the area average is maximum, or the variation coefficient is minimum in an area where the area average is maximum. A movement signal to the second optimum position may be output to the position adjustment unit. The control unit may output a movement signal to the second optimum position to the position adjustment unit when the first optimum position is different from the second optimum position.
- This microchip type optical measuring device can be configured as a microchip type microparticle measuring device.
- a procedure for detecting light generated from a microchip by laser irradiation from a plurality of positions on the microchip, and an integrated value or an average value of the detection intensity of the light in a preset region is maximum.
- an optical position adjustment method including a procedure for specifying a position.
- the procedure of specifying the position it is assumed that the relationship between the detection position and the integrated value or average value of the detection intensity of light follows a pre-stored probability distribution, and the distribution parameter in the probability distribution is based on a probability statistical method.
- the position where the integrated value or the average value of the detection intensity of the light is maximized may be specified by the estimation.
- the optical position adjustment method may be configured to calculate an integrated value or an average value of the detected light intensity from a position where the integrated value or average value of the detected intensity of light is estimated to be a maximum by the probability distribution to a predetermined position. It may be assumed that the distribution is one-dimensional, and a procedure for specifying a position where the integrated value or the average value of the detection intensity of the light is maximum by the one-dimensional distribution may be included. Further, in the procedure for specifying the position, the position may be a position where the integrated value or average value variation coefficient of the light detection intensity is minimum at a plurality of preset points.
- the optical position adjustment method may include a procedure for specifying a position where the area average of the integrated value of the detection intensity of the light is maximum in a plurality of preset areas.
- the optical position adjustment method may include a procedure for specifying a first optimum position at which the integrated value of the detected intensity is maximum in an area where the area average is maximum.
- the procedure for specifying the position where the variation coefficient is the minimum may be a procedure for specifying the second optimum position where the variation coefficient is the minimum in the area where the area average is the maximum.
- the optical position adjustment method may include a procedure for setting a relative position of the microchip with respect to the laser to the first optimum position or the second optimum position.
- the present technology provides a procedure for detecting light generated from the microchip by laser irradiation from a plurality of positions on the microchip, and a procedure for specifying a position where the area average of the integrated value of the detection intensity of the light is larger.
- a procedure for specifying a first optimum position where the integrated value or average value of the detected intensity becomes larger in an area where the area average becomes larger, and an integrated value of the detected intensity in an area where the area average becomes larger A procedure for specifying the second optimum position where the coefficient of variation of the value or the average value becomes smaller, and a procedure for setting the relative position of the microchip with respect to the laser to the first optimum position or the second optimum position
- an optical position adjusting method in a microchip type optical measuring device is provided.
- microparticles widely include living body-related microparticles such as cells, microorganisms, and liposomes, or synthetic particles such as latex particles, gel particles, and industrial particles.
- Biologically relevant microparticles include chromosomes, liposomes, mitochondria, organelles (organelles) that constitute various cells.
- Cells include animal cells (such as blood cells) and plant cells.
- Microorganisms include bacteria such as Escherichia coli, viruses such as tobacco mosaic virus, and fungi such as yeast.
- biologically relevant microparticles may include biologically relevant polymers such as nucleic acids, proteins, and complexes thereof.
- the industrial particles may be, for example, an organic or inorganic polymer material, a metal, or the like.
- Organic polymer materials include polystyrene, styrene / divinylbenzene, polymethyl methacrylate, and the like.
- Inorganic polymer materials include glass, silica, magnetic materials, and the like.
- Metals include gold colloid and aluminum. The shape of these fine particles is generally spherical, but may be non-spherical, and the size and mass are not particularly limited.
- This technology provides a microchip-type optical measuring device that can automatically adjust the position of the microchip relative to the optical axis of the laser with high accuracy.
- FIG. 3 is a flowchart for explaining control steps of the first embodiment for optimizing an optical position in the flow cytometer 1;
- FIG. 7 is a diagram for explaining control in an origin / reference point moving step S 1 to an area average maximum value position determining step S 3 according to the first embodiment.
- FIG. 7 is a diagram for explaining control in an area average maximum position movement step S 4 to an integrated value maximum position determination step S 6 according to the first embodiment. It is a diagram illustrating control in the coefficient of variation determination step S 7 of the first embodiment.
- 6 is a flowchart for explaining control steps of a second embodiment for optimizing an optical position in the flow cytometer 1; It is a diagram for explaining the control in the coarse adjustment step S 21 of the second embodiment. It is a diagram for explaining the assumed determined distribution in the coarse adjustment step S 21 of the second embodiment. It is a diagram for explaining the control in the first fine adjustment step S 22 of the second embodiment. It is a diagram for explaining the control in the second fine adjustment step S 23 of the second embodiment. Is a diagram illustrating control in the insignificant adjusting step S 24 of the second embodiment.
- Microchip type optical measurement device (1) Irradiation detection unit (2) Position adjustment unit (3) Vibration element (4) Charging unit (5) Deflection plate (6) Recovery container (7) Control unit, etc. (8) Microchip 2 .
- Optimal position optimization control in the microchip optical measuring device (1) Origin / reference point moving step S 1 (2) Signal acquisition step S 2 (3) Area average value maximum position determination step S 3 (4) Area average maximum position movement step S 4 (5) Signal acquisition step S 5 (6) Integrated value maximum position determination step S 6 (7) variation coefficient determining step S 7 (8) Position optimization step S 8 3.
- Coarse adjustment step S 21 (1-1) Lattice signal acquisition step S211 (1-2) Two-dimensional distribution parameter estimation step S 212 (1-3) Maximum position moving step S213 (2) a first fine adjustment step S 22 (2-1) Linear signal acquisition step S 221 (2-2) One-dimensional distribution parameter estimation step S 222 (2-3) Maximum position movement step S223 (3) second fine adjustment step S 23 (3-1) Linear Signal Acquisition Step S 231 (3-2) One-dimensional distribution parameter estimation step S 232 (3-3) Maximum position moving step S233 (4) insignificant adjustment step S 24
- FIG. 1 is a schematic diagram illustrating the configuration of a microchip optical measurement apparatus 1 (hereinafter also referred to as “flow cytometer 1”) according to the present technology configured as a microchip flow cytometer.
- flow cytometer 1 a microchip optical measurement apparatus 1
- FIG. 2A is a schematic top view
- FIG. 2B is a schematic cross-sectional view corresponding to the PP cross section in A
- FIG. 3 is a diagram schematically illustrating the configuration of the orifice 21 of the microchip 2, where A is a top view, B is a cross-sectional view, and C is a front view.
- FIG. 3B corresponds to the PP section in FIG. 2A.
- the flow cytometer 1 includes irradiation detection including a light source 61 that irradiates the microchip 2 with the laser L 1 and a detector 62 that detects detection target light generated by the irradiation of the laser L 1. A part.
- the light source 61 may be an LD, an LED, or the like.
- the laser L 1 is applied to the cells flowing through the sample channel 22 of the microchip 2.
- the detector 62 detects the scattered light of the laser L 1 by the cells and the fluorescence generated when the cells or fluorescent dyes labeled on the cells are excited by the laser L 1 .
- the fluorescence generated from the cells flowing through the sample flow path 22 is indicated by reference numeral F 1 .
- Irradiation detection unit includes a laser L 1 emitted from the light source 61 is guided to the cell condenser lens and a dichroic mirror for condensing the illumination system comprising a band-pass filter or the like.
- the irradiation detection unit is configured by a detection system that collects the detection target light generated from the cells by irradiation of the laser L 1 and guides the detection target light to the detector 62.
- the detection system includes, for example, a PMT (photo multiplier tube), an area imaging device such as a CCD or a CMOS device, and the like.
- Detected light detected by the detection system of the illumination detection unit is a light generated from the cells by irradiation of the laser L 1, for example, forward scattered light or side scattered light, Rayleigh scattering and Mie scattering or the like of the scattered light Or fluorescence. Fluorescence may be generated from cells or fluorescent dyes labeled on the cells. These detection target lights are converted into electrical signals and used for determining the optical characteristics of the cells and automatically adjusting the optical position described later.
- the flow cytometer 1 includes a position adjustment unit 9 that changes the relative position of the microchip 2 with respect to the irradiation detection unit.
- Position adjusting unit 9 the position of the position and / or the irradiation detecting section of the microchip 2 is moved on the vertical plane (XY plane) with respect to the optical axis of the laser L 1. Accordingly, the position adjusting unit 9 adjusts the position of the microchip 2 with respect to the optical axis of the laser L 1, optimized to the laser L 1 is irradiated to the flowing position of the cells of the sample flow path 22 .
- the position adjustment unit 9 only needs to be capable of moving at least one of the position of the microchip 2 or the position of the irradiation detection unit including the light source 61 and the detector 62 in the X-axis direction and the Y-axis direction.
- the position adjusting unit 9 is configured by, for example, a stepping motor.
- the position adjustment unit 9, the relative position of the microchip 2 for irradiation detecting section may be those also moved in the Z axis direction (focus direction of the laser L 1).
- Vibrating element The flow cytometer 1 applies vibration to the orifice 21 formed in the microchip 2 to form a droplet of the laminar flow of the sample liquid containing cells and the sheath liquid discharged from the orifice 21. Vibration element 3 to be discharged.
- the vibration element 3 can be, for example, a piezo element.
- the discharged droplets are ejected in the positive direction of the arrow Y-axis in the figure as a fluid stream S.
- the microchip 2 is mounted so as to be replaceable.
- the vibration element 3 may be configured integrally with the microchip 2, and is disposed on the apparatus side so as to be in contact with the mounted microchip 2. Also good.
- the droplet discharged from the orifice 21 is given a positive or negative charge by the charging part 41.
- the charging of the droplet is performed by an electrode 42 that is electrically connected to the charging unit 41 and inserted into the sample inlet 23 provided in the microchip 2.
- the electrode 42 may be inserted into any part of the microchip 2 so as to be in electrical contact with the sample liquid or sheath liquid fed through the flow path.
- the frequency of the driving voltage of the vibration element 3 and the switching timing of the voltage (charge voltage) of the charging unit 41 are synchronized, so that a part of the droplets discharged from the orifice 21 is added or Apply any negative charge. Some droplets may be uncharged and uncharged.
- the flow cytometer 1 includes a pair of deflection plates 51 and 52 arranged to face each other with the fluid stream S interposed therebetween.
- the deflecting plates 51 and 52 change the traveling direction of each droplet in the fluid stream S by an electric force acting between the electric charges applied to the droplets.
- the deflection plates 51 and 52 may be commonly used electrodes.
- the opposing direction of the polarizing plates 51 and 52 is indicated by the X-axis direction.
- Recovery container The fluid stream that has passed between the deflecting plates 51 and 52 is received by any of the recovery container 81, the recovery container 82, and the recovery container 83.
- the droplet charged negatively by the charging unit 41 is collected in the collection container 82 and the positively charged droplet is collected in the collection container 83.
- the liquid droplets that are not charged by the charging unit 41 fly straight without receiving the electric action force from the deflecting plates 51 and 52 and are collected in the collection container 81.
- the target cells having the desired characteristics and the other non-target cells are separately collected. Can be recovered.
- the collection containers 81, 82, 83 may be general-purpose plastic tubes or glass tubes for experiments. These collection containers are preferably disposed on the flow cytometer 1 in a replaceable manner. Moreover, you may connect the drainage path of the collect
- the number of collection containers arranged is not particularly limited. When more than three collection containers are arranged, each droplet is guided to one of the collection containers depending on the presence / absence of the electric acting force between the deflecting plates 51 and 52 and the size thereof. To be.
- the flow cytometer 1 includes a data analysis unit for determining optical characteristics of cells, a tank unit for storing sample liquid and sheath liquid, and the like, which are included in a normal flow cytometer.
- the control part 10 etc. for controlling each structure of these are provided.
- the control unit 10 can be configured by a general-purpose computer including a CPU, a memory, a hard disk, and the like.
- the hard disk stores an OS and a program for executing a control step described below.
- the control unit 10 is a position where the integrated value or average value of the detection intensity of light generated from the microchip by irradiation of the laser L 1 becomes larger (preferably the maximum value) in the preset region.
- the movement signal to the position where the variation is reduced is output to the position adjustment unit 9.
- Microchip 2 is formed by bonding the substrate layers 2a and 2b on which the sample channel 22 is formed. Formation of the sample flow path 22 to the substrate layers 2a and 2b can be performed by injection molding of a thermoplastic resin using a mold.
- thermoplastic resin known plastics can be employed as materials for conventional microchips such as polycarbonate, polymethyl methacrylate resin (PMMA), cyclic polyolefin, polyethylene, polystyrene, polypropylene, and polydimethylsiloxane (PDMS).
- PMMA polymethyl methacrylate resin
- PDMS polydimethylsiloxane
- the sample liquid is introduced into the sample inlet 23, merged with the sheath liquid introduced into the sheath inlet 24, and fed through the sample flow path 22.
- the sheath liquid introduced from the sheath inlet 24 is divided and fed in two directions, the sample liquid is sandwiched from the two directions at the junction with the sample liquid introduced from the sample inlet 23. Join.
- a three-dimensional laminar flow in which the sample liquid laminar flow is located at the center of the sheath liquid laminar flow is formed at the junction.
- Reference numeral 25 denotes a suction flow path for eliminating clogging or bubbles by applying a negative pressure in the sample flow path 22 to temporarily reverse the flow when clogging or bubbles are generated in the sample flow path 22.
- a suction outlet 251 connected to a negative pressure source such as a vacuum pump is formed at one end of the suction flow path 25, and the other end is connected to the sample flow path 22 at the communication port 252.
- narrowing portions 261 (see FIG. 2) and 262 (see FIG. 3) formed so that the area of the vertical cross section with respect to the liquid feeding direction gradually or gradually decreases from the upstream to the downstream of the liquid feeding direction.
- the laminar flow width is narrowed down. Thereafter, the three-dimensional laminar flow is discharged from an orifice 21 provided at one end of the flow path.
- cell characteristic detection is performed.
- laser L 1 to the cell in which flows sent by arranging a medium sample channel 22 in a row in the center of the three-dimensional laminar flow is irradiated, fluorescent F 1 and the scattered light generated from the cell is detected (See FIG. 2).
- connection part of the sample flow path 22 to the orifice 21 is a straight part 27 formed in a straight line.
- the straight portion 27 functions to eject the fluid stream S straight from the orifice 21 in the positive direction of the Y axis.
- the three-dimensional laminar flow discharged from the orifice 21 is formed into droplets by the vibration applied to the orifice 21 by the vibration element 31 and ejected as a fluid stream S (see FIG. 1).
- the orifice 21 opens in the direction of the end face of the substrate layers 2a and 2b, and a notch 211 is provided between the opening position and the end face of the substrate layer.
- the notch 211 is formed by notching the substrate layers 2 a and 2 b between the opening position of the orifice 21 and the substrate end surface so that the diameter L of the notch 221 is larger than the opening diameter l of the orifice 21. (See FIG. 3C).
- the diameter L of the notch 211 is desirably formed to be twice or more larger than the opening diameter l of the orifice 21 so as not to hinder the movement of the droplets discharged from the orifice 21.
- FIG. 4 is a flowchart for explaining control steps for optimizing the optical position of the microchip 2 in the flow cytometer 1 in the microchip optical measurement apparatus according to the first embodiment of the present technology.
- the control steps are “origin / reference point moving step S 1 ”, “signal acquisition step S 2 ”, “area average maximum position determination step S 3 ”, “area average maximum position movement step S 4 ”, “signal acquisition step”.
- the procedure includes “S 5 ”, “integrated value maximum position determination step S 6 ”, “variation coefficient determination step S 7 ”, and “position optimization step S 8 ”.
- each procedure will be described.
- Origin / reference point movement step S 1 When the analysis start signal is input by the user, the control unit 10 outputs a movement signal to the position adjustment unit 9, and the position adjustment unit 9 sets the relative position of the microchip 2 with respect to the irradiation detection unit to a preset initial position ( (See FIG. 5, origin O). When the relative position is at the origin O, the laser L 1 emitted from the irradiation detection unit is emitted to the origin O on the microchip 2.
- the relative position can be changed by moving at least one of the position of the microchip 2 or the position of the irradiation detection unit including the light source 61 and the detector 62 in the X-axis direction and the Y-axis direction. A case where the position of the microchip 2 is moved will be described as an example.
- the control unit 10 drives the pump of the tank unit that stores the sample liquid and the sheath liquid, and starts feeding the sample liquid and the sheath liquid to the sample inlet 23 and the sheath inlet 24 of the microchip 2.
- the sample solution preferably contains calibration beads.
- the control unit 10 starts applying vibration to the orifice 21 by the vibration element 3. As a result, the three-dimensional laminar flow of the sample liquid and the sheath liquid ejected from the orifice 21 is discharged as droplets, and a fluid stream S is generated.
- the control unit 10 outputs a movement signal to the position adjusting unit 9, the position adjusting unit 9 moves the position of the microchip 2 in the reference point D 0 from the origin O (FIG. (See arrow 5).
- the position adjusting unit 9 moves the position of the microchip 2 in the reference point D 0 from the origin O (FIG. (See arrow 5).
- Reference point D 0 the position should cell characteristics detection is performed in the microchip 2 (i.e., the optimum position determined by the steps described below) is pre-set in the vicinity of. More specifically, the reference point D 0 is set in the vicinity between the narrowed portion 261 and the narrowed portion 262 (see FIG. 3) of the sample flow path 22.
- step S 2 the irradiation detection unit, fluorescence or scattered light generated from a plurality of locations on the microchip 2 including the reference point D 0 (hereinafter, simply referred to as "fluorescence") is detected is performed.
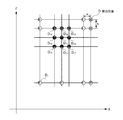
- this step S 2 shown by FIG. 5, reference numeral D positions on the microchip 2 fluorescence detection.
- 24 detection positions D including the reference point D 0 are set, and from the detection positions D in which the arrangement number M 1 in the X-axis direction is arranged in 8 rows and the arrangement number N 1 in the Z-axis direction is arranged in 3 rows.
- the case of detecting fluorescence of is shown as an example.
- the region where the detection position D is set includes the sample flow path 22, and as long as this is the case, the number and arrangement of the detection positions D are not particularly limited and are arbitrarily set.
- the detection positions D are preferably arranged in a lattice pattern in the X-axis direction and the Z-axis direction as shown in the figure.
- the arrangement intervals W and H of the detection position D in the X-axis direction and the Z-axis direction are the flow path width (flow path diameter) of the sample flow path 22 and the number M of the detection positions D in the X-axis direction and Z-axis direction. 1 and N 1 can be set as appropriate.
- the arrangement intervals W and H are set to 25 and 75 ⁇ m, respectively, for example.
- Fluorescence detection is performed for one detection position D for a certain period of time. Fluorescence detected in a certain time is integrated and converted into an electrical signal and output to the control unit 10. Fluorescence detection may be performed by a laser L 1 are sequentially irradiated by scanning the X-axis direction and the Z-axis direction at each detection position D, and detecting the fluorescence emitted. Alternatively, it may be detected collectively by the fluorescence from the detection position D area imaging element by the irradiation of the laser L 1.
- Step S 3 the control unit 10, the area average of the integrated value of the detected intensity calculated for each detection position D, the detection position D where the area average becomes greater, preferably automatically determined detection position D to the maximum value To do.
- “Area average” means an average of integrated values of detection intensities obtained at one detection position D and a plurality of detection positions D within a predetermined distance range therefrom.
- the area average is obtained from one detection position D 1 and detection positions D 2 to D 9 within a distance range of 2 W in the X-axis direction and 2 H in the Z-axis direction from the detection position D 1. The case where the integrated value of the detected intensities is averaged is shown.
- the control unit 10 compares the area averages calculated for the respective detection positions D, and determines a detection position D at which the area average becomes larger, preferably a detection position D having the maximum value.
- a detection position D at which the area average becomes larger, preferably a detection position D having the maximum value.
- the area average at the detection position D 1 will be described assuming that the maximum value.
- the sample flow is within the region R 1 formed by connecting the detection positions D 1 to D 9 where the area average is the maximum value. It can be considered that the path 22 is located.
- Step S 5 the irradiation detecting section, area average detection of fluorescence emitted from a plurality of locations in the region R 1 to be the maximum value is performed.
- the detection position D of fluorescence in this step S 5 shown in enlarged view of FIG. In the figure, fluorescence is detected from (M 2 ⁇ N 2 ) detection positions D in which M 2 rows are arranged in the X-axis direction and N 2 rows are arranged in the Z-axis direction including the detection position D 1 where the area average is the maximum value.
- the case is shown as an example.
- the arrangement intervals w and h of the detection position D in the X-axis direction and the Z-axis direction depend on the channel width (channel diameter) of the sample channel 22 and the number of arrangements M 2 and N 2 in the X-axis direction and the Z-axis direction. It can be set appropriately.
- the number of arrangement numbers M 2 and N 2 is, for example, 11 and 7, respectively.
- the column spacings w and h are set to, for example, 5 and 25 ⁇ m, respectively. Also in the step S 5, the number and arrangement pattern of the detection position D is not intended to be particularly limited.
- the detection of fluorescence is performed for one detection position D for a certain period of time.
- the fluorescence detected for a certain time is converted into an electric signal and output to the control unit 10.
- Detection of fluorescence the laser L 1 is scanned in the X-axis direction and the Z-axis direction sequentially scanned on the detection position D, and detecting the fluorescence emitted.
- the area image sensor, the fluorescence from each of the detection position D by the irradiation of the laser L 1 may be collectively detected.
- step S 6 Integrated value maximum position determination step S 6
- the control unit 10 for each detection position D, and calculates the either or both of the accumulation value or average value of the detected intensity, and their coefficient of variation (CV value).
- CV value coefficient of variation
- the control unit 10 compares the integrated values of the detection intensities calculated for the respective detection positions D, and determines a detection position D where the integrated value becomes larger, preferably a detection position D (first optimal position) that becomes the maximum value. To do.
- the integrated value at the detection position D 11 will be described assuming that the maximum value (see FIG. 6).
- variation coefficient determining step S 7 the control unit 10, the integrated value is compared with CV values between the detection position D 12 ⁇ D 19 adjacent to the detection position D 11 with a maximum value smaller than the detection position D 11 CV The presence / absence of a detection position D (second optimum position) that gives a value is automatically determined (see FIG. 7).
- step S 7 a detection position D that gives a smaller CV value than the detection position D 11 where the integrated value is the maximum is found in any of the detection positions D 12 to D 19 adjacent to the detection position D 11. when it becomes, the control unit 10 moves to the detection position D 11 the position of the microchip 2 from the detection position D 1. At this time, the integrated value is consistent with the detection position (first optimum position) and the detection position that the CV value is the minimum value (the second optimum position) Any detection position D 11 with a maximum value.
- the control unit 10 determines the position of the microchip 2. the move from the detection position D 1 to the detection position D (for example, the detection position D 18). At this time, the detection position where the integrated value becomes the maximum value (first optimal position) and the detection position where the CV value becomes the minimum value (second optimal position) do not match.
- Detecting position D 11 of the integrated value becomes the maximum value, the fluorescence is most strongly generated position, it can be regarded as a flowing position of the calibration beads or cells of the sample flow path 22. That is, when the relative position of the microchip 2 with respect to the irradiation detection unit is at the detection position D 11 , the laser L 1 emitted from the irradiation detection unit is irradiated to the flow position such as calibration beads in the sample flow path 22. It becomes.
- the detection position D 11 is in the case of matching the channel walls of the microchannel 22 may unusually high fluorescence intensity and the like reflected or scattered fluorescent from being detected sporadically. In this case, the fluorescence intensity detected at the position varies, and the CV value of the integrated value of the fluorescence intensity increases.
- the detection position D 18 that gives a smaller CV value among the detection positions adjacent to the detection position D 11 is the calibration of the sample flow path 22. It can be regarded as the flow position of beads. That is, when the relative position of the microchip 2 with respect to the irradiation detection unit is at the detection position D 18 , the laser L 1 emitted from the irradiation detection unit is irradiated to the flow position of the sample flow path 22 such as calibration beads. It becomes.
- the laser L 1 is positioned at a position where the integrated value or average value of the detection intensity of the fluorescence generated from the microchip 2 by the irradiation of the laser L 1 becomes larger or the CV value becomes smaller.
- the relative position of the microchip 2 with respect to 1 is set. Carried out by this, the flow cytometer 1, the flowing position of the cells of the sample flow path 22 of the microchip 2, the optical axis of the laser L 1, a highly accurately positioned automatically, a simple high-precision measurement It is possible.
- step S 2 and S 3 coarse adjustment for specifying a position where the area average of the integrated value of the fluorescence detection intensity becomes larger, and the integrated value or average in the region where the area average becomes larger.
- the optical position of the microchip 2 is optimized by a two-step procedure including fine adjustment (steps S 5 to S 7 ) for specifying a position where the value becomes larger or a position where the CV value becomes smaller. As a result, the optical position of the microchip 2 can be optimized quickly with a small processing load.
- FIG. 8 is a diagram for explaining the control steps of the second embodiment for optimizing the optical position in the flow cytometer 1 in the microchip-type optical measuring device according to the second embodiment of the present technology. It is a flowchart.
- the control steps of this embodiment are “origin / reference point moving step S 1 ”, “rough adjustment step S 21 ”, “first fine adjustment step S 22 ”, “second fine adjustment step S 23 ” and “fine adjustment”. step including the steps of S 24 ".
- each procedure will be described.
- the origin-reference point movement step S 1 is compared with the origin-reference point movement step S 1 of the first embodiment, the reference point D 0 reference point P 0 shown in FIG. 9 (FIG. 5 again see) is described below Since it is substantially the same process except for being equivalent, the description is abbreviate
- Coarse adjustment step S 21 Figure 9 is a diagram for explaining the control in the coarse adjustment step S 21 of the present embodiment.
- the coarse adjustment step S 21 includes procedures of “lattice signal acquisition step S 211 ”, “two-dimensional distribution parameter estimation step S 212 ”, and “maximum position movement step S 213 ”. Hereinafter, each procedure will be described.
- step S 211 the irradiation detection unit detects fluorescence from a plurality of preset detection positions D 21 (see FIG. 9A).
- this step S 211 shown by FIG. 9A numeral D 21 positions on the microchip 2 fluorescence detection.
- Figure 9A around the reference point P 0, as shown six rows in the X-axis direction, a case of detecting the fluorescence from the detection position D 21 arranged in 7 rows in the Z axis direction as an example.
- a region detecting position D 21 is set is to contain the sample channel 22, the number and arrangement pattern of the detecting D 21 Insofar is set arbitrarily without particular limitation.
- Detecting position D 21 is preferably arranged in a lattice pattern in the X-axis direction and the Z-axis direction as shown in Figure 9A.
- the arrangement intervals W 2 and H 2 of the detection position D 21 in the X-axis direction and the Z-axis direction are the width of the sample flow path 22 (flow path diameter) and the detection position D 21 in the X-axis direction and the Z-axis direction.
- the array intervals W 2 and H 2 are set to 62.5 and 125 ⁇ m, for example.
- For detection of fluorescence is performed in substantially the same manner as the signal acquisition step S 2 of the first embodiment.
- step S 212 Two-dimensional distribution parameter estimation step S 212
- the control unit 10 assumes that relationships integrated value or average value of the detected intensity of each detection position D 21 and the fluorescence, according to the probability distribution of two-dimensional. And about the detection position and detection intensity acquired in step S211 , and the irradiation profile of the laser showing the relationship between the irradiation position and the irradiation intensity, the detection intensity at each detection position is correlated with the irradiation intensity at the corresponding irradiation position. Have For this reason, it is preferable to select the assumed probability distribution according to the irradiation profile of the laser.
- the control unit 10 can assume a uniform distribution as the probability distribution model.
- the irradiation profile has a Gaussian beam shape as shown in FIG. 10B described later, a normal distribution can be assumed as the probability distribution model.
- the optical position can be adjusted at high speed and with high accuracy according to the optical characteristics of the laser of the apparatus.
- the control unit 10 when assuming that relationships integrated value or average value of the detected intensity of each detection position D 21 and the fluorescence follows the probability distribution of two-dimensional, based on the distribution parameters in the probability distribution to the probability statistics, Estimate by probability statistical method. For example, the control unit 10 can estimate distribution parameters (average (central position of distribution), variance (spread of distribution), etc.) for each integrated value or average value by the maximum likelihood estimation method.
- the center position of the two-dimensional normal distribution (based on a probability distribution model stored in advance in the control unit 10 ( It is possible to estimate at which position the position where the detection intensity is maximum is maximized. According to the maximum likelihood estimation method, even if data of the detected intensity is small, it is possible to accurately detect the strength estimates the maximum a position (optical axis central position of the laser L 1).
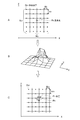
- FIG. 10 is a diagram illustrating a state in which a two-dimensional probability distribution is viewed from one direction.
- FIG. 10A shows a top hat distribution (uniform distribution).
- the control unit 10 determines that the center positions of the edges E1 and E2 in FIG.
- FIG. 10B shows a Gaussian distribution.
- a position having the integrated value of detection intensity or the maximum value b of the average value can be set to a position where the inclination is 0 (inclination a).
- the optical profile of the laser it is preferable that the optical profile of the laser has a Gaussian distribution.
- a distribution of an integrated value or an average value of a plurality of detection intensities can be a Gaussian distribution.
- the integrated value or average value of the detected intensity of light is estimated that the probability distribution of a specific two-dimensional at a plurality of detection positions D 21, the said probability distribution, a larger, preferably The microchip 2 can be moved to a position having the maximum value.
- the optical position adjustment method of the present embodiment by estimating the probability distribution of the detected intensity of each detection position D 21, without increasing the number of detection positions D 21, the position of the microchip 2 Adjustment accuracy can be improved.
- FIG. 11 is a diagram for explaining the control in the first fine adjustment step S 22 of the present embodiment.
- the first fine adjustment step S 22 includes a procedure of “linear signal acquisition step S 221 ”, “one-dimensional distribution parameter estimation step S 222 ”, and “maximum position movement step S 223 ”. Hereinafter, each procedure will be described.
- step S 221 the position P 1 set in the coarse adjustment step S 21 in the center, the detection of fluorescence from a plurality of detection positions d 22 arranged in the X-axis direction is performed (FIG. 11A). Sequence number of intervals W 22 and the detection position d 22 is detected can be set as appropriate.
- FIG. 11A around the position P 1, it shows a case where the detection position d 22 in the X-axis direction is 19 arranged in Examples. For detection of fluorescence is performed in substantially the same manner as the signal acquisition step S 2 of the first embodiment.
- step S 222 the control unit 10 assumes that the relationship between each detection position d 22 and the integrated value or average value of the fluorescence detection intensity follows a one-dimensional distribution stored in a memory or the like. For example, when the detected intensity data shown in FIG. 11B is obtained, the control unit 10 can calculate the maximum value based on the least square method using a one-dimensional distribution as an Nth order polynomial model. By using an Nth-order polynomial model rather than a one-dimensional distribution as a normal distribution, it is possible to accurately cope with variations in the distribution of the optical profile due to variations in the design of each component constituting the flow cytometer 1. .
- the position adjustment of the microchip 2 is made based on the detected intensity of the detection position d 22 arranged in one direction. Therefore, the number of data to be detected can be reduced as compared with the case where position adjustment is performed in a plurality of directions, for example, based on the intensity of detection positions arranged in a grid pattern. Therefore, by narrowing the interval between the detection position d 22, increasing the number of sequences, even by increasing the accuracy of the data, it is possible to suppress the increase in the data detection time compared to the case of acquiring the data in a two-dimensional .
- FIG. 12 is a diagram for explaining the control in the second fine adjustment step S 23 of the present embodiment.
- the second fine adjustment step S 23 includes steps in the "linear signal acquisition step S 231", "one-dimensional parameter estimation step S 232" and "maximum position moving step S 233 '.
- the control in this step S 23 is compared with the control in the first fine adjustment step S 22 described with reference to FIGS. 11A ⁇ C, detection position d 22 arranged in the X-axis direction the microchip 2 from the position P 1 to P 2 based on the detected intensity, instead of moving in the X-axis direction, based on the detected intensity of the detection position d 23 arranged in the Y-axis direction around the position P 2 position P 2 the microchip 2 to P 3 except that move in the Y-axis direction from a substantially similar. Therefore, the description is omitted here.
- the first fine adjustment step S 22, the position adjustment in the X-axis direction (the flow width direction of the microchip 2), the second fine adjustment step S 23, the Z-axis direction (focus direction of the laser L1) Adjust the position. Since this Z-axis direction is greater than the spread of the optical profile as compared to the X-axis direction (a large detection intensity of fluorescence in a wide range), the processing performed by the coarse adjustment step S 21 described above, than the X-axis direction There is a high possibility that the position adjustment in the Z-axis direction is accurately performed. Therefore, must first fix the Z-axis direction more precisely the position adjustment is performed in the coarse adjustment step S 21, it is preferable to adjust the position of the microchip 2 in the X-axis direction. Thus, the first fine adjustment step S 21, and the second fine adjustment step S 22, is preferably performed in this order.
- FIG. 13 is a diagram for explaining the control in the second fine adjustment step S 23 of the present embodiment.
- the fine adjustment step S 24 includes procedures of “signal acquisition step S 241 ”, “integrated value maximum position determination step S 6 ”, “variation coefficient determination step S 7 ”, and “position optimization step S 8 ”.
- the signal acquisition step S 241 fluorescence detection is performed at a plurality of detection positions d 24 around the position P 3 set in the second fine adjustment step S 23.
- SEQ number M 4 to 11 rows of the X-axis direction showing a case where the sequence number N 1 in the Z-axis direction in the three columns as an example.
- For detection of fluorescence is performed in substantially the same manner as the signal acquisition step S 2 of the first embodiment.
- fluorescence detection is by the signal acquiring step S 241
- the integrated value up to the position determining step S 6 the coefficient of variation determination step S 7, the position optimization step S 8 is substantially in the first embodiment This is performed in the same manner as the integrated value maximum position determination step S 6 , variation coefficient determination step S 7 , and position optimization step S 8 in the control step (see also FIGS. 13B and 13C).
- the microchip 2 is moved to a more optimal position (in FIG. 13C, it moves from P 3 to P 4).
- each step has been described in the order of “rough adjustment step S 21 ”, “first fine adjustment step S 22 ”, “second fine adjustment step S 23 ”, and “fine adjustment step S 24 ”.
- “rough adjustment step S 21 ”, “first fine adjustment step S 22 ”, and “second fine adjustment step S 23 ” may be repeated a plurality of times. Further, only “rough adjustment step S 21 ”, “first fine adjustment step S 22 ” and “second fine adjustment step S 23 ” may be performed one or more times, and “fine adjustment step S 24 ” may be omitted. .
- the optical position adjustment method of the present embodiment it is assumed that the relationship between each detection position and the detection intensity follows a specific probability distribution model, and the distribution parameters are estimated based on the probability statistical method.
- the position of the microchip 2 can be adjusted with high accuracy in a short time without increasing the number of detection positions.
- the microchip-type optical measurement device includes a wide range of devices that optically measure a measurement object introduced into a region formed on a microchip, in addition to a microparticle measurement device (flow cytometer). Shall be.
- the optical position adjustment method according to the present technology is widely applied to all devices that optically measure a measurement object introduced into a region formed on a microchip, in addition to a fine particle measurement device (flow cytometer). It shall be possible.
- the microchip type optical measuring device can be configured as follows. (1) an irradiation detection unit that detects light generated by irradiating the microchip with a laser; A position adjusting unit for changing the relative position of the microchip with respect to the irradiation detecting unit; A microchip type optical measuring device comprising: a control unit that outputs a movement signal to a position where the integrated value or average value of the detected intensity of light increases in a preset region to the position adjusting unit. (2) The control unit assumes that the relationship between the integrated value or average value of the detection position of the light and the detection intensity of the light follows a pre-stored probability distribution, and the distribution parameter in the probability distribution is stored in advance.
- the microchip optical measurement according to (1) wherein a movement signal to a position at which an integrated value or an average value of the detection intensity of the light is maximized by the estimation is generated by estimation based on the probabilistic statistical method. apparatus.
- (3) The microchip optical measurement device according to (2), wherein the control unit assumes the probability distribution according to an irradiation profile of the laser.
- the control unit outputs, to the position adjustment unit, a movement signal to a position at which the integrated value or average value variation coefficient of the light detection intensity is minimum at a plurality of preset points.
- the microchip type optical measuring device according to any one of (3) to (3).
- Chip type fine particle sorting device Chip type fine particle sorting device.
- apparatus (7) The control unit has a first optimal position where the integrated value of the detected intensity is maximum in an area where the area average is maximum, or the variation coefficient is minimum in an area where the area average is maximum.
- microchip type optical measuring device (6), wherein a movement signal to the second optimum position is output to the position adjustment unit.
- Microchip type microparticle sorting device (8)
- the microchip type optical measuring device according to any one of (1) to (8) above, which is a microchip type microparticle measuring device.
- the optical position adjustment method in the microchip type optical measurement apparatus can be configured as follows. (1) a procedure for detecting light generated from a microchip by laser irradiation from a plurality of positions on the microchip; And a procedure for specifying a position where the integrated value or average value of the detection intensity of the light is maximum in an area where a plurality of preset points are present. (2) In the procedure of specifying the position, it is assumed that the relationship between the integrated value or average value of the light detection position and the light detection intensity follows a pre-stored probability distribution, and distribution parameters in the probability distribution are set in advance.
- the optical position adjustment method according to (1) wherein a position where an integrated value or an average value of the detection intensity of the light is maximized by the estimation is specified by estimation based on a stored probability statistical technique.
- (4) A one-dimensional distribution in which the relationship between the integrated value or average value of the detected light intensity from a position where the integrated value or average value of the detected intensity of light is estimated to be the maximum by the probability distribution to a predetermined position is one-dimensional distribution.
- the optical position adjustment method according to (3) further including a step of specifying a position where the integrated value or average value of the detected intensity of the light is maximum based on the one-dimensional distribution.
- the position is set to a position where the integrated value or average coefficient of variation of the detection intensity of the light is a minimum at a plurality of preset points.
- the optical position adjusting method according to any one of the above.
- the optical position adjustment method according to (5) including a procedure for specifying a position where an area average of integrated values of the detection intensity of the light is maximum in a plurality of preset areas.
- the optical position adjustment method according to (6) including a procedure for specifying a first optimum position where the integrated value of the detected intensity is maximum in an area where the area average is maximum.
- the procedure for specifying the position where the variation coefficient is minimum is a procedure for specifying the second optimum position where the variation coefficient is minimum in the area where the area average is maximum.
- the optical position adjustment method as described.
- the optical position adjustment method according to (8) including a procedure for setting a relative position of the microchip with respect to the laser to the first optimum position or the second optimum position.
- (11) a procedure of detecting light generated from the microchip by laser irradiation from a plurality of positions on the microchip; A procedure for specifying a position where the area average of the integrated value of the detection intensity of the light is larger, A procedure for identifying a first optimum position at which the integrated value or average value of the detected intensities is larger in an area where the area average is larger; and A procedure for specifying a second optimum position where the integrated value of the detected intensity or the coefficient of variation of the average value becomes smaller in an area where the area average becomes larger, And a procedure for setting the relative position of the microchip to the laser at the first optimum position or the second optimum position.
Landscapes
- Chemical & Material Sciences (AREA)
- Physics & Mathematics (AREA)
- General Physics & Mathematics (AREA)
- Engineering & Computer Science (AREA)
- Life Sciences & Earth Sciences (AREA)
- Pathology (AREA)
- Immunology (AREA)
- General Health & Medical Sciences (AREA)
- Biochemistry (AREA)
- Analytical Chemistry (AREA)
- Health & Medical Sciences (AREA)
- Dispersion Chemistry (AREA)
- Theoretical Computer Science (AREA)
- Human Computer Interaction (AREA)
- Manufacturing & Machinery (AREA)
- Automation & Control Theory (AREA)
- Evolutionary Computation (AREA)
- Software Systems (AREA)
- Mathematical Physics (AREA)
- General Engineering & Computer Science (AREA)
- Computing Systems (AREA)
- Pure & Applied Mathematics (AREA)
- Mathematical Optimization (AREA)
- Mathematical Analysis (AREA)
- Data Mining & Analysis (AREA)
- Computational Mathematics (AREA)
- Artificial Intelligence (AREA)
- Algebra (AREA)
- Probability & Statistics with Applications (AREA)
- Investigating, Analyzing Materials By Fluorescence Or Luminescence (AREA)
Priority Applications (4)
| Application Number | Priority Date | Filing Date | Title |
|---|---|---|---|
| US14/386,499 US9915935B2 (en) | 2012-03-30 | 2013-01-28 | Microchip-type optical measuring apparatus and optical position adjusting method thereof |
| CN201380016177.4A CN104204766B (zh) | 2012-03-30 | 2013-01-28 | 微芯片型光学测量装置及其光学位置调整方法 |
| US15/875,846 US10180676B2 (en) | 2012-03-30 | 2018-01-19 | Microchip-type optical measuring apparatus and optical position adjusting method thereof |
| US16/237,039 US10859996B2 (en) | 2012-03-30 | 2018-12-31 | Microchip-type optical measuring apparatus and optical position adjusting method thereof |
Applications Claiming Priority (2)
| Application Number | Priority Date | Filing Date | Title |
|---|---|---|---|
| JP2012-080472 | 2012-03-30 | ||
| JP2012080472 | 2012-03-30 |
Related Child Applications (2)
| Application Number | Title | Priority Date | Filing Date |
|---|---|---|---|
| US14/386,499 A-371-Of-International US9915935B2 (en) | 2012-03-30 | 2013-01-28 | Microchip-type optical measuring apparatus and optical position adjusting method thereof |
| US15/875,846 Continuation US10180676B2 (en) | 2012-03-30 | 2018-01-19 | Microchip-type optical measuring apparatus and optical position adjusting method thereof |
Publications (1)
| Publication Number | Publication Date |
|---|---|
| WO2013145836A1 true WO2013145836A1 (ja) | 2013-10-03 |
Family
ID=49259122
Family Applications (1)
| Application Number | Title | Priority Date | Filing Date |
|---|---|---|---|
| PCT/JP2013/051800 Ceased WO2013145836A1 (ja) | 2012-03-30 | 2013-01-28 | マイクロチップ型光学測定装置及び該装置における光学位置調整方法 |
Country Status (4)
| Country | Link |
|---|---|
| US (3) | US9915935B2 (https=) |
| JP (3) | JPWO2013145836A1 (https=) |
| CN (1) | CN104204766B (https=) |
| WO (1) | WO2013145836A1 (https=) |
Cited By (5)
| Publication number | Priority date | Publication date | Assignee | Title |
|---|---|---|---|---|
| JPWO2021009849A1 (https=) * | 2019-07-16 | 2021-01-21 | ||
| JPWO2020240755A1 (ja) * | 2019-05-29 | 2021-11-11 | 株式会社島津製作所 | 光散乱検出装置 |
| JP2022014302A (ja) * | 2020-07-06 | 2022-01-19 | シンクサイト株式会社 | フローサイトメータ、位置算出方法、及びプログラム |
| WO2023062831A1 (ja) * | 2021-10-15 | 2023-04-20 | シンクサイト株式会社 | フローサイトメータ、位置算出方法、及びプログラム |
| KR102944977B1 (ko) | 2017-10-26 | 2026-03-26 | 파티클 머슈어링 시스템즈, 인크. | 입자 측정을 위한 시스템 및 방법 |
Families Citing this family (18)
| Publication number | Priority date | Publication date | Assignee | Title |
|---|---|---|---|---|
| JPWO2013145836A1 (ja) | 2012-03-30 | 2015-12-10 | ソニー株式会社 | マイクロチップ型光学測定装置及び該装置における光学位置調整方法 |
| WO2013145905A1 (ja) | 2012-03-30 | 2013-10-03 | ソニー株式会社 | 微小粒子分取装置及び該装置における流体ストリーム最適化方法 |
| JP5924077B2 (ja) | 2012-03-30 | 2016-05-25 | ソニー株式会社 | 微小粒子分取装置及び微小粒子分取装置における軌道方向判定方法 |
| JP5994337B2 (ja) | 2012-03-30 | 2016-09-21 | ソニー株式会社 | 微小粒子分取装置及びディレイタイム決定方法 |
| JP6065527B2 (ja) | 2012-11-08 | 2017-01-25 | ソニー株式会社 | 微小粒子分取装置及び微小粒子分取方法 |
| WO2014115409A1 (ja) | 2013-01-28 | 2014-07-31 | ソニー株式会社 | 微小粒子分取装置、微小粒子分取方法及びプログラム |
| US9915599B2 (en) | 2013-02-08 | 2018-03-13 | Sony Corporation | Microparticle analysis apparatus and microparticle analysis system |
| EP3035030B1 (en) | 2013-10-16 | 2019-07-10 | Sony Corporation | Particle fractionation device, particle fractionation method, and program |
| JP6136843B2 (ja) | 2013-10-17 | 2017-05-31 | ソニー株式会社 | 粒子分取装置、粒子分取方法及びプログラム |
| CN107003227B (zh) * | 2014-12-12 | 2020-06-05 | 贝克顿·迪金森公司 | 用于将光源与流动流对准的方法及其系统 |
| CN105988579A (zh) * | 2015-03-06 | 2016-10-05 | 北京智谷睿拓技术服务有限公司 | 设备间相对位置调整方法及调整装置 |
| CZ306640B6 (cs) * | 2015-08-31 | 2017-04-12 | Wolf & Danniel S.R.O. | Způsob provádění průtokového cytometrického měření |
| US10466158B2 (en) * | 2017-04-11 | 2019-11-05 | Sony Corporation | Microparticle sorting apparatus and delay time determination method |
| US10591400B2 (en) | 2018-03-29 | 2020-03-17 | Sony Corporation | Micro particle analyzer and micro particle analysis method |
| WO2019207988A1 (ja) * | 2018-04-25 | 2019-10-31 | ソニー株式会社 | 微小粒子分取装置及び微小粒子分取方法 |
| JP7683484B2 (ja) * | 2019-11-06 | 2025-05-27 | ソニーグループ株式会社 | 位置調整方法、微小粒子分析装置、及びプログラム |
| JP7473185B2 (ja) * | 2020-07-06 | 2024-04-23 | シンクサイト株式会社 | フローサイトメータ、イメージング装置、位置検出方法、及びプログラム |
| CN113252633B (zh) * | 2021-07-14 | 2021-10-12 | 季华实验室 | 一种液相芯片分析仪的质控检测方法及标准盘 |
Citations (8)
| Publication number | Priority date | Publication date | Assignee | Title |
|---|---|---|---|---|
| JPS6236542A (ja) * | 1985-08-09 | 1987-02-17 | Canon Inc | 粒子解析装置 |
| JPS6412245A (en) * | 1987-07-03 | 1989-01-17 | Canon Kk | Particle analyzing device |
| JPH09189653A (ja) * | 1996-01-11 | 1997-07-22 | Horiba Ltd | 散乱式粒度分布測定装置における光軸調整方法 |
| JP2004257756A (ja) * | 2003-02-24 | 2004-09-16 | Nippon Koden Corp | フローセル位置決め方法およびフローセル位置調整可能なフローサイトメータ |
| JP2006242849A (ja) * | 2005-03-04 | 2006-09-14 | Mitsui Eng & Shipbuild Co Ltd | 試料液流の位置制御方法および装置 |
| JP2010286292A (ja) * | 2009-06-10 | 2010-12-24 | Sony Corp | 微小粒子測定装置 |
| JP4805417B1 (ja) * | 2010-03-31 | 2011-11-02 | 古河電気工業株式会社 | 光情報解析装置及び光情報解析方法 |
| JP2012047464A (ja) * | 2010-08-24 | 2012-03-08 | Sony Corp | 微小粒子測定装置及び光軸補正方法 |
Family Cites Families (47)
| Publication number | Priority date | Publication date | Assignee | Title |
|---|---|---|---|---|
| JPS6129737A (ja) | 1984-07-20 | 1986-02-10 | Canon Inc | 粒子解析装置 |
| JPS62100643A (ja) | 1985-10-28 | 1987-05-11 | Canon Inc | 粒子解析装置 |
| US5700692A (en) | 1994-09-27 | 1997-12-23 | Becton Dickinson And Company | Flow sorter with video-regulated droplet spacing |
| US5602039A (en) | 1994-10-14 | 1997-02-11 | The University Of Washington | Flow cytometer jet monitor system |
| US6538229B1 (en) * | 1996-05-08 | 2003-03-25 | Infineon Technologies Ag | Method for the positionally accurate adjustment and fixing of a microoptical element |
| JP3736007B2 (ja) * | 1997-03-03 | 2006-01-18 | 株式会社島津製作所 | マイクロチップ電気泳動装置 |
| JP4294740B2 (ja) * | 1997-05-23 | 2009-07-15 | ソレクサ・インコーポレイテッド | 分析物の系列的プロセシングのためのシステムおよび装置 |
| GB2326229A (en) * | 1997-06-13 | 1998-12-16 | Robert Jeffrey Geddes Carr | Detecting and analysing submicron particles |
| US6248590B1 (en) | 1998-02-27 | 2001-06-19 | Cytomation, Inc. | Method and apparatus for flow cytometry |
| US6372506B1 (en) | 1999-07-02 | 2002-04-16 | Becton, Dickinson And Company | Apparatus and method for verifying drop delay in a flow cytometer |
| EP1245944B1 (en) * | 2001-03-29 | 2007-02-14 | Sysmex Corporation | Flow cytometer |
| US6941005B2 (en) | 2002-11-01 | 2005-09-06 | Coulter International Corp. | Monitoring and control of droplet sorting |
| JP2007512148A (ja) * | 2003-09-19 | 2007-05-17 | ザ リージェンツ オブ ザ ユニバーシティ オブ カリフォルニア | ピボット回転する光ファイバを利用した光ビーム平行移動装置及び方法 |
| US7232687B2 (en) | 2004-04-07 | 2007-06-19 | Beckman Coulter, Inc. | Multiple sorter monitor and control subsystem for flow cytometer |
| JP4304120B2 (ja) | 2004-04-30 | 2009-07-29 | ベイバイオサイエンス株式会社 | 生物学的粒子をソーティングする装置及び方法 |
| US7575589B2 (en) * | 2006-01-30 | 2009-08-18 | Photothera, Inc. | Light-emitting device and method for providing phototherapy to the brain |
| US8343428B2 (en) * | 2007-10-29 | 2013-01-01 | Rohm Co., Ltd. | Microchip and method of using the same |
| US8290625B2 (en) | 2007-04-04 | 2012-10-16 | Beckman Coulter, Inc. | Flow cytometer sorter |
| JP5536995B2 (ja) * | 2007-07-17 | 2014-07-02 | オリンパス株式会社 | 顕微鏡対物レンズおよびレーザー走査型顕微鏡システム |
| US8075853B2 (en) * | 2007-11-16 | 2011-12-13 | Rohm Co., Ltd. | Microchip |
| JP2009156659A (ja) * | 2007-12-26 | 2009-07-16 | Olympus Corp | 測定装置及び測定方法 |
| JP5202971B2 (ja) * | 2008-01-28 | 2013-06-05 | オリンパス株式会社 | 測定装置及び測定方法 |
| US8928881B2 (en) * | 2009-01-23 | 2015-01-06 | University Of Washington | Cytometer with automatic continuous alignment correction |
| JP5487638B2 (ja) | 2009-02-17 | 2014-05-07 | ソニー株式会社 | 微小粒子分取のための装置及びマイクロチップ |
| US8223445B2 (en) * | 2009-09-21 | 2012-07-17 | Cytopeia | Lens positioning apparatus |
| WO2011097032A1 (en) * | 2010-02-05 | 2011-08-11 | Cytonome/St, Llc | Multiple flow channel particle analysis system |
| JP5437148B2 (ja) | 2010-04-23 | 2014-03-12 | ベイバイオサイエンス株式会社 | フローサイトメータおよびセルソータ |
| CA2826544C (en) | 2011-02-04 | 2020-06-30 | Cytonome/St, Llc | Particle sorting apparatus and method |
| JP5765022B2 (ja) * | 2011-03-31 | 2015-08-19 | ソニー株式会社 | 微小粒子分析装置及び微小粒子分析方法 |
| EP2724144B1 (en) * | 2011-08-25 | 2018-04-11 | Sony Corporation | Characterization of motion-related error in a stream of moving micro-entities |
| WO2013145905A1 (ja) | 2012-03-30 | 2013-10-03 | ソニー株式会社 | 微小粒子分取装置及び該装置における流体ストリーム最適化方法 |
| JPWO2013145836A1 (ja) | 2012-03-30 | 2015-12-10 | ソニー株式会社 | マイクロチップ型光学測定装置及び該装置における光学位置調整方法 |
| JP5924077B2 (ja) | 2012-03-30 | 2016-05-25 | ソニー株式会社 | 微小粒子分取装置及び微小粒子分取装置における軌道方向判定方法 |
| JP5994337B2 (ja) | 2012-03-30 | 2016-09-21 | ソニー株式会社 | 微小粒子分取装置及びディレイタイム決定方法 |
| US9029724B2 (en) | 2012-03-30 | 2015-05-12 | Sony Corporation | Microparticle sorting device and method for controlling position in microparticle sorting device |
| US9448157B2 (en) | 2012-07-18 | 2016-09-20 | Sony Corporation | Microparticle sorting apparatus, microchip for sorting microparticles and microparticle sorting method |
| US9669403B2 (en) | 2012-07-25 | 2017-06-06 | Sony Corporation | Microparticle measurement device and liquid delivery method in microparticle measurement device |
| JP2014062822A (ja) | 2012-09-21 | 2014-04-10 | Sony Corp | 微小粒子分析装置及び微小粒子分析方法 |
| JP6065527B2 (ja) | 2012-11-08 | 2017-01-25 | ソニー株式会社 | 微小粒子分取装置及び微小粒子分取方法 |
| WO2014115409A1 (ja) | 2013-01-28 | 2014-07-31 | ソニー株式会社 | 微小粒子分取装置、微小粒子分取方法及びプログラム |
| US9915599B2 (en) | 2013-02-08 | 2018-03-13 | Sony Corporation | Microparticle analysis apparatus and microparticle analysis system |
| EP3035030B1 (en) | 2013-10-16 | 2019-07-10 | Sony Corporation | Particle fractionation device, particle fractionation method, and program |
| JP6136843B2 (ja) | 2013-10-17 | 2017-05-31 | ソニー株式会社 | 粒子分取装置、粒子分取方法及びプログラム |
| JP6465036B2 (ja) | 2014-02-13 | 2019-02-06 | ソニー株式会社 | 粒子分取装置、粒子分取方法、プログラム及び粒子分取システム |
| JP6657625B2 (ja) | 2014-09-05 | 2020-03-04 | ソニー株式会社 | 液滴分取装置、液滴分取方法及びプログラム |
| WO2017068822A1 (ja) | 2015-10-19 | 2017-04-27 | ソニー株式会社 | 画像処理装置、微小粒子分取装置及び画像処理方法 |
| US10591400B2 (en) | 2018-03-29 | 2020-03-17 | Sony Corporation | Micro particle analyzer and micro particle analysis method |
-
2013
- 2013-01-28 JP JP2014507472A patent/JPWO2013145836A1/ja active Pending
- 2013-01-28 US US14/386,499 patent/US9915935B2/en not_active Expired - Fee Related
- 2013-01-28 WO PCT/JP2013/051800 patent/WO2013145836A1/ja not_active Ceased
- 2013-01-28 CN CN201380016177.4A patent/CN104204766B/zh active Active
-
2016
- 2016-07-05 JP JP2016133041A patent/JP6256537B2/ja not_active Expired - Fee Related
-
2017
- 2017-12-07 JP JP2017235407A patent/JP6597762B2/ja active Active
-
2018
- 2018-01-19 US US15/875,846 patent/US10180676B2/en active Active
- 2018-12-31 US US16/237,039 patent/US10859996B2/en active Active
Patent Citations (8)
| Publication number | Priority date | Publication date | Assignee | Title |
|---|---|---|---|---|
| JPS6236542A (ja) * | 1985-08-09 | 1987-02-17 | Canon Inc | 粒子解析装置 |
| JPS6412245A (en) * | 1987-07-03 | 1989-01-17 | Canon Kk | Particle analyzing device |
| JPH09189653A (ja) * | 1996-01-11 | 1997-07-22 | Horiba Ltd | 散乱式粒度分布測定装置における光軸調整方法 |
| JP2004257756A (ja) * | 2003-02-24 | 2004-09-16 | Nippon Koden Corp | フローセル位置決め方法およびフローセル位置調整可能なフローサイトメータ |
| JP2006242849A (ja) * | 2005-03-04 | 2006-09-14 | Mitsui Eng & Shipbuild Co Ltd | 試料液流の位置制御方法および装置 |
| JP2010286292A (ja) * | 2009-06-10 | 2010-12-24 | Sony Corp | 微小粒子測定装置 |
| JP4805417B1 (ja) * | 2010-03-31 | 2011-11-02 | 古河電気工業株式会社 | 光情報解析装置及び光情報解析方法 |
| JP2012047464A (ja) * | 2010-08-24 | 2012-03-08 | Sony Corp | 微小粒子測定装置及び光軸補正方法 |
Cited By (10)
| Publication number | Priority date | Publication date | Assignee | Title |
|---|---|---|---|---|
| KR102944977B1 (ko) | 2017-10-26 | 2026-03-26 | 파티클 머슈어링 시스템즈, 인크. | 입자 측정을 위한 시스템 및 방법 |
| JPWO2020240755A1 (ja) * | 2019-05-29 | 2021-11-11 | 株式会社島津製作所 | 光散乱検出装置 |
| JP7070797B2 (ja) | 2019-05-29 | 2022-05-18 | 株式会社島津製作所 | 光散乱検出装置 |
| JPWO2021009849A1 (https=) * | 2019-07-16 | 2021-01-21 | ||
| WO2021009849A1 (ja) * | 2019-07-16 | 2021-01-21 | アライドフロー株式会社 | 粒子分別装置及びフローセルのアライメント方法 |
| JP7373859B2 (ja) | 2019-07-16 | 2023-11-06 | アライドフロー株式会社 | 粒子分別装置及びフローセルのアライメント方法 |
| US11965811B2 (en) | 2019-07-16 | 2024-04-23 | Allied Flow Inc. | Particle sorting apparatus and method of aligning flow cell |
| JP2022014302A (ja) * | 2020-07-06 | 2022-01-19 | シンクサイト株式会社 | フローサイトメータ、位置算出方法、及びプログラム |
| JP7566302B2 (ja) | 2020-07-06 | 2024-10-15 | シンクサイト株式会社 | フローサイトメータ、観測対象物判別方法、及びプログラム |
| WO2023062831A1 (ja) * | 2021-10-15 | 2023-04-20 | シンクサイト株式会社 | フローサイトメータ、位置算出方法、及びプログラム |
Also Published As
| Publication number | Publication date |
|---|---|
| JP2016191715A (ja) | 2016-11-10 |
| US20180143609A1 (en) | 2018-05-24 |
| JP6597762B2 (ja) | 2019-10-30 |
| US20150057787A1 (en) | 2015-02-26 |
| US10859996B2 (en) | 2020-12-08 |
| JP6256537B2 (ja) | 2018-01-10 |
| JPWO2013145836A1 (ja) | 2015-12-10 |
| CN104204766A (zh) | 2014-12-10 |
| US10180676B2 (en) | 2019-01-15 |
| JP2018059943A (ja) | 2018-04-12 |
| CN104204766B (zh) | 2016-08-31 |
| US20190171179A1 (en) | 2019-06-06 |
| US9915935B2 (en) | 2018-03-13 |
Similar Documents
| Publication | Publication Date | Title |
|---|---|---|
| JP6256537B2 (ja) | マイクロチップ型光学測定装置及び該装置における光学位置調整方法 | |
| JP5905317B2 (ja) | 微小粒子分取装置におけるキャリブレーション方法及び該装置 | |
| JP6729597B2 (ja) | 画像処理装置、微小粒子分取装置及び画像処理方法 | |
| JP6102994B2 (ja) | 微小粒子分取装置及び微小粒子分取装置における位置制御方法 | |
| JP5601424B2 (ja) | 微小粒子分取装置及び該装置における流体ストリーム最適化方法 | |
| JP5994337B2 (ja) | 微小粒子分取装置及びディレイタイム決定方法 | |
| JP6657625B2 (ja) | 液滴分取装置、液滴分取方法及びプログラム | |
| JP5924077B2 (ja) | 微小粒子分取装置及び微小粒子分取装置における軌道方向判定方法 | |
| KR102318759B1 (ko) | 미세입자 분류 장치 및 지연 시간 결정 방법 | |
| JP7601183B2 (ja) | 微小粒子分析装置及び微小粒子分析方法 | |
| US20160245736A1 (en) | Particle fractionation apparatus, particle fractionation method and particle fractionation program | |
| JP6237806B2 (ja) | 微小粒子分取装置 | |
| US20240165621A1 (en) | Biological particle sorting device and method for adjusting sorting condition in biological particle sorting device |
Legal Events
| Date | Code | Title | Description |
|---|---|---|---|
| 121 | Ep: the epo has been informed by wipo that ep was designated in this application |
Ref document number: 13767556 Country of ref document: EP Kind code of ref document: A1 |
|
| ENP | Entry into the national phase |
Ref document number: 2014507472 Country of ref document: JP Kind code of ref document: A |
|
| WWE | Wipo information: entry into national phase |
Ref document number: 14386499 Country of ref document: US |
|
| NENP | Non-entry into the national phase |
Ref country code: DE |
|
| 122 | Ep: pct application non-entry in european phase |
Ref document number: 13767556 Country of ref document: EP Kind code of ref document: A1 |
|
| NENP | Non-entry into the national phase |
Ref country code: DE |