WO2012164895A1 - 電子機器 - Google Patents
電子機器 Download PDFInfo
- Publication number
- WO2012164895A1 WO2012164895A1 PCT/JP2012/003434 JP2012003434W WO2012164895A1 WO 2012164895 A1 WO2012164895 A1 WO 2012164895A1 JP 2012003434 W JP2012003434 W JP 2012003434W WO 2012164895 A1 WO2012164895 A1 WO 2012164895A1
- Authority
- WO
- WIPO (PCT)
- Prior art keywords
- pressure
- data based
- press
- operator
- enlargement
- Prior art date
Links
Images


Classifications
-
- G—PHYSICS
- G06—COMPUTING; CALCULATING OR COUNTING
- G06F—ELECTRIC DIGITAL DATA PROCESSING
- G06F3/00—Input arrangements for transferring data to be processed into a form capable of being handled by the computer; Output arrangements for transferring data from processing unit to output unit, e.g. interface arrangements
- G06F3/01—Input arrangements or combined input and output arrangements for interaction between user and computer
- G06F3/048—Interaction techniques based on graphical user interfaces [GUI]
- G06F3/0487—Interaction techniques based on graphical user interfaces [GUI] using specific features provided by the input device, e.g. functions controlled by the rotation of a mouse with dual sensing arrangements, or of the nature of the input device, e.g. tap gestures based on pressure sensed by a digitiser
- G06F3/0488—Interaction techniques based on graphical user interfaces [GUI] using specific features provided by the input device, e.g. functions controlled by the rotation of a mouse with dual sensing arrangements, or of the nature of the input device, e.g. tap gestures based on pressure sensed by a digitiser using a touch-screen or digitiser, e.g. input of commands through traced gestures
- G06F3/04883—Interaction techniques based on graphical user interfaces [GUI] using specific features provided by the input device, e.g. functions controlled by the rotation of a mouse with dual sensing arrangements, or of the nature of the input device, e.g. tap gestures based on pressure sensed by a digitiser using a touch-screen or digitiser, e.g. input of commands through traced gestures for inputting data by handwriting, e.g. gesture or text
-
- G—PHYSICS
- G06—COMPUTING; CALCULATING OR COUNTING
- G06F—ELECTRIC DIGITAL DATA PROCESSING
- G06F2203/00—Indexing scheme relating to G06F3/00 - G06F3/048
- G06F2203/048—Indexing scheme relating to G06F3/048
- G06F2203/04806—Zoom, i.e. interaction techniques or interactors for controlling the zooming operation
Definitions
- the present invention relates to an electronic device. More specifically, the present invention relates to an electronic device that performs processing according to data based on pressure detected by a pressure detection unit.
- Patent Document 1 proposes an analog type resistive touch panel that can be miniaturized at a low production cost.
- a touch panel as described in Patent Document 1 is composed of two conductive films that are slightly spaced by spacers. This touch panel is configured to read a position where the conductive film is pressed and in contact with the other conductive film as a voltage by a voltage gradient applied to the one conductive film.
- a touch sensor For such a touch sensor, various methods such as a capacitive method and an optical method are known in addition to the resistive film method. Both types of touch sensors detect contact with an operator's finger or stylus pen.
- An electronic device including a touch sensor generally displays an image (hereinafter, referred to as “object”) such as operation keys and buttons on a display unit such as a liquid crystal display disposed on the back side of the touch sensor.
- object an image
- the touch sensor detects a contact at a position corresponding to the object.
- An electronic device equipped with such a touch sensor can have various user interfaces configured by displaying various objects in accordance with application software to be used (hereinafter simply referred to as “application”). Therefore, the electronic device provided with the touch sensor can configure various user interfaces with a high degree of freedom. Since such an electronic device is easy to understand for the operator and easy to use, an electronic device equipped with a touch sensor is rapidly spreading.
- touch sensors that support multi-touch can detect a plurality of points even when touched at the same time. is there.
- various types of processing can be performed depending on the operation mode by detecting not only the presence / absence of contact but also the mode of operation by contact. There are some (see, for example, Patent Document 2).
- a tap that touches the touch sensor only once (single tap)
- a double tap that touches the touch sensor twice quickly a slide (or drag) that moves the position of the contact while touching the touch sensor
- a flick that slides quickly to repel
- Some touch sensors that support multi-touch can detect a pinch operation in which two fingers or the like of an operator are simultaneously brought into contact with the touch sensor to open or close the two fingers or the like.
- a pinch-out operation an operation of opening two fingers that are brought into contact with each other
- an operation of closing two fingers or the like may be referred to as a pinch-in operation.
- FIG. 48A in the electronic device 100 in which the touch sensor 200 is placed on the front side of the display unit 300, a wide area map including Japan is displayed on the display unit 300 as an image.
- the electronic device 100 is an electronic device that supports a pinch operation.
- the operator touches to pinch a specific area to be expanded.
- a pinch-out operation can be performed by spreading two fingers.
- FIG. 48B the specific area that is touched so as to be pinched with the two fingers is enlarged and displayed so as to follow the movement in which the two fingertips are spread.
- the operator touches two fingers that touch the specific area to be reduced as shown in FIG.
- the pinch-in operation can be performed by narrowing the interval.
- FIG. 48A the specific area that is touched so as to be pinched with two fingers is reduced and displayed so as to follow the movement of closing the two fingertips.
- the operator When the electronic device 100 is a relatively large device such as a tablet computer, for example, the operator holds the case of the electronic device 100 with one hand and touches it with the finger of the other hand. There are many scenes where pinch operation is performed on the sensor.
- the electronic device 100 when the electronic device 100 is a relatively small device such as a smartphone, the operator holds the housing of the electronic device 100 with one hand and uses the thumb of the same hand to tap on the touch sensor. The operation can be performed.
- the image displayed on the display unit is enlarged and displayed as shown in FIG. 49, for example.
- a dedicated object such as a button to zoom out.
- FIG. 49A in the electronic device 100 in which the touch sensor 200 is placed on the front side of the display unit 300, a wide area map including Japan is displayed on the display unit 300 as an image.
- objects of a “+” button for enlarging an image and a “ ⁇ ” button for reducing an image are displayed in the lower right area.
- the operator taps the position corresponding to the “+” button on the touch sensor 200 to display on the display unit 300 as shown in FIG. 49 (B).
- the image can be enlarged.
- the operator taps the position corresponding to the “ ⁇ ” button on the touch sensor 200 to display the display unit 300 as shown in FIG.
- the displayed image can be reduced.
- an object of the present invention made in view of such circumstances is to reduce the number of places where an operator performs an operation and to perform processing without displaying a number of dedicated objects for processing and the like Is to provide.
- the invention of the electronic device is as follows: A pressure detector for detecting pressure; When a standard related to data based on pressure is set, control is performed to increase or decrease the value of a parameter associated with a predetermined process according to the difference between the standard and data based on the pressure detected by the pressure detection unit.
- a control unit It is characterized by providing.
- the invention of the electronic device is as follows: A pressure detector for detecting pressure; When a standard for data based on pressure is set, the speed at which the parameter value associated with the predetermined process changes is changed according to the difference between the standard and data based on the pressure detected by the pressure detection unit.
- a control unit for controlling to It is characterized by providing.
- the invention according to a third aspect is the electronic device according to the first or second aspect,
- the control unit sets the reference based on the data based on the pressure detected in the predetermined period when the change in the data based on the pressure detected by the pressure detection unit is within a predetermined range within the predetermined period. Is to control.
- the invention according to a fourth aspect is the electronic device according to the first aspect,
- the control unit uses the reference and the pressure detection unit.
- the amount of increase or decrease in the parameter value is controlled to be equal according to the difference from the detected data based on the pressure.
- An invention according to a fifth aspect is the electronic device according to the first aspect,
- the control unit is configured such that the difference between the reference and the data based on the pressure detected by the pressure detection unit before and after the data based on the pressure detected by the pressure detection unit changes from one to the other among the increase and decrease.
- the amount of increase / decrease in the parameter value is controlled to be different according to the above.
- a pressure detector for detecting pressure If the data based on the pressure detected by the pressure detection unit satisfies a predetermined condition, set a reference for data based on the pressure, When the reference is set, a control unit that controls to increase or decrease the value of the parameter associated with the predetermined process according to the difference between the reference and data based on the pressure detected by the pressure detection unit , It is characterized by providing.
- the invention of the electronic device for achieving the above object is as follows: A pressure detector for detecting pressure; If the data based on the pressure detected by the pressure detection unit satisfies a predetermined condition, set a reference for data based on the pressure, When the reference is set, control is performed to change the speed at which the value of the parameter associated with the predetermined process changes according to the difference between the reference and data based on the pressure detected by the pressure detection unit.
- a control unit to It is characterized by providing.
- the invention according to an eighth aspect is the electronic device according to the sixth or seventh aspect,
- the control unit increases the data based on the pressure when the change changes from increase to decrease and the increase from the decrease
- the control is performed so as to set the reference based on the data based on the pressure at the time of turning to.
- the invention according to a ninth aspect is the electronic device according to the sixth aspect,
- the control unit uses the reference and the pressure detection unit.
- the amount of increase or decrease in the parameter value is controlled to be equal according to the difference from the detected data based on the pressure.
- the invention according to a tenth aspect is the electronic device according to the sixth aspect,
- the control unit is configured such that the difference between the reference and the data based on the pressure detected by the pressure detection unit before and after the data based on the pressure detected by the pressure detection unit changes from one to the other among the increase and decrease.
- the amount of increase / decrease in the parameter value is controlled to be different according to the above.
- an electronic device it is possible to reduce the number of places where an operator performs an operation and to perform processing without displaying a number of dedicated objects for processing.
- the electronic device according to the present invention is not limited to a mobile phone, a smart phone, a tablet computer, or the like, and can be applied to any device having a touch sensor such as a PDA.
- the present invention is not limited to a portable electronic device, and can be applied to any device having a touch sensor, such as a bank ATM or a station ticket vending machine.
- the present invention is preferably applied to an electronic device having a touch sensor, but is not limited to a device having a touch sensor, as will be described later, and is also applicable to an electronic device having no touch sensor. Can be applied.
- FIG. 1 is a functional block diagram showing a schematic configuration of the electronic apparatus 1 according to the first embodiment of the present invention.
- the electronic device 1 includes a control unit 10, a touch sensor 20, a display unit 30, a press detection unit 40, a tactile sensation providing unit 50, and a storage unit 60.
- the control unit 10 controls and manages the entire electronic device 1 including each functional unit constituting the electronic device 1. Among the processes performed in the control unit 10, those unique to the present embodiment will be described later.
- the touch sensor 20 is usually configured by being superimposed on the front surface of the display unit 30 to detect contact with an operator's finger or stylus (hereinafter collectively referred to as “contact object”).
- the touch sensor 20 outputs a signal corresponding to the position where the contact is detected to the control unit 10 by detecting the contact by the contact object.
- the touch sensor 20 is configured using a system such as a resistance film system or a capacitance system, for example. Note that it is not essential for the touch sensor 20 to physically touch the touch sensor 20 when the touch sensor 20 detects a touch by the touch object.
- the touch sensor 20 is an optical type, the touch sensor 20 detects a position where the infrared light on the touch sensor 20 is blocked by the contact object, and thus it is not necessary for the contact object to touch the touch sensor 20. .
- the display unit 30 performs display corresponding to each application, and draws and displays a user interface constituted by objects in a predetermined display area. Furthermore, the display unit 30 also displays various information such as input results according to each application. In particular, in the present embodiment, as will be described later, the display unit 30 also displays an image such as a map as an example by an application that performs enlargement / reduction display in the electronic device 1.
- the display unit 30 is configured using, for example, a liquid crystal display panel (LCD), an organic EL display panel, or the like.
- the press detection unit 40 detects a press when the operator performs an operation on the touch panel 20. For example, physical or electrical characteristics (distortion, resistance, voltage, etc.) change according to the press. An element such as a strain gauge sensor or a piezoelectric element is used.
- the piezoelectric element of the press detection unit 40 has a magnitude of a load (force) related to a press on the touch panel 20 (or a magnitude of the load (force).
- the magnitude of the voltage (voltage value (hereinafter referred to as data based on pressure)), which is an electrical characteristic, changes in accordance with the speed (acceleration) at which the voltage changes.
- the control part 10 can be controlled to perform a predetermined
- the control unit 10 is based on the pressure when the press detection unit 40 notifies the control unit 10 of data based on the press, or the control unit 10 detects data based on the press of the press detection unit 40. Get the data. That is, the control unit 10 acquires data based on the pressure on the touch panel 20 from the pressure detection unit 40. Note that the data based on the pressure may be the magnitude of the load applied to the pressure, the power value, the resistance value, or the like instead of the voltage value.
- the press detection unit 40 can be configured according to a contact detection method on the touch panel 20.
- the touch panel 20 is a resistive film type
- the resistance according to the size of the contact area, or the range in which the magnitude of the resistance has changed is used as the load (force) of pressing against the touch surface of the touch panel.
- the load (force) of pressing against the touch surface of the touch panel By associating, it is possible to configure without using a strain gauge sensor or a piezoelectric element.
- the touch panel 20 is a capacitance type
- the size of the capacitance (charge) according to the size of the contact area, the range in which the size of the capacitance (charge) has changed, or the like is displayed. By associating it with the load (force) of pressing against, it can be configured without using a strain gauge sensor, a piezoelectric element or the like.
- the tactile sensation providing unit 50 vibrates the touch sensor 20, and is configured using, for example, a piezoelectric element or an ultrasonic transducer.
- the tactile sensation providing unit 50 presents a tactile sensation to a contact object that is in contact with the touch sensor 20 by generating a vibration according to a predetermined vibration pattern.
- the tactile sensation providing unit 50 generates vibration based on the drive signal supplied from the control unit 10.
- the tactile sensation providing unit 50 vibrates the tactile sensation providing unit in response to a press detected by the press detection unit 40 (press on the touch panel 20), thereby generating a vibration and presenting a tactile sensation to a user's finger or the like. It can be understood sensuously that the user who is pressing 20 has performed the operation.
- the press detection part 40 can also be comprised integrally with the tactile sense presentation part 50. FIG.
- the press detection unit 40 and the tactile sensation providing unit 50 are configured using a piezoelectric element, it is also possible to configure a press detection unit / tactile sensation providing unit using the piezoelectric element in common. This is because the piezoelectric element generates a voltage when pressure is applied and deforms when the voltage is applied.
- the tactile sensation providing unit 50 performs a predetermined process and drives the piezoelectric element when the magnitude of the voltage (voltage value (data)) of the piezoelectric element that also serves as the pressure detection unit 40 satisfies a predetermined threshold. By doing so, vibration can be generated.
- a predetermined threshold value when the magnitude of the voltage of the piezoelectric element (voltage value (data)) satisfies a predetermined threshold value, it may be when the voltage value (data) reaches a predetermined reference value, It may be when the value (data) exceeds a predetermined reference value or when a voltage value (data) equal to the predetermined reference value is detected.
- the storage unit 60 is configured by, for example, a NAND flash memory, and can store not only various applications executed in the electronic device 1 but also various information.
- the storage unit 60 can store a contact position detected by the touch sensor 20 at an arbitrary timing, and can also store a history of the contact position.
- the storage unit 60 can also store data based on the pressure detected by the pressure detection unit 40 at an arbitrary timing, and can also store a history of data based on the pressure. it can.
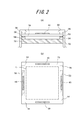
- FIG. 2 is a diagram illustrating an example of a mounting structure of the touch sensor 20, the display unit 30, the press detection unit 40, and the tactile sensation providing unit 50 of the electronic device 1 illustrated in FIG. 2A is a cross-sectional view of a main part, and FIG. 2B is a plan view of the main part.
- the display unit 30 for performing various displays is housed and held in a housing 90.
- the touch sensor 20 is held on the display unit 30 via an insulator 94 made of an elastic member.
- the electronic apparatus 1 according to the present embodiment has the display unit 30 and the touch sensor 20 in a rectangular shape in plan view.
- the touch sensor 20 is illustrated as a square shape, but may be a rectangular shape or the like according to the specifications of the electronic device 1 on which the touch sensor 20 is mounted.
- the electronic device 1 holds the touch sensor 20 on the display unit 30 via the insulators 94 disposed at the four corners deviated from the display area A of the display unit 30 indicated by virtual lines in FIG. To do.
- the housing 90 is provided with an upper cover 92 so as to cover the surface area of the touch sensor 20 that is out of the display area of the display unit 30, and is made of an elastic member between the upper cover 92 and the touch sensor 20.
- An insulator 96 is provided.
- the touch sensor 20 includes, for example, a transparent film on the front surface, that is, a surface on which an operation by the operator is performed, and a glass on the back surface. Use a structure that bends (distorts) slightly.
- the electronic device 1 includes a strain gauge sensor for detecting pressure applied to the touch sensor 20 in the vicinity of each side covered with the upper cover 92 on the transparent film on the surface of the touch sensor 20.
- a piezoelectric element or an ultrasonic vibrator for vibrating the touch sensor 20 is provided in the vicinity of two opposing sides by bonding or the like. That is, in the electronic device 1 shown in FIG. 2, the press detection unit 40 shown in FIG. 1 is configured using four strain gauge sensors, and the tactile sensation providing unit 50 is configured using two vibrators.
- the pressure detection unit 40 detects the pressure from, for example, an average value of outputs from the four strain gauge sensors.
- the tactile sensation providing unit 50 drives, for example, two vibrators in the same phase.
- FIG. 2B illustration of the housing 90, the upper cover 92, and the insulator 96 shown in FIG. 2A is omitted.
- a standard regarding data based on pressure is set based on a predetermined operation by an operator, and when the standard is set, the electronic apparatus 1 shifts to an enlargement / reduction mode.
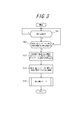
- FIG. 3 is a flowchart for explaining processing centering on setting of a standard regarding data based on pressing in the present embodiment.
- This “reference for data based on pressure” is a standard set based on data based on pressure by an operator's operation, and based on this standard for data based on pressure, the map is enlarged by subsequent processing. ⁇ Reduce. Therefore, when setting the reference regarding the data based on the press, the data based on the press during the operation in which the operator presses the touch sensor 20 with a force that is not relatively strong or weak (medium) is used. It is preferable to use the “reference for data based on pressure”.
- the control unit 10 monitors the contact detected by the touch sensor 20 and the pressure detected by the pressure detection unit 40 (step S11). In particular, in the present embodiment, it is preferable that the control unit 10 performs monitoring while storing a history of changes in data based on the pressure detected by the pressure detection unit 40 in the storage unit 60.
- the control unit 10 determines whether or not a change in data based on the press is within a predetermined range within a predetermined period (step S12).
- the “predetermined period” is a period that is too short, a reference for data based on the pressure is set before the operator performs an operation to appropriately maintain the pressure.
- the “predetermined period” is set to an excessively long period, there is a risk that the operability of the electronic device 1 may be deteriorated because a standard regarding data based on pressing is not set. Therefore, it is possible to set an appropriate period of time such as about 1 second, which corresponds to “long press” on a normal button, and to change it appropriately after the setting according to the preference of the operator. It is preferable to do this.
- the change in the data based on the pressure is within “predetermined range” means that the change in the data based on the pressure detected by the pressure detection unit 40 is small when the operator maintains the pressure. Or, it means a state that has hardly changed.
- the control unit 10 determines whether the change in data based on the pressure is within a predetermined range, for example, the amount of change per minute time from the history of the data based on the pressure stored in the storage unit 60. It can be determined whether or not is substantially zero. In this case, since it is difficult to assume that the amount of change per minute time of the data based on the pressure is strictly maintained at zero, the control unit 10 considers the margin per predetermined time by considering the margin of the predetermined width.
- the control unit 10 determines whether or not the data change based on is within the predetermined range. That is, it is preferable that the control unit 10 determines that the differential coefficient has become a small value close to zero so that it can be determined that the differential coefficient in the time change of the data based on the pressure is close to zero. Further, when the control unit 10 determines whether or not the data change based on the pressure is within a predetermined range, for example, the difference between the maximum value and the minimum value of the data based on the pressure in the “predetermined period” described above. It can be determined whether the value is less than or equal to a predetermined threshold. In this case, when the difference value mentioned above is below a predetermined threshold, the control part 10 can determine with the change of the data based on a press being within the predetermined range.
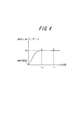
- FIG. 4 is a graph for explaining an example of the time change of data based on the press by the operation of the operator.
- the horizontal axis represents the passage of time
- the vertical axis represents data based on the pressure detected by the pressure detection unit 40.
- FIG. 4 shows an operation of gradually increasing the pressure after the operator starts pressing (starting operation) the touch sensor 20, and then performs a predetermined period (from time A to time B, that is, between t 0 and t 1 ). ), A state of performing an operation of maintaining the pressure substantially constant (P 0 ).
- step S12 If it is determined in step S12 that the change in the data based on the pressure is not within the predetermined range within the predetermined period, the control unit 10 returns to step S11 and continues the process. On the other hand, if it is determined in step S12 that the change in the data based on the pressure is within the predetermined range within the predetermined period, the control unit 10 performs the pressing based on the data based on the pressure detected during the predetermined period. A reference for the data based on is set (step S13). That is, in the present embodiment, if the change in the data based on the pressure detected by the pressure detection unit 40 is within a predetermined range within the predetermined period, the control unit 10 converts the data based on the pressure detected during the predetermined period.
- control is performed so as to set a reference for data based on pressure.
- the reference (P 0 ) regarding the data based on the pressure is set at the time t 1.
- the control unit 10 when setting the reference regarding the data based on the pressure, the control unit 10, for example, the average value of the data based on the pressure detected (substantially constant) detected during a predetermined period (that is, between t 0 and t 1 ). Can be calculated.
- the calculation is not limited to the average value as described above, and various calculations can be performed. For example, data based on a press at the moment of change of the data based on a press is first determined that within a predetermined range, i.e. data based on a press at the time of t 0 shown in FIG. 4 (data based on a press of the point A) Can also be set as a reference for data based on pressure.
- data changes in the data based on a press is based on a press at the time of t 1 shown in the data, i.e., 4 based on a press at the moment it is determined that within a predetermined range within a predetermined time period (B point Can be set as a reference for data based on pressure.
- step S13 the control unit 10 controls the corresponding functional unit so as to notify the operator that the reference regarding the data based on the press is set (step S14). ).
- step S14 the operator is informed that the reference for the data based on the pressure has been set by the elapse of the predetermined period after the change in the data based on the pressure is within the predetermined range. Therefore, the control unit 10 can control the tactile sensation providing unit 40 so as to present the tactile sensation to the operator by vibrating the touch sensor 20, for example.
- the display on the display unit 30 is changed, or a predetermined sound is output from a sound output unit (not shown), thereby setting a standard for data based on pressing. It is also possible to notify the operator that this has been done.
- a reference relating to data based on pressing is set, and the operator is notified that a reference relating to data based on pressing has been set.
- step S14 When it is notified in step S14 that the reference regarding the data based on the press is set, the control unit 10 shifts to the enlargement / reduction mode and is displayed on the display unit 30 in accordance with the adjustment of the operator's press. Control is performed to enlarge or reduce the image (step S15). This enlargement / reduction mode will be described later.
- the notification that the reference related to the data based on the pressure performed in step S13 is set can also be interpreted for the operator as notification that the mode is to be shifted to the enlargement / reduction mode.
- the same operation as when an operator operates an electronic device equipped with a conventional touch sensor can be performed. It is preferable to perform the processing as described above. For example, before the transition to the enlargement / reduction mode in step S15, for example, when a slide operation on the touch sensor 20 is detected, the control unit 10 displays an image displayed on the display unit 30 so as to follow the slide operation. It is also preferable to control the sliding. Since such processing can be the same processing as that of an electronic device having a touch sensor according to the prior art, detailed description thereof is omitted.
- FIG. 5 is a flowchart for explaining processing performed in the enlargement / reduction mode as step S15 in FIG.
- step S21 the control unit 10 performs control so as to associate the data based on the press with the enlargement / reduction ratio (step S21).
- step S ⁇ b> 21 the control unit 10 presets a ratio of how much the image displayed on the display unit 30 should be enlarged or reduced according to data based on the pressure detected by the pressure detection unit 40.
- the control unit 10 may calculate the association between the data based on the detected press and the enlargement / reduction ratio each time.
- FIG. 6 is a graph for explaining an example of the association between the data based on the press shown in step S21 of FIG. 5 and the enlargement / reduction ratio.
- the control unit 10 determines the data (P) based on the pressure and the enlargement / reduction ratio based on the reference (P 0 ) regarding the data based on the pressure set in step S13 in FIG. Control to associate with (X).
- the horizontal axis represents data (P) based on pressure
- the vertical axis represents the enlargement / reduction ratio (X).
- P max on the horizontal axis represents data based on the maximum pressure that can be detected by the pressure detection unit 40
- P min represents data based on the minimum pressure that can be detected by the pressure detection unit 40.
- data based on the maximum or minimum pressure that can be detected by the pressure detection unit 40 is determined by various conditions such as physical characteristics and arrangement of the pressure detection unit 40.
- P max is, for example, a data value based on a pressure slightly smaller than the maximum pressure that can be actually detected by the pressure detection unit 40.
- P min is, for example, actually detected by the pressure detection unit 40. It can also be a data value based on a pressure slightly greater than the smallest possible pressure. That is, P max and P min can be values set in a range in which the pressure detection unit 40 can accurately and reliably detect data based on the pressure.
- X max on the vertical axis represents the maximum enlargement rate when the image displayed on the display unit 30 is enlarged
- X min represents the minimum reduction rate when the image displayed on the display unit 30 is reduced.
- X 0 is a reference for the enlargement / reduction ratio, and represents the enlargement / reduction ratio of the image displayed on the display unit 30 when the reference P 0 regarding data based on pressing is set.
- the change in the data based on the press from P min to P 0 may include an enlargement / reduction ratio from X min to X 0.
- a change in data based on the pressure from P 0 to P max is associated with a linear change in the enlargement / reduction ratio from X 0 to X max .
- FIG. 6 for simplification of description, an example in which the reference P 0 related to the data based on the pressure is set just around the middle between P max and P min in step S13 of FIG. Show. Therefore, in step S13 of FIG.
- step S21 of FIG. 5 after associating the data based on the pressure as shown in FIG. 6 with the enlargement / reduction ratio, the control unit 10 determines whether or not the position of the contact detected by the touch sensor 20 has changed. That is, it is determined whether or not a slide operation by the operator is detected (step S22). In this case, when the change in the contact position detected by the touch sensor 20 is extremely small, the control unit 10 does not determine that the slide operation has been detected. It is preferable to determine that a slide operation has been detected when the distance has changed beyond this distance.
- step S22 the control unit 10 sets the enlargement / reduction ratio of the image displayed on the display unit 30 at that time as a fixed value (step S23), and ends the enlargement / reduction mode. . That is, in the enlargement / reduction mode shown in FIG. 5, when a slide operation by the operator is detected on the touch sensor 20, the image displayed on the display unit 30 at that time is next put into the enlargement / reduction mode again. Do not scale up or down until the transition.
- step S24 determines whether data based on the pressure detected by the pressure detection unit 40 has changed. If it is not determined in step S24 that the data based on the pressure has changed, the control unit 10 returns to step S22 and continues the process. On the other hand, if it is determined that data based on a press is changed in step S24, the control unit 10, in accordance with the difference between the data P based on a press detected by the reference P 0 and press detection unit 40 on the data based on a press Then, control is performed to enlarge or reduce the image displayed on the display unit 30 (step S25).
- the control unit 10 causes the display unit 30 to Control to reduce the displayed image a little.
- the difference between P 0 and P is large, so the control unit 10 displays the display unit. The image displayed at 30 is controlled to be considerably enlarged.
- the control unit 10 when a reference relating to data based on pressure is set, the control unit 10 responds to a difference between the set reference and data based on the pressure detected by the pressure detection unit 40. Thus, control is performed so as to increase or decrease the value of the parameter associated with the predetermined process.
- the “predetermined process” corresponds to a process of enlarging or reducing the image displayed on the display unit 30 in this example, but various other processes depending on the application executed on the electronic device 1. It can be.
- the “parameter value” corresponds to a value of an enlargement / reduction ratio when an image is enlarged or reduced in this example, and this also applies to various parameters according to the application executed in the electronic device 1. Value.
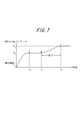
- FIG. 7 is a graph showing an example of the time change of data based on the press by the operation of the operator, as in FIG.
- FIG. 7 after the point B described in FIG. 4, i.e., after the reference regarding the data based on the pressure is set, an increase in data based on the pressure by the operation of the operator is detected up to the point C.
- the data based on a press detected by the press detection unit 40 is increased relative to the P 0, is displayed on the display unit 30
- the image is enlarged.
- the time t 2 the i.e.
- the pressing data based on a press detected by the detecting unit 40 is maintained at a substantially constant value P 1, when the slide operation is detected at this time , It is fixed at the current enlargement / reduction ratio. That is, in this case, the image displayed on the display unit 30 is neither enlarged nor reduced. After that, if the pressure on the touch sensor 20 by the operation of the operator is maintained again for a predetermined time, a reference regarding data based on the new pressure is set, and the image displayed on the display unit 30 at that time is enlarged again or as a reference. Can be reduced.
- FIG. 8 is also a graph showing another example of the time change of the data based on the press by the operation of the operator, as in FIG.
- the point B that is, after the reference regarding the data based on the pressure is set
- a decrease in the data based on the pressure due to the operation by the operator is detected up to the point C.
- the data based on a press detected by the press detection unit 40 is reduced relative to the P 0, is displayed on the display unit 30 The image is reduced.
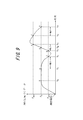
- FIG. 9 is also a graph showing another example of the time change of the data based on the press by the operation of the operator, similarly to FIG.
- point B that is, after a reference relating to data based on pressing is set
- a decrease in data based on pressing due to the operation by the operator is detected up to point C.
- the data based on the pressure changes from decreasing to increasing, and increases from the E point to the F point.
- the data based on pressing changes from increasing to decreasing and decreases to the H point.
- the image displayed on the display unit 30 is reduced between the times t 1 and t 2 and is displayed on the display unit 30 between the times t 3 and t 5.
- the image to be displayed is enlarged, and the image displayed on the display unit 30 is reduced again between times t 6 and t 7 .
- the time t 4 it has returned to the scaling ratio of the time the standards for data based on a press is set. That is, at the point E, an image having the same enlargement / reduction ratio as that at the time when the reference regarding the data based on the pressure is set is displayed.
- the data based on the pressure changes, but exceeds the data P max based on the maximum pressure that can be detected by the pressure detection unit 40. Or is less than the data P min based on the minimum pressing, so neither enlargement nor reduction is performed.
- FIG. 10 is a graph showing the change over time of the enlargement / reduction ratio of the image displayed on the display unit 30 when the data based on the pressure changes over time as shown in FIG.
- the horizontal axis represents the passage of time
- the vertical axis represents the enlargement / reduction ratio of the image displayed on the display unit 30.
- FIG. 11 is a diagram illustrating a specific example of display on the display unit 30 when the operator performs an operation on the electronic device 1 according to the present embodiment.
- the operator performs a slide operation on the touch sensor 20 before the reference regarding the data based on the pressure is set, that is, before the transition to the enlargement / reduction mode.
- the map of Japan displayed on the display unit 30 can be arbitrarily slid.
- standard regarding the data based on a press is set by maintaining the position and press which an operator contacts in arbitrary positions of the touch sensor 20 for a predetermined time, and the electronic device 1 transfers to expansion / reduction mode.
- the display unit 30 is displayed as shown in FIG.
- the displayed image is not slid and the enlargement / reduction ratio of the image is fixed. Therefore, after the operator performs a sliding operation on the touch sensor 20 as shown in FIG. 11D, even if the operator reduces the pressure by removing the finger from the touch sensor 20, the display unit 30 images are not reduced.
- the present embodiment if the casing of the electronic device is small, using the fingertip of the same hand while holding the electronic device with one hand, enlargement or reduction similar to the conventional pinch operation Etc. can be performed. Further, according to the present embodiment, when an operation is performed on the touch sensor 20 regardless of the size of the electronic device, the operation is performed with only one finger, that is, by pressing only one place. be able to. Furthermore, according to the present embodiment, since the operation can be started at an arbitrary position of the touch sensor 20, the operation can be smoothly performed with a small number of procedures. Further, according to the present embodiment, it is not necessary to display a dedicated object for performing a specific process such as enlargement or reduction on the display unit, so that the display area of the display unit can be used effectively.
- the processing by the control unit 10 is changed in the first embodiment described above. That is, the second embodiment changes the process of step S25 described in FIG. 5 in the electronic device 1 according to the first embodiment. Specifically, the electronic device 2 according to the second embodiment responds to the difference between the reference P 0 related to the data based on the pressure and the data P based on the pressure detected by the pressure detection unit 40 in the enlargement / reduction mode. Thus, the speed at which the image displayed on the display unit 30 is enlarged or reduced is changed.
- the electronic device 2 according to the second embodiment can be realized by basically the same device configuration and control as those of the electronic device 1 described in the first embodiment described above except for the above points. For this reason, below, the description which becomes the same content as having demonstrated in 1st Embodiment is abbreviate
- FIG. 12 is a flowchart for explaining processing of the electronic device 2 according to the second embodiment.
- FIG. 12 illustrates the processing performed in the enlargement / reduction mode shown in step S15 of FIG. 3 after the reference regarding the data based on the press is set, as in FIG. 5 described in the first embodiment. It is a flowchart.
- “association of data based on pressing and enlargement / reduction ratio” is performed in step S21.
- “association of data based on pressure and enlargement / reduction speed” is performed in step S21.
- step S21 after associating the data (P) based on the pressure with the enlargement / reduction speed in step S21, the control unit 10 does not detect the slide operation in step S22, but in step S24 the pressure detection unit.
- the process of step S31 is performed.
- control unit 10 is displayed on the display unit 30 according to the difference between the reference P 0 related to the data based on the pressure and the data P based on the pressure detected by the pressure detection unit 40. Control is performed to enlarge or reduce the image (step S25).
- control unit 10 in accordance with the difference between the data P based on a press detected by the reference P 0 and press detection unit 40 on the data based on a press, it is displayed on the display unit 30
- Control is made to change the speed at which the image is enlarged or reduced (step S31).
- the control unit 10 causes the display unit 30 to Control to reduce the displayed image at a relatively slow speed.
- the difference between P 0 and P is large, so the control unit 10 displays the display unit. Control is performed so that the image displayed at 30 is enlarged at a relatively high speed.
- the pressure is maintained in the enlargement / reduction mode, neither enlargement nor reduction is performed.
- the reference P 0 regarding the data based on the pressure is Enlargement or reduction is performed according to the difference from the data P based on the pressure detected by the pressure detection unit 40.
- control unit 10 when a reference relating to data based on pressure is set, the control unit 10 responds to a difference between the set reference and data based on the pressure detected by the pressure detection unit 40. Then, control is performed to change the speed at which the value of the parameter associated with the predetermined process changes.
- step S21 the data based on the pressure detected by the pressure detection unit 40 and the image displayed on the display unit 30 are enlarged or reduced. Correlate with speed.
- the data P based on the pressure slightly larger than the reference P 0 regarding the data based on the pressure is associated with a relatively slowly expanding speed
- the data P based on the pressure much smaller than the standard P 0 regarding the data based on the pressure is associated with the data P.
- FIG. 13 is a graph showing an example of the time change of data based on the press by the operation of the operator, like FIG.
- point B that is, after a reference relating to data based on the pressure is set
- the case where the point C is reached by increasing the data based on the pressure by the operator's operation and the operation of the operator
- the case where the point D is reached as a result of further increase in data based on the pressing due to is shown.
- the reference P 0 related to the data based on the press is set, several stages of the data based on the press are set above and below the reference based on the reference P 0 related to the data based on the press. .
- FIG. 13 only the stage of data based on the pressure set higher than the reference P 0 regarding the data based on the pressure is shown. Further, in FIG. 13, as an example, only two data stages based on the pressure set for each 1N are shown for data based on the pressure larger than the reference P 0 regarding the data based on the pressure.
- the level of the data based on the pressure it is not essential that the interval between the levels of the data based on the pressure be 1N, and it is also possible to set the data at a denser interval. You can also set it with. It is not essential to set two such stages, and more stages may be set, or a very large number of stages may correspond to changes in data based on pressure in an analog manner. May be. Furthermore, it is not essential to set the stage of data based on such a press in advance, and the above-described stage may be calculated every time a press is detected.
- the speed displayed on the display unit 30 is enlarged as the speed
- ⁇ correspond.
- the speed ⁇ is used as the speed at which the image displayed on the display unit 30 is enlarged at the data stage based on the pressure from P 0 + 1N to P 0 + 2N.
- the speed ⁇ can be a speed at which an image displayed on the display unit 30 is enlarged faster than the speed ⁇ . That is, in this case, when the operator operates the touch sensor 20, the image displayed on the display unit 30 is enlarged at a higher speed when the greater pressure is maintained.
- FIG. 14 is a graph showing another example of the time change of the data based on the press by the operation of the operator, similarly to FIG. 7 and the like.
- point B that is, after a reference relating to data based on pressing is set
- the data based on pressing by the operator's operation decreases to reach point C
- the operator's operation The case where the point D is reached by further reducing the data based on the pressure by the is shown at the same time.
- FIG. 14 only the data stage based on the pressure set lower than the reference P 0 regarding the data based on the pressure is shown. Moreover, in FIG. 14, as an example, only two data stages based on the pressure set for each 1N are shown for data based on the pressure smaller than the reference P 0 regarding the data based on the pressure.
- the speed ⁇ can be a speed at which an image displayed on the display unit 30 is reduced faster than the speed ⁇ . That is, in this case, when the operator operates the touch sensor 20, the image displayed on the display unit 30 is reduced at a higher speed when the smaller pressure is maintained.
- FIG. 15 is a graph showing still another example of the time change of the data based on the press by the operation of the operator.
- the point B that is, after the standard regarding the data based on the pressure is set, the data based on the pressure once decreases and then increases and then increases and decreases.
- phase of the data based on a press from P 0 to P 0 + 1N made to correspond to the speed alpha
- stage of the data based on a press from P 0 + 1N to P 0 + 2N Is associated with a speed ⁇ .
- FIG. 15 similar to FIG. 14, in correspondence to the rate ⁇ is the phase of the data based on a press from P 0 to P 0 -1N, based on the pressure from P 0 -1N to P 0 -2N
- a speed ⁇ is associated with the data stage.
- FIG. 16 is a graph showing the change over time of the enlargement / reduction ratio of the image displayed on the display unit 30 when the data based on the pressure changes over time as shown in FIG.
- the horizontal axis represents the passage of time
- the vertical axis represents the enlargement / reduction ratio of the image displayed on the display unit 30.
- FIG. 15 and FIG. 16 are compared, since the mode has not been changed to the enlargement / reduction mode from the operation start time to time t 0 , that is, before the reference relating to the data based on the pressure is set, it is based on the pressure. Although the data is changing, it can be seen that the scaling ratio does not change from the standard. As shown in FIG. 15, since the data based on the pressure is maintained between P 0 and P 0 ⁇ 1N between times t 1 and t 2 , as shown in FIG. The image displayed on the display unit 30 is reduced at the speed ⁇ . Further, as shown in FIG.
- the number of operations performed by the operator can be reduced and the procedure of operations performed by the operator can also be reduced. it can.
- the image displayed on the display unit 30 is enlarged at such a large speed, so that the operator performs the operation with a large pressure. Since a short time is required, the burden on the operator of applying a pressing force can be reduced.
- the 3rd Embodiment changes the process by the control part 10 in 1st Embodiment mentioned above. That is, in the electronic device 1 according to the first embodiment, the third embodiment changes the mode of the process in step S21 described in FIG. Specifically, in the electronic device 3 according to the third embodiment, after the reference regarding the data based on the pressing is set, the manner of associating the data based on the pressing and the enlargement / reduction ratio as described in FIG. To change.
- the electronic device 3 according to the third embodiment can be realized by basically the same device configuration and control as those of the electronic device 1 described in the first embodiment described above except for the above points. For this reason, below, the description which becomes the same content as having demonstrated in 1st Embodiment is abbreviate
- the change in the data based on the pressure from P min to P 0 includes X min A linear change in the enlargement / reduction ratio from 1 to X0 was associated.
- the change in data based on the pressure from P 0 to P max is associated with the linear change in the enlargement / reduction ratio from X 0 to X max .
- FIG. 6 shows an example in which the reference P 0 related to the data based on the pressure is set just around the middle between P max and P min for the sake of simplicity of explanation.
- the relationship between the data based on the pressure and the enlargement / reduction ratio is as follows.
- the graph is a straight line from P min to P max .
- the vertical axis and the horizontal axis are set differently from those in FIG.
- the graph changes in slope at the point of P 0 .
- the reference P 0 related to the data based on the pressure is set to a position smaller than the middle of P min and P max , the relationship between the data based on the pressure and the enlargement / reduction ratio is shown in FIG. as shown in C), the graph, the slope of which varies at the time of P 0 Again.
- the data based on the pressure is less than P 0 even if the operator gradually decreases the pressure at a certain rate. As a result, the rate at which the enlargement ratio decreases suddenly increases, and the image displayed on the display unit 30 is suddenly reduced.
- the reference P regarding the data based on the pressure is used. Before and after 0 , correction is performed so that the amount of change in the enlargement / reduction ratio for the data based on the pressure does not change significantly. Specifically, for example, when the association shown in FIG. 17B is about to be performed, the control unit 10 corrects these associations, for example, as shown in FIG. Correspondence between the data based on the press and the enlargement / reduction ratio is performed.
- the reference P 0 regarding the data based on the pressure is P min (actually, the enlargement / reduction ratio is the minimum X min) . It is set in the middle between the data P) based on the pressing of time and P max . Therefore, the correlation between the data based on the pressure and the enlargement / reduction ratio is a graph in which the slope does not change before and after P 0 , and even if the operator changes the pressure across the reference P 0 regarding the data based on the pressure. Does not give a sense of incongruity to the follow-up performance of enlargement or reduction
- control unit 10 corrects these associations and based on the press as shown in FIG. 18B, for example. Correspondence between data and enlargement / reduction ratio is performed.
- the reference P 0 regarding the data based on the pressure is P min and P max (actually, the enlargement / reduction ratio is X It is set in the middle of the data P) based on the pressure when reaching max . Therefore, the correlation between the data based on the pressure and the enlargement / reduction ratio is a graph in which the slope does not change before and after P 0 , and even if the operator changes the pressure across the reference P 0 regarding the data based on the pressure. Does not give a sense of incongruity to the follow-up performance of enlargement or reduction
- control unit 10 responds to the difference between the reference regarding the data based on the pressure and the data based on the pressure detected by the pressure detection unit 40, as in the first embodiment. Then, control is performed so as to increase or decrease the value of the parameter associated with the predetermined process.
- control unit 10 includes a case where the data based on the pressure detected by the pressure detection unit 40 increases and a case where the data based on the pressure detected by the pressure detection unit 40 decreases. The amount of increase or decrease in the parameter value is controlled to be equal.
- the “amount to increase / decrease the value of the parameter” is based on the pressure according to the difference between the reference regarding the data based on the pressure and the data based on the pressure detected by the pressure detection unit 40 in the above-described example. This corresponds to the amount of change in the enlargement / reduction ratio for the data.
- the mode of correction so as not to change is not limited to that described in FIG. 18, and various modes can be assumed.
- the corrected association as shown in FIG. 19A can be performed.
- the amount of change in the enlargement / reduction ratio with respect to the data based on the press is large before and after the reference P 0 regarding the data based on the press.
- the enlargement / reduction ratio can be changed until the data based on the pressure reaches the original Pmin .
- the corrected association as shown in FIG. 19B can be performed.
- the change amount of the enlargement / reduction ratio with respect to the data based on the press is large before and after the reference P 0 regarding the data based on the press.
- the enlargement / reduction ratio can be changed until the data based on the pressure reaches the original Pmax .
- the present embodiment even if the operator changes the pressure across the reference P 0 regarding the data based on the pressure, the amount of increase or decrease in the value of the parameter associated with the predetermined process is greatly changed. Without being almost equal. Therefore, according to the present embodiment, when the operator changes the pressure across the reference P 0 regarding the data based on the pressure, the followability when the image displayed on the display unit 30 is enlarged or reduced. There is no sense of discomfort.
- the processing by the control unit 10 is changed in the first embodiment described above. That is, in the electronic device 1 according to the first embodiment, the fourth embodiment changes the process after step S25 described in FIG. That is, in the electronic device 4 according to the fourth embodiment, the reference regarding the data based on the press is set, and a predetermined operation is performed during the process of enlarging or reducing the image according to the data based on the press. If it is determined that it has been performed, the manner of associating the data based on the press and the enlargement / reduction ratio as described with reference to FIG. 6 is changed.
- the electronic device 4 according to the fourth embodiment can be realized by basically the same device configuration and control as those of the electronic device 1 described in the first embodiment described above except for the above points. For this reason, below, the description which becomes the same content as having demonstrated in 1st Embodiment is abbreviate
- the operator enlarges or reduces the image too much during the process of enlarging or reducing the image displayed on the display unit 30 by the electronic device 1 according to the first embodiment.
- a measure for easily correcting to a desired enlargement / reduction ratio is provided.
- FIG. 20 is a flowchart for explaining processing of the electronic device 4 according to the fourth embodiment. Note that FIG. 20 illustrates processing performed in the enlargement / reduction mode shown in step S ⁇ b> 15 of FIG. 3 after the reference regarding the data based on pressing is set, as in FIG. 5 described in the first embodiment. It is a flowchart.
- control unit 10 at step S25, according to the difference between the data P based on a press detected by the reference P 0 and press detection unit 40 on the data based on a press, is displayed on the display unit 30
- the processing until the control is performed to enlarge or reduce the image is performed in the same manner as in the first embodiment.
- the control unit 10 increases the data P based on the pressure detected by the pressure detection unit 40, and the data P based on the maximum pressure that can be detected by the pressure detection unit 40. It is determined whether or not it has started decreasing after exceeding max (step S41). If it is determined in step S41 that the data P based on the pressure exceeds the data P max based on the maximum pressure and then starts to decrease, the control unit 10 changes the association between the data based on the pressure and the enlargement / reduction ratio ( Step S42).
- step S41 the control unit 10 increases after the data P based on the pressure detected by the pressure detection unit 40 decreases and falls below the data P min based on the minimum pressure that can be detected by the pressure detection unit 40. Also when it is determined that the process has changed to step S42, the process of step S42 is performed. That is, even if it is determined in step S41 that the data P based on the pressure has decreased below the data P min based on the minimum pressure, the control unit 10 associates the data based on the pressure with the enlargement / reduction ratio. Change (step S42).
- step S42 when the association between the data based on the pressure and the enlargement / reduction ratio is changed, the control unit 10 returns to step S22 and continues the process.
- the control unit 10 returns to step S22 and continues the process without performing the process of step S42.
- FIG. 21 is a graph showing an example of the time change of data based on the press by the operator's operation, like FIG. 7 described in the first embodiment.
- the data based on the pressure by the operation of the operator is maintained substantially constant from the point A to the point B, and as shown in FIG. Correlation with the reduction ratio X is performed (step S21 in FIG. 20).
- the processing so far is the same as that described with reference to FIG. 6 and the like in the first embodiment.
- the data based on the pressure by the operation of the operator increases to the point D beyond P max at the point C, It starts to decrease at point D (Yes in step S41). Accordingly, in this case, the association between the data based on the pressure and the enlargement / reduction ratio is changed to a mode as shown in FIG. 22B, for example (step S42).
- the association between the data based on the pressure shown in FIG. 22B and the enlargement / reduction ratio has a smaller (gradual) slope of the graph representing the correspondence than the mode shown in FIG. For this reason, when the data based on the pressure is reduced from the point E to the point F in FIG.
- the change in the reduction ratio with respect to the decrease is also small (slow). Therefore, when the operator increases the data based on the press up to point C and enlarges the image too much, and when the image is reduced by reducing the data based on the press, the operator can reduce the image finely. And a desired enlargement / reduction ratio can be easily reached.
- FIG. 23 is a graph showing an example of the time change of data based on the press by the operation of the operator, like FIG. 7 described in the first embodiment. Also in FIG. 23, the data based on the pressure by the operation of the operator is maintained substantially constant from the point A to the point B, and as shown in FIG. Correlation with the reduction ratio X is performed (step S21 in FIG. 20).
- step S42 the association between the data based on the pressure shown in FIG. 22C and the enlargement / reduction ratio is changed to a mode as shown in FIG. 22C, for example (step S42).
- the correlation between the data based on the pressure shown in FIG. 22C and the enlargement / reduction ratio is also made smaller (slower) than the aspect shown in FIG. For this reason, when the data based on the press is increased from the point E to the point F in FIG.
- the control unit 10 according to the difference between the reference regarding the data based on the pressure and the data based on the pressure detected by the pressure detection unit 40. Control is performed to increase or decrease the value of a parameter associated with a predetermined process. However, in the present embodiment, the control unit 10 is different in the amount by which the value of the parameter is increased or decreased before and after the data based on the pressure detected by the pressure detection unit 40 increases or decreases from one to the other. To control.
- the “amount to increase / decrease the value of the parameter” is based on the pressure according to the difference between the reference regarding the data based on the pressure and the data based on the pressure detected by the pressure detection unit 40 in the above-described example.
- the control unit 10 reduces the amount of the parameter value less than before. It is preferable to control as described above. Similarly, after the data based on the pressure detected by the pressure detection unit 40 changes from decrease to increase, the control unit 10 controls the parameter value to increase less than before. Is preferred. Further, in the present embodiment, in order to reduce the change in the enlargement / reduction ratio with respect to the increase / decrease in the data based on the pressure, for example, when a slide operation is detected in step S22 in FIG. It is preferable to return to the association between the data based on the pressure and the enlargement / reduction ratio.
- FIG. 24 is a flowchart for explaining processing of the electronic device 4 according to another example of the fourth embodiment.
- FIG. 24 is a flowchart for explaining processing performed in the enlargement / reduction mode shown as step S ⁇ b> 15 in FIG. 3, after the reference regarding the data based on pressing is set, as in FIG. 20.
- step S41 of FIG. 20 when it is determined that a predetermined operation has been performed by the operator, the manner of associating the data based on the pressure with the enlargement / reduction ratio is changed.
- the case where it is determined that a predetermined operation has been performed is the case where the data P based on the pressure exceeds the data Pmax based on the maximum pressure and then starts to decrease, and the case where the data is based on the pressure. It was assumed that the data P started to increase after falling below the data P min based on the minimum pressing.
- the aspect of changing the association between the data based on the press and the enlargement / reduction ratio is the same as the example described above. Change the content of the operation. That is, in this example, as shown in step S51 of FIG. 24, when the data P based on the pressure changes from increase to decrease, and when the data P based on the pressure changes from decrease to increase, it is based on the pressure. Change the association between data and scaling ratio. In short, in this example, when the data P based on the pressure changes from increase to decrease, even if P max does not exceed P max, and when the data P based on the pressure changes from increase to decrease, it does not fall below P min. In both cases, as in the example described above, the association between the data based on the press and the enlargement / reduction ratio is changed.
- FIG. 25 is a graph showing an example of the time change of data based on the press by the operation of the operator, as in FIG.
- the data based on the pressure by the operator's operation is maintained almost constant from the point A to the point B, and as shown in FIG. Association with the reduction ratio X is performed (step S21 in FIG. 24).
- the processing so far is the same as that described with reference to FIG. 6 and the like in the first embodiment.
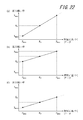
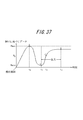
- FIG. 27 is a graph showing an example of the time change of data based on the press by the operation of the operator, as in FIG.
- the data based on the pressure by the operator's operation is maintained almost constant from the point A to the point B, thereby expanding the data P based on the pressure as shown in FIG. Association with the reduction ratio X is performed (step S21 in FIG. 24).
- the processing so far is the same as that described with reference to FIG. 6 and the like in the first embodiment.
- step S51 after the point B, that is, after the reference regarding the data based on the pressure is set, the data based on the pressure by the operation of the operator decreases to the point C and starts increasing at the point C. (Yes in step S51). Therefore, in this case, even data based on a press is not less than the P min, at the time of t 2, the correspondence between the data and the scaling factor based on a press, for example, as shown in FIG. 28 (B), pressing The mode based on the point at which the data based on P1 is P 1 is changed (step S42). The association between the data based on the press shown in FIG.
- the processing according to the above-described example may be performed continuously every time data based on pressing increases and decreases.
- Such an example will be described.
- FIG. 29 is a graph showing an example of the time change of the data based on the press by the operation of the operator, similarly to FIG. 25 and FIG. Also in FIG. 29, the data based on the pressure by the operation of the operator is maintained substantially constant from the point A to the point B, and as shown in FIG. Correlation with the reduction ratio X is performed (step S21 in FIG. 20).
- step S42 the control part may be changed to a mode based on the point at which the data based on the pressure becomes P min , for example. .
- the correspondence between the data based on the pressure shown in FIG. 30C and the enlargement / reduction ratio is smaller (slower) than the aspect shown in FIG. 30B. . For this reason, when the data based on the pressure increases after the point D in FIG. 29 by the operation of the operator, the change in the enlargement ratio with respect to the increase in the data based on the pressure is further reduced (slowly).
- the operator when the operator increases the data based on the pressure from the point B to the point C and enlarges the image too much, and when the image is reduced by reducing the data based on the pressure, the operator The image can be reduced finely. Further, in this example, even if the operator reduces the data based on the pressure from the point C to the point D and reduces the image too much, the operator enlarges the image by increasing the data based on the pressure. The operator can enlarge the image more finely. For this reason, the operator can reach the desired enlargement / reduction ratio more easily.
- the enlargement / reduction with respect to the increase / decrease in the data based on the press The rate change becomes smaller and smaller. Therefore, even if the operator intends to keep the data based on the pressure constant, when the data based on the pressure detected by the pressure detection unit 40 repeats a minute increase / decrease, the enlargement / reduction with respect to the increase / decrease in the data based on the pressure is performed. The change in the rate may gradually become smaller (gradually) against the operator's intention.
- a measure for reducing (gradually) the change in the enlargement / reduction ratio with respect to the increase / decrease in the data based on the pressure is taken. You can also avoid it.
- a minute change width ⁇ P of the data based on the pressure may be set. And even if the data based on the pressure changes within such a small change width ⁇ P, the association between the data based on the pressure and the enlargement / reduction ratio can be prevented from being changed.
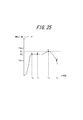
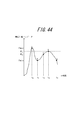
- FIG. 31 is a graph illustrating an example of a time change of data based on a press by an operator's operation. Also in FIG. 31, during the period from point A to point B, by the data based on a press by the operation of the operator is maintained substantially constant, at a time point t 1, the data P based on a press and scaling factor X Are associated.
- the point B that is, after the standard regarding the data based on the pressure is set
- the data based on the pressure by the operator's operation slightly increases to the point C, and starts decreasing at the point C. ing.
- the increase in the data based on the pressure up to the point C is within the predetermined change width ⁇ P of the data based on the pressure, the association between the data based on the pressure and the enlargement / reduction ratio may not be changed.
- the electronic device 5 according to the fifth embodiment can be realized by basically the same device configuration and control as those of the electronic device 1 described in the first embodiment, except for the above points. For this reason, below, the description which becomes the same content as having demonstrated in 1st Embodiment is abbreviate
- the control unit 10 determines whether or not the data based on the pressure detected by the pressure detection unit 40 satisfies a predetermined condition. However, in the present embodiment, the control unit 10 determines whether the data based on the pressure detected by the pressure detection unit 40 satisfies a predetermined condition, and determines the pressure detected by the pressure detection unit 40. After the base data has changed from increasing to decreasing, it is determined whether or not the data has decreased to increasing.
- FIG. 32 is a flowchart for explaining processing centering on setting of a standard regarding data based on pressing in the present embodiment.
- Set criteria for data based on That is, in the present embodiment, the data based on the pressure by the operation of the operator changes from increasing to decreasing without moving the position of the finger or the like operated by the operator on the touch sensor 20, and then increases from the decrease. Then, “standard for data based on pressure” is set. It should be noted that in setting the “reference for data based on pressure”, the “reference for data based on pressure” may be set even if the position of a finger or the like operated on the touch sensor 20 moves.
- the control unit 10 monitors the contact detected by the touch sensor 20 and the pressure detected by the pressure detection unit 40 (step S11). In particular, in the present embodiment, it is preferable that the control unit 10 performs monitoring while storing a history of changes in data based on the pressure detected by the pressure detection unit 40 in the storage unit 60.
- the control unit 10 determines whether or not the data based on the pressure detected by the pressure detection unit 40 changes from increase to decrease and then increases. Is determined (step S61). In this case, in order to notify the operator that the “reference for data based on pressing” is set by this operation, for example, in the display unit 30, “press the touch sensor strongly, then weaken and press again. "Please do” may be displayed.
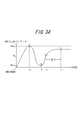
- FIG. 33 is a graph for explaining an example of a time change of data based on a press by an operator's operation.
- the horizontal axis represents the passage of time
- the vertical axis represents data based on the pressure detected by the pressure detection unit 40.
- the operator performs a gradual operation of increasing the pressure from the start of pressing (operation start) on the touch sensor 20, was allowed to turn to decrease the pressing from the increase in the point A (i.e. time point t 0) It represents the situation. Further, as shown in FIG. 33, the operator performs an operation to reduce gradually pressed from point A (i.e. time point t 0), started to increase the pressure from decreasing at the point B (i.e. time point t 1) It shows the state of letting.
- step S61 If it is determined in step S61 that the data based on the pressure has not changed from increase to decrease after the change from increase to decrease, the control unit 10 returns to step S11 and continues the process. On the other hand, if it is determined in step S61 that the data based on the pressure has changed from the increase to the decrease and then changed from the decrease to the increase, the control unit 10 determines the data based on the pressure based on the data based on the pressure detected during the period.
- the reference regarding is set (step S13). That is, in the present embodiment, the control unit 10 sets a reference for data based on pressure when the data based on the pressure detected by the pressure detection unit 40 changes from increase to decrease and then decreases. To control. In the example shown in FIG.
- a reference (P 0 ) relating to data based on the pressure is set at the time t 1 .
- the control unit 10 when setting the reference (P 0 ) related to the data based on the pressure, the control unit 10, for example, as shown in FIG. 33, the data based on the pressure detected at the point A (that is, at the time t 0 ).
- An average value of (P max ) and data (P min ) based on the pressure detected at point B (that is, at time t 1 ) can be calculated.
- the calculation is not limited to the average value as described above, and various calculations can be performed. For example, instead of simply calculating the average value of P max and P min as described above, for example, the time from the start of the operation until the point A is reached and / or the time from the point A to the point B.
- the time factor When taking into account temporal factors, for example, when the time from the start of the operation until reaching point A is longer than the time from reaching point A to point B, the average value of P max and P min A value closer to Pmax can be set as a reference for data based on pressure. It should be noted that the value close to P max is determined based on the ratio of the time from the start of the operation until the point A is reached and the time from the point A to the point B. Can do.
- a reference (P 0 ) regarding data based on pressure may be set based only on data (P max ) based on pressure detected at point A (that is, at time t 0 ), or point B
- the reference (P 0 ) related to the data based on the pressure may be set based only on the data based on the pressure (P min ) detected at the time point (t 1 ).
- the reference (P 0 ) relating to the data based on the pressure that is the predetermined value stored in the storage unit 60 in advance. Can also be set.
- step S13 the control unit 10 controls the corresponding functional unit so as to notify the operator that the reference regarding the data based on the press is set (step S14). ).
- step S ⁇ b> 14 the operator is notified that the reference for the data based on the pressure has been set by changing the data based on the pressure from the increase to the decrease and then the decrease to the increase. Therefore, the control unit 10 can control the tactile sensation providing unit 40 so as to present the tactile sensation to the operator by vibrating the touch sensor 20, for example.
- the display on the display unit 30 is changed, or a predetermined sound is output from a sound output unit (not shown), thereby setting a standard for data based on pressing. It is also possible to notify the operator that this has been done.
- Figure 33 together with standards for data based on a press at the time of t 1 (B point) is set, the operator is informed of the fact that standards for data based on a press is set.
- the subsequent processing can be performed in the same manner as in the first embodiment described above. Further, the processing performed in the enlargement / reduction mode as step S15 in FIG. 32 can be performed in the same manner as in the first embodiment as described in FIG.
- step S21 in FIG. 5 the association between the data based on the pressing and the enlargement / reduction ratio shown in step S21 in FIG. 5 can be performed in the same manner as in the first embodiment, as described in FIG.
- the control unit 10 performs the data (P) based on the pressure and the enlargement / reduction based on the reference (P 0 ) regarding the data based on the pressure set in step S ⁇ b> 13 in FIG. 32.
- Control is performed to associate with the rate (X).
- P max on the horizontal axis represents data based on the pressure detected at point A (ie, at time t 0 )
- P min represents data based on the pressure detected at point B (ie, at time t 1 ).
- the data based on the maximum or minimum pressure that can be detected by the pressure detection unit 40 is determined by various conditions such as physical characteristics and arrangement of the pressure detection unit 40, and exceeds the data based on the maximum pressure, Data based on the pressure below the minimum pressure cannot be detected. Therefore, P max is a value of data based on the pressure below the data based on the maximum pressure that can be actually detected by the pressure detection unit 40. Similarly, P min is the minimum value that can be actually detected by the pressure detection unit 40. It becomes the value of the data based on the press more than the data based on the press. That is, P max and P min are values set in a range in which the pressure detection unit 40 can accurately and reliably detect data based on the pressure.
- control unit 10 sets a reference for data based on pressure when the data based on the pressure detected by the pressure detection unit 40 changes from increase to decrease and then decreases to increase. Control.
- the control unit 10 converts the data based on the pressure when the data based on the pressure is changed from the increase to the decrease and the data based on the pressure when the data based on the pressure is changed from the decrease to the increase. Based on this, it is possible to control to set a reference for data based on pressure.
- the control unit 10 returns to step S22 and continues the process.
- FIG. 34 is a graph showing an example of the time change of data based on the press by the operation of the operator, as in FIG.
- FIG. 34 after the point B described in FIG. 33, that is, after the reference regarding the data based on the pressure is set, an increase in data based on the pressure by the operator's operation is detected from the point C to the point D. ing. In such a case, neither enlargement nor reduction is performed until the reference P 0 regarding the data based on the pressure is reached, that is, between the times t 1 and t 2 .
- the image displayed on the display unit 30 as the data based on the pressure detected by the pressure detection unit 40 increases with reference to P 0.
- FIG. 35 is also a graph showing another example of the time change of the data based on the press by the operation of the operator, similarly to FIG.
- the point B that is, after the reference regarding the data based on the pressure is set
- an increase in data based on the pressure by the operation of the operator is detected until the point D.
- the data based on pressure turned to decrease and decreased from point E to point G
- point G the data based on pressure turned to increase and increased from point H to point I. Has been.
- the image displayed on the display unit 30 is enlarged between the times t 2 and t 3 , and is displayed on the display unit 30 between the times t 4 and t 6.
- the image to be displayed is reduced, and the image displayed on the display unit 30 is enlarged again between the times t 7 and t 8 .
- the time t 5 it has returned to the scaling ratio of the time the standards for data based on a press is set. That is, at the point F, an image having the same enlargement / reduction ratio as that at the time when the reference regarding the data based on the pressure is set is displayed.
- the data P max based on the pressure is exceeded or less than the data P min based on the pressure, and both enlargement and reduction are performed. I will not.
- FIG. 36 is a graph showing the change over time of the enlargement / reduction ratio of the image displayed on the display unit 30 when the data based on the pressure changes over time as shown in FIG.
- the horizontal axis represents the passage of time
- the vertical axis represents the enlargement / reduction ratio of the image displayed on the display unit 30.
- a specific example of display on the display unit 30 when the operator performs an operation on the electronic device 5 according to this embodiment can be performed in the same manner as described in the first embodiment in FIG.
- the operator performs a slide operation on the touch sensor 20 before the reference regarding the data based on the pressure is set, that is, before the transition to the enlargement / reduction mode.
- the map of Japan displayed on the display unit 30 can be arbitrarily slid.
- the data based on the pressure is changed from the increase to the decrease, and then the decrease is changed to the increase.
- the standard regarding the data based on is set, and the electronic device 5 shifts to the enlargement / reduction mode.
- the present embodiment if the casing of the electronic device is small, using the fingertip of the same hand while holding the electronic device with one hand, enlargement or reduction similar to the conventional pinch operation Etc. can be performed. Further, according to the present embodiment, when an operation is performed on the touch sensor 20 regardless of the size of the electronic device, the operation is performed with only one finger, that is, by pressing only one place. be able to. Furthermore, according to the present embodiment, since the operation can be started at an arbitrary position of the touch sensor 20, the operation can be smoothly performed with a small number of procedures. Further, according to the present embodiment, it is not necessary to display a dedicated object for performing a specific process such as enlargement or reduction on the display unit, so that the display area of the display unit can be used effectively.
- the processing by the control unit 10 is changed in the above-described fifth embodiment. That is, the sixth embodiment changes the process of step S25 described in FIG. 5 in the electronic device 5 according to the fifth embodiment. Specifically, the electronic device 6 according to the sixth embodiment responds to the difference between the reference P 0 related to the data based on the pressure and the data P based on the pressure detected by the pressure detection unit 40 in the enlargement / reduction mode. Thus, the speed at which the image displayed on the display unit 30 is enlarged or reduced is changed.
- the electronic device 6 according to the sixth embodiment is basically realized by the same device configuration and control as those of the electronic device 5 and the electronic device 2 described in the fifth and second embodiments, except for the above points. can do. For this reason, below, the description which becomes the same content as having demonstrated in 5th and 2nd embodiment is abbreviate
- the processing of the electronic device 6 according to the sixth embodiment can be performed according to the flowchart described with reference to FIG. 12 in the second embodiment.
- FIG. 38 is a graph showing an example of the time change of data based on the press by the operation of the operator, similarly to FIG. 34 and the like.
- the data based on the pressure by the operation of the operator increases to reach the point E through the point C.
- the case where the point D is reached by further increasing the data based on the press by the operation of the operator is shown at the same time.
- the reference P 0 on the data based on a press is set, based on the reference P 0 on the data based on the pressing, set some stages of data based on a press above and below the said reference.
- FIG. 38 shows only the stage of data based on a press which is set higher than the reference P 0 on the data based on a press. Further, in FIG. 38, as an example, only two data stages based on the pressure set for each 1N are shown for data based on the pressure larger than the reference P 0 regarding the data based on the pressure.
- the level of the data based on the pressure it is not essential that the interval between the levels of the data based on the pressure be 1N, and it is also possible to set the data at a denser interval. You can also set it with. It is not essential to set two such stages, and more stages may be set, or a very large number of stages may correspond to changes in data based on pressure in an analog manner. May be. Furthermore, it is not essential to set the stage of data based on such a press in advance, and the above-described stage may be calculated every time a press is detected.
- the speed displayed on the display unit 30 is enlarged as the speed.
- ⁇ correspond.
- the speed ⁇ is used as the speed at which the image displayed on the display unit 30 is enlarged at the data stage based on the pressure from P 0 + 1N to P 0 + 2N.
- the speed ⁇ can be a speed at which an image displayed on the display unit 30 is enlarged faster than the speed ⁇ . That is, in this case, when the operator operates the touch sensor 20, the image displayed on the display unit 30 is enlarged at a higher speed when the greater pressure is maintained.
- FIG. 39 is a graph showing another example of the time change of data based on the press by the operation of the operator, as in FIG.
- the point B that is, after the reference regarding the data based on the pressure is set
- the data based on the pressure increases and reaches the reference P 0 regarding the data based on the pressure at the C point.
- the case where the point D is reached due to the decrease in the data based on the point and the case where the point E is reached due to the further decrease in the data based on the press by the operator's operation are shown.
- Figure 39 shows only the stage of data based on a press which is set lower than the reference P 0 on the data based on a press.
- FIG. 39 as an example, only two data stages based on the pressure set for each 1N are shown for data based on the pressure smaller than the reference P 0 regarding the data based on the pressure.
- it is not essential to set the interval between the levels of the data based on the pressure every 1N, and it is also necessary to set two such levels. is not.
- the speed ⁇ can be a speed at which an image displayed on the display unit 30 is reduced faster than the speed ⁇ . That is, in this case, when the operator operates the touch sensor 20, the image displayed on the display unit 30 is reduced at a higher speed when the smaller pressure is maintained.
- FIG. 40 is a graph showing still another example of the time change of data based on the press by the operation of the operator.
- the data based on the pressing increases and reaches the reference P 0 regarding the data based on the pressing at the C point.
- the data based on the data once decreases and then increases, and then increases and decreases.
- Figure 40 the step of data based on a press which is set lower than the reference P 0 on the data based on a press, and both stages of the data based on the high set pressed than the reference P 0 on the data based on a press Show. Note that in the example shown in FIG. 40, for the data based on the pressure larger than the reference P 0 and the data based on the small pressure related to the data based on the pressure, two stages of data based on the pressure set for each 1N are performed. It is shown. Further, in FIG. 40, similar to FIG.
- phase of the data based on a press from P 0 to P 0 + 1N made to correspond to the speed alpha
- stage of the data based on a press from P 0 + 1N to P 0 + 2N Is associated with a speed ⁇ .
- FIG. 40 similar to FIG. 39, in correspondence to the rate ⁇ is the phase of the data based on a press from P 0 to P 0 -1N, based on the pressure from P 0 -1N to P 0 -2N
- a speed ⁇ is associated with the data stage.
- FIG. 41 is a graph showing the change over time of the enlargement / reduction ratio of the image displayed on the display unit 30 when the data based on the pressure changes over time as shown in FIG. 41.
- the horizontal axis represents the passage of time
- the vertical axis represents the enlargement / reduction ratio of the image displayed on the display unit 30.
- FIG. 40 and FIG. 41 are compared, since the mode does not shift to the enlargement / reduction mode from the operation start time to time t 1 , that is, before the reference relating to the data based on the pressure is set, it is based on the pressure. Although the data is changing, it can be seen that the scaling ratio does not change from the standard. Moreover, since as described above, the period from time t 1 to t 2, but has been shifted to the scale mode, which as described above, it does not reach the reference P 0 on the data based on a press, Fig. 41 As shown in the figure, neither enlargement nor reduction is performed.
- the number of operations performed by the operator can be reduced, and the operation procedure by the operator can be reduced. it can.
- the image displayed on the display unit 30 is enlarged at such a large speed, so that the operator performs the operation with a large pressure. Since a short time is required, the burden on the operator of applying a pressing force can be reduced.
- the 7th Embodiment changes the process by the control part 10 in 5th Embodiment mentioned above. That is, in the electronic device 5 according to the fifth embodiment, the seventh embodiment changes the mode of the process in step S21 described in FIG. Specifically, in the electronic device 7 according to the seventh embodiment, after the reference regarding the data based on the press is set, the manner of associating the data based on the press with the enlargement / reduction ratio as described in FIG. To change.
- the electronic device 7 according to the seventh embodiment is realized by basically the same device configuration and control as the electronic device 5 and the electronic device 3 described in the fifth and third embodiments described above except for the above points. can do. For this reason, below, the description which becomes the same content as having demonstrated in 5th and 3rd Embodiment is abbreviate
- the change in the data based on the pressure from P min to P 0 is represented by X min A linear change in the enlargement / reduction ratio from 1 to X0 was associated.
- the change in data based on the pressure from P 0 to P max is associated with the linear change in the enlargement / reduction ratio from X 0 to X max .
- FIG. 6 shows an example in which the reference P 0 related to the data based on the pressure is set just around the middle between P max and P min for the sake of simplicity of explanation.
- the relationship between the data based on the pressure and the enlargement / reduction ratio is As shown in FIG. 17A, the graph is a straight line from P min to P max .
- the vertical axis and the horizontal axis are set differently from those in FIG.
- the graph changes in slope at the point of P 0 .
- the reference P 0 related to the data based on the pressure is set to a position smaller than the middle of P min and P max , the relationship between the data based on the pressure and the enlargement / reduction ratio is shown in FIG. as shown in C), the graph, the slope of which varies at the time of P 0 Again.
- the reference P regarding the data based on the pressure is used. Before and after 0 , correction is performed so that the amount of change in the enlargement / reduction ratio for the data based on the pressure does not change significantly. Specifically, for example, when the association shown in FIG. 17B is about to be performed, the control unit 10 corrects these associations, for example, as shown in FIG. Correspondence between the data based on the press and the enlargement / reduction ratio is performed.
- the reference P 0 regarding the data based on the press is P min (the press when the enlargement / reduction ratio is the minimum X min). Is set in the middle of the data P) and P max based on. Therefore, the correlation between the data based on the pressure and the enlargement / reduction ratio is a graph in which the inclination does not change before and after P 0 , and the operator changes the data based on the pressure across the reference P 0 regarding the data based on the pressure. Even if it makes it, it does not give a sense of incongruity to the followability of enlargement or reduction.
- control unit 10 corrects these associations and based on the press as shown in FIG. 18B, for example. Correspondence between data and enlargement / reduction ratio is performed.
- the reference P 0 regarding the data based on the pressure is P min and P max (the enlargement / reduction ratio is the maximum X max) . It is set in the middle with the data P) based on the pressing of time. Therefore, the correlation between the data based on the pressure and the enlargement / reduction ratio is a graph in which the inclination does not change before and after P 0 , and the operator changes the data based on the pressure across the reference P 0 regarding the data based on the pressure. Even if it makes it, it does not give a sense of incongruity to the followability of enlargement or reduction.
- control unit 10 responds to the difference between the reference on the data based on the pressure and the data based on the pressure detected by the pressure detection unit 40, as in the fifth embodiment. Then, control is performed so as to increase or decrease the value of the parameter associated with the predetermined process.
- control unit 10 includes a case where the data based on the pressure detected by the pressure detection unit 40 increases and a case where the data based on the pressure detected by the pressure detection unit 40 decreases. The amount of increase or decrease in the parameter value is controlled to be equal.
- the “amount to increase / decrease the value of the parameter” is based on the pressure according to the difference between the reference regarding the data based on the pressure and the data based on the pressure detected by the pressure detection unit 40 in the above-described example. This corresponds to the amount of change in the enlargement / reduction ratio for the data.
- the amount of change in the enlargement / reduction ratio with respect to the data based on the press is large before and after the reference P 0 regarding the data based on the press.
- the mode of correction so as not to change is not limited to that described with reference to FIG. 18, and various modes can be assumed as described in the third embodiment.
- the present embodiment even if the operator changes the pressure across the reference P 0 regarding the data based on the pressure, the amount of increase or decrease in the value of the parameter associated with the predetermined process is greatly changed. Without being almost equal. Therefore, according to the present embodiment, when the operator changes the pressure across the reference P 0 regarding the data based on the pressure, the followability when the image displayed on the display unit 30 is enlarged or reduced. There is no sense of discomfort.
- the eighth embodiment also changes the processing performed by the control unit 10 in the fifth embodiment described above. That is, the eighth embodiment changes the processing after step S25 described in FIG. 5 in the electronic device 1 according to the fifth embodiment. That is, in the electronic device 8 according to the eighth embodiment, the reference regarding the data based on the press is set, and a predetermined operation is performed during the process of enlarging or reducing the image according to the data based on the press. If it is determined that it has been performed, the manner of associating the data based on the press and the enlargement / reduction ratio as described with reference to FIG. 6 is changed.
- the electronic device 8 according to the eighth embodiment is basically realized by the same device configuration and control as those of the electronic device 5 and the electronic device 4 described in the fifth and fourth embodiments, except for the above points. can do. For this reason, hereinafter, descriptions that are the same as those described in the fifth and fourth embodiments are omitted as appropriate.
- the operator enlarges or reduces the image too much during the process of enlarging or reducing the image displayed on the display unit 30 by the electronic device 5 according to the fifth embodiment.
- a measure for easily correcting to a desired enlargement / reduction ratio is provided.
- the processing of the electronic device 8 according to the eighth embodiment can be performed based on the flowchart described in FIG. 20 in the fourth embodiment.
- step S25 in FIG. 20 the control unit 10 increases the data P based on the pressure detected by the pressure detection unit 40, and the value of the data based on the pressure exceeds Pmax . It is then determined whether or not it has started to decrease (step S41). If it is determined in step S41 that the data P based on the pressure has turned to decrease after exceeding Pmax , the control unit 10 changes the association between the data based on the pressure and the enlargement / reduction ratio (step S42).
- step S41 the control unit 10 determines that the data P based on the pressure detected by the pressure detection unit 40 has decreased, and has increased after the value of the data based on the pressure falls below Pmin . Even in this case, the process of step S42 is performed. Even if it is determined in step S41 that the data P based on the pressure has decreased below P min and then increased, the control unit 10 changes the association between the data based on the pressure and the enlargement / reduction ratio (step S42). .
- step S42 when the association between the data based on the pressure and the enlargement / reduction ratio is changed, the control unit 10 returns to step S22 and continues the process.
- the control unit 10 returns to step S22 and continues the process without performing the process of step S42.
- FIG. 42 is a graph showing an example of the time change of data based on the press by the operation of the operator, like FIG. 34 described in the fifth embodiment.
- the data based on the pressure by the operator's operation changed from increase to decrease and then decreased to increase after point A to point B.
- the data P based on the pressure and the enlargement / reduction ratio X are associated with each other (step S21 in FIG. 20).
- the processing up to this point is the same as that described with reference to FIG. 6 in the fifth embodiment described above.
- the data based on the pressure by the operation of the operator passes the point C and the point D and exceeds the point P max. Until the point E decreases (Yes in step S41). Accordingly, in this case, the association between the data based on the pressure and the enlargement / reduction ratio is changed to a mode as shown in FIG. 22B, for example (step S42).
- the association between the data based on the pressure shown in FIG. 22B and the enlargement / reduction ratio has a smaller (gradual) slope of the graph representing the correspondence than the mode shown in FIG. For this reason, when the data based on the pressure is decreased from the F point to the G point in FIG.
- the data based on the pressure is reduced.
- the change in the reduction ratio with respect to the decrease is also small (slow). Therefore, when the operator increases the data based on the press to the point D to enlarge the image too much, and when the image is reduced by reducing the data based on the press, the operator can reduce the image finely. And a desired enlargement / reduction ratio can be easily reached.
- FIG. 43 is a graph showing an example of the time change of data based on the press by the operation of the operator, like FIG. 34 described in the first embodiment. Also in FIG. 43, as shown in FIG. 22 (A), the data based on the pressure by the operator's operation changed from increase to decrease and then decreased to increase after point A to point B. The data P based on the pressure and the enlargement / reduction ratio X are associated with each other (step S21 in FIG. 20).
- the data based on the pressing by the operator's operation reaches the reference P 0 regarding the data based on the pressing at the C point. After that, it started to decrease. Then, the data based on the pressure that has turned to decrease after point C passes through point D and point E, decreases below Pmin to point F, and starts increasing at point F (Yes in step S41). Therefore, in this case, the association between the data based on the pressure and the enlargement / reduction ratio is changed to a mode as shown in FIG. 22C, for example (step S42).
- the control unit 10 according to the difference between the reference regarding the data based on the pressure and the data based on the pressure detected by the pressure detection unit 40. Control is performed to increase or decrease the value of a parameter associated with a predetermined process. However, in the present embodiment, the control unit 10 is different in the amount by which the value of the parameter is increased or decreased before and after the data based on the pressure detected by the pressure detection unit 40 increases or decreases from one to the other. To control.
- the “amount to increase / decrease the value of the parameter” is based on the pressure according to the difference between the reference regarding the data based on the pressure and the data based on the pressure detected by the pressure detection unit 40 in the above-described example.
- the control unit 10 reduces the amount of the parameter value less than before. It is preferable to control as described above. Similarly, after the data based on the pressure detected by the pressure detection unit 40 changes from decrease to increase, the control unit 10 controls the parameter value to increase less than before. Is preferred. Further, in the present embodiment, in order to reduce the change in the enlargement / reduction ratio with respect to the increase / decrease in the data based on the pressure, for example, when a slide operation is detected in step S22 in FIG. It is preferable to return to the association between the data based on the pressure and the enlargement / reduction ratio.
- FIG. 24 is a flowchart for explaining processing performed in the enlargement / reduction mode shown as step S ⁇ b> 15 in FIG. 3, after the reference regarding the data based on pressing is set, as in FIG. 20.
- step S41 of FIG. 20 when it is determined that a predetermined operation has been performed by the operator, the manner of associating the data based on the pressure with the enlargement / reduction ratio is changed.
- the case where it is determined that a predetermined operation has been performed is the case where the data P based on the pressure exceeds the data Pmax based on the maximum pressure and then starts to decrease, and the case where the data is based on the pressure. It was assumed that the data P started to increase after falling below the data P min based on the minimum pressing.
- the aspect of changing the association between the data based on the press and the enlargement / reduction ratio is the same as the example described above. Change the content of the operation. That is, in this example, as shown in step S51 of FIG. 24, when the data P based on the pressure changes from increase to decrease, and when the data P based on the pressure changes from decrease to increase, it is based on the pressure. Change the association between data and scaling ratio. In short, in this example, when the data P based on the pressure changes from increase to decrease, even if P max does not exceed P max, and when the data P based on the pressure changes from increase to decrease, it does not fall below P min. In both cases, as in the example described above, the association between the data based on the press and the enlargement / reduction ratio is changed.
- FIG. 44 is a graph showing an example of the time change of data based on the press by the operation of the operator, as in FIG.
- the data based on the pressure by the operation of the operator changed from increase to decrease and then decreased to increase after point A to point B.
- Correspondence between the data P based on the pressure and the enlargement / reduction ratio X is performed (step S21 in FIG. 24). The processing up to this point is the same as that described with reference to FIG. 6 in the fifth embodiment described above.
- the enlargement / reduction ratio has a smaller (gradual) slope of the graph representing the correspondence than the mode shown in FIG. Therefore, when the data based on the pressure is reduced from the point D to the point E in FIG. 44 by the operator's operation (corresponding to the decrease from P 1 to P min in FIG. 26B ), the data based on the pressure is reduced.
- the change in the reduction ratio with respect to the decrease is also small (slow). Therefore, also in this example, when the operator increases the data based on the press to the point D and enlarges the image too much, and when the image is reduced by reducing the data based on the press, the operator finely selects the image. Can be reduced, and a desired enlargement / reduction ratio can be easily reached.
- FIG. 45 is a graph showing an example of the time change of data based on the press by the operation of the operator, as in FIG.
- the data based on the pressure by the operator's operation changed from increase to decrease and then decreased to increase after point A to point B.
- Correspondence between the data P based on the pressure and the enlargement / reduction ratio X is performed (step S21 in FIG. 24). The processing so far is the same as that described with reference to FIG. 6 and the like in the first embodiment.
- step S42 pressing The mode based on the point at which the data based on P1 is P 1 is changed (step S42).
- the association between the data based on the press shown in FIG. 28B and the enlargement / reduction ratio has a smaller (gradual) slope of the graph representing the correspondence than the mode shown in FIG. Therefore, when the data based on a press by the operation of the operator is increased from the point E in FIG. 45 to point F (corresponding to an increase from P 1 to P max in FIG. 28 (B)), the data based on a press
- the change of the reduction ratio with respect to the increase is also small (slow).
- the processing according to the above-described example may be performed continuously every time data based on pressing increases and decreases.
- Such an example will be described.
- FIG. 46 is a graph showing an example of the time change of data based on the press by the operator's operation, similarly to FIG. 44 and FIG. Also in FIG. 46, as shown in FIG. 30 (A), the data based on the pressure by the operator's operation changed from increase to decrease after the change from increase to decrease between point A and point B.
- the data P based on the pressure and the enlargement / reduction ratio X are associated with each other (step S21 in FIG. 20).
- the data based on the pressure decreases before the point E before the point P min decreases.
- the data based on the press by the operation of the operator has started to increase (Yes in step S51). Therefore, in this case, at the time of t 4, the correspondence between the data and the scaling factor based on a press, for example, as shown in FIG. 30 (C), aspect data based on the pressed relative to the point where the P2 (Step S42).
- step S42 the control part may be changed to a mode based on the point at which the data based on the pressure becomes P min , for example. .
- the correspondence between the data based on the pressure shown in FIG. 30C and the enlargement / reduction ratio is smaller (slower) than the aspect shown in FIG. 30B. . For this reason, when the data based on the pressure increases after the point E in FIG. 46 by the operation of the operator, the change in the enlargement ratio with respect to the increase in the data based on the pressure is further reduced (slowly).
- the operator when the operator increases the data based on the pressure from the point C to the point D to enlarge the image too much, and when the image is reduced by reducing the data based on the pressure, the operator The image can be reduced finely. Further, in this example, even when the operator reduces the data based on the pressure from the point D to the point E and reduces the image too much, the operator enlarges the image by increasing the data based on the pressure. The operator can enlarge the image more finely. For this reason, the operator can reach the desired enlargement / reduction ratio more easily.
- the enlargement / reduction with respect to the increase / decrease in the data based on the press The rate change becomes smaller and smaller. Therefore, even if the operator intends to keep the data based on the pressure constant, when the data based on the pressure detected by the pressure detection unit 40 repeats a minute increase / decrease, the enlargement / reduction with respect to the increase / decrease in the data based on the pressure is performed. The change in the rate may gradually become smaller (gradually) against the operator's intention.
- a measure for reducing (gradually) the change in the enlargement / reduction ratio with respect to the increase / decrease in the data based on the pressure is taken. You can also avoid it.
- a minute change width ⁇ P of the data based on the pressure may be set. In the enlargement / reduction mode, even if the data based on the pressure changes within such a small change width ⁇ P, the association between the data based on the pressure and the enlargement / reduction ratio can be prevented from being changed.
- FIG. 47 is a graph showing an example of the time change of data based on the press by the operation of the operator. Also in FIG. 47, during the period from point A to point B, by turned from decreasing to increasing after the data based on a press by the operation of the operator has turned from increase to decrease, at time of t 1, based on a press The data P and the enlargement / reduction ratio X are associated with each other. In the example of FIG. 47, after the point B, that is, after the reference regarding the data based on the pressure is set, the data based on the pressure by the operation of the operator slightly increases to the D point after passing through the C point. The point has started to decrease.
- the present invention is not limited to the above embodiment, and many variations or modifications are possible.
- an aspect has been described in which an image such as a map is displayed on the display unit 30 and the image is enlarged or reduced.
- the present invention is not limited to the mode of performing such a process, and is applicable to various scenes in which the value of a parameter associated with a predetermined process is changed according to data based on the pressure applied to the pressure detection unit 40. Can be applied.
- the predetermined processing here may be any processing such as processing associated with an application.
- the volume at the time of reproducing the sound is adjusted according to the difference between the reference relating to the data based on the set pressure and the data based on the pressure detected by the pressure detection unit 40. It can be applied to various processes such as adjusting the playback speed of a moving image displayed on the display unit 30.
- the present invention is preferably applied to an electronic device including a touch sensor, but changes the value of a parameter associated with a predetermined process in accordance with data based on the pressure applied to the pressure detection unit 40. Therefore, the present invention is not limited to a device provided with a touch sensor.
- the present invention can also be applied to an electronic device that includes a press detection unit but does not include a touch sensor. In this case, for example, data based on the pressure on the key or button so that the data based on the pressure when the operator performs an operation on the key or button constituting the normal operation unit can be detected. It is preferable to provide a pressure detection unit for detecting the above.
- a press detection unit that detects data based on pressing when the operator directly presses the casing of the electronic device. It is also possible to consider an aspect that comprises.
- a pressure detection unit can be configured as a touch sensor 20 provided with an arbitrary number of strain gauge sensors and the like.
- such a pressure detection unit can be configured according to a contact detection method in the touch sensor 20.
- a contact detection method in the touch sensor 20.
- the resistance film method if a pressure can be detected from a change in an output signal based on a change in resistance due to a contact area, it can be configured without using a strain gauge sensor.
- the electrostatic capacity method even when the pressure can be detected from the change in the output signal based on the change in the electrostatic capacity, it can be configured without using the strain gauge sensor.
- the tactile sensation providing unit 50 is configured using an arbitrary number of piezoelectric vibrators, is configured by providing a transparent piezoelectric element over the entire surface of the touch sensor 20, or rotates the eccentric motor once in one cycle of the drive signal. It can also be configured in this way. Further, when the pressure detection unit and the tactile sensation providing unit 50 are configured using a piezoelectric element, the pressure detection unit / vibration unit may be configured by sharing the piezoelectric element. This is because the piezoelectric element generates electric power when pressure is applied and deforms when electric power is applied.
- the tactile sensation providing unit 50 detects the data based on the pressure based on the output of the piezoelectric element that also serves as the pressure detection unit, and drives the piezoelectric element when a reference regarding the data based on the pressure is set, for example. Therefore, vibration can be generated.
- the electronic device according to the present invention does not necessarily have such a configuration, and the touch sensor 20 and the display unit 30 can be separated from each other.
- the touch sensor 20 is arranged so as to overlap the upper surface of the display unit 30, the operator can easily recognize the correspondence between the displayed image and the generated vibration.
- the display unit 30 and the touch sensor 20 in the description of the present embodiment may be configured by an integrated device, for example, by providing both functions of the display unit and the contact detection unit on a common substrate. Good.
- a plurality of photoelectric conversion elements such as photodiodes are regularly arranged in a matrix electrode array of pixel electrodes included in the liquid crystal panel.
- This device displays an image with a liquid crystal panel structure, while reflecting the light of the backlight for liquid crystal display at the tip of the pen that contacts the desired position on the panel surface, and the surrounding photoelectric conversion elements receive this reflected light. By doing so, the position of contact can be detected.
- a standard related to data based on pressure is set.
- the standard related to data based on pressure is set based on a reference value stored in the storage unit when the application is started, for example.
- the setting may be made by operating the object for setting the reference regarding the data based on the press by the operator when the application is activated.
- the present invention is not limited to the mode described in the description of the present embodiment for setting the reference regarding the data based on the pressure.
- the control unit determines whether the data based on the pressure detected by the pressure detection unit satisfies a predetermined condition, and based on the pressure detected by the pressure detection unit. Although it is determined whether or not the data has changed from increase to decrease after the data has changed from increase to decrease, the present invention is not limited to this.
- the control unit is data based on the pressure detected by the pressure detection unit. Determine whether the data based on the pressure detected by the pressure detection unit satisfies a predetermined load standard (greater than or equal to a predetermined pressure threshold). Alternatively, it may be determined whether or not the data based on the pressure detected by the pressure detection unit has changed in accordance with a data change curve based on a predetermined pressure.
Abstract
Description
押圧を検出する押圧検出部と、
押圧に基づくデータに関する基準が設定されると、当該基準と前記押圧検出部により検出される押圧に基づくデータとの差に応じて、所定の処理に関連付けられたパラメータの値を増減するように制御する制御部と、
を備えることを特徴とするものである。
押圧を検出する押圧検出部と、
押圧に基づくデータに関する基準が設定されると、当該基準と前記押圧検出部により検出される押圧に基づくデータとの差に応じて、所定の処理に関連付けられたパラメータの値が変化する速度を変更するように制御する制御部と、
を備えることを特徴とするものである。
前記制御部は、前記押圧検出部により検出される押圧に基づくデータの変化が所定期間内に所定範囲内であったら、前記所定期間に検出された押圧に基づくデータに基づいて前記基準を設定するように制御するものである。
前記制御部は、前記押圧検出部により検出される押圧に基づくデータが増加した場合と、前記押圧検出部により検出される押圧に基づくデータが減少した場合とで、前記基準と前記押圧検出部により検出される押圧に基づくデータとの差に応じて前記パラメータの値を増減する量が等しくなるように制御するものである。
前記制御部は、前記押圧検出部により検出される押圧に基づくデータが増加および減少のうち一方から他方へと転じる前後において、前記基準と前記押圧検出部により検出される押圧に基づくデータとの差に応じて前記パラメータの値を増減する量が異なるように制御するものである。
押圧を検出する押圧検出部と、
前記押圧検出部により検出される押圧に基づくデータが所定の条件を満たしたら、押圧に基づくデータに関する基準を設定し、
前記基準が設定されると、当該基準と前記押圧検出部により検出される押圧に基づくデータとの差に応じて、所定の処理に関連付けられたパラメータの値を増減するように制御する制御部と、
を備えることを特徴とするものである。
押圧を検出する押圧検出部と、
前記押圧検出部により検出される押圧に基づくデータが所定の条件を満たしたら、押圧に基づくデータに関する基準を設定し、
前記基準が設定されると、当該基準と前記押圧検出部により検出される押圧に基づくデータとの差に応じて、所定の処理に関連付けられたパラメータの値が変化する速度を変更するように制御する制御部と、
を備えることを特徴とするものである。
前記制御部は、前記押圧検出部により検出される押圧に基づくデータが増加から減少に転じた後に減少から増加に転じたら、前記増加から減少に転じた際の押圧に基づくデータおよび前記減少から増加に転じた際の押圧に基づくデータに基づいて前記基準を設定するように制御するものである。
前記制御部は、前記押圧検出部により検出される押圧に基づくデータが増加した場合と、前記押圧検出部により検出される押圧に基づくデータが減少した場合とで、前記基準と前記押圧検出部により検出される押圧に基づくデータとの差に応じて前記パラメータの値を増減する量が等しくなるように制御するものである。
前記制御部は、前記押圧検出部により検出される押圧に基づくデータが増加および減少のうち一方から他方へと転じる前後において、前記基準と前記押圧検出部により検出される押圧に基づくデータとの差に応じて前記パラメータの値を増減する量が異なるように制御するものである。
図1は、本発明の第1実施の形態に係る電子機器1の概略構成を示す機能ブロック図である。図1に示すように、電子機器1は、制御部10と、タッチセンサ20と、表示部30と、押圧検出部40と、触感呈示部50と、記憶部60と、を備えている。
次に、本発明の第2実施の形態に係る電子機器について説明する。
次に、本発明の第3実施の形態に係る電子機器について説明する。
次に、本発明の第4実施の形態に係る電子機器について説明する。
次に、本発明の第5実施の形態に係る電子機器について説明する。
次に、本発明の第6実施の形態に係る電子機器について説明する。
次に、本発明の第7実施の形態に係る電子機器について説明する。
次に、本発明の第8実施の形態に係る電子機器について説明する。
10 制御部
20 タッチセンサ
30 表示部
40 押圧検出部
50 触感呈示部
80 記憶部
Claims (10)
- 押圧を検出する押圧検出部と、
押圧に基づくデータに関する基準が設定されると、当該基準と前記押圧検出部により検出される押圧に基づくデータとの差に応じて、所定の処理に関連付けられたパラメータの値を増減するように制御する制御部と、
を備えることを特徴とする電子機器。 - 押圧を検出する押圧検出部と、
押圧に基づくデータに関する基準が設定されると、当該基準と前記押圧検出部により検出される押圧に基づくデータとの差に応じて、所定の処理に関連付けられたパラメータの値が変化する速度を変更するように制御する制御部と、
を備えることを特徴とする電子機器。 - 前記制御部は、前記押圧検出部により検出される押圧に基づくデータの変化が所定期間内に所定範囲内であったら、前記所定期間に検出された押圧に基づくデータに基づいて前記基準を設定するように制御する、請求項1または2に記載の電子機器。
- 前記制御部は、前記押圧検出部により検出される押圧に基づくデータが増加した場合と、前記押圧検出部により検出される押圧に基づくデータが減少した場合とで、前記基準と前記押圧検出部により検出される押圧に基づくデータとの差に応じて前記パラメータの値を増減する量が等しくなるように制御する、請求項1に記載の電子機器。
- 前記制御部は、前記押圧検出部により検出される押圧に基づくデータが増加および減少のうち一方から他方へと転じる前後において、前記基準と前記押圧検出部により検出される押圧に基づくデータとの差に応じて前記パラメータの値を増減する量が異なるように制御する、請求項1に記載の電子機器。
- 押圧を検出する押圧検出部と、
前記押圧検出部により検出される押圧に基づくデータが所定の条件を満たしたら、押圧に基づくデータに関する基準を設定し、
前記基準が設定されると、当該基準と前記押圧検出部により検出される押圧に基づくデータとの差に応じて、所定の処理に関連付けられたパラメータの値を増減するように制御する制御部と、
を備えることを特徴とする電子機器。 - 押圧を検出する押圧検出部と、
前記押圧検出部により検出される押圧に基づくデータが所定の条件を満たしたら、押圧に基づくデータに関する基準を設定し、
前記基準が設定されると、当該基準と前記押圧検出部により検出される押圧に基づくデータとの差に応じて、所定の処理に関連付けられたパラメータの値が変化する速度を変更するように制御する制御部と、
を備えることを特徴とする電子機器。 - 前記制御部は、前記押圧検出部により検出される押圧に基づくデータが増加から減少に転じた後に減少から増加に転じたら、前記増加から減少に転じた際の押圧に基づくデータおよび前記減少から増加に転じた際の押圧に基づくデータに基づいて前記基準を設定するように制御する、請求項6または7に記載の電子機器。
- 前記制御部は、前記押圧検出部により検出される押圧に基づくデータが増加した場合と、前記押圧検出部により検出される押圧に基づくデータが減少した場合とで、前記基準と前記押圧検出部により検出される押圧に基づくデータとの差に応じて前記パラメータの値を増減する量が等しくなるように制御する、請求項6に記載の電子機器。
- 前記制御部は、前記押圧検出部により検出される押圧に基づくデータが増加および減少のうち一方から他方へと転じる前後において、前記基準と前記押圧検出部により検出される押圧に基づくデータとの差に応じて前記パラメータの値を増減する量が異なるように制御する、請求項6に記載の電子機器。
Priority Applications (2)
| Application Number | Priority Date | Filing Date | Title |
|---|---|---|---|
| JP2013517863A JP5808404B2 (ja) | 2011-05-27 | 2012-05-25 | 電子機器 |
| US14/122,640 US9798408B2 (en) | 2011-05-27 | 2012-05-25 | Electronic device |
Applications Claiming Priority (4)
| Application Number | Priority Date | Filing Date | Title |
|---|---|---|---|
| JP2011-119713 | 2011-05-27 | ||
| JP2011-119682 | 2011-05-27 | ||
| JP2011119682 | 2011-05-27 | ||
| JP2011119713 | 2011-05-27 |
Publications (1)
| Publication Number | Publication Date |
|---|---|
| WO2012164895A1 true WO2012164895A1 (ja) | 2012-12-06 |
Family
ID=47258771
Family Applications (1)
| Application Number | Title | Priority Date | Filing Date |
|---|---|---|---|
| PCT/JP2012/003434 WO2012164895A1 (ja) | 2011-05-27 | 2012-05-25 | 電子機器 |
Country Status (3)
| Country | Link |
|---|---|
| US (1) | US9798408B2 (ja) |
| JP (1) | JP5808404B2 (ja) |
| WO (1) | WO2012164895A1 (ja) |
Cited By (10)
| Publication number | Priority date | Publication date | Assignee | Title |
|---|---|---|---|---|
| JP2014142813A (ja) * | 2013-01-24 | 2014-08-07 | Sharp Corp | 電子機器、および電子機器操作制御プログラム |
| US20150002416A1 (en) * | 2013-06-27 | 2015-01-01 | Fujitsu Limited | Electronic device |
| JP2015176449A (ja) * | 2014-03-17 | 2015-10-05 | アルプス電気株式会社 | 入力装置 |
| JP2016039497A (ja) * | 2014-08-07 | 2016-03-22 | キヤノン株式会社 | 携帯端末および携帯端末の制御方法 |
| JP2016130999A (ja) * | 2015-01-15 | 2016-07-21 | Smk株式会社 | タッチパネル保持体 |
| US9588616B2 (en) | 2014-05-06 | 2017-03-07 | Corning Incorporated | Cantilevered displacement sensors and methods of determining touching forces on a touch screen |
| EP2939098B1 (en) * | 2012-12-29 | 2018-10-10 | Apple Inc. | Device, method, and graphical user interface for transitioning between touch input to display output relationships |
| JP2019204199A (ja) * | 2018-05-22 | 2019-11-28 | 国立大学法人お茶の水女子大学 | 情報処理端末、情報処理方法、及び情報処理プログラム |
| JP2020518897A (ja) * | 2017-04-20 | 2020-06-25 | 株式会社 ハイディープHiDeep Inc. | タッチ感知及びタッチ圧力感知が可能な装置及び制御方法 |
| WO2023281829A1 (ja) * | 2021-07-07 | 2023-01-12 | アルプスアルパイン株式会社 | 入力装置 |
Families Citing this family (52)
| Publication number | Priority date | Publication date | Assignee | Title |
|---|---|---|---|---|
| US9417754B2 (en) | 2011-08-05 | 2016-08-16 | P4tents1, LLC | User interface system, method, and computer program product |
| KR101806350B1 (ko) | 2012-05-09 | 2017-12-07 | 애플 인크. | 사용자 인터페이스 객체를 선택하는 디바이스, 방법, 및 그래픽 사용자 인터페이스 |
| WO2013169851A2 (en) | 2012-05-09 | 2013-11-14 | Yknots Industries Llc | Device, method, and graphical user interface for facilitating user interaction with controls in a user interface |
| WO2013169843A1 (en) | 2012-05-09 | 2013-11-14 | Yknots Industries Llc | Device, method, and graphical user interface for manipulating framed graphical objects |
| AU2013259613B2 (en) | 2012-05-09 | 2016-07-21 | Apple Inc. | Device, method, and graphical user interface for providing tactile feedback for operations performed in a user interface |
| EP2847659B1 (en) | 2012-05-09 | 2019-09-04 | Apple Inc. | Device, method, and graphical user interface for transitioning between display states in response to a gesture |
| WO2013169865A2 (en) | 2012-05-09 | 2013-11-14 | Yknots Industries Llc | Device, method, and graphical user interface for moving a user interface object based on an intensity of a press input |
| WO2013169846A1 (en) | 2012-05-09 | 2013-11-14 | Yknots Industries Llc | Device, method, and graphical user interface for displaying additional information in response to a user contact |
| WO2013169845A1 (en) | 2012-05-09 | 2013-11-14 | Yknots Industries Llc | Device, method, and graphical user interface for scrolling nested regions |
| WO2013169842A2 (en) | 2012-05-09 | 2013-11-14 | Yknots Industries Llc | Device, method, and graphical user interface for selecting object within a group of objects |
| WO2013169875A2 (en) | 2012-05-09 | 2013-11-14 | Yknots Industries Llc | Device, method, and graphical user interface for displaying content associated with a corresponding affordance |
| CN109298789B (zh) | 2012-05-09 | 2021-12-31 | 苹果公司 | 用于针对激活状态提供反馈的设备、方法和图形用户界面 |
| EP3264252B1 (en) | 2012-05-09 | 2019-11-27 | Apple Inc. | Device, method, and graphical user interface for performing an operation in accordance with a selected mode of operation |
| WO2013169849A2 (en) | 2012-05-09 | 2013-11-14 | Industries Llc Yknots | Device, method, and graphical user interface for displaying user interface objects corresponding to an application |
| CN104220975B (zh) * | 2012-05-10 | 2017-12-01 | 英特尔公司 | 用于响应手势捕捉图像的方法和设备 |
| JP2014038560A (ja) * | 2012-08-20 | 2014-02-27 | Canon Inc | 情報処理装置、情報処理方法及びプログラム |
| CN107831991B (zh) | 2012-12-29 | 2020-11-27 | 苹果公司 | 用于确定是滚动还是选择内容的设备、方法和图形用户界面 |
| WO2014105274A1 (en) | 2012-12-29 | 2014-07-03 | Yknots Industries Llc | Device, method, and graphical user interface for navigating user interface hierarchies |
| CN105144057B (zh) | 2012-12-29 | 2019-05-17 | 苹果公司 | 用于根据具有模拟三维特征的控制图标的外观变化来移动光标的设备、方法和图形用户界面 |
| WO2014105279A1 (en) | 2012-12-29 | 2014-07-03 | Yknots Industries Llc | Device, method, and graphical user interface for switching between user interfaces |
| AU2013368441B2 (en) | 2012-12-29 | 2016-04-14 | Apple Inc. | Device, method, and graphical user interface for forgoing generation of tactile output for a multi-contact gesture |
| US9396697B2 (en) * | 2013-06-01 | 2016-07-19 | Apple Inc. | Intelligently placing labels |
| JP6473610B2 (ja) * | 2014-12-08 | 2019-02-20 | 株式会社デンソーテン | 操作装置、及び、操作システム |
| JP6038202B2 (ja) * | 2015-02-06 | 2016-12-07 | 京セラドキュメントソリューションズ株式会社 | 入力装置および電子機器 |
| TWI653552B (zh) | 2015-02-13 | 2019-03-11 | 禾瑞亞科技股份有限公司 | 調整觸控筆壓力信號值參數的設定方法、觸控電子裝置與系統 |
| US9990107B2 (en) | 2015-03-08 | 2018-06-05 | Apple Inc. | Devices, methods, and graphical user interfaces for displaying and using menus |
| US10048757B2 (en) | 2015-03-08 | 2018-08-14 | Apple Inc. | Devices and methods for controlling media presentation |
| US9632664B2 (en) | 2015-03-08 | 2017-04-25 | Apple Inc. | Devices, methods, and graphical user interfaces for manipulating user interface objects with visual and/or haptic feedback |
| US10095396B2 (en) | 2015-03-08 | 2018-10-09 | Apple Inc. | Devices, methods, and graphical user interfaces for interacting with a control object while dragging another object |
| US9645732B2 (en) | 2015-03-08 | 2017-05-09 | Apple Inc. | Devices, methods, and graphical user interfaces for displaying and using menus |
| US9639184B2 (en) | 2015-03-19 | 2017-05-02 | Apple Inc. | Touch input cursor manipulation |
| US9785305B2 (en) | 2015-03-19 | 2017-10-10 | Apple Inc. | Touch input cursor manipulation |
| US10067653B2 (en) | 2015-04-01 | 2018-09-04 | Apple Inc. | Devices and methods for processing touch inputs based on their intensities |
| US20170045981A1 (en) | 2015-08-10 | 2017-02-16 | Apple Inc. | Devices and Methods for Processing Touch Inputs Based on Their Intensities |
| US10200598B2 (en) | 2015-06-07 | 2019-02-05 | Apple Inc. | Devices and methods for capturing and interacting with enhanced digital images |
| US10346030B2 (en) | 2015-06-07 | 2019-07-09 | Apple Inc. | Devices and methods for navigating between user interfaces |
| US9674426B2 (en) | 2015-06-07 | 2017-06-06 | Apple Inc. | Devices and methods for capturing and interacting with enhanced digital images |
| US9860451B2 (en) | 2015-06-07 | 2018-01-02 | Apple Inc. | Devices and methods for capturing and interacting with enhanced digital images |
| US9891811B2 (en) | 2015-06-07 | 2018-02-13 | Apple Inc. | Devices and methods for navigating between user interfaces |
| US9830048B2 (en) | 2015-06-07 | 2017-11-28 | Apple Inc. | Devices and methods for processing touch inputs with instructions in a web page |
| US10416800B2 (en) | 2015-08-10 | 2019-09-17 | Apple Inc. | Devices, methods, and graphical user interfaces for adjusting user interface objects |
| US9880735B2 (en) | 2015-08-10 | 2018-01-30 | Apple Inc. | Devices, methods, and graphical user interfaces for manipulating user interface objects with visual and/or haptic feedback |
| US10235035B2 (en) | 2015-08-10 | 2019-03-19 | Apple Inc. | Devices, methods, and graphical user interfaces for content navigation and manipulation |
| US10248308B2 (en) | 2015-08-10 | 2019-04-02 | Apple Inc. | Devices, methods, and graphical user interfaces for manipulating user interfaces with physical gestures |
| US20170068374A1 (en) * | 2015-09-09 | 2017-03-09 | Microsoft Technology Licensing, Llc | Changing an interaction layer on a graphical user interface |
| EP3936991A1 (en) * | 2015-10-02 | 2022-01-12 | Koninklijke Philips N.V. | Apparatus for displaying data |
| KR102468314B1 (ko) * | 2015-10-21 | 2022-11-17 | 삼성전자주식회사 | Ui 제공 방법 및 이를 수행하는 전자 장치 |
| US20170220241A1 (en) * | 2016-01-29 | 2017-08-03 | Onshape Inc. | Force touch zoom selection |
| CN105718116A (zh) * | 2016-02-01 | 2016-06-29 | 京东方科技集团股份有限公司 | 一种触控面板及其制备方法、触控显示屏 |
| KR102514963B1 (ko) * | 2016-04-18 | 2023-03-28 | 엘지전자 주식회사 | 이동 단말기 및 그 제어방법 |
| JP6730972B2 (ja) * | 2017-10-20 | 2020-07-29 | ヤフー株式会社 | 情報制御プログラム、情報制御方法および端末装置 |
| CN113096220A (zh) * | 2021-04-08 | 2021-07-09 | 苏州伊恩动漫有限公司 | 动漫场景渲染制作方法 |
Citations (4)
| Publication number | Priority date | Publication date | Assignee | Title |
|---|---|---|---|---|
| JP2000317142A (ja) * | 1994-04-28 | 2000-11-21 | Sega Enterp Ltd | コンピュータゲーム装置およびこれに用いる操作制御装置 |
| JP2001202192A (ja) * | 2000-01-18 | 2001-07-27 | Sony Corp | 情報処理装置及びその方法並びにプログラム格納媒体 |
| JP2010211399A (ja) * | 2009-03-09 | 2010-09-24 | Sony Corp | 情報処理装置、閾値設定方法及びそのプログラム |
| JP2011048666A (ja) * | 2009-08-27 | 2011-03-10 | Sony Corp | 情報処理装置、情報処理方法、及びプログラム |
Family Cites Families (17)
| Publication number | Priority date | Publication date | Assignee | Title |
|---|---|---|---|---|
| TW521205B (en) * | 2001-06-05 | 2003-02-21 | Compal Electronics Inc | Touch screen capable of controlling amplification with pressure |
| JP2003157075A (ja) * | 2001-11-22 | 2003-05-30 | Kawai Musical Instr Mfg Co Ltd | 電子楽器のパラメータ入力装置 |
| JP2003241898A (ja) | 2002-02-20 | 2003-08-29 | Fujikura Ltd | タッチパネル |
| EP1462917A1 (en) * | 2003-03-26 | 2004-09-29 | High Tech Computer Corp. | Touch panel threshold pressure setup method and apparatus |
| CN1993672A (zh) * | 2004-08-02 | 2007-07-04 | 皇家飞利浦电子股份有限公司 | 在触摸屏上的压控导航 |
| US7619616B2 (en) | 2004-12-21 | 2009-11-17 | Microsoft Corporation | Pressure sensitive controls |
| US7683889B2 (en) * | 2004-12-21 | 2010-03-23 | Microsoft Corporation | Pressure based selection |
| JP2006345209A (ja) | 2005-06-08 | 2006-12-21 | Sony Corp | 入力装置、情報処理装置、情報処理方法、及びプログラム |
| US7486282B2 (en) * | 2006-01-27 | 2009-02-03 | Microsoft Corporation | Size variant pressure eraser |
| US20070222767A1 (en) * | 2006-03-22 | 2007-09-27 | David Wang | Glide touch sensor based interface for navigation infotainment systems |
| US20090046110A1 (en) * | 2007-08-16 | 2009-02-19 | Motorola, Inc. | Method and apparatus for manipulating a displayed image |
| JP4590596B2 (ja) * | 2007-12-11 | 2010-12-01 | 独立行政法人理化学研究所 | 入力装置、制御装置、入力方法、制御方法ならびに、プログラム |
| JP5191321B2 (ja) * | 2008-09-02 | 2013-05-08 | 株式会社ジャパンディスプレイウェスト | 情報入力装置、情報入力方法、情報入出力装置および情報入力プログラム |
| JP4811452B2 (ja) | 2008-11-19 | 2011-11-09 | ソニー株式会社 | 画像処理装置、画像表示方法および画像表示プログラム |
| JP5734546B2 (ja) * | 2009-02-25 | 2015-06-17 | 京セラ株式会社 | オブジェクト表示装置 |
| JP2011053974A (ja) * | 2009-09-02 | 2011-03-17 | Sony Corp | 操作制御装置、操作制御方法およびコンピュータプログラム |
| JP5182260B2 (ja) | 2009-09-02 | 2013-04-17 | ソニー株式会社 | 操作制御装置、操作制御方法およびコンピュータプログラム |
-
2012
- 2012-05-25 WO PCT/JP2012/003434 patent/WO2012164895A1/ja active Application Filing
- 2012-05-25 JP JP2013517863A patent/JP5808404B2/ja active Active
- 2012-05-25 US US14/122,640 patent/US9798408B2/en active Active
Patent Citations (4)
| Publication number | Priority date | Publication date | Assignee | Title |
|---|---|---|---|---|
| JP2000317142A (ja) * | 1994-04-28 | 2000-11-21 | Sega Enterp Ltd | コンピュータゲーム装置およびこれに用いる操作制御装置 |
| JP2001202192A (ja) * | 2000-01-18 | 2001-07-27 | Sony Corp | 情報処理装置及びその方法並びにプログラム格納媒体 |
| JP2010211399A (ja) * | 2009-03-09 | 2010-09-24 | Sony Corp | 情報処理装置、閾値設定方法及びそのプログラム |
| JP2011048666A (ja) * | 2009-08-27 | 2011-03-10 | Sony Corp | 情報処理装置、情報処理方法、及びプログラム |
Cited By (11)
| Publication number | Priority date | Publication date | Assignee | Title |
|---|---|---|---|---|
| EP2939098B1 (en) * | 2012-12-29 | 2018-10-10 | Apple Inc. | Device, method, and graphical user interface for transitioning between touch input to display output relationships |
| JP2014142813A (ja) * | 2013-01-24 | 2014-08-07 | Sharp Corp | 電子機器、および電子機器操作制御プログラム |
| US20150002416A1 (en) * | 2013-06-27 | 2015-01-01 | Fujitsu Limited | Electronic device |
| JP2015176449A (ja) * | 2014-03-17 | 2015-10-05 | アルプス電気株式会社 | 入力装置 |
| US9588616B2 (en) | 2014-05-06 | 2017-03-07 | Corning Incorporated | Cantilevered displacement sensors and methods of determining touching forces on a touch screen |
| JP2016039497A (ja) * | 2014-08-07 | 2016-03-22 | キヤノン株式会社 | 携帯端末および携帯端末の制御方法 |
| JP2016130999A (ja) * | 2015-01-15 | 2016-07-21 | Smk株式会社 | タッチパネル保持体 |
| JP2020518897A (ja) * | 2017-04-20 | 2020-06-25 | 株式会社 ハイディープHiDeep Inc. | タッチ感知及びタッチ圧力感知が可能な装置及び制御方法 |
| JP2019204199A (ja) * | 2018-05-22 | 2019-11-28 | 国立大学法人お茶の水女子大学 | 情報処理端末、情報処理方法、及び情報処理プログラム |
| JP7085195B2 (ja) | 2018-05-22 | 2022-06-16 | 国立大学法人お茶の水女子大学 | 情報処理端末、情報処理方法、及び情報処理プログラム |
| WO2023281829A1 (ja) * | 2021-07-07 | 2023-01-12 | アルプスアルパイン株式会社 | 入力装置 |
Also Published As
| Publication number | Publication date |
|---|---|
| US20140111456A1 (en) | 2014-04-24 |
| US9798408B2 (en) | 2017-10-24 |
| JP5808404B2 (ja) | 2015-11-10 |
| JPWO2012164895A1 (ja) | 2015-02-23 |
Similar Documents
| Publication | Publication Date | Title |
|---|---|---|
| JP5808404B2 (ja) | 電子機器 | |
| JP5738413B2 (ja) | 電子機器 | |
| US20110179381A1 (en) | Portable electronic device and method of controlling same | |
| JP5977627B2 (ja) | 情報処理装置、情報処理方法およびプログラム | |
| CA2667911C (en) | Portable electronic device including a touch-sensitive display and method of controlling same | |
| US20110084910A1 (en) | Portable electronic device including touch-sensitive display and method of controlling same | |
| KR101971982B1 (ko) | 터치 감지 및 터치압력 감지가 가능한 장치 및 제어방법 | |
| JP5792558B2 (ja) | 電子機器および制御方法 | |
| CA2685639A1 (en) | Portable electronic device including touch-sensitive display and method of controlling same to provide tactile feedback | |
| EP2390766A1 (en) | Electronic device including touch-sensitive display and method of controlling same | |
| JP5555612B2 (ja) | 触感呈示装置 | |
| US20110128236A1 (en) | Electronic device and method of controlling same | |
| US8887086B2 (en) | Portable electronic device and method of controlling same | |
| EP2306288A1 (en) | Electronic device including touch-sensitive input device and method of controlling same | |
| JP2013206180A (ja) | 電子機器および表示方法 | |
| JP5529981B2 (ja) | 電子機器 | |
| JP5792553B2 (ja) | 電子機器および制御方法 | |
| US20110074827A1 (en) | Electronic device including touch-sensitive input device and method of controlling same | |
| CA2761567A1 (en) | Portable electronic device with dual-touch zoom | |
| JP5588023B2 (ja) | 電子機器 | |
| EP2348392A1 (en) | Portable electronic device and method of controlling same | |
| JP2015106174A (ja) | 電子機器 | |
| EP2690538A1 (en) | Electronic device including touch-sensitive display and method of controlling same | |
| US8350818B2 (en) | Touch-sensitive display method and apparatus | |
| CA2686570C (en) | Method of changing boundaries on a touch-sensitive display |
Legal Events
| Date | Code | Title | Description |
|---|---|---|---|
| 121 | Ep: the epo has been informed by wipo that ep was designated in this application |
Ref document number: 12793413 Country of ref document: EP Kind code of ref document: A1 |
|
| ENP | Entry into the national phase |
Ref document number: 2013517863 Country of ref document: JP Kind code of ref document: A |
|
| WWE | Wipo information: entry into national phase |
Ref document number: 14122640 Country of ref document: US |
|
| NENP | Non-entry into the national phase |
Ref country code: DE |
|
| 122 | Ep: pct application non-entry in european phase |
Ref document number: 12793413 Country of ref document: EP Kind code of ref document: A1 |