WO2012137775A1 - 異常要因特定方法および装置、上記異常要因特定方法をコンピュータに実行させるためのプログラム、並びに上記プログラムを記録したコンピュータ読み取り可能な記録媒体 - Google Patents
異常要因特定方法および装置、上記異常要因特定方法をコンピュータに実行させるためのプログラム、並びに上記プログラムを記録したコンピュータ読み取り可能な記録媒体 Download PDFInfo
- Publication number
- WO2012137775A1 WO2012137775A1 PCT/JP2012/059072 JP2012059072W WO2012137775A1 WO 2012137775 A1 WO2012137775 A1 WO 2012137775A1 JP 2012059072 W JP2012059072 W JP 2012059072W WO 2012137775 A1 WO2012137775 A1 WO 2012137775A1
- Authority
- WO
- WIPO (PCT)
- Prior art keywords
- manufacturing
- data
- manufacturing data
- defective
- test
- Prior art date
- Legal status (The legal status is an assumption and is not a legal conclusion. Google has not performed a legal analysis and makes no representation as to the accuracy of the status listed.)
- Ceased
Links
Images







Classifications
-
- G—PHYSICS
- G05—CONTROLLING; REGULATING
- G05B—CONTROL OR REGULATING SYSTEMS IN GENERAL; FUNCTIONAL ELEMENTS OF SUCH SYSTEMS; MONITORING OR TESTING ARRANGEMENTS FOR SUCH SYSTEMS OR ELEMENTS
- G05B19/00—Program-control systems
- G05B19/02—Program-control systems electric
- G05B19/418—Total factory control, i.e. centrally controlling a plurality of machines, e.g. direct or distributed numerical control [DNC], flexible manufacturing systems [FMS], integrated manufacturing systems [IMS] or computer integrated manufacturing [CIM]
- G05B19/41875—Total factory control, i.e. centrally controlling a plurality of machines, e.g. direct or distributed numerical control [DNC], flexible manufacturing systems [FMS], integrated manufacturing systems [IMS] or computer integrated manufacturing [CIM] characterised by quality surveillance of production
-
- Y—GENERAL TAGGING OF NEW TECHNOLOGICAL DEVELOPMENTS; GENERAL TAGGING OF CROSS-SECTIONAL TECHNOLOGIES SPANNING OVER SEVERAL SECTIONS OF THE IPC; TECHNICAL SUBJECTS COVERED BY FORMER USPC CROSS-REFERENCE ART COLLECTIONS [XRACs] AND DIGESTS
- Y02—TECHNOLOGIES OR APPLICATIONS FOR MITIGATION OR ADAPTATION AGAINST CLIMATE CHANGE
- Y02P—CLIMATE CHANGE MITIGATION TECHNOLOGIES IN THE PRODUCTION OR PROCESSING OF GOODS
- Y02P90/00—Enabling technologies with a potential contribution to greenhouse gas [GHG] emissions mitigation
- Y02P90/02—Total factory control, e.g. smart factories, flexible manufacturing systems [FMS] or integrated manufacturing systems [IMS]
Definitions
- the present invention relates to an abnormality factor identification method, and more particularly, to an abnormality factor identification method for identifying an abnormality factor that is a parameter causing a defective product in a production process.
- the present invention also relates to an abnormality factor identification device that executes such an abnormality factor identification method.
- the present invention also relates to a program for causing a computer to execute such an abnormal factor identification method.
- the present invention also relates to a computer-readable recording medium in which such a program is recorded.
- Patent Document 1 Japanese Patent Laid-Open No. 2009-009299, “Abnormality Factor Identification Method and System, Abnormal Factor Identification”. A program for causing a computer to execute the method, and a computer-readable recording medium on which the program is recorded ”) are known.
- the abnormality factor identification method is applied to, for example, a semiconductor production process 59 as shown in FIG.
- the semiconductor production process 59 executes one or more manufacturing steps 56 on a manufactured product (wafer in this example), and also inspects the manufactured product that has passed through the manufacturing step 56 (including pass / fail judgment) 55. Is supposed to run.
- the database 58 obtains one or more types of manufacturing data 54 including manufacturing conditions for each manufactured product from each manufacturing step 56 of the semiconductor production process 59, and the quality of the manufactured product from each inspection step 55. Inspection data (including the pass / fail judgment result) 53 is obtained. For each manufactured product, manufacturing data 54 and inspection data 53 for the manufactured product are stored in association with each other.
- a system that executes the above-described abnormality factor identification method executes arithmetic processing according to a database 58 as a storage unit and software (program).
- An abnormality factor specifying unit 57 formed of a computer and a display device (for example, an LCD (liquid crystal display)) 52 that displays a processing result by the abnormality factor specifying unit 57 are provided.
- the abnormality factor identification unit 57 executes the abnormality factor identification method described later using the manufacturing data 54 and the inspection data 53 accumulated in the database 58, and obtains the manufacturing data that is a factor (abnormal factor) of defective product generation. Identify.
- the processing contents and processing results by the abnormality factor specifying unit 57 are displayed on the screen of the display device 52. While viewing the screen displayed on the display device 52, the worker 50 can instruct the abnormality factor specifying unit 57 to execute processing and set processing conditions.
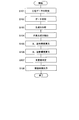
- the abnormality factor specifying unit 57 generally executes a process (an abnormality factor specifying method) as shown in FIG.
- the manufacturing data 54 and the inspection data 53 accumulated in the database 58 are acquired (step S101).
- the manufacturing data 54 and the inspection data 53 for the manufactured product are associated with each manufactured product.
- the acquired data group is determined based on the inspection data 53 as data for a non-defective product and data for a defective product (step S102).
- at least one feature amount that best represents the manufacturing condition of the manufactured product is extracted from the manufacturing data of the manufactured product determined to be non-defective (S103, S104).
- the distance between the point representing the origin and production data of each article of manufacture in the feature quantity space expressed with the extracted feature quantity as an axis (for example, T 2 statistic Hotelling), average during good manufacturing
- a residual component that is not expressed in the feature amount space represented by the feature amount as an axis is calculated as a sub-significant difference for each manufactured product (S105).
- the contribution ratio of each manufacturing data occupying the main significant difference is calculated as the main influence degree, and the contribution ratio of each manufacturing data occupying the sub significant difference is calculated as the sub influence degree (S106).
- the manufacturing data in which the main influence degree or the sub influence degree substantially increased (increased with a significant difference) at the time of defective product manufacture compared to the non-defective product manufacture is specified as an abnormal factor and output ( S107, S108).
- the main influence at the time of defective production A viewpoint of the size itself may be added.
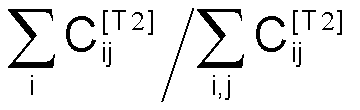
- each cumulative value obtained by accumulating the main influence degree for each of the manufacturing data is used as all related manufacturing data. Then, the main influence degree is divided by the total value obtained by accumulating the main influence degree, and a normal main influence degree normalization value representing the main influence degree is obtained for each manufacturing data.
- the cumulative value obtained by accumulating the main influence degree for each production data was obtained by accumulating the main influence degree over all related production data. By dividing each by the total value, a main influence normalization value of a defective product representing the main influence degree is obtained for each of the manufacturing data. Then, with respect to each of the manufacturing data, the main influence normalized value of the non-defective product and the main influence normalized value of the defective product are compared to identify the manufacturing data that has caused the abnormality.
- the main influence degree about the manufacturing data j of the manufactured product i determined to be non-defective The main influence normalization value of the above non-defective product is It is represented by
- the main influence on the manufacturing data j of the manufactured product i determined to be defective The main effect normalization value of the above defective product is It is represented by
- the abnormality factor identification method of this embodiment makes it possible to compare the main influence degree of a manufactured product determined as a non-defective product and a manufactured product determined as a defective product based on the proportion of the total manufacturing data. Thereby, even when the number of manufactured products determined to be non-defective and the number of manufactured products determined to be defective are different, it is possible to identify manufacturing data (anomaly factor) that is a cause of defective product generation.
- Patent Document 1 describes this.
- the abnormality factor can be identified with high accuracy when the data on the non-defective product and the data on the defective product are normally distributed and equally distributed.
- data acquired in an actual production process does not necessarily have a normal distribution, and the data of non-defective products and defective products to be compared are not necessarily equally distributed.
- the identified abnormality factor may not necessarily affect the quality of the manufactured product.
- the quality manager eventually determines that the production data (including process parameters) identified as the abnormality factor actually affects the quality of the manufactured product.
- the quality manager There is a problem that it takes a long time to identify the actual abnormality factor, because it is necessary to check whether each process parameter is present. This problem becomes particularly serious when the number of process parameters extracted as abnormal factors is large. As a result, the manufacturing process cannot be quickly returned to the normal state.
- an object of the present invention is to accurately identify manufacturing data that is a cause of defective products regardless of characteristics of manufacturing data and inspection data (distribution mode such as normal distribution or not).
- An object of the present invention is to provide a method for identifying abnormal factors.
- the present invention is to provide an abnormality factor identification device that executes such an abnormality factor identification method.
- the present invention is to provide a program for causing a computer to execute such an abnormal factor identification method.
- Another object of the present invention is to provide a computer-readable recording medium in which such a program is recorded.
- the abnormality factor identification method includes: An abnormality factor identification method for identifying a factor of defective product generation in a production process in which one or more manufacturing processes are performed on a manufactured product and an inspection process including a quality inspection is performed on the manufactured product that has undergone the manufacturing process. There, In the production process, for each manufactured product, one or more types of manufacturing data including manufacturing conditions for the manufactured product are associated with inspection data representing quality obtained in the inspection step, and acquired as a data set.
- the data is used to determine whether the product is good or defective, From the manufacturing data of the manufactured product determined to be non-defective in the data set, at least one feature amount that best represents the manufacturing condition of the manufactured product is extracted by performing multivariate analysis, and the extracted feature Based on the quantity, calculate the significant difference between the average manufacturing data at the time of non-defective product manufacturing and each manufacturing data at the time of defective product manufacturing, and the contribution rate of each manufacturing data in the above significant difference as the degree of influence
- An abnormal factor candidate extraction step for calculating and extracting, from the manufacturing data, manufacturing data in which the degree of influence has substantially increased during defective product manufacturing as compared to non-defective product manufacturing, as abnormal factor candidates;
- the “manufactured product” is a concept including a work-in-progress product in the middle of manufacture and a finished product.
- substantially increasing the degree of influence means that there is a significant difference in increase.
- the manufacturing condition of the manufactured product by performing multivariate analysis from the manufacturing data of the manufactured product determined to be non-defective in the data set. At least one feature amount that best represents is extracted. Next, based on the extracted feature amount, a significant difference between average manufacturing data at the time of non-defective product manufacturing and each manufacturing data at the time of defective product manufacturing is calculated. Next, the contribution rate of each manufacturing data occupying the significant difference is calculated as the degree of influence. Then, from the manufacturing data, manufacturing data in which the degree of influence is substantially increased at the time of manufacturing a defective product is extracted as an abnormal factor candidate.
- each of the manufacturing data as the abnormal factor candidates is extracted from the data set, and using the extracted manufacturing data, statistics on whether the manufacturing data has an influence on the quality or not. Perform a physical test.
- whether or not each of the manufacturing data extracted as the abnormal factor candidate has an influence on the quality depends on the characteristics of the manufacturing data and the inspection data (distribution mode such as whether or not the distribution is normal). First, it is confirmed with high accuracy by the above statistical test.
- the test result display step the result obtained by the test step is displayed based on the input or based on a predetermined criterion.
- the quality manager of the above production process may be a maintenance person or an operator. The same shall apply hereinafter) can accurately grasp the abnormal factor that is the cause of defective products, By removing the abnormal factor, the manufacturing process can be quickly returned to the normal state.
- the abnormality factor identification method includes: An abnormality factor identification method for identifying a factor of defective product generation in a production process in which one or more manufacturing processes are performed on a manufactured product and an inspection process including a quality inspection is performed on the manufactured product that has undergone the manufacturing process.
- An abnormality factor identification method for identifying a factor of defective product generation in a production process in which one or more manufacturing processes are performed on a manufactured product and an inspection process including a quality inspection is performed on the manufactured product that has undergone the manufacturing process.
- one or more types of manufacturing data including manufacturing conditions for the manufactured product are associated with inspection data representing quality obtained in the inspection step, and acquired as a data set.
- the data is used to determine whether the product is good or defective
- the multivariate analysis is performed to best represent the manufacturing conditions of the manufactured product from the manufacturing data of the manufactured product determined to be non-defective and the manufacturing data of the manufactured product determined to be defective.
- the abnormality factor candidate extraction step in the abnormality factor candidate extraction step, first, among the manufacturing data for the manufactured product determined to be non-defective in the data set and the manufacturing data for the manufactured product determined to be defective. Then, a multivariate analysis is performed to extract at least one feature quantity that best represents the manufacturing conditions of the manufactured product. Then, an abnormal factor candidate is extracted from the manufacturing data based on the extracted feature amount.
- each of the manufacturing data as the abnormal factor candidates is extracted from the data set, and using the extracted manufacturing data, statistics on whether the manufacturing data has an influence on the quality or not. Perform a physical test.
- whether or not each of the manufacturing data extracted as the abnormal factor candidate has an influence on the quality depends on the characteristics of the manufacturing data and the inspection data (distribution mode such as whether or not the distribution is normal). First, it is confirmed with high accuracy by the above statistical test.
- the test result display step the result obtained by the test step is displayed based on the input or based on a predetermined criterion.
- the quality manager of the production process can accurately grasp the abnormality factor, and can quickly return the manufacturing process to the normal state by removing the abnormality factor.
- the verification step determines the extent to which the manufacturing data affects the quality for each piece of manufacturing data as an abnormality factor candidate extracted in the abnormality factor candidate extraction step. It is characterized by calculating a test index quantitatively expressed.
- the test step is performed to the extent that the production data affects the quality for each production data as the abnormality factor candidate extracted in the abnormality factor candidate extraction step.
- a test index that quantitatively represents is calculated.
- the test result display step for each manufacturing data as the abnormal factor candidate extracted in the abnormal factor candidate extraction step, a test that quantitatively represents the degree to which the manufacturing data affects the quality. An indicator is displayed. Therefore, the quality manager of the production process can grasp the degree of influence of the production data on the quality of each piece of production data as the abnormal factor candidate based on the test index.
- the verification step determines, for each production data, whether or not the production data as the abnormality factor candidate extracted in the abnormality factor candidate extraction step is significant.
- the verification step determines for each piece of production data whether or not the production data as the abnormality factor candidate extracted in the abnormality factor candidate extraction step is significant.
- the quality manager of the production process substantially determines that the manufacturing data as the abnormal factor candidate extracted in the abnormal factor candidate extraction step is substantially the quality based on the indication of whether or not it is significant. It is possible to grasp whether or not there is an influence.
- the test result display step includes manufacturing data as the abnormal factor candidates extracted in the abnormal factor candidate extraction step, in order of increasing or decreasing the test index for the manufacturing data. It is characterized by being rearranged in order and displayed.
- the manufacturing data as the abnormal factor candidates extracted in the abnormal factor candidate extraction step is in descending order of the test index for the manufacturing data. Sorted in ascending order. Therefore, the quality manager of the production process can easily and quantitatively and visually determine the degree of influence of the manufacturing data on the quality of each manufacturing data as an abnormal factor candidate by looking at the display. I can grasp.
- the abnormal factor candidate extraction step calculates, for each manufacturing data as the abnormal factor candidate, an evaluation index that quantitatively represents a basis on which the manufacturing data should be extracted as the abnormal factor candidate,
- the verification step selects, based on the evaluation index, manufacturing data that is estimated to affect the quality from the manufacturing data as the abnormal factor candidate extracted in the abnormal factor candidate extraction step. Then, the statistical test is performed.
- the abnormality factor candidate extraction step performs an evaluation that quantitatively represents the basis on which the manufacturing data should be extracted as the abnormality factor candidate for each of the manufacturing data as the abnormality factor candidate. Calculate the indicator. And the said test step is based on the said evaluation parameter
- the verification step calculates a priority indicating the order in which countermeasures are required for each manufacturing data as the abnormality factor candidate based on the evaluation index. .
- the verification step calculates a priority indicating the order in which countermeasures are required for each manufacturing data as the abnormality factor candidate based on the evaluation index.
- the priority indicating the order in which countermeasures are required is displayed for each manufacturing data as the abnormal factor candidate. Therefore, the quality manager of the production process can quantitatively and visually grasp the priority indicating the order in which countermeasures are required for each piece of manufacturing data as the abnormal factor candidate by viewing the display.
- the test step selects the statistical test method according to the characteristics of the data set.
- the “characteristic” of the data set refers to a distribution mode such as whether or not the manufacturing data and inspection data have a normal distribution.
- the test step selects, for example, the optimal statistical test method according to the characteristics of the data set. As a result, whether or not each of the manufacturing data extracted as the abnormal factor candidates has an influence on the quality is confirmed with higher accuracy by the statistical test.
- the verification step includes inspection data for a manufactured product determined as a non-defective product and inspection data for a manufactured product determined as a defective product among the inspection data in the data set.
- the parametric method is used as the statistical test method, whereas when the assumption does not hold, the statistical test method As a feature, a non-parametric method is used.
- the abnormality factor identification device of this invention is An abnormality factor identification device for identifying a factor of defective product generation in a production process in which one or more manufacturing processes are performed on a manufactured product and an inspection process including a quality inspection is performed on the manufactured product that has undergone the manufacturing process. There, In the production process, for each manufactured product, one or more types of manufacturing data including manufacturing conditions for the manufactured product are associated with inspection data representing quality obtained in the inspection step, and acquired as a data set.
- the data is used to determine whether the product is good or defective, From the manufacturing data of the manufactured product determined to be non-defective in the data set, at least one feature amount that best represents the manufacturing condition of the manufactured product is extracted by performing multivariate analysis, and the extracted feature Based on the quantity, calculate the significant difference between the average manufacturing data at the time of non-defective product manufacturing and each manufacturing data at the time of defective product manufacturing, and the contribution rate of each manufacturing data in the above significant difference as the degree of influence
- An abnormal factor candidate extraction unit that calculates and extracts, from among the manufacturing data, manufacturing data in which the degree of influence is substantially increased when defective products are manufactured as compared with non-defective products,
- a test that extracts manufacturing data as candidate abnormal factors from the data set, and uses the extracted manufacturing data to perform a statistical test of whether the manufacturing data affects the quality.
- a test result display unit for displaying a result obtained by the test unit based on an input or based on a predetermined criterion; It is characterized by including.
- the abnormality factor candidate extraction unit first performs multivariate analysis from the manufacturing data on the manufactured product determined to be non-defective in the data set, and the manufacturing condition of the manufactured product. At least one feature amount that best represents is extracted. Next, based on the extracted feature amount, a significant difference between average manufacturing data at the time of non-defective product manufacturing and each manufacturing data at the time of defective product manufacturing is calculated. Next, the contribution rate of each manufacturing data occupying the significant difference is calculated as the degree of influence. Then, from the manufacturing data, manufacturing data in which the degree of influence is substantially increased at the time of manufacturing a defective product is extracted as an abnormal factor candidate.
- each of the manufacturing data as the abnormal factor candidates is extracted from the data set, and using the extracted manufacturing data, statistics on whether the manufacturing data affects the quality or not. Perform a physical test.
- whether or not each of the manufacturing data extracted as the abnormal factor candidate has an influence on the quality depends on the characteristics of the manufacturing data and the inspection data (distribution mode such as whether or not the distribution is normal). First, it is confirmed with high accuracy by the above statistical test.
- the test result display unit displays the result obtained by the test unit based on the input or based on a predetermined criterion.
- the quality manager of the above production process may be a maintenance person or an operator. The same shall apply hereinafter) can accurately grasp the abnormal factor that is the cause of defective products, By removing the abnormal factor, the manufacturing process can be quickly returned to the normal state.
- the abnormality factor identification device of the present invention is: An abnormality factor identification device for identifying a factor of defective product generation in a production process in which one or more manufacturing processes are performed on a manufactured product and an inspection process including a quality inspection is performed on the manufactured product that has undergone the manufacturing process.
- one or more types of manufacturing data including manufacturing conditions for the manufactured product are associated with inspection data representing quality obtained in the inspection step, and acquired as a data set. The data is used to determine whether the product is good or defective.
- the multivariate analysis is performed to best represent the manufacturing conditions of the manufactured product from the manufacturing data of the manufactured product determined to be non-defective and the manufacturing data of the manufactured product determined to be defective.
- the abnormality factor candidate extraction unit first includes manufacturing data for a manufactured product determined to be non-defective in the data set and manufacturing data for a manufactured product determined to be defective. Then, a multivariate analysis is performed to extract at least one feature quantity that best represents the manufacturing conditions of the manufactured product. Then, an abnormal factor candidate is extracted from the manufacturing data based on the extracted feature amount.
- each of the manufacturing data as the abnormal factor candidates is extracted from the data set, and using the extracted manufacturing data, statistics on whether the manufacturing data affects the quality or not. Perform an automated test.
- whether or not each of the manufacturing data extracted as the abnormal factor candidate has an influence on the quality depends on the characteristics of the manufacturing data and the inspection data (distribution mode such as whether or not the distribution is normal).
- distributed mode such as whether or not the distribution is normal.
- the test result display unit displays the result obtained by the test unit based on the input or based on a predetermined criterion.
- the quality manager of the production process can accurately grasp the abnormality factor, and can quickly return the manufacturing process to the normal state by removing the abnormality factor.
- the program of the present invention is a program for causing a computer to execute the abnormality factor specifying method of the first aspect or the second aspect.
- the recording medium of the present invention is a computer-readable recording medium on which the program is recorded.
- the recording medium of the present invention it is possible to cause the computer to execute the abnormality factor specifying method of the first aspect or the second aspect by causing the computer to read the recorded content of the recording medium.
- the cause of the occurrence of defective products regardless of the characteristics of the manufacturing data and inspection data (distribution mode such as whether or not the distribution is normal). Manufacturing data can be specified with high accuracy.
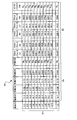
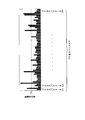
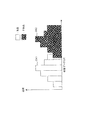
- FIG. 1 It is a figure which shows the flow of the abnormality factor identification method of one Embodiment of this invention. It is a figure which shows the structure of the abnormality factor identification system which performs the said abnormality factor identification method. It is a figure which shows the flow of the abnormality factor identification method of another embodiment of this invention. It is a figure which illustrates the data set obtained by the production process. It is a figure which illustrates the result of having calculated the difference of the influence degree at the time of defective article manufacture with respect to the time of non-defective article manufacture for every process parameter as manufacture data. It is a figure which illustrates the distribution of the inspection data about the manufactured product determined to be non-defective, and the distribution of the inspection data about the manufactured product determined to be defective.
- FIG. 10 is a diagram illustrating an example in which process parameters extracted as abnormal factor candidates are rearranged and displayed in descending order of test indices (t values) for the process parameters when t-test is performed in a test step. It is a figure which shows the example of a display by a test result display step in case a certain process parameter extracted as an abnormality factor candidate has influenced the test
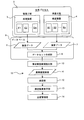
- FIG. 2 shows a block configuration of an abnormality factor identification system (generally indicated by reference numeral 15) according to an embodiment of the present invention for identifying the factor of occurrence of defective products in the semiconductor production process 5.
- the semiconductor production process 5 includes a manufacturing process 3 for performing a process on a manufactured product (wafer in this example) and an inspection process 4 for performing an inspection on the manufactured product.
- a manufacturing process 3 for performing a process on a manufactured product (wafer in this example) and an inspection process 4 for performing an inspection on the manufactured product.
- a plurality of manufacturing apparatuses E1, E2,..., Em sequentially perform process processing on manufactured products.
- an inspection such as an in-line inspection of a manufactured product being manufactured or a quality determination of a manufactured product for which the manufacturing process 3 has been completed is performed by a plurality of inspection devices B1, B2,.
- This abnormality factor specifying system 15 is generally provided with a database 9 as a storage unit, an abnormality factor candidate extraction unit 10, a test unit 12, and a test result display unit 13.
- the database 9 acquires one or more types of manufacturing data 6 including manufacturing conditions for each manufactured product from each manufacturing step 3 of the semiconductor production process 5, and the quality of the manufactured product from each inspection step 4. Inspection data (including pass / fail judgment results; hereinafter simply referred to as “inspection data”) 7 is acquired.
- the data set creation unit 8 belonging to the database 9 associates the manufacturing data 6 and the inspection data 7 for each manufactured product for each manufactured product, and the data set 8A (described later with reference to FIG. 4).
- the database 9 is configured by a server including a known hard disk drive device, for example.
- the abnormal factor candidate extraction unit 10 executes the abnormal factor candidate extraction process described later using the data set 8A accumulated in the database 9 to produce manufacturing data (process parameter) that is a cause of defective products (abnormal factor). ) Candidates (abnormality factor candidates) 11 are extracted.
- the test unit 12 extracts each piece of manufacturing data as the abnormal factor candidate 11, and uses the extracted manufacturing data to execute a statistical test as to whether or not the manufacturing data affects the inspection data. .
- the test result display unit 13 performs processing for displaying the result (output information) obtained by the test unit 12 on a display screen of an LCD (Liquid Crystal Display) or CRT (Cathode Ray Tube) (not shown), for example.
- LCD Liquid Crystal Display
- CRT Cathode Ray Tube
- the quality manager 14 looks at the screen displayed on the display screen by the test result display unit 13 and uses an input device (keyboard, mouse, etc.) (not shown) to the abnormal factor candidate extraction unit 10 and the test unit 12. Processing execution can be instructed, and processing conditions can be set.
- an input device keyboard, mouse, etc.
- the abnormal factor candidate extraction unit 10, the verification unit 12, and the verification result display unit 13 constitute an abnormal factor identification device, and in this example, includes a computer that executes arithmetic processing according to software (program).
- the data represented by “performance” Q1, Q2,..., QM is the performance of the device obtained by, for example, a wafer test or electrical characteristics.
- “Process parameters” A1, A2,..., AN are values of manufacturing conditions in the manufacturing process. The process parameters A1, A2,..., AN may be distinguished for each machine number (unit) of the manufacturing apparatus used in the manufacturing process and for each operator's name.
- FIG. 1 shows a schematic flow of an abnormality factor identification process executed by the abnormality factor identification system 15.
- step S1 the database 9 acquires the manufacturing data 6 and the inspection data 7 from the production process 5 and accumulates them.
- step S2 the data set creation unit 8 creates a data set 8A as illustrated in FIG. 4 by associating the manufacturing data 6 and the inspection data 7.
- step (abnormal factor candidate extraction step) S3 in FIG. 1 the abnormal factor candidate extraction unit 10 executes an abnormal factor candidate extraction process described below.
- the abnormal factor candidate extraction process the abnormal factor identification method disclosed in the above-mentioned Patent Document 1 (Japanese Patent Laid-Open No. 2009-009299) can be used.
- the data group included in the data set 8 A is determined based on the inspection data 7 as data on a non-defective product and data on a defective product.
- discrimination between non-defective products and defective products is performed using a management upper limit value, a management lower limit value, a 10% value, or a statistical value such as a 90% value set manually or automatically as a threshold value.
- a method other than the method shown here may be used as a method for discriminating between a non-defective product and a defective product.
- a principal component analysis as a multivariate analysis is performed from among the manufacturing data of the manufactured products determined to be non-defective in the data set 8A, and the manufacturing conditions of the manufactured products are most determined.
- a plurality of well-characterized feature quantities are extracted.
- the manufacturing data set X of N rows and M columns is decomposed as follows.
- N represents the number of manufactured products
- M represents the number of manufactured data.
- T is an N ⁇ R orthogonal matrix representing a principal component score matrix
- V is an M ⁇ R orthonormal matrix called an additive matrix.
- the superscript “ T ” means a transposed matrix.
- R represents the number of principal components to be extracted.
- E corresponds to a residual variable that is not represented in the extracted principal component model.
- At least one principal component to be used for analysis is selected from the principal components having a large contribution ratio to the original data before principal component analysis among the principal components obtained by principal component analysis in sub-step S3-3. Extract one.
- the origin represents an average production data set at the time of non-defective product production.
- sub-step S3-4 the distance (e.g., T 2 statistic Hotelling) between the point representing the manufacturing data of the origin and the respective article of manufacture in the feature quantity space expressed representative principal component as an axis
- the main significant difference between the average manufacturing data at the time of good product manufacturing and the respective manufacturing data at the time of defective product manufacturing is calculated.
- a residual component that is not expressed in the feature amount space expressed with the representative principal component as an axis is calculated as a sub-significant difference for each manufactured product.
- T 2 the main significant difference T 2 are calculated by the following equation.
- t r is the r principal component score
- sigma tr denotes the standard deviation of the r principal component score.
- x p is a submatrix of the manufacturing data set X, which means manufacturing data regarding the p-th variable, It refers to the estimated value of x p.
- sub-step S3-5 the contribution rate of each manufacturing data occupying this main significant difference is calculated as the main influence degree. Further, the contribution rate of each manufacturing data in the sub-significant difference is calculated as the sub-influence degree.
- t means a principal component score
- ⁇ p means a loading vector that is a coefficient between the principal component score and the original data.
- the fact that the main influence degree and the sub influence degree are “substantially increased” means that there is a significant difference in increase. For example, as shown in FIG. 5, for each of the process parameters A1, A2,. Difference).
- manufacturing data in this example, a process parameter in which the difference in influence level is larger than a certain threshold Th is extracted as an abnormal factor candidate 11.
- a plurality of process parameters may be extracted as the abnormal factor candidate 11.
- an abnormal factor candidate may be extracted simply based on the magnitude of the main influence degree when a defective product occurs.
- test unit 12 extracts each process parameter as the abnormal factor candidate 11 and uses the extracted process parameter. Perform a statistical test to determine if the process parameter affects the test data.
- the test unit 12 firstly has the characteristics of the data set 8A, here, inspection data for a manufactured product determined as a non-defective product and inspection data for a manufactured product determined as a defective product. Examine the distribution mode. Subsequently, whether or not the inspection data for the manufactured product determined to be non-defective and the inspection data for the manufactured product determined to be defective are normally distributed and equally distributed with each other. Determine. When the above assumption is satisfied, a parametric method is used as the statistical test method. When the above assumption is not satisfied, a non-parametric method is used as the statistical test method.
- the inspection data DX1 for a manufactured product determined as a non-defective product and the inspection data DX2 for a manufactured product determined as a defective product have normal distributions, respectively. It is assumed that they are distributed equally distributed (that is, the above assumption holds). In that case, a statistical test using a parametric method is performed. As a parametric statistical test method, t-test, F-test, regression analysis, or analysis of variance can be used.
- t-test is performed as follows.
- the sample average of individual parameters at the time of non-defective product extraction extracted from the data set is ⁇ A
- the sample average of individual parameters at the time of defective product manufacture is ⁇ B
- the number of data of each individual parameter is n A , n B.
- the calculated t value is checked against the t distribution table based on predetermined conditions (degree of freedom, confidence interval). That is, the calculated t value is compared with a value corresponding to a certain significance level (for example, 5%) in the t distribution table. As a result of the comparison, if the calculated t value is larger than the value collated in the t distribution table, it can be seen that there is a significant difference in the parameter group subjected to the test, that is, the test data is affected. On the contrary, when the calculated t value is smaller than the value collated in the t distribution table, it can be seen that there is no significant difference in the parameter group, that is, the examination data is not affected.
- a certain significance level for example, 5%
- a non-parametric method is used as the statistical test method.
- a sign test (sign test), Wilcoxon test (ranked code sum test), Mann-Whitney U test, chi-square test, or Fisher's exact test can be used. .
- the chi-square test is performed as follows.
- two processing devices E1 and E2 (each of which is capable of executing the manufacturing steps independently) are used in parallel in a certain manufacturing step.
- a case will be described as an example. Assume that the numbers of manufactured products processed by the processing apparatuses E1 and E2 within a certain period are f1 and f2, respectively. Further, the number of defective products among the manufactured products processed by the processing apparatuses E1 and E2 is set to f11 and f21, respectively. Further, the number of non-defective products among the processed products processed by the processing apparatuses E1 and E2 is set to f12 and f22, respectively.
- FIG. 7 shows a contingency table listing these numerical values.
- the front side items of this contingency table indicate process parameters (A3, A8 in this example), and the number of items is two.
- the top item of this contingency table is the number of defective / non-defective products, and the number of items is two.
- the front side is a variable in the vertical direction, and the front is a variable in the horizontal direction.
- a contingency table in which the number of items on the front side is s and the number of items on the front is t is called an s ⁇ t contingency table, and in the case of FIG. 7, it is called a 2 ⁇ 2 contingency table.
- f1 ⁇ , f2 ⁇ , f ⁇ 1, and f ⁇ 2 are frequencies representing the sum in the horizontal direction or the vertical direction, and are called peripheral frequencies.
- f11, f21, f12, and f22 are called observation frequencies.
- the statistic ⁇ 2 of the chi-square test can be calculated by the following equation.
- the fi ⁇ ⁇ f ⁇ j / n in this equation is called the theoretical frequency (or expected frequency) of the cell (i, j) constituting the contingency table of FIG. 7, and is predicted under the null hypothesis. Is the (expected) frequency.
- Significance probability 1-F ( ⁇ 2, ⁇ ) ⁇ If so, it is estimated that there is a correlation between the process parameter and the defective product occurrence rate at the significance level ⁇ . Traditionally, the significance level ⁇ is often 1% or 5%.
- F (x, ⁇ ) represents a chi-square cumulative distribution function with ⁇ degrees of freedom.
- the chi-square cumulative distribution function F (x, ⁇ ) can be expressed as follows using the chi-square probability density function f (x, ⁇ ).
- the defective product is generated between the process parameters (between the two process parameters A3 and A8 in the example of FIG. 7). There will be a difference in rate. That is, it is possible to find a possibility that there is a processing apparatus that significantly generates defective products in the two process parameters A3 and A8. Further, in a production process in which a plurality of manufacturing processes are sequentially performed, defective process estimation is performed for each manufacturing process, so that process parameter candidates for generating defective products can be listed.
- test result display step S4-2 in FIG. 1 the result obtained by the test step S4-1 is based on an input by an input device or based on a predetermined criterion. For example, it is displayed on an LCD display screen (not shown).
- the quality manager 14 can grasp whether or not the process parameter has a substantial influence on the inspection data. Therefore, the quality manager 14 can accurately grasp the abnormality factor in the production process 5 and can quickly return the production process 5 to a normal state by removing the abnormality factor.
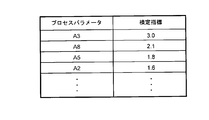
- FIG. 8 shows the process parameters extracted as the abnormal factor candidate 11 in the abnormal factor candidate extraction step S3 when the t test is performed as described above in the substep (testing step) S4-1.
- the process parameters are rearranged in the descending order of the test index (t value).
- the process parameters A3, A8, A5, A2,..., In descending order of test indices (t values) for the process parameters (in this example, 3.0, 2.1, 1.8, 1.6,...) Is displayed. Therefore, the quality manager 14 can easily grasp quantitatively and visually the extent to which the manufacturing data affects the quality for each manufacturing data as the abnormal factor candidate by viewing the display.
- process parameters extracted as the abnormal factor candidate 11 may be rearranged and displayed in ascending order of the test index (t value) for the process parameter.
- FIGS. 9 and 10 illustrate other display contents displayed on the display screen when the t-test is performed as described above in the sub-step (test step) S4-1.
- the distribution of non-defective products and the distribution of defective products occur in different ranges of process parameters as abnormal factor candidates extracted in the abnormal factor candidate extraction step S3.
- the quality manager 14 can grasp that the process parameter has a substantial influence on the inspection data.
- the distribution of non-defective products and the distribution of defective products occur in the same range of process parameters as the abnormal factor candidates extracted in the abnormal factor candidate extraction step S3.
- the quality manager 14 can grasp that the process parameter does not substantially affect the inspection data. Therefore, the quality manager 14 can accurately grasp the abnormality factor in the production process 5 and can quickly return the production process 5 to a normal state by removing the abnormality factor.
- FIG. 3 shows a schematic flow of this abnormality factor specifying process.
- step S11 the database 9 acquires the manufacturing data 6 and the inspection data 7 from the production process 5 and accumulates them.
- step S12 the data set creation unit 8 creates the data set 8A illustrated in FIG. 4 by associating the manufacturing data 6 and the inspection data 7.
- step (abnormal factor candidate extraction step) S13 in FIG. 3 the abnormal factor candidate extraction unit 10 executes an abnormal factor candidate extraction process described below. Specifically, an abnormal factor candidate that affects test data is extracted using an evaluation index calculated using a partial least square method as multivariate analysis.
- the evaluation index quantitatively represents the basis on which a certain process parameter should be extracted as an abnormal factor candidate.
- a VIP Very Importance Projection
- FIG. 11A conceptually shows how to calculate a VIP value as an evaluation index by the partial least square method.
- the VIP value indicates the importance of the variables in the projection, that is, the importance of each explanatory variable (here, the process parameter as a feature amount) with respect to the objective variable (here, inspection data) Y. It can be said that the explanatory variable having a higher VIP value has a greater influence on the prediction of the objective variable Y.
- the VIP value is defined by the following equation.
- A represents the number of components of PLS (Partial Least Squares).
- K represents the number of explanatory variables.
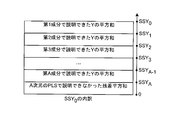
- SSY a represents “the residual sum of squares of the objective variable Y” that could not be explained by the a-dimensional PLS model.
- SSY 0 represents the variance (total sum of squares) of the objective variable Y.
- w ak represents the k th element of the weight vector w a of the a th component.
- the weight vector w a is It is expressed.
- Score t a using the weight vector w a, It is expressed.
- the VIP value is derived as follows.
- the magnitude of the weight vector is Because Holds.
- the influence (Variable Influence) VINak of the kth variable is defined as the following equation.
- (VIP AK ) 2 uses, for each component, the “sum of squares of Y that can be explained by the a-th component” as the weight w ak (the k-th of the weight vector w a of the a-th component). It means that the value is the sum of all the components.
- the abnormal factor candidate extraction unit 10 calculates a VIP value as an evaluation index using a partial least square method as a multivariate analysis in sub-step S13-1 in FIG.
- a latent variable (process parameter) that affects the inspection data is extracted as an abnormal factor candidate.
- the process parameter extracted as an abnormal factor candidate is output.
- the test unit 12 takes a countermeasure for each process parameter as the abnormal factor candidate based on the VIP value as the evaluation index.
- a priority representing the required order is calculated. For example, as illustrated in the table of FIG. 12, the priorities 1, 2, 3, 4,... Are assigned in descending order of VIP values as evaluation indices (in this example, 5.6, 4.4, 4.1, 3.6, etc wear.
- the order in which countermeasures are required is determined for each process parameter (in this example, A8, A5, A3, A2,...) As the abnormal factor candidate. Representing priorities 1, 2, 3, 4,... Are displayed. Therefore, the quality manager 14 can quantitatively and visually grasp the priority indicating the order in which countermeasures are required for each process parameter as the abnormal factor candidate by viewing the display.
- the test unit 12 uses the VIP value as the evaluation index as the abnormal factor candidate as illustrated in FIG.
- the process parameters in this example, A8, A5, A3, A2, etc.
- the process parameters that are estimated to affect the quality of the inspection data are selected. That is, process parameters as abnormal factor candidates are narrowed down.
- a threshold value (referred to as Th2) that is a criterion for determining whether or not the quality is affected is determined in advance.
- Th2 a threshold value that is a criterion for determining whether or not the quality is affected.
- the threshold value Th2 is set to 4.0. In this case, only the process parameters A8, A5, A3 having a VIP value larger than 4.0 are selected, and the process parameters A2,... Having a VIP value smaller than 4.0 are excluded from the abnormal factor candidates.
- the verification unit 12 extracts each of the process parameters as the abnormal factor candidate 11 in the substep (testing step) S14-3 in FIG. 3 in the same manner as in the substep S4-1 in FIG. Using the extracted process parameter, a statistical test is performed to determine whether the process parameter affects the inspection data.
- the test unit 12 firstly has the characteristics of the data set 8A, here, inspection data for a manufactured product determined as a non-defective product and inspection data for a manufactured product determined as a defective product. Examine the distribution mode. Subsequently, whether or not the inspection data for the manufactured product determined to be non-defective and the inspection data for the manufactured product determined to be defective are normally distributed and equally distributed with each other. Determine. When the above assumption is satisfied, a parametric method is used as the statistical test method. When the assumption is not satisfied, a non-parametric method is used as the statistical test method.
- test unit 12 inputs the result obtained in the test step S14-3 in the sub-step (test result display step) S14-4 as in the sub-step S4-2 in FIG. For example, it is displayed on a display screen of an LCD (not shown) based on an input from the apparatus or based on a predetermined standard.
- the quality manager 14 can grasp whether or not the process parameter has a substantial influence on the inspection data. Therefore, the quality manager 14 can accurately grasp the abnormality factor in the production process 5 and can quickly return the production process 5 to a normal state by removing the abnormality factor.
- the priority indicating the order in which countermeasures are required for each process parameter (in this example, A8, A5, A3, A2,8) As the abnormal factor candidate. 1, 2, 3, 4,... are displayed. Therefore, the quality manager 14 can quantitatively and visually grasp the priority indicating the order in which countermeasures are required for each process parameter as the abnormal factor candidate by viewing the display.
- Such a program may be recorded and distributed on a computer-readable recording medium such as a CD-ROM.
- a computer-readable recording medium such as a CD-ROM.
- the abnormality factor identification method and apparatus of the present invention manufactures a large number of products using various materials such as semiconductor manufacturing, solar cell manufacturing, thin display device manufacturing, chemical manufacturing, and steel manufacturing. It can be widely applied to various manufacturing fields.
Landscapes
- Engineering & Computer Science (AREA)
- General Engineering & Computer Science (AREA)
- Manufacturing & Machinery (AREA)
- Quality & Reliability (AREA)
- Physics & Mathematics (AREA)
- General Physics & Mathematics (AREA)
- Automation & Control Theory (AREA)
- General Factory Administration (AREA)
- Management, Administration, Business Operations System, And Electronic Commerce (AREA)
- Testing Or Measuring Of Semiconductors Or The Like (AREA)
Abstract
本発明の異常要因特定方法では、製造品毎にその製造品についての製造データと検査工程で得られた品質を表す検査データとが関連付けてデータセットとして取得される(S1,S2)。データセットのうち良品についての製造データと不良品についての製造データとの中から、多変量解析を行ってその製造品の製造条件を最も良く表す特徴量を少なくとも1つ抽出し、抽出された特徴量に基づいて、製造データの中から異常要因候補を抽出する(S3)。データセットから異常要因候補としての製造データを各々抽出し、その製造データが品質に影響を与えているか否かの統計学的検定を実行する(S4-1)。検定ステップにより得られた結果を、入力に基づいてまたは予め定められた基準に基づいて表示する(S4-2)。
Description
この発明は異常要因特定方法に関し、より詳しくは、生産プロセスにおいて不良品の発生の原因となるパラメータである異常要因を特定する異常要因特定方法に関する。
また、この発明は、そのような異常要因特定方法を実行する異常要因特定装置に関する。
また、この発明は、そのような異常要因特定方法をコンピュータに実行させるためのプログラムに関する。
また、この発明は、そのようなプログラムを記録したコンピュータ読み取り可能な記録媒体に関する。
製造品を大量に生産する生産プロセスにおいて効率的な生産を行うには、生産された製造品の品質検査結果または製造品の特性値から生産プロセスに異常があると判定された際、その異常の要因となる製造データを特定し、特定した製造データを正常な値に設定し直すことにより、生産プロセスを速やかに正常な状態に復帰させることが重要である。しかし、半導体製造工場のように多くの処理装置と検査装置とを用いて生産プロセスを実行する場合、取得されるデータは多種大量であり、異常の要因となり得るプロセスパラメータの数は非常に膨大となるため、品質管理者がプロセスパラメータを個別に確認することは、一般に困難である。
かかる生産プロセスに置いて不良品発生の要因となっている製造データを特定できる異常要因特定方法として、特許文献1(特開2009-009299号公報、「異常要因特定方法およびシステム、上記異常要因特定方法をコンピュータに実行させるためのプログラム、並びに上記プログラムを記録したコンピュータ読み取り可能な記録媒体」)に開示されたものが知られている。
その異常要因特定方法は、例えば図14中に示すような半導体生産プロセス59に適用されている。この半導体生産プロセス59は、製造品(この例ではウエハ)に対して1つ以上の製造工程56を実行するとともに、製造工程56を経た製造品を検査する検査工程(良否判定を含む。)55を実行するようになっている。データベース58は、半導体生産プロセス59の各製造工程56から製造品毎にその製造品についての製造条件を含む1種以上の製造データ54を取得するとともに、各検査工程55からその製造品についての品質を表す検査データ(良否判定結果を含む。)53を取得する。そして、製造品毎に、その製造品についての製造データ54と検査データ53とを関連付けして記憶する。
この半導体生産プロセス59に対して、上述の異常要因特定方法を実行するシステム(全体を符号51で示す。)は、記憶部としてのデータベース58と、ソフトウエア(プログラム)にしたがって演算処理を実行するコンピュータからなる異常要因特定部57と、この異常要因特定部57による処理結果を表示する表示装置(例えばLCD(液晶表示ディスプレイ)からなる)52とを備えている。
異常要因特定部57は、データベース58に蓄積された製造データ54と検査データ53を用いて後述の異常要因特定方法を実行して、不良品発生の要因(異常要因)となっている製造データを特定する。異常要因特定部57による処理内容や処理結果は、表示装置52の画面に表示される。作業者50は、表示装置52に表示された画面を見ながら、異常要因特定部57に対して処理の実行を指示し、また、処理条件を設定することができる。
異常要因特定部57は、概ね、図13に示すような処理(異常要因特定方法)を実行する。まず、データベース58に蓄積された製造データ54と検査データ53とを取得する(ステップS101)。取得されたデータ群では、上述のように、製造品毎に、その製造品についての製造データ54と検査データ53とが関連付けられている。次に、取得されたデータ群を、検査データ53に基づいて、良品についてのデータと不良品についてのデータとに判別する(ステップS102)。次に、良品と判定された製造品についての製造データの中から、主成分分析を行ってその製造品の製造条件を最も良く表す特徴量を少なくとも1つ抽出する(S103、S104)。次に、抽出した特徴量を軸として表される特徴量空間における原点と各製造品の製造データが表す点との間の距離(例えばホテリングのT2統計量)を、良品製造時の平均的な製造データと不良品製造時の各製造データとの間の主有意差としてそれぞれ算出する。また、特徴量を軸として表される特徴量空間においては表現されない残差成分を副有意差として製造品毎に算出する(S105)。次に、上記主有意差に占める各製造データの寄与率をそれぞれ主影響度として算出し、また、副有意差に占める各製造データの寄与率をそれぞれ副影響度として算出する(S106)。次に、製造データの中から、良品製造時に対して不良品製造時に主影響度または副影響度が実質的に増加(有意差のある増加)した製造データを異常要因として特定し、出力する(S107、S108)。なお、異常要因となっている製造データを特定するために、良品製造時に対して不良品製造時に上記主影響度が実質的に増加したという観点に加えて、不良品発生時の主影響度の大きさ自体の観点を加えても良い。
特許文献1における異常要因特定方法の1つの実施形態では、良品と判定された製造品について、上記製造データ毎に上記主影響度を累計して得られた各累計値を、関連する全製造データにわたって上記主影響度を累計して得られた総和値でそれぞれ除算して、上記各製造データについて上記主影響度を表す良品の主影響度正規化値を得る。一方、不良品と判定された製造品について、上記製造データ毎に上記主影響度を累計して得られた各累計値を、関連する全製造データにわたって上記主影響度を累計して得られた総和値でそれぞれ除算して、上記各製造データについて上記主影響度を表す不良品の主影響度正規化値を得る。そして、上記各製造データについて、上記良品の主影響度正規化値と上記不良品の主影響度正規化値とを比較して、上記異常要因となった製造データを特定する。
例えば、良品と判定された製造品iの製造データjについての主影響度を
 としたとき、上記良品の主影響度正規化値は
 で表される。また、不良品と判定された製造品iの製造データjについての主影響度を
 としたとき、上記不良品の主影響度正規化値は
 で表される。
この実施形態の異常要因特定方法により、良品と判定された製造品と不良品と判定された製造品の主影響度を全製造データの中での割合の大小で比較することが可能となる。これにより、良品と判定された製造品と不良品と判定された製造品の数が異なる場合などにおいても、不良品発生の要因となっている製造データ(異常要因)を特定することができる、と特許文献1では述べられている。
上記従来の異常要因特定方法では、不良品発生の要因となっている製造データを「特定」した後、この異常要因としての製造データが実際に不良品発生の要因となっているか否かについて検定を行っていないため、特定された異常要因が、必ず製造品の品質に影響を与えているか否かは、不明であると言える。
ここで、上記従来の異常要因特定方法では、上述の良品についてのデータと不良品についてのデータとが、正規分布かつ互いに等分散であるときは、異常要因を精度良く特定できると思われる。しかしながら、現実の生産プロセスで取得されるデータは、必ずしも正規分布にはなっておらず、また比較される良品と不良品のデータも必ずしも等分散にはなっていない。このため、上記従来の異常要因特定方法では、特定された異常要因が、必ずしも製造品の品質に影響を与えているとは限らないというおそれがある。
このため、上記従来の異常要因特定方法を実行したとしても、結局、品質管理者が、異常要因として特定された製造データ(プロセスパラメータを含む。)が実際に製造品の品質に影響を与えているかどうかを、プロセスパラメータ毎に個別に確認しなければならず、実際の異常要因の特定に時間がかかるという問題がある。この問題は、異常要因として抽出されたプロセスパラメータの数が多い場合に、特に深刻になる。結果として、製造工程を速やかに正常な状態に復帰させることができなくなる。
そこで、この発明の課題は、製造データや検査データの特性(正規分布であるか否かなどの分布の態様)によらず、不良品発生の要因となっている製造データを精度良く特定することができる異常要因特定方法を提供することにある。
また、この発明は、そのような異常要因特定方法を実行する異常要因特定装置を提供することにある。
また、この発明は、そのような異常要因特定方法をコンピュータに実行させるためのプログラムを提供することにある。
また、この発明は、そのようなプログラムを記録したコンピュータ読み取り可能な記録媒体を提供することにある。
上記課題を解決するため、この発明の第1の局面の異常要因特定方法は、
製造品に対して1つ以上の製造工程を実行するとともに上記製造工程を経た上記製造品についての品質検査を含む検査工程を実行する生産プロセスにおいて不良品発生の要因を特定する異常要因特定方法であって、
上記生産プロセスでは、上記製造品毎にその製造品についての製造条件を含む1種以上の製造データと上記検査工程で得られた品質を表す検査データとが関連付けてデータセットとして取得され、上記検査データによってその製造品が良品、不良品のいずれであるかが判定されるようになっており、
上記データセットのうち良品と判定された製造品についての製造データの中から、多変量解析を行ってその製造品の製造条件を最も良く表す特徴量を少なくとも1つ抽出し、上記抽出された特徴量に基づいて、良品製造時の平均的な製造データと不良品製造時の各製造データとの間の有意差をそれぞれ算出し、上記有意差に占める各製造データの寄与率をそれぞれ影響度として算出し、上記製造データの中から、良品製造時に対して不良品製造時に上記影響度が実質的に増加した製造データを異常要因候補として抽出する異常要因候補抽出ステップと、
上記データセットから上記異常要因候補としての製造データを各々抽出し、上記抽出された製造データを用いて、その製造データが上記品質に影響を与えているか否かの統計学的検定を実行する検定ステップと、
上記検定ステップにより得られた結果を、入力に基づいてまたは予め定められた基準に基づいて表示する検定結果表示ステップと、
を含むことを特徴とする。
製造品に対して1つ以上の製造工程を実行するとともに上記製造工程を経た上記製造品についての品質検査を含む検査工程を実行する生産プロセスにおいて不良品発生の要因を特定する異常要因特定方法であって、
上記生産プロセスでは、上記製造品毎にその製造品についての製造条件を含む1種以上の製造データと上記検査工程で得られた品質を表す検査データとが関連付けてデータセットとして取得され、上記検査データによってその製造品が良品、不良品のいずれであるかが判定されるようになっており、
上記データセットのうち良品と判定された製造品についての製造データの中から、多変量解析を行ってその製造品の製造条件を最も良く表す特徴量を少なくとも1つ抽出し、上記抽出された特徴量に基づいて、良品製造時の平均的な製造データと不良品製造時の各製造データとの間の有意差をそれぞれ算出し、上記有意差に占める各製造データの寄与率をそれぞれ影響度として算出し、上記製造データの中から、良品製造時に対して不良品製造時に上記影響度が実質的に増加した製造データを異常要因候補として抽出する異常要因候補抽出ステップと、
上記データセットから上記異常要因候補としての製造データを各々抽出し、上記抽出された製造データを用いて、その製造データが上記品質に影響を与えているか否かの統計学的検定を実行する検定ステップと、
上記検定ステップにより得られた結果を、入力に基づいてまたは予め定められた基準に基づいて表示する検定結果表示ステップと、
を含むことを特徴とする。
本明細書で、「製造品」とは、製造途中の仕掛かり品、および完成品を含む概念である。
また、影響度が「実質的に増加」とは、増加の有意差があることを意味する。
この発明の異常要因特定方法では、異常要因候補抽出ステップにおいて、まず、上記データセットのうち良品と判定された製造品についての製造データの中から、多変量解析を行ってその製造品の製造条件を最も良く表す特徴量を少なくとも1つ抽出する。次に、上記抽出された特徴量に基づいて、良品製造時の平均的な製造データと不良品製造時の各製造データとの間の有意差をそれぞれ算出する。次に、上記有意差に占める各製造データの寄与率をそれぞれ影響度として算出する。そして、上記製造データの中から、良品製造時に対して不良品製造時に上記影響度が実質的に増加した製造データを異常要因候補として抽出する。
次に、検定ステップにおいて、上記データセットから上記異常要因候補としての製造データを各々抽出し、上記抽出された製造データを用いて、その製造データが上記品質に影響を与えているか否かの統計学的検定を実行する。これにより、上記異常要因候補として抽出された製造データの各々が品質に影響を与えているか否かが、製造データや検査データの特性(正規分布であるか否かなどの分布の態様)によらず、上記統計学的検定によって精度良く確認される。
そして、この異常要因特定方法では、検定結果表示ステップにおいて、上記検定ステップにより得られた結果を、入力に基づいてまたは予め定められた基準に基づいて表示する。この結果の表示を見ることにより、上記生産プロセスの品質管理者(メンテナンス担当者や作業者であっても良い。以下同様。)は、不良品発生の要因である異常要因を正確に把握でき、その異常要因を取り除くことによって製造工程を速やかに正常な状態に復帰させることができる。
この発明の第2の局面の異常要因特定方法は、
製造品に対して1つ以上の製造工程を実行するとともに上記製造工程を経た上記製造品についての品質検査を含む検査工程を実行する生産プロセスにおいて不良品発生の要因を特定する異常要因特定方法であって、
上記生産プロセスでは、上記製造品毎にその製造品についての製造条件を含む1種以上の製造データと上記検査工程で得られた品質を表す検査データとが関連付けてデータセットとして取得され、上記検査データによってその製造品が良品、不良品のいずれであるかが判定されるようになっており、
上記データセットのうち良品と判定された製造品についての製造データと不良品と判定された製造品についての製造データとの中から、多変量解析を行ってその製造品の製造条件を最も良く表す特徴量を少なくとも1つ抽出し、上記抽出された特徴量に基づいて、上記製造データの中から異常要因候補を抽出する異常要因候補抽出ステップと、
上記データセットから上記異常要因候補としての製造データを各々抽出し、上記抽出された製造データを用いて、その製造データが上記品質に影響を与えているか否かの統計学的検定を実行する検定ステップと、
上記検定ステップにより得られた結果を、入力に基づいてまたは予め定められた基準に基づいて表示する検定結果表示ステップと、
を含むことを特徴とする。
製造品に対して1つ以上の製造工程を実行するとともに上記製造工程を経た上記製造品についての品質検査を含む検査工程を実行する生産プロセスにおいて不良品発生の要因を特定する異常要因特定方法であって、
上記生産プロセスでは、上記製造品毎にその製造品についての製造条件を含む1種以上の製造データと上記検査工程で得られた品質を表す検査データとが関連付けてデータセットとして取得され、上記検査データによってその製造品が良品、不良品のいずれであるかが判定されるようになっており、
上記データセットのうち良品と判定された製造品についての製造データと不良品と判定された製造品についての製造データとの中から、多変量解析を行ってその製造品の製造条件を最も良く表す特徴量を少なくとも1つ抽出し、上記抽出された特徴量に基づいて、上記製造データの中から異常要因候補を抽出する異常要因候補抽出ステップと、
上記データセットから上記異常要因候補としての製造データを各々抽出し、上記抽出された製造データを用いて、その製造データが上記品質に影響を与えているか否かの統計学的検定を実行する検定ステップと、
上記検定ステップにより得られた結果を、入力に基づいてまたは予め定められた基準に基づいて表示する検定結果表示ステップと、
を含むことを特徴とする。
この発明の異常要因特定方法では、異常要因候補抽出ステップにおいて、まず、上記データセットのうち良品と判定された製造品についての製造データと不良品と判定された製造品についての製造データとの中から、多変量解析を行ってその製造品の製造条件を最も良く表す特徴量を少なくとも1つ抽出する。そして、上記抽出された特徴量に基づいて、上記製造データの中から異常要因候補を抽出する。
次に、検定ステップにおいて、上記データセットから上記異常要因候補としての製造データを各々抽出し、上記抽出された製造データを用いて、その製造データが上記品質に影響を与えているか否かの統計学的検定を実行する。これにより、上記異常要因候補として抽出された製造データの各々が品質に影響を与えているか否かが、製造データや検査データの特性(正規分布であるか否かなどの分布の態様)によらず、上記統計学的検定によって精度良く確認される。
そして、この異常要因特定方法では、検定結果表示ステップにおいて、上記検定ステップにより得られた結果を、入力に基づいてまたは予め定められた基準に基づいて表示する。この結果の表示を見ることにより、上記生産プロセスの品質管理者は、異常要因を正確に把握でき、その異常要因を取り除くことによって製造工程を速やかに正常な状態に復帰させることができる。
一実施形態の異常要因特定方法では、上記検定ステップは、上記異常要因候補抽出ステップにて抽出された異常要因候補としての製造データ毎に、その製造データが上記品質に影響を与えている程度を定量的に表す検定指標を算出することを特徴とする。
この一実施形態の異常要因特定方法では、上記検定ステップは、上記異常要因候補抽出ステップにて抽出された異常要因候補としての製造データ毎に、その製造データが上記品質に影響を与えている程度を定量的に表す検定指標を算出する。この結果、上記検定結果表示ステップでは、上記異常要因候補抽出ステップにて抽出された異常要因候補としての製造データ毎に、その製造データが上記品質に影響を与えている程度を定量的に表す検定指標が表示される。したがって、上記生産プロセスの品質管理者は、上記検定指標に基づいて、異常要因候補としての製造データ毎に、その製造データが品質に影響を与えている程度を把握できる。
一実施形態の異常要因特定方法では、上記検定ステップは、上記異常要因候補抽出ステップにて抽出された異常要因候補としての製造データが有意であるか否かを、その製造データ毎に求めることを特徴とする。
この一実施形態の異常要因特定方法では、上記検定ステップは、上記異常要因候補抽出ステップにて抽出された異常要因候補としての製造データが有意であるか否かを、その製造データ毎に求める。この結果、上記検定結果表示ステップでは、上記異常要因候補抽出ステップにて抽出された異常要因候補としての製造データが有意であるか否かが、その製造データ毎に表示される。したがって、上記生産プロセスの品質管理者は、上記有意であるか否かの表示に基づいて、上記異常要因候補抽出ステップにて抽出された異常要因候補としての製造データが品質に対して実質的に影響を与えているか否かを把握できる。
一実施形態の異常要因特定方法では、上記検定結果表示ステップは、上記異常要因候補抽出ステップにて抽出された異常要因候補としての製造データを、その製造データについての上記検定指標が大きい順または小さい順に並べ直して表示することを特徴とする。
この一実施形態の異常要因特定方法では、上記検定結果表示ステップで、上記異常要因候補抽出ステップにて抽出された異常要因候補としての製造データが、その製造データについての上記検定指標が大きい順または小さい順に並べ直して表示される。したがって、上記生産プロセスの品質管理者は、その表示を見ることにより、異常要因候補としての製造データ毎に、その製造データが品質に影響を与えている程度を、定量的かつ視覚的に容易に把握できる。
一実施形態の異常要因特定方法では、
上記異常要因候補抽出ステップは、上記異常要因候補としての製造データ毎に、その製造データが上記異常要因候補として抽出されるべき根拠を定量的に表す評価指標を算出し、
上記検定ステップは、上記評価指標に基づいて、上記異常要因候補抽出ステップにおいて抽出された上記異常要因候補としての製造データの中から、上記品質に影響を与えていると推定される製造データを選別して、上記統計学的検定を実行することを特徴とする。
上記異常要因候補抽出ステップは、上記異常要因候補としての製造データ毎に、その製造データが上記異常要因候補として抽出されるべき根拠を定量的に表す評価指標を算出し、
上記検定ステップは、上記評価指標に基づいて、上記異常要因候補抽出ステップにおいて抽出された上記異常要因候補としての製造データの中から、上記品質に影響を与えていると推定される製造データを選別して、上記統計学的検定を実行することを特徴とする。
この一実施形態の異常要因特定方法では、上記異常要因候補抽出ステップは、上記異常要因候補としての製造データ毎に、その製造データが上記異常要因候補として抽出されるべき根拠を定量的に表す評価指標を算出する。そして、上記検定ステップは、上記評価指標に基づいて、上記異常要因候補抽出ステップにおいて抽出された上記異常要因候補としての製造データの中から、上記品質に影響を与えていると推定される製造データを選別する。つまり、異常要因候補を絞り込む。そして、その選別された製造データを用いて、その製造データが上記品質に影響を与えているか否かの統計学的検定を実行する。これにより、上記選別された第2次の異常要因候補として抽出された製造データの各々が品質に影響を与えているか否かが、上記統計学的検定によって精度良く確認される。このようにした場合、異常要因を少ない計算量でかつ迅速に求めることができる。
一実施形態の異常要因特定方法では、上記検定ステップは、上記評価指標に基づいて、上記異常要因候補としての製造データ毎に、対策が求められる順位を表す優先度を算出することを特徴とする。
この一実施形態の異常要因特定方法では、上記検定ステップは、上記評価指標に基づいて、上記異常要因候補としての製造データ毎に、対策が求められる順位を表す優先度を算出する。この結果、上記検定結果表示ステップでは、上記異常要因候補としての製造データ毎に、対策が求められる順位を表す優先度が表示される。したがって、上記生産プロセスの品質管理者は、その表示を見ることにより、上記異常要因候補としての製造データ毎に、対策が求められる順位を表す優先度を、定量的かつ視覚的に把握できる。
一実施形態の異常要因特定方法では、上記検定ステップは、上記データセットの特性に応じて上記統計学的検定の手法を選択することを特徴とする。
ここで、上記データセットの「特性」とは、製造データや検査データが正規分布であるか否かなどの分布の態様を指す。
この一実施形態の異常要因特定方法では、上記検定ステップは、上記データセットの特性に応じて、例えば最適な上記統計学的検定の手法を選択する。これにより、上記異常要因候補として抽出された製造データの各々が品質に影響を与えているか否かが、上記統計学的検定によってさらに精度良く確認される。
一実施形態の異常要因特定方法では、上記検定ステップは、上記データセットにおける検査データのうち、良品と判定された製造品についての検査データと不良品と判定された製造品についての検査データとが、それぞれ正規分布であり、かつ互いに等分散であるとの仮定が成り立つ場合は、上記統計学的検定の手法としてパラメトリック手法を用いる一方、上記仮定が成り立たない場合は、上記統計学的検定の手法としてノンパラメトリック手法を用いることを特徴とする。
この一実施形態の異常要因特定方法では、上記異常要因候補として抽出された製造データの各々が品質に影響を与えているか否かが、上記統計学的検定によってさらに精度良く確認される。
この発明の異常要因特定装置は、
製造品に対して1つ以上の製造工程を実行するとともに上記製造工程を経た上記製造品についての品質検査を含む検査工程を実行する生産プロセスにおいて不良品発生の要因を特定する異常要因特定装置であって、
上記生産プロセスでは、上記製造品毎にその製造品についての製造条件を含む1種以上の製造データと上記検査工程で得られた品質を表す検査データとが関連付けてデータセットとして取得され、上記検査データによってその製造品が良品、不良品のいずれであるかが判定されるようになっており、
上記データセットのうち良品と判定された製造品についての製造データの中から、多変量解析を行ってその製造品の製造条件を最も良く表す特徴量を少なくとも1つ抽出し、上記抽出された特徴量に基づいて、良品製造時の平均的な製造データと不良品製造時の各製造データとの間の有意差をそれぞれ算出し、上記有意差に占める各製造データの寄与率をそれぞれ影響度として算出し、上記製造データの中から、良品製造時に対して不良品製造時に上記影響度が実質的に増加した製造データを異常要因候補として抽出する異常要因候補抽出部と、
上記データセットから上記異常要因候補としての製造データを各々抽出し、上記抽出された製造データを用いて、その製造データが上記品質に影響を与えているか否かの統計学的検定を実行する検定部と、
上記検定部により得られた結果を、入力に基づいてまたは予め定められた基準に基づいて表示する検定結果表示部と、
を含むことを特徴とする。
製造品に対して1つ以上の製造工程を実行するとともに上記製造工程を経た上記製造品についての品質検査を含む検査工程を実行する生産プロセスにおいて不良品発生の要因を特定する異常要因特定装置であって、
上記生産プロセスでは、上記製造品毎にその製造品についての製造条件を含む1種以上の製造データと上記検査工程で得られた品質を表す検査データとが関連付けてデータセットとして取得され、上記検査データによってその製造品が良品、不良品のいずれであるかが判定されるようになっており、
上記データセットのうち良品と判定された製造品についての製造データの中から、多変量解析を行ってその製造品の製造条件を最も良く表す特徴量を少なくとも1つ抽出し、上記抽出された特徴量に基づいて、良品製造時の平均的な製造データと不良品製造時の各製造データとの間の有意差をそれぞれ算出し、上記有意差に占める各製造データの寄与率をそれぞれ影響度として算出し、上記製造データの中から、良品製造時に対して不良品製造時に上記影響度が実質的に増加した製造データを異常要因候補として抽出する異常要因候補抽出部と、
上記データセットから上記異常要因候補としての製造データを各々抽出し、上記抽出された製造データを用いて、その製造データが上記品質に影響を与えているか否かの統計学的検定を実行する検定部と、
上記検定部により得られた結果を、入力に基づいてまたは予め定められた基準に基づいて表示する検定結果表示部と、
を含むことを特徴とする。
この発明の異常要因特定装置では、異常要因候補抽出部において、まず、上記データセットのうち良品と判定された製造品についての製造データの中から、多変量解析を行ってその製造品の製造条件を最も良く表す特徴量を少なくとも1つ抽出する。次に、上記抽出された特徴量に基づいて、良品製造時の平均的な製造データと不良品製造時の各製造データとの間の有意差をそれぞれ算出する。次に、上記有意差に占める各製造データの寄与率をそれぞれ影響度として算出する。そして、上記製造データの中から、良品製造時に対して不良品製造時に上記影響度が実質的に増加した製造データを異常要因候補として抽出する。
次に、検定部において、上記データセットから上記異常要因候補としての製造データを各々抽出し、上記抽出された製造データを用いて、その製造データが上記品質に影響を与えているか否かの統計学的検定を実行する。これにより、上記異常要因候補として抽出された製造データの各々が品質に影響を与えているか否かが、製造データや検査データの特性(正規分布であるか否かなどの分布の態様)によらず、上記統計学的検定によって精度良く確認される。
そして、この異常要因特定装置では、検定結果表示部において、上記検定部により得られた結果を、入力に基づいてまたは予め定められた基準に基づいて表示する。この結果の表示を見ることにより、上記生産プロセスの品質管理者(メンテナンス担当者や作業者であっても良い。以下同様。)は、不良品発生の要因である異常要因を正確に把握でき、その異常要因を取り除くことによって製造工程を速やかに正常な状態に復帰させることができる。
別の局面では、この発明の異常要因特定装置は、
製造品に対して1つ以上の製造工程を実行するとともに上記製造工程を経た上記製造品についての品質検査を含む検査工程を実行する生産プロセスにおいて不良品発生の要因を特定する異常要因特定装置であって、
上記生産プロセスでは、上記製造品毎にその製造品についての製造条件を含む1種以上の製造データと上記検査工程で得られた品質を表す検査データとが関連付けてデータセットとして取得され、上記検査データによってその製造品が良品、不良品のいずれであるかが判定されるようになっており、
上記データセットのうち良品と判定された製造品についての製造データと不良品と判定された製造品についての製造データとの中から、多変量解析を行ってその製造品の製造条件を最も良く表す特徴量を少なくとも1つ抽出し、上記抽出された特徴量に基づいて、上記製造データの中から異常要因候補を抽出する異常要因候補抽出部と、
上記データセットから上記異常要因候補としての製造データを各々抽出し、上記抽出された製造データを用いて、その製造データが上記品質に影響を与えているか否かの統計学的検定を実行する検定部と、
上記検定部により得られた結果を、入力に基づいてまたは予め定められた基準に基づいて表示する検定結果表示部と、
を含むことを特徴とする。
製造品に対して1つ以上の製造工程を実行するとともに上記製造工程を経た上記製造品についての品質検査を含む検査工程を実行する生産プロセスにおいて不良品発生の要因を特定する異常要因特定装置であって、
上記生産プロセスでは、上記製造品毎にその製造品についての製造条件を含む1種以上の製造データと上記検査工程で得られた品質を表す検査データとが関連付けてデータセットとして取得され、上記検査データによってその製造品が良品、不良品のいずれであるかが判定されるようになっており、
上記データセットのうち良品と判定された製造品についての製造データと不良品と判定された製造品についての製造データとの中から、多変量解析を行ってその製造品の製造条件を最も良く表す特徴量を少なくとも1つ抽出し、上記抽出された特徴量に基づいて、上記製造データの中から異常要因候補を抽出する異常要因候補抽出部と、
上記データセットから上記異常要因候補としての製造データを各々抽出し、上記抽出された製造データを用いて、その製造データが上記品質に影響を与えているか否かの統計学的検定を実行する検定部と、
上記検定部により得られた結果を、入力に基づいてまたは予め定められた基準に基づいて表示する検定結果表示部と、
を含むことを特徴とする。
この発明の異常要因特定装置では、異常要因候補抽出部において、まず、上記データセットのうち良品と判定された製造品についての製造データと不良品と判定された製造品についての製造データとの中から、多変量解析を行ってその製造品の製造条件を最も良く表す特徴量を少なくとも1つ抽出する。そして、上記抽出された特徴量に基づいて、上記製造データの中から異常要因候補を抽出する。
次に、検定部において、上記データセットから上記異常要因候補としての製造データを各々抽出し、上記抽出された製造データ用いて、その製造データが上記品質に影響を与えているか否かの統計学的検定を実行する。これにより、上記異常要因候補として抽出された製造データの各々が品質に影響を与えているか否かが、製造データや検査データの特性(正規分布であるか否かなどの分布の態様)によらず、上記統計学的検定によって精度良く確認される。
そして、この異常要因特定装置では、検定結果表示部において、上記検定部により得られた結果を、入力に基づいてまたは予め定められた基準に基づいて表示する。この結果の表示を見ることにより、上記生産プロセスの品質管理者は、異常要因を正確に把握でき、その異常要因を取り除くことによって製造工程を速やかに正常な状態に復帰させることができる。
この発明のプログラムは、第1の局面または第2の局面の異常要因特定方法をコンピュータに実行させるためのプログラムである。
この発明のプログラムによれば、コンピュータに第1の局面または第2の局面の異常要因特定方法を実行させることができる。
この発明の記録媒体は、上記プログラムが記録されたコンピュータ読み取り可能な記録媒体である。
この発明の記録媒体によれば、記録媒体の記録内容をコンピュータに読み取らせることで、上記コンピュータに第1の局面または第2の局面の異常要因特定方法を実行させることができる。
以上より明らかなように、この発明の異常要因特定方法および装置によれば、製造データや検査データの特性(正規分布であるか否かなどの分布の態様)によらず、不良品発生の要因となっている製造データを精度良く特定することができる。
(第1実施形態)
図2は、半導体生産プロセス5において不良品発生の要因を特定するためのこの発明の一実施形態の異常要因特定システム(全体を符号15で示す。)のブロック構成を示している。
図2は、半導体生産プロセス5において不良品発生の要因を特定するためのこの発明の一実施形態の異常要因特定システム(全体を符号15で示す。)のブロック構成を示している。
半導体生産プロセス5は、製造品(この例ではウエハ)に対してプロセス処理を行う製造工程3と、製造品に対して検査を実行する検査工程4とを含んでいる。製造工程3では、複数の製造装置E1、E2、…、Emによって、製造品に対して順次プロセス処理を実行するようになっている。検査工程4では、複数の検査装置B1、B2、…、Bnによって、製造途中の製造品についてのインライン検査や、製造工程3が完了した製造品の良否判定などの検査が行われる。
この異常要因特定システム15は、概略、記憶部としてのデータベース9と、異常要因候補抽出部10と、検定部12と、検定結果表示部13とを備えている。
データベース9は、半導体生産プロセス5の各製造工程3から製造品毎にその製造品についての製造条件を含む1種以上の製造データ6を取得するとともに、各検査工程4からその製造品についての品質を表す検査データ(良否判定結果を含む。以下、単に「検査データ」という。)7を取得する。そして、この例ではデータベース9に属するデータセット作成部8によって、製造品毎に、その製造品についての製造データ6と検査データ7とを関連付けて、データセット8A(図4を用いて後述する)として記憶する。データベース9は、例えば公知のハードディスクドライブ装置を含むサーバによって構成される。
異常要因候補抽出部10は、データベース9に蓄積されたデータセット8Aを用いて後述の異常要因候補抽出処理を実行して、不良品発生の要因(異常要因)となっている製造データ(プロセスパラメータを含む)の候補(異常要因候補)11を抽出する。
検定部12は、異常要因候補11としての製造データを各々抽出し、上記抽出された製造データを用いて、その製造データが検査データに影響を与えているか否かの統計学的検定を実行する。
検定結果表示部13は、検定部12により得られた結果(出力情報)を、例えば図示しないLCD(液晶表示ディスプレイ)またはCRT(陰極線管)の表示画面に表示する処理を行う
品質管理者14は、検定結果表示部13によって表示画面に表示された画面を見ながら、図示しない入力装置(キーボードやマウスなど)を用いて、異常要因候補抽出部10や検定部12に対して処理の実行を指示し、また、処理条件を設定することができる。
異常要因候補抽出部10、検定部12および検定結果表示部13は、異常要因特定装置を構成しており、この例では、ソフトウエア(プログラム)にしたがって演算処理を実行するコンピュータからなる。
図4に示すように、この例では、データセット8Aとして、欄8cに示す製品ロットLt1、Lt2、…、LtL毎に、欄8aに示す検査データとしてのM個の「性能」Q1、Q2、…、QMと、欄8bに示す製造データとしてのN個の「プロセスパラメータ」A1、A2、…、ANとが、互いに関連付けて記憶されている。
半導体製造分野での例では、「性能」Q1、Q2、…、QMが表すデータは、例えばウェハテストや電気特性等で得られたデバイスの性能である。「プロセスパラメータ」A1、A2、…、ANは、製造工程における製造条件の値である。プロセスパラメータA1、A2、…、ANは、製造工程に使用された製造装置の機番(号機)や作業者の名前毎に区別されていても良い。
図1は、異常要因特定システム15が実行する異常要因特定処理の概略フローを示している。
この異常要因特定処理では、まず、ステップS1で、データベース9は、生産プロセス5から製造データ6と検査データ7とを取得して蓄積する。ステップS2で、データセット作成部8が、製造データ6と検査データ7とを関連付けて、図4に例示したようなデータセット8Aを作成する。
次に、図1中のステップ(異常要因候補抽出ステップ)S3で、異常要因候補抽出部10は、次に述べる異常要因候補抽出処理を実行する。なお、この異常要因候補抽出処理としては、既述の特許文献1(特開2009-009299号公報)に開示された異常要因特定方法を利用できる。
具体的には、まず、サブステップS3-1で、データセット8Aに含まれたデータ群を、検査データ7に基づいて、良品についてのデータと不良品についてのデータとに判別する。この例では、良品と不良品との判別は、手動または自動で設定された管理上限値、管理下限値または10%値、90%値のような統計値を閾値として行われる。そして、検査データの値が閾値内の製造品は良品であると判定され、閾値外の製造品は不良品であると判定される。なお、良品と不良品の判別方法はここに示す方法以外の方法でも良い。
次に、サブステップS3-2で、上記データセット8Aのうち良品と判定された製造品についての製造データの中から、多変量解析としての主成分分析を行ってその製造品の製造条件を最も良く表す特徴量を複数抽出する。この主成分分析では、各製造データの平均が0、分散が1になるように標準化する処理を行った後、N行M列の製造データ集合Xについて次のように分解を行う。
 ここで、Nは製造品数、Mは製造データ数を表す。Tは主成分得点行列を表すN×Rの直交行列であり、Vは付加量行列と呼ばれるM×Rの正規直交行列である。上添え字の「T」は転置行列であることを意味する。Rは抽出する主成分数を表す。Eは抽出した主成分モデルでは表現されない残差変数に相当する。
次に、サブステップS3-3で、主成分分析により得られた主成分のうち、主成分分析前の元データに対し寄与率の大きな主成分の中から解析に使用すべき主成分を少なくとも1つ抽出する。ここで、抽出された主成分(これを「代表主成分」と呼ぶ。)を軸とする主成分空間において、原点は良品製造時の平均的な製造データ集合を表す。
次に、サブステップS3-4で、代表主成分を軸として表される特徴量空間における原点と上記各製造品の製造データが表す点との間の距離(例えばホテリングのT2統計量)を、良品製造時の平均的な製造データと不良品製造時の各製造データとの間の主有意差としてそれぞれ算出する。また、上記代表主成分を軸として表される特徴量空間においては表現されない残差成分を副有意差として製造品毎に算出する。
ここで、主有意差T2は次式のように算出される。
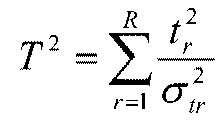 この式において、trは第r主成分得点、σtrは第r主成分得点の標準偏差を意味する。
また、副有意差Qは次式により算出される。
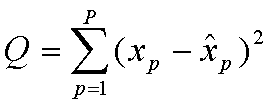 この式において、xpは製造データ集合Xの部分行列であり、第p変数に関する製造データを意味し、
 はxpの推定値を意味する。
次に、サブステップS3-5で、この主有意差に占める各製造データの寄与率をそれぞれ主影響度として算出する。また、この副有意差に占める各製造データの寄与率をそれぞれ副影響度として算出する。
ここで、主影響度は次式により算出される。
 この式において、tは主成分得点を意味し、また、νpは主成分得点と元データとの係数であるローディングベクトルを意味する。
また、副影響度は次式により算出される。

次に、サブステップS3-6で、上記製造データの中から、良品製造時に対して不良品製造時に主影響度および/または副影響度が実質的に増加した製造データを、異常要因候補11として抽出する。ここで主影響度、副影響度が「実質的に増加」とは、増加の有意差があることを意味する。例えば図5に示すように、製造データとしてのプロセスパラメータA1、A2、…、AN毎に、良品製造時に対して不良品製造時の、主影響度および/または副影響度の増加分(影響度の差)を算出する。そして、上記影響度の差が或る閾値Thよりも大きい製造データ(この例ではプロセスパラメータとする。)を、異常要因候補11として抽出する。異常要因候補11として抽出されるプロセスパラメータは、複数であっても良い。
なお、上記影響度の差に代えて、単に、不良品発生時の主影響度の大きさに基づいて、異常要因候補を抽出しても良い。
次に、図1中のステップS4の最初のサブステップ(検定ステップ)S4-1で、検定部12は、異常要因候補11としてのプロセスパラメータを各々抽出し、上記抽出されたプロセスパラメータを用いて、そのプロセスパラメータが検査データに影響を与えているか否かの統計学的検定を実行する。
具体的には、抽出されたプロセスパラメータ毎に、そのプロセスパラメータが不良品発生の要因となっているという仮説について、統計学的検定を実施する。
統計学的検定を実施するために、検定部12は、まず、上記データセット8Aの特性、ここでは良品と判定された製造品についての検査データと不良品と判定された製造品についての検査データの分布の態様を調べる。続いて、良品と判定された製造品についての検査データと不良品と判定された製造品についての検査データとが、それぞれ正規分布であり、かつ互いに等分散であるとの仮定が成り立つか否かを判定する。そして、上記仮定が成り立つ場合は、上記統計学的検定の手法としてパラメトリック手法を用いる一方、上記仮定が成り立たない場合は、上記統計学的検定の手法としてノンパラメトリック手法を用いる。
例えば、図6に例示するように、検査データDXとして、良品と判定された製造品についての検査データDX1と不良品と判定された製造品についての検査データDX2とがそれぞれ正規分布であり、かつ互いに等分散で分布している(つまり、上記仮定が成り立つ)ものとする。その場合は、パラメトリックな手法を用いた統計学的検定を実施する。パラメトリックな統計学的検定手法としては、t検定、F検定、回帰分析、または分散分析を用いることができる。
例えば、パラメトリックな統計学的検定手法としてt検定を用いる場合、t検定は次のようにして行われる。
まず、データセットから抽出された、良品製造時の個別のパラメータの標本平均をμA、不良品製造時の個別のパラメータの標本平均をμB、各個別のパラメータのデータ数をnA、nBとする。すると、上記2つのデータ群間の検定指標(t値)は、次式により算出される。

算出されたt値を、予め定めておいた条件(自由度、信頼区間)をもとに、t分布表と照合を行う。すなわち、算出されたt値をt分布表における或る有意水準(例えば5%)に応じた値と比較する。比較の結果、算出されたt値がt分布表にて照合された値より大きくなる場合は、検定を行ったパラメータ群に有意差がある、つまり検査データに影響を与えていることがわかる。逆に、算出されたt値がt分布表にて照合された値より小さくなる場合は、パラメータ群に有意差がない、つまり検査データに影響を与えていないことがわかる。
一方、良品と判定された製造品についての検査データと不良品と判定された製造品についての検査データとが、それぞれ正規分布であり、かつ互いに等分散であるとの仮定が成り立たない場合は、上記統計学的検定の手法としてノンパラメトリック手法を用いる。ノンパラメトリックな統計学的検定手法としては、サイン検定(符号検定)、Wilcoxon検定(順位付符号和検定)、Mann-WhitneyのU検定、カイ二乗検定、またはフィッシャーの直接確率検定を用いることができる。
例えば、ノンパラメトリックな統計学的検定手法としてカイ二乗検定を用いる場合、カイ二乗検定は次のようにして行われる。
複数の製造工程を順次実行する生産プロセスにおいて、或る製造工程で2台の処理装置E1、E2(それぞれ単独でその製造工程を実行可能な装置であるものとする。)が並行して用いられる場合を例として説明する。或る期間内に、処理装置E1、E2で処理された製造品数を、それぞれf1・、f2・とする。また、処理装置E1、E2で処理された製造品の中で不良品数を、それぞれf11、f21とする。また、処理装置E1、E2で処理された製造品の中で良品数を、それぞれf12、f22とする。また、この製造工程で処理された不良品の合計数をf・1、良品の合計数をf・2とする。これらの数値を一覧にした分割表を、図7に示す。この分割表の表側の項目はプロセスパラメータ(この例ではA3、A8)を示し、項目数は2個である。この分割表の表頭の項目は不良品/良品数であり、項目数は2個である。ここで、表側は縦方向にある変数であり、表頭は横方向にある変数である。一般に、表側の項目数がs個、表頭の項目数がt個の場合の分割表を、s×t分割表と呼び、図7の場合は2×2分割表と呼ぶ。全製造品数をnとすると、次の式が成り立つ。
n=f1・+f2・=f・1+f・2
n=f1・+f2・=f・1+f・2
また、f1・、f2・、f・1、f・2は、横方向あるいは縦方向の合計を表す度数であり、周辺度数と呼ばれる。f11、f21、f12、f22は、観測度数と呼ばれる。 カイ2乗検定の統計量χ2は、次の式で計算できる。
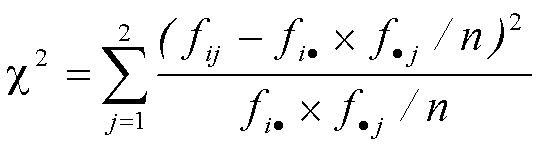
この式中のfi・×f・j/nは、図7の分割表を構成するセル(i,j)の理論度数(あるいは期待度数)と呼ばれ、帰無仮説の下で、予測される(期待される)度数である。また、図7の分割表の自由度νは、(表側の項目数-1)×(表頭の項目数-1)=1×1=1である。
有意確率=1-F(χ2,ν)<α
であれば有意水準αで、プロセスパラメータと不良品発生率に相関があると推定される。有意水準αは、1%ないしは5%とすることが伝統的に多い。ここで、F(x,ν)は、自由度νのカイ2乗累積分布関数を表す。また、カイ2乗累積分布関数F(x,ν)は、カイ2乗確率密度関数f(x,ν)を使って、次式のように表すことができる。

有意確率=1-F(χ2,ν)<α
であれば有意水準αで、プロセスパラメータと不良品発生率に相関があると推定される。有意水準αは、1%ないしは5%とすることが伝統的に多い。ここで、F(x,ν)は、自由度νのカイ2乗累積分布関数を表す。また、カイ2乗累積分布関数F(x,ν)は、カイ2乗確率密度関数f(x,ν)を使って、次式のように表すことができる。
有意水準αで処理装置と不良品発生率に相関があると検定された場合、このプロセスパラメータの間には(図7の例では2項目のプロセスパラメータA3、A8間には)、不良品発生率に差があることになる。すなわち、2項目のプロセスパラメータA3、A8の中に著しく不良品を発生させる処理装置が存在する可能性を見つけることができる。さらに、複数の製造工程を順次実行する生産プロセスにおいて、製造工程毎に不良工程推定を行うことで、不良品を発生させるプロセスパラメータの候補をリストアップすることができる。
次に、図1中のサブステップ(検定結果表示ステップ)S4-2で、上記検定ステップS4-1により得られた結果を、入力装置による入力に基づいてまたは予め定められた基準に基づいて、例えば図示しないLCDの表示画面に表示する。
この結果の表示を見ることにより、品質管理者14は、そのプロセスパラメータが検査データに対して実質的に大きく影響を与えているか否かを把握できる。したがって、品質管理者14は、生産プロセス5における異常要因を正確に把握でき、その異常要因を取り除くことによって生産プロセス5を速やかに正常な状態に復帰させることができる。
例えば図8は、上記サブステップ(検定ステップ)S4-1で上述のようにt検定を行った場合に、上記異常要因候補抽出ステップS3にて異常要因候補11として抽出されたプロセスパラメータを、そのプロセスパラメータについての検定指標(t値)が大きい順に並べ直して表示した例を示している。この例では、プロセスパラメータA3、A8、A5、A2、…というように、そのプロセスパラメータについての検定指標(t値)が大きい順(この例では、3.0、2.1、1.8、1.6、…の順)に表示されている。したがって、品質管理者14は、その表示を見ることにより、異常要因候補としての製造データ毎に、その製造データが品質に影響を与えている程度を、定量的かつ視覚的に容易に把握できる。
なお、異常要因候補11として抽出されたプロセスパラメータを、そのプロセスパラメータについての検定指標(t値)が小さい順に並べ直して表示しても良い。
また、図9、図10は、上記サブステップ(検定ステップ)S4-1で上述のようにt検定を行った場合に、表示画面に表示される別の表示内容を例示している。図9では、良品の分布と不良品の分布とが、異常要因候補抽出ステップS3にて抽出された異常要因候補としてのプロセスパラメータの異なる範囲で生じている。この結果の表示を見ることにより、品質管理者14は、そのプロセスパラメータが検査データに対して実質的に大きく影響を与えていることを把握できる。一方、図10では、良品の分布と不良品の分布とが、異常要因候補抽出ステップS3にて抽出された異常要因候補としてのプロセスパラメータの同じ範囲で生じている。この結果の表示を見ることにより、品質管理者14は、そのプロセスパラメータが検査データに対して実質的に影響を与えていないことを把握できる。したがって、品質管理者14は、生産プロセス5における異常要因を正確に把握でき、その異常要因を取り除くことによって生産プロセス5を速やかに正常な状態に復帰させることができる。
(第2実施形態)
本実施形態では、図2に示した異常要因特定システム15が、図1の異常要因特定処理とは別の異常要因特定処理を実行するものとする。
本実施形態では、図2に示した異常要因特定システム15が、図1の異常要因特定処理とは別の異常要因特定処理を実行するものとする。
図3は、この異常要因特定処理の概略フローを示している。
この異常要因特定処理では、まず、ステップS11で、データベース9は、生産プロセス5から製造データ6と検査データ7とを取得して蓄積する。ステップS12で、データセット作成部8が、製造データ6と検査データ7とを関連付けて、図4に例示したようなデータセット8Aを作成する。
次に、図3中のステップ(異常要因候補抽出ステップ)S13で、異常要因候補抽出部10は、次に述べる異常要因候補抽出処理を実行する。具体的には、多変量解析としての部分最小二乗法を用いて算出された評価指標を用いて、検査データに対して影響を与える異常要因候補を抽出するものとする。評価指標は、或るプロセスパラメータが異常要因候補として抽出されるべき根拠を定量的に表すものである。
特に、この例では、プロセスパラメータごとの評価指標としてVIP(Variable Importance in Projection)値を用いるものとする。
図11Aは、部分最小二乗法によって評価指標としてのVIP値を算出する仕方を、概念的に示している。ここで、VIP値は、射影における変数の重要度、つまり、目的変数(ここでは検査データ)Yに対する各説明変数(ここでは特徴量としてのプロセスパラメータ)の重要度を示している。VIP値の高い説明変数ほど、目的変数Yの予測に影響が大きいと言える。
VIP値は、後述のように、次式によって定義される。

ここで、AはPLS(Partial Least Squares:部分最小二乗)の成分数を表している。aはPLSの成分番号(a=1,2,3,…,A)を表している。Kは説明変数の数を表している。kは説明変数の番号(k=1,2,3,…,K)を表している。SSYaはa次元PLSモデルで説明できなかった「目的変数Yの残差平方和」を表している。SSY0は目的変数Yの分散(総平方和)を表している。wakは第a成分の重みベクトルwaの第k番目の要素を表している。また、重みベクトルwaは
 と表される。スコアtaは、この重みベクトルwaを用いて、
 と表される。
上記VIP値は、次のようにして導出される。
まず、図11Bから分かるように、
(第1成分で説明できたYの平方和)+(第2成分で説明できたYの平方和)+…+(第A成分で説明できたYの平方和)=(Yの総平方和)-(A次元のPLSで説明できなかった残差平方和)
と言える。すなわち、次式が成り立つ。

(第1成分で説明できたYの平方和)+(第2成分で説明できたYの平方和)+…+(第A成分で説明できたYの平方和)=(Yの総平方和)-(A次元のPLSで説明できなかった残差平方和)
と言える。すなわち、次式が成り立つ。
この式は次のように順次変形される。


ここで、重みベクトルの大きさは、
 であるから、
 が成り立つ。
この式は、aとkの総和の順番を入れ替えると、次のように変形される。

ここで、この式の左辺を変数毎の(VIPAK)2の総和とみなしたときに、VIPAKの平均を1とするために、上式をK倍する。

そして、上述のようにこの式の左辺を変数毎の(VIPAK)2の総和とみなすと、次式のように書ける。

ここで、
 である。したがって、VIPAKは、
 として表される(証明終了)。
また、PLSのa成分において、第k変数の影響力(Variable Influence)VINakを、次式のように定義する。

すると、(VIPAK)2は、次式のように表される。
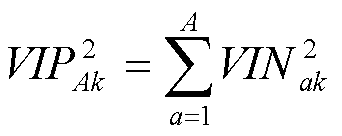
最後の2つの式から分かるように、(VIPAK)2は、成分毎に、「第a成分で説明できたYの平方和」を重みwak(第a成分の重みベクトルwaの第k番目の要素)を付けて変数毎に分解し、それを全成分で総和した値という意味をもつ。
本実施形態では、異常要因候補抽出部10は、図3中のサブステップS13-1で、多変量解析としての部分最小二乗法を用いて評価指標としてのVIP値を算出する。サブステップS13-2で、算出されたVIP値を用いて、検査データに対して影響を与える潜在変数(プロセスパラメータ)を異常要因候補として抽出する。そして、サブステップS13-3で、異常要因候補として抽出されたプロセスパラメータを出力する。
次に、ステップS14の最初のサブステップ(優先度算出ステップ)S14-1で、検定部12は、上記評価指標としてのVIP値に基づいて、上記異常要因候補としてのプロセスパラメータ毎に、対策が求められる順位を表す優先度を算出する。例えば図12のテーブルに例示するように、評価指標としてのVIP値が大きい順(この例では、5.6、4.4、4.1、3.6、…の順)に優先度1、2、3、4、…を付ける。この結果、後述のサブステップ(検定結果表示ステップ)S14-4では、上記異常要因候補としてのプロセスパラメータ(この例では、A8、A5、A3、A2、…)毎に、対策が求められる順位を表す優先度1、2、3、4、…が表示される。したがって、品質管理者14は、その表示を見ることにより、上記異常要因候補としてのプロセスパラメータ毎に、対策が求められる順位を表す優先度を、定量的かつ視覚的に把握できる。
次に、図3中のサブステップ(優先度算出ステップ)S14-2で、検定部12は、上記評価指標としてのVIP値に基づいて、図12に例示されたような上記異常要因候補としてのプロセスパラメータ(この例では、A8、A5、A3、A2、…)の中から、検査データに対して品質に影響を与えていると推定されるプロセスパラメータを選別する。つまり、異常要因候補としてのプロセスパラメータを絞り込む。
例えば、予め、評価指標としてのVIP値に対して、品質の良否に影響を与えているか否かの基準となる閾値(Th2とする。)を定める。評価指標としてのVIP値が閾値Th2より大きい場合は、品質の良否に影響を与えている一方、評価指標としてのVIP値が閾値Th2より小さい場合は、品質の良否に影響を与えていないことを意味する。例えば、図12のテーブルの例で、閾値Th2=4.0として定める。この場合、VIP値が4.0よりも大きいプロセスパラメータA8、A5、A3のみが選別され、VIP値が4.0よりも小さいプロセスパラメータA2、…は上記異常要因候補から除外される。
この結果、次に述べるサブステップ(検定ステップ)S14-3では、その選別されたプロセスパラメータA8、A5、A3を用いて、そのプロセスパラメータA8、A5、A3が検査データに影響を与えているか否かの統計学的検定が実行される。これにより、上記選別されたプロセスパラメータの各々が検査データに影響を与えているか否かが、上記統計学的検定によって精度良く確認される。このようにした場合、異常要因を少ない計算量でかつ迅速に求めることができる。
次に、検定部12は、図3中のサブステップ(検定ステップ)S14-3で、図1中のサブステップS4-1におけるのと同様に、異常要因候補11としてのプロセスパラメータを各々抽出し、上記抽出されたプロセスパラメータを用いて、そのプロセスパラメータが検査データに影響を与えているか否かの統計学的検定を実行する。
具体的には、抽出されたプロセスパラメータ毎に、そのプロセスパラメータが不良品発生の要因となっているという仮説について、統計学的検定を実施する。
統計学的検定を実施するために、検定部12は、まず、上記データセット8Aの特性、ここでは良品と判定された製造品についての検査データと不良品と判定された製造品についての検査データの分布の態様を調べる。続いて、良品と判定された製造品についての検査データと不良品と判定された製造品についての検査データとが、それぞれ正規分布であり、かつ互いに等分散であるとの仮定が成り立つか否かを判定する。そして、上記仮定が成り立つ場合は、上記統計学的検定の手法としてパラメトリック手法を用いる一方、上記仮定が成り立たない場合は、上記統計学的検定の手法としてノンパラメトリック手法を用いる。
この後、検定部12は、サブステップ(検定結果表示ステップ)S14-4で、図1中のサブステップS4-2におけるのと同様に、上記検定ステップS14-3により得られた結果を、入力装置による入力に基づいてまたは予め定められた基準に基づいて、例えば図示しないLCDの表示画面に表示する。
この結果の表示を見ることにより、品質管理者14は、そのプロセスパラメータが検査データに対して実質的に大きく影響を与えているか否かを把握できる。したがって、品質管理者14は、生産プロセス5における異常要因を正確に把握でき、その異常要因を取り除くことによって生産プロセス5を速やかに正常な状態に復帰させることができる。
ここで、図12に例示したように、この例では、上記異常要因候補としてのプロセスパラメータ(この例では、A8、A5、A3、A2、…)毎に、対策が求められる順位を表す優先度1、2、3、4、…が表示される。したがって、品質管理者14は、その表示を見ることにより、上記異常要因候補としてのプロセスパラメータ毎に、対策が求められる順位を表す優先度を、定量的かつ視覚的に把握できる。
なお、上述の異常要因特定方法をコンピュータに実行させるためのプログラムとして構築しても良い。
また、そのようなプログラムをCD-ROMなどのコンピュータ読み取り可能な記録媒体に記録して配布できるようにしても良い。上記プログラムを汎用コンピュータにインストールすることで、汎用コンピュータによって上記異常要因特定方法を実行することが可能である。
本発明の異常要因特定方法および装置は、半導体の製造、太陽電池の製造、薄型表示デバイスの製造、化学薬品の製造および鉄鋼の製造等の、様々な素材を用いて大量に製造品を製造する様々な製造分野に、広く適用され得る。
3 製造工程
4 検査工程
5 生産プロセス
6 製造データ
7 検査データ
8 データセット作成部
8A データセット
9 データベース
10 異常要因候補抽出部
12 検定部
13 検定結果表示部
4 検査工程
5 生産プロセス
6 製造データ
7 検査データ
8 データセット作成部
8A データセット
9 データベース
10 異常要因候補抽出部
12 検定部
13 検定結果表示部
Claims (13)
- 製造品に対して1つ以上の製造工程を実行するとともに上記製造工程を経た上記製造品についての品質検査を含む検査工程を実行する生産プロセスにおいて不良品発生の要因を特定する異常要因特定方法であって、
上記生産プロセスでは、上記製造品毎にその製造品についての製造条件を含む1種以上の製造データと上記検査工程で得られた品質を表す検査データとが関連付けてデータセットとして取得され、上記検査データによってその製造品が良品、不良品のいずれであるかが判定されるようになっており、
上記データセットのうち良品と判定された製造品についての製造データの中から、多変量解析を行ってその製造品の製造条件を最も良く表す特徴量を少なくとも1つ抽出し、上記抽出された特徴量に基づいて、良品製造時の平均的な製造データと不良品製造時の各製造データとの間の有意差をそれぞれ算出し、上記有意差に占める各製造データの寄与率をそれぞれ影響度として算出し、上記製造データの中から、良品製造時に対して不良品製造時に上記影響度が実質的に増加した製造データを異常要因候補として抽出する異常要因候補抽出ステップと、
上記データセットから上記異常要因候補としての製造データを各々抽出し、上記抽出された製造データを用いて、その製造データが上記品質に影響を与えているか否かの統計学的検定を実行する検定ステップと、
上記検定ステップにより得られた結果を、入力に基づいてまたは予め定められた基準に基づいて表示する検定結果表示ステップと、
を含むことを特徴とする異常要因特定方法。 - 製造品に対して1つ以上の製造工程を実行するとともに上記製造工程を経た上記製造品についての品質検査を含む検査工程を実行する生産プロセスにおいて不良品発生の要因を特定する異常要因特定方法であって、
上記生産プロセスでは、上記製造品毎にその製造品についての製造条件を含む1種以上の製造データと上記検査工程で得られた品質を表す検査データとが関連付けてデータセットとして取得され、上記検査データによってその製造品が良品、不良品のいずれであるかが判定されるようになっており、
上記データセットのうち良品と判定された製造品についての製造データと不良品と判定された製造品についての製造データとの中から、多変量解析を行ってその製造品の製造条件を最も良く表す特徴量を少なくとも1つ抽出し、上記抽出された特徴量に基づいて、上記製造データの中から異常要因候補を抽出する異常要因候補抽出ステップと、
上記データセットから上記異常要因候補としての製造データを各々抽出し、上記抽出された製造データを用いて、その製造データが上記品質に影響を与えているか否かの統計学的検定を実行する検定ステップと、
上記検定ステップにより得られた結果を、入力に基づいてまたは予め定められた基準に基づいて表示する検定結果表示ステップと、
を含むことを特徴とする異常要因特定方法。 - 請求項1または2に記載の異常要因特定方法において、
上記検定ステップは、上記異常要因候補抽出ステップにて抽出された異常要因候補としての製造データ毎に、その製造データが上記品質に影響を与えている程度を定量的に表す検定指標を算出することを特徴とする異常要因特定方法。 - 請求項1または2に記載の異常要因特定方法において、
上記検定ステップは、上記異常要因候補抽出ステップにて抽出された異常要因候補としての製造データが有意であるか否かを、その製造データ毎に求めることを特徴とする異常要因特定方法。 - 請求項3に記載の異常要因特定方法において、
上記検定結果表示ステップは、上記異常要因候補抽出ステップにて抽出された異常要因候補としての製造データを、その製造データについての上記検定指標が大きい順または小さい順に並べ直して表示することを特徴とする異常要因特定方法。 - 請求項1または2に記載の異常要因特定方法において、
上記異常要因候補抽出ステップは、上記異常要因候補としての製造データ毎に、その製造データが上記異常要因候補として抽出されるべき根拠を定量的に表す評価指標を算出し、
上記検定ステップは、上記評価指標に基づいて、上記異常要因候補抽出ステップにおいて抽出された上記異常要因候補としての製造データの中から、上記品質に影響を与えていると推定される製造データを選別して、上記統計学的検定を実行することを特徴とする異常要因特定方法。 - 請求項3に記載の異常要因特定方法において、
上記検定ステップは、上記評価指標に基づいて、上記異常要因候補としての製造データ毎に、対策が求められる順位を表す優先度を算出することを特徴とする異常要因特定方法。 - 請求項1または2に記載の異常要因特定方法において、
上記検定ステップは、上記データセットの特性に応じて上記統計学的検定の手法を選択することを特徴とする異常要因特定方法。 - 請求項8に記載の異常要因特定方法において、
上記検定ステップは、上記データセットにおける検査データのうち、良品と判定された製造品についての検査データと不良品と判定された製造品についての検査データとが、それぞれ正規分布であり、かつ互いに等分散であるとの仮定が成り立つ場合は、上記統計学的検定の手法としてパラメトリック手法を用いる一方、上記仮定が成り立たない場合は、上記統計学的検定の手法としてノンパラメトリック手法を用いることを特徴とする異常要因特定方法。 - 製造品に対して1つ以上の製造工程を実行するとともに上記製造工程を経た上記製造品についての品質検査を含む検査工程を実行する生産プロセスにおいて不良品発生の要因を特定する異常要因特定装置であって、
上記生産プロセスでは、上記製造品毎にその製造品についての製造条件を含む1種以上の製造データと上記検査工程で得られた品質を表す検査データとが関連付けてデータセットとして取得され、上記検査データによってその製造品が良品、不良品のいずれであるかが判定されるようになっており、
上記データセットのうち良品と判定された製造品についての製造データの中から、多変量解析を行ってその製造品の製造条件を最も良く表す特徴量を少なくとも1つ抽出し、上記抽出された特徴量に基づいて、良品製造時の平均的な製造データと不良品製造時の各製造データとの間の有意差をそれぞれ算出し、上記有意差に占める各製造データの寄与率をそれぞれ影響度として算出し、上記製造データの中から、良品製造時に対して不良品製造時に上記影響度が実質的に増加した製造データを異常要因候補として抽出する異常要因候補抽出部と、
上記データセットから上記異常要因候補としての製造データを各々抽出し、上記抽出された製造データを用いて、その製造データが上記品質に影響を与えているか否かの統計学的検定を実行する検定部と、
上記検定部により得られた結果を、入力に基づいてまたは予め定められた基準に基づいて表示する検定結果表示部と、
を含むことを特徴とする異常要因特定方法。 - 製造品に対して1つ以上の製造工程を実行するとともに上記製造工程を経た上記製造品についての品質検査を含む検査工程を実行する生産プロセスにおいて不良品発生の要因を特定する異常要因特定装置であって、
上記生産プロセスでは、上記製造品毎にその製造品についての製造条件を含む1種以上の製造データと上記検査工程で得られた品質を表す検査データとが関連付けてデータセットとして取得され、上記検査データによってその製造品が良品、不良品のいずれであるかが判定されるようになっており、
上記データセットのうち良品と判定された製造品についての製造データと不良品と判定された製造品についての製造データとの中から、多変量解析を行ってその製造品の製造条件を最も良く表す特徴量を少なくとも1つ抽出し、上記抽出された特徴量に基づいて、上記製造データの中から異常要因候補を抽出する異常要因候補抽出部と、
上記データセットから上記異常要因候補としての製造データを各々抽出し、上記抽出された製造データを用いて、その製造データが上記品質に影響を与えているか否かの統計学的検定を実行する検定部と、
上記検定部により得られた結果を、入力に基づいてまたは予め定められた基準に基づいて表示する検定結果表示部と、
を含むことを特徴とする異常要因特定装置。 - 請求項1または2に記載の異常要因特定方法をコンピュータに実行させるためのプログラム。
- 請求項12に記載のプログラムが記録されたことを特徴とするコンピュータ読出し可能な記録媒体。
Applications Claiming Priority (2)
| Application Number | Priority Date | Filing Date | Title |
|---|---|---|---|
| JP2011082579A JP5014500B1 (ja) | 2011-04-04 | 2011-04-04 | 異常要因特定方法および装置、上記異常要因特定方法をコンピュータに実行させるためのプログラム、並びに上記プログラムを記録したコンピュータ読み取り可能な記録媒体 |
| JP2011-082579 | 2011-04-04 |
Publications (1)
| Publication Number | Publication Date |
|---|---|
| WO2012137775A1 true WO2012137775A1 (ja) | 2012-10-11 |
Family
ID=46844540
Family Applications (1)
| Application Number | Title | Priority Date | Filing Date |
|---|---|---|---|
| PCT/JP2012/059072 Ceased WO2012137775A1 (ja) | 2011-04-04 | 2012-04-03 | 異常要因特定方法および装置、上記異常要因特定方法をコンピュータに実行させるためのプログラム、並びに上記プログラムを記録したコンピュータ読み取り可能な記録媒体 |
Country Status (2)
| Country | Link |
|---|---|
| JP (1) | JP5014500B1 (ja) |
| WO (1) | WO2012137775A1 (ja) |
Cited By (3)
| Publication number | Priority date | Publication date | Assignee | Title |
|---|---|---|---|---|
| WO2014148210A1 (ja) * | 2013-03-22 | 2014-09-25 | 株式会社 東芝 | 電子デバイスの製造支援システム、製造支援方法及び製造支援プログラム |
| JP2015142084A (ja) * | 2014-01-30 | 2015-08-03 | オムロン株式会社 | 品質管理装置、品質管理方法 |
| CN119647784A (zh) * | 2024-12-10 | 2025-03-18 | 东风本田发动机有限公司 | 汽车零件的质量预警方法、装置、计算机设备和可读存储介质 |
Families Citing this family (21)
| Publication number | Priority date | Publication date | Assignee | Title |
|---|---|---|---|---|
| JP5633522B2 (ja) * | 2012-01-06 | 2014-12-03 | 新日鐵住金株式会社 | 操業状況評価装置、操業状況評価方法、コンピュータプログラムおよびコンピュータ読み取り可能な記憶媒体 |
| JP6165658B2 (ja) * | 2014-03-20 | 2017-07-19 | 株式会社東芝 | 製造装置管理システム及び製造装置管理方法 |
| JP2016021179A (ja) * | 2014-07-15 | 2016-02-04 | 大日本印刷株式会社 | 品質管理システム、品質管理方法 |
| JP6715705B2 (ja) * | 2016-07-04 | 2020-07-01 | 株式会社日立製作所 | 不良原因探索システム、及び不良要因探索方法 |
| JP6809874B2 (ja) * | 2016-11-15 | 2021-01-06 | ヤフー株式会社 | 検定装置、検定方法、および検定プログラム |
| JP6849543B2 (ja) * | 2017-06-16 | 2021-03-24 | 株式会社神戸製鋼所 | 不良要因分析システム及び不良要因分析方法 |
| JP2020123274A (ja) * | 2019-01-31 | 2020-08-13 | 株式会社カネカ | 不良要因分析方法、不良要因分析装置及びコンピュータプログラム |
| JP6727478B1 (ja) | 2019-03-28 | 2020-07-22 | 三菱電機株式会社 | 学習装置、学習方法及びプログラム |
| JP7281708B2 (ja) * | 2019-05-28 | 2023-05-26 | パナソニックIpマネジメント株式会社 | 不良品の発生に寄与する装置特定のための製造条件計算装置、製造条件計算方法及び製造条件計算プログラム |
| US20220285231A1 (en) * | 2019-07-12 | 2022-09-08 | Semiconductor Energy Laboratory Co., Ltd. | Semiconductor element characteristic value estimation method and semiconductor element characteristic value estimation system |
| WO2021015094A1 (ja) * | 2019-07-19 | 2021-01-28 | パナソニックIpマネジメント株式会社 | 不良要因推定装置及び不良要因推定方法 |
| JP7446771B2 (ja) | 2019-10-30 | 2024-03-11 | 株式会社東芝 | 可視化データ生成装置、可視化データ生成システム、及び可視化データ生成方法 |
| JP7084907B2 (ja) * | 2019-11-28 | 2022-06-15 | 花王株式会社 | 品質計測方法及び品質計測装置 |
| JP7237863B2 (ja) * | 2020-01-07 | 2023-03-13 | 株式会社東芝 | 情報処理装置および情報処理方法 |
| JP7449732B2 (ja) * | 2020-03-16 | 2024-03-14 | 株式会社Screenホールディングス | 異常検知方法および搬送装置 |
| JP7406441B2 (ja) * | 2020-04-08 | 2023-12-27 | 株式会社日立製作所 | 製造不良要因探索方法、及び製造不良要因探索装置 |
| JP7524045B2 (ja) | 2020-12-10 | 2024-07-29 | 株式会社東芝 | データ解析装置、方法およびシステム |
| JP7567504B2 (ja) * | 2021-01-25 | 2024-10-16 | オムロン株式会社 | 品質予測システム、モデル生成装置、品質予測方法、及び品質予測プログラム |
| JP7524145B2 (ja) * | 2021-08-19 | 2024-07-29 | 株式会社東芝 | データ処理装置、方法及びプログラム |
| JP7830275B2 (ja) * | 2022-09-14 | 2026-03-16 | 株式会社東芝 | データ解析装置、方法及びプログラム |
| WO2025028492A1 (ja) * | 2023-07-31 | 2025-02-06 | Jfeスチール株式会社 | 品質要因推定方法、操業条件変更方法、モデル生成方法、品質要因推定装置及び操業条件変更装置 |
Citations (2)
| Publication number | Priority date | Publication date | Assignee | Title |
|---|---|---|---|---|
| JP2009009299A (ja) * | 2007-06-27 | 2009-01-15 | Sharp Corp | 異常要因特定方法およびシステム、上記異常要因特定方法をコンピュータに実行させるためのプログラム、並びに上記プログラムを記録したコンピュータ読み取り可能な記録媒体 |
| JP2009021348A (ja) * | 2007-07-11 | 2009-01-29 | Sharp Corp | 異常要因特定方法およびシステム、上記異常要因特定方法をコンピュータに実行させるためのプログラム、並びに上記プログラムを記録したコンピュータ読み取り可能な記録媒体 |
-
2011
- 2011-04-04 JP JP2011082579A patent/JP5014500B1/ja not_active Expired - Fee Related
-
2012
- 2012-04-03 WO PCT/JP2012/059072 patent/WO2012137775A1/ja not_active Ceased
Patent Citations (2)
| Publication number | Priority date | Publication date | Assignee | Title |
|---|---|---|---|---|
| JP2009009299A (ja) * | 2007-06-27 | 2009-01-15 | Sharp Corp | 異常要因特定方法およびシステム、上記異常要因特定方法をコンピュータに実行させるためのプログラム、並びに上記プログラムを記録したコンピュータ読み取り可能な記録媒体 |
| JP2009021348A (ja) * | 2007-07-11 | 2009-01-29 | Sharp Corp | 異常要因特定方法およびシステム、上記異常要因特定方法をコンピュータに実行させるためのプログラム、並びに上記プログラムを記録したコンピュータ読み取り可能な記録媒体 |
Cited By (7)
| Publication number | Priority date | Publication date | Assignee | Title |
|---|---|---|---|---|
| WO2014148210A1 (ja) * | 2013-03-22 | 2014-09-25 | 株式会社 東芝 | 電子デバイスの製造支援システム、製造支援方法及び製造支援プログラム |
| JP2014187211A (ja) * | 2013-03-22 | 2014-10-02 | Toshiba Corp | 電子デバイスの製造支援システム、製造支援方法及び製造支援プログラム |
| CN105009254A (zh) * | 2013-03-22 | 2015-10-28 | 株式会社东芝 | 用于电子设备的制造支持系统、制造支持方法和制造支持程序 |
| US10001774B2 (en) | 2013-03-22 | 2018-06-19 | Kabushiki Kaisha Toshiba | Manufacturing supporting system, manufacturing supporting method, and manufacturing supporting program for electronic device |
| JP2015142084A (ja) * | 2014-01-30 | 2015-08-03 | オムロン株式会社 | 品質管理装置、品質管理方法 |
| WO2015115426A1 (ja) * | 2014-01-30 | 2015-08-06 | オムロン株式会社 | 品質管理装置、品質管理方法 |
| CN119647784A (zh) * | 2024-12-10 | 2025-03-18 | 东风本田发动机有限公司 | 汽车零件的质量预警方法、装置、计算机设备和可读存储介质 |
Also Published As
| Publication number | Publication date |
|---|---|
| JP2012220978A (ja) | 2012-11-12 |
| JP5014500B1 (ja) | 2012-08-29 |
Similar Documents
| Publication | Publication Date | Title |
|---|---|---|
| JP5014500B1 (ja) | 異常要因特定方法および装置、上記異常要因特定方法をコンピュータに実行させるためのプログラム、並びに上記プログラムを記録したコンピュータ読み取り可能な記録媒体 | |
| JP4191772B1 (ja) | 異常要因特定方法およびシステム、上記異常要因特定方法をコンピュータに実行させるためのプログラム、並びに上記プログラムを記録したコンピュータ読み取り可能な記録媒体 | |
| JP5242959B2 (ja) | 異常要因特定方法およびシステム、上記異常要因特定方法をコンピュータに実行させるためのプログラム、並びに上記プログラムを記録したコンピュータ読み取り可能な記録媒体 | |
| JP4394728B2 (ja) | 影響要因特定装置 | |
| JP7354421B2 (ja) | エラー要因の推定装置及び推定方法 | |
| US6701204B1 (en) | System and method for finding defective tools in a semiconductor fabrication facility | |
| CN112180230B (zh) | 芯片测试参数异常的侦测方法、存储介质、终端 | |
| JP6312955B1 (ja) | 品質分析装置及び品質分析方法 | |
| WO2020166236A1 (ja) | 作業効率評価方法、作業効率評価装置、及びプログラム | |
| JP2011187836A (ja) | 半導体製造装置の管理方法及び管理システム | |
| JP2006318263A (ja) | 情報分析システム、情報分析方法及びプログラム | |
| US20070094196A1 (en) | Manufacture data analysis method and manufacture data analyzer apparatus | |
| JP6802122B2 (ja) | 原因推定方法およびプログラム | |
| JP5501908B2 (ja) | 要因分析方法、要因分析装置、及び記録媒体 | |
| TW201832167A (zh) | 決定半導體製造系統的不良設備的方法及程式產品 | |
| JP4439803B2 (ja) | 製造データ解析方法及びそれをコンピュータに実行させるプログラム | |
| CN118568635B (zh) | 油气阀门安全控制及监测系统 | |
| JP4276503B2 (ja) | 半導体不良原因絞込み方法 | |
| WO2013031040A1 (ja) | 管理装置、管理方法、プログラムおよび記録媒体 | |
| JP2017183624A (ja) | 半導体装置の製造過程における異常解析装置および異常解析方法 | |
| JP2004296826A (ja) | 品質管理装置及び品質管理方法 | |
| KR20240042627A (ko) | 다차원 동적 부품 평균 테스트를 위한 시스템 및 방법 | |
| CN118396246B (zh) | 工业关键机组生命周期智能管理方法及装置 | |
| Kovacs et al. | Improved pareto chart analysis for yield detractors’ identification | |
| Sand et al. | Holistic production analysis for actuator manufacturing using data mining |
Legal Events
| Date | Code | Title | Description |
|---|---|---|---|
| 121 | Ep: the epo has been informed by wipo that ep was designated in this application |
Ref document number: 12767648 Country of ref document: EP Kind code of ref document: A1 |
|
| NENP | Non-entry into the national phase |
Ref country code: DE |
|
| 122 | Ep: pct application non-entry in european phase |
Ref document number: 12767648 Country of ref document: EP Kind code of ref document: A1 |