WO2009142214A1 - RNA in situハイブリダイゼーション - Google Patents
RNA in situハイブリダイゼーション Download PDFInfo
- Publication number
- WO2009142214A1 WO2009142214A1 PCT/JP2009/059219 JP2009059219W WO2009142214A1 WO 2009142214 A1 WO2009142214 A1 WO 2009142214A1 JP 2009059219 W JP2009059219 W JP 2009059219W WO 2009142214 A1 WO2009142214 A1 WO 2009142214A1
- Authority
- WO
- WIPO (PCT)
- Prior art keywords
- oligonucleic acid
- probe
- rna
- dummy
- situ hybridization
- Prior art date
Links
Images


Classifications
-
- C—CHEMISTRY; METALLURGY
- C12—BIOCHEMISTRY; BEER; SPIRITS; WINE; VINEGAR; MICROBIOLOGY; ENZYMOLOGY; MUTATION OR GENETIC ENGINEERING
- C12Q—MEASURING OR TESTING PROCESSES INVOLVING ENZYMES, NUCLEIC ACIDS OR MICROORGANISMS; COMPOSITIONS OR TEST PAPERS THEREFOR; PROCESSES OF PREPARING SUCH COMPOSITIONS; CONDITION-RESPONSIVE CONTROL IN MICROBIOLOGICAL OR ENZYMOLOGICAL PROCESSES
- C12Q1/00—Measuring or testing processes involving enzymes, nucleic acids or microorganisms; Compositions therefor; Processes of preparing such compositions
- C12Q1/68—Measuring or testing processes involving enzymes, nucleic acids or microorganisms; Compositions therefor; Processes of preparing such compositions involving nucleic acids
- C12Q1/6813—Hybridisation assays
- C12Q1/6832—Enhancement of hybridisation reaction
-
- C—CHEMISTRY; METALLURGY
- C12—BIOCHEMISTRY; BEER; SPIRITS; WINE; VINEGAR; MICROBIOLOGY; ENZYMOLOGY; MUTATION OR GENETIC ENGINEERING
- C12Q—MEASURING OR TESTING PROCESSES INVOLVING ENZYMES, NUCLEIC ACIDS OR MICROORGANISMS; COMPOSITIONS OR TEST PAPERS THEREFOR; PROCESSES OF PREPARING SUCH COMPOSITIONS; CONDITION-RESPONSIVE CONTROL IN MICROBIOLOGICAL OR ENZYMOLOGICAL PROCESSES
- C12Q1/00—Measuring or testing processes involving enzymes, nucleic acids or microorganisms; Compositions therefor; Processes of preparing such compositions
- C12Q1/68—Measuring or testing processes involving enzymes, nucleic acids or microorganisms; Compositions therefor; Processes of preparing such compositions involving nucleic acids
- C12Q1/6813—Hybridisation assays
- C12Q1/6841—In situ hybridisation
Definitions
- the present invention relates to RNA-in situ hybridization that can be used for research and diagnosis by simply detecting and quantifying gene expression pathologically and histochemically.
- RNA in situ hybridization a method for detecting messenger RNA (mRNA), which is a transcription product obtained by transcription of a gene, in situ where mRNA is present.
- mRNA messenger RNA
- Patent Document 1 a buffer for in situ hybridization
- a label for detection is added to the nucleic acid probe, and the label is detected by an appropriate method and observed under a microscope.
- digoxigenin (Dig, digoxigenin) is used as a label, and the anti-digoxigenin antibody is conjugated with alkaline phosphatase to detect the Dig label in the anti-digoxigenin antibody portion, followed by alkaline phosphatase-NBT / BCIP This causes a color reaction due to sensitization and sensitization (Patent Documents 3, 4, 5, and 6).
- a nucleic acid probe complementary RNA obtained by transcribing the full length or a partial sequence of mRNA to be detected by an in vitro transcription system, or oligo DNA by chemical synthesis (Patent Documents 7 and 8) or oligo RNA has been used. It was.
- Non-Patent Document 1 Pardue and Gall
- Non-Patent Document 2 John et al.
- the initial label used was a radioisotope, which was exposed to a film to detect the presence of mRNA.
- Patent Document 9 the above-described Dig label method and the like have been developed (Patent Documents 3, 4, 5, and 6).
- TSA sensitization method As a sensitization method, a tyramide sensitization method (TSA sensitization method) has been developed separately from the color development reaction using alkaline phosphatase-NBT / BCIP, and is used to increase detection sensitivity (Patent Documents 10, 11, and 12). ), Detection using fluorescent dyes has also been developed (Non-patent Document 3, Patent Documents 13, 14, and 15).
- Probes have been created and used. In this case, the place where the hydrolysis is performed cannot be artificially controlled, and the probe is a mixture of various fragments. In order to avoid mixing of various fragments, one region with a characteristic length of about 300 to 500 bases as another gene is selected from the total length of the target mRNA with a computer, and this region is cloned in after cloning. In some cases, a complementary RNA probe is prepared in an in vitro transcription system, and RNA in situ hybridization is performed with one type of probe. However, when selecting a region, the length of the probe varies from gene to gene due to restrictions such as the restriction of both ends of this region as a PCR primer and GC content, which is an important parameter for hybridization. .
- the in vitro transcription system has a drawback that an extra sequence such as a vector used on the 3 ′ end side of complementary RNA is added in addition to the selected region.
- complementary RNA is used as a probe using an in vitro transcription system
- the length of each probe varies and the position and number of labels to be added cannot be controlled.
- the probe used for detection for quantifying the amount cannot have a quantitative property.
- the conventional complementary RNA probes are not suitable because the hybridization conditions differ between the probes used.
- complementary RNA is used as a nucleic acid probe, it is difficult to set experimental conditions.
- the hybridization process is a kind of equilibrium reaction, it is necessary to search for the concentration condition of the probe for hybridizing the nucleic acid probe to as many mRNA molecules as possible and the temperature condition for hybridization for the purpose of increasing detection sensitivity. Yes, it depends on the length and GC content of the complementary RNA probe used.
- the antibody reaction for detecting the label is also an equilibrium reaction, it is necessary to search for the conditions for the antibody concentration.
- sensitization such as a color development reaction by alkaline phosphatase also requires a control of the reaction time because the color development intensity increases depending on the reaction time.
- a complementary RNA prepared by an in vitro transcription system is used as a nucleic acid probe, a complicated process and a search for conditions are required, which is not convenient.
- oligonucleic acid chemically synthesized with a DNA synthesizer or the like as a probe. This is probably because the probe can be easily created based on the nucleic acid sequence registered in the database without cloning the mRNA. Furthermore, since the sequence is short, there is an advantage that it has better permeability to a tissue sample than a complementary RNA probe having a length of 300 to 500 bases. On the other hand, compared to complementary RNA probes, oligonucleic acid probes have a short length, so the number of labels attached to each probe molecule is small, and therefore the signal intensity is weak for detecting hybrid oligonucleic acids. There are drawbacks.
- fluorescent molecules such as Cy3 and fluorescein are used as the label molecules of oligonucleic acid probes, and weak fluorescent light emitted from the fluorescent molecules of the label is emitted using a high magnification objective lens of 60 to 100 times.
- This is a method in which a large number of optical sections are captured using a CCD camera in the Z-axis direction, viewed as points, and observed by clarifying the images using a computer algorithm (Patent Document 13). Because of computer processing, the luminance in one pixel can be measured, and mRNA can be quantified.
- the other direction is to increase the number of label molecules to be added by adding a tail to the outside of the sequence complementary to the target mRNA of the probe molecule, or a sensitization method called TSA (tyramide sensitivity amplification) (patented)
- TSA tacamide sensitivity amplification
- the background noise tends to increase with sensitization, and the intensity of expression is qualitatively observed under a microscope, but the amount of mRNA is quantified. It has not yet reached.
- the expression level of mRNAs of a plurality of genes has not been compared.
- Quantitative PCR is used to quantify the expressed mRNA.
- quantitative PCR uses a sample in which tissue is homogenized to destroy the structure of the tissue, and a mixture of mRNAs derived from various cells present in the tissue. Therefore, quantification of mRNA expressed in individual cells is not possible. Can not. Therefore, if the amount of mRNA expressed histochemically in addition to localization can be quantified, mRNA expressed in various cells in the tissue can be quantified. spread.
- cancer cells are mixed with cancer cells and normal cells, and various normal cells coexist. In many cases, cancer cells are mixed with highly differentiated cancer cells and poorly differentiated cancer cells. If it is possible to diagnose the response of anticancer drugs by detecting and quantifying histochemically expressed mRNA in cancer cells of such cancer tissues, a great effect is expected from the viewpoint of cancer chemotherapy. it can.
- RNA-in situ hybridization method As a method for histochemically detecting the localization of mRNA in a tissue sample, there is an RNA-in situ hybridization method. Conventionally, in many cases, RNA-in-situ hybridization methods have been used as probes in the form of complementary RNA prepared by an in-vitro transcription system. However, even if the complementary RNA probe can detect the presence (localization) of the mRNA to be detected pathologically and histochemically, it quantifies how much mRNA is present there. Not suitable for. In addition, when using an oligo DNA probe labeled with a fluorescent molecule, it is possible to quantify the expressed mRNA by measuring the fluorescence intensity using a computer, but the detection of the fluorescent signal is 60 to 100 times.
- RNA-in-situ hybridization DNA of fish (mainly salmon) sperm or yeast tRNA is used to reduce background noise.
- tissue sample is a biological sample, there are many sites in the tissue sample where non-specifically adsorbed nucleic acid probes having molecular characteristics equivalent to those of biopolymers exist. Nucleic acid probes adsorbed nonspecifically to the tissue sample cause background noise.
- the background noise is also amplified at the same time, and the SN ratio is deteriorated.
- this nucleic acid probe In order to prevent non-specific adsorption of this nucleic acid probe to a tissue sample, before hybridizing the nucleic acid probe with a single-stranded fish sperm DNA or yeast tRNA fragmented to a length of about 2000 bases by sonication. If it is used for prehybridization and adsorbed to a non-specific adsorption site, background noise can be reduced.
- fish sperm DNA or yeast tRNA is used by mixing with a nucleic acid probe in a hybridization solution.
- an oligonucleic acid probe when using an oligonucleic acid probe, if fish sperm DNA fragmented to a single strand of about 2000 bases in length is used, there is a possibility that the site where the oligonucleic acid probe hybridizes in the fish sperm DNA. is there. When this site competes with the target mRNA in the original tissue sample, it may hinder the oligonucleic acid probe from hybridizing to the target mRNA and may cause a decrease in the original signal. Alternatively, an oligonucleic acid probe hybridized with fish sperm DNA causes background noise, which is amplified by sensitization.
- oligonucleic acid probes are shorter than fish sperm DNA and have high permeability to tissue samples even if fish sperm DNA is fragmented to about 2000 bases in length. There may be non-specific adsorption sites that cannot be reached by sperm DNA, which may cause background noise to increase.
- the present invention has been made in view of the above problems, and by reducing the background noise and amplifying the signal, a signal corresponding to the expression level of mRNA can be obtained using a 10 to 40 times objective lens. It is an object of the present invention to provide a means for detecting and quantifying pathologically and histochemically expressed mRNA, and for use in research and diagnosis by accurately and simply detecting changes in intensity.
- dummy oligonucleic acids that are approximately the same length as oligonucleic acid probes are used instead of fish sperm DNA such as salmon, which is usually used in RNA in situ hybridization.
- sensitization method we found that there was an improvement in the signal-to-noise ratio and signal enhancement by simply taking images with a CCD camera using a 10 to 20x objective lens with a fluorescence microscope. It was. Then, on the premise of using this dummy oligonucleic acid, it was found that the observed signal intensity increases as the number of oligonucleic acid probe labels increases.
- the observed signal intensity increased as the number of types of oligonucleic acid probes with the same number of labels increased. Furthermore, it was found that the observed signal intensity increased in an increasing function as the GC content in the oligonucleic acid probe sequence increased. It was also found that the observed signal intensity increased in an increasing function as the Tm value of the probe increased.
- the present invention provides the following based on the above novel findings by the inventors.
- (1) One or more types of oligonucleic acid probes are hybridized to the target gene mRNA expressed in the tissue sample, and the low molecular weight compound label added to at least one base of the oligonucleic acid probe is detected.
- a method for identifying the presence of a target gene mRNA comprising: Either pretreat (pre-hybridize) one or more types of dummy oligonucleic acid on a tissue sample and then contact the oligonucleic acid probe with the tissue sample to hybridize with the target gene mRNA, or oligonucleic acid probe and the above dummy Contact the mixed solution with the oligonucleic acid to the sample tissue to hybridize the oligonucleic acid probe to the target gene mRNA,
- the dummy oligonucleic acid is: It consists of approximately the same length as the oligonucleic acid probe, Does not hybridize to the region where the oligonucleic acid probe on the target gene mRNA hybridizes, and does not hybridize to the oligonucleic acid probe.
- RNA in situ hybridization method characterized by that.
- RNA in situ high of (1) wherein two or more of the oligonucleic acid probes according to (4) are hybridized to mRNA such that the 5 ′ end and 3 ′ end of each other are separated by 8 bases or more.
- Hybridization method (6)
- the detection signal is sensitized using an antibody against a low molecular weight compound, an enzyme conjugated to this antibody, a chromogenic compound or a fluorescent molecular compound as a substrate for this enzyme, and an objective lens of 10 to 40 times is used.
- the RNA in situ hybridization method of (1) above wherein the signal is detected.
- RNA in situ hybridization method wherein the tissue sample is a tissue isolated from a mammal, and the dummy oligonucleic acid is an oligonucleic acid corresponding to a part of a repetitive sequence of a retrotransposon.
- tissue sample is a tissue isolated from a mammal, and the dummy oligonucleic acid is an oligonucleic acid corresponding to a part of a plant genome or a part of a microbial genome.
- the dummy oligonucleic acid is In the nucleotide sequence of the oligonucleic acid probe, A is replaced with T, T is replaced with A, G is replaced with C, and C is replaced with G.
- M is 4
- the bases from M ⁇ 0.2 places (integers rounded up to the next decimal point) to M ⁇ 0.8 places (integers rounded down to the nearest decimal place) in the continuous sequence are complementary.
- RNA in situ hybridization method of (1) above which is an oligonucleic acid obtained by (10) A dummy oligonucleic acid used in the RNA in situ hybridization method according to (7) above, wherein the oligonucleic acid consists of a partial sequence of a retrotransposon repetitive sequence, or a different partial sequence of the repetitive sequence.
- a set of multiple types of oligonucleic acids (11) A dummy oligonucleic acid used in the RNA in situ hybridization method according to (8) above, each of an oligonucleic acid comprising a part of a plant genome or a part of a microbial genome, or each of a plant genome or a microbial genome A set of multiple types of oligonucleic acid consisting of different partial sequences.
- the present invention makes it possible to detect and quantify mRNAs expressed pathologically and histochemically easily and with high accuracy, and advances basic research on the causes and treatment methods of various diseases. Or greatly contribute to improving the diagnostic accuracy of various diseases.
- Example 1 it is the result of the RNA
- concentration of dummy oligo DNA it is the result of calculating
- concentration of dummy oligo DNA it is the result of having calculated
- Example 2 it is the result of RNA-in-situ hybridization which calculated
- the signal when the probe concentration was 0 nM was determined from the results of RNA ⁇ in situ hybridization. It is the result of calculating the intensity.
- Example 2 two types of dummy oligo DNA, salmon sperm DNA, and the signal at each probe concentration calculated from the results of RNA in situ hybridization to determine the effect on each oligo DNA probe concentration in the absence of addition. It is strength.
- Example 3 it is the result of having compared the effect in RNA detection of RNA (in) situ hybridization of dummy oligo DNA and salmon sperm DNA.
- the obtained SN ratio is plotted on the vertical axis
- the probe concentration is plotted on the horizontal axis
- the SN ratio when dummy oligo DNA is added is compared with the SN ratio when salmon sperm DNA is added.
- Example 4 it is the result of the RNA
- Example 5 it is a photographic image of RNA in situ hybridization showing the relationship between the number of types of probes used for detection and the detected signal intensity. It is a correlation between the signal intensity in Example 5 and the number of types of probes. In Example 6, it is the photograph image image
- FIG. 6 is a correlation between signal intensity and probe concentration in Example 6.
- FIG. 6 is a correlation between signal intensity and probe concentration in Example 6.
- FIG. 7 it is the photographic image which investigated how signal intensity changed as the density
- Example 8 it is the photograph image which investigated the mouse
- Example 8 it is the result of having investigated the change in the expression intensity of the gene Arntl in the liver by RNA-in-situ hybridization from 9 am to 4 am every 4 hours until midnight.
- Example 8 the change in the expression of the gene Arntl in the liver from 9 am to 4 am every midnight until 1 am was examined by quantitative PCR and RNA in situ hybridization, and the correlation between the results of quantitative PCR and the results of signal intensity was correlated. It is the figure which was taken.
- Example 9 it is a photographic image obtained by carrying out RNA-in-situ hybridization simultaneously about the expression in the liver about the genes Cyp1a2 and Alb using several oligo DNA probe.
- Example 10 it is the result of investigating the influence of the concentration of tyramide-Flu in tyramide sensitivity amplification.
- Example 11 the GC content (%) of each oligonucleic acid was calculated.
- Example 12 the effect of the position (5′-end or 3′-end) and the number effect of labeling of the oligonucleic acid probe was confirmed by the signal intensity of in situ hybridization to the rat actin beta gene Actb in the rat lung. It is.
- Example 13 when trying to detect a product hybridized using a plurality of labels on mRNA of one gene, how far the two labels need to be separated on the nucleic acid sequence of mRNA. It is a conceptual diagram of two oligo DNA probes for confirming.
- Example 13 when trying to detect a product hybridized using a plurality of labels on mRNA of one gene, how far the two labels need to be separated on the nucleic acid sequence of mRNA. This is the result of RNA-in-situ hybridization performed to confirm the above. In Example 14, it is the result of having performed in situ hybridization with the oligonucleic acid probe which changed GC content.
- the invention (1) is characterized by using one or more types of dummy oligonucleic acid that does not hybridize with the region where the oligonucleic acid probe on the target gene mRNA hybridizes and does not hybridize with the oligonucleic acid probe. To do.
- a single-stranded dummy oligonucleic acid is pretreated (prehybridized) with a tissue sample, and then a single-stranded oligonucleic acid probe is contacted with the tissue sample to hybridize with the target gene mRNA, or A mixed solution of the single-stranded oligonucleic acid probe and the single-stranded dummy oligonucleic acid is brought into contact with the tissue sample to hybridize the single-stranded oligonucleic acid probe to the target gene mRNA.
- the target gene is about 1 to 10 gene mRNAs expressed in a tissue sample.
- the dummy oligonucleic acid can be prepared by chemical synthesis on the condition that it does not hybridize with the region where the oligonucleic acid probe on the target gene mRNA hybridizes and does not hybridize with the oligonucleic acid probe.
- a commercially available automatic DNA synthesizer can also be used for chemical synthesis. It is also possible to use a DNA synthesis consignment company.
- the condition that the dummy oligonucleic acid does not hybridize with the region where the oligonucleic acid probe on the target gene mRNA hybridizes is synonymous with having a base sequence different from that of the oligonucleic acid probe that hybridizes with the target gene mRNA.
- the different base sequences in this case can be based on, for example, a match rate of 30% or less, preferably 20% or less, more preferably 10% or less in comparison of base sequences such as Blast.
- it can also be based on a sequence having different continuous base sequences corresponding to 70% or more, preferably 80% or more, more preferably 90% or more of the total length of the oligonucleic acid probe.
- the condition that the dummy oligonucleic acid does not hybridize with the oligonucleic acid probe means that the concordance rate in the comparison of the base sequence such as Blast and the complementary sequence of the oligonucleic acid probe is 30% or less, preferably 20% or less, more preferably 10%.
- the standard can be as follows. Alternatively, it can be based on a sequence having different continuous base sequences corresponding to 70% or more, preferably 80% or more, more preferably 90% or more of the full length of the complementary sequence of the oligonucleic acid probe.
- the type of dummy oligonucleic acid may be one type or a plurality of types (2 to 5 types). In addition, when multiple types of dummy oligonucleic acids are used, two of them may have complementary sequences.
- the amount of the dummy oligonucleic acid that is, the concentration in the prehybridization solution or the hybridization solution described later is 2 to 10 times, preferably 6 to 8 times the amount of the oligonucleic acid probe, that is, the concentration of the oligonucleic acid probe in the hybridization solution. It can be. When a plurality of oligonucleic acid probes are used, the total value of their concentrations is taken as the amount of oligonucleic acid probes. Even when a plurality of dummy oligonucleic acids are used, the total value of their concentrations is taken as the amount of dummy oligonucleic acids.
- the length of the dummy oligonucleic acid is substantially the same as the length of the oligonucleic acid probe.
- “substantially the same” means a range in which the difference in length between the two is ⁇ 10%, preferably ⁇ 5%, more preferably ⁇ 3%, particularly preferably ⁇ 0% (completely the same).
- the base length of the oligonucleic acid probe can be in the range of 20 bp to 70 bp. Therefore, the base length of the dummy oligonucleic acid is substantially the same as that of the oligonucleic acid probe in this range.
- a nucleic acid sequence that does not hybridize to the target gene mRNA but hybridizes to the mRNA of another gene can be selected. It is also possible to select a sequence substantially the same length as the oligonucleic acid probe from repetitive sequences derived from retrotransposons that appear repeatedly in the mammalian genome. Furthermore, it can also be selected as a sequence having substantially the same length from the sequence of a gene that does not exist in mammals in plants and microorganisms.
- Selection of dummy oligonucleic acid is simple by setting the GC content in the partial sequence of the desired length while shifting one base at a time from the 5 'side for the repetitive sequence in the genome or the plant or microbial gene sequence for which the dummy oligonucleic acid is to be selected.
- An oligonucleic acid sequence having a desired GC content can be listed by calculation using a computer program.
- the degree of coincidence with the oligonucleic acid probe is confirmed, and those having a low degree of coincidence with the oligonucleic acid probe are selected.
- the complementary strand is also searched at the same time, so that those having a low degree of coincidence with the complementary strand of the oligonucleic acid probe are selected at the same time.
- the base sequence of the oligonucleic acid probe for example, from the 5 ′ side, A is replaced with T, T is replaced with A, G is replaced with C, and C is replaced with G. If the sequence is more than 4 (M is 4), replace the base from M ⁇ 0.2 (rounded up to the nearest whole number) to M ⁇ 0.8 (rounded down to the next whole number) with its complementary base.
- N is 5) or more that will be the same sequence when read from the 5 'side or the 3' side, at least N x 0.2 places (rounded up to the nearest whole number), N is Oligo obtained by substituting at most ((N-1) / 2-1) bases with their complementary bases when N is an odd number and at most (N / 2-1) places Nucleic acids can also be used. In this case, the dummy oligonucleic acid has the same GC content and length as the oligonucleic acid probe.
- Oligonucleic acid probe has a low molecular compound label attached to at least one base. Also, two or more different types of low molecular compound labels may be added.
- a fluorescent dye such as digoxigenin (Dig, digoxigenin) and FITC (fluorescein isothiocyanate) similar to the conventional method can be used.
- Dig a protein in which alkaline phosphatase is linked to an anti-digoxigenin antibody is used to detect the Dig label in the anti-digoxigenin antibody portion, and further, a color reaction with alkaline phosphatase-NBT / BCIP is caused to sensitize.
- Patent Documents 3, 4, 5, and 6 As a sensitization method, in addition to the above-described color reaction by alkaline phosphatase-NBT / BCIP, a tyramide-fluorescent dye molecule is added to a protein in which peroxidase is conjugated to an anti-digoxigenin antibody or to a protein in which peroxidase is conjugated to an anti-FITC antibody.
- a tyramide sensitization method (TSA sensitization method) for sensitization by reaction can also be used (Patent Documents 10, 11, and 12).
- the addition of the low molecular weight compound label is, as one preferred embodiment, at two locations of the 5 'terminal base and the 3' terminal base of the oligonucleic acid probe.
- a labeled oligonucleic acid can be ordered from an oligo DNA synthesis contractor and is easily synthesized.
- Oligonucleic acid probes hybridize one or more kinds, that is, 1 to 20, preferably 1 to 10, more preferably 1 to 5, to one target gene mRNA to different regions of mRNA.
- the hybridization process time can be shortened.
- the concentration of the oligonucleic acid probe can be in the range of 0.01 nM to 10 nM, and in particular, the hybridization process time can be shortened by increasing the concentration within the above range.
- the GC contents between the oligonucleic acid probes are substantially the same. In this case, “substantially the same” means a range in which the difference in GC content between the two is ⁇ 10%, preferably ⁇ 5%, more preferably ⁇ 3%, particularly preferably ⁇ 0% (completely the same).
- the 5 'end and the 3' end of each probe are separated by 8 bases or more.
- the distance between the 5 'end and the 3' end of each probe is set longer than the length of the oligonucleic acid probe used.
- a solution as described in Patent Document 1 can be basically used.
- formamide 12.5% to 25%, 3 ⁇ SSPE (Invitrogen), 1 ⁇ Denhart (Wako Pure Chemicals), dextran 10% (V / V) (Sigma), 0.2% CHAPS (Sigma-Aldrich)).
- yeast or Escherichia coli tRNA is added thereto.
- the temperature for hybridization depends on the length of the oligo DNA probe to be used and the GC content, but is performed in the range of 30 ° C. to 45 ° C. For example, when the length of the oligo DNA probe is 40 bases and the GC content is 50%, it is preferably carried out at 40 ° C. to 42 ° C.
- the hybridization time is 12 to 24 hours, preferably 16 hours.
- target gene mRNA can be quantitatively detected.
- Dig digoxigenin
- TSA sensitization with a tyramide-fluorescent dye is performed using an anti-digoxigenin antibody conjugated with peroxidase (POD), and a tissue sample is 10 to 40 times.
- POD peroxidase
- the image was taken with a CCD camera through a fluorescence microscope with a double objective lens, and the resulting microscope image was calculated using image processing software such as Image J (NIH, http://rsb.info.nih.gov/ij/).
- Tyramide sensitizing reagents and tyramide-fluorescent molecules are commercially available from Perkin Elmer and Invitrogen, and can be used.
- antibodies against label molecules conjugated with POD are available from Dako and Roche, and these can be used.
- an oligonucleic acid probe with two or more kinds of labels i added as a low molecular compound label an antibody against each label i to which POD has been added is used in multiple steps using Tyramide-fluorescent dye i.
- tyramide sensitivity amplification and multiple detection of fluorescent dye i signals By performing sensitization of tyramide sensitivity amplification and multiple detection of fluorescent dye i signals using a fluorescence microscope, mRNA localization and quantitative detection of two or more types of target genes can be performed.
- the range of the detection range can be widened by increasing the number of oligonucleic acid probes that hybridize to the mRNA of the target gene or the concentration of the oligonucleic acid probe.
- the target gene expression level is high, reduce the number of oligonucleic acid probes hybridizing to the target gene mRNA, the number of probes, the concentration of oligonucleic acid probes, or the concentration of tyramide-fluorescent dye used.
- the width of the detection range can be made comparable to that of gene mRNA with a low expression level.
- the localization and quantitative detection of mRNAs of a plurality of genes having different expression levels can be performed with the same signal intensity and range width, which can be used for pathological tissue diagnosis and the like.
- sequence number 1 5'-catccagaacactaaacagaagatggcagtggccagtagc-3 '
- Sequence number 2 5'-gaagaagtccactgcattccctgaggtgacattctccaca-3 '
- Sequence number 3 5'-tcattgaaggtcttaaacctcttgagggccgggttgggca-3 '
- Sequence number 4 5'-cgctgtgcttgaacagggcacttgtgatgtcttggatact-3 '
- Sequence number 6 5'-gctcccggcgatacgagggtccgatcttagctcgttgaca-3
- SEQ ID NOs: 5, 7, and 8 are oligonucleic acid base sequences consisting of a partial sequence of a human transposon repeat sequence.
- SEQ ID NOs: 9-11 are oligonucleic acid base sequences each consisting of a complementary sequence of SEQ ID NOs: 5, 7, and 8.
- SEQ ID NO: 6 is the base sequence of an oligonucleic acid consisting of a partial sequence of the Shiroizuna POD gene.
- SEQ ID NO: 12 is the base sequence of an oligonucleic acid that hybridizes with mouse alb gene mRNA
- SEQ ID NOs: 13 and 14 are the base sequences of the oligonucleic acid that hybridizes with mouse Arntl gene mRNA.
- SEQ ID NOs: 15 and 16 are the nucleotide sequences of the PCR primer set for the mouse Arntl gene
- SEQ ID NO: 17 are the nucleotide sequences of the TaqMan Probe for the mouse Arntl gene.
- SEQ ID Nos: 18 and 19 are the base sequences of the primer set of the mouse Cyp1a2 gene
- SEQ ID NO: 20 is the base sequence of TaqMan Probe for the mouse Cyp1a2 gene.
- SEQ ID Nos: 21 and 22 are the base sequences of the primer set of the mouse Alb gene
- SEQ ID NO: 23 is the base sequence of TaqMan® Probe for the mouse Alb gene.
- SEQ ID NOs: 24-27 are base sequences of oligonucleic acids that hybridize to mouse Cyp1a2 gene mRNA, respectively.
- SEQ ID NO: 28 is the base sequence of an oligonucleic acid that hybridizes to mouse Alb gene mRNA.
- SEQ ID NO: 29 is the rat Actb gene mRNA
- SEQ ID NOS: 30-34 are the rat Gapdh gene mRNA
- SEQ ID NOs: 35-37 are the base sequences of the oligonucleic acids that hybridize to the rat Actb gene mRNA, respectively.
- SEQ ID NO: 38 is the sequence from the 5 ′ end of the oligonucleic acid of SEQ ID NO: 27, replacing A with T, T with A, G with C, C with G, and the TTTT sequence with TAAA.
- the optimal addition ratio of the dummy oligo DNA to the probe concentration was determined.
- the target tissue was mouse liver, and the detection target gene was Cyp1a2.
- the liver of 8-week-old male mice is prepared with paraffin blocks by normal formalin fixation and paraffin embedding, serial sections with a thickness of 5 microns are prepared, deparaffinized, and treated with protease K (Invitrogen, Proteinase K SOL. RNA, 25530049). ) was followed by RNA in situ hybridization.
- SEQ ID NOs: 1 to 4 Four kinds of single-stranded oligo DNA probes (SEQ ID NOs: 1 to 4) having FITC labels at both ends were used as probes for detecting mRNA of the gene Cyp1a2.
- SEQ ID NOs: 1 to 4 are arranged in the order of numbers from the 5 ′ end to the 3 ′ end, and the distance to the adjacent oligo DNA probe is 594 bases for SEQ ID NOs: 1 and 2.
- 2 and 3 are 16 bases, and SEQ ID NOs: 3 and 4 are 61 bases.
- the dummy oligo DNA (single strand) shown by sequence number 5 was used.
- FIG. 1 shows that the concentration of each of the four probes is 1 nM (nanomol), 2 nM, 3 nM, 4 nM, 5 nM, that is, the total concentration of 4 nM, 8 nM, 12 nM, 16 nM, and 20 nM, respectively.
- concentration of 2 times, 4 times, 6 times, 8 times, and 10 times is shown.
- the horizontal axis shows the dummy oligo DNA addition ratio and the vertical axis shows the signal intensity (IntDen). It is illustrated.
- the dummy oligo DNA addition ratio is 8 times, the order relationship between the concentration of the oligo DNA probe and the signal intensity is maintained, and the order relationship is also maintained for the signal intensity range. It can be seen that it is wider than 1x.
- the signal intensity generally increases as the probe concentration increases.
- the addition ratio maintaining the order relationship between the oligo DNA probe concentration and the signal intensity is 8 times or 1 time, the fluorescence of the image when the oligo DNA probe concentration is 0 nM for each image.
- a ratio indicating how many times the fluorescence intensity is stronger than the intensity was calculated (FIG. 3).
- the probe concentration is low, such as at 1 nM
- this ratio indicates an increase in background noise when the RNA in situ hybridization signal is weak. That is, it can be seen from FIG. 3 that when the addition ratio of the dummy oligo DNA is 1 time, this ratio is larger than when the addition ratio is 8 times, and the background noise is high.
- the concentration of the oligo DNA probe is high, this ratio indicates an increase in signal intensity due to RNA in situ hybridization.
- the addition ratio is 8 times, the signal intensity of the entire image becomes lower as the background noise is smaller than when the addition ratio is 1 time.
- the rate of increase of this ratio is larger when the addition ratio is 8 times than when the addition ratio is 1 time, and this increases the dynamic range when the addition ratio is 8 times. Indicates wide. From FIG. 3, it can be seen that when the addition ratio is 8 times, the dynamic range is 1.375 times wider than when the addition ratio is 1 time.
- Example 1 (Comparison of dummy oligo DNA, salmon sperm DNA, and no addition) We compared the effects of dummy oligo DNA and salmon sperm DNA in the RNA detection of quantitative RNA in situ hybridization without addition.
- the detection gene was Cyp1a2 as in Example 1, and four kinds of single-stranded oligo DNA probes represented by SEQ ID NOs: 1 to 4 labeled at both ends with FITC were used. The concentration of each of the four kinds of probes was 0 nM (nanomol).
- SEQ ID NO: 5 (denoted as L1C1) and SEQ ID NO: 6 (denoted as arbp) at various addition concentrations of 8 times for various probe concentrations of 1 nM, 2 nM, 3 nM, 4 nM, 5 nM Dummy oligo DNA (single strand) was used.
- the final concentration is 100 ug / ml (microgram / milliliter) (equivalent to 80 nM) for the same oligo DNA probe concentration. did.
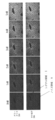
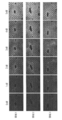
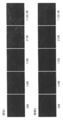
- FIG. 4 shows in situ hybridization images obtained for the same region in serial sections. An additive-free image, an image when salmon sperm DNA is added, an image when dummy oligo DNA L1C1 is added, and an image when dummy oligo DNA arbp is added are shown in order from the top.
- the concentrations of the four oligo DNA probes in order from the left are 0 nM (nanomol), 1 nM, 2 nM, 3 nM, 4 nM, and 5 nM.
- the image was taken with a 10x objective lens and the same area of the serial section was taken using a Zeiss fluorescence microscope Axioplan2 and a CCD camera AxioCam. These images were computer processed using Image J software (NIH, http://rsb.info.nih.gov/ij/) to determine the signal intensity at each concentration.
- the concentration of the oligo DNA probe is 0 nM
- the signal intensity of the image is the background fluorescence intensity (IntDen).
- the true signal is about 1.4 to 2.5 times stronger when the dummy oligo DNA L1C1 or arbp is added than when the salmon sperm DNA is added or not added (particularly the probe). It can be seen that the concentration is greater than 2 nM). Furthermore, it can be seen that the linearity between the probe concentration and the signal intensity is very good when the dummy oligo DNA L1C1 is added and when arbp is added.
- RNA detection The effect of quantitative RNA in situ hybridization of dummy oligo DNA and salmon sperm DNA on RNA detection was compared.
- a formalin-fixed and paraffin-embedded mouse liver tissue sample was used, and serial sections were prepared and used in the experiment.
- the detection gene was Cyp1a2 as in Example 1, and four kinds of single-stranded oligo DNA probes represented by SEQ ID NOs: 1 to 4 labeled at both ends with FITC were used. The concentration of each of the four kinds of probes was 0 nM (nanomol).
- a dummy oligo DNA (single strand) represented by SEQ ID NO: 5 was used at a concentration of 8 times the various oligo DNA probe concentrations of 1 nM, 2 nM, 3 nM, 4 nM and 5 nM.
- salmon sperm DNA of Invitrogen catalog number 15632-011, Salmon Sperm DNA solution
- was used for the same probe concentration and a final concentration of 100 ug / ml (microgram / milliliter) (equivalent to 80 nM) was added.
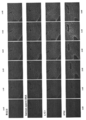
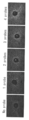
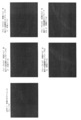
- FIG. 7 shows in situ hybridization images obtained for the same region in serial sections. The upper image shows an image with dummy oligo DNA added, and the lower image shows an image with salmon sperm DNA added. Further, the concentrations of the four probes in order from the left are 1 nM (nanomol), 2 nM, 3 nM, 4 nM, and 5 nM.
- the image was taken with a 10x objective lens and the same area of the serial section was taken using a Zeiss fluorescence microscope Axioplan2 and a CCD camera AxioCam.
- a signal region S where a signal exists and a noise region N where no signal exists are set, and Image J software (NIH, http://rsb.info.nih.gov / ij /) was used to determine the signal intensity in each region, and the signal intensity ratio in regions S and N was determined as the signal-to-noise ratio.
- FIG. 7 Image J software
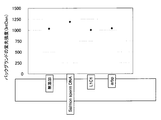
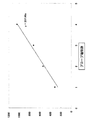
- FIG. 8 shows a comparison between the SN ratio when the dummy oligo DNA is added and the SN ratio when the salmon sperm DNA is added, with the obtained SN ratio on the vertical axis and the probe concentration on the horizontal axis.
- the relationship between the oligo DNA probe concentration and the SN ratio is bell-shaped, but when the oligo DNA probe concentration is 2 nM or more, the dummy oligo DNA has a better SN ratio than the salmon sperm DNA. It is shown.
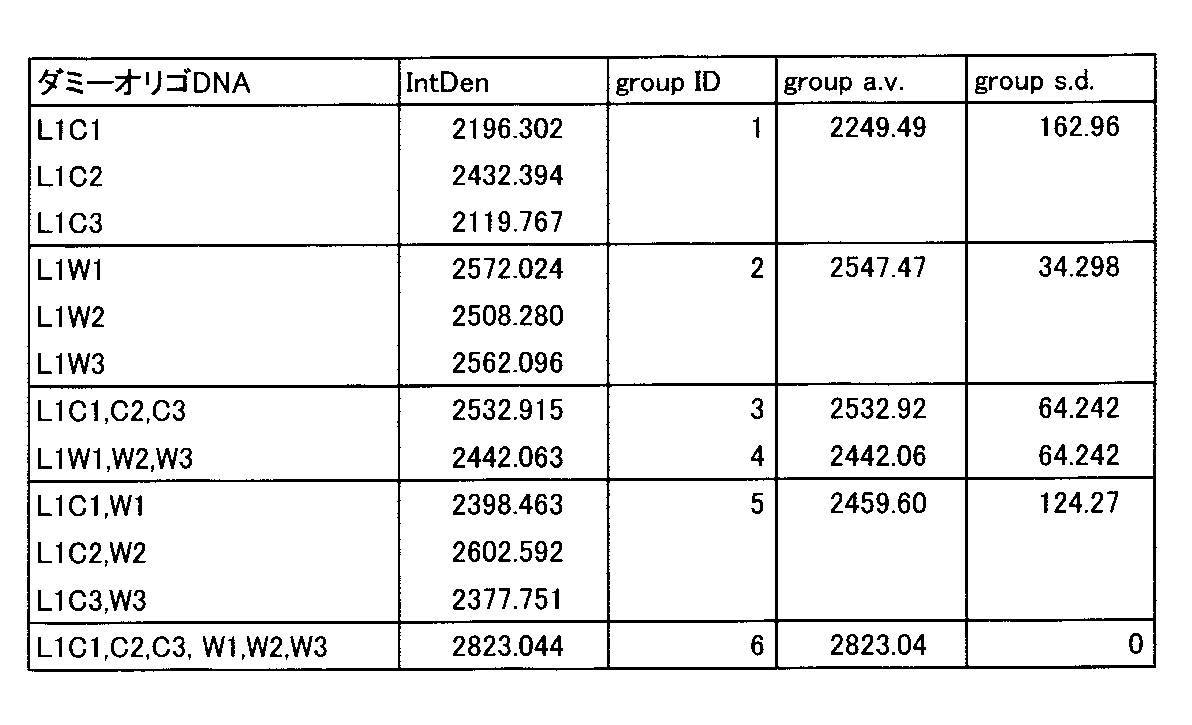
- Example 2 It is the Example which tested the kind and number of the dummy oligo DNA sequences to be used.
- a formalin-fixed and paraffin-embedded mouse liver tissue sample was used, and serial sections were prepared, deparaffinized, and treated with protease K (Invitrogen, Proteinase K SOL. RNA, 25530049).
- protease K Invitrogen, Proteinase K SOL. RNA, 25530049.
- RNA in situ hybridization experiments were performed.
- the detection gene was Cyp1a2 as in Example 1, and single-stranded oligo DNA probes of SEQ ID NOs: 1 to 4 labeled with FITC at both ends were used. According to the results of Example 2, the concentration of each of the four probes was 2 nM.
- the dummy oligo DNA (single strand) used in the experiment was one of the sequences L1W1, L1W2, L1W3 (SEQ ID NO: 5, 7, 8) and the sequences L1W1, L1W2, L1W3 (SEQ ID NOs: 9 to 11) (L1C1, L1C2).
- the concentration of the dummy oligo DNA was 64 nM in total (8 times the total 8 nM of the concentration of 2 nM of each oligo DNA probe).
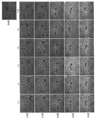
- Dako anti-FITC rabbit polyclonal antibody, P5100 was used, and sensitization with tyramide-FLU (Perkin-Elmer, TSA plus fluorescein system, NEL741B001KT) was performed. Images were taken with a 10x objective lens and the same area of serial sections (numbers in the upper right of each image indicate the order of serial sections) was taken using a Zeiss fluorescence microscope Axioplan2 and a CCD camera AxioCam.
- FIG. 9 shows the result of the RNA in situ hybridization.
- Example 1 a formalin-fixed and paraffin-embedded mouse liver tissue sample was used, serial sections were prepared, deparaffinized, and treated with protease K (Invitrogen, Proteinase K SOL. RNA, 25530049). RNA in situ hybridization experiments were performed.
- the detection gene was Cyp1a2 as in Example 1, and single-stranded oligo DNA probes of SEQ ID NOs: 1 to 4 with FITC labels at both ends were used.
- the concentration of each of the four oligo DNA probes was 2 nM (nanomol).
- the conditions were one, two, three, four kinds of oligo DNA probes and no oligo DNA probe.
- the dummy oligo DNA (single strand), the dummy oligo DNA (L1C1) of SEQ ID NO: 5 was used, and the concentration was 8 times the total concentration of the oligo DNA probe used. That is, 16 nM for one kind of oligo DNA probe, 32 nM for two kinds of oligo DNA probes, 48 nM for three kinds of oligo DNA probes, and 64 nM for four kinds of oligo DNA probes. In the absence of the oligo DNA probe, the concentration of the dummy oligo DNA was 64 nM.
- FITC label Dako, anti-FITC rabbit polyclonal antibody, P5100 was used, and sensitization with tyramide-FLU (Perkin-Elmer, TSA plus fluorescein system, NEL741B001KT) was performed.
- the image was taken with a 10x objective lens and the same area of the serial section was taken using a Zeiss fluorescence microscope Axioplan2 and a CCD camera AxioCam.
- FIG. 11 shows an image.
- Image J software NIH, http://rsb.info.nih.gov/ij/
- the value obtained by subtracting the signal intensity was obtained as the signal intensity in the image of each probe type.
- the results are shown in FIG. 12 with the signal intensity plotted on the vertical axis and the number of types of oligo DNA probes plotted on the horizontal axis. As shown in the figure, when dummy oligo DNA is added, the number of types of oligo DNA probes and the signal intensity are in a linear relationship with a straight line rising to the right.
- Probe concentration It shows how the signal intensity changes as the concentration of the oligo DNA probe used for detection increases.
- K [H] / [fR] ⁇ [fP]
- concentration of the hydridized product [H] the concentration of free mRNA [fR] and the concentration of free oligo DNA probe [fP].
- Concentration of hybridized oligo DNA probe P0 [H] + [fP] MRNA concentration in tissue sample
- R0 [H] + [fR] (constant in tissue sample) Therefore, the higher the concentration of the oligo DNA probe to be hybridized, the higher the number of products that are hydrangeed. This example shows that the signal intensity increases linearly as the concentration of the oligo DNA probe increases.
- Example 1 a formalin-fixed and paraffin-embedded mouse liver tissue sample was used, serial sections were prepared, deparaffinized, and treated with protease K (Invitrogen, Proteinase K SOL. RNA, 25530049). RNA in situ hybridization experiments were performed.
- the detection gene is albumin Alb, and a single-stranded oligo DNA probe of SEQ ID NO: 12 with FITC labeling at both ends is used, and there are 6 concentrations: 0nM (no probe), 0.1nM, 0.25nM, 0.5nM, 1nM, 1.5nM It carried out in.
- the dummy oligo DNA As the dummy oligo DNA, the dummy oligo DNA (single strand) of SEQ ID NO: 5 was used, and the concentration was 8 times the concentration of the oligo DNA probe used. A 12 nM dummy oligo DNA was used for the hybridization solution containing no oligo DNA probe.
- FITC label Dako, anti-FITC rabbit polyclonal antibody, P5100 was used, and sensitization with tyramide-FLU (Perkin-Elmer, TSA plus fluorescein system, NEL741B001KT) was performed.
- FIG. 14a shows the signal intensity for an image 10 times the objective lens of FIG. 13
- FIG. 14b shows the objective lens 20 of FIG. (Signal intensity for double image).
- the signal intensity increases linearly as the probe concentration increases, but the signal intensity saturates above a certain concentration (1 nM for the Alb gene as shown in FIG. 14). It is shown. This reflects the very high expression level of the Alb gene in the liver, as shown in Example 9 for the results of quantitative PCR.
- Example 2 It shows how the signal intensity changes as the concentration of the probe used for detection increases.
- a formalin-fixed and paraffin-embedded mouse liver tissue sample was used, and serial sections were prepared, deparaffinized, and treated with protease K (Invitrogen, Proteinase K SOL. RNA, 25530049).
- RNA in situ hybridization experiments were performed.
- the detection gene was Cyp1a2 as in Examples 1 and 2, and single-stranded oligo DNA probes of SEQ ID NOs: 1 to 4 with FITC labels at both ends were used.
- the concentration of each of the four oligo DNA probes was 0 nM (nanomol).
- the dummy oligo DNA (single strand) represented by SEQ ID NO: 5 was used at a concentration of 8 times the concentration of various oligo DNA probes at 1 nM, 2 nM, 3 nM, 4 nM, and 5 nM.
- a 64 nM dummy oligo DNA was used for the hybridization solution containing no oligo DNA probe.
- FITC label Dako, anti-FITC rabbit polyclonal antibody, P5100 was used, and sensitization with tyramide-FLU (Perkin-Elmer, TSA plus fluorescein system, NEL741B001KT) was performed.
- the detection gene in this example is Arntl whose expression level fluctuates according to the circadian period, using an 8-week-old male mouse, 2 points at 5 points every 4 hours from 9:00 am to midnight (25:00). Collect the liver (outside left lobe) of the target tissue for each individual, cut into halves, and place 2mm on each side of the cut surface for formalin-fixed and paraffin-embedded tissue samples and RNA extraction tissues for quantitative PCR A sample was used.
- tissue samples were prepared by formalin fixation and paraffin embedding, serial sections were prepared, deparaffinized, treated with protease K (Invitrogen, Proteinase K SOL. RNA, 25530049), and then RNA in situ high Hybridization experiments were performed.
- the oligonucleic acid probe of the detection gene Arntl is a single-stranded oligo DNA probe of SEQ ID NOs: 13 and 14 (the distance of Arntl gene on the mRNA is 21 bases) labeled at both ends at a concentration of 2 nM (nanomolar). did.
- L1C1 shown in SEQ ID NO: 5 was used at a concentration of 8 times the addition ratio.
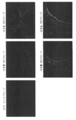
- An anti-Dig antibody (Roche, anti-digoxigenin-POD, 1207733) was used for detection of the Dig label, and tyramide-Cy3 (Perkin-Elmer, TSA plus cyanine 3 system, NEL744B001KT) was used for TSA sensitization. Images were taken with a 10x objective lens using a Zeiss fluorescence microscope Axioplan2 and a CCD camera AxioCam. FIG. 17 shows images of two regions in the liver of one individual at each time point.
- FIG. 18 shows changes in the expression levels of the target genes Arntl and Actb as changes in Ct values obtained by quantitative PCR for tissue samples collected every 4 hours.
- FIG. 19 shows changes in signal intensity obtained by RNA in situ hybridization of the target gene Arntl.
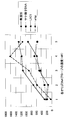
- FIG. 20 plots the Ct value obtained by quantitative PCR of the target gene Arntl in the collected liver of each individual and the average value of each time group of the signal intensity obtained by RNA in situ hybridization. The relationship between the value and the signal intensity by RNA in situ hybridization was shown. As shown in FIG.
- the Ct value of quantitative PCR and the signal intensity show a good correlation (the Ct value decreases when the mRNA expression level is large, so the Ct value is When the vertical axis and the signal intensity are taken on the horizontal axis, the correlation is downward-sloping as shown in this figure).
- Example 8 As a tissue sample, the liver of one 8 week old male mouse at 1 pm used in Example 8 was used, and an oligo DNA probe labeled with Dig at both ends was used for the target gene Cyp1a2, and the target gene Alb was used. Multi-step TSA sensitization using FITC-labeled oligo DNA probes at both ends, quantitative detection of two target genes with two color fluorescent dyes, and comparison with Ct values of these genes by quantitative PCR This is an example.
- Quantification of the expression level of Cyp1a2 gene mRNA by quantitative PCR was performed by TaqMan method using forward and reverse primers shown in SEQ ID NOs: 18 and 19.
- the sequence of the TaqMan® probe is shown in SEQ ID NO: 20.
- quantitative PCR by TaqMan method was performed using the forward and reverse primers shown in SEQ ID NOs: 21 and 22.
- the sequence of the TaqMan® probe is shown in SEQ ID NO: 23.
- Quantitative PCR was performed using Applied Biosystems 7500 Reat-time PCR System according to the protocol attached thereto.
- the Cb value of the Alb gene was 22.135 (amplification efficiency 1.0178), and the Ct value of the Cyp1a2 gene was 27.053 (amplification efficiency 1.008), indicating that the expression level of the Alb gene is large, approximately 5 to the power of 2, that is, 128 times. .
- the oligo DNA probe used was 5 kinds of oligo DNA probes with a Dig label at both ends for the Cyp1a2 gene (a set of probes shown in SEQ ID NOs: 2 and 24 to 27) or 1 type of probe shown in SEQ ID NO: 2.
- Two types of oligo DNA probes shown in SEQ ID NOs: 12 and 28 on both ends of the FITC label for the Alb gene were used.
- L1C1 shown by sequence number 5 was used for dummy oligo DNA.
- the mouse liver was fixed in normal formalin and embedded in paraffin, then serial sections were prepared, deparaffinized, treated with protease K (Invitrogen, Proteinase K SOL. RNA, 25530049), and the above probe mixture was prepared.
- RNA in situ hybridization An anti-Dig antibody (Roche, anti-digoxigenin-POD, 1207733) was used for detection of the Dig label, and tyramide-Cy3 (Perkin-Elmer, TSA plus cyanine 3 system, NEL744B001KT) was used for TSA sensitization.
- anti-FITC antibody Dako, anti-FITC rabbit polyclonal antibody, P5100 was used for FITC label detection, and tyramide-FLU (Perkin-Elmer, TSA plus fluorescein system, NEL741B001KT) was used for TSA sensitization.
- a Zeiss fluorescence microscope Axioplan2 and a CCD camera AxioCam with a 10 ⁇ objective lens were used for microscopic photography.
- FIG. 19 shows an example in which Cyp1a2 gene mRNA is detected with Cy3 and Alb gene mRNA is detected with FLU using two consecutive sections.
- the upper part of FIG. 21 shows the result when only one probe is used for detection of the Cyp1a2 gene (section 1), and the lower part shows an in-situ hybridization image when a set of five types of probes is used (section 2).
- the localization of the expression of the two genes is different, the Alb gene is expressed in the PV (portal vein) region, and the Cyp1a2 gene is expressed in the CV (central vein) region.
- Cyp1a2 gene mRNA when the number of probes is 1, the signal is very weak, but when the number of probes is 5, the signal intensity approaches the signal intensity by FLU of the Alb gene mRNA.
- the Cyp1a2 gene is expressed only about 1/128 of the Alb gene, but by increasing the number of types of probes, the difference in the expression level of 10 to the square of 10 is filled. Successfully increasing the signal intensity. For this, using Image J in the image of FIG. 21, for each of the sections 1 and 2, 8 circular small areas of the size shown in FIG.
- the intensity and signal intensity of Cy3 were measured and summarized in Table 2.
- the maximum signal intensity of Cy3 is increased from 39.75 of one oligo DNA probe to Cyp1a2 to 151.00 in the case of five oligo DNA probes as shown in the section of CV region of the range evaluation in Table 2, and the maximum signal intensity in the PV region of Alb ( It is comparable to 137.88 in section 1 and 142.38 in section 2.
- the expression level of the target gene is 10 2 to 10
- the signal intensity can be adjusted to the same level even if they are different to the third power.
- RNA in situ hybridization was performed by using oligo DNA of rat Actb gene without added as dummy oligo DNA at a concentration of 8 nM.
- Dako anti-FITC rabbit polyclonal antibody, P5100 was used.
- the result is shown in FIG.
- the dilution factor 1 in the figure was the concentration of tryamide-FLU recommended by the manufacturer, and the experiment was conducted with 2-fold dilution, 5-fold dilution, and 10-fold dilution.
- the signal intensity decreases as the concentration of tryamide-FLU decreases.
- a Zeiss fluorescence microscope Axioplan2 and a CCD camera AxioCam were used with a 10 ⁇ objective lens, and each obtained image was processed using Image J to obtain signal intensity.
- a label is added to the probe, but how it affects hybridization depending on the position and number of labels, the signal of in situ hybridization to the rat actin beta gene Actb in the rat lung The strength was confirmed (FIG. 24). Specifically, rat lungs were fixed in normal formalin and embedded in paraffin, then serial sections were prepared. After deparaffinization and treatment with protease K (Invitrogen, Proteinase K SOL. RNA, 25530049), the FITC label was placed at the 5 'end.
- protease K Invitrogen, Proteinase K SOL. RNA, 25530049
- oligo DNA probe oligo DNA probe added at the 3 ′ end
- probe 2 oligo DNA probe with FITC label added at both ends of the 5 ′ end and the 3 ′ end
- RNA in situ hybridization was used to compare the resulting fluorescence intensities.
- salmon sperm DNA was used instead of dummy oligo DNA.
- sequences of the three types of oligo DNA probes to which the FITC label was added used are the same and have a length of 40 bases and are represented by SEQ ID NO: 29.
- FITC was detected using a protein (Dako, anti-FITC rabbit polyclonal antibody, P5100) in which POD was linked to an anti-FITC antibody to detect FITC label, and tyramide-FLU was added, and TSA was added. Sensitization was performed.
- a Perkin-Elmer kit (TSA plus fluorescein system, NEL741B001KT) was used, and the TSA sensitization protocol was in accordance with the package insert. The concentration of the probe to be hybridized was 5 nM in all cases.
- TSA sensitization a Perkin-Elmer kit (TSA plus fluorescein system, NEL741B001KT) was used, and the TSA sensitization protocol was in accordance with the package insert. The concentration of the probe to be hybridized was 5 nM in all cases.
- a Zeiss fluorescence microscope Axioplan2 and a CCD camera AxioCam were used with a 10 ⁇ objective lens.
- FIGS. 24a, b, and c show the results of detection of rat lung Actb gene mRNA using probe 1, probe 2, and probe 3, respectively.
- the signal intensity of the Actb gene mRNA detected with the probe 1 labeled only at the 5 'end is almost the same as the signal intensity of the Actb gene mRNA detected with the probe 2 labeled only at the 3' end. Met.
- the signal intensity of the Actb gene mRNA detected with the probe 3 labeled at both ends was about double these. That is, the signal intensity depends on the number of labels, and the detection sensitivity can be increased by using probes with labels attached to both ends.
- the sequence of the Actb sense probe shown in FIG. 24d is the complementary strand of SEQ ID NO: 29.
- the salmon sperm DNA which does not quantify the signal intensity, was used
- the distance between the two labels on the nucleic acid sequence of the mRNA was confirmed. This also depends on the label sensitization method, the microscope used, and the resolution of the optical system of the CCD camera.
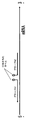
- two oligonucleic acid probes A1 and A2 were prepared for the mRNA sequence of the gene GAPDH, and the 5 ′ end of A1 and the 3 ′ end of A2 were labeled with FITC (FIG. 25).
- Labeled A1 and A2 are 40 bases in length, and the 3 ′ end of A2 is at a distance of 3 bases, 5 bases, 8 bases, and 11 bases from the 5 ′ end of A1 shown in SEQ ID NO: 30.
- Four types of probes A21, A22, A23, and A24 were used (SEQ ID NOs: 31, 32, 33, and 34, respectively).
- the sample tissue used was rat lung, and after normal formalin fixation and paraffin embedding, serial sections were prepared, treated with protease K (Invitrogen, Proteinase K SOL.
- RNA, 25530049 RNA in situ hybridization was performed using A1 and A21, A1 and A22, A1 and A23, A1 and A24), and salmon sperm DNA.
- FITC FITC
- Dako anti-FITC rabbit polyclonal antibody
- P5100 was used, and TSA sensitization was performed using a Perkin-Elmer kit (TSA plus fluorescein system, NEL741B001KT) for sensitization.
- TSA plus fluorescein system NEL741B001KT
- microscope photography a Zeiss fluorescence microscope Axioplan2 and a CCD camera AxioCam were used with a 10 ⁇ objective lens.
- an additive enhancement of the signal is observed when the distance between the 3 ′ end of A1 and the 5 ′ end of A2 is 8 bases or more apart. That is, the distance between labels is 8 bases away.
- the GC content was 40% (SEQ ID NO: 35), 50% (SEQ ID NO: 29), 60% (SEQ ID NO: 36) and 70% (SEQ ID NO: 37), each of which is used alone as a probe and subjected to RNA in situ hybridization in the rat lung.
- anti-FITC antibody Dako, anti-FITC rabbit polyclonal antibody
- TSA sensitization Perkin-Elmer, TSA plus fluorescein system, NEL741B001KT.
- Microscope photography was performed using a Zeiss fluorescence microscope Axioplan2 and a CCD camera AxioCam with a 10 ⁇ objective lens (FIG. 27). It can be seen that as the GC content of the probe increases, the signal becomes stronger and the detection sensitivity increases. In other words, since the hybridization equilibrium constant K and the melting temperature Tm are functions of increasing the GC content, the signal intensity increases and the detection sensitivity increases as the melting temperature Tm increases. Note that the sequence of the Actb sense probe in FIG. 27 is a complementary strand of SEQ ID NO: 29.
- the dummy oligo DNAs used in Examples 1 to 10 are SEQ ID NOs: 5 to 11 and SEQ ID NO: 29.
- SEQ ID NO: 5 and SEQ ID NOs: 7-11 were selected from repetitive sequences derived from a tramposon on the human genome.
- SEQ ID NO: 6 was selected from the sequence of the peroxidase gene of plant Arabidopsis thaliana.
- SEQ ID NO: 29 is selected from the rat Actb gene and does not hybridize to the mRNA of the target gene Alb in Example 10.
- the oligo DNA probe of SEQ ID NO: 27 5'-gtcttggtagtgctcctggacagttttctgcagaaacagc-3 '
- the length and GC content are the same as those of the oligo DNA probe (SEQ ID NO: 27).
Landscapes
- Chemical & Material Sciences (AREA)
- Organic Chemistry (AREA)
- Life Sciences & Earth Sciences (AREA)
- Zoology (AREA)
- Wood Science & Technology (AREA)
- Proteomics, Peptides & Aminoacids (AREA)
- Health & Medical Sciences (AREA)
- Engineering & Computer Science (AREA)
- Microbiology (AREA)
- Biochemistry (AREA)
- Physics & Mathematics (AREA)
- Molecular Biology (AREA)
- Biotechnology (AREA)
- Biophysics (AREA)
- Analytical Chemistry (AREA)
- Immunology (AREA)
- Bioinformatics & Cheminformatics (AREA)
- General Engineering & Computer Science (AREA)
- General Health & Medical Sciences (AREA)
- Genetics & Genomics (AREA)
- Chemical Kinetics & Catalysis (AREA)
- Measuring Or Testing Involving Enzymes Or Micro-Organisms (AREA)
Abstract
Description
病理学的、組織化学的に遺伝子発現を検出する方法が幾つか知られている。なかでも、遺伝子が転写されてできた転写産物であるメッセンジャーRNA(mRNA)を、mRNAが存在しているその場で(in situ)検出する方法として、in situハイブリダイゼーション法がある。この方法は、検出したいmRNAの配列に相補的な核酸配列を持った核酸プローブを溶解させたin situハイブリダイゼーション用のバッファー(特許文献1)を組織試料に添加させることにより核酸プローブをmRNAにハイブリダイズさせる。このとき、核酸プローブには検出用のラベルが付加されており、ラベルを適当な方法で検出し、顕微鏡下で観察する(特許文献2)。多くの場合、ラベルとしてジゴキシゲニン(Dig、digoxigenin)が使われ、抗ジゴキシゲニン抗体にアルカリフォスファターゼをコンジュゲートさせた蛋白質を用いて、抗ジゴキシゲニン抗体部分でDigラベルを検出し、さらにアルカリフォスファターゼ-NBT/BCIPによる発色反応を起こさせ、増感する(特許文献3、4、5、6)。核酸プローブとしては、検出したいmRNAの全長もしくは一部の配列をin vitro転写系で転写させて得られる相補的RNA、もしくは化学合成によるオリゴDNA(特許文献7、8)あるいはオリゴRNAが用いられてきた。
検出したいmRNAに対する核酸プローブとして、in vitro転写系で転写させて得られる相補的RNAを用いる場合、Dig-UTPをin vitro転写系に混入することにより、転写合成される相補的RNAにDig-UTPを取り込ませてDigラベルを付けるが(特許文献3、4、5、6)、個々の相補的RNAプローブ分子に何個のDig-UTPが取り込まれ、またプローブ配列中のどの位置に取り込まれるか、は人為的に制御できない。また、相補的RNAをプローブとして用いる場合、強いシグナルを獲得するために、in vitro転写系でなるべく長い相補的RNAを合成し、加水分解で長さが300塩基から500塩基程度の断片化されたプローブを作成し使用されてきた。この場合、どこで加水分解されるかという場所を人為的に制御できず、いろんな断片の混在したプローブとなる。いろんな断片の混在を避ける為に、標的とするmRNA全長の中から、他の遺伝子として特性の高い長さが300塩基から500塩基程度の領域を計算機で1個選択し、この領域をクローニング後にin vitro転写系で相補的RNAプローブを作成し、プローブ1種類でRNA in situハイブリダイゼーションを行う場合もある。しかし、領域の選択にはクローニングの際、PCRプライマーとしてのこの領域の両端配列の制約やハイブリダイゼーション時の重要なパラメーターであるGC含量の制約などから遺伝子間毎にプローブの長さがまちまちとなる。さらには、in vitro転写系では選択した領域に加えて相補的RNAの3’末端側に使用するベクターなどの余計な配列が付加される欠点がある。このように、in vitro転写系を用いて相補的RNAをプローブとして使用する場合、プローブごとに長さがまちまちであり、付加されるラベルの位置や数も制御できないことから、発現しているmRNAを定量化するための検出に用いるプローブに定量性を持たせることができない、という欠点が存在する。特に複数の遺伝子間での発現量の比較を目的とするのには、使用するプローブ間でのハイブリダイゼーションの条件が異なるため、従来の相補的RNAプローブは向いていない。また、相補的RNAを核酸プローブとして用いるときには、実験的条件設定に困難が伴う。すなわち、ハイブリダイゼーション過程は、一種の平衡反応であるため、検出感度を上げる目的で核酸プローブがなるべく多くのmRNA分子にハイブリダイズするプローブの濃度条件およびハイブリダイズさせるときの温度条件を探索する必要があり、それは用いる相補的RNAプローブの長さやGC含量によって異なる。ハイブリダイズした相補的RNAプローブを検出するプロセスでは、ラベルを検出するための抗体反応も平衡反応であるため、抗体濃度をどれくらいにするか、の条件探索が必要となる。さらに、アルカリフォスファターゼによる発色反応などの増感も反応時間に依存して発色強度が増すため、反応時間の制御が必要となる。以上のように、in vitro転写系で作成された相補的RNAを核酸プローブとして使用する場合は、複雑なプロセスと条件探索が必要で簡便ではない。
(1)組織試料中で発現している標的遺伝子mRNAに対して1または複数種のオリゴ核酸プローブをハイブリダイズさせ、オリゴ核酸プローブの少なくとも1塩基に付加されている低分子化合物ラベルを検出して標的遺伝子mRNAの存在を特定する方法であって、
1種または複数種のダミーオリゴ核酸を組織試料に前処理(プレハイブリダイズ)させた後にオリゴ核酸プローブを組織試料に接触させて標的遺伝子mRNAとハイブリダイズさせるか、または
オリゴ核酸プローブと前記のダミーオリゴ核酸との混合液を試料組織に接触させてオリゴ核酸プローブを標的遺伝子mRNAにハイブリダイズさせ、
前記ダミーオリゴ核酸は:
オリゴ核酸プローブと略同一の長さからなり、
標的遺伝子mRNA上のオリゴ核酸プローブがハイブリダイズする領域とはハイブリダイズせず、そして
オリゴ核酸プローブとはハイブリダイズしない、
ことを特徴とするRNA in situハイブリダイゼーション法。
(2) ダミーオリゴ核酸量が、オリゴ核酸プローブ量の2~10倍である前記(1)のRNA in situハイブリダイゼーション法。
(3) オリゴ核酸プローブとダミーオリゴ核酸の塩基長が20bpから70bpの範囲で略同一である前記(2)のRNA in situハイブリダイゼーション法。
(4) オリゴ核酸プローブが、その5’末端塩基または/および3’末端塩基のそれぞれに低分子化合物ラベルが付加されている前記(1)のRNA in situハイブリダイゼーション法。
(5) 前記(4)に記載のオリゴ核酸プローブの2種以上を、互いの5’末端と3’末端とが8塩基以上離れるようにmRNAにハイブリダイズする前記(1)のRNA in situハイブリダイゼーション法。
(6) 低分子化合物に対する抗体、この抗体にコンジュゲートされた酵素、この酵素の基質としての発色化合物または蛍光分子化合物を使って検出シグナルを増感し、10倍から40倍の対物レンズを使用してシグナルを検出す前記(1)のRNA in situハイブリダイゼーション法。
(7) 組織試料がほ乳動物から単離した組織であり、ダミーオリゴ核酸がレトロトランスポゾンの反復配列の一部に相当するオリゴ核酸である前記(1)のRNA in situハイブリダイゼーション法。
(8) 組織試料がほ乳動物から単離した組織であり、ダミーオリゴ核酸が植物ゲノムの一部または微生物ゲノムの一部に相当するオリゴ核酸である前記(1)のRNA in situハイブリダイゼーション法。
(9) ダミーオリゴ核酸が、
オリゴ核酸プローブの塩基配列におけるAをTに、TをAに、GをCに、そしてCをGに置換し、
同じ塩基がM個(Mは4)以上で連続する場合は、その連続配列におけるM×0.2カ所(小数点以下切り上げて整数)からM×0.8カ所(小数点以下切り下げて整数)の塩基をその相補的な塩基で置換し、
5’側から読んでも3’側から読んでも同じ配列になるN塩基(Nは5)以上の回文配列がある場合は、少なくともN×0.2カ所(小数点以下切り上げて整数)、Nが偶数の場合多くて(N/2-1)カ所、Nが奇数の場合多くて((N-1)/2-1)カ所の塩基をその相補的な塩基で置換すること、
によって得られるオリゴ核酸である前記(1)のRNA in situハイブリダイゼーション法。
(10) 前記(7)に記載のRNA in situハイブリダイゼーション法に使用するダミーオリゴ核酸であり、レトロトランスポゾンの反復配列の一部配列からなるオリゴ核酸、または当該反復配列のそれぞれ異なる一部配列からなる複数種のオリゴ核酸のセット。
(11) 前記(8)に記載のRNA in situハイブリダイゼーション法に使用するダミーオリゴ核酸であり、植物ゲノムの一部または微生物ゲノムの一部配列からなるオリゴ核酸、もしくは植物ゲノムまたは微生物ゲノムのそれぞれ異なる一部配列からなる複数種のオリゴ核酸のセット。
配列番号1:5’-catccagaacactaaacagaagatggcagtggccagtagc-3’
配列番号2:5’-gaagaagtccactgcattccctgaggtgacattctccaca-3’
配列番号3:5’-tcattgaaggtcttaaacctcttgagggccgggttgggca-3’
配列番号4:5’-cgctgtgcttgaacagggcacttgtgatgtcttggatact-3’
配列番号5:5’-tagtcccagctactcaggaagctgaggtgggaggatggct-3’
配列番号6:5’-gctcccggcgatacgagggtccgatcttagctcgttgaca-3’
配列番号7:5’-cttataagtgggagctgaacaatgagaacacatggacaca-3’
配列番号8:5’-gggaggggaacattgcacaccagggcctgttgtgggggag-3’
配列番号9:5’-agccatcctcccacctcagcttcctgagtagctgggacta-3’
配列番号10:5’-tgtgtccatgtgttctcattgttcagctcccacttataag-3’
配列番号11:5’-ctcccccacaacaggccctggtgtgcaatgttcccctccc-3’
配列番号12:5’-ctggagatactgggaaaaggcaatcaggactaggcctttg-3’
配列番号13:5’-cgcagtgtccgaggaagatagctgttccttaactttggca-3’
配列番号14:5’-caggggttatatccgttttaaccggaagtccagtcttggc-3’
配列番号15:5’-gaacagctatcttcctcggacactgcg-3’
配列番号16:5’-ggtagaggcgaagtccttatcttccac-3’
配列番号17:5’-attgatgccaagactggacttccggtta-3’
配列番号18:5’-tgtccttccaaatgagctggcaagtg-3’
配列番号19:5’-ggagtttcccaaacactcagtgaaacaaag-3’
配列番号20:5’-acttcaacaagaacagtatccaagacatcac-3’
配列番号21:5’-gggtgcatcgctggtaacatcc-3’
配列番号22:5’-ctcaagatcgcattcatgcgtcttcac-3’
配列番号23:5’-aaatcccttcacactctttttggagata-3’
配列番号24:5’-aagcacatggcaccaatgacgttagccaccgattccacca-3’
配列番号25:5’-gtcttggtagtgctcctggacagttttctgcagaaacagc-3’
配列番号26:5’-atgttgacaatcttctcctcggggatgagaccgccattgt-3’
配列番号27:5’-ctcatggatcttcctctgcacgttaggccatgtcacaagt-3’
配列番号28:5’-cggcaacacacgtctttgcaaagtctgttacttcctgcac-3’
配列番号29:5’-ctttaatgtcacgcacgatttccctctcagctgtggtggt-3’
配列番号30:5’-atttctcgtggttcacacccatcacaaacatgggggcatc-3’
配列番号31:5’-gtggtgcaggatgcattgctgacaatcttgagggagttgt-3’
配列番号32:5’-tggtggtgcaggatgcattgctgacaatcttgagggagtt-3’
配列番号33:5’-agttggtggtgcaggatgcattgctgacaatcttgaggga-3’
配列番号34:5’-agcagttggtggtgcaggatgcattgctgacaatcttgag-3’
配列番号35:5’-aattgaatgtagtttcatggatgccacaggattccatacc-3’
配列番号36:5’-ggatgcggcagtggccatctcttgctcgaagtctagggca-3’
配列番号37:5’-ctgtcaggtcccggccagccaggtccagacgcaggatggc-3’
配列番号38:5’-cagaaccatcacgaggacctgtcataagacgtctttgtcg-3’
配列番号1~4は、それぞれマウスCyp1a2遺伝子mRNAにハイブリダイズするオリゴ核酸の塩基配列である。
ダミーオリゴDNAのプローブ濃度に対する最適添加比率を求めた。対象組織はマウス肝臓を使用し、検出対象の遺伝子をCyp1a2とした。8週齢オスマウスの肝臓を通常のホルマリン固定・パラフィン包埋によりパラフィンブロックを作成し、厚さ5ミクロンの連続切片を作成し、脱パラフィン処理しプロテアーゼK(Invitrogen社、Proteinase K SOL. RNA、25530049)で処理後、RNA in situハイブリダイゼーションを実施した。遺伝子Cyp1a2のmRNAを検出するプローブとして両端をFITCラベルされた4種類の一本鎖オリゴDNAプローブ(配列番号1~4)を用いた。Cyp1a2遺伝子のmRNA上で配列番号1~4は、番号順に5’末端から3’末端の方向に並んでおり、隣のオリゴDNAプローブまでの距離は、配列番号1と2は594塩基、配列番号2と3は16塩基、配列番号3と4は61塩基である。また、配列番号5に示されるダミーオリゴDNA(一本鎖)を用いた。FITCラベルの検出には、Dako社、抗FITCウサギポリクローナル抗体、P5100を用い、tyramide-FLU(Perkin-Elmer社、TSAプラスフルオレセインシステム、NEL741B001KT)によるTSA増感を実施した。図1は、4種のプローブのそれぞれの濃度が1nM(ナノモル)、2nM、3nM、4nM、5nM、すなわちそれぞれ合計4nM、8nM、12nM、16nM、20nMに対し、ダミーオリゴDNAの濃度が1倍、2倍、4倍、6倍、8倍、10倍の濃度で添加されたハイブリダイゼーション溶液を用いて定量性RNA in situハイブリダイゼーションを行った結果を示す。なお、対照実験としての0nMのとき、ダミーオリゴDNAは200nMを添加した。画像は対物レンズ10倍で、連続切片の同じ領域を、Zeiss蛍光顕微鏡Axioplan2およびCCDカメラAxioCamを使って撮影した。これらの画像データをImage Jソフトウエア(NIH、http://rsb.info.nih.gov/ij/)を用いて計算機処理し各画像のシグナル強度からプローブ濃度が0nMのときのシグナル強度を差し引いた値を各画像のシグナル強度として求めた。図2はその結果を、ダミーオリゴDNAの添加比率とCyp1a2遺伝子mRNAを検出して得られるシグナル強度との関係として、横軸にダミーオリゴDNAの添加比率、縦軸にシグナル強度(IntDen)をとり図示したものである。図2から分るように、ダミーオリゴDNAの添加比率が8倍のとき、オリゴDNAプローブの濃度とシグナル強度との順序関係が維持されており、シグナル強度のレンジも同じく順序関係が維持されている1倍と比較して広いことが分る。また、図2から一般にプローブ濃度が高くなるにしたがいシグナル強度も強くなっていることが分る。さらに、オリゴDNAプローブの濃度とシグナル強度との順序関係が維持されている添加比率が8倍のとき、および1倍のときの各画像について、オリゴDNAプローブの濃度が0nMの時の画像の蛍光強度に対し、何倍蛍光強度が強くなっているか、を示す比率を算出した(図3)。プローブ濃度が低い場合、例えば1nMのときのように、RNA in situハイブリダイゼーションのシグナルが弱いときには、この比率はバックグランドノイズの上昇を示す。すなわち、ダミーオリゴDNAの添加比率が1倍のとき、添加比率が8倍のときよりこの比率が大きく、バックグランドノイズが高い事が図3から分る。一方、オリゴDNAプローブの濃度が高い場合は、この比率はRNA in situハイブリダイゼーションによるシグナル強度の増加を示す。添加比率が8倍のとき、添加比率が1倍のときと比べて、バックグランドノイズが少ない分、画像全体のシグナル強度は低くなる。しかし、オリゴDNAプローブの濃度が高くなるにつれ、この比率の上昇度は添加比率が8倍のとき、添加比率が1倍のときと比べて大きく、これは添加比率が8倍のときダイナミックレンジが広いことを示す。図3から、添加比率が8倍のとき添加比率が1倍のときと比べてダイナミックレンジは1.375倍広くなっていることが分る。
ダミーオリゴDNAとサケ精子DNA、および添加しない場合の定量性RNA in situハイブリダイゼーションのRNA検出における効果の比較を行った。実験には、実施例1と同じくホルマリン固定・パラフィン包埋のマウス肝臓組織試料を用い、連続切片を作成し、実験に使用した。検出遺伝子は実施例1と同様、Cyp1a2であり両端をFITCラベルした配列番号1~4で示した4種の一本鎖オリゴDNAプローブを使用し、4種のプローブのそれぞれの濃度が0nM(ナノモル)、1nM、2nM、3nM、4nM、5nMとなる種々のプローブ濃度に対し、添加比率8倍の濃度で配列番号5(L1C1と記す)および配列番号6(arbpと記す)に示される2種類のダミーオリゴDNA(一本鎖)を用いた。また、同様のオリゴDNAプローブ濃度に対し、Invitrogen社(カタログ番号15632-011、Salmon Sperm DNA solution)のサケ精子DNAを用い、終濃度が100ug/ml(マイクログラム/ミリリットル)(80nM相当)を添加した。また、対照として、ダミーオリゴDNAあるいはサケ精子DNAを添加しない(無添加と記す)実験を行った。FITCラベルの検出には、Dako社、抗FITCウサギポリクローナル抗体、P5100を用い、tyramide-FLU(Perkin-Elmer社、TSAプラスフルオレセインシステム、NEL741B001KT)によるTSA増感を実施した。図4に、連続切片で同じ領域に対し得られたin situハイブリダイゼーション画像を示す。上段から順に無添加の画像、サケ精子DNAを添加した場合の画像、ダミーオリゴDNAのL1C1を添加した場合の画像、ダミーオリゴDNAのarbpを添加した場合の画像を示す。また左から順に4種のオリゴDNAプローブのそれぞれの濃度が0nM(ナノモル)、1nM、2nM、3nM、4nM、5nMである。画像は対物レンズ10倍で、連続切片の同じ領域を、Zeiss蛍光顕微鏡Axioplan2およびCCDカメラAxioCamを使って撮影した。これらの画像をImage Jソフトウエア(NIH、http://rsb.info.nih.gov/ij/)を用いて計算機処理し、各濃度におけるシグナル強度を求めた。オリゴDNAプローブの濃度が0nMのとき、画像のシグナル強度はバックグランドの蛍光強度(IntDen)であり、これを無添加、サケ精子DNAを添加した場合、ダミーオリゴDNAのL1C1およびarbpを添加した場合について図5に示した。サケ精子DNAを添加した場合にバックグランドの蛍光強度が他と比べて強い。次に、各濃度におけるシグナル強度からこのバックグランドの蛍光強度を差し引くことにより各濃度における真のシグナル強度として求めた。これを図6に示した。オリゴDNAプローブ濃度が1nMでダミーオリゴDNAのarbpを添加した場合、真のシグナル強度が他と比べて小さいが、コントラスト良くシグナルは見えており、オリゴDNAプローブの添加に伴うバックグランドノイズの上昇が小さいことを示している。図6から、真のシグナルはダミーオリゴDNAのL1C1あるいはarbpを添加した場合、サケ精子DNAを添加した場合あるいは無添加の場合と比較して1.4倍から2.5倍ほど強いシグナルが得られる(特にプローブ濃度が2nM以上のとき)ことが分る。さらに、ダミーオリゴDNAのL1C1を添加したとき、およびarbpを添加したときプローブ濃度とシグナル強度との間の線形性が非常に良い事が分る。
ダミーオリゴDNAとサケ精子DNAの定量性RNA in situハイブリダイゼーションのRNA検出における効果の比較を行った。実験には、実施例1と同じくホルマリン固定・パラフィン包埋のマウス肝臓組織試料を用い、連続切片を作成し、実験に使用した。検出遺伝子は実施例1と同様、Cyp1a2であり両端をFITCラベルした配列番号1~4で示した4種の一本鎖オリゴDNAプローブを使用し、4種のプローブのそれぞれの濃度が0nM(ナノモル)、1nM、2nM、3nM、4nM、5nMとなる種々のオリゴDNAプローブ濃度に対し、添加比率8倍の濃度で配列番号5に示されるダミーオリゴDNA(一本鎖)を用いた。また、同様のプローブ濃度に対し、Invitrogen社(カタログ番号15632-011、Salmon Sperm DNA solution)のサケ精子DNAを用い、終濃度が100ug/ml(マイクログラム/ミリリットル)(80nM相当)を添加した。FITCラベルの検出には、Daco社、抗FITCウサギポリクローナル抗体、P5100を用い、tyramide-FLU(Perkin-Elmer社、TSAプラスフルオレセインシステム、NEL741B001KT)による増感を実施した。図7に、連続切片で同じ領域に対し得られたin situハイブリダイゼーション画像を示す。上段がダミーオリゴDNA添加の画像、下段がサケ精子DNA添加の画像を示す。また左から順に4種のプローブのそれぞれの濃度が1nM(ナノモル)、2nM、3nM、4nM、5nMである。画像は対物レンズ10倍で、連続切片の同じ領域を、Zeiss蛍光顕微鏡Axioplan2およびCCDカメラAxioCamを使って撮影した。これらの画像において図7のようにシグナルが存在しているシグナル領域Sとシグナルが存在していないノイズ領域Nを設定し、Image Jソフトウエア(NIH、http://rsb.info.nih.gov/ij/)を用いてそれぞれの領域におけるシグナル強度を求め、領域S、Nにおけるシグナル強度の比率をSN比(signal-to-noise ratio)として求めた。図8は、得られたSN比を縦軸に、プローブ濃度を横軸にとり、ダミーオリゴDNAを添加した場合のSN比とサケ精子DNAを添加した場合のSN比の比較を示す。図8に示すように、オリゴDNAプローブ濃度とSN比の関係は釣り鐘状となるが、オリゴDNAプローブ濃度が2nM以上のときダミーオリゴDNAの方がサケ精子DNAに比較してSN比が良い事が示されている。
使用するダミーオリゴDNA配列の種類および数をテストした実施例である。実験には、実施例1と同じくホルマリン固定・パラフィン包埋のマウス肝臓組織試料を用い、連続切片を作成し、脱パラフィン処理しプロテアーゼK(Invitrogen社、Proteinase K SOL. RNA、25530049)で処理後、RNA in situハイブリダイゼーション実験を実施した。検出遺伝子は実施例1と同様、Cyp1a2であり両端をFITCラベルした配列番号1~4の一本鎖オリゴDNAプローブを使用し、実施例2の結果にしたがい4種のプローブのそれぞれの濃度が2nM(ナノモル)の条件で行った。実験に使用したダミーオリゴDNA(一本鎖)は、配列L1W1、L1W2、L1W3(配列番号5、7、8)および配列L1W1、L1W2、L1W3(配列番号9~11)を1種類(L1C1、L1C2、L1C3のそれぞれ1種類、グループID=1)、1種類(L1W1、L1W2、L1W3のそれぞれ1種類、グループID=2)、2種類混合(L1C1とL1W1の混合、L1C2とL1W2の混合、L1C3とL1W3の混合、グループID=5)、3種類混合(L1C1、L1C2およびL1C3の混合、グループID=3)、3種類混合(L1W1、L1W2、L1W3の混合、グループID=4)、および6種類混合(グループID=6)で行った。なお、L1W1、L1W2、L1W3の配列は、それぞれL1W1、L1W2、L1W3と相補的な配列となっている。ダミーオリゴDNAの濃度は、それぞれ合計で64nM(それぞれのオリゴDNAプローブの濃度2nMの合計8nMの8倍)で実施した。FITCラベルの検出には、Dako社、抗FITCウサギポリクローナル抗体、P5100を用い、tyramide-FLU(Perkin-Elmer社、TSAプラスフルオレセインシステム、NEL741B001KT)による増感を実施した。画像は対物レンズ10倍で、連続切片(各画像の右上の数字は連続切片の順を示す)の同じ領域を、Zeiss蛍光顕微鏡Axioplan2およびCCDカメラAxioCamを使って撮影した。図9にそのRNA in situハイブリダイゼーションの結果を示す。図9に示すように、上記ダミーオリゴDNA6種類を混合した場合コントラストが他と比較して悪くなっているが、どのダミーオリゴDNA組合せにおいても良好な画像が得られる。次にImage Jソフトウエア(NIH、http://rsb.info.nih.gov/ij/)を用いて各画像のシグナル強度を求め、図10および表1に示した。図10に示すように、使用するダミーオリゴDNAの種類および組によってシグナル強度に大きな差はなく、良好な結果が得られる。
検出に使用するプローブの種類数と検出されるシグナル強度の関係を示す実施例である。理論的には、ハイブリダイゼーション溶液中においてハイブリダイズさせる各オリゴ核酸プローブの濃度が均一であってGC含量が50%で均一であるとき、ハイブリダイゼーション過程での平衡定数Kは各オリゴ核酸プローブ間で同一であり、オリゴ核酸プローブiに対して
K = [Hi]/[fR]・[fPi] (式1)
が成り立ち、フリーのオリゴ核酸プローブ濃度 [fPi]は各オリゴ核酸プローブに対して同一である。さらに、オリゴ核酸プローブiがハイブリダイズした量(濃度)Hiは
[Hi] = K・[fR]・[fPi] (式2)
で表現され、
[H1] = [H2] = … = [HN] (式3)
である。したがって、観察されるシグナル強度Iは
I = S([H1])+….+S([HN]) (式4)
と加算的であり、ハイブリダイゼーション溶液中のオリゴ核酸プローブの種類数Nに依存して増加関数的に(理論的には比例して)増加する。
検出に使用するオリゴDNAプローブの濃度が上がるに従ってシグナル強度が、どのように変化するか、を示す。
K = [H]/[fR]・[fP]
なる平衡定数とハイズリダイズした産物の濃度[H]、フリーのmRNA濃度[fR]およびフリーのオリゴDNAプローブの濃度[fP]との間の関係式が成り立つ。
ハイブリダイズさせるオリゴDNAプローブの濃度P0 = [H]+[fP]
組織サンプル中に存在するmRNA濃度R0 = [H]+[fR] (組織試料中で一定)
の2式が成り立つので、ハイブリダイズさせるオリゴDNAプローブの濃度が高いほど、ハイズリダイズした産物は増える。本実施例では、オリゴDNAプローブの濃度が高くなるにしたがい、シグナル強度も線形的に強くなることを示す。
検出に使用するプローブの濃度が上がるに従ってシグナル強度が、どのように変化するか、を示す。実験には、実施例1と同じくホルマリン固定・パラフィン包埋のマウス肝臓組織試料を用い、連続切片を作成し、脱パラフィン処理しプロテアーゼK(Invitrogen社、Proteinase K SOL. RNA、25530049)で処理後、RNA in situハイブリダイゼーション実験を実施した。検出遺伝子は実施例1、2と同様、Cyp1a2であり両端をFITCラベルした配列番号1~4の一本鎖オリゴDNAプローブを使用し、4種のオリゴDNAプローブのそれぞれの濃度が0nM(ナノモル)、1nM、2nM、3nM、4nM、5nMとなる種々のオリゴDNAプローブの濃度に対し、添加比率8倍の濃度で配列番号5に示されるダミーオリゴDNA(一本鎖)を用いた。オリゴDNAプローブが入っていないハイブリダイゼーション溶液には、64nMのダミーオリゴDNAを使用した。FITCラベルの検出には、Dako社、抗FITCウサギポリクローナル抗体、P5100を用い、tyramide-FLU(Perkin-Elmer社、TSAプラスフルオレセインシステム、NEL741B001KT)による増感を実施した。画像は対物レンズ10倍で、連続切片の同じ領域3カ所を、Zeiss蛍光顕微鏡Axioplan2およびCCDカメラAxioCamを使って撮影した。図15に画像を示す。また、Image Jソフトウエア(NIH、http://rsb.info.nih.gov/ij/)を使用して、各濃度における各領域の画像のシグナル強度を計算機で求め、プローブ濃度が0nMの画像におけるシグナル強度を引いた値を真のシグナル強度として計算し、3カ所の平均値を求めた。その結果を図16に、縦軸にシグナル強度、横軸にプローブ濃度をプロットして示した。図に示されているように、ダミーオリゴDNA添加のもとでプローブ濃度が上がるにしたがい直線的にシグナル強度も強くなることが示されている。
発現量とシグナル強度の関係が線形になることにより、本発明によるRNA in situハイブリダイゼーションにより標的遺伝子mRNAを定量的に検出できることを示した実施例である。本実施例における検出遺伝子は概日周期に従い発現量が変動するArntlで、8週齢のオスマウスを使用し、午前9時から深夜1時(25時)までの4時間毎の5ポイントにおいて、2個体ずつ対象組織の肝臓(外側左葉)を採取し、半分に切断後、切断面からそれぞれ両側2mmの範囲を、ホルマリン固定・パラフィン包埋用組織試料および定量PCRに供するためのRNA抽出用組織試料とした。
組織試料として実施例8で使用した午後1時における8週齢のオスマウス1個体の肝臓を使用し、標的遺伝子Cyp1a2に対して両端をDigでラベルのオリゴDNAプローブを使用し、標的遺伝子Albに対し両端をFITCでラベルしたオリゴDNAプローブを用いて多段階にTSA増感を実施し、2つの標的遺伝子を2色の蛍光色素で定量的に検出し、これらの遺伝子の定量PCRによるCt値と比較した実施例である。

マウス肝臓において、アルブミン(Alb)遺伝子に対するオリゴDNAプローブ(配列番号12、両端FITCラベル、濃度1nM)を使って、tyramide sensitivity amplificationにおけるtyramid-FLU (Perkin-Elmer社、TSAプラスフルオレセインシステム、NEL741B001KT)の濃度の影響をみた。実験では、マウス肝臓を通常のホルマリン固定・パラフィン包埋後、連続切片を作成し、プロテアーゼK(Invitrogen社、Proteinase K SOL. RNA、25530049)で処理し、上記オリゴDNAプローブおよび配列番号29のラベルの付加されていないラットActb遺伝子のオリゴDNAをダミーオリゴDNAとして濃度8nMで使用し、RNA in situハイブリダイゼーションを行った。FITCラベルの検出には、Dako社、抗FITCウサギポリクローナル抗体、P5100を用いた。その結果を図22に示す。図中の希釈倍率1は、メーカー推奨プロトコルのtryamide-FLUの濃度で、2倍希釈、5倍希釈、10倍希釈で実験を行った。図22に示すように、tryamide-FLUの濃度が減少するにしたがい、シグナル強度も減少する。なお、顕微鏡撮影には10倍の対物レンズでZeiss蛍光顕微鏡Axioplan2およびCCDカメラAxioCamを使用し、得られた各画像をImage Jを用いて処理し、シグナル強度を求めた。
ラットGAPDH遺伝子のmRNA配列の5’末端から、オリゴ核酸プローブとして用いたい長さのウインドウ(この例では40塩基)を1塩基づつずらしながら、各オリゴ核酸のGC含量(%)を計算した例を図23示す。
オリゴ核酸プローブの場合、プローブにラベルを付加するが、ラベルを付加する位置およびラベルの数によってハイブリダイゼーションにどのように影響を与えるか、ラット肺におけるラットアクチンベータ遺伝子Actbに対するin situハイブリダイゼーションのシグナル強度で確認した(図24)。すなわち、ラット肺を通常のホルマリン固定・パラフィン包埋後、連続切片を作成し、脱パラフィン処理およびプロテアーゼK(Invitrogen社、Proteinase K SOL. RNA、25530049)で処理後、FITCラベルが5’末端に付加されたオリゴDNAプローブ(プローブ1)、3’末端に付加されたオリゴDNAプローブ(プローブ2)、5’末端および3’末端の両端にFITCラベルの付加されたオリゴDNAプローブ(プローブ3)を使用してRNA in situハイブリダイゼーションを実施し、得られる蛍光強度を比較した。なお、この実施例では、ダミーオリゴDNAではなくサケ精子DNAを用いた。ここで使用したFITCラベルの付加された3種のオリゴDNAプローブの配列は同じで長さ40塩基であり、配列番号29で示されている。実験には、FITCラベルを検出するための抗FITC抗体にPODがつなげられた蛋白質(Dako社、抗FITCウサギポリクローナル抗体、P5100)を用いてFITCを検出し、さらにtyramide-FLUを添加させ、TSA増感を実施した。TSA増感にはPerkin-Elmer社のキット(TSAプラスフルオレセインシステム、NEL741B001KT)を使い、TSA増感のプロトコルはこのキットの添付文章にしたがった。ハイブリダイズさせるプローブの濃度は、いずれも5nMとした。撮影には10倍の対物レンズでZeiss蛍光顕微鏡Axioplan2およびCCDカメラAxioCamを使用した。図24a、b、cは、それぞれプローブ1、プローブ2、プローブ3でラット肺のActb遺伝子のmRNAを検出した結果である。5’末端のみにラベルのついたプローブ1で検出されたActb遺伝子のmRNAのシグナル強度および、3’末端のみにラベルの付加されたプローブ2で検出されたActb遺伝子のmRNAのシグナル強度はほぼ同等であった。また、両端にラベルの付加されたプローブ3で検出されたActb遺伝子のmRNAのシグナル強度は、これらの倍程度であった。すなわち、シグナル強度はラベルの数に依存し、両端にラベルの付加されたプローブを使用することにより、検出感度を上げることが可能である。なお、図24dで示したActbのセンスプローブの配列は配列番号29の相補鎖である。
一つの遺伝子のmRNA上で、複数のラベルを用いてハイブリダイズした産物を検出しようとするとき、mRNAの核酸配列上で、2個のラベルはいったいどれくらい離れている必要があるか、確認した。これは、ラベルの増感方法や用いる顕微鏡、CCDカメラの光学系の解像度にも依存する。本実施例では、遺伝子GAPDHのmRNAの核酸配列に対し、2つのオリゴ核酸プローブA1およびA2を用意し、A1の5’末端およびA2の3’末端をFITCでラベルした(図25)。ラベルの付加されたA1およびA2の長さは40塩基であり、A2の3’末端は、配列番号30で示されるA1の5’末端から3塩基、5塩基、8塩基、11塩基の距離になるよう4種類のプローブA21、A22、A23、A24を用いた(それぞれ配列番号31、32、33、34)。なお、使用した試料組織はラット肺で、通常のホルマリン固定・パラフィン包埋後、連続切片を作成し、プロテアーゼK(Invitrogen社、Proteinase K SOL. RNA、25530049)で処理後、上記プローブの組(A1とA21、A1とA22、A1とA23、A1とA24)、およびサケ精子DNAを用いてRNA in situハイブリダイゼーションを実施した。FITCの検出にはDako社、抗FITCウサギポリクローナル抗体、P5100を使用し、増感のためにPerkin-Elmer社のキット(TSAプラスフルオレセインシステム、NEL741B001KT)を用いてTSA増感を行った。顕微鏡撮影には10倍の対物レンズでZeiss蛍光顕微鏡Axioplan2およびCCDカメラAxioCamを使用した。図26に示すように、A1の3’末端およびA2の5’末端の距離が8塩基以上離れている場合に、シグナルの加算的増強が観察される。すなわち、ラベル間の距離は8塩基離れていることが条件となる。
ラットACTB遺伝子のmRNAに対して、両端をFITCでラベルされた長さ40塩基のオリゴ核酸プローブにおいて、GC含量が40%(配列番号35)、50%(配列番号29)、60%(配列番号36)、70%(配列番号37)の4種類を用いて、それぞれ単独にプローブとして使用し、ラット肺でRNA in situハイブリダイゼーションを行い、さらに、抗FITC抗体(Dako社、抗FITCウサギポリクローナル抗体、P5100)を使用しTSA増感(Perkin-Elmer社、TSAプラスフルオレセインシステム、NEL741B001KT)を行った。顕微鏡撮影には10倍の対物レンズでZeiss蛍光顕微鏡Axioplan2およびCCDカメラAxioCamを使用した(図27)。プローブのGC含量が増えるに従って、シグナルが強くなり、検出感度が上がることが分かる。言い換えれば、ハイブリダイゼーションの平衡定数Kおよび融解温度TmはGC含量の増加関数であるため、融解温度Tmが大きくなるにしたがって、シグナル強度は上がり、検出感度があがる。なお、図27のActbセンスプローブの配列は配列番号29の相補鎖である。
実施例1から実施例10で用いたダミーオリゴDNAは、配列番号5~11、配列番号29である。配列番号5および配列番号7~11はヒトゲノム上のトランポゾン由来の反復配列から選択した。配列番号6は植物シロイヌナズナのperoxidase遺伝子の配列から選択した。また、配列番号29はラットActb遺伝子から選択されており、実施例10における標的遺伝子AlbのmRNAにはハイブリダイズしない。また配列番号27のオリゴDNAプローブ:
5’-gtcttggtagtgctcctggacagttttctgcagaaacagc-3’
に対し、5’側から順次に、AをTに、TをAに、GをCに、そしてCをGに置換し、TTTTの連続配列をATAAと置換して合成したオリゴDNA:
5’-cagaaccatcacgaggacctgtcataagacgtctttgtcg-3’(配列番号38)
もダミーオリゴDNAとして使用できる。この配列番号38のダミーオリゴ核酸の例では、長さおよびGC含量がオリゴDNAプローブ(配列番号27)と同一になっている。
Claims (11)
- 組織試料中で発現している標的遺伝子mRNAに対して1または複数種のオリゴ核酸プローブをハイブリダイズさせ、オリゴ核酸プローブの少なくとも1塩基に付加されている低分子化合物ラベルを検出して標的遺伝子mRNAの存在を特定する方法であって、
1種または複数種のダミーオリゴ核酸を組織試料に前処理(プレハイブリダイズ)させた後にオリゴ核酸プローブを組織試料に接触させて標的遺伝子mRNAとハイブリダイズさせるか、または
オリゴ核酸プローブと前記のダミーオリゴ核酸との混合液を試料組織に接触させてオリゴ核酸プローブを標的遺伝子mRNAにハイブリダイズさせ、
前記ダミーオリゴ核酸は:
オリゴ核酸プローブと略同一の長さからなり、
標的遺伝子mRNA上のオリゴ核酸プローブがハイブリダイズする領域とはハイブリダイズせず、そして
オリゴ核酸プローブとはハイブリダイズしない、
ことを特徴とするRNA in situハイブリダイゼーション法。 - ダミーオリゴ核酸量が、オリゴ核酸プローブ量の2~10倍である請求項1のRNA in situハイブリダイゼーション法。
- オリゴ核酸プローブとダミーオリゴ核酸の塩基長が20bpから70bpの範囲で略同一である請求項2のRNA in situハイブリダイゼーション法。
- オリゴ核酸プローブが、その5’末端塩基または/および3’末端塩基のそれぞれに低分子化合物ラベルが付加されている請求項1のRNA in situハイブリダイゼーション法。
- 請求項4に記載のオリゴ核酸プローブの2種以上を、互いの5’末端と3’末端とが8塩基以上離れるようにmRNAにハイブリダイズする請求項1のRNA in situハイブリダイゼーション法。
- 低分子化合物に対する抗体、
この抗体にコンジュゲートされた酵素、
この酵素の基質としての発色化合物または蛍光分子化合物を使って
検出シグナルを増感し、
10倍から40倍の対物レンズを使用してシグナルを検出する請求項1のRNA in situハイブリダイゼーション法。 - 組織試料がほ乳動物から単離した組織であり、ダミーオリゴ核酸がレトロトランスポゾンの反復配列の一部配列からなるオリゴ核酸である請求項1のRNA in situハイブリダイゼーション法。
- 組織試料がほ乳動物から単離した組織であり、ダミーオリゴ核酸が植物ゲノムの一部または微生物ゲノムの一部配列からなるオリゴ核酸である請求項1のRNA in situハイブリダイゼーション法。
- ダミーオリゴ核酸が、
オリゴ核酸プローブの塩基配列における
AをTに、
TをAに、
GをCに、そして
CをGに置換し、
同じ塩基がM個(Mは4)以上で連続する場合は、その連続配列におけるM×0.2カ所(小数点以下切り上げて整数)からM×0.8カ所(小数点以下切り下げて整数)の塩基をその相補的な塩基で置換し、
5’側から読んでも3’側から読んでも同じ配列になるN塩基(Nは5)以上の回文配列がある場合は、少なくともN×0.2カ所(小数点以下切り上げて整数)、Nが偶数の場合多くて(N/2-1)カ所、Nが奇数の場合多くて((N-1)/2-1)カ所の塩基をその相補的な塩基で置換すること、
によって得られるオリゴ核酸である請求項1のRNA in situハイブリダイゼーション法。 - 請求項7に記載のRNA in situハイブリダイゼーション法に使用するダミーオリゴ核酸であり、レトロトランスポゾンの反復配列の一部配列からなるオリゴ核酸、または当該反復配列のそれぞれ異なる一部配列からなる複数種のオリゴ核酸のセット。
- 請求項8に記載のRNA in situハイブリダイゼーション法に使用するダミーオリゴ核酸であり、植物ゲノムの一部または微生物ゲノムの一部配列からなるオリゴ核酸、もしくは植物ゲノムまたは微生物ゲノムのそれぞれ異なる一部配列からなる複数種のオリゴ核酸のセット。
Priority Applications (5)
| Application Number | Priority Date | Filing Date | Title |
|---|---|---|---|
| JP2010513029A JP5733977B2 (ja) | 2008-05-19 | 2009-05-19 | RNAinsituハイブリダイゼーション |
| US12/993,338 US9051610B2 (en) | 2008-05-19 | 2009-05-19 | RNA in situ hybridization |
| EP09750576.2A EP2292798B1 (en) | 2008-05-19 | 2009-05-19 | Rna in situ hybridization |
| CN200980117915.8A CN102037137B (zh) | 2008-05-19 | 2009-05-19 | Rna原位杂交 |
| AU2009250528A AU2009250528B2 (en) | 2008-05-19 | 2009-05-19 | RNA in situ hybridization |
Applications Claiming Priority (2)
| Application Number | Priority Date | Filing Date | Title |
|---|---|---|---|
| JP2008-131302 | 2008-05-19 | ||
| JP2008131302 | 2008-05-19 |
Publications (1)
| Publication Number | Publication Date |
|---|---|
| WO2009142214A1 true WO2009142214A1 (ja) | 2009-11-26 |
Family
ID=41340145
Family Applications (1)
| Application Number | Title | Priority Date | Filing Date |
|---|---|---|---|
| PCT/JP2009/059219 WO2009142214A1 (ja) | 2008-05-19 | 2009-05-19 | RNA in situハイブリダイゼーション |
Country Status (6)
| Country | Link |
|---|---|
| US (1) | US9051610B2 (ja) |
| EP (1) | EP2292798B1 (ja) |
| JP (1) | JP5733977B2 (ja) |
| CN (1) | CN102037137B (ja) |
| AU (1) | AU2009250528B2 (ja) |
| WO (1) | WO2009142214A1 (ja) |
Cited By (2)
| Publication number | Priority date | Publication date | Assignee | Title |
|---|---|---|---|---|
| US9212390B2 (en) * | 2010-04-30 | 2015-12-15 | Exiqon A/S | In situ hybridization method and buffer |
| CN110205357A (zh) * | 2019-06-22 | 2019-09-06 | 福建农林大学 | 一种多引物oligo探针的制备方法 |
Families Citing this family (8)
| Publication number | Priority date | Publication date | Assignee | Title |
|---|---|---|---|---|
| WO2011056185A2 (en) | 2009-11-04 | 2011-05-12 | President And Fellows Of Harvard College | Reactivity-dependent and interaction-dependent pcr |
| EP2989214A4 (en) * | 2013-04-23 | 2016-12-28 | Harvard College | IN SITU INTERACTION DETERMINATION |
| CN105861695A (zh) * | 2016-05-11 | 2016-08-17 | 江苏省肿瘤医院 | 一种检测乳腺癌细胞耐药性的方法及检测试剂盒 |
| GB201621514D0 (en) | 2016-12-16 | 2017-02-01 | Q-Linea Ab | Padlock probe detection method |
| CN108707662B (zh) * | 2017-04-05 | 2021-11-19 | 益善生物技术股份有限公司 | 一种ar-v7表达检测试剂盒 |
| CN108517352A (zh) * | 2018-04-25 | 2018-09-11 | 内蒙古华星康为生物科技有限公司 | 一种检测微生物的方法及其应用 |
| CN111426667A (zh) * | 2020-04-23 | 2020-07-17 | 天津科技大学 | 一种基于量子点-核酸适配体-氧化石墨烯建立的对β-乳球蛋白检测的荧光方法 |
| CN114622000B (zh) * | 2020-12-14 | 2024-05-07 | 厦门大学 | 一种高特异性的检测靶核酸序列的方法 |
Citations (11)
| Publication number | Priority date | Publication date | Assignee | Title |
|---|---|---|---|---|
| US4888278A (en) | 1985-10-22 | 1989-12-19 | University Of Massachusetts Medical Center | In-situ hybridization to detect nucleic acid sequences in morphologically intact cells |
| US5196306A (en) | 1989-03-29 | 1993-03-23 | E. I. Du Pont De Nemours And Company | Method for the detection or quantitation of an analyte using an analyte dependent enzyme activation system |
| US5344757A (en) | 1988-01-12 | 1994-09-06 | Boehringer Mannheim Gmbh | Process for the detection of nucleic acids |
| US5354657A (en) | 1988-01-12 | 1994-10-11 | Boehringer Mannheim Gmbh | Process for the highly specific detection of nucleic acids in solid |
| WO1996006950A1 (en) * | 1994-08-30 | 1996-03-07 | Chiron Corporation | Reduction of nonspecific hybridization by using novel base-pairing schemes |
| US5597692A (en) | 1984-04-05 | 1997-01-28 | Howard Florey Institute Of Experimental Physiology And Medicine | Hybridization histochemistry method for determining the presence and location in animal or plant tissue of RNA |
| US5750340A (en) | 1995-04-07 | 1998-05-12 | University Of New Mexico | In situ hybridization solution and process |
| US5866331A (en) | 1995-10-20 | 1999-02-02 | University Of Massachusetts | Single molecule detection by in situ hybridization |
| US5985549A (en) | 1985-10-22 | 1999-11-16 | University Of Massachusetts | Non-isotopic in-situ hybridization method for detection of nucleic acids |
| US6265156B1 (en) | 1984-04-05 | 2001-07-24 | Howard Florey Institute Of Experimental Physiology And Medicine | Hybridization histochemistry method for determining the presence and location in animal or plant tissue of RNA |
| JP2002542793A (ja) | 1999-04-22 | 2002-12-17 | ザ アルバート アインシュタイン カレッジ オブ メディシン オブ イエシバ ユニバーシティ | 多蛍光fishによる遺伝子発現パターンのアッセイ法 |
Family Cites Families (7)
| Publication number | Priority date | Publication date | Assignee | Title |
|---|---|---|---|---|
| AU4681393A (en) * | 1992-07-17 | 1994-02-14 | Aprogenex, Inc. | Background-reducing compounds for probe-mediated in-situ fluorimetric assays |
| CA2410974A1 (en) * | 2000-05-16 | 2002-11-15 | Dnavec Research Inc. | Polypeptides cleaving telomeric repeats |
| AU2002306768A1 (en) * | 2001-03-20 | 2002-10-03 | Ortho-Clinical Diagnostics, Inc. | Expression profiles and methods of use |
| JP2004267033A (ja) * | 2003-03-05 | 2004-09-30 | Japan Science & Technology Agency | カヤツリグサ科植物のレトロトランスポゾン遺伝子 |
| EP1745156A2 (en) * | 2004-05-04 | 2007-01-24 | Dako Denmark A/S | Methods for detecting chromosome aberrations |
| US20080153094A1 (en) * | 2006-10-13 | 2008-06-26 | Minor James M | Reduction of nonspecific binding in nucleic acid assays and nucleic acid synthesis reactions |
| WO2008068636A2 (en) * | 2006-12-01 | 2008-06-12 | Dako Denmark A/S | Blocking agents comprising non-natural nucleic acids and detection methods using such blocking agents |
-
2009
- 2009-05-19 US US12/993,338 patent/US9051610B2/en not_active Expired - Fee Related
- 2009-05-19 JP JP2010513029A patent/JP5733977B2/ja active Active
- 2009-05-19 EP EP09750576.2A patent/EP2292798B1/en not_active Not-in-force
- 2009-05-19 CN CN200980117915.8A patent/CN102037137B/zh not_active Expired - Fee Related
- 2009-05-19 AU AU2009250528A patent/AU2009250528B2/en not_active Ceased
- 2009-05-19 WO PCT/JP2009/059219 patent/WO2009142214A1/ja active Application Filing
Patent Citations (16)
| Publication number | Priority date | Publication date | Assignee | Title |
|---|---|---|---|---|
| US6265156B1 (en) | 1984-04-05 | 2001-07-24 | Howard Florey Institute Of Experimental Physiology And Medicine | Hybridization histochemistry method for determining the presence and location in animal or plant tissue of RNA |
| US5597692A (en) | 1984-04-05 | 1997-01-28 | Howard Florey Institute Of Experimental Physiology And Medicine | Hybridization histochemistry method for determining the presence and location in animal or plant tissue of RNA |
| US4888278A (en) | 1985-10-22 | 1989-12-19 | University Of Massachusetts Medical Center | In-situ hybridization to detect nucleic acid sequences in morphologically intact cells |
| US5985549A (en) | 1985-10-22 | 1999-11-16 | University Of Massachusetts | Non-isotopic in-situ hybridization method for detection of nucleic acids |
| JPH0731194B2 (ja) | 1988-01-12 | 1995-04-10 | ベーリンガー マンハイム ゲゼルシヤフト ミツト ベシユレンクテル ハフツング | 核酸の検出法 |
| US5354657A (en) | 1988-01-12 | 1994-10-11 | Boehringer Mannheim Gmbh | Process for the highly specific detection of nucleic acids in solid |
| US5702888A (en) | 1988-01-12 | 1997-12-30 | Boehringer Mannheim Gmbh | Process for the detection of nucleic acids |
| US5344757A (en) | 1988-01-12 | 1994-09-06 | Boehringer Mannheim Gmbh | Process for the detection of nucleic acids |
| US5583001A (en) | 1989-03-29 | 1996-12-10 | E. I. Du Pont De Nemours And Company | Method for detection or quantitation of an analyte using an analyte dependent enzyme activation system |
| US5731158A (en) | 1989-03-29 | 1998-03-24 | E. I. Du Pont De Nemours And Company | Catalyzed reporter deposition |
| US5196306A (en) | 1989-03-29 | 1993-03-23 | E. I. Du Pont De Nemours And Company | Method for the detection or quantitation of an analyte using an analyte dependent enzyme activation system |
| WO1996006950A1 (en) * | 1994-08-30 | 1996-03-07 | Chiron Corporation | Reduction of nonspecific hybridization by using novel base-pairing schemes |
| US5750340A (en) | 1995-04-07 | 1998-05-12 | University Of New Mexico | In situ hybridization solution and process |
| US5866331A (en) | 1995-10-20 | 1999-02-02 | University Of Massachusetts | Single molecule detection by in situ hybridization |
| JP2002542793A (ja) | 1999-04-22 | 2002-12-17 | ザ アルバート アインシュタイン カレッジ オブ メディシン オブ イエシバ ユニバーシティ | 多蛍光fishによる遺伝子発現パターンのアッセイ法 |
| US6534266B1 (en) | 1999-04-22 | 2003-03-18 | Albert Einstein College Of Medicine Of Yeshiva University | Assay of transcription sites by multi-fluor fish |
Non-Patent Citations (5)
| Title |
|---|
| JOHN ET AL.: "RNA-DNA hybrids at the cytological level.", NATURE, vol. 223, no. 5206, 9 August 1969 (1969-08-09), pages 582 - 7 |
| LEVSKY JM; SINGER RH: "Fluorescence in situ hybridization: past, present and future", J. CELL SCIENCE, vol. 116, 2003, pages 2833 - 2838 |
| PARDUE ML; GALL JG.: "Molecular hybridization of radioactive DNA to the DNA of cytological preparations", PROC NATL ACAD SCI USA., vol. 64, no. 2, October 1969 (1969-10-01), pages 600 - 4 |
| ROCHE BIOCHEMICALS CATALOG 2002/2003, 2002, pages 191, XP008160670 * |
| See also references of EP2292798A4 * |
Cited By (3)
| Publication number | Priority date | Publication date | Assignee | Title |
|---|---|---|---|---|
| US9212390B2 (en) * | 2010-04-30 | 2015-12-15 | Exiqon A/S | In situ hybridization method and buffer |
| US10023912B2 (en) | 2010-04-30 | 2018-07-17 | Exiqon A/S | In situ hybridization method and buffer |
| CN110205357A (zh) * | 2019-06-22 | 2019-09-06 | 福建农林大学 | 一种多引物oligo探针的制备方法 |
Also Published As
| Publication number | Publication date |
|---|---|
| JPWO2009142214A1 (ja) | 2011-09-29 |
| CN102037137B (zh) | 2017-11-28 |
| EP2292798A4 (en) | 2011-11-16 |
| JP5733977B2 (ja) | 2015-06-10 |
| EP2292798B1 (en) | 2013-12-25 |
| US9051610B2 (en) | 2015-06-09 |
| US20110183331A1 (en) | 2011-07-28 |
| CN102037137A (zh) | 2011-04-27 |
| EP2292798A1 (en) | 2011-03-09 |
| AU2009250528B2 (en) | 2016-02-18 |
| AU2009250528A1 (en) | 2009-11-26 |
Similar Documents
| Publication | Publication Date | Title |
|---|---|---|
| JP5733977B2 (ja) | RNAinsituハイブリダイゼーション | |
| JP6246155B2 (ja) | 安定したナノレポーター | |
| Tsanov et al. | smiFISH and FISH-quant–a flexible single RNA detection approach with super-resolution capability | |
| US20180171396A1 (en) | Imaging individual mrna molecules using multiple singly labeled probes | |
| EP3434784A1 (en) | Multiplexable tag-based reporter system | |
| EP2500436B1 (en) | Method, probe and kit for DNA in situ hybridation and use thereof | |
| EP1469067A1 (en) | Method and apparatus for detecting nucleic acid data | |
| US20140220574A1 (en) | Methods for fixing and detecting rna | |
| CN112166199A (zh) | 用于对核酸分子进行计数的方法、系统和组合物 | |
| US20150225781A1 (en) | Silver nanocluster probe and target polynucleotide detection method using same, and silver nanocluster probe design method | |
| Barkan | Studying the structure and processing of chloroplast transcripts | |
| JP2009518004A (ja) | 核酸ハイブリダイゼーションにおけるCot−1DNAの歪みの低減 | |
| TW202328456A (zh) | 染色體著絲粒探針 | |
| Blanco et al. | A FRET-based assay for characterization of alternative splicing events using peptide nucleic acid fluorescence in situ hybridization | |
| JP4882071B2 (ja) | 基板、及び標的物質の定量方法 | |
| AU2015201993B2 (en) | Stable Nanoreporters | |
| Paré et al. | Transcriptional analysis of the Hox gene Scr at single molecule resolution yields evidence for transcriptional bursting during Drosophila embryogenesis | |
| Bermano et al. | The study of mRNA-cytoskeleton interactions and mRNA sorting in mammalian cells |
Legal Events
| Date | Code | Title | Description |
|---|---|---|---|
| WWE | Wipo information: entry into national phase |
Ref document number: 200980117915.8 Country of ref document: CN |
|
| 121 | Ep: the epo has been informed by wipo that ep was designated in this application |
Ref document number: 09750576 Country of ref document: EP Kind code of ref document: A1 |
|
| WWE | Wipo information: entry into national phase |
Ref document number: 2010513029 Country of ref document: JP |
|
| WWE | Wipo information: entry into national phase |
Ref document number: 2009250528 Country of ref document: AU Ref document number: 8206/DELNP/2010 Country of ref document: IN |
|
| NENP | Non-entry into the national phase |
Ref country code: DE |
|
| ENP | Entry into the national phase |
Ref document number: 2009250528 Country of ref document: AU Date of ref document: 20090519 Kind code of ref document: A |
|
| WWE | Wipo information: entry into national phase |
Ref document number: 2009750576 Country of ref document: EP |
|
| WWE | Wipo information: entry into national phase |
Ref document number: 12993338 Country of ref document: US |