US8046059B2 - Mobile diagnosis device - Google Patents
Mobile diagnosis device Download PDFInfo
- Publication number
- US8046059B2 US8046059B2 US11/886,794 US88679406A US8046059B2 US 8046059 B2 US8046059 B2 US 8046059B2 US 88679406 A US88679406 A US 88679406A US 8046059 B2 US8046059 B2 US 8046059B2
- Authority
- US
- United States
- Prior art keywords
- unit
- ecg
- signal
- volume pulse
- pulse signal
- Prior art date
- Legal status (The legal status is an assumption and is not a legal conclusion. Google has not performed a legal analysis and makes no representation as to the accuracy of the status listed.)
- Active, expires
Links
- 238000003745 diagnosis Methods 0.000 title claims abstract description 117
- 238000011156 evaluation Methods 0.000 claims abstract description 54
- 238000005259 measurement Methods 0.000 claims abstract description 14
- 230000002792 vascular Effects 0.000 claims abstract description 9
- 230000008081 blood perfusion Effects 0.000 claims abstract description 7
- 230000003287 optical effect Effects 0.000 claims abstract description 6
- 238000000034 method Methods 0.000 claims description 35
- 210000004369 blood Anatomy 0.000 claims description 19
- 239000008280 blood Substances 0.000 claims description 19
- 210000000748 cardiovascular system Anatomy 0.000 claims description 17
- QVGXLLKOCUKJST-UHFFFAOYSA-N atomic oxygen Chemical compound [O] QVGXLLKOCUKJST-UHFFFAOYSA-N 0.000 claims description 15
- 229910052760 oxygen Inorganic materials 0.000 claims description 15
- 239000001301 oxygen Substances 0.000 claims description 15
- 210000004204 blood vessel Anatomy 0.000 claims description 14
- 230000002861 ventricular Effects 0.000 claims description 14
- 229940000032 cardiovascular system drug Drugs 0.000 claims description 13
- 230000002526 effect on cardiovascular system Effects 0.000 claims description 11
- 230000036760 body temperature Effects 0.000 claims description 3
- 230000008859 change Effects 0.000 claims description 3
- 208000024172 Cardiovascular disease Diseases 0.000 abstract description 7
- 208000011775 arteriosclerosis disease Diseases 0.000 description 12
- 210000001519 tissue Anatomy 0.000 description 12
- 206010003210 Arteriosclerosis Diseases 0.000 description 11
- 238000010586 diagram Methods 0.000 description 10
- 208000037265 diseases, disorders, signs and symptoms Diseases 0.000 description 8
- 238000004458 analytical method Methods 0.000 description 7
- 201000010099 disease Diseases 0.000 description 7
- 230000036772 blood pressure Effects 0.000 description 6
- 230000008901 benefit Effects 0.000 description 5
- 238000004422 calculation algorithm Methods 0.000 description 5
- 210000000709 aorta Anatomy 0.000 description 4
- 230000000694 effects Effects 0.000 description 4
- 230000008569 process Effects 0.000 description 4
- INGWEZCOABYORO-UHFFFAOYSA-N 2-(furan-2-yl)-7-methyl-1h-1,8-naphthyridin-4-one Chemical compound N=1C2=NC(C)=CC=C2C(O)=CC=1C1=CC=CO1 INGWEZCOABYORO-UHFFFAOYSA-N 0.000 description 3
- 108010064719 Oxyhemoglobins Proteins 0.000 description 3
- 108010002255 deoxyhemoglobin Proteins 0.000 description 3
- 238000009795 derivation Methods 0.000 description 3
- 238000001514 detection method Methods 0.000 description 3
- 239000000706 filtrate Substances 0.000 description 3
- 230000006870 function Effects 0.000 description 3
- 230000031700 light absorption Effects 0.000 description 3
- 238000000718 qrs complex Methods 0.000 description 3
- 230000003595 spectral effect Effects 0.000 description 3
- 238000002560 therapeutic procedure Methods 0.000 description 3
- 238000012546 transfer Methods 0.000 description 3
- 238000012935 Averaging Methods 0.000 description 2
- 238000010521 absorption reaction Methods 0.000 description 2
- 208000029078 coronary artery disease Diseases 0.000 description 2
- 230000001419 dependent effect Effects 0.000 description 2
- 238000013399 early diagnosis Methods 0.000 description 2
- 230000005284 excitation Effects 0.000 description 2
- 238000001914 filtration Methods 0.000 description 2
- 210000004088 microvessel Anatomy 0.000 description 2
- 230000002093 peripheral effect Effects 0.000 description 2
- 230000001960 triggered effect Effects 0.000 description 2
- 206010003671 Atrioventricular Block Diseases 0.000 description 1
- 206010006578 Bundle-Branch Block Diseases 0.000 description 1
- 206010015856 Extrasystoles Diseases 0.000 description 1
- 206010019280 Heart failures Diseases 0.000 description 1
- 206010061216 Infarction Diseases 0.000 description 1
- 208000031481 Pathologic Constriction Diseases 0.000 description 1
- 208000000418 Premature Cardiac Complexes Diseases 0.000 description 1
- 208000007888 Sinus Tachycardia Diseases 0.000 description 1
- 206010040738 Sinus arrest Diseases 0.000 description 1
- 206010040741 Sinus bradycardia Diseases 0.000 description 1
- 208000001871 Tachycardia Diseases 0.000 description 1
- 230000004913 activation Effects 0.000 description 1
- 238000013459 approach Methods 0.000 description 1
- 230000005540 biological transmission Effects 0.000 description 1
- 230000017531 blood circulation Effects 0.000 description 1
- 208000006218 bradycardia Diseases 0.000 description 1
- 230000036471 bradycardia Effects 0.000 description 1
- 238000004364 calculation method Methods 0.000 description 1
- 239000003990 capacitor Substances 0.000 description 1
- 230000001143 conditioned effect Effects 0.000 description 1
- 230000008602 contraction Effects 0.000 description 1
- 230000006735 deficit Effects 0.000 description 1
- 238000011161 development Methods 0.000 description 1
- 230000003467 diminishing effect Effects 0.000 description 1
- 208000035475 disorder Diseases 0.000 description 1
- 230000002708 enhancing effect Effects 0.000 description 1
- 230000004907 flux Effects 0.000 description 1
- 230000003862 health status Effects 0.000 description 1
- 230000007574 infarction Effects 0.000 description 1
- 210000003141 lower extremity Anatomy 0.000 description 1
- 210000004165 myocardium Anatomy 0.000 description 1
- 238000005192 partition Methods 0.000 description 1
- 230000001575 pathological effect Effects 0.000 description 1
- 230000010412 perfusion Effects 0.000 description 1
- 210000005259 peripheral blood Anatomy 0.000 description 1
- 239000011886 peripheral blood Substances 0.000 description 1
- 238000013186 photoplethysmography Methods 0.000 description 1
- 238000012545 processing Methods 0.000 description 1
- 230000001373 regressive effect Effects 0.000 description 1
- 238000004904 shortening Methods 0.000 description 1
- 230000036262 stenosis Effects 0.000 description 1
- 208000037804 stenosis Diseases 0.000 description 1
- 230000006794 tachycardia Effects 0.000 description 1
- 230000001225 therapeutic effect Effects 0.000 description 1
- 210000003462 vein Anatomy 0.000 description 1
Images


Classifications
-
- A—HUMAN NECESSITIES
- A61—MEDICAL OR VETERINARY SCIENCE; HYGIENE
- A61B—DIAGNOSIS; SURGERY; IDENTIFICATION
- A61B5/00—Measuring for diagnostic purposes; Identification of persons
- A61B5/02—Detecting, measuring or recording pulse, heart rate, blood pressure or blood flow; Combined pulse/heart-rate/blood pressure determination; Evaluating a cardiovascular condition not otherwise provided for, e.g. using combinations of techniques provided for in this group with electrocardiography or electroauscultation; Heart catheters for measuring blood pressure
- A61B5/0205—Simultaneously evaluating both cardiovascular conditions and different types of body conditions, e.g. heart and respiratory condition
- A61B5/02055—Simultaneously evaluating both cardiovascular condition and temperature
-
- A—HUMAN NECESSITIES
- A61—MEDICAL OR VETERINARY SCIENCE; HYGIENE
- A61B—DIAGNOSIS; SURGERY; IDENTIFICATION
- A61B5/00—Measuring for diagnostic purposes; Identification of persons
- A61B5/02—Detecting, measuring or recording pulse, heart rate, blood pressure or blood flow; Combined pulse/heart-rate/blood pressure determination; Evaluating a cardiovascular condition not otherwise provided for, e.g. using combinations of techniques provided for in this group with electrocardiography or electroauscultation; Heart catheters for measuring blood pressure
- A61B5/026—Measuring blood flow
- A61B5/0285—Measuring or recording phase velocity of blood waves
-
- A—HUMAN NECESSITIES
- A61—MEDICAL OR VETERINARY SCIENCE; HYGIENE
- A61B—DIAGNOSIS; SURGERY; IDENTIFICATION
- A61B5/00—Measuring for diagnostic purposes; Identification of persons
- A61B5/02—Detecting, measuring or recording pulse, heart rate, blood pressure or blood flow; Combined pulse/heart-rate/blood pressure determination; Evaluating a cardiovascular condition not otherwise provided for, e.g. using combinations of techniques provided for in this group with electrocardiography or electroauscultation; Heart catheters for measuring blood pressure
-
- A—HUMAN NECESSITIES
- A61—MEDICAL OR VETERINARY SCIENCE; HYGIENE
- A61B—DIAGNOSIS; SURGERY; IDENTIFICATION
- A61B5/00—Measuring for diagnostic purposes; Identification of persons
- A61B5/145—Measuring characteristics of blood in vivo, e.g. gas concentration, pH value; Measuring characteristics of body fluids or tissues, e.g. interstitial fluid, cerebral tissue
- A61B5/1455—Measuring characteristics of blood in vivo, e.g. gas concentration, pH value; Measuring characteristics of body fluids or tissues, e.g. interstitial fluid, cerebral tissue using optical sensors, e.g. spectral photometrical oximeters
-
- A—HUMAN NECESSITIES
- A61—MEDICAL OR VETERINARY SCIENCE; HYGIENE
- A61B—DIAGNOSIS; SURGERY; IDENTIFICATION
- A61B5/00—Measuring for diagnostic purposes; Identification of persons
- A61B5/24—Detecting, measuring or recording bioelectric or biomagnetic signals of the body or parts thereof
- A61B5/316—Modalities, i.e. specific diagnostic methods
- A61B5/318—Heart-related electrical modalities, e.g. electrocardiography [ECG]
- A61B5/346—Analysis of electrocardiograms
- A61B5/349—Detecting specific parameters of the electrocardiograph cycle
- A61B5/352—Detecting R peaks, e.g. for synchronising diagnostic apparatus; Estimating R-R interval
-
- A—HUMAN NECESSITIES
- A61—MEDICAL OR VETERINARY SCIENCE; HYGIENE
- A61B—DIAGNOSIS; SURGERY; IDENTIFICATION
- A61B5/00—Measuring for diagnostic purposes; Identification of persons
- A61B5/72—Signal processing specially adapted for physiological signals or for diagnostic purposes
- A61B5/7203—Signal processing specially adapted for physiological signals or for diagnostic purposes for noise prevention, reduction or removal
- A61B5/7207—Signal processing specially adapted for physiological signals or for diagnostic purposes for noise prevention, reduction or removal of noise induced by motion artifacts
- A61B5/7214—Signal processing specially adapted for physiological signals or for diagnostic purposes for noise prevention, reduction or removal of noise induced by motion artifacts using signal cancellation, e.g. based on input of two identical physiological sensors spaced apart, or based on two signals derived from the same sensor, for different optical wavelengths
Definitions
- the present invention relates to a mobile diagnosis device comprised of an ECG unit to record an ECG signal, with the ECG unit being connected or connectible to two or more ECG electrodes to dissipate electrical signals from a patient's body, and comprised of a pulsoximetry unit for simultaneous recording of a volume pulse signal, with the pulsoximetry unit comprising at least one light source and at least one light sensor for optical measurement of blood perfusion in the vascular system of a patient's body tissue, and comprised of a program-controlled evaluation unit to evaluate the ECG signal and the volume pulse signal.
- Cardio-vascular diseases are the main cause of death in nearly all industrialized countries, as is well known.
- a special rank is taken by arteriosclerosis, i.e. the pathological stenosis of blood vessels. Approx. 50% of patients suffering from ateriosclerosis are also affected by coronary heart disease.
- arteriosclerosis i.e. the pathological stenosis of blood vessels.
- Approx. 50% of patients suffering from ateriosclerosis are also affected by coronary heart disease.
- Both the heart and the blood vessels must be evaluated equally in their functional status to permit early diagnosis.
- a healthy vascular system can offset minor heart insufficiencies for years, as is well known, while a vascular system already affected by arteriosclerosis advances circulatory decompensation.
- the ECG (electrocardiogram) might be the most frequently applied examination modality for diagnosis of cardio-vascular diseases.
- ECG electrocardiogram
- electrical signals are dissipated with two or more ECG electrodes from the body of a patient to be examined.
- the ECG thus obtained reflects the bioelectrical voltages that occur during excitation spread and regression at the heart.
- the ECG contains numerous parameters that can be diagnostically evaluated.
- R peak At the moment when the heart muscle contracts during a heart beat, the ECG shows an evident peak which is also designated as R peak.
- the ECG contains the so-called P wave which precedes the R peak.
- the R peak is followed by what is called a T wave.
- the minimum levels in the ECG immediately before and immediately after the R peak are designated by Q and S, respectively.
- Those parameters of interest for cardio-vascular diagnostics are the duration of the P wave as well as the amplitude of the P wave, the duration of the PQ interval, the duration of the QRS complex, the duration of the QT interval as well as the amplitude of the T wave. Both from the absolute values of the a.m. parameters and from the ratios of these parameters, it is possible to draw conclusions on the health status of the cardiovascular system.
- plethysmography blood-flow conditioned volume fluctuations of a peripheral blood vessel are measured.
- NIRP method near infrared photo plethysmography
- the diagnostic modalities applied therein are briefly called pulsoximeters.
- Such pulsoximeters typically comprise two light sources which radiate red and/or infrared light of a different wavelength into the human body tissue of a patient. The light is scattered in a patient's body tissue and partly absorbed. The scattered light is detected by means of a light sensor in form of an appropriate photocell.
- a prior art disclosed in U.S. Pat. No. 4,960,126 is an ECG-synchronized pulsoximeter.
- the prior art equipment is comprised of an ECG unit and a pulsoximetry unit.
- the ECG unit is utilized to determine the heart beat cycle by detection of R peaks in the ECG signal.
- the duration of the heart beat cycle is then taken as the basis in determining the oxygen saturation by means of the pulsoximetry unit.
- it is intended to improve signal averaging and reduce motion-induced artefacts.
- a more reliable determination of the value of oxygen saturation of blood is achieved thereby as compared with conventional pulsoximeters.
- a diagnosis device that allows for an (at least coarse) status and trend diagnosis of the cardio-vascular system.
- This device is intended to be capable of indicating to a patient an early auto-diagnosis of a cardio-vascular disease without posing excessive demands on a patient in terms of evaluating a plurality of diagnostic parameters.
- the present invention solves this task based upon a mobile diagnosis device of the type and nature mentioned hereinabove in that the evaluation unit is configured
- the present invention is based upon the finding that a combination of the ECG signal with the volume pulse signal in the combined diagnosis device comprised of an ECG unit and a pulsoximetry unit allows for a simple automatic status diagnostics of the cardiovascular system.
- the evaluation unit of the inventive mobile diagnosis device is capable of automatically recognizing the R peaks in the ECG signal. Thereby, the exact moment of a heart beat is automatically determined.
- the evaluation unit is capable of recognizing extreme levels, i.e. minimum or maximum levels, in the volume pulse signal. Based upon the extreme levels in a volume pulse signal, the moment of arrival of a pulse wave triggered with a heart beat can be ascertained at the peripheral measurement location covered by the pulsoximetry unit.
- This time-relevant interval is a measure of what is called pulse wave velocity.
- pulse wave velocity On the basis of pulse wave velocity, it is possible to make a statement on blood pressure. For a shortening in pulse wave velocity is accompanied by an increase in blood pressure, while an extension in pulse wave velocity is indicative for a decrease in blood pressure.
- an exact assessment of blood pressure based on pulse wave velocity is impossible, it is merely possible to indicate tendencies.
- the pulse wave velocity is dependent on blood density and, in particular, on the elasticity of blood vessel walls. From the elasticity of blood vessels, in turn, conclusions can be drawn concerning a possibly existing arteriosclerosis.
- Pulse wave velocity also depends on the inner diameter of arteria. Thereby it is possible to characterize the supply of blood at the relevant location of medical examination (e.g. on a patient's arm), assuming constant elasticity and constant density of blood.
- the inventive diagnosis device is autonomously able to make a functional evaluation of a patient's vascular system. Based upon automatically evaluated signals, the inventive diagnosis devices can roughly assess a patient's cardiovascular status and generate an adequate warning signal to a patient, if there is any indicative sign of arteriosclerosis.
- a patient can employ the inventive diagnosis device for auto-diagnosis. There is no necessity for a differentiated evaluation of the various cardio-vascular parameters determined by the device that in most cases would pose excessive demands on a patient.
- the evaluation unit is furthermore appropriately equipped to allow for
- a determination of blood oxygen saturation, ventricular, plethysmographic heart frequency rate allow for making a further and more refined status diagnostics of the cardio-vascular system.
- inventive diagnosis devices it is possible to automatically determine the absolute values of the heart frequency rate, heart frequency variability, and the corresponding arrhythmii of the heart. In this manner, arrhythmii such as Sinus Tachycardia, Sinus Bradycardia, Sinus Arrest and so-called Escape Beats can be ascertained.
- arrhythmii such as Sinus Tachycardia, Sinus Bradycardia, Sinus Arrest and so-called Escape Beats can be ascertained.
- Based upon the ECG signal it is moreover possible to make statements on the time-relevant duration of an auricular systole of the heart with one heart beat, the time-relevant duration of the ventricular contraction as well as the duration of the relaxation of the ventricle, etc.
- the evaluation unit of the inventive diagnosis device is furthermore appropriately equipped to allow for an automatic recognition of main and secondary peak values in the volume pulse signal, for determination of the amplitudes of the main and secondary peak values, and for determination of the time-relevant interval between the main and secondary peak values.
- Dicrotism is defined as the double-peak configuration of the blood pressure course in distant blood vessels. Dicrotism is caused by an overlapping of the pulse wave proceeding from the heart with a regressive pulse wave from the reflexion of the pulse wave at vessel partitions or less elastic vessel sections.
- the secondary maximum levels in the volume pulse signal are caused above all by a reflexion of the pulse waves at the lower extremities. Therefore, the time-relevant interval between main and secondary peak values is mainly determined by the properties of the aorta. Thereby it is possible to determine a second pulse wave velocity, i.e. the pulse wave velocity in the aorta, while the first pulse wave velocity is determined at the relevant measuring point (e.g. on a patient's arm), as has been outlined hereinabove. Hence, with the inventive diagnosis device, it is possible to advantageously determine two different pulse wave velocities and evaluate these to diagnose diseases (individually or in combination).
- the inventive diagnosis device is comprised of a diagnosis unit that is appropriately equipped to allow for a determination of the status of a patient's cardiovascular system from the parameters determined by means of the evaluation unit.
- the diagnosis device has a modular setup.
- the evaluation device is merely in charge of evaluating captured signals in order to determine thereof those parameters required for diagnostics in the manner described hereinabove. These parameters are then processed by the diagnosis unit of the diagnosis device in order to draw conclusions therefrom with regard to the status of the cardiovascular system.
- the diagnosis unit is also in charge of automatically recognizing the existence of arteriosclerosis and generating a corresponding warning signal to the patient, if required.
- the diagnosis unit of the inventive diagnosis device is furthermore appropriately equipped to be able to determine trends with regard to a change in the status of a patient's cardio-vascular system from the time-relevant variation of the parameters stored by means of the memory unit.
- a change in the parameters for example a continuous increase in pulse wave velocity, may be indicative for a developing cardio-vascular disease at an early stage.
- Such trends can be utilized for automatic recognition of diseases, if the diagnosis device is repeatedly utilized by a patient over an extensive period of time, with the parameters automatically determined by the evaluation unit being stored by means of the memory unit of the diagnosis device.
- the diagnosis unit of the inventive diagnosis device can expediently be equipped to compute an elasticity parameter from the time-relevant interval between an R peak in the ECG signal and a successive extreme level in the volume pulse signal, with the elasticity parameter representing a measure for the elasticity of a patient's blood vessels.
- the pulse wave velocity (PWG) is proportional to the square root from the quotient of the elasticity of blood vessels ⁇ and the specific density of blood ⁇ .
- ⁇ is the elasticity of blood vessels
- h is the wall thickness of veins
- d is the diameter of vessels
- ⁇ is the density of blood.
- the diagnosis device is comprised of a display unit to display the ECG signal, the volume pulse signal, and the parameters determined by means of the evaluation unit.
- a patient utilizing the diagnosis device and/or the practicing doctor can read-out all values comfortably from the display unit. At the same time, it is possible to check the diagnosis device for proper functioning.
- the ECG unit, the pulsoximetry unit, and the evaluation unit are accommodated in a common casing.
- the diagnosis device is of a compact setup and can be utilized as a mobile device at any time.
- the ECG electrodes as well as the light source and the light sensor of the pulsoximetry unit are so arranged on the exterior side of the casing that a patient can touch with one hand a first ECG electrode and with the other hand a second ECG electrode and simultaneously the light sensor.
- a patient can hold tight the diagnosis device configured in this manner with both hands and watch the display of the diagnosis device at the same time.
- the ECG derivation then proceeds from the patient's left and right hand.
- the pulsoximetry unit concurrently captures the volume pulse signal at one of these two hands that touch the casing.
- This configuration has the advantage in that it is not necessary to connect additional electrodes through cable connections to the diagnosis device. All components form a compact unit. Faults in operating the device, more particularly on connecting the ECG electrodes and affixing a pulsoximeter to a patient's body are ruled out.
- the ECG signal can be taken-up through at least two external electrodes which can be glued directly on a patient's body.
- This arrangement has the advantage that it keeps a patient's hands free, for example to keep position or get support on an ergometer.
- the light source and the light sensor in a measuring head separated from the casing, i.e. in such a manner that the light sensor can be put on a patient's body at arbitrary measuring points. This allows for examining microvascular perfusion not only on a patient's hand but at arbitrary measuring points on a patient's body.
- the present invention furthermore relates to a method for acquisition and evaluation of a patient's cardio-vascular parameters, wherein
- An actually known diagnosis device comprised of an ECG unit and a pulsoximetry unit can be employed by way of an adequate program control of the evaluation unit in accordance with the present invention.
- a computer software for the evaluation unit of such a diagnosis device includes instructions
- the computer software can comprise instructions for computation of the pulse wave velocity from the time-relevant interval between an R peak in the ECG signal and a successive extreme level in the volume pulse signal.
- the pulse wave velocity represents the central parameter which the status diagnostics of the cardio-vascular system with the inventive diagnosis device is mainly based upon.
- the computer software prefferably contains instructions for automatic recognition of main and secondary peak values in the volume pulse signal, to determine the time-relevant interval between main and secondary peak values, and to compute a second pulse wave velocity from the time-relevant interval between the main and secondary peak values.
- This second pulse wave velocity is the pulse wave velocity in the aorta.
- a computer software of the type described hereinabove can also be utilized in the sense of the present invention to evaluate an ECG signal and a volume pulse signal by means of a usual PC.
- FIG. 1 shows the setup of the inventive diagnosis device based on a block diagram
- FIG. 2 shows a block diagram representation of the pulsoximetry unit of the inventive diagnosis device
- FIG. 3 shows a block diagram representation of the ECG unit
- FIG. 4 illustrates the determination of the pulse wave velocity based on a process diagram
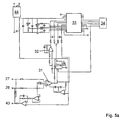
- FIGS. 5 and 5 a show a circuit diagram of the ECG unit of the inventive diagnosis device
- FIGS. 6 and 6 a show a circuit diagram of the pulsoximetry unit of the inventive diagnosis device
- FIG. 7 represents a volume pulse signal together with an ECG signal
- FIG. 8 shows a view of the inventive diagnosis device
- FIG. 9 shows a process diagram for evaluation of the ECG signal
- FIG. 10 shows a process diagram for evaluation of the volume pulse signal.
- FIG. 1 elucidates the essential components of the inventive mobile diagnosis device and their co-action.
- the diagnosis device is comprised of an ECG unit 1 and a pulsoximetry unit 2 .
- the ECG unit 1 is connectible by ECG electrodes not shown more detailedly in FIG. 1 for dissipation of electrical signals from a patient's body.
- the ECG signals captured by the ECG unit 1 are transmitted to an analysis unit 3 .
- the pulsoximetry unit 2 serves for optical measurement of blood perfusion in the micro-vascular system of a patient's body tissue.
- the volume pulse signals captured by the pulsoximetry unit 2 at two different light wavelengths are also transmitted to the analysis unit 3 .
- the signals from the pulsoximetry unit 2 and from the ECG unit 1 are pre-processed.
- the signals pass through a bandpass filter in order to filtrate interferences in a range of net frequency from 50 and/or 60 Hz.
- the signals from the pulsoximetry unit 2 are subjected to averaging in order to reduce the signal-to-noise ratio.
- the pre-processed signals from the ECG unit 1 and from the pulsoximetry unit 2 come into an evaluation unit 4 .
- the evaluation unit 4 the parameters required for cardio-vascular diagnostics are extracted from the signals. To this effect, the evaluation unit 4 has an appropriate program control.
- R peaks in the ECG signal are automatically recognized, extreme levels in the volume pulse signal are automatically recognized, and the time-relevant interval between an R peak in the ECG signal and the successive extreme level, e.g. the nearest minimum in terms of time, in the volume pulse signal is determined.
- the blood oxygen saturation is determined from the volume pulse signals of the pulsoximetry unit 2 .
- Determined from the time-relevant intervals between R peaks in the ECG signal is the ventricular heart frequency rate.
- the plethysmographic heart frequency rate is determined from the volume pulse signal.
- the evaluation unit 4 is appropriately equipped by its program control to automatically recognize main and secondary peak values in volume pulse signals as well as to determine the amplitudes of main and secondary peak values.
- the time-relevant intervals between main and secondary peak values in volume pulse signals are determined by means of the evaluation unit 4 , whereof the pulse wave velocity in the aorta can be ascertained, as has been outlined hereinabove.
- the parameters thus determined by the evaluation unit 4 are passed on to a diagnosis unit 5 .
- the diagnosis unit 5 is appropriately equipped to allow for a determination of the status of the cardio-vascular system from those parameters determined by means of the evaluation unit 4 .
- the diagnosis unit 5 interprets the relevant parameters in order to assess the quality of a patient's vascular system and to ascertain whether the parameters determined are indicative signs for an existing arteriosclerosis.
- the diagnosis unit 5 evaluates the heart frequency rate in order to ascertain whether there is a bradycardia or a tachycardia. Other irregularities of the heart beat such as for example extrasystoles, can also be ascertained by means of the diagnosis unit 5 . Furthermore, the diagnosis unit 5 compares the ventricular heart frequency rate with the plethysmographic heart frequency rate in order to detect pulse deficits, if any. But in particular, the diagnosis unit 5 is appropriately equipped with its program control to compute an elasticity parameter from the time-relevant interval between an R peak in the ECG signal and a successive extreme level in the volume pulse signal. Accordingly, the elasticity parameter is a measure for the elasticity of a patient's blood vessels.
- the diagnosis unit 5 can analyse the cardiovascular status of a patient autonomously and with high reliability. Thereby, the inventive diagnosis device is helpful to allow for an early diagnosis of a coronary heart disease.
- the parameters determined by means of evaluation unit 4 as well as the data derived therefrom by means of the diagnosis unit 5 are ultimately stored in a memory unit 6 of the inventive diagnosis device, i.e. by simultaneously storing the date and time of each measurement. All the data and parameters thus obtained can be displayed by means of a display unit 7 .
- display unit 7 displays the ECG signal, the volume pulse signal, and the pulse wave velocity.
- an interface 8 is provided for to establish a connection between the diagnosis devices and a computer. Via interface 8 all the data and parameters, particularly those data and parameters stored in the memory unit 6 can be transmitted to a PC (not shown in detail) of the practicing doctor. There, the data can be analysed more detailedly. In particular, those data and parameters recorded with the diagnosis device over an extensive period of time can be investigated for changes in order to be able to derive therefrom certain trends with regard to the development of a patient's existing disease. Moreover, it is possible to follow-up the success of a therapy.
- inventive diagnosis device also as a mere measuring data acquisition and transmission unit and to transfer recorded signals, for example directly to a doctor's PC by means of which the corresponding evaluations, computations, and representations (see further below) can then be carried out (possibly more quickly and more comfortably.)
- FIG. 2 illustrates the setup of the pulsoximetry unit 2 of the inventive diagnosis device.
- the pulsoximetry unit 2 is comprised of a micro-controller 9 .
- An integral part of the micro-controller 9 is a timing generator 10 , which activates an infrared modulator 11 and a red modulator 12 .
- the supply voltages of adjustable voltage supplies 13 and 14 are modulated. Modulated voltages are conducted through current/voltage converters 15 , 16 to a light-emitting diode 17 emitting an infrared light and to a light-emitting diode 18 emitting a red light.
- the timing generator 10 ensures that the light-emitting diodes 17 and 18 are alternately turned on and off.
- a patient's body tissue is alternately radiated with red and infrared light.
- the light is scattered and absorbed corresponding to the oxyhemoglobin and/or deoxyhemoglobin content of blood that flows through the tissue 19 .
- the scattered light is registered by a photodetector (a photodiode) 20 .
- the photon flux of the photodetector 20 is converted by means of a converter 21 into a voltage, amplified by means of an amplifier 22 , and transformed by means of an analog/digital transducer 23 into a digital signal.
- the digital signal is then passed on to an infrared/red demodulator 24 which is a component of the micro-controller 9 .
- the infrared/red demodulator 24 is linked to the timing generator 10 .
- the demodulator 24 divides the digital signal into two volume pulse signals 25 and 26 .
- the signal 25 represents the absorption of infrared light in the tissue 19
- the signal 26 is allocated to the absorption of the red light in the tissue 19 .
- the setup of the ECG unit 1 of the inventive diagnosis device is explained.
- the signals captured by means of electrodes 27 and 28 initially pass through high-pass filter 29 and 30 .
- the boundary frequency of the high-pass filters 29 and 30 preferably ranges between 0.05 and 0.5 Hz.
- the filtered signals are then fed to a differential amplifier 31 . It is extinguished by a high common-mode rejection which is purposive to reduce motion artefacts in the ECG signal.
- the differential amplifier 31 is succeeded by another amplifier 32 with a variable amplifying factor.
- the analog signal thus amplified is transformed by means of an analog/digital transducer 33 into a digital signal that is fed to a micro-controller 34 (which may be identical to the micro-controller 9 ). Finally, a filtration 35 of the digital signal is carried out in order to filtrate interferences of the signal at a net frequency of 50 and/or 60 Hz from the ECG signal.
- the principle functional mode of the inventive diagnosis device is elucidated in FIG. 4 .
- the signals captured by ECG unit 1 and pulsoximetry unit 2 and processed by means of analysis unit 3 are evaluated by means of evaluation unit 4 , as has been outlined hereinabove.
- the evaluation unit incorporates an appropriate program control which in a process step 36 initially analyses the ECG signal and determines various time intervals of the PQRST complex.
- the R peaks in an ECG signal are recognized in a process step 36 .
- the exact points of time of the detected R peaks are determined in a process step 37 .
- the program control of the evaluation unit 4 is comprised of a dicrotism calculation routine 38 . It is in charge of automatically recognizing main and secondary peak values in the digital volume pulse signals, and of determining the amplitudes of the main and secondary peak values as well as the time intervals between the main and secondary peak values.
- Another routine 39 in turn, by access to the real-time clock of the diagnosis devices, determines the exact point of time for each detected primary maximum level.
- the program control of the diagnosis unit 5 is comprised of a routine 40 for computation of an elasticity parameter from the time-relevant interval between the R peaks determined by means of routine 37 and the points of time of primary maximum levels (and/or minimum levels) evidenced by the volume pulse signals and determined by means of routine 39 .
- routine 40 determines the pulse wave velocity which is invertedly proportional to the time interval between an R peak in the ECG signal and the succeeding minimum in one of the volume pulse signals.
- the elasticity parameter represents a measure for the elasticity of a patient's blood vessels and is displayed by means of display unit 17 .
- the diagnosis unit 5 is comprised of a routine 41 for evaluation of the ventricular heart beat from the digital ECG signal as well as a routine 42 to assess the oxygen saturation of blood from the digital plethysmographic signals.
- the ventricular heart frequency rate as well as the oxygen saturation are also displayed by means of the display unit 7 .
- the most important function of the inventive diagnosis device is the automatic early recognition of an arteriosclerosis disease, as has been outlined hereinabove.
- three significant parameters are determined which are characteristic for the elasticity of a patient's blood vessels. Therefore, based on these three parameters, one can ascertain an existing arteriosclerosis and even the severity of an existing disease.
- These three parameters are the time difference between the main and secondary peak values in the volume pulse signal, the relative intensity of the main and secondary peak values in the pulse wave velocity resulting from the time difference between an R peak in the ECG signal and the successive extreme level in the volume pulse signal.
- the inventive diagnosis device Upon evaluation of these three parameters, the inventive diagnosis device generates a warning signal, if required, advising a patient, for example, to consult a doctor. The practicing doctor can then evaluate in detail those data stored in the memory unit 6 of the device and establish an appropriate therapy for the patient.
- the diagram according to FIG. 5 shows the principle circuit engineering setup of the ECG unit 1 of the inventive diagnosis device.
- ECG electrodes 27 and 28 electrical signals are dissipated from a patient's body. Initially, these electrical signals are filtered by means of a passive network composed of diodes, capacitors, and resistors. Subsequently the signals are passed to the differential amplifier 31 . It is distinguished by a high common-mode rejection. Thereby, interferences synchronously occurring at both electrodes are eliminated from the ECG signal. Via a third electrode 43 , an inverted common-mode signal can be fed back to a patient, thus further reducing such signal interferences.
- FIGS. 6 and 6 a illustrate the principle circuit engineering setup of the pulsoximetry unit 2 of the inventive diagnosis device.
- the interconnection of the infrared LED 17 is identical to the interconnection of the red LED 18 . Both parts are supplied with electric current through the reference voltage source 45 .
- diodes 17 and 18 The activation of diodes 17 and 18 is effected through digital potentiometers 46 and 47 . These are triggered by the micro-controller 9 of the pulsoximetry unit 2 .
- the voltages at the outputs of operation amplifiers 48 and 49 together with the succeeding resistors determine those electric currents that stream through the light-emitting diodes 17 and/or 18 .
- Photodiodes 50 and 51 are provided for which are connected to the operation amplifiers 48 and 49 .
- the circuit variant according to FIG. 6 a just needs one photodiode 50 . Hereby a temperature-independent constant intensity of the light emitted from the diodes 17 and 18 is controlled.
- the light from light-emitting diodes 17 and 18 is detected by means of the photodiode 20 .
- the photodiode 20 is connected to an operations amplifier 52 which converts the electric current through photodiode 20 into a voltage and amplifies it. This voltage is digitalized by means of the analog/digital transducer 23 and passed on to the pulsoximetry unit after it has been averaged.
- an NTC resistor 53 is provided for measurement of a patient's body temperature at the measuring point of the pulsoximetry unit.
- the NTC resistor 53 is linked to the analog/digital transducer 23 .
- the NTC resistor 53 is a component part of a simple voltage divider which is charged with voltage through a reference voltage source 54 .
- the reference voltage source 54 is simultaneously utilized for the analog/digital transducer 23 . According to FIG. 6 a , only one reference voltage source 45 is provided for.
- the circuit as per FIG. 5 a corresponds to the variant shown in FIG. 6 a in which an NTC resistor connected to the analog/digital transducer 33 is provided for which is missing in FIG. 6 a.
- FIG. 7 at top shows and ECG signal 55 together with a volume pulse signal 56 as a function of time. Signals 55 and 56 are simultaneously recorded with the inventive mobile diagnosis device. A plurality of R peaks 57 can be seen in the ECG signal 55 . Each of the R peaks 57 indicates a ventricular heart beat. The primary maximum levels 58 and the secondary maximum levels 59 can be seen in the volume pulse signal. It evidences the dicrotism, i.e. the double peak configuration of the blood pressure course in the vessels covered by the pulsoximetry unit 2 .
- the lower diagram of FIG. 7 shows a time clip from the ECG signal 55 and from the volume pulse signal 56 in a magnified representation.
- time difference 60 there is a time difference 60 between the R peak 57 and the primary maximum level 58 of the volume pulse signal 56 .
- This time difference is determined in accordance with the present invention.
- the time difference 60 depends on the pulse wave velocity.
- a large time difference suggests a low pulse wave velocity.
- a short time difference implies a high pulse wave velocity.
- a substantially increased pulse wave velocity is indicative for the existence of arteriosclerosis, because the pulse wave velocity depends on the elasticity of blood vessels.
- To determine the pulse wave velocity one can also take recourse to the time difference between the R peak 57 and a successive minimum of the volume pulse signal 56 . This approach may have some advantages in terms of signal processing.
- the inventive diagnosis device evaluates the time difference 61 between the primary maximum level 58 and the secondary maximum level 59 of the volume pulse signal as well as the relative intensities of the primary maximum level 58 and secondary maximum level 59 . From these parameters, one can draw a highly reliable conclusion as to the cardio-vascular status, more particularly with regard to the elasticity of blood vessels. Moreover, the P wave 62 , the minimum levels and S 63 and/or 64 as well as the T wave 65 can be seen in the ECG signal 55 . The time differences between these characteristic features of the ECG signal 55 are automatically evaluated by means of the inventive diagnosis device.
- FIG. 8 shows a view of the inventive diagnosis device. It is comprised of a mainly quader-shaped casing 66 , on the top side of which an LCD display 67 is arranged. It represents the display unit 7 of the diagnosis device. On the LCD display 67 , the ECG signal 55 as well as the volume pulse signal 56 are graphically shown as a function of time. Concurrently, the ventricular heart frequency rate HR, the oxygen saturation of blood SaO 2 as well as the pulse wave velocity PWG are displayed. At the external side of casing 66 , the two ECG electrodes 27 and 28 are arranged in such a manner that a patient can touch the electrode 27 with one hand and the electrode 28 with the other hand.
- the pulsoximetry unit of the diagnosis device captures the volume pulse signal on the hand with which a patient touches the electrode 28 .
- the switches 68 Arranged at the front side of casing 66 are the switches 68 to operate the diagnosis device.
- the algorithm implemented by the program control of the diagnosis device to evaluate the ECG signal 55 is explained in the following.
- the algorithm receives the digital ECG signal. Initially this signal is subjected to a low-pass filtration 70 in order to reduce the signal-to-noise ratio.
- the first time-related derivation of the ECG signal is formed.
- the R peaks are then automatically recognized based upon zero crossings of the derived signal from positive to negative values. From the time differences between the R peaks, the ventricular heart frequency rate is determined in process step 63 . Two values of the heart frequency rate determined in immediate succession are compared with each other and checked for similarity.
- N s is the number of heart frequency rate values considered to be similar to each other
- N t is the total number of determined heart frequency rate values.
- N t is equal to ten.
- the quality parameter Q can also be displayed by display unit 7 of the diagnosis device. A small value of Q suggests an arrhythmical heart beat.
- process step 74 the minimum levels in the ECG signal are determined immediately before and after the R peaks. Thereof, all parameters of the QRS complex of the ECG signal can be computed in process step 75 . The first maximum level after each R peak is determined in process step 76 . This maximum represents the T wave of the ECG signal.
- the QT interval i.e. the time difference between the QRS complex and the T wave is computed.
- process step 78 a maximum level between the T wave detected in process step 76 and the next R peak is determined.
- the PR interval i.e. the time difference between the P wave and the R peak can be computed in process step 79 .
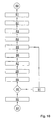
- FIG. 10 elucidates the algorithm of the inventive diagnosis device for determination of the plethysmographic heart frequency rate.
- the algorithm proceeds from the digital volume pulse signal 80 . It is initially filtered in a low-pass filter in a process step 81 in order to reduce the signal-to-noise ratio; subsequently the computation of the first time difference of the volume pulse signal is effected in process step 82 . The first time-related derivation is again filtered in a low-pass filter in process step 83 to reduce the signal-to-noise ratio.
- a threshold value is stipulated in process step 84 . For example, it may correspond to the absolute minimum of the volume pulse signal during a pre-settable time interval of e.g. 10 s.
- process step 85 the passages of the volume pulse signal through the threshold stipulated before are determined.
- process step 86 local minimum levels in the derived signal between the passages through the threshold value defined before are determined.
- the time-related time interval between the local minimum levels in the derived signal corresponds to the time difference between the successive points of inversion in the original volume pulse signal. Therefore, the plethysmographic heart frequency rate can be computed in process step 87 from the time difference between the local minimum levels.
- the values of the plethysmographic heart frequency rate determined in chronological succession are checked for similarity in process step 88 .
- a quality parameter is computed in process step 89 for a defined number of heart frequency rates determined in consecutive succession.
- the quality parameter is evaluated in process step 90 and, if required, the threshold value is increased in process step 91 and the process is passed through again, commencing with process step 85 .
- the repetition terminates as the quality parameter has reached a maximum valve.
- process step 92 an averaged plethysmographic heart frequency rate is computed from the individual heart frequency rate values. This value is then displayed together with the maximum quality parameter. This marks the end of the algorithm in process step 93 .
Applications Claiming Priority (4)
| Application Number | Priority Date | Filing Date | Title |
|---|---|---|---|
| DE102005013429A DE102005013429A1 (de) | 2005-03-21 | 2005-03-21 | Mobiles Diagnosegerät |
| DE102005013429 | 2005-03-21 | ||
| DE102005013429.7 | 2005-03-21 | ||
| PCT/EP2006/002410 WO2006099988A1 (de) | 2005-03-21 | 2006-03-16 | Mobiles diagnosegerät |
Publications (2)
| Publication Number | Publication Date |
|---|---|
| US20080200823A1 US20080200823A1 (en) | 2008-08-21 |
| US8046059B2 true US8046059B2 (en) | 2011-10-25 |
Family
ID=36607466
Family Applications (1)
| Application Number | Title | Priority Date | Filing Date |
|---|---|---|---|
| US11/886,794 Active 2026-04-27 US8046059B2 (en) | 2005-03-21 | 2006-03-16 | Mobile diagnosis device |
Country Status (10)
| Country | Link |
|---|---|
| US (1) | US8046059B2 (de) |
| EP (1) | EP1860999B1 (de) |
| JP (2) | JP2008532719A (de) |
| KR (1) | KR101286402B1 (de) |
| CN (1) | CN101170944B (de) |
| AT (1) | ATE452580T1 (de) |
| CA (1) | CA2602269C (de) |
| DE (2) | DE102005013429A1 (de) |
| EA (1) | EA013620B1 (de) |
| WO (1) | WO2006099988A1 (de) |
Cited By (9)
| Publication number | Priority date | Publication date | Assignee | Title |
|---|---|---|---|---|
| US20080275317A1 (en) * | 2005-08-09 | 2008-11-06 | Ok Kyung Cho | Medical Measuring Device |
| US20100056880A1 (en) * | 2006-11-23 | 2010-03-04 | Ok Kyung Cho | Medical measuring device |
| US20100234701A1 (en) * | 2007-09-07 | 2010-09-16 | Ok Kyung Cho | Medical measurement device for bioelectrical impedance measurement |
| US20120310103A1 (en) * | 2011-06-02 | 2012-12-06 | Nokia Siemens Networks Oy | Heart monitor with user input |
| US9101264B2 (en) | 2006-06-15 | 2015-08-11 | Peerbridge Health, Inc. | Wireless electrode arrangement and method for patient monitoring via electrocardiography |
| US9675264B2 (en) | 2013-03-15 | 2017-06-13 | Peerbridge Health, Inc. | System and method for monitoring and diagnosing patient condition based on wireless sensor monitoring data |
| US9833146B2 (en) | 2012-04-17 | 2017-12-05 | Covidien Lp | Surgical system and method of use of the same |
| US10226190B2 (en) | 2009-03-05 | 2019-03-12 | Ingo Flore | Diagnostic measuring device |
| US11559234B2 (en) | 2018-09-06 | 2023-01-24 | The Aga Khan University | Portable electrocardiography device |
Families Citing this family (23)
| Publication number | Priority date | Publication date | Assignee | Title |
|---|---|---|---|---|
| CA2602899A1 (en) * | 2005-03-21 | 2006-09-28 | Software Solutions Limited | System for continuous blood pressure monitoring |
| CN101827555B (zh) * | 2007-09-07 | 2012-11-21 | 英戈·弗洛尔 | 诊断用传感器单元 |
| US8386000B2 (en) | 2008-09-30 | 2013-02-26 | Covidien Lp | System and method for photon density wave pulse oximetry and pulse hemometry |
| US8433382B2 (en) | 2008-09-30 | 2013-04-30 | Covidien Lp | Transmission mode photon density wave system and method |
| TWI439255B (zh) * | 2009-04-28 | 2014-06-01 | 私立中原大學 | Measurement of arrhythmia |
| US8788001B2 (en) | 2009-09-21 | 2014-07-22 | Covidien Lp | Time-division multiplexing in a multi-wavelength photon density wave system |
| US8494604B2 (en) | 2009-09-21 | 2013-07-23 | Covidien Lp | Wavelength-division multiplexing in a multi-wavelength photon density wave system |
| US20110218448A1 (en) * | 2010-03-03 | 2011-09-08 | Buntic Rudolf F | Perfusion detection devices and methods of using the same |
| RU2469641C2 (ru) * | 2011-03-11 | 2012-12-20 | Государственное образовательное учреждение высшего профессионального образования "Самарский государственный аэрокосмический университет имени академика С.П. Королева (национальный исследовательский университет)" (СГАУ) | Устройство для определения показателя эластичности артериальных сосудов |
| JP5874367B2 (ja) | 2011-12-13 | 2016-03-02 | 富士通株式会社 | 心拍信号処理装置、および心拍信号処理方法 |
| CN103315709B (zh) * | 2013-06-13 | 2015-06-03 | 北京豪络科技有限公司 | 一种有嵌入传感电路用于检测人体生命特征的表带和检测方法 |
| CN103654770B (zh) * | 2013-12-03 | 2015-11-18 | 上海理工大学 | 移动心电信号qrs波实时波检测方法及装置 |
| CN104173035A (zh) * | 2014-07-22 | 2014-12-03 | 北京工业大学 | 一种便携袖带式健康监测装置及其使用方法 |
| WO2016131492A1 (en) * | 2015-02-20 | 2016-08-25 | Synergia Medical | Photovoltaic electrical stimulation device |
| CN104720773A (zh) * | 2015-03-10 | 2015-06-24 | 中国科学院电子学研究所 | 一种手持式的人体多健康参数监护系统 |
| JP6778369B2 (ja) * | 2015-03-10 | 2020-11-04 | 東京都公立大学法人 | 生体信号解析システムおよびプログラム |
| CN106175720A (zh) * | 2015-05-06 | 2016-12-07 | 深圳迪美泰数字医学技术有限公司 | 一种生理生化参数监护与记录的方法及装置 |
| JP6537900B2 (ja) * | 2015-06-09 | 2019-07-03 | 日本光電工業株式会社 | 医療用装置、生体パラメータ解析方法および生体パラメータ解析プログラム |
| FR3053237A1 (fr) * | 2016-06-30 | 2018-01-05 | Universite D'aix-Marseille | Dispositif de detection d'au moins un trouble du rythme cardiaque |
| KR102244675B1 (ko) | 2019-04-26 | 2021-04-26 | 연세대학교 산학협력단 | 경피성 산소분압 센서가 내장된 모바일 디바이스 센서 플랫폼 |
| CN112858445B (zh) * | 2021-01-15 | 2023-03-17 | 重庆大学 | 一种基于摩擦起电效应的变压器油老化程度与水分含量自驱动传感系统及检测方法 |
| GB202403014D0 (en) * | 2021-08-18 | 2024-04-17 | Second Medical Center Of Chinese Pla General Hospital | Glove for measuring multiple physiological parameters, and system for detecting risk of suffering from hypertensive disease |
| WO2024038688A1 (ja) * | 2022-08-18 | 2024-02-22 | ソニーグループ株式会社 | 情報処理装置、情報処理方法、及びプログラム |
Citations (12)
| Publication number | Priority date | Publication date | Assignee | Title |
|---|---|---|---|---|
| US4934382A (en) | 1989-07-03 | 1990-06-19 | Barone Jr Richard J | Protective sheath with manipulation tabs |
| US4960126A (en) | 1988-01-15 | 1990-10-02 | Criticare Systems, Inc. | ECG synchronized pulse oximeter |
| US5191891A (en) * | 1991-09-10 | 1993-03-09 | Ralin, Inc. | Portable ECG monitor/recorder |
| US5309916A (en) | 1990-07-18 | 1994-05-10 | Avl Medical Instruments Ag | Blood pressure measuring device and method |
| US6190325B1 (en) * | 1998-10-02 | 2001-02-20 | Colin Corporation | Blood-pressure monitoring apparatus |
| US20010012916A1 (en) | 1999-12-23 | 2001-08-09 | Klaus Deuter | Blood pressure measuring device |
| US20020087087A1 (en) | 1995-11-06 | 2002-07-04 | Colin Corporation | Apparatus for measuring pulse-wave propagation velocity |
| EP1317902A1 (de) | 2001-12-10 | 2003-06-11 | Kabushiki Gaisha K-and-S | Vorrichtung zur Beobachtung biologischer Daten |
| US20030109901A1 (en) | 2001-12-11 | 2003-06-12 | Wilson Greatbatch | Photonic pacemaker-cardiac monitor |
| US20040116784A1 (en) | 2002-12-13 | 2004-06-17 | Intercure Ltd. | Apparatus and method for beneficial modification of biorhythmic activity |
| US20040162493A1 (en) | 1999-10-07 | 2004-08-19 | Mills Alexander K. | Device and method for noninvasive continuous determination of physiologic characteristics |
| US7215991B2 (en) * | 1993-09-04 | 2007-05-08 | Motorola, Inc. | Wireless medical diagnosis and monitoring equipment |
Family Cites Families (17)
| Publication number | Priority date | Publication date | Assignee | Title |
|---|---|---|---|---|
| GB8422770D0 (en) * | 1984-09-10 | 1984-10-17 | Pulse Time Products Ltd | Indicating blood pressure |
| US4934372A (en) * | 1985-04-01 | 1990-06-19 | Nellcor Incorporated | Method and apparatus for detecting optical pulses |
| JPS63186623A (ja) * | 1987-01-27 | 1988-08-02 | 松下電工株式会社 | 心拍計 |
| JPH04276235A (ja) * | 1991-03-04 | 1992-10-01 | Casio Comput Co Ltd | 信号検出装置 |
| JP2544324Y2 (ja) * | 1992-09-25 | 1997-08-20 | 日本光電工業株式会社 | 生体情報測定用センサ |
| JP3223931B2 (ja) * | 1992-11-04 | 2001-10-29 | カシオ計算機株式会社 | 人体接触用電極を備えた電子機器 |
| JPH08257002A (ja) * | 1995-03-27 | 1996-10-08 | Nippon Colin Co Ltd | 脈波伝播速度測定装置 |
| JP3558431B2 (ja) * | 1995-11-27 | 2004-08-25 | コーリンメディカルテクノロジー株式会社 | 脈波伝播速度測定機能付き自動血圧測定装置 |
| JP3599858B2 (ja) * | 1995-11-06 | 2004-12-08 | コーリンメディカルテクノロジー株式会社 | 脈波伝播速度測定装置 |
| JP4092769B2 (ja) * | 1998-04-21 | 2008-05-28 | 松下電器産業株式会社 | 生体モニタ装置 |
| JP4174922B2 (ja) * | 1999-07-19 | 2008-11-05 | オムロンヘルスケア株式会社 | 患者監視装置 |
| US7204250B1 (en) * | 1999-12-16 | 2007-04-17 | Compumedics Limited | Bio-mask |
| KR20010096186A (ko) * | 2000-04-17 | 2001-11-07 | 김종필 | 통합의료진단장치 |
| JP3785529B2 (ja) * | 2000-12-06 | 2006-06-14 | カシオ計算機株式会社 | 血圧測定システム及び血圧値演算装置 |
| KR20030084290A (ko) * | 2002-04-26 | 2003-11-01 | 송철규 | 연속 심장기능 변수 모니터링을 위한 신호처리 방법 |
| JP3988674B2 (ja) * | 2003-04-21 | 2007-10-10 | オムロンヘルスケア株式会社 | 脈波伝播速度情報測定装置 |
| KR100552681B1 (ko) * | 2003-04-25 | 2006-02-20 | 삼성전자주식회사 | 수면 무호흡 진단 장치 및 방법 |
-
2005
- 2005-03-21 DE DE102005013429A patent/DE102005013429A1/de not_active Withdrawn
-
2006
- 2006-03-16 US US11/886,794 patent/US8046059B2/en active Active
- 2006-03-16 DE DE502006005727T patent/DE502006005727D1/de active Active
- 2006-03-16 EA EA200702042A patent/EA013620B1/ru not_active IP Right Cessation
- 2006-03-16 KR KR1020077021568A patent/KR101286402B1/ko active IP Right Grant
- 2006-03-16 AT AT06723463T patent/ATE452580T1/de active
- 2006-03-16 CN CN2006800156615A patent/CN101170944B/zh active Active
- 2006-03-16 WO PCT/EP2006/002410 patent/WO2006099988A1/de active Application Filing
- 2006-03-16 CA CA2602269A patent/CA2602269C/en active Active
- 2006-03-16 EP EP06723463A patent/EP1860999B1/de active Active
- 2006-03-16 JP JP2008502292A patent/JP2008532719A/ja active Pending
-
2013
- 2013-11-01 JP JP2013227943A patent/JP5748160B2/ja active Active
Patent Citations (12)
| Publication number | Priority date | Publication date | Assignee | Title |
|---|---|---|---|---|
| US4960126A (en) | 1988-01-15 | 1990-10-02 | Criticare Systems, Inc. | ECG synchronized pulse oximeter |
| US4934382A (en) | 1989-07-03 | 1990-06-19 | Barone Jr Richard J | Protective sheath with manipulation tabs |
| US5309916A (en) | 1990-07-18 | 1994-05-10 | Avl Medical Instruments Ag | Blood pressure measuring device and method |
| US5191891A (en) * | 1991-09-10 | 1993-03-09 | Ralin, Inc. | Portable ECG monitor/recorder |
| US7215991B2 (en) * | 1993-09-04 | 2007-05-08 | Motorola, Inc. | Wireless medical diagnosis and monitoring equipment |
| US20020087087A1 (en) | 1995-11-06 | 2002-07-04 | Colin Corporation | Apparatus for measuring pulse-wave propagation velocity |
| US6190325B1 (en) * | 1998-10-02 | 2001-02-20 | Colin Corporation | Blood-pressure monitoring apparatus |
| US20040162493A1 (en) | 1999-10-07 | 2004-08-19 | Mills Alexander K. | Device and method for noninvasive continuous determination of physiologic characteristics |
| US20010012916A1 (en) | 1999-12-23 | 2001-08-09 | Klaus Deuter | Blood pressure measuring device |
| EP1317902A1 (de) | 2001-12-10 | 2003-06-11 | Kabushiki Gaisha K-and-S | Vorrichtung zur Beobachtung biologischer Daten |
| US20030109901A1 (en) | 2001-12-11 | 2003-06-12 | Wilson Greatbatch | Photonic pacemaker-cardiac monitor |
| US20040116784A1 (en) | 2002-12-13 | 2004-06-17 | Intercure Ltd. | Apparatus and method for beneficial modification of biorhythmic activity |
Non-Patent Citations (1)
| Title |
|---|
| International Search Report for PCT/EP2006/002410 Jul. 13, 2006. |
Cited By (13)
| Publication number | Priority date | Publication date | Assignee | Title |
|---|---|---|---|---|
| US9924886B2 (en) | 2005-08-09 | 2018-03-27 | Ingo Flore | Medical measuring device |
| US20080275317A1 (en) * | 2005-08-09 | 2008-11-06 | Ok Kyung Cho | Medical Measuring Device |
| US9101264B2 (en) | 2006-06-15 | 2015-08-11 | Peerbridge Health, Inc. | Wireless electrode arrangement and method for patient monitoring via electrocardiography |
| US9681825B2 (en) | 2006-06-15 | 2017-06-20 | Peerbridge Health, Inc. | Wireless electrode arrangement and method for patient monitoring via electrocardiography |
| US20100056880A1 (en) * | 2006-11-23 | 2010-03-04 | Ok Kyung Cho | Medical measuring device |
| US9603521B2 (en) * | 2006-11-23 | 2017-03-28 | Ingo Flore | Medical measuring device |
| US20100234701A1 (en) * | 2007-09-07 | 2010-09-16 | Ok Kyung Cho | Medical measurement device for bioelectrical impedance measurement |
| US9060700B2 (en) | 2007-09-07 | 2015-06-23 | Ingo Flore | Medical measurement device for bioelectrical impedance measurement |
| US10226190B2 (en) | 2009-03-05 | 2019-03-12 | Ingo Flore | Diagnostic measuring device |
| US20120310103A1 (en) * | 2011-06-02 | 2012-12-06 | Nokia Siemens Networks Oy | Heart monitor with user input |
| US9833146B2 (en) | 2012-04-17 | 2017-12-05 | Covidien Lp | Surgical system and method of use of the same |
| US9675264B2 (en) | 2013-03-15 | 2017-06-13 | Peerbridge Health, Inc. | System and method for monitoring and diagnosing patient condition based on wireless sensor monitoring data |
| US11559234B2 (en) | 2018-09-06 | 2023-01-24 | The Aga Khan University | Portable electrocardiography device |
Also Published As
| Publication number | Publication date |
|---|---|
| ATE452580T1 (de) | 2010-01-15 |
| EP1860999B1 (de) | 2009-12-23 |
| JP2008532719A (ja) | 2008-08-21 |
| KR20070113238A (ko) | 2007-11-28 |
| KR101286402B1 (ko) | 2013-07-15 |
| WO2006099988A1 (de) | 2006-09-28 |
| CN101170944A (zh) | 2008-04-30 |
| CN101170944B (zh) | 2010-09-29 |
| EA013620B1 (ru) | 2010-06-30 |
| EP1860999A1 (de) | 2007-12-05 |
| JP2014039875A (ja) | 2014-03-06 |
| DE502006005727D1 (de) | 2010-02-04 |
| CA2602269C (en) | 2013-07-02 |
| DE102005013429A1 (de) | 2006-09-28 |
| JP5748160B2 (ja) | 2015-07-15 |
| CA2602269A1 (en) | 2006-09-28 |
| US20080200823A1 (en) | 2008-08-21 |
| EA200702042A1 (ru) | 2008-02-28 |
Similar Documents
| Publication | Publication Date | Title |
|---|---|---|
| US8046059B2 (en) | Mobile diagnosis device | |
| US5862805A (en) | Apparatus and method for measuring the variability of cardiovascular parameters | |
| US8428673B2 (en) | Medical measuring device | |
| US8126526B2 (en) | Pulse wave analyzing device | |
| US8801621B2 (en) | Method, system and program product for analyzing pulse wave data | |
| JP2019524187A (ja) | 被検者の呼吸情報を決定するための方法及び装置 | |
| KR20100048324A (ko) | 통합적인 생체신호 처리장치 및 방법 | |
| JP2009089883A (ja) | 心房細動検出装置、システムおよび方法 | |
| CN111386071B (zh) | 生物体信息计测装置、记录介质 | |
| Ghamari et al. | Design and prototyping of a wristband-type wireless photoplethysmographic device for heart rate variability signal analysis | |
| US20110184298A1 (en) | Portable cardio waveform acquisiton and heart rate variability (hrv) analysis | |
| Yoon et al. | Development of a compact home health monitor for telemedicine | |
| US20200297225A1 (en) | Vital sign measurement device | |
| JP2000217796A (ja) | 循環機能診断装置 | |
| Hayirlioglu et al. | A Novel Multi-Modal Sensing System Prototype for Cardiovascular and Cardiopulmonary Monitoring. | |
| Zainal et al. | Real Time PPG Data Acquisition with GUI based Application for HRV Measurement | |
| KR101033473B1 (ko) | 생체정보 측정장치 | |
| Gagnon-Turcotte et al. | Photoplethysmography-based derivation of physiological information using the BioPoint | |
| Uguz | Design of a multipurpose photoplethysmography sensor to assist cardiovascular and respiratory diagnosis | |
| Huotari et al. | Arterial pulse wave analysis based on PPG and EMFi measurements | |
| Giri et al. | Phonocardiography and Photoplethysmography Circuit for Integrated Physiological Signal Acquisition | |
| Mazjanis | Development, Design, and Utilization of a Reflective Based Photoplethysmography Sensor | |
| Devaki et al. | On the Development of a Wearable Multi-Spectral Photoplethysmographic Device for Heart Rate Detection | |
| JP2022167320A (ja) | 脈波解析装置、脈波解析方法、および脈波解析プログラム | |
| Pietrewicz et al. | A wearable system developed to monitor people suffering from vasovagal syncope |
Legal Events
| Date | Code | Title | Description |
|---|---|---|---|
| AS | Assignment |
Owner name: FLORE, INGO, GERMANY Free format text: ASSIGNMENT OF ASSIGNORS INTEREST;ASSIGNORS:CHO, OK KYUNG;KIM, YOON OK;REEL/FRAME:020191/0632 Effective date: 20070927 |
|
| STCF | Information on status: patent grant |
Free format text: PATENTED CASE |
|
| FEPP | Fee payment procedure |
Free format text: PAYOR NUMBER ASSIGNED (ORIGINAL EVENT CODE: ASPN); ENTITY STATUS OF PATENT OWNER: LARGE ENTITY |
|
| FPAY | Fee payment |
Year of fee payment: 4 |
|
| MAFP | Maintenance fee payment |
Free format text: PAYMENT OF MAINTENANCE FEE, 8TH YEAR, LARGE ENTITY (ORIGINAL EVENT CODE: M1552); ENTITY STATUS OF PATENT OWNER: LARGE ENTITY Year of fee payment: 8 |
|
| MAFP | Maintenance fee payment |
Free format text: PAYMENT OF MAINTENANCE FEE, 12TH YEAR, LARGE ENTITY (ORIGINAL EVENT CODE: M1553); ENTITY STATUS OF PATENT OWNER: LARGE ENTITY Year of fee payment: 12 |