US20110262928A1 - Disease markers and uses thereof - Google Patents
Disease markers and uses thereof Download PDFInfo
- Publication number
- US20110262928A1 US20110262928A1 US12/866,586 US86658609A US2011262928A1 US 20110262928 A1 US20110262928 A1 US 20110262928A1 US 86658609 A US86658609 A US 86658609A US 2011262928 A1 US2011262928 A1 US 2011262928A1
- Authority
- US
- United States
- Prior art keywords
- ifnα
- inducible
- rsad2
- isg15
- ifit1
- Prior art date
- Legal status (The legal status is an assumption and is not a legal conclusion. Google has not performed a legal analysis and makes no representation as to the accuracy of the status listed.)
- Abandoned
Links
Images


Classifications
-
- C—CHEMISTRY; METALLURGY
- C12—BIOCHEMISTRY; BEER; SPIRITS; WINE; VINEGAR; MICROBIOLOGY; ENZYMOLOGY; MUTATION OR GENETIC ENGINEERING
- C12Q—MEASURING OR TESTING PROCESSES INVOLVING ENZYMES, NUCLEIC ACIDS OR MICROORGANISMS; COMPOSITIONS OR TEST PAPERS THEREFOR; PROCESSES OF PREPARING SUCH COMPOSITIONS; CONDITION-RESPONSIVE CONTROL IN MICROBIOLOGICAL OR ENZYMOLOGICAL PROCESSES
- C12Q1/00—Measuring or testing processes involving enzymes, nucleic acids or microorganisms; Compositions therefor; Processes of preparing such compositions
- C12Q1/68—Measuring or testing processes involving enzymes, nucleic acids or microorganisms; Compositions therefor; Processes of preparing such compositions involving nucleic acids
- C12Q1/6876—Nucleic acid products used in the analysis of nucleic acids, e.g. primers or probes
- C12Q1/6883—Nucleic acid products used in the analysis of nucleic acids, e.g. primers or probes for diseases caused by alterations of genetic material
-
- A—HUMAN NECESSITIES
- A61—MEDICAL OR VETERINARY SCIENCE; HYGIENE
- A61P—SPECIFIC THERAPEUTIC ACTIVITY OF CHEMICAL COMPOUNDS OR MEDICINAL PREPARATIONS
- A61P17/00—Drugs for dermatological disorders
-
- A—HUMAN NECESSITIES
- A61—MEDICAL OR VETERINARY SCIENCE; HYGIENE
- A61P—SPECIFIC THERAPEUTIC ACTIVITY OF CHEMICAL COMPOUNDS OR MEDICINAL PREPARATIONS
- A61P17/00—Drugs for dermatological disorders
- A61P17/06—Antipsoriatics
-
- A—HUMAN NECESSITIES
- A61—MEDICAL OR VETERINARY SCIENCE; HYGIENE
- A61P—SPECIFIC THERAPEUTIC ACTIVITY OF CHEMICAL COMPOUNDS OR MEDICINAL PREPARATIONS
- A61P21/00—Drugs for disorders of the muscular or neuromuscular system
-
- A—HUMAN NECESSITIES
- A61—MEDICAL OR VETERINARY SCIENCE; HYGIENE
- A61P—SPECIFIC THERAPEUTIC ACTIVITY OF CHEMICAL COMPOUNDS OR MEDICINAL PREPARATIONS
- A61P29/00—Non-central analgesic, antipyretic or antiinflammatory agents, e.g. antirheumatic agents; Non-steroidal antiinflammatory drugs [NSAID]
-
- A—HUMAN NECESSITIES
- A61—MEDICAL OR VETERINARY SCIENCE; HYGIENE
- A61P—SPECIFIC THERAPEUTIC ACTIVITY OF CHEMICAL COMPOUNDS OR MEDICINAL PREPARATIONS
- A61P35/00—Antineoplastic agents
-
- A—HUMAN NECESSITIES
- A61—MEDICAL OR VETERINARY SCIENCE; HYGIENE
- A61P—SPECIFIC THERAPEUTIC ACTIVITY OF CHEMICAL COMPOUNDS OR MEDICINAL PREPARATIONS
- A61P37/00—Drugs for immunological or allergic disorders
- A61P37/02—Immunomodulators
- A61P37/06—Immunosuppressants, e.g. drugs for graft rejection
-
- A—HUMAN NECESSITIES
- A61—MEDICAL OR VETERINARY SCIENCE; HYGIENE
- A61P—SPECIFIC THERAPEUTIC ACTIVITY OF CHEMICAL COMPOUNDS OR MEDICINAL PREPARATIONS
- A61P9/00—Drugs for disorders of the cardiovascular system
-
- C—CHEMISTRY; METALLURGY
- C12—BIOCHEMISTRY; BEER; SPIRITS; WINE; VINEGAR; MICROBIOLOGY; ENZYMOLOGY; MUTATION OR GENETIC ENGINEERING
- C12Q—MEASURING OR TESTING PROCESSES INVOLVING ENZYMES, NUCLEIC ACIDS OR MICROORGANISMS; COMPOSITIONS OR TEST PAPERS THEREFOR; PROCESSES OF PREPARING SUCH COMPOSITIONS; CONDITION-RESPONSIVE CONTROL IN MICROBIOLOGICAL OR ENZYMOLOGICAL PROCESSES
- C12Q2600/00—Oligonucleotides characterized by their use
- C12Q2600/106—Pharmacogenomics, i.e. genetic variability in individual responses to drugs and drug metabolism
-
- C—CHEMISTRY; METALLURGY
- C12—BIOCHEMISTRY; BEER; SPIRITS; WINE; VINEGAR; MICROBIOLOGY; ENZYMOLOGY; MUTATION OR GENETIC ENGINEERING
- C12Q—MEASURING OR TESTING PROCESSES INVOLVING ENZYMES, NUCLEIC ACIDS OR MICROORGANISMS; COMPOSITIONS OR TEST PAPERS THEREFOR; PROCESSES OF PREPARING SUCH COMPOSITIONS; CONDITION-RESPONSIVE CONTROL IN MICROBIOLOGICAL OR ENZYMOLOGICAL PROCESSES
- C12Q2600/00—Oligonucleotides characterized by their use
- C12Q2600/158—Expression markers
Definitions
- the present invention relates to miRNA markers and interferon (IFN) alpha/type I IFN-inducible pharmacodynamic (PD) markers and methods employing the same.
- IFN interferon
- PD pharmacodynamic
- the present invention encompasses miRNA markers and IFN ⁇ /type I IFN-inducible PD markers.
- the present invention further encompasses methods that employ these markers in methods of, e.g., treating patients and prognosing or monitoring disease.
- One embodiment of the invention encompasses a method of treating a patient having a type I IFN or IFN ⁇ -mediated disease or disorder.
- An agent that binds to and modulates type I IFN or IFN ⁇ activity is administered to the patient.
- the patient comprises a differentially regulated miRNA marker profile.
- the agent neutralizes the differentially regulated miRNA marker profile.
- Another embodiment of the invention is a method of neutralizing a differentially regulated miRNA marker profile in a patient in need thereof.
- An agent that binds to and modulates type I IFN or IFN ⁇ activity is administered to the patient.
- the agent neutralizes the differentially regulated miRNA marker profile of the patient.
- a further embodiment of the invention is a method of monitoring or prognosing an autoimmune or inflammatory disease progression of a patient.
- a first differentially regulated miRNA marker profile is obtained in a first sample from a patient.
- a first miRNA profile is obtained in a first sample from the patient.
- a therapeutic agent is administered.
- a second miRNA profile is obtained in a second sample from the patient.
- the first and the second miRNA profiles are compared.
- a variance in the first and the second miRNA profiles indicates a level of efficacy of the therapeutic agent.
- In another embodiment of the invention is a method of treating a myositis patient.
- An agent that binds to and modulates type I IFN or IFN ⁇ activity is administered to the patient.
- the agent neutralizes the type I IFN or IFN ⁇ -inducible PD marker expression profile of the patient.
- a further embodiment of the invention encompasses a method of monitoring or prognosing myositis disease progression of a patient.
- a first IFN ⁇ -inducible PD marker expression profile is obtained in a first sample from the patient.
- a further embodiment of the invention is a method of monitoring myositis disease progression of a patient receiving treatment with a therapeutic agent.
- a first IFN ⁇ -inducible PD marker expression profile is obtained in a first sample from the patient.
- a therapeutic agent is administered to the patient.
- a second IFN ⁇ -inducible PD marker expression profile is obtained from a second sample from the patient. The first and the second IFN ⁇ -inducible PD marker expression profiles are compared.
- FIGS. 1 a and 1 b The majority of the most upregulated genes in muscle specimens of DM and PM patients are IFN- ⁇ / ⁇ -inducible.
- FIGS. 2 a and 2 b IFN- ⁇ / ⁇ -inducible gene signature scores in DM and PM patients decreases as patients disease condition improves.
- DMA DM active patients
- PMA PM active patients
- PMI PM improving patients
- PMI PM improving patients
- FIG. 3 a - 3 c IFN- ⁇ / ⁇ -inducible gene signature scores in DM patient whole blood samples correlate with clinical improvement, but not gene signature scores of other cytokines (TNF ⁇ , IL1 ⁇ , IL4, IL10, and IL13) as shown for three, (a)-(c), patients.
- cytokines TNF ⁇ , IL1 ⁇ , IL4, IL10, and IL13
- FIG. 4 IFN- ⁇ / ⁇ -inducible gene signature scores of a DM patient predicted clinical improvement as well as relapse.
- FIG. 5 a - 5 d Change in IFN- ⁇ / ⁇ -inducible gene signature score in a PM patient correlates with serum CK level.
- (a) shows the IFN- ⁇ / ⁇ -, TNF ⁇ -, IL1 ⁇ -, IL4-, IL10-, IL13-inducible gene signature scores of the PM patient,
- (b) provides the serum CK activity of the patient, which follows the curve of the IFN- ⁇ / ⁇ -inducible gene signature;
- (c) provides the correlation between the various cytokine gene signature scores and serum CK level;
- (d) is a PCA plot of the PM patient's IFN- ⁇ / ⁇ -inducible gene signature score relative to that of healthy donors (black circles).
- FIG. 6 Change in IFN- ⁇ / ⁇ -inducible gene signature score in a DM patient correlates with serum CK level.
- (a) shows the patient's serum CK activity over four visits with a physician;
- (b) shows the IFN- ⁇ / ⁇ -, TNF ⁇ -, IL1 ⁇ -, IL4-, IL10-, IL13-inducible gene signature scores of the patient over the same four visits;
- (c) provides the correlation between the various cytokine gene signature scores and serum CK level.
- the type I IFN gene signature shown in (b)), as monitored by the neutralization of top 25 inducible genes in the whole blood of the patient, tracked the clinical activity. Visit 1, pre-treatment; Visit 2, followed treatment with Rituximab and steroids (marginal improvement); Visit 3, patient remained stable; Visit 4, patient crashed (sharp increase in serum CK level).
- FIGS. 7 a and 7 b The IFN- ⁇ / ⁇ -inducible gene signature of the DM patient discussed in FIG. 6 tracks disease progression/regression.
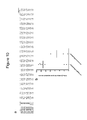
- FIG. 8 Scatter plot showing that muscle specimens of IBM patients exhibit IFN- ⁇ / ⁇ -inducible gene signature overexpression. Scatter plot is of IFN- ⁇ / ⁇ -gene signature scores for muscle specimens from 14 patients with IBM using two methods: a dynamic list of 25 genes and a static list of 21 genes. Each point represents a patient.
- FIGS. 9 a and 9 b IBM patient serum samples show distinct IFN- ⁇ / ⁇ -gene signature overexpression.
- FIGS. 10 a and 10 b Jo1 negative DM patients have higher IFN- ⁇ / ⁇ -gene signature scores than Jo1 positive DM patients.
- FIGS. 11-104 Probe list with annotation of genes in IL4 signature.
- FIGS. 105-158 Probe list with annotation of genes in IL10 signature.
- FIGS. 159-234 Probe list with annotation of genes in IL13 signature.
- FIGS. 235-381 Probe list with annotation of 807 IFN ⁇ -inducible genes.
- FIGS. 382-383 List with unique detector ids, miRNA ids, and sequences.
- FIGS. 384 a and 384 b The prevalence of type 1 IFN-inducible genes among those most overexpressed in DM and PM patients can be used to identify type 1 IFN-inducible gene signature score-positive patients.
- the first, black, horizontal bar represents the normal healthy donors; the second horizontal bar, labeled low, represents patients with a weak type 1 IFN-inducible gene signature score (fold change ⁇ 4); the third horizontal bar, labeled moderate, represents patients with a moderate type 1 IFN-inducible gene signature score (4 ⁇ fold change ⁇ 10), and the fourth horizontal bar, labeled high, represents patients with a high type 1 IFN-inducible gene signature score (i.e., signature score-positive).
- FIG. 385 a - 385 c Patient-specific longitudinal type 1 IFN-inducible transcript measurements have utility as biomarkers to measure DM and PM disease activity.
- FIGS. 386 a and 386 b DM and PM patients demonstrate a correlation between MITAX score and type 1 IFN 13-gene composite score from peripheral blood.
- the solid black line and rightmost y-axis represent MITAX scores, while the dashed black line and leftmost y-axis represent 13-gene composite scores.
- the ‘H’ designation in the plots for BGE15 and BGE147 represent the herald visits.
- the dashed black line and rightmost y-axis in the leftmost plot represents the CK levels for this patient.
- DM dermatomyositis
- PM polymyositis
- CK creatine kinas
- FIGS. 387 a and 387 b Strong elevation of type 1 IFN-inducible gene expression in WB heralding disease relapse in several patients with DM or PM. Three visits occurred in which disease was believed to be clinically stable or improving, yet the patient developed a clinical relapse 6-35 days later. The significant IFN-inducible gene expression increases in each of these 3 visits “heralded” that relapses would soon occur. (a) Tabular listing of expression changes for the 13-gene composite score.
- FIG. 388 a - 388 c Other cytokine-inducible signature scores do not differ between moderate and severe patients with DM or PM and are not correlated with disease activity.
- cytokine-inducible gene signatures are calculated relative to the median of the 36 normal healthy donors.
- FIG. 389 Comparison of different cytokine-inducible gene signatures for 24 DM or PM patients at the visits with the highest (upper panel) and lowest (lower panel) MITAX scores. Each row indicates the overexpression of a different cytokine-inducible gene signature.
- the 3 patients outlined in the box are type 1 IFN-inducible gene signature score-negative. Elevated cytokine-induced gene signature levels for each patient are represented by colors approaching red, while colors approaching blue represent low cytokine-induced gene signature values.
- the invention encompasses methods of identifying, diagnosing, treating, and monitoring disease progression in patients.
- Patients include any animal having a type I IFN or an IFN ⁇ -inducible disease, disorder, or condition; or any animal having an inflammatory or autoimmune disease, disorder, or condition.
- the patient may have the disease, disorder, or condition as a result of experimental research, e.g., it may be an experimental model developed for the disease, disorder, or condition. Alternatively, the patient may have the disease, disorder, or condition in the absence of experimental manipulation.
- Patients include humans, mice, rats, horses, pigs, cats, dogs, and any animal used for research.
- a type I IFN or an IFN ⁇ -inducible disease, disorder, or condition is any that exhibits a type I IFN or an IFN ⁇ PD marker expression profile or gene signature.
- a PD marker expression profile and a gene signature will be understood to be equivalent.
- These diseases, disorders, or conditions include those with an autoimmune component such as systemic lupus erythematosus, insulin dependent diabetes mellitus, inflammatory bowel disease (including Crohn's disease, ulcerative colitis, and Celiac's disease), multiple sclerosis, psoriasis, autoimmune thyroiditis, rheumatoid arthritis, glomerulonephritis, idiopathic inflammatory myositis such as inclusion body myositis or dermatomyositis or polymyositis or nonspecific myositis, or necrotizing myopathy, Sjogren's syndrome, vasculitis, and sarcoidosis.
- Other diseases, disorders, or conditions include graf
- the patient may have inclusion body myositis or dermatomyositis or polymyositis.
- the myositis patient may have a high or a low Myositis Intention to Treat scale (MITAX) score.
- MIVAX Myositis Intention to Treat scale
- One of skill in the art would readily be able to determine the MITAX score of a myositis patient. See, for example, Walsh R J, Pinkus J L, et al. Type I interferon-inducible gene expression in blood is present and reflects disease activity in dermatomyositis and polymyositis. Arthritis Rheum. 2007; 56(11):3784-92, incorporated by reference.
- a high MITAX score may be about greater than 6.
- a low MITAX score may be about less than or equal to 6.
- the myositis patient may alternatively or further have a moderate or strong type I IFN- or IFN ⁇ -inducible gene signature score.
- a type 1 IFN- or IFN ⁇ -inducible gene signature score may be weak if assigned a score of about less than 4, moderate if assigned a score around or about greater than 4 but less than 10, and high if assigned a score of about 10 or greater than 10.
- Those of skill in the art would readily understand and be able to determine type I IFN or IFN ⁇ -inducible gene signature score. See, for example, Yao, Y, Jallal J, et al.
- An autoimmune disease, disorder, or condition may be any disease, disorder, or condition in which the immune system triggers an immune response when there are no foreign substances to fight and the body's normally protective immune system causes damage to its own tissues by mistakenly attacking self.
- diseases, disorders, or conditions include multiple sclerosis, Crohn's disease, rheumatoid arthritis, alopecia greata, ankylosing spondylitis, antiphospholipid syndrome, autoimmune Addison's disease, autoimmune diseases of the adrenal gland, allergic encephalomyelitis, autoimmune hemolytic anemia, autoimmune hepatitis, autoimmune inflammatory eye disease, autoimmune neonatal thrombocytopenia, autoimmune neutropenia, autoimmune oophoritis and orchitis, autoimmune thrombocytopenia, autoimmune thyroiditis, Behcet's disease, bullous pemphigoid, cardiomyopathy, cardiotomy syndrome, celiac sprue-dermatitis, chronic active hepatitis, chronic fatigue
- An inflammatory disorder, disease, or condition may include asthma, allergic disorders, inflammatory disorders characterized by type-2 mediated inflammation, pulmonary fibrosis, chronic obstructive pulmonary disease (COPD), encephilitis, inflammatory bowel disease, septic shock, undifferentiated spondyloarthropathy, undifferentiated arthropathy, arthritis, inflammatory osteolysis, and chronic inflammation resulting from chronic viral or bacteria infections.
- COPD chronic obstructive pulmonary disease
- the patient may comprise a differentially regulated miRNA profile.
- a differentially regulated miRNA profile may be one in which a tissue sample of the patient exhibits increased expression of one or more miRNAs relative to a control tissue sample of the patient or relative to a healthy control individual.
- a differentially regulated miRNA profile may be one in which a tissue sample of the patient exhibits decreased expression of one or more miRNAs relative to a control sample of the patient or relative to a healthy control individual.
- a differentially regulated miRNA profile may be one in which a tissue sample of the patient exhibits both increased expression of one or more miRNAs relative to a control sample and decreased expression of one or more miRNAs relative to a control sample.
- the number of miRNAs exhibiting increased expression may be 1, at least 1, 2, at least 2, 3, at least 3, 4, at least 4, 4, at least 5, at least 6, at least 7, at least 8, at least 9, at least 10, at least 15, at least 20, at least 25, at least 30, or at least 50.
- the number of miRNAs exhibiting decreased expression may be 1, at least 1, 2, at least 2, 3, at least 3, 4, at least 4, 4, at least 5, at least 6, at least 7, at least 8, at least 9, at least 10, at least 15, at least 20, at least 25, at least 30, or at least 50.
- the differential increase or decrease in expression may be approximately 10%-500% of the control sample, approximately 10%-400% of the control sample, approximately 10%-300% of the control sample, approximately 10%-250% of the control sample, approximately 10%-200% of the control sample, approximately 10%-150% of the control sample, approximately 10%-100% of the control sample, approximately 10%-50% of the control sample, approximately 100%-500% of the control sample, approximately 200%-500% of the control sample, approximately 300%-500% of the control sample, approximately 400%-500% of the control sample, approximately 50%-100% of the control sample, approximately 100%-200% of the control sample, approximately 100%-400% of the control sample, approximately 200%-400% of the control sample, approximately 10%-50% of the control sample, approximately 20%-100% of the control sample, approximately 25%-75% of the control sample, or approximately 50%-100% of the control sample. It may be 10, 20, 25, 30, 40, 50, 75, 100, 125, 150, 175, 200, 250, 300, 400, or 500 percent of the control sample.
- the any 1, at least 1, 2, at least 2, 3, at least 3, 4, at least 4, 4, at least 5, at least 6, at least 7, at least 8, at least 9, at least 10, at least 15, at least 20, at least 25, at least 30, or at least 50 miRNAs differentially expressed may include any of the miRNAs discussed in Tables 2-5 or FIGS. 382-383 .
- the miRNA may be detected by the detector hsa-miR-34b-4373037 or hsa-miR-1-4373161.
- Administration of an agent which binds to and modulates type I IFN or IFN ⁇ activity may be administration of a small molecule or a biological agent. If the therapeutic agent is a small molecule it may be synthesized or identified and isolated from a natural source.
- the therapeutic agent may be an antibody specific for any subtype(s) of type I IFN or IFN ⁇ .
- the antibody may be specific for any one of IFN ⁇ 1, IFN ⁇ 2, IFN ⁇ 4, IFN ⁇ 5, IFN ⁇ 6, IFN ⁇ 7, IFN ⁇ 8, IFN ⁇ 10, IFN ⁇ 14, IFN ⁇ 17, IFN ⁇ 21, IFN ⁇ , or IFN ⁇ .
- the antibody may be specific for any two, any three, any four, any five, any six, any seven, any eight, any nine, any ten, any eleven, any twelve type I IFN of IFN ⁇ subtypes.
- the antibody may be specific for IFN ⁇ 1, IFN ⁇ 2, IFN ⁇ 4, IFN ⁇ 5, IFN ⁇ 8, IFN ⁇ 10, and IFN ⁇ 21; or it may be specific for IFN ⁇ 1, IFN ⁇ 2, IFN ⁇ 4, IFN ⁇ 5, IFN ⁇ 8, and IFN ⁇ 10; or it may be specific for IFN ⁇ 1, IFN ⁇ 2, IFN ⁇ 4, IFN ⁇ 5, IFN ⁇ 8, and IFN ⁇ 21; or it may be specific for IFN ⁇ 1, IFN ⁇ 2, IFN ⁇ 4, IFN ⁇ 5, IFN ⁇ 10, and IFN ⁇ 21.
- Antibodies specific for type I IFN or IFN ⁇ include MEDI-545, any biologic or antibody other than MEDI-545, antibodies described in U.S.
- the antibody may be a synthetic antibody, a monoclonal antibody, polyclonal antibodies, a recombinantly produced antibody, an intrabody, a multispecific antibody (including bi-specific antibodies), a human antibody, a humanized antibody, a chimeric antibody, a single-chain Fv (scFv) (including bi-specific scFv), a BiTE molecule, a single chain antibody, a Fab fragments, a F(ab′) fragment, a disulfide-linked Fv (sdFv), or an epitope-binding fragment of any of the above.
- the antibody may be any of an immunoglobulin molecule or immunologically active portion of an immunoglobulin molecule.
- the antibody may be of any isotype.
- it may be any of isotypes IgG1, IgG2, IgG3 or IgG4.
- the antibody may be a full-length antibody comprising variable and constant regions, or an antigen-binding fragment thereof, such as a single chain antibody, or a Fab or Fab′2 fragment.
- the antibody may also be conjugated or linked to a therapeutic agent, such as a cytotoxin or a radioactive isotope.
- a second agent other than the agent that binds to modulates IFN ⁇ activity may be administered to the patient.
- Second agents include, but are not limited to non-steroidal anti-inflammatory drugs such as ibuprofen, naproxen, sulindac, diclofenac, piroxicam, ketoprofen, diflunisal, nabumetone, etodolac, and oxaprozin, indomethacin; anti-malarial drugs such as hydroxychloroquine; corticosteroid hormones, such as prednisone, hydrocortisone, methylprednisolone, and dexamethasone; methotrexate; immunosuppressive agents, such as azathioprine and cyclophosphamide; and biologic agents that, e.g., target T cells such as Alefacept and Efalizumab, or target TNF ⁇ , such as, Enbrel, Remicade, and Humira.
- target T cells such
- Treatment with the agent may result in neutralization of the differentially regulated miRNA profile. Treatment with the agent may result in a decrease in one or more symptoms of the type I IFN or an IFN ⁇ -mediated disease or disorder. Treatment with the agent may result in fewer flare-ups related to the type I IFN or an IFN ⁇ -mediated disease or disorder. Treatment with the agent may result in improved prognosis for the patient having the type I IFN or an IFN ⁇ -mediated disease or disorder. Treatment with the agent may result in a higher quality of life for the patient. Treatment with the agent may alleviate the need to co-administer second agents or may lessen the dosage of administration of the second agent to the patient. Treatment with the agent may reduce the number of hospitalizations of the patient that are related to the type I IFN or an IFN ⁇ -mediated disease or disorder.
- the agent that binds to and modulates type I IFN or IFN ⁇ activity may neutralize a differentially regulated miRNA profile.
- Neutralization of the differentially regulated miRNA profile may be a reduction in at least one, at least two, at least three, at least five, at least seven, at least eight, at least ten, at least twelve, at least fifteen, at least twenty, at least twenty five, at least thirty, at least thirty five, at least forty, at least forty five, or at least fifty up-regulated miRNAs.
- the upregulated miRNAs may include any of those detected by or included in Tables 2 or 4 or as shown in figure sheets 382-383.
- Neutralization of the differentially regulated miRNA profile may be a reduction of at least 2%, at least 3%, at least 4%, at least 5%, at least 7%, at least 8%, at least 10%, at least 15%, at least 25%, at least 30%, at least 35%, at least 40%, at least 45%, at least 50%, at least 60%, at least 70%, at least 75%, at least 80%, or at least 90% of any of the at least one, at least two, at least three, at least five, at least seven, at least eight, at least ten, at least twelve, at least fifteen, at least twenty, at least twenty five, at least thirty, at least thirty five, at least forty, at least forty five, or at least fifty genes up-regulated in any differentially regulated miRNA profile.
- neutralization of the differentially regulated miRNA profile refers to a reduction of expression of up-regulated miRNAs that is within at most 50%, at most 45%, at most 40%, at most 35%, at most 30%, at most 25%, at most 20%, at most 15%, at most 10%, at most 5%, at most 4%, at most 3%, at most 2%, or at most 1% of expression levels of those miRNAs in a control sample.
- the agent that binds to and modulates type I IFN or IFN ⁇ activity is a biologic agent, such as an antibody
- the agent may neutralize the type I IFN or IFN ⁇ profile at doses of 0.3 to 30 mg/kg, 0.3 to 10 mg/kg, 0.3 to 3 mg/kg, 0.3 to 1 mg/kg, 1 to 30 mg/kg, 3 to 30 mg/kg, 5 to 30 mg/kg, 10 to 30 mg/kg, 1 to 10 mg/kg, 3 to 10 mg/kg, or 1 to 5 mg/kg.
- Neutralization of the differentially regulated miRNA profile may be an increase in down-regulated expression of at least one, at least two, at least three, at least five, at least seven, at least eight, at least ten, at least twelve, at least fifteen, at least twenty, at least twenty five, at least thirty, at least thirty five, at least forty, at least forty five, or at least fifty miRNAs.
- the downregulated miRNAs may include any of these detected by or included in Tables 3 or 5 or as shown in figure sheets 382-383.
- Neutralization of down-regulated genes in a differentially regulated miRNA profile is an increase of at least 2%, at least 3%, at least 4%, at least 5%, at least 7%, at least 8%, at least 10%, at least 15%, at least 25%, at least 30%, at least 35%, at least 40%, at least 45%, at least 50%, at least 60%, at least 70%, at least 75%, at least 80%, or at least 90%, or at least 100%, or at least 125%, or at least 130%, or at least 140%, or at least 150%, or at least 175%, or at least 200%, or at least 250%, or at least 300%, or at least 500% of any of the at least one, at least two, at least three, at least five, at least seven, at least eight, at least ten, at least twelve, at least fifteen, at least twenty, or at least twenty five miRNAs whose expression is downregulated in any miRNA profile.
- neutralization of the differentially regulated miRNA profile refers to an increase in expression of miRNAs to within at most 50%, at most 45%, at most 40%, at most 35%, at most 30%, at most 25%, at most 20%, at most 15%, at most 10%, at most 5%, at most 4%, at most 3%, at most 2%, or at most 1% of expression levels of those miRNAs in a control sample.
- the agent that binds to and modulates type I IFN or IFN ⁇ activity is a biologic agent, such as an antibody
- the agent may neutralize the differentially regulated miRNA profile at doses of 0.3 to 30 mg/kg, 0.3 to 10 mg/kg, 0.3 to 3 mg/kg, 0.3 to 1 mg/kg, 1 to 30 mg/kg, 3 to 30 mg/kg, 5 to 30 mg/kg, 10 to 30 mg/kg, 1 to 10 mg/kg, 3 to 10 mg/kg, or 1 to 5 mg/kg.
- the patient may further comprise a type I IFN or IFN ⁇ -inducible PD marker expression profile.
- the type I IFN or IFN ⁇ -inducible PD marker expression profile may be a strong profile, a moderate profile, or a weak profile.
- the type I IFN or IFN ⁇ -inducible PD marker expression profile can readily be designated as strong, moderate, or weak by determining the fold dysregulation of the type I IFN or IFN ⁇ -inducible PD marker expression profile of the patient, (e.g., the fold increase in expression of upregulated type I IFN or IFN ⁇ -inducible PD markers in the patient), relative to a control sample(s) or control patient(s) and comparing the patient's fold dysregulation to that of other patients having a type I IFN or IFN ⁇ -inducible PD marker expression profile.
- the type I IFN or IFN ⁇ -inducible PD marker expression profile may be any disclosed in PCT/US2007/024947 filed Dec. 6, 2007, herein incorporated by reference.
- the group of genes that may be included in the type I IFN or IFN ⁇ -inducible PD marker expression profile of the patient may be MX1, LY6E, IFI27, OAS1, IFIT1, IFI6, IFI44L, ISG15, LAMP3, OASL, RASD2, and IFI44.
- the genes or genes detected by the probes may include IFI44, IFI27, IFI44L, DNAPTP6, LAMP3, LY6E, RSAD2, HERC5, IFI6, ISG15, OAS3, SIGLEC1, OAS2, USP18, RTP4, IFIT1, MX1, OAS1, EPSTI1, PLSCR1, and IFRG28.
- the IFN ⁇ -inducible PD markers in such an expression profile may further include at least one or more gene listed in drawing sheets 235-381.
- the genes may include any at least 2, any at least 3, any at least 4, any at least 5, any at least 6, any at least 7, any at least 8, any at least 9, any at least 10, or any at least 11, or any at least 12, or any at least 13, or any at least 14, or any at least 15, or any at least 16, or any at least 17, or any at least 18, or any at least 19, or at least 20, or any at least 21, or any at least 22, or any at least 23, or any at least 24, or any least 25, or any at least 26, or any at least 27, or any at least 28, or any at least 29, or any at least 30 of LAMP3, DNAPTP6, FLJ31033, HERC6, SERPING1, EPST11, RTP4, OASL, FBXO6, IFIT2, IFI44, OAS3, BATF2, ISG15, IRF7, RSAD2, IFI35, OAS1, LAP3, IFIT1, IFIT5, PLSCR1, IFI44L, MS4A4A, GALM, UBE2L6, TOR1B, SAMD9L, HERC5,
- the IFN ⁇ -inducible PD markers in an expression profile may include at least genes IFI27, SIGLEC1, RSAD2, IFI6, IFI44L, IFI44, USP18, IFIT2, SAMD9L, BIRC4BP, DNAPTP6, OAS3, LY6E, IFIT1, LIPA, LOC129607, ISG15, PARP14, MX1, OAS2, OASL, CCL2, HERC5, OAS1.
- the IFN ⁇ -inducible PD markers in such an expression profile may further include at least one or more gene listed in drawing sheets 235-381.
- the IFN ⁇ -inducible PD markers in an expression profile may include at least genes IFIT1, IFIT3, IRF7, IFI6, IL6ST, IRF2, LY6E, MARCKS, MX1, MX2, OAS1, EIF2AK2, ISG15, STAT2, OAS3, IFI44, IFI44L, HERC5, RAB8B, LILRA5, RSAD2, and FCHO2.
- the IFN ⁇ -inducible PD markers in such an expression profile may further include at least one or more gene listed in drawing sheets 235-381.
- the IFN ⁇ -inducible PD markers in an expression profile may include at least genes SERPING1, IFIT2, IFIT3, IFI6, LY6E, MX1, OAS1, ISG15, IFI27, OAS3, IFI44, LAMP3, DNAPTP6, ETV7, HERC5, OAS2, USP18, XAF1, RTP4, SIGLEC1, and EPSTI1.
- the IFN ⁇ -inducible PD markers in such an expression profile may further include at least one or more gene listed in drawing sheets 235-381.
- the IFN ⁇ -inducible PD markers in an expression profile may include at least genes SERPING1, IFIT2, IFIT3, IFI6, LY6E, MX1, OAS1, ISG15, IFI27, OAS3, IFI44, LAMP3, DNAPTP6, ETV7, HERC5, OAS2, USP18, XAF1, RTP4, SIGLEC1, EPSTI1, and RSAD2.
- the IFN ⁇ -inducible PD markers in such an expression profile may further include at least one or more gene listed in drawing sheets 235-381.
- the IFN ⁇ -inducible PD markers in an expression profile may include at least genes BCL2, BAK1, BAD, BAX, and BCL2L1.
- the IFN ⁇ -inducible PD markers in such an expression profile may further include at least one or more gene listed in drawing sheets 235-381.
- the IFN ⁇ -inducible PD markers in an expression profile may include at least genes RTP4, RSAD2, HERC5, SIGLEC1, USP18, LY6E, ETV7, SERPING1, IFIT3, OAS1, HSXIAPAF1, G1P3, MX1, OAS3, IFI27, DNAPTP6, LAMP3, EPSTI1, IFI44, OAS2, IFIT2, and ISG15.
- the IFN ⁇ -inducible PD markers in such an expression profile may further include at least one or more gene listed in drawing sheets 235-381.
- the IFN ⁇ -inducible PD markers in an expression profile may include at least genes LAMP3, SIGLEC1, DNAPTP6, IFIT2, ETV7, RTP4, SERPING1, HERC5,XAF MX1, EPSTI1, OAS2, OAS1, OAS3, IFIT3, IFI6, USP18, RSAD2, IFI44, LY6E, ISG15, and IFI27.
- the IFN ⁇ -inducible PD markers in such an expression profile may further include at least one or more gene listed in drawing sheets 235-381.
- the IFN ⁇ -inducible PD markers in an expression profile may include at least genes DNAPTP6, EPSTI1, HERC5, IFI27, IFI44, IFI44L, IFI6, IFIT1, IFIT3, ISG15, LAMP3, LY6E, MX1, OAS1, OAS2, OAS3, PLSCR1, RSAD2, RTP4, SIGLEC1, and USP18.
- the IFN ⁇ -inducible PD markers in such an expression profile may further include at least one or more gene listed in drawing sheets 235-381.
- the IFN ⁇ -inducible PD markers in an expression profile may include at least genes SAMD9L, IFI6, IFI44, IFIT2, ZC3HAV1, ETV6, DAPP1, IL1RN, CEACAM1, OAS1, IFI27, OAS3, IFI44L, HERC5, IFIT1, EPSTI1, ISG15, SERPING1, OASL, GBP1, and MX1.
- the IFN ⁇ -inducible PD markers in such an expression profile may further include at least one or more gene listed in drawing sheets 235-381.
- the IFN ⁇ -inducible PD markers in an expression profile may include at least genes IFI6, RSAD2, IFI44, IFI44L, IFI27, MX1, IFIT1, ISG15, LAMP3, OAS3, OAS1, EPSTI1, IFIT3, OAS2, SIGLEC1, and USP18.
- the IFN ⁇ -inducible PD markers in such an expression profile may further include at least one or more gene listed in drawing sheets 235-381.
- the IFN ⁇ -inducible PD markers in an expression profile may include at least genes IFI6, RSAD2, IFI44, IFI44L, IFI27, MX1, IFIT1, HERC5, ISG15, LAMP3, OAS3, OAS1, EPSTI1, IFIT3, OAS2, LY6E, SIGLEC1, and USP18.
- the IFN ⁇ -inducible PD markers in such an expression profile may further include at least one or more gene listed in drawing sheets 235-381.
- the IFN ⁇ -inducible PD markers in an expression profile may include at least genes IFI6, RSAD2, IFI44, IFI44L, IFI27, MX1, and IFIT1.
- the IFN ⁇ -inducible PD markers in such an expression profile may further include at least one or more gene listed in drawing sheets 235-381.
- the IFN ⁇ -inducible PD markers in an expression profile may include at least genes SAMD9L, IFI6, IFI44, IFIT2, OAS1, IFI27, OAS3, IFI44L, HERC5, IFIT1, EPSTI1, ISG15, SERPING1, OASL, GBP1, and MX1.
- the IFN ⁇ -inducible PD markers in such an expression profile may further include at least one or more gene listed in drawing sheets 235-381.
- the IFN ⁇ -inducible PD markers in an expression profile may include at least genes IFI27, RSAD2, IFI44L, IFI44, OAS1, IFIT1, ISG15, OAS3, HERC5, MX1, ESPTI1, IFIT3, and IFI6.
- the IFN ⁇ -inducible PD markers in such an expression profile may further include at least one or more gene listed in drawing sheets 235-381.
- the IFN ⁇ -inducible PD markers in an expression profile may include at least genes IFI44L, RSAD2, IFI27, and IFI44.
- the IFN ⁇ -inducible PD markers in such an expression profile may further include at least one or more gene listed in drawing sheets 235-381.
- the IFN ⁇ -inducible PD markers in an expression profile may include at least genes IFI44L and RSAD2.
- the IFN ⁇ -inducible PD markers in such an expression profile may further include at least one or more gene listed in drawing sheets 235-381.
- the IFN ⁇ -inducible PD markers in an expression profile may include at least gene IFI444L.
- the IFN ⁇ -inducible PD markers in such an expression profile may further include at least one or more gene listed in drawing sheets 235-381.
- the IFN ⁇ -inducible PD markers in an expression profile may include at least gene RSAD2.
- the IFN ⁇ -inducible PD markers in such an expression profile may further include at least one or more gene listed in drawing sheets 235-381.
- the patient comprising the differentially regulated miRNA profile may further comprise downregulated type I IFN or IFN ⁇ PD marker(s).
- the downregulated PD markers may include any one, any two, any three, any four, any five, any six, or any seven, of genes CYP1B1, TGST1, RRAGD, IRS2, MGST1, TGFBR3, and RGS2.
- the patient comprising the differentially regulated miRNA profile may further comprise upregulation of expression of any number of IFN ⁇ or type-I IFN subtypes.
- the IFN ⁇ or type-I IFN subtypes may include any more than one, more than two, more than three, more than four, more than five, more than six, more than seven, more than eight, more than nine, or more than ten IFN ⁇ or type-I IFN subtypes. These subtypes may include IFN ⁇ 1, IFN ⁇ 2, IFN ⁇ 4, IFN ⁇ 5, IFN ⁇ 6, IFN ⁇ 7, IFN ⁇ 8, IFN ⁇ 10, IFN ⁇ 14, IFN ⁇ 17, IFN ⁇ 21, IFN ⁇ , or IFN ⁇ .
- the patient may comprise upregulation of expression of IFN subtypes IFN ⁇ 1, IFN ⁇ 2, IFN ⁇ 8, and IFN ⁇ 14.
- the patient comprising the differentially regulated miRNA profile may further comprise upregulation of expression of IFN ⁇ receptors, either IFNAR1 or IFNAR2, or both, or TNF ⁇ , or IFN ⁇ , or IFN ⁇ receptors (either IFNGR1, IFNGR2, or both IFNGR1 and IFNGR2).
- the patient may simply be identified as one who comprises upregulation of expression of IFN ⁇ receptors, either IFNAR1 or IFNAR2, or both, or TNF ⁇ , or IFN ⁇ , or IFN ⁇ receptors (either IFNGR1, IFNGR2, or both IFNGR1 and IFNGR2).
- the upregulation or downregulation of the type I IFN or IFN ⁇ -inducible PD markers in the patient's expression profile may be by any degree relative to that of a sample from a control (which may be from a sample that is not disease tissue of the patient (e.g., non-lesional skin of a psoriasis patient) or from a healthy person not afflicted with the disease or disorder).
- a control which may be from a sample that is not disease tissue of the patient (e.g., non-lesional skin of a psoriasis patient) or from a healthy person not afflicted with the disease or disorder).
- the degree upregulation or downregulation may be at least 10%, at least 15%, at least 20%, at least 25%, at least 30%, at least 40%, at least 50%, at least 60%, at least 70%, at least 75%, at least 80%, at least 90%, at least 100%, at least 125%, at least 150%, or at least 200%, or at least 300%, or at least 400%, or at least 500% that of the control or control sample.
- the patient may overexpress or have a tissue that overexpresses a type I IFN subtype at least 10%, at least 15%, at least 20%, at least 25%, at least 30%, at least 40%, at least 50%, at least 60%, at least 70%, at least 75%, at least 80%, at least 90%, at least 100%, at least 125%, at least 150%, or at least 200%, or at least 300%, or at least 400%, or at least 500% that of the control.
- the type I IFN subtype may be any one of IFN ⁇ 1, IFN ⁇ 2, IFN ⁇ 4, IFN ⁇ 5, IFN ⁇ 6, IFN ⁇ 7, IFN ⁇ 8, IFN ⁇ 10, IFN ⁇ 14, IFN ⁇ 17, IFN ⁇ 21, IFN ⁇ , or IFN ⁇ .
- the type I IFN subtypes may include all of IFN ⁇ 1, IFN ⁇ 2, IFN ⁇ 8, and IFN ⁇ 14.
- the patient may further comprise or alternatively comprise alterations in levels of proteins in serum.
- the patient may have increased serum levels of proteins such as adiponectin, alpha-fetoprotein, apolipoprotein CIII, beta-2 microglobulin, cancer antigen 125, cancer antigen 19-9, eotaxin, FABP, factor VII, ferritin, IL-10, IL-12p70, IL-16, IL-18, IL-1ra, IL-3, MCP-1, MMP-3, myoglobin, SGOT, tissue factor, TIMP-1, TNF RII, TNF-alpha, VCAM-1, or vWF.
- proteins such as adiponectin, alpha-fetoprotein, apolipoprotein CIII, beta-2 microglobulin, cancer antigen 125, cancer antigen 19-9, eotaxin, FABP, factor VII, ferritin, IL-10, IL-12p70, IL-16, IL-18, IL-1ra, IL
- the patient may have increased serum levels of any 1, 2, 3, 4, 5, 6, 7, 8, 9, 10, 11, 12, 13 14, 15, 16, 17, 18, 19, 20, 21, o22, 23, 24, 25, or 26 of these proteins in serum.
- the increased level may be at least 10%, at least 15%, at least 20%, at least 25%, at least 30%, at least 40%, at least 50%, at least 60%, at least 70%, at least 75%, at least 80%, at least 90%, at least 100%, at least 125%, at least 150%, or at least 200%, or at least 300%, or at least 400%, or at least 500% that of a control, e.g., a healthy subject.
- the alteration may be a decrease in serum levels of proteins such as BDNK, complement 3, CD40 ligand, EGF, ENA-78, EN-RAGE, IGF-1, MDC, myeloperoxidase, RANTES, or thrombopoietin
- the patient may have decreased serum levels of any 1, 2, 3, 4, 5, 6, 7, 8, 9, 10, or 11 or these proteins.
- the decreased level may be at least 10%, at least 15%, at least 20%, at least 25%, at least 30%, at least 40%, at least 50%, at least 60%, at least 70%, at least 75%, at least 80%, at least 90%, or at least 100% that of a control, e.g., a healthy subject.
- the PD marker profile may comprise one or more of these increased or decreased serum levels of proteins.
- the patient may further comprise auto-antibodies that bind to any one of the following auto-antigens: (a) Myxovirus (influenza virus) resistance 1, interferon-inducible protein p78; (b) surfeit 5, transcript variant c; (c) proteasome (posome, macropain) activator subunit 3 (PA28 gamma; Ki) transc; (d) retinoic acid receptor, alpha; (e) Heat shock 10 kDa protein 1 (chaperonin 10); (f) tropomyosin 3; (g) pleckstrin homology-like domain, family A, member 1; (h) cytoskeleton-associated protein 1; (i) Sjogren syndrome antigen A2 (60 kDa, ribonucleoprotein auto-antigen SS-A/Ro); (j) NADH dehydrogenase (ubiquinone) 1, alpha/beta subcomplex 1, 8 kDa; (k) NudE nuclear distribution gene E homo
- nidulans (1) MutL homolog 1, colon cancer, nonpolyposis type 2 ( E. coli ); (m) leucine rich repeat (in FLII) interacting protein 2; (n) tropomyosin 1 (alpha); (o) spastic paraplegia 20, spartin (Troyer syndrome); (p) preimplantation protein, transcript variant 1; (r) mitochondrial ribosomal protein L45; (s) Lin-28 homolog ( C. elegans ); (t) heat shock 90 kDa protein 1, alpha; (u) dom-3 homolog Z ( C.
- elegans dynein, cytoplasmic, light intermediate polypeptide 2; (w) Ras-related C3 botulinum toxin substrate 1 (rho family, small GTP binding protein); (x) synovial sarcoma, X breakpoint 2, transcript variant 2; (y) moesin; (z) homer homolog ( Drosophila ), transcript variant 1; (aa) GCN5 general control of amino-acid synthesis 5-like 2 (yeast); (bb) eukaryotic translation elongation factor 1 gamma; (cc) eukaryotic translation elongation factor 1, delta; (dd) DNA-damage-inducible transcript 3; (ee) CCAAT/enhancer binding protein (C/EBP) gamma; and any other auto-antigen described in provisional application entitled “Auto-antibody markers of autoimmune disease” filed May 3, 2007 or in provisional application entitled entitled “Auto-antibody markers of autoimmune disease” to be filed Nov.
- the patient may comprise auto-antibodies that bind to any number of these auto-antigens, e.g., any at least 2, at least 3, at least 4, at least 5, at least 6, at least 7, at least 8, at least 9 at least 10, at least 11, at least 12, at least 13, at least 14, at least 15, at least 20, at least 25.
- auto-antibodies that bind to any number of these auto-antigens, e.g., any at least 2, at least 3, at least 4, at least 5, at least 6, at least 7, at least 8, at least 9 at least 10, at least 11, at least 12, at least 13, at least 14, at least 15, at least 20, at least 25.
- Administration of the agent that binds to and modulates type I IFN or an IFN ⁇ activity may further neutralize a type I IFN or IFN ⁇ -inducible profile to within at least 2%, at least 3%, at least 4%, at least 5%, at least 7%, at least 8%, at least 10%, at least 15%, at least 25%, at least 30%, at least 35%, at least 40%, at least 45%, at least 50%, at least 60%, at least 70%, at least 75%, at least 80%, or at least 90% that of a control sample.
- samples from the patient may be obtained before and after administration of an agent.
- Samples include any biological fluid or tissue, such as whole blood, serum, muscle, saliva, urine, synovial fluid, bone marrow, cerebrospinal fluid, nasal secretions, sputum, amniotic fluid, bronchoalveolar lavage fluid, peripheral blood mononuclear cells, total white blood cells, lymph node cells, spleen cells, tonsil cells, or skin.
- biological fluid or tissue such as whole blood, serum, muscle, saliva, urine, synovial fluid, bone marrow, cerebrospinal fluid, nasal secretions, sputum, amniotic fluid, bronchoalveolar lavage fluid, peripheral blood mononuclear cells, total white blood cells, lymph node cells, spleen cells, tonsil cells, or skin.
- the samples may be obtained by any means known in the art.
- miRNA profiles are obtained in the (before and after agent administration) samples.
- the miRNA profiles in the samples are compared. Comparison may be of the number of miRNAs present in the samples or may be of the quantity of miRNAs present in the samples, or any combination thereof.
- Variance indicating efficacy of the therapeutic agent may be indicated if the number or level (or any combination thereof) of up-regulated miRNAs decreases in the sample obtained after administration of the therapeutic agent relative to the sample obtained before administration of the therapeutic agent.
- the number of up-regulated miRNAs may decrease by at least 1, at least 2, at least 3, at least 4, at least 5, at least 6, at least 7, at least 8, at least 9, or at least 10.
- the level of any given up-regulated miRNAs may decrease by at least 10%, at least 20%, at least 25%, at least 30%, at least 35%, at least 40%, at least 50%, at least 60%, at least 70%, at least 80%, at least 90%, or at least 95%.
- the number of up-regulated miRNAs with decreased levels may be at least 1, at least 2, at least 3, at least 4, at least 5, at least 6, at least 7, at least 8, at least 9, at least 10, at least 15, at least 20, at least 25, at least 30, or at least 35. Any combination of decreased number and decreased level of up-regulated miRNAs may indicate efficacy.
- Variance indicating efficacy of the therapeutic agent may be indicated if the number or level (or any combination thereof) of down-regulated miRNAs decreases in the sample obtained after administration of the therapeutic agent relative to the sample obtained before administration of the therapeutic agent.
- the number of down-regulated miRNAs may decrease by at least 1, at least 2, at least 3, at least 4, at least 5, at least 6, at least 7, at least 8, at least 9, or at least 10.
- the level of any given down-regulated miRNA may increase by at least 10%, at least 20%, at least 25%, at least 30%, at least 35%, at least 40%, at least 50%, at least 60%, at least 70%, at least 80%, at least 90%, or at least 95%.
- the number of down-regulated miRNAs with increased levels may be at least 1, at least 2, at least 3, at least 4, at least 5, at least 6, at least 7, at least 8, at least 9, at least 10, at least 15, at least 20, at least 25, at least 30, or at least 35. Any combination of decreased number and increased level of down-regulated miRNAs may indicate efficacy.
- the sample obtained from the patient may be obtained prior to a first administration of the agent, i.e., the patient is na ⁇ ve to the agent.
- the sample obtained from the patient may occur after administration of the agent in the course of treatment.
- the agent may have been administered prior to the initiation of the monitoring protocol.
- an additional samples may be obtained from the patient and type I IFN or IFN ⁇ inducible PD markers in the samples are compared.
- the samples may be of the same or different type, e.g., each sample obtained may be a blood sample, or each sample obtained may be a serum sample.
- the type I IFN or IFN ⁇ inducible PD markers detected in each sample may be the same, may overlap substantially, or may be similar.
- the samples may be obtained at any time before and after the administration of the therapeutic agent.
- the sample obtained after administration of the therapeutic agent may be obtained at least 2, at least 3, at least 4, at least 5, at least 6, at least 7, at least 8, at least 9, at least 10, at least 12, or at least 14 days after administration of the therapeutic agent.
- the sample obtained after administration of the therapeutic agent may be obtained at least 2, at least 3, at least 4, at least 5, at least 6, at least 7, or at least 8 weeks after administration of the therapeutic agent.
- the sample obtained after administration of the therapeutic agent may be obtained at least 2, at least 3, at least 4, at least 5, or at least 6 months following administration of the therapeutic agent.
- Additional samples may be obtained from the patient following administration of the therapeutic agent.
- At least 2, at least 3, at least 4, at least 5, at least 6, at least 7, at least 8, at least 9, at least 10, at least 12, at least 15, at least 20, at least 25 samples may be obtained from the patient to monitor progression or regression of the disease or disorder over time.
- Disease progression may be monitored over a time period of at least 1 week, at least 2 weeks, at least 3 weeks, at least 4 weeks, at least 5 weeks, at least 6 weeks, at least 7 weeks, at least 2 months, at least 3 months, at least 4 months, at least 5 months, at least 6 months, at least 1 year, at least 2 years, at least 3 years, at least 4 years, at least 5 years, at least 10 years, or over the lifetime of the patient.
- Additional samples may be obtained from the patient at regular intervals such as at monthly, bi-monthly, once a quarter year, twice a year, or yearly intervals.
- the samples may be obtained from the patient following administration of the agent at regular intervals. For instance, the samples may be obtained from the patient at one week following each administration of the agent, or at two weeks following each administration of the agent, or at three weeks following each administration of the agent, or at one month following each administration of the agent, or at two months following each administration of the agent.
- multiple samples may be obtained from the patient following each administration of the agent.
- Disease progression in a patient may similarly be monitored in the absence of administration of an agent.
- Samples may periodically be obtained from the patient having the disease or disorder.
- Disease progression may be identified if the number of miRNAs increases in a later-obtained sample relative to an earlier obtained sample.
- the number of miRNAs may increase by at least 1, at least 2, at least 3, at least 4, at least 5, at least 6, at least 7, at least 8, at least 9, or at least 10.
- Disease progression may be identified if level of any given up-regulated miRNAs increases by at least 10%, at least 20%, at least 25%, at least 30%, at least 35%, at least 40%, at least 50%, at least 60%, at least 70%, at least 80%, at least 90%, or at least 95%.
- Level of any given down-regulated miRNAs decreases by at least 10%, at least 20%, at least 25%, at least 30%, at least 35%, at least 40%, at least 50%, at least 60%, at least 70%, at least 80%, at least 90%, or at least 95%.
- the number of up-regulated miRNAs with increased levels may be at least 1, at least 2, at least 3, at least 4, at least 5, at least 6, at least 7, at least 8, at least 9, at least 10, at least 15, at least 20, at least 25, at least 30, or at least 35.
- the number of down-regulated miRNAs with decreased levels may be at least 1, at least 2, at least 3, at least 4, at least 5, at least 6, at least 7, at least 8, at least 9, at least 10, at least 15, at least 20, at least 25, at least 30, or at least 35. Any combination of increased number and increased level of up-regulated miRNA may indicate disease progression. Alternatively, or in combination, any combination of decreased number and decreased level of down-regulated type miRNA may indicate disease progression. Disease regression may also be identified in a patient having a disease or disorder, not treated by an agent. In this instance, regression may be identified if the number of miRNAs decreases in a later-obtained sample relative to an earlier obtained sample.
- the number of miRNAs may decrease by at least 1, at least 2, at least 3, at least 4, at least 5, at least 6, at least 7, at least 8, at least 9, or at least 10.
- Disease regression may be identified if level of any given up-regulated miRNA decreases by at least 10%, at least 20%, at least 25%, at least 30%, at least 35%, at least 40%, at least 50%, at least 60%, at least 70%, at least 80%, at least 90%, or at least 95%.
- Disease regression may be identified if level of any given down-regulated miRNA increases by at least 10%, at least 20%, at least 25%, at least 30%, at least 35%, at least 40%, at least 50%, at least 60%, at least 70%, at least 80%, at least 90%, or at least 95%.
- the number of up-regulated miRNAs with decreased levels may be at least 1, at least 2, at least 3, at least 4, at least 5, at least 6, at least 7, at least 8, at least 9, at least 10, at least 15, at least 20, at least 25, at least 30, or at least 35.
- the number of down-regulated miRNAs with increased levels may be at least 1, at least 2, at least 3, at least 4, at least 5, at least 6, at least 7, at least 8, at least 9, at least 10, at least 15, at least 20, at least 25, at least 30, or at least 35.
- Disease progression or disease regression may be monitored by obtaining samples over any period of time and at any interval.
- Disease progression or disease regression may be monitored by obtaining samples over the course of at least 1 week, at least 2 weeks, at least 3 weeks, at least 4 weeks, at least 5 weeks, at least 6 weeks, at least 7 weeks, at least 2 months, at least 3 months, at least 4 months, at least 5 months, at least 6 months, at least 1 year, at least 2 years, at least 3 years, at least 4 years, at least 5 years, at least 10 years, or over the lifetime of the patient.
- Disease progression or disease regression may be monitored by obtaining samples at least monthly, bi-monthly, once a quarter year, twice a year, or yearly. The samples need not be obtained at strict intervals.
- Variance in the samples may guide treatment strategy of a disease or disorder.
- Treatment strategy may be dosage of a particular therapeutic, or may be removal or addition of particular therapeutics administered to a patient.
- the invention also encompasses methods employing IFN ⁇ -inducible PD markers to treat, diagnose, prognose, and monitor myositis. These IFN ⁇ -inducible PD markers can also be used to guide dosage and treatment of myositis patients or models of myositis disease.
- the type I IFN or IFN ⁇ -inducible PD marker expression profile may comprise upregulation or downregulation of any type I IFN or IFN ⁇ -inducible PD marker expression profile genes or group of genes relative to a control, e.g. healthy, patient or sample of non-disease tissue of a patient.
- the gene or group of genes may include any at least 2, any at least 3, any at least 4, any at least 5, any at least 6, any at least 7, any at least 8, any at least 9, any at least 10, any at least 11, any at least 12, any at least 13, any at least 14, any at least 15, any at least 16, any at least 17, any at least 18, any at least 19, any at least 20, any at least 21, any at least 22, any at least 23, any at least 24, any at least 25, any at least 26, any at least 27, any at least 28, any at least 29, any at least 30, any at least 40, any at least 50 genes, any at least 75 gene, any at least 100 genes, or any at least 150 genes.
- the IFN ⁇ -inducible PD markers in an expression profile may include at least genes EPSTI1, HERC5, IFI27, IFI44, IFI44L, IFI6, IFIT1, IFIT3, ISG15, LAMP3, LY6E, MX1, OAS1, OAS2, OAS3, RSAD2, RTP4, SIGLEC1, USP18.
- the IFN ⁇ -inducible PD markers in such an expression profile may further include at least one or more gene listed in drawing sheets 235-381.
- the IFN ⁇ -inducible PD markers in an expression profile may include at least genes IFI27, SIGLEC1, RSAD2, IFI6, IFI44L, IFI44, USP18, IFIT2, SAMD9L, BIRC4BP, DNAPTP6, OAS3, LY6E, IFIT1, LIPA, LOC129607, ISG15, PARP14, MX1, OAS2, OASL, CCL2, HERC5, OAS1.
- the IFN ⁇ -inducible PD markers in such an expression profile may further include at least one or more gene listed in drawing sheets 235-381.
- the IFN ⁇ -inducible PD markers in an expression profile may include at least genes IFIT1, IFIT3, IRF7, IFI6, IL6ST, IRF2, LY6E, MARCKS, MX1, MX2, OAS1, EIF2AK2, ISG15, STAT2, OAS3, IFI44, IFI44L, HERC5, RAB8B, LILRA5, RSAD2, and FCHO2.
- the IFN ⁇ -inducible PD markers in such an expression profile may further include at least one or more gene listed in drawing sheets 235-381.
- the IFN ⁇ -inducible PD markers in an expression profile may include at least genes SERPING1, IFIT2, IFIT3, IFI6, LY6E, MX1, OAS1, ISG15, IFI27, OAS3, IFI44, LAMP3, DNAPTP6, ETV7, HERC5, OAS2, USP18, XAF1, RTP4, SIGLEC1, and EPSTI1.
- the IFN ⁇ -inducible PD markers in such an expression profile may further include at least one or more gene listed in drawing sheets 235-381.
- the IFN ⁇ -inducible PD markers in an expression profile may include at least genes SERPING1, IFIT2, IFIT3, IFI6, LY6E, MX1, OAS1, ISG15, IFI27, OAS3, IFI44, LAMP3, DNAPTP6, ETV7, HERC5, OAS2, USP18, XAF1, RTP4, SIGLEC1, EPSTI1, and RSAD2.
- the IFN ⁇ -inducible PD markers in such an expression profile may further include at least one or more gene listed in drawing sheets 235-381.
- the IFN ⁇ -inducible PD markers in an expression profile may include at least genes RTP4, RSAD2, HERC5, SIGLEC1, USP18, LY6E, ETV7, SERPING1, IFIT3, OAS1, HSXIAPAF1, G1P3, MX1, OAS3, IFI27, DNAPTP6, LAMP3, EPSTI1, IFI44, OAS2, IFIT2, and ISG15.
- the IFN ⁇ -inducible PD markers in such an expression profile may further include at least one or more gene listed in drawing sheets 235-381.
- the IFN ⁇ -inducible PD markers in an expression profile may include at least genes LAMP3, SIGLEC1, DNAPTP6, IFIT2, ETV7, RTP4, SERPING1, HERC5,XAF1, MX1, EPSTI1, OAS2, OAS1, OAS3, IFIT3, IFI6, USP18, RSAD2, IFI44, LY6E, ISG15, and IFI27.
- the IFN ⁇ -inducible PD markers in such an expression profile may further include at least one or more gene listed in drawing sheets 235-381.
- the IFN ⁇ -inducible PD markers in an expression profile may include at least genes DNAPTP6, EPSTI1, HERC5, IFI27, IFI44, IFI44L, IFI6, IFIT1, IFIT3, ISG15, LAMP3, LY6E, MX1, OAS1, OAS2, OAS3, PLSCR1, RSAD2, RTP4, SIGLEC1, and USP18.
- the IFN ⁇ -inducible PD markers in such an expression profile may further include at least one or more gene listed in drawing sheets 235-381.
- the IFN ⁇ -inducible PD markers in an expression profile may include at least genes SAMD9L, IFI6, IFI44, IFIT2, ZC3HAV1, ETV6, DAPP1, IL1RN, CEACAM1, OAS1, IFI27, OAS3, IFI44L, HERC5, IFIT1, EPSTI1, ISG15, SERPING1, OASL, GBP1, and MX1.
- the IFN ⁇ -inducible PD markers in such an expression profile may further include at least one or more gene listed in drawing sheets 235-381.
- the IFN ⁇ -inducible PD markers in an expression profile may include at least genes IFI6, RSAD2, IFI44, IFI44L, IFI27, MX1, IFIT1, ISG15, LAMP3, OAS3, OAS1, EPSTI1, IFIT3, OAS2, SIGLEC1, and USP18.
- the IFN ⁇ -inducible PD markers in such an expression profile may further include at least one or more gene listed in drawing sheets 235-381.
- the IFN ⁇ -inducible PD markers in an expression profile may include at least genes IFI6, RSAD2, IFI44, IFI44L, IFI27, MX1, IFIT1, HERC5, ISG15, LAMP3, OAS3, OAS1, EPSTI1, IFIT3, OAS2, LY6E, SIGLEC1, and USP18.
- the IFN ⁇ -inducible PD markers in such an expression profile may further include at least one or more gene listed in drawing sheets 235-381.
- the IFN ⁇ -inducible PD markers in an expression profile may include at least genes IFI6, RSAD2, IFI44, IFI44L, IFI27, MX1, and IFIT1.
- the IFN ⁇ -inducible PD markers in such an expression profile may further include at least one or more gene listed in drawing sheets 235-381.
- the IFN ⁇ -inducible PD markers in an expression profile may include at least genes IFI6, RSAD2, IFI44, IFI44L, and IFI27.
- the IFN ⁇ -inducible PD markers in such an expression profile may further include at least one or more gene listed in drawing sheets 235-381.
- the IFN ⁇ -inducible PD markers in an expression profile may include at least genes SAMD9L, IFI6, IFI44, IFIT2, OAS1, IFI27, OAS3, IFI44L, HERC5, IFIT1, EPSTI1, ISG15, SERPING1, OASL, GBP1, and MX1.
- the IFN ⁇ -inducible PD markers in such an expression profile may further include at least one or more gene listed in drawing sheets 235-381.
- the IFN ⁇ -inducible PD markers in an expression profile may include at least genes IFI27, RSAD2, IFI44L, IFI44, OAS1, IFIT1, ISG15, OAS3, HERC5, MX1, ESPTI1, IFIT3, and IFI6.
- the IFN ⁇ -inducible PD markers in such an expression profile may further include at least one or more gene listed in drawing sheets 235-381.
- the IFN ⁇ -inducible PD markers in an expression profile may include at least genes IFI44L, RSAD2, IFI27, and IFI44.
- the IFN ⁇ -inducible PD markers in such an expression profile may further include at least one or more gene listed in drawing sheets 235-381.
- the IFN ⁇ -inducible PD markers in an expression profile may include at least genes IFI44L and RSAD2.
- the IFN ⁇ -inducible PD markers in such an expression profile may further include at least one or more gene listed in drawing sheets 235-381.
- the IFN ⁇ -inducible PD markers in an expression profile may include at least gene IFI444L.
- the IFN ⁇ -inducible PD markers in such an expression profile may further include at least one or more gene listed in drawing sheets 235-381.
- the IFN ⁇ -inducible PD markers in an expression profile may include at least gene RSAD2.
- the IFN ⁇ -inducible PD markers in such an expression profile may further include at least one or more gene listed in drawing sheets 235-381.
- the IFN ⁇ -inducible PD markers in an expression profile may include at least genes IFI27, IL-121R beta2, IL-15R alpha, IL-15, suppressor of cytokine signaling 1 (SOCS1), janus kinase 2, CXCL11 (T-TAC), TNFSF13B (BAFF), TRAF-type domain 1 (TRAFD1), SERPING1, CD274 (PD1-L), indoleamine 2,3 dioxygenase (INDO), lymphocyte-activation gene 3 (LAG3), and caspase 5.
- the IFN ⁇ -inducible PD markers in such an expression profile may further include at least one or more gene listed in drawing sheets 235-381.
- IFN ⁇ -inducible PD markers or a PD marker profile may include any at least 5 genes such as, for example: MX1, LLY6E, IFI27, OAS1, IFIT1; or MX1, LLY6E, IFI27, OAS1, IFI6; or MX1, LLY6E, IFI27, OAS1, IFI44L; or MX1, LLY6E, IFI27, OAS1, ISG15; or MX1, LLY6E, IFI27, OAS1, LAMP3; or MX1, LLY6E, IFI27, OAS1, OASL; or MX1, LLY6E, IFI27, OAS1, RSAD2; or MX1, LLY6E, IFI27, OAS1, IFI44; or MX1, LLY6E, IFI27, OAS1, IFIT2; or MX1, LLY6E, IFI27, OAS1, OAS3; or MX1, LLY6E, IFI27, OAS1, USP18; or MX
- the IFN ⁇ -inducible PD markers in an expression profile may include any at least 6 genes such as, for example: MX1, LLY6E, IFI27, OAS1, IFIT1, IFI6; or MX1, LLY6E, IFI27, OAS1, IFIT1, IFI44L; or MX1, LLY6E, IFI27, OAS1, IFIT1, ISG15; or MX1, LLY6E, IFI27, OAS1, IFIT1, LAMP3; or MX1, LLY6E, IFI27, OAS1, IFIT1, OASL; or MX1, LLY6E, IFI27, OAS1, IFIT1, RSAD2; or MX1, LLY6E, IFI27, OAS1, IFIT1, IFI44; or MX1, LLY6E, IFI27, OAS1, IFIT1, IFIT2; or MX1, LLY6E, IFI27, OAS1, IFIT1, OAS3; or MX1, LLY6E, IFI27, OAS1, IFIT
- the IFN ⁇ -inducible PD markers in an expression profile may include any at least 7 genes such as, for example: MX1, LLY6E, IFI27, OAS1, IFIT1, IFI6, IFI44L; or MX1, LLY6E, IFI27, OAS1, IFIT1, IFI6, ISG15; or MX1, LLY6E, IFI27, OAS1, IFIT1, IFI6, LAMP3; or MX1, LLY6E, IFI27, OAS1, IFIT1, IFI6, OASL; or MX1, LLY6E, IFI27, OAS1, IFIT1, IFI6, RSAD2; or MX1, LLY6E, IFI27, OAS1, IFIT1, IFI6, IFI44; or MX1, LLY6E, IFI27, OAS1, IFIT1, IFI6, IFIT2; or MX1, LLY6E, IFI27, OAS1, IFIT1, IFI6, OAS3; or MX1, LLY6E, IFI27, OAS1, I
- the IFN ⁇ -inducible PD markers in an expression profile may include any at least 8 genes such as, for example: MX1, LLY6E, IFI27, OAS1, IFIT1, IFI6, IFI44L, ISG15; or MX1, LLY6E, IFI27, OAS1, IFIT1, IFI6, IFI44L, LAMP3; or MX1, LLY6E, IFI27, OAS1, IFIT1, IFI6, IFI44L, OASL; or MX1, LLY6E, IFI27, OAS1, IFIT1, IFI6, IFI44L, RSAD2; or MX1, LLY6E, IFI27, OAS1, IFIT1, IFI6, IFI44L, IFI44; or MX1, LLY6E, IFI27, OAS1, IFIT1, IFI6, IFI44L, IFIT2; or MX1, LLY6E, IFI27, OAS1, IFIT1, IFI6, IFI44L, OAS3; or MX1, LLY6E,
- the IFN ⁇ -inducible PD markers in an expression profile may include any at least 12 genes such as, for example: MX1, LLY6E, IFI27, OAS1, IFIT1, IFI6, IFI44L, ISG15, LAMP3, OASL, RSAD2, IFI44; or MX1, LLY6E, IFI27, OAS1, IFIT1, IFI6, IFI44L, ISG15, LAMP3, OASL, RSAD2, IFIT2; or MX1, LLY6E, IFI27, OAS1, IFIT1, IFI6, IFI44L, ISG15, LAMP3, OASL, RSAD2, OAS3; or MX1, LLY6E, IFI27, OAS1, IFIT1, IFI6, IFI44L, ISG15, LAMP3, OASL, RSAD2, USP18; or MX1, LLY6E, IFI27, OAS1, IFIT1, IFI6, IFI44L, ISG15, LAMP3, OASL, RSAD2, US
- the IFN ⁇ -inducible PD markers in an expression profile may include alterations in any one or more of serum protein levels of adiponectin, alpha-fetoprotein, apolipoprotein CIII, beta-2 microglobulin, cancer antigen 125, cancer antigen 19-9, eotaxin, FABP, factor VII, ferritin, IL-10, IL-12p70, IL-16, IL-18, IL-1ra, IL-3, MCP-1, MMP-3, myoglobin, SGOT, tissue factor, TIMP-1, TNF RII, TNF-alpha, VCAM-1, vWF, BDNK, complement 3, CD40 ligand, EGF, ENA-78, EN-RAGE, IGF-1, MDC, myeloperoxidase, RANTES, or thrombopoietin.
- the IFN ⁇ -inducible PD markers in such an expression profile may further include at least one or more gene listed in drawing sheets 235-381.
- the IFN ⁇ -inducible PD markers in an expression profile may include alterations in any one or more of serum protein levels of adiponectin, alpha-fetoprotein, apolipoprotein CIII, beta-2 microglobulin, cancer antigen 125, cancer antigen 19-9, eotaxin, FABP, factor VII, ferritin, IL-10, IL-12p70, IL-16, IL-18, IL-1ra, IL-3, MCP-1, MMP-3, myoglobin, SGOT, tissue factor, TIMP-1, TNF RII, TNF-alpha, VCAM-1, or vWF.
- the IFN ⁇ -inducible PD markers in such an expression profile may further include at least one or more gene listed in drawing sheets 235-381.
- the IFN ⁇ -inducible PD markers in an expression profile may include alterations in any one or more of serum protein levels of BDNK, complement 3, CD40 ligand, EGF, ENA-78, EN-RAGE, IGF-1, MDC, myeloperoxidase, RANTES, or thrombopoietin.
- the IFN ⁇ -inducible PD markers in such an expression profile may further include at least one or more gene listed in drawing sheets 235-381.
- An IFN ⁇ -inducible PD marker expression profile may further include genes whose expression or activity is down-regulated in cells exposed to non-baseline IFN ⁇ levels.
- the genes may include any one or more of SLC4A1, PRSS33, FCER1A, BACH2, KLRB1, D4S234E, T cell receptor alpha locus/T cell receptor delta locus, FEZ1, AFF3, CD160, ABCB1, PTCH1, OR2W3, IGHD, NOG, NR3C2, TNS1, PDZK1IP1, SH2D1B, STRBP, ZMYND11, TMOD1, FCRLA, DKFZp761P0423, EPB42, NR6A1, LOC341333, MS4A1, IGHM, SIGLECP3, KIR2DS2, PKIA, BLR1, C5orf4, MYLK, LOC283663, MAD1L1, CXCL5, D4S234E, FCRLA, KRT1, c16orf74,
- PD markers may be upregulated or may be downregulated relative to those of healthy subjects or non-afflicted patient tissues.
- the upregulation or downregulation of the type I IFN or IFN ⁇ -inducible PD markers in the patient's expression profile may be by any degree relative to that of a sample from a control (which may be from a sample that is not disease tissue of the patient (e.g., non-lesional skin of a psoriasis patient) or from a healthy person not afflicted with the disease or disorder).
- the degree upregulation or downregulation may be at least 10%, at least 15%, at least 20%, at least 25%, at least 30%, at least 40%, at least 50%, at least 60%, at least 70%, at least 75%, at least 80%, at least 90%, at least 100%, at least 125%, at least 150%, or at least 200%, or at least 300%, or at least 400%, or at least 500% that of the control or control sample.
- a patient comprising the type I IFN or IFN ⁇ -inducible PD marker expression profile may further comprise upregulation of expression of any number of IFN ⁇ or type-I IFN subtypes.
- the IFN ⁇ or type-I IFN subtypes may include any more than one, more than two, more than three, more than four, more than five, more than six, more than seven, more than eight, more than nine, or more than ten IFN ⁇ or type-I IFN subtypes. These subtypes may include IFN ⁇ 1, IFN ⁇ 2, IFN ⁇ 4, IFN ⁇ 5, IFN ⁇ 6, IFN ⁇ 7, IFN ⁇ 8, IFN ⁇ 10, IFN ⁇ 14, IFN ⁇ 17, IFN ⁇ 21, IFN ⁇ , or IFN ⁇ .
- the patient may comprise upregulation of expression of IFN subtypes IFN ⁇ 1, IFN ⁇ 2, IFN ⁇ 8, and IFN ⁇ 14.
- the upregulation of expression may be at least 10%, at least 15%, at least 20%, at least 25%, at least 30%, at least 40%, at least 50%, at least 60%, at least 70%, at least 75%, at least 80%, at least 90%, at least 100%, at least 125%, at least 150%, or at least 200%, or at least 300%, or at least 400%, or at least 500% that of the control.
- a patient comprising a type I IFN or IFN ⁇ -inducible PD marker expression profile may further comprise upregulation of expression of IFN ⁇ receptors, either IFNAR1 or IFNAR2, or both, or TNF ⁇ , or IFN ⁇ , or IFN ⁇ receptors (either IFNGR1, IFNGR2, or both IFNGR1 and IFNGR2).
- the patient may simply be identified as one who comprises upregulation of expression of IFN ⁇ receptors, either IFNAR1 or IFNAR2, or both, or TNF ⁇ , or IFN ⁇ , or IFN ⁇ receptors (either IFNGR1, IFNGR2, or both IFNGR1 and IFNGR2).
- the patient may further comprise or alternatively comprise alterations in levels of proteins in serum.
- the patient may have increased serum levels of proteins such as adiponectin, alpha-fetoprotein, apolipoprotein CIII, beta-2 microglobulin, cancer antigen 125, cancer antigen 19-9, eotaxin, FABP, factor VII, ferritin, IL-10, IL-12p70, IL-16, IL-18, IL-1ra, IL-3, MCP-1, MMP-3, myoglobin, SGOT, tissue factor, TIMP-1, TNF RII, TNF-alpha, VCAM-1, or vWF.
- proteins such as adiponectin, alpha-fetoprotein, apolipoprotein CIII, beta-2 microglobulin, cancer antigen 125, cancer antigen 19-9, eotaxin, FABP, factor VII, ferritin, IL-10, IL-12p70, IL-16, IL-18, IL-1ra, IL
- the patient may have increased serum levels of any 1, 2, 3, 4, 5, 6, 7, 8, 9, 10, 11, 12, 13 14, 15, 16, 17, 18, 19, 20, 21, o22, 23, 24, 25, or 26 of these proteins in serum.
- the increased level may be at least 10%, at least 15%, at least 20%, at least 25%, at least 30%, at least 40%, at least 50%, at least 60%, at least 70%, at least 75%, at least 80%, at least 90%, at least 100%, at least 125%, at least 150%, or at least 200%, or at least 300%, or at least 400%, or at least 500% that of a control, e.g., a healthy subject.
- the alteration may be a decrease in serum levels of proteins such as BDNK, complement 3, CD40 ligand, EGF, ENA-78, EN-RAGE, IGF-1, MDC, myeloperoxidase, RANTES, or thrombopoietin
- the patient may have decreased serum levels of any 1, 2, 3, 4, 5, 6, 7, 8, 9, 10, or 11 or these proteins.
- the decreased level may be at least 10%, at least 15%, at least 20%, at least 25%, at least 30%, at least 40%, at least 50%, at least 60%, at least 70%, at least 75%, at least 80%, at least 90%, or at least 100% that of a control, e.g., a healthy subject.
- the PD marker profile may comprise one or more of these increased or decreased serum levels of proteins.
- the patient may further comprise auto-antibodies that bind to any one of the following auto-antigens: (a) Myxovirus (influenza virus) resistance 1, interferon-inducible protein p78; (b) surfeit 5, transcript variant c; (c) proteasome (posome, macropain) activator subunit 3 (PA28 gamma; Ki) transc; (d) retinoic acid receptor, alpha; (e) Heat shock 10 kDa protein 1 (chaperonin 10); (f) tropomyosin 3; (g) pleckstrin homology-like domain, family A, member 1; (h) cytoskeleton-associated protein 1; (i) Sjogren syndrome antigen A2 (60 kDa, ribonucleoprotein auto-antigen SS-A/Ro); (j) NADH dehydrogenase (ubiquinone) 1, alpha/beta subcomplex 1, 8 kDa; (k) NudE nuclear distribution gene E homo
- nidulans (1) MutL homolog 1, colon cancer, nonpolyposis type 2 ( E. coli ); (m) leucine rich repeat (in FLII) interacting protein 2; (n) tropomyosin 1 (alpha); (o) spastic paraplegia 20, spartin (Troyer syndrome); (p) preimplantation protein, transcript variant 1; (r) mitochondrial ribosomal protein L45; (s) Lin-28 homolog ( C. elegans ); (t) heat shock 90 kDa protein 1, alpha; (u) dom-3 homolog Z ( C.
- elegans dynein, cytoplasmic, light intermediate polypeptide 2; (w) Ras-related C3 botulinum toxin substrate 1 (rho family, small GTP binding protein); (x) synovial sarcoma, X breakpoint 2, transcript variant 2; (y) moesin; (z) homer homolog ( Drosophila ), transcript variant 1; (aa) GCN5 general control of amino-acid synthesis 5-like 2 (yeast); (bb) eukaryotic translation elongation factor 1 gamma; (cc) eukaryotic translation elongation factor 1, delta; (dd) DNA-damage-inducible transcript 3; (ee) CCAAT/enhancer binding protein (C/EBP) gamma; and any other auto-antigen described in provisional application entitled “Auto-antibody markers of autoimmune disease” filed May 3, 2007 or in provisional application entitled entitled “Auto-antibody markers of autoimmune disease” filed Nov.
- C/EBP
- the patient may comprise auto-antibodies that bind to any number of these auto-antigens, e.g., any at least 2, at least 3, at least 4, at least 5, at least 6, at least 7, at least 8, at least 9 at least 10, at least 11, at least 12, at least 13, at least 14, at least 15, at least 20, at least 25.
- auto-antibodies that bind to any number of these auto-antigens, e.g., any at least 2, at least 3, at least 4, at least 5, at least 6, at least 7, at least 8, at least 9 at least 10, at least 11, at least 12, at least 13, at least 14, at least 15, at least 20, at least 25.
- a therapeutic agent may be administered to a myositis patient.
- a therapeutic agent may be any molecule that binds to and modulates type I IFN or IFN ⁇ activity.
- the therapeutic agent may be a small molecule or a biological agent. If the therapeutic agent is a small molecule it may be synthesized or identified and isolated from a natural source.
- the therapeutic agent may be an antibody specific for any subtype(s) of type I IFN or IFN ⁇ .
- the antibody may be specific for any one of IFN ⁇ 1, IFN ⁇ 2, IFN ⁇ 4, IFN ⁇ 5, IFN ⁇ 6, IFN ⁇ 7, IFN ⁇ 8, IFN ⁇ 10, IFN ⁇ 14, IFN ⁇ 17, IFN ⁇ 21, IFN ⁇ , or IFN ⁇ .
- the antibody may be specific for any two, any three, any four, any five, any six, any seven, any eight, any nine, any ten, any eleven, any twelve type I IFN of IFN ⁇ subtypes.
- the antibody may be specific for IFN ⁇ 1, IFN ⁇ 2, IFN ⁇ 4, IFN ⁇ 5, IFN ⁇ 8, IFN ⁇ 10, and IFN ⁇ 21; or it may be specific for IFN ⁇ 1, IFN ⁇ 2, IFN ⁇ 4, IFN ⁇ 5, IFN ⁇ 8, and IFN ⁇ 10; or it may be specific for IFN ⁇ 1, IFN ⁇ 2, IFN ⁇ 4, IFN ⁇ 5, IFN ⁇ 8, and IFN ⁇ 21; or it may be specific for IFN ⁇ 1, IFN ⁇ 2, IFN ⁇ 4, IFN ⁇ 5, IFN ⁇ 10, and IFN ⁇ 21.
- Antibodies specific for type I IFN or IFN ⁇ include MEDI-545, any biologic or antibody other than MEDI-545, antibodies described in U.S.
- the antibody may be a synthetic antibody, a monoclonal antibody, polyclonal antibodies, a recombinantly produced antibody, an intrabody, a multispecific antibody (including bi-specific antibodies), a human antibody, a humanized antibody, a chimeric antibody, a single-chain Fv (scFv) (including bi-specific scFv), a BiTE molecule, a single chain antibody, a Fab fragments, a F(ab′) fragment, a disulfide-linked Fv (sdFv), or an epitope-binding fragment of any of the above.
- the antibody may be any of an immunoglobulin molecule or immunologically active portion of an immunoglobulin molecule.
- the antibody may be of any isotype.
- it may be any of isotypes IgG1, IgG2, IgG3 or IgG4.
- the antibody may be a full-length antibody comprising variable and constant regions, or an antigen-binding fragment thereof, such as a single chain antibody, or a Fab or Fab′2 fragment.
- the antibody may also be conjugated or linked to a therapeutic agent, such as a cytotoxin or a radioactive isotope.
- a second agent other than the agent that binds to modulates IFN ⁇ activity may be administered to a myositis patient.
- Second agents include, but are not limited to non-steroidal anti-inflammatory drugs such as ibuprofen, naproxen, sulindac, diclofenac, piroxicam, ketoprofen, diflunisal, nabumetone, etodolac, and oxaprozin, indomethacin; anti-malarial drugs such as hydroxychloroquine; corticosteroid hormones, such as prednisone, hydrocortisone, methylprednisolone, and dexamethasone; methotrexate; immunosuppressive agents, such as azathioprine and cyclophosphamide; and biologic agents that, e.g., target T cells such as Alefacept and Efalizumab, or target TNF ⁇ , such as, Enbrel, Remicade, and Humira.
- Treatment with the agent may result in neutralization of the type I IFN or IFN ⁇ -inducible profile.
- Treatment with the agent may result in a decrease in one or more symptoms of myositis or disease flare-ups.
- the symptoms may include muscle weakness, difficulty swallowing, difficulty breathing, fever, weight loss, pain, muscle tenderness, arthritis, and rash.
- Treatment with the agent may result in improved prognosis.
- Treatment with the agent may result in a higher quality of life for the patient.
- Treatment with the agent may alleviate the need to co-administer second agents or may lessen the dosage of administration of the second agent to the patient.
- Treatment with the agent may reduce the number of hospitalizations of the patient.
- the agent that binds to and modulates type I IFN or IFN ⁇ activity may neutralize a type I IFN or IFN ⁇ -inducible profile.
- Neutralization of the type I IFN or IFN ⁇ -inducible profile may be a reduction in at least one, at least two, at least three, at least five, at least seven, at least eight, at least ten, at least twelve, at least fifteen, at least twenty, at least twenty five, at least thirty, at least thirty five, at least forty, at least forty five, or at least fifty genes up-regulated by type I IFN or IFN ⁇ .
- the genes upregulated by type I IFN or IFN ⁇ may be any group of genes in FIGS. 235-381 or as discussed above.
- Neutralization of the type I IFN or IFN ⁇ -inducible profile is a reduction of at least 2%, at least 3%, at least 4%, at least 5%, at least 7%, at least 8%, at least 10%, at least 15%, at least 25%, at least 30%, at least 35%, at least 40%, at least 45%, at least 50%, at least 60%, at least 70%, at least 75%, at least 80%, or at least 90% of any of the at least one, at least two, at least three, at least five, at least seven, at least eight, at least ten, at least twelve, at least fifteen, at least twenty, at least twenty five, at least thirty, at least thirty five, at least forty, at least forty five, or at least fifty genes up-regulated in any type I IFN or IFN ⁇ -inducible profile.
- neutralization of the type I IFN or IFN ⁇ -inducible profile may refer to a reduction of expression of up-regulated type I IFN or IFN ⁇ -inducible genes that is within at most 50%, at most 45%, at most 40%, at most 35%, at most 30%, at most 25%, at most 20%, at most 15%, at most 10%, at most 5%, at most 4%, at most 3%, at most 2%, or at most 1% of expression levels of those type I IFN or IFN ⁇ -inducible genes in a control sample.
- the agent that binds to and modulates type I IFN or IFN ⁇ activity is a biologic agent, such as an antibody
- the agent may neutralize the type I IFN or IFN ⁇ profile at doses of 0.3 to 30 mg/kg, 0.3 to 10 mg/kg, 0.3 to 3 mg/kg, 0.3 to 1 mg/kg, 1 to 30 mg/kg, 3 to 30 mg/kg, 5 to 30 mg/kg, 10 to 30 mg/kg, 1 to 10 mg/kg, 3 to 10 mg/kg, or 1 to 5 mg/kg.
- Neutralization of the type I IFN or IFN ⁇ -inducible profile may be increased expression of at least one, at least two, at least three, at least five, at least seven, at least eight, at least ten, at least twelve, at least fifteen, at least twenty, at least twenty five, at least thirty, at least thirty five, at least forty, at least forty five, or at least fifty genes whose expression is reduced by type I IFN or IFN ⁇ .
- the genes whose expression is reduced by type I IFN or IFN ⁇ may be any group of genes in FIGS. 235-381 or as discussed above.
- Neutralization of down-regulated genes in a type I IFN or IFN ⁇ -inducible profile may be an increase of at least 2%, at least 3%, at least 4%, at least 5%, at least 7%, at least 8%, at least 10%, at least 15%, at least 25%, at least 30%, at least 35%, at least 40%, at least 45%, at least 50%, at least 60%, at least 70%, at least 75%, at least 80%, or at least 90%, or at least 100%, or at least 125%, or at least 130%, or at least 140%, or at least 150%, or at least 175%, or at least 200%, or at least 250%, or at least 300%, or at least 500% of any of the at least one, at least two, at least three, at least five, at least seven, at least eight, at least ten, at least twelve, at least fifteen, at least twenty, or at least twenty five genes whose expression is downregulated in any type I IFN or IFN ⁇ -inducible profile.
- neutralization of the type I IFN or IFN ⁇ -inducible profile refers to an increase in expression of type I IFN or IFN ⁇ -inducible genes to within at most 50%, at most 45%, at most 40%, at most 35%, at most 30%, at most 25%, at most 20%, at most 15%, at most 10%, at most 5%, at most 4%, at most 3%, at most 2%, or at most 1% of expression levels of those type I IFN or IFN ⁇ -inducible (downregulated) genes in a control sample.
- the agent that binds to and modulates type I IFN or IFN ⁇ activity is a biologic agent, such as an antibody
- the agent may neutralize the type I IFN or IFN ⁇ profile at doses of 0.3 to 30 mg/kg, 0.3 to 10 mg/kg, 0.3 to 3 mg/kg, 0.3 to 1 mg/kg, 1 to 30 mg/kg, 3 to 30 mg/kg, 5 to 30 mg/kg, 10 to 30 mg/kg, 1 to 10 mg/kg, 3 to 10 mg/kg, or 1 to 5 mg/kg.
- the agent that binds to and modulates type I IFN or IFN ⁇ activity may further or alternatively neutralize expression of one or more type I IFN or IFN ⁇ subtypes.
- the IFN ⁇ or type-I IFN subtypes may include any more than one, more than two, more than three, more than four, more than five, more than six, more than seven, more than eight, more than nine, or more than ten IFN ⁇ or type-I IFN subtypes. These subtypes may include IFN ⁇ 1, IFN ⁇ 2, IFN ⁇ 4, IFN ⁇ 5, IFN ⁇ 6, IFN ⁇ 7, IFN ⁇ 8, IFN ⁇ 10, IFN ⁇ 14, IFN ⁇ 17, IFN ⁇ 21, IFN ⁇ , or IFN ⁇ .
- subtypes may include all of IFN ⁇ 1, IFN ⁇ 2, IFN ⁇ 8, and IFN ⁇ 14.
- these subtypes may include IFN ⁇ 1, IFN ⁇ 2, IFN ⁇ 4, IFN ⁇ 5, IFN ⁇ 8, IFN ⁇ 10, IFN ⁇ 21.
- Neutralization of the IFN ⁇ or type-I IFN subtypes may be a reduction of at least 2%, at least 3%, at least 4%, at least 5%, at least 7%, at least 8%, at least 10%, at least 15%, at least 25%, at least 30%, at least 35%, at least 40%, at least 45%, at least 50%, at least 60%, at least 70%, at least 75%, at least 80%, or at least 90% of any of the at least one, at least two, at least three, at least five, at least seven, at least eight, or at least ten of the subtypes.
- Neutralization of the IFN ⁇ or type-I IFN subtypes may be a reduction in expression of IFN ⁇ or type-I IFN subtype genes that is within at most 50%, at most 45%, at most 40%, at most 35%, at most 30%, at most 25%, at most 20%, at most 15%, at most 10%, at most 5%, at most 4%, at most 3%, at most 2%, or at most 1% of expression levels of those IFN ⁇ or type I IFN subtypes in a control sample.
- the agent that binds to and modulates IFN ⁇ activity or type I IFN activity is a biologic agent, such as an antibody
- the agent may neutralize the IFN ⁇ or type I IFN subtypes at doses of 0.3 to 30 mg/kg, 0.3 to 10 mg/kg, 0.3 to 3 mg/kg, 0.3 to 1 mg/kg, 1 to 30 mg/kg, 3 to 30 mg/kg, 5 to 30 mg/kg, 10 to 30 mg/kg, 1 to 10 mg/kg, 3 to 10 mg/kg, or 1 to 5 mg/kg.
- the agent that binds to and modulates type I IFN or IFN ⁇ activity may further or alternatively neutralize expression of IFN ⁇ receptors, either IFNAR1 or IFNAR2, or both, or TNF ⁇ , or IFN ⁇ , or IFN ⁇ receptors (either IFNGR1, IFNGR2, or both IFNGR1 and IFNGR2).
- Neutralization of expression of IFN ⁇ receptors may be a reduction of at least 2%, at least 3%, at least 4%, at least 5%, at least 7%, at least 8%, at least 10%, at least 15%, at least 25%, at least 30%, at least 35%, at least 40%, at least 45%, at least 50%, at least 60%, at least 70%, at least 75%, at least 80%, or at least 90% of any of the at least one, at least two, at least three, at least five, or at least six of these genes.
- IFN ⁇ receptors either IFNAR1 or IFNAR2, or TNF ⁇ , or IFN ⁇ , or IFN ⁇ receptors (either IFNGR1, IFNGR2, or both IFNGR1 and IFNGR2) is a reduction of expression of at most 50%, at most 45%, at most 40%, at most 35%, at most 30%, at most 25%, at most 20%, at most 15%, at most 10%, at most 5%, at most 4%, at most 3%, at most 2%, or at most 1% of expression levels of these genes in a control sample.
- the agent that binds to and modulates type I IFN or IFN ⁇ activity is a biologic agent, such as an antibody
- the agent may neutralize expression of IFN ⁇ receptors IFNAR1 or IFNAR2, or TNF ⁇ , or IFN ⁇ , or IFN ⁇ receptors IFNGR1 or IFNGR2 at doses of 0.3 to 30 mg/kg, 0.3 to 10 mg/kg, 0.3 to 3 mg/kg, 0.3 to 1 mg/kg, 1 to 30 mg/kg, 3 to 30 mg/kg, 5 to 30 mg/kg, 10 to 30 mg/kg, 1 to 10 mg/kg, 3 to 10 mg/kg, or 1 to 5 mg/kg.
- the agent that binds to and modulates type I IFN or IFN ⁇ activity may further or alternatively neutralize alterations of levels of proteins in serum, e.g., increase levels of those proteins whose serum levels are downregulated or decrease levels of those proteins whose serum levels are upregulated to levels closer to those of control subjects.
- Neutralization of expression of proteins in serum may be by bringing the level of at least one, at least two, at least three, at least five, at least six, at least seven, at least eight, at least nine, at least ten, at least twelve, at least fifteen, at least twenty proteins in serum, such as adiponectin, alpha-fetoprotein, apolipoprotein CIII, beta-2 microglobulin, cancer antigen 125, cancer antigen 19-9, eotaxin, FABP, factor VII, ferritin, IL-10, IL-12p70, IL-16, IL-18, IL-1ra, IL-3, MCP-1, MMP-3, myoglobin, SGOT, tissue factor, TIMP-1, TNF RII, TNF-alpha, VCAM-1, vWF, BDNK, complement 3, CD40 ligand, EGF, ENA-78, EN-RAGE, IGF-1, MDC, myeloperoxidase, RANTES, or thrombopo
- the agent that binds to and modulates type I IFN or IFN ⁇ activity is a biologic agent, such as an antibody
- the agent may neutralize levels of the serum proteins, e.g., adiponectin, alpha-fetoprotein, apolipoprotein CIII, beta-2 microglobulin, cancer antigen 125, cancer antigen 19-9, eotaxin, FABP, factor VII, ferritin, IL-10, IL-12p70, IL-16, IL-18, IL-1ra, IL-3, MCP-1, MMP-3, myoglobin, SGOT, tissue factor, TIMP-1, TNF RII, TNF-alpha, VCAM-1, vWF, BDNK, complement 3, CD40 ligand, EGF, ENA-78, EN-RAGE, IGF-1, MDC, myeloperoxidase, RANTES, or thrombopoietin, at doses of 0.3 to 30 mg/kg, 0.3 to 10 mg/
- the agent that binds to and modulates type I IFN or IFN ⁇ activity may further or alternatively reduce number or level of auto-antibodies that bind to any one, any at least 2, any at least 3, any at least 4, any at least 5, any at least 6, any at least 7, any at least 8, any at least 9, any at least 10, any at least 15, or any at least 20 of the following auto-antigens: (a) Myxovirus (influenza virus) resistance 1, interferon-inducible protein p78; (b) surfeit 5, transcript variant c; (c) proteasome (posome, macropain) activator subunit 3 (PA28 gamma; Ki) transc; (d) retinoic acid receptor, alpha; (e) Heat shock 10 kDa protein 1 (chaperonin 10); (f) tropomyosin 3; (g) pleckstrin homology-like domain, family A, member 1; (h) cytoskeleton-associated protein 1; (i) Sjogren syndrome antigen A2 (
- nidulans (1) MutL homolog 1, colon cancer, nonpolyposis type 2 ( E. coli ); (m) leucine rich repeat (in FLII) interacting protein 2; (n) tropomyosin 1 (alpha); (o) spastic paraplegia 20, spartin (Troyer syndrome); (p) preimplantation protein, transcript variant 1; (r) mitochondrial ribosomal protein L45; (s) Lin-28 homolog ( C. elegans ); (t) heat shock 90 kDa protein 1, alpha; (u) dom-3 homolog Z ( C.
- Reduction in level of auto-antibody may be a reduction of at least 2%, at least 3%, at least 4%, at least 5%, at least 7%, at least 8%, at least 10%, at least 15%, at least 25%, at least 30%, at least 35%, at least 40%, at least 45%, at least 50%, at least 60%, at least 70%, at least 75%, at least 80%, or at least 90% in presence of any of the auto-antibodies.
- the agent that binds to and modulates type I IFN or IFN ⁇ activity is a biologic agent, such as an antibody
- the agent may reduce number or level or auto-antibodies at doses of 0.3 to 30 mg/kg, 0.3 to 10 mg/kg, 0.3 to 3 mg/kg, 0.3 to 1 mg/kg, 1 to 30 mg/kg, 3 to 30 mg/kg, 5 to 30 mg/kg, 10 to 30 mg/kg, 1 to 10 mg/kg, 3 to 10 mg/kg, or 1 to 5 mg/kg.
- the agent that binds to and modulates type I IFN or IFN ⁇ activity may not neutralize expression of genes that are not included in an interferon-inducible signature or PD marker profile.
- Monitoring disease progression may be performed by obtaining patient samples before and after administration of an agent, e.g., an agent that binds to and modulates type I IFN or IFN ⁇ activity, or an agent that binds to and does not modulate type I IFN or IFN ⁇ activity, or a combination of agents that may or may not include an agent that binds to and modulates type I IFN or IFN ⁇ activity.
- Samples include any biological fluid or tissue, such as whole blood, saliva, urine, synovial fluid, bone marrow, cerebrospinal fluid, nasal secretions, sputum, amniotic fluid, bronchoalveolar lavage fluid, peripheral blood mononuclear cells, total white blood cells, lymph node cells, spleen cells, tonsil cells, or skin.
- the samples may be obtained by any means known in the art.
- Type I IFN or IFN ⁇ inducible PD marker expression profiles are obtained in the (before and after agent administration) samples.
- the type I IFN or IFN ⁇ inducible PD marker expression profiles in the samples are compared. Comparison may be of the number of type I IFN or IFN ⁇ inducible PD markers present in the samples or may be of the quantity of type I IFN or IFN ⁇ inducible PD markers present in the samples, or any combination thereof.
- Variance indicating efficacy of the therapeutic agent may be indicated if the number or level (or any combination thereof) of up-regulated type I IFN or IFN ⁇ inducible PD markers decreases in the sample obtained after administration of the therapeutic agent relative to the sample obtained before administration of the therapeutic agent.
- the number of up-regulated type I IFN or IFN ⁇ inducible PD markers may decrease by at least 1, at least 2, at least 3, at least 4, at least 5, at least 6, at least 7, at least 8, at least 9, or at least 10.
- the level of any given up-regulated type I IFN or IFN ⁇ inducible PD marker may decrease by at least 10%, at least 20%, at least 25%, at least 30%, at least 35%, at least 40%, at least 50%, at least 60%, at least 70%, at least 80%, at least 90%, or at least 95%.
- the number of up-regulated type I IFN or IFN ⁇ inducible PD markers with decreased levels may be at least 1, at least 2, at least 3, at least 4, at least 5, at least 6, at least 7, at least 8, at least 9, at least 10, at least 15, at least 20, at least 25, at least 30, or at least 35. Any combination of decreased number and decreased level of up-regulated type I IFN or IFN ⁇ inducible PD markers may indicate efficacy. Variance indicating efficacy of the therapeutic agent may be indicated if the number or level (or any combination thereof) of down-regulated type I IFN or IFN ⁇ inducible PD markers decreases in the sample obtained after administration of the therapeutic agent relative to the sample obtained before administration of the therapeutic agent.
- the number of down-regulated type I IFN or IFN ⁇ inducible PD markers may decrease by at least 1, at least 2, at least 3, at least 4, at least 5, at least 6, at least 7, at least 8, at least 9, or at least 10.
- the level of any given down-regulated type I IFN or IFN ⁇ inducible PD marker may increase by at least 10%, at least 20%, at least 25%, at least 30%, at least 35%, at least 40%, at least 50%, at least 60%, at least 70%, at least 80%, at least 90%, or at least 95%.
- the number of down-regulated type I IFN or IFN ⁇ inducible PD markers with increased levels may be at least 1, at least 2, at least 3, at least 4, at least 5, at least 6, at least 7, at least 8, at least 9, at least 10, at least 15, at least 20, at least 25, at least 30, or at least 35. Any combination of decreased number and increased level of down-regulated type I IFN or IFN ⁇ inducible PD markers may indicate efficacy.
- the sample obtained from the patient may be obtained prior to a first administration of the agent, i.e., the patient is na ⁇ ve to the agent.
- the sample obtained from the patient may occur after administration of the agent in the course of treatment.
- the agent may have been administered prior to the initiation of the monitoring protocol.
- an additional samples may be obtained from the patient and type I IFN or IFN ⁇ inducible PD markers in the samples are compared.
- the samples may be of the same or different type, e.g., each sample obtained may be a blood sample, or each sample obtained may be a serum sample.
- the type I IFN or IFN ⁇ inducible PD markers detected in each sample may be the same, may overlap substantially, or may be similar.
- the samples may be obtained at any time before and after the administration of the therapeutic agent.
- the sample obtained after administration of the therapeutic agent may be obtained at least 2, at least 3, at least 4, at least 5, at least 6, at least 7, at least 8, at least 9, at least 10, at least 12, or at least 14 days after administration of the therapeutic agent.
- the sample obtained after administration of the therapeutic agent may be obtained at least 2, at least 3, at least 4, at least 5, at least 6, at least 7, or at least 8 weeks after administration of the therapeutic agent.
- the sample obtained after administration of the therapeutic agent may be obtained at least 2, at least 3, at least 4, at least 5, or at least 6 months following administration of the therapeutic agent.
- Additional samples may be obtained from the patient following administration of the therapeutic agent.
- At least 2, at least 3, at least 4, at least 5, at least 6, at least 7, at least 8, at least 9, at least 10, at least 12, at least 15, at least 20, at least 25 samples may be obtained from the patient to monitor progression or regression of the disease or disorder over time.
- Disease progression may be monitored over a time period of at least 1 week, at least 2 weeks, at least 3 weeks, at least 4 weeks, at least 5 weeks, at least 6 weeks, at least 7 weeks, at least 2 months, at least 3 months, at least 4 months, at least 5 months, at least 6 months, at least 1 year, at least 2 years, at least 3 years, at least 4 years, at least 5 years, at least 10 years, or over the lifetime of the patient.
- Additional samples may be obtained from the patient at regular intervals such as at monthly, bi-monthly, once a quarter year, twice a year, or yearly intervals.
- the samples may be obtained from the patient following administration of the agent at regular intervals. For instance, the samples may be obtained from the patient at one week following each administration of the agent, or at two weeks following each administration of the agent, or at three weeks following each administration of the agent, or at one month following each administration of the agent, or at two months following each administration of the agent.
- multiple samples may be obtained from the patient following an or each administration of the agent.
- Disease progression in a patient may similarly be monitored in the absence of administration of an agent.
- Samples may periodically be obtained from the patient having the disease or disorder.
- Disease progression may be identified if the number of type I IFN or IFN ⁇ inducible PD markers increases in a later-obtained sample relative to an earlier obtained sample.
- the number of type I IFN or IFN ⁇ inducible PD markers may increase by at least 1, at least 2, at least 3, at least 4, at least 5, at least 6, at least 7, at least 8, at least 9, or at least 10.
- Disease progression may be identified if level of any given up-regulated type I IFN or IFN ⁇ inducible PD marker increases by at least 10%, at least 20%, at least 25%, at least 30%, at least 35%, at least 40%, at least 50%, at least 60%, at least 70%, at least 80%, at least 90%, or at least 95%.
- Disease progression may be identified if level of any given down-regulated type I IFN or IFN ⁇ inducible PD marker decreases by at least 10%, at least 20%, at least 25%, at least 30%, at least 35%, at least 40%, at least 50%, at least 60%, at least 70%, at least 80%, at least 90%, or at least 95%.
- the number of up-regulated type I IFN or IFN ⁇ inducible PD markers with increased levels may be at least 1, at least 2, at least 3, at least 4, at least 5, at least 6, at least 7, at least 8, at least 9, at least 10, at least 15, at least 20, at least 25, at least 30, or at least 35.
- the number of down-regulated type I IFN or IFN ⁇ inducible PD markers with decreased levels may be at least 1, at least 2, at least 3, at least 4, at least 5, at least 6, at least 7, at least 8, at least 9, at least 10, at least 15, at least 20, at least 25, at least 30, or at least 35. Any combination of increased number and increased level of up-regulated type I IFN or IFN ⁇ inducible PD marker may indicate disease progression.
- any combination of decreased number and decreased level of down-regulated type I IFN or IFN ⁇ inducible PD marker may indicate disease progression.
- Disease regression may also be identified in a patient having a disease or disorder, not treated by an agent. In this instance, regression may be identified if the number of type I IFN or IFN ⁇ inducible PD markers decreases in a later-obtained sample relative to an earlier obtained sample.
- the number of type I IFN or IFN ⁇ inducible PD markers may decrease by at least 1, at least 2, at least 3, at least 4, at least 5, at least 6, at least 7, at least 8, at least 9, or at least 10.
- Disease regression may be identified if level of any given up-regulated type I IFN or IFN ⁇ inducible PD marker decreases by at least 10%, at least 20%, at least 25%, at least 30%, at least 35%, at least 40%, at least 50%, at least 60%, at least 70%, at least 80%, at least 90%, or at least 95%.
- Disease regression may be identified if level of any given down-regulated type I IFN or IFN ⁇ inducible PD marker increases by at least 10%, at least 20%, at least 25%, at least 30%, at least 35%, at least 40%, at least 50%, at least 60%, at least 70%, at least 80%, at least 90%, or at least 95%.
- the number of up-regulated type I IFN or IFN ⁇ inducible PD markers with decreased levels may be at least 1, at least 2, at least 3, at least 4, at least 5, at least 6, at least 7, at least 8, at least 9, at least 10, at least 15, at least 20, at least 25, at least 30, or at least 35.
- the number of down-regulated type I IFN or IFN ⁇ inducible PD markers with increased levels may be at least 1, at least 2, at least 3, at least 4, at least 5, at least 6, at least 7, at least 8, at least 9, at least 10, at least 15, at least 20, at least 25, at least 30, or at least 35.
- Disease progression or disease regression may be monitored by obtaining samples over any period of time and at any interval.
- Disease progression or disease regression may be monitored by obtaining samples over the course of at least 1 week, at least 2 weeks, at least 3 weeks, at least 4 weeks, at least 5 weeks, at least 6 weeks, at least 7 weeks, at least 2 months, at least 3 months, at least 4 months, at least 5 months, at least 6 months, at least 1 year, at least 2 years, at least 3 years, at least 4 years, at least 5 years, at least 10 years, or over the lifetime of the patient.
- Disease progression or disease regression may be monitored by obtaining samples at least monthly, bi-monthly, once a quarter year, twice a year, or yearly. The samples need not be obtained at strict intervals.
- the invention also encompasses kits and probes.
- the probes may be any molecule that detects any expression or activity of any gene that may be included in an IFN ⁇ -inducible PD marker expression profile.
- DM muscle samples were examined to determine which genes were most up-regulated in DM patients.
- RNA extraction and microarray processing Total RNA was extracted from PAXgene muscle biopsies using the Qiagen RNeasy Fibrous Tissue Mini (Hilden, Germany). RNA purity and concentration were determined spectrophotometrically (260/280>1.9). RNA quality was assessed on an Agilent 2100 Bioanalyzer using the RNA 6000 Nano LabChip®.
- biotin-labeled amplified cRNA from 2 ug of total RNA, was accomplished with the Affymetrix GeneChip® One-Cycle cDNA Synthesis kit and the Affymetrix GeneChip® IVT Labeling kit. Concentration and purity of the cRNA product were determined spectrophotometrically. Twenty micrograms of each biotin-labeled cRNA was fragmented for hybridization on Affymetrix Human Genome U133 Plus 2.0 GeneChip® arrays. Fragmented cRNA was prepared for hybridization as outlined in the Affymetrix GeneChip® manual. Hybridization was conducted overnight in a model 320 rotating hybridization oven set at 45° C.
- Results The majority of the most up-regulated genes in muscle specimens of DM patients are IFN ⁇ / ⁇ -inducible. See FIG. 1 a , which provides a list of the most up-regulated genes in the DM patient muscle samples, and fold-up-regulation of those genes in the DM patient muscle samples relative to healthy control muscle samples. See also FIG. 1 b which provides a scatter plot of the IFN ⁇ / ⁇ -inducible gene signature score in muscle of DM and PM patients.
- Patient and patient samples Two groups of patients were used in this study. The first group included 24 myositis patients (15 with DM and 9 with PM) from a single hospital center prospectively enrolled into a longitudinal exploratory study of the association between whole genome gene expression in peripheral WB samples and clinical features including disease activity. Clinical data from a total of 150 patient-visits and gene expression data from 80 patient-visits were collected over a period of up to 6 years (mean period of participation in this study was 1.9 years). Clinical features of those patients are summarized in Table 6, below.
- WB samples were collected at routine clinical follow-up visits. Disease activity was assessed at each visit using the Myositis Intention to Treat scale (MITAX) as previously described (Walsh R J, Pinkus J L, et al. Type I interferon-inducible gene expression in blood is present and reflects disease activity in dermatomyositis and polymyositis. Arthritis Rheum. 2007; 56(11):3784-92). Clinical parameters, including the MITAX score (Rider L G, Miller F W. Idiopathic inflammatory muscle disease: clinical aspects. Baillieres Best Pract Res Clin Rheumatol. 2000; 14(1):37-54), were assessed blinded to gene expression data. WB samples were not collected according to any predefined schedule. Patients gave informed consent in order to participate. These studies were approved by institutional review board (IRB) at Brigham and Women's Hospital.
- MIITAX Myositis Intention to Treat scale
- the second group of myositis patients (18) was studied for single blood samples obtained at screening visits for a clinical trial in patients with DM or PM. These blood samples were used for initial evaluation of the prevalence of cytokine-inducible gene signatures across patients seen by multiple investigators at multiple centers, and were collected with informed consent under IRB approved protocols. These subjects were at least 18 years of age and had probable or definite DM or PM according to the Bohan and Peter criteria (Bohan A, Peter J B. Polymyositis and dermatomyositis. N Engl J Med. 1975 Feb. 13; 292(7):344-7; Bohan A, Peter J B. Polymyositis and dermatomyositis. N Engl J Med. 1975 Feb.
- WB samples were collected in PAXgene RNA tubes at clinical visits prior to treatment. All subjects had to have at least 2 of the following: strength in manual muscle testing (MMT) ⁇ 80/150 but ⁇ 125/150 using the MMT-8 muscle group testing; patient global activity assessment by visual analogue scale ⁇ 2.0 cm on a 10-cm scale; physician global activity assessment by visual analogue scale ⁇ 2.0 cm on a 10-cm scale, CLINHQA disability index ⁇ 0.25; and global extramuscular activity assessment ⁇ 1.0 on a 10 cm visual analogue scale. Subjects with PM were required to have documentation of a muscle biopsy result consistent with the diagnosis of PM.
- MMT manual muscle testing
- subjects could not be receiving >35 mg prednisone or equivalent per day, hydroxychloroquine >600 mg/day, mycophenolate mofetil >3 g/day, methotrexate >25 mg/week, azathioprine >3 mg/kg/day, leflunomide >20 mg/day, or any dose of cyclophosphamide, cyclosporine, or thalidomide.
- RNA isolation from WB used PAXgene tubes or buffy coat samples were carried out as previously described (Yao, Y, Jallal J, et al. Development of Potential Pharmacodynamic and Diagnostic Markers for Anti-IFN- ⁇ Monoclonal Antibody Trials in Systemic Lupus Erythematosus. Human Genomics and Proteomics. 2008; Volume 2009, Article ID 374312, doi:10.4061/2009/374312; Walsh R J, Pinkus J L, et al.
- Fluidigm's Biomark system dynamic array platform (Fluidigm Corp, South San Francisco, Calif., USA) was used to measure expression levels of the type 1 IFN-inducible genes, a panel of cytokine-inducible genes, and selected immune response genes in the WB of 15 patients with DM or PM.
- the general procedures for sample processing and data analysis were as described previously (Yao, Y, Jallal J, et al. Development of Potential Pharmacodynamic and Diagnostic Markers for Anti-IFN- ⁇ Monoclonal Antibody Trials in Systemic Lupus Erythematosus. Human Genomics and Proteomics. 2008; Volume 2009, Article ID 374312, doi:10.4061/2009/374312).
- Microarray data analysis was performed as previously described (Yao, Y, Jallal J, et al. Development of Potential Pharmacodynamic and Diagnostic Markers for Anti-IFN- ⁇ Monoclonal Antibody Trials in Systemic Lupus Erythematosus. Human Genomics and Proteomics. 2008; Volume 2009, Article ID 374312, doi:10.4061/2009/374312; Yao Y, Jallal J, et al. Type I IFN as a potential therapeutic target for psoriasis. PLoS ONE 2008; 3(7): e2737.
- GCRMA GC-Content Robust Multichip Analysis
- Affymetrix human genome U133 plus 2.0 GeneChip® was employed to profile the peripheral WB of 42 patients with DM or PM (22 DM and 20 PM patients; from first and second patient groups).
- 1,072 and 703 transcripts were observed to be upregulated and downregulated (fold change >2, q ⁇ 0.05), respectively, in the blood of patients with DM or PM compared with healthy controls.
- 136 were type 1 IFN-inducible as defined by ex vivo stimulation of WB with type I IFN family members as described (Yao, Y, Jallal J, et al. Development of Potential Pharmacodynamic and Diagnostic Markers for Anti-IFN- ⁇ Monoclonal Antibody Trials in Systemic Lupus Erythematosus.
- FIG. 384 a A heatmap visualizing the expression of the 136 transcripts in WB of 42 patients with DM or PM, as compared to 24 healthy controls, is shown in FIG. 384 a .
- the patients evaluated in the study exhibited different degrees of overexpression of type 1 IFN-inducible genes in the blood, and this included a distinct population of patients with DM or PM that had weak type 1 IFN-inducible gene signatures (score ⁇ 4). Normal donors and these weak signature score patients are represented by the first and second horizontal bars, respectively, in FIG. 384 b .
- classification criteria in which a type 1 IFN-inducible gene signature was weak if it was assigned a score of less than 4, moderate if it was assigned a score that was greater than or equal to 4 but less than 10, and high if it was assigned a score greater than or equal to 10.
- 17% of patients with DM or PM had weak or no overexpression of type 1 IFN-inducible gene signature in the blood.
- a total of 45% and 38% of the patients had moderate or high type 1 IFN-inducible gene signatures, respectively.
- the overwhelming majority of patients with DM or PM showed moderate to high overexpression of type 1 IFN-inducible gene signature in the
- Example lb Based on the results of Example lb, a small panel of type 1 IFN-inducible genes was selected that could be used to evaluate the activation of the type 1 IFN signaling pathway in the blood of DM and PM patients.
- the thirteen overexpressed type 1 IFN-inducible genes were selected from this group in order to construct a type 1 IFN-inducible gene signature score reflecting type 1 IFN signaling pathway activation in the blood of DM and PM patients.
- the 13 selected genes were: the 6 most overexpressed type 1 IFN-inducible genes in the blood of DM and PM patients (IF127, RSAD2, IF144L, IF144, OAST, IFIT1), plus ISG15, one of the most overexpressed type 1 IFN-inducible genes in DM muscle specimens (Greenberg SA, Tawil R, et al. Interferon-alpha/beta-mediated innate immune mechanisms in dermatomyositis.
- Ten different regression models were fit where MITAX score (low and high disease activity as defined previously) was regressed on the following, all modeled as random effects: 13-gene composite score, RSAD2, IF127, IF144, and IF144L.
- Treatment status at the initial visit was used as a binary covariate (i.e., any treatment/no treatment) and modeled as a fixed effect in each model in order to control for the influence of medication on gene expression changes.
- DM and PM patients from a study separate from Example lb-d patients, were likewise monitored to determine whether disease progression and/or regression could be predicted by changes in IFN ⁇ / ⁇ -inducible gene signature.
- RNA extraction and microarray processing Total RNA was extracted from PAXgene blood using the PAXgene Blood RNA kit. RNA purity and concentration were determined spectrophotometrically (260/280 >1.9). RNA quality was assessed on an Agilent 2100 Bioanalyzer using the RNA 6000 Nano LabChip®.
- biotin-labeled amplified cRNA from 2ug of total RNA, was accomplished with the Affymetrix GeneChip® One-Cycle cDNA Synthesis kit and the Affymetrix GeneChip® IVT Labeling kit. Concentration and purity of the cRNA product were determined spectrophotometrically. Twenty micrograms of each biotin-labeled cRNA was fragmented for hybridization on Affymetrix Human Genome U133 Plus 2.0 GeneChip® arrays. Fragmented cRNA was prepared for hybridization as outlined in the Affymetrix GeneChip® manual. Hybridization was conducted overnight in a model 320 rotating hybridization oven set at 45° C.
- Serum CK levels were obtained from Steven Greenberg (Brigham and Women's Hospital, Inc.).
- 21 genes were identified by their prevalence and magnitude of overexpression in Myositis patients as compared to those of normal controls. It includes a standard list of the same 21 genes (i.e. 21 probes that map to 21 unique genes) for each Myositis patient.
- DNAPTP6 DNA polymerase-transactivated protein 6
- EPSTI1 epithelial stromal interaction 1
- hect domain and RLD 5 HERC5
- interferon alpha-inducible protein 27—IF127; Interferon-induced protein 44—IF144; interferon-induced protein 44-like—IF144L; interferon, alpha-inducible protein 6—IF16; interferon-induced protein with tetratricopeptide repeats 1—IFIT1; interferon-induced protein with tetratricopeptide repeats 3—IFIT3; ISG15 ubiquitin-like modifier; lysosomal-associated membrane protein 3—LAMP3; lymphocyte antigen 6 complex, locus E—LY6E; myxovirus (influenza virus) resistance 1, interferon-inducible protein p78—MX1; 2′,5′-oligoadenylate synthetase 1, 40/46 kDa—O
- the fold change is calculated between Myositis patients at day 0 (predose) and the average of 24 normal healthy controls. The median of these 21 fold change values is then computed for each Myositis patient and this value is used as the IFN- ⁇ / ⁇ -inducible gene signature score.
- TNF ⁇ , IL1 ⁇ , IL4, IL10, and IL13 gene signatures Calculation of TNF ⁇ , IL1 ⁇ ,l IL4, IL10, and IL13 gene signatures were calculated similarly to way that the IFN- ⁇ / ⁇ -inducible gene signature. However, because the initial number of cytokine-inducible genes that were identified differs for each cytokine, the percentage rather than absolute number of genes was used. For example, using the IFN- ⁇ / ⁇ -inducible gene signature as the standard, the top 25 of the 807 genes were selected for each patient (dynamic gene list). This represents approximately 3.5% of the IFN- ⁇ / ⁇ -inducible genes determined.
- the IL1 ⁇ genes from which the IL1 ⁇ signature was derived included: zinc finger CCCH-type containing 12A—ZC3H12A; ureidopropionase, beta—UPB1; SAM domain, SH3 domain and nuclear localisation signals, 1—SAMSN1; nuclear factor of kappa light polypeptide gene enhancer in B-cells inhibitor, zeta—NFKBIZ; pentraxin-related gene, rapidly induced by IL-1 beta—PTX3; peptidase inhibitor 3, skin-derived (SKALP)—PI3; IBR domain containing 2—IBRDC2; ATG7 autophagy related 7 homolog ( S.
- SKALP skin-derived
- v-rel reticuloendotheliosis viral oncogene homolog B nuclear factor of kappa light polypeptide gene enhancer in B-cells 3 (avian)—RELB
- G protein-coupled receptor 157 GPR157
- oligodendrocyte transcription factor 1 similar to oligodendrocyte transcription factor 1 /// similar to oligodendrocyte transcription factor 1—OLIG1;/// LOC728598///; LOC732056—6355; Thrombospondin 1—THBS1
- TNF ⁇ genes from which the TNF ⁇ signature was derived included: C-type lectin domain family 4, member D—CLEC4D; DENN/MADD domain containing 4A—DENND4A; phosphoinositide-3-kinase adaptor protein 1—PIK3AP1; interferon induced with helicase C domain 1—IFIH1; SAM domain, SH3 domain and nuclear localization signals 1—SAMSN1; guanine nucleotide binding protein (G protein), gamma 2—GNG2; Hypothetical protein LOC149478—LOC149478; CDNA F1132866 fis, clone TESTI2003718; hypothetical protein LOC389072—LOC389072; LIM domain kinase 2—LIMK2; RNA binding motif, single stranded interacting protein 1—RBMS1; hypothetical protein LOC731424—LOC731424; cytoskeleton-associated protein 4—CKAP4; acidic (leucine-rich)
- the IL4 genes from which the IL4 signature was derived included: the genes listed and annotated on FIGS. 11-104
- the IL10 genes from which the IL10 signature was derived included: the genes listed and annotated on FIGS. 105-158 .
- the IL 13 gene from which the IL 13 signature was derived included: the genes listed and annotated on FIGS. 159-234 .
- FIG. 2 a shows that the IFN ⁇ / ⁇ -inducible gene signature of DM and PM patients is higher in those with active disease relative to those that are improving.
- FIG. 2 b provides the IFN ⁇ / ⁇ -inducible gene signature of individual DM patients in paired samples, one obtained during active disease and one obtained during disease improvement. The IFN ⁇ / ⁇ -inducible gene signature of DM patients decreased as the DM patients exhibited disease improvement.
- FIG. 2 a shows that the IFN ⁇ / ⁇ -inducible gene signature of DM and PM patients is higher in those with active disease relative to those that are improving.
- FIG. 2 b provides the IFN ⁇ / ⁇ -inducible gene signature of individual DM patients in paired samples, one obtained during active disease and one obtained during disease improvement.
- the IFN ⁇ / ⁇ -inducible gene signature of DM patients decreased as the DM patients exhibited disease improvement.
- FIG. 3 provides the IFN ⁇ / ⁇ -inducible gene signature in whole blood of three other DM patients that showed clinical improvement over the course of two visits with a physician. For each of the three patients ((a), (b), and (c)) the IFN ⁇ / ⁇ -inducible gene signature deceased as the patient clinically improved. This correlation of cytokine gene signature score with clinical improvement was not observed for other cytokine gene signatures (TNF ⁇ , IL1 ⁇ , IL4, IL 10, or IL 13).
- FIG. 4 provides changes in the IFN ⁇ / ⁇ -inducible gene signature of a DM patient. The IFN ⁇ / ⁇ -inducible gene signature increases as the patient's condition worsens clinically and decreases as the patient's condition improves clinically.
- FIG. 4 provides changes in the IFN ⁇ / ⁇ -inducible gene signature of a DM patient. The IFN ⁇ / ⁇ -inducible gene signature increases as the patient's condition worsens clinically and decreases as the patient's condition improves clinically.
- FIG. 5 furthers show correlation of IFN ⁇ / ⁇ -inducible gene signature and serum CK level in a PM patient.
- FIGS. 6 and 7 show correlation of clinical disease, serum CK activity, and IFN ⁇ / ⁇ -inducible gene signature in a DM patient.
- FIG. 6 provides the tight correlation between the IFN ⁇ / ⁇ -inducible gene signature and serum CK activity.
- FIG. 7 further correlates the IFN ⁇ / ⁇ -inducible gene signature and clinical disease course of the patient.
- TNF- ⁇ , IL-1 ⁇ , GM-CSF, IL-10, and IL-13 Signaling Pathways are Activated in DM and PM Patients, but not Correlated with Disease Activity
- FIG. 388 a shows the composite cytokine-inducible gene signature scores for TNF- ⁇ , IL-1 ⁇ , IL-10, IL-13 and GM-CSF, respectively, in WB of 36 healthy normal controls, and in DM and PM patients with low and high disease activity (patients discussed in Examples 1b-1d).
- cytokine-inducible genes signature scores of type 1 IFN, GM-CSF, IL-10, IL-13, IL-1 ⁇ , and TNF- ⁇ were calculated as described (Yao, Y, Jallal J, et al. Development of Potential Pharmacodynamic and Diagnostic Markers for Anti-IFN- ⁇ Monoclonal Antibody Trials in Systemic Lupus Erythematosus. Human Genomics and Proteomics. 2008;Volume 2009, Article ID 374312, doi:10.4061/2009/374312; Yao, Y, Jallal J, et al.
- FIG. 389 shows the cytokine-inducible gene signature scores of all 24 patients stratified by high disease and low disease activity. Suppression of type 1 IFN-inducible genes was universal for patients who showed improvement in disease activity while it was not the case for the TNF- ⁇ , IL-1 ⁇ , IL-10, IL-13 and GM-CSF inducible gene signatures.
- IFN ⁇ / ⁇ -inducible gene signature is overexpressed in IBM patient muscle and whole blood samples.
- Total RNA extraction and microarray processing Total RNA was extracted from PAXgene blood and muscle biopsies using the PAXgene Blood RNA kit and the Qiagen RNeasy Fibrous Tissue Mini (Hilden, Germany), respectively. RNA purity and concentration were determined spectrophotometrically (260/280 >1.9). RNA quality was assessed on an Agilent 2100 Bioanalyzer using the RNA 6000 Nano LabChip®.
- biotin-labeled amplified cRNA from 2ug of total RNA, was accomplished with the Affymetrix GeneChip® One-Cycle cDNA Synthesis kit and the Affymetrix GeneChip® IVT Labeling kit. Concentration and purity of the cRNA product were determined spectrophotometrically. Twenty micrograms of each biotin-labeled cRNA was fragmented for hybridization on Affymetrix Human Genome U133 Plus 2.0 GeneChip® arrays. Fragmented cRNA was prepared for hybridization as outlined in the Affymetrix GeneChip® manual. Hybridization was conducted overnight in a model 320 rotating hybridization oven set at 45° C.
- the 21 genes within this list were identified by their prevalence and magnitude of overexpression in Myositis patients as compared to those of normal controls. It includes a standard list of the same 21 genes (i.e. 21 probes that map to 21 unique genes) for each Myositis patient. These 21 genes were DNAPTP6; EPSTI1; HERC5; IF127; IF144; IF144L; IF16; IFIT1; IFIT3; ISG15; LAMP3; LY6E; MX1; OAS1; OAS2; OAS3; PLSCR1; RSAD2; RTP4; SIGLEC1; and USP18.
- the fold change is calculated between Myositis patients at day 0 (predose) and the average of 24 normal healthy controls. The median of these 21 fold change values is then computed for each Myositis patient and this value is used as the IFN- ⁇ / ⁇ -inducible gene signature score.
- a dynamic list of the top 25 genes is selected from a set of 807 probes previously found to be IFN- ⁇ / ⁇ -inducible and neutralized by MEDI-545. See FIGS. 235-381 These 25 genes are chosen by their fold change magnitude and all represent a unique known gene (for genes that are represented by multiple probes, the one that showed the highest fold change was used for the purpose).
- the fold change is calculated between Myositis patients at day 0 (predose) and the average of 24 normal healthy controls. The median of these 25 fold change values is then computed for each Myositis patient and this value is used as the IFN- ⁇ / ⁇ -inducible gene signature score.
- Table 1 shows that the IFN ⁇ / ⁇ -inducible gene signature is overexpressed in IBM patient muscle whether calculated using a static list of 21 genes or a dynamic list of 25 genes.
- FIG. 8 provides a scatter plot which illustrates the overexpression of the IFN ⁇ / ⁇ -inducible gene signature in muscle tissue of the individual IBM patients shown in Table 1.
- the IFN ⁇ / ⁇ -Inducible Gene Signature is More Elevated in Muscle of Jol ⁇ than Jol ⁇ DM Patients
- RNA extraction and microarray processing Total RNA was extracted from PAXgene muscle biopsies using the the Qiagen RNeasy Fibrous Tissue Mini (Hilden, Germany). RNA purity and concentration were determined spectrophotometrically (260/280 >1.9). RNA quality was assessed on an Agilent 2100 Bioanalyzer using the RNA 6000 Nano LabChip®.
- biotin-labeled amplified cRNA from 2 ug of total RNA, was accomplished with the Affymetrix GeneChip® One-Cycle cDNA Synthesis kit and the Affymetrix GeneChip® IVT Labeling kit. Concentration and purity of the cRNA product were determined spectrophotometrically. Twenty micrograms of each biotin-labeled cRNA was fragmented for hybridization on Affymetrix Human Genome U133 Plus 2.0 GeneChip® arrays. Fragmented cRNA was prepared for hybridization as outlined in the Affymetrix GeneChip® manual. Hybridization was conducted overnight in a model 320 rotating hybridization oven set at 45° C.
- FIG. 10 a provides the median-fold overexpression of the each of the 19 genes included in the IFN ⁇ / ⁇ -inducible gene signature and the overall median-fold change in IFN ⁇ / ⁇ -inducible gene signature for each of 10 IBM patient muscle samples.
- FIG. 10 b provides a scatter plot which illustrates the overexpression of the IFN ⁇ / ⁇ -inducible gene signature in muscle tissue of each individual IBM patient shown in FIG. 10 a . While the IFN ⁇ / ⁇ -inducible gene signature was over-expressed in muscle samples of both the Jol ⁇ and Jol + patients, overexpression was greater in muscle samples of Jol - patients.
- miRNAs are Differentially Regulated in Myositis Patient Muscle Tissue Relative to Healthy Donor Muscle Tissue
- miRNA levels in muscle tissue were measured in samples obtained from 8 healthy donors, 11 DM patients, and 10 IBM patients.
- Muscle tissue samples were processed with the mirVana miRNA Isolation Kit (Ambion, Inc., Austin, TX) following the manufacturers suggested protocol. Concentration and purity (260/280 nm) of each sample was determined spectrophotometrically. Sample quality was assessed by Agilent 2100 Bioanalyzer (Agilent Technologies, Inc., Santa Clara, Calif.) analysis.
- RNA samples were normalized to a concentration of 25 ng/ ⁇ L. 4 ⁇ L of each normalized RNA sample was transferred to individual wells of an eight-tube microtube strip (4 ⁇ L ⁇ 8) that had been placed on ice. 5 ⁇ L ice cold RT master mix was added to well containing the 4 ⁇ L of normalized RNA.
- Each 5 ⁇ L RT master mix contained 0.2 ⁇ L 100 mM dNTPs, 2.0 ⁇ L MultiScribe Reverse Transcriptase (50 U/mL), 1.0 ⁇ L 10 ⁇ Reverse Transcription Buffer, 0.125 ⁇ L RNase Inhibitor (20 U/ ⁇ L), and 1.675 ⁇ L Nuclease-free water that had been prepared on ice.
- a 1 ⁇ L volume of a Multiplex RT human primer pool (one of each of primer pools #1-8) was added to a corresponding microtube (microtubes 1-8)), resulting in a total of eight independent RT reactions per RNA sample.
- the microtubes were capped, mixed gently and centrifuged briefly. All reaction samples were then incubated on ice for at least 5 minutes prior to conducting the cDNA synthesis protocol.
- the cDNA synthesis procedure was conducted in a Bio-Rad (Hercules, Calif.) Tetrad thermal cycler using the following profile: 16° C. for 30 minutes, 42° C. for 30 minutes, 85° C. for 5 minutes, 4° C-hold. After completion of the cDNA synthesis reaction, all sample volumes (10 ⁇ L) were transferred to individual 1.5 mL microcentrifuge tubes and diluted 62.5-fold by adding 615 ⁇ L nuclease-free water. All samples were kept on ice until further processing.
- TaqMan Low-Density Array In preparation for analysis on the Human MicroRNA Panel TaqMan Low-Density Array (TLDA) (Applied Biosystems, Foster City, Calif.), 50 ⁇ L diluted RT reaction and 50 ⁇ L TaqMan Universal PCR Master Mix (2X) (Applied Biosystems, Foster City, Calif.) were combined in individual 1.5 mL microcentrifuge tubes. The sample tubes were capped, mixed gently and centrifuged briefly. Standard procedures for loading the array were followed and the array was run on a 7900HT Fast Real-Time PCR System (Applied Biosystems, Foster City, Calif.). Data analysis of the resulting Ct values was conducted with SDSv2.2.2 software (Applied Biosystems, Foster City, Calif.).
- miRNAs were differentially regulated in muscle of both DM and IBM patients. See Tables 2-5. Unique detector Ids, miRNA ids, and sequences are provided in Figure sheets
- miRNAs may be useful in the diagnosis, prognosis, treatment, and/or stratification of myositis patients.
Landscapes
- Health & Medical Sciences (AREA)
- Chemical & Material Sciences (AREA)
- Life Sciences & Earth Sciences (AREA)
- Organic Chemistry (AREA)
- Engineering & Computer Science (AREA)
- General Health & Medical Sciences (AREA)
- Bioinformatics & Cheminformatics (AREA)
- Nuclear Medicine, Radiotherapy & Molecular Imaging (AREA)
- General Chemical & Material Sciences (AREA)
- Animal Behavior & Ethology (AREA)
- Chemical Kinetics & Catalysis (AREA)
- Public Health (AREA)
- Veterinary Medicine (AREA)
- Medicinal Chemistry (AREA)
- Pharmacology & Pharmacy (AREA)
- Proteomics, Peptides & Aminoacids (AREA)
- Immunology (AREA)
- Zoology (AREA)
- Wood Science & Technology (AREA)
- Genetics & Genomics (AREA)
- Analytical Chemistry (AREA)
- Biophysics (AREA)
- General Engineering & Computer Science (AREA)
- Biochemistry (AREA)
- Molecular Biology (AREA)
- Dermatology (AREA)
- Pathology (AREA)
- Microbiology (AREA)
- Biotechnology (AREA)
- Physics & Mathematics (AREA)
- Heart & Thoracic Surgery (AREA)
- Pain & Pain Management (AREA)
- Rheumatology (AREA)
- Physical Education & Sports Medicine (AREA)
- Cardiology (AREA)
- Transplantation (AREA)
- Orthopedic Medicine & Surgery (AREA)
- Neurology (AREA)
- Measuring Or Testing Involving Enzymes Or Micro-Organisms (AREA)
- Medicines That Contain Protein Lipid Enzymes And Other Medicines (AREA)
Priority Applications (1)
| Application Number | Priority Date | Filing Date | Title |
|---|---|---|---|
| US12/866,586 US20110262928A1 (en) | 2008-02-08 | 2009-02-06 | Disease markers and uses thereof |
Applications Claiming Priority (3)
| Application Number | Priority Date | Filing Date | Title |
|---|---|---|---|
| US696308P | 2008-02-08 | 2008-02-08 | |
| US12/866,586 US20110262928A1 (en) | 2008-02-08 | 2009-02-06 | Disease markers and uses thereof |
| PCT/US2009/033407 WO2009100342A2 (en) | 2008-02-08 | 2009-02-06 | Disease markers and uses thereof |
Publications (1)
| Publication Number | Publication Date |
|---|---|
| US20110262928A1 true US20110262928A1 (en) | 2011-10-27 |
Family
ID=40952717
Family Applications (1)
| Application Number | Title | Priority Date | Filing Date |
|---|---|---|---|
| US12/866,586 Abandoned US20110262928A1 (en) | 2008-02-08 | 2009-02-06 | Disease markers and uses thereof |
Country Status (13)
| Country | Link |
|---|---|
| US (1) | US20110262928A1 (ja) |
| EP (2) | EP2848702A1 (ja) |
| JP (1) | JP2011511804A (ja) |
| KR (1) | KR20110005783A (ja) |
| CN (1) | CN101999001B (ja) |
| AU (1) | AU2009212216B2 (ja) |
| BR (1) | BRPI0908065A2 (ja) |
| CA (1) | CA2714410A1 (ja) |
| ES (1) | ES2529593T3 (ja) |
| HK (1) | HK1150063A1 (ja) |
| MX (1) | MX2010008698A (ja) |
| SG (1) | SG188147A1 (ja) |
| WO (1) | WO2009100342A2 (ja) |
Cited By (2)
| Publication number | Priority date | Publication date | Assignee | Title |
|---|---|---|---|---|
| US20100190659A1 (en) * | 2007-07-12 | 2010-07-29 | The Brigham And Women's Hospital, Inc. | Compositions and Methods for Diagnosing and Assessing Inflammatory Myopathies |
| WO2013093870A1 (en) | 2011-12-23 | 2013-06-27 | International Centre For Genetic Engineering And Biotechnology - Icgeb | microRNAs FOR CARDIAC REGENERATION THROUGH INDUCTION OF CARDIAC MYOCYTE PROLIFERATION |
Families Citing this family (23)
| Publication number | Priority date | Publication date | Assignee | Title |
|---|---|---|---|---|
| KR20220008944A (ko) | 2008-01-18 | 2022-01-21 | 프레지던트 앤드 펠로우즈 오브 하바드 칼리지 | 체액 내에서 질병 또는 병태의 시그너쳐의 검출 방법 |
| US8785414B2 (en) * | 2009-03-31 | 2014-07-22 | The United States Of America, As Represented By The Secretary, Department Of Health And Human Services | Differentially expressed microRNAs as biomarkers for the diagnosis and treatment of Sjögren's syndrome |
| WO2011028933A1 (en) * | 2009-09-03 | 2011-03-10 | Medimmune, Llc | Type 1 interferon diagnostic |
| WO2011126105A1 (ja) * | 2010-04-08 | 2011-10-13 | 三菱化学メディエンス株式会社 | 免疫系の異常疾患または関節系の異常疾患への罹患またはこれらの病勢を判定するための検査方法 |
| WO2012012725A2 (en) | 2010-07-23 | 2012-01-26 | President And Fellows Of Harvard College | Methods of detecting diseases or conditions using phagocytic cells |
| CA2806304A1 (en) | 2010-07-23 | 2012-01-26 | President And Fellows Of Harvard College | Methods of detecting prenatal or pregnancy-related diseases or conditions |
| US20130184178A1 (en) | 2010-07-23 | 2013-07-18 | President And Fellows Of Harvard College | Methods of Detecting Autoimmune or Immune-Related Diseases or Conditions |
| JP2013538565A (ja) | 2010-07-23 | 2013-10-17 | プレジデント アンド フェロウズ オブ ハーバード カレッジ | 体液中の疾患または症状のシグネチャを検出する方法 |
| EP2742148B1 (en) * | 2011-08-11 | 2017-06-28 | Hummingbird Diagnostics GmbH | Complex sets of mirnas as non-invasive biomarkers for psoriasis |
| EP2653554A1 (en) * | 2012-04-17 | 2013-10-23 | Istituto Nazionale Di Genetica Molecolare-INGM | Immune response biomarkers |
| EP2965077B1 (en) | 2013-03-09 | 2022-07-13 | Harry Stylli | Methods of detecting cancer |
| EP2965086A4 (en) | 2013-03-09 | 2017-02-08 | Harry Stylli | Methods of detecting prostate cancer |
| WO2014209238A1 (en) * | 2013-06-28 | 2014-12-31 | Acumen Research Laboratories Pte. Ltd. | Sepsis biomarkers and uses thereof |
| EP3191846A4 (en) | 2014-09-11 | 2018-06-13 | Harry Stylli | Methods of detecting prostate cancer |
| JP6531306B2 (ja) * | 2015-02-20 | 2019-06-19 | 一三 西野 | 炎症性筋疾患鑑別マーカー及びそれを用いた炎症性筋疾患と非炎症性筋疾患の鑑別方法 |
| CN108379584B (zh) * | 2018-04-12 | 2020-08-11 | 上海交复生物医药科技有限公司 | RSAD2通过wnt通路影响肿瘤细胞替莫唑胺耐药性 |
| EP3784270A1 (en) * | 2018-04-27 | 2021-03-03 | Stemline Therapeutics Inc. | Methods of treating an autoimmune disease with a human interleukin-3 (il-3)-diphtheria toxin conjugate (dt-il3) |
| CN110085282A (zh) * | 2019-04-23 | 2019-08-02 | 华中师范大学 | 核酸结构中核苷酸与核苷酸相互作用预测的方法 |
| CN110108880A (zh) * | 2019-05-30 | 2019-08-09 | 四川大学华西医院 | Fez1自身抗体检测试剂在制备肺癌筛查试剂盒中的用途 |
| CN110161235B (zh) * | 2019-06-26 | 2022-04-12 | 江苏省中医院 | 三种血清蛋白联合用于强直性脊柱炎诊断的用途 |
| CA3152279A1 (en) * | 2019-10-04 | 2021-04-08 | The Regents Of The University Of Michigan | Methods for determining responsiveness to anti-tumor necrosis factor therapy in the treatment of psoriasis |
| CN111378742A (zh) * | 2020-04-16 | 2020-07-07 | 嘉兴程瑞医药科技有限公司 | microRNA生物标志物及其在制备自身免疫疾病检测试剂盒中的应用 |
| CN113388677A (zh) * | 2021-06-17 | 2021-09-14 | 河北医科大学第二医院 | 包括ifi44的干燥症诊断标志物组合 |
Citations (1)
| Publication number | Priority date | Publication date | Assignee | Title |
|---|---|---|---|---|
| US20070092890A1 (en) * | 2005-08-05 | 2007-04-26 | Genentech, Inc. | Methods and compositions for detecting autoimmune disorders |
Family Cites Families (9)
| Publication number | Priority date | Publication date | Assignee | Title |
|---|---|---|---|---|
| GB8303165D0 (en) | 1983-02-04 | 1983-03-09 | Secher D S | Monoclonal antibody |
| JPS60500864A (ja) | 1983-02-04 | 1985-06-06 | ワドリ、テクナラジズ、インコーパレイティド | 近縁関係にあるが別個のタンパク質間に存在する共通決定基に対して特異的なハイブリド−マ抗体の製造および特性づけ |
| DE3306060A1 (de) | 1983-02-22 | 1984-08-23 | Boehringer Ingelheim International GmbH, 6507 Ingelheim | Neue immunglobulin-produzierende hybridzellinien, deren verwendung und verfahren zu deren herstellung |
| EP0205404B1 (en) | 1985-06-11 | 1992-07-15 | Ciba-Geigy Ag | Hybrid interferons |
| US7087726B2 (en) | 2001-02-22 | 2006-08-08 | Genentech, Inc. | Anti-interferon-α antibodies |
| US20070166281A1 (en) * | 2004-08-21 | 2007-07-19 | Kosak Kenneth M | Chloroquine coupled antibodies and other proteins with methods for their synthesis |
| US7833795B2 (en) * | 2004-08-24 | 2010-11-16 | The Trustees Of The University Of Pennsylvania | Assessment of cardiovascular risk using isoprostane biomarkers and COX-2 selective inhibitors |
| US20070065844A1 (en) * | 2005-06-08 | 2007-03-22 | Massachusetts Institute Of Technology | Solution-based methods for RNA expression profiling |
| US20100143373A1 (en) * | 2006-12-06 | 2010-06-10 | Medimmune, Llc | Methods of treating systemic lupus erythematosus |
-
2009
- 2009-02-06 KR KR1020107019933A patent/KR20110005783A/ko not_active Application Discontinuation
- 2009-02-06 EP EP14191479.6A patent/EP2848702A1/en not_active Withdrawn
- 2009-02-06 CN CN2009801123932A patent/CN101999001B/zh active Active
- 2009-02-06 JP JP2010546054A patent/JP2011511804A/ja active Pending
- 2009-02-06 BR BRPI0908065-1A patent/BRPI0908065A2/pt not_active IP Right Cessation
- 2009-02-06 ES ES09709316.5T patent/ES2529593T3/es active Active
- 2009-02-06 WO PCT/US2009/033407 patent/WO2009100342A2/en active Application Filing
- 2009-02-06 MX MX2010008698A patent/MX2010008698A/es active IP Right Grant
- 2009-02-06 AU AU2009212216A patent/AU2009212216B2/en active Active
- 2009-02-06 SG SG2013010608A patent/SG188147A1/en unknown
- 2009-02-06 US US12/866,586 patent/US20110262928A1/en not_active Abandoned
- 2009-02-06 CA CA2714410A patent/CA2714410A1/en not_active Abandoned
- 2009-02-06 EP EP09709316.5A patent/EP2252703B1/en active Active
-
2011
- 2011-04-18 HK HK11103859.1A patent/HK1150063A1/xx unknown
Patent Citations (1)
| Publication number | Priority date | Publication date | Assignee | Title |
|---|---|---|---|---|
| US20070092890A1 (en) * | 2005-08-05 | 2007-04-26 | Genentech, Inc. | Methods and compositions for detecting autoimmune disorders |
Non-Patent Citations (3)
| Title |
|---|
| Greenberg et al. (2005), Ann. Neurology, Vol. 57, pp.664-678. * |
| MediImmune and Medarex (2005), pp1-3 (Investigational New Drug Application) * |
| Silicon Investor (2007), P.82. * |
Cited By (2)
| Publication number | Priority date | Publication date | Assignee | Title |
|---|---|---|---|---|
| US20100190659A1 (en) * | 2007-07-12 | 2010-07-29 | The Brigham And Women's Hospital, Inc. | Compositions and Methods for Diagnosing and Assessing Inflammatory Myopathies |
| WO2013093870A1 (en) | 2011-12-23 | 2013-06-27 | International Centre For Genetic Engineering And Biotechnology - Icgeb | microRNAs FOR CARDIAC REGENERATION THROUGH INDUCTION OF CARDIAC MYOCYTE PROLIFERATION |
Also Published As
| Publication number | Publication date |
|---|---|
| EP2848702A1 (en) | 2015-03-18 |
| AU2009212216A1 (en) | 2009-08-13 |
| MX2010008698A (es) | 2010-12-20 |
| KR20110005783A (ko) | 2011-01-19 |
| JP2011511804A (ja) | 2011-04-14 |
| AU2009212216B2 (en) | 2015-04-09 |
| CN101999001B (zh) | 2013-11-20 |
| WO2009100342A3 (en) | 2009-12-30 |
| BRPI0908065A2 (pt) | 2015-08-11 |
| CN101999001A (zh) | 2011-03-30 |
| WO2009100342A2 (en) | 2009-08-13 |
| CA2714410A1 (en) | 2009-08-13 |
| EP2252703A2 (en) | 2010-11-24 |
| ES2529593T3 (es) | 2015-02-23 |
| EP2252703B1 (en) | 2014-11-05 |
| HK1150063A1 (en) | 2011-10-28 |
| EP2252703A4 (en) | 2011-12-21 |
| SG188147A1 (en) | 2013-03-28 |
Similar Documents
| Publication | Publication Date | Title |
|---|---|---|
| AU2009212216B2 (en) | Disease markers and uses thereof | |
| AU2007327995B2 (en) | Interferon alpha-induced pharmacodynamic markers | |
| US11230597B2 (en) | Methods of treatment using an interferon gamma inhibitor | |
| AU2008247398B2 (en) | Interferon alpha-induced pharmacodynamic markers | |
| AU2010289383B2 (en) | Type 1 interferon diagnostic | |
| US20110287022A1 (en) | Interferon alpha-induced pharmacodynamic markers | |
| US20100261172A1 (en) | Interferon alpha-induced pharmacodynamic markers | |
| AU2015203772A1 (en) | Disease markers and uses thereof | |
| WO2009155559A1 (en) | Interferon alpha-induced pharmacodynamic markers | |
| AU2014200128A1 (en) | Interferon alpha-induced pharmacodynamic markers | |
| AU2014200127A1 (en) | Interferon alpha-induced pharmacodynamic markers | |
| NZ625324B2 (en) | Methods of treatment using an antibody against interferon gamma |
Legal Events
| Date | Code | Title | Description |
|---|---|---|---|
| AS | Assignment |
Owner name: MEDIMMUNE, LLC, MARYLAND Free format text: ASSIGNMENT OF ASSIGNORS INTEREST;ASSIGNORS:YAO, YIHONG;MOREHOUSE, CHRIS;HIGGS, BRANDON;AND OTHERS;SIGNING DATES FROM 20100912 TO 20100913;REEL/FRAME:025323/0356 |
|
| STCB | Information on status: application discontinuation |
Free format text: ABANDONED -- FAILURE TO RESPOND TO AN OFFICE ACTION |