EP4141430B1 - Auswerteanordnung für einen thermischen gassensor, verfahren und computerprogramm - Google Patents
Auswerteanordnung für einen thermischen gassensor, verfahren und computerprogramm Download PDFInfo
- Publication number
- EP4141430B1 EP4141430B1 EP22196711.0A EP22196711A EP4141430B1 EP 4141430 B1 EP4141430 B1 EP 4141430B1 EP 22196711 A EP22196711 A EP 22196711A EP 4141430 B1 EP4141430 B1 EP 4141430B1
- Authority
- EP
- European Patent Office
- Prior art keywords
- signal
- sensor
- gas
- heater
- information
- Prior art date
- Legal status (The legal status is an assumption and is not a legal conclusion. Google has not performed a legal analysis and makes no representation as to the accuracy of the status listed.)
- Active
Links
Images















Classifications
-
- G—PHYSICS
- G01—MEASURING; TESTING
- G01N—INVESTIGATING OR ANALYSING MATERIALS BY DETERMINING THEIR CHEMICAL OR PHYSICAL PROPERTIES
- G01N25/00—Investigating or analyzing materials by the use of thermal means
- G01N25/18—Investigating or analyzing materials by the use of thermal means by investigating thermal conductivity
-
- G—PHYSICS
- G01—MEASURING; TESTING
- G01F—MEASURING VOLUME, VOLUME FLOW, MASS FLOW OR LIQUID LEVEL; METERING BY VOLUME
- G01F1/00—Measuring the volume flow or mass flow of fluid or fluent solid material wherein the fluid passes through a meter in a continuous flow
- G01F1/68—Measuring the volume flow or mass flow of fluid or fluent solid material wherein the fluid passes through a meter in a continuous flow by using thermal effects
- G01F1/684—Structural arrangements; Mounting of elements, e.g. in relation to fluid flow
- G01F1/688—Structural arrangements; Mounting of elements, e.g. in relation to fluid flow using a particular type of heating, cooling or sensing element
- G01F1/6888—Thermoelectric elements, e.g. thermocouples, thermopiles
-
- G—PHYSICS
- G01—MEASURING; TESTING
- G01N—INVESTIGATING OR ANALYSING MATERIALS BY DETERMINING THEIR CHEMICAL OR PHYSICAL PROPERTIES
- G01N33/00—Investigating or analysing materials by specific methods not covered by groups G01N1/00 - G01N31/00
- G01N33/48—Biological material, e.g. blood, urine; Haemocytometers
- G01N33/483—Physical analysis of biological material
- G01N33/497—Physical analysis of biological material of gaseous biological material, e.g. breath
Definitions
- Embodiments according to the invention relate to evaluation arrangements for a thermal gas sensor, methods and computer programs.
- Gases can currently be analyzed for their properties using a wide variety of sensors.
- Various patient ventilation systems are currently available on the market. These are differentiated according to use in clinical and home care settings (e.g., systems from Heinen+Löwenstein, Dräger, and Stephan Medizintechnik). Only their top-of-the-line systems from these providers include all the necessary measuring devices for determining pressure, respiratory flow, and respiratory gas analysis. This requires a combination of several devices, most of which measure remotely from the patient.
- One embodiment relates to an evaluation arrangement for a thermal gas sensor with at least one heater (e.g. a heating element) and at least one detector (e.g., a thermocouple structure, temperature-variable resistors, or thermistors).
- the evaluation arrangement is designed, for example, to obtain information about an amplitude of a detector signal from a first detector (e.g., D1.Uss) and information about a first phase difference between a heater signal and the detector signal from the first detector (e.g., (D1-Hz).phi).
- the evaluation arrangement can further be designed to form a combination signal as an intermediate variable depending on the information about the amplitudes of the detector signal (e.g., D1.Uss and/or D2.Uss) and depending on the information about the first phase difference, which combination signal can combine amplitude information and phase information.
- the evaluation arrangement is further designed, for example, to: B. to determine information about a gas concentration or information about a thermal conductivity of a fluid (e.g. a gas or gas mixture) based on the combination signal (e.g. without having to consider the individual information flowing into the combination signal separately again in the further course of the calculations).
- the heater and the at least one detector can be cyclically swapped to minimize possible (synchronization) errors.
- the detector can act as a heater and the heater as a detector, and at a second point in time, the detector can serve as a detector and the heater as a heater.
- the evaluation arrangement comprises two detectors, with these two detectors being equidistant from the heater.
- the combined signal can include, for example, a sum of the information about the amplitudes of the two detector signals (e.g., D1.Uss and D2.Uss) from the two detectors and a sum of the information about the two phase differences ((D1-Hz).phi and (D2-Hz).phi) of the two detectors.
- One embodiment relates to an evaluation arrangement for a thermal gas sensor with at least one heater (e.g. a heating element) and two detectors arranged at different distances from the heater (e.g. a first thermocouple structure and a second thermocouple structure or temperature-variable resistors or thermistors), wherein the evaluation arrangement is designed to provide information about an amplitude of a detector signal of a first detector (e.g. D1.Uss), information about an amplitude of a detector signal of a second detector (e.g. D2.Uss), information about a first phase difference between a heater signal and the detector signal of the first detector (e.g.
- a first detector e.g. D1.Uss
- information about an amplitude of a detector signal of a second detector e.g. D2.Uss
- information about a first phase difference between a heater signal and the detector signal of the first detector e.g.
- the evaluation arrangement can be designed to form a combination signal as an intermediate variable depending on the information about the amplitudes of the detector signals (e.g. D1.Uss of the first detector and D2.Uss of the second detector) and depending on the information about the first phase difference and depending on the information about the second phase difference, which can combine amplitude information and phase information.
- the evaluation arrangement is further designed to determine information about a gas concentration or information about a thermal conductivity of a fluid (for example a gas or gas mixture) based on the combination signal (for example without separately considering the individual information flowing into the combination signal again in the further course of the calculations).
- gas can be arranged in the thermal gas sensor between the at least one heater and the detectors arranged at different distances or at equal distances (e.g., symmetrically) from the heater, which gas can be analyzed by the evaluation arrangement in cooperation with the thermal gas sensor.
- heat is transported from the at least one heater to the first detector and the second detector via the gas or gas mixture located therebetween.
- a detector signal detected by the first detector or a detector signal detected by the second detector can indicate the heat transported from the heater to the respective detector.
- a heating signal amplitude (e.g., heater amplitude) of the at least one heater varies (e.g., periodic excitation of the heater)
- a varying amplitude corresponding to the heater can also be detected by the two detectors.
- the detector signal of the first detector or the second detector can be sent to the evaluation arrangement.
- the evaluation arrangement can obtain the respective information about the amplitude from the detector signal of the first detector and from the detector signal of the second detector, as well as information about the first phase difference between the heater signal and the detector signal of the first detector and information about the second phase difference between the heater signal and the detector signal of the second detector.
- the evaluation arrangement can, for example, receive the heater signal from the thermal gas sensor in addition to the detector signals of the first detector and the second detector, respectively.
- the evaluation arrangement can, for example, directly receive the information about the amplitude from the thermal gas sensor. of the detector signal of the first detector, the information about the amplitude of the detector signal of the second detector, the information about the first phase difference and the information about the second phase difference.
- This embodiment of the evaluation system is based on the finding that the combined signal, based on the information about the amplitudes of the detector signals and dependent on the information about the first phase difference and the information about the second phase difference, represents a very stable signal that can be further processed very quickly by the evaluation system, for example, to determine a gas concentration or information about the thermal conductivity of the fluid.
- the evaluation system allows for rapid gas analysis.
- the evaluation arrangement can be designed to obtain information about a heater amplitude.
- the evaluation arrangement can also be designed to form a linear combination of the information about the heater amplitude, the information about amplitudes of the detector signals, the information about the first phase difference, and the information about the second phase difference in order to determine the combination signal (sigX).
- the information about the heater amplitude can, for example, be information about a heating power.
- the information about a heater amplitude can also be referred to as Hz.Uss.
- the evaluation arrangement can, for example, obtain the information about the heater amplitude directly from the thermal gas sensor or, for example, from a heater signal sent from the thermal gas sensor to the evaluation arrangement.
- the linear combination can, for example, have a first term comprising a first linear combination of the information about the heater amplitude and the information about the amplitudes of the detector signals, and a second term comprising a second linear combination of the information about the first phase difference and the information about the second phase difference.
- the first term and the second term can be weighted with different constants in the linear combination to determine the combination signal.
- the heater signal e.g., a signal emitted by the heater from periodic temperature waves
- the detector signal of the first detector or the second detector e.g., a received signal from periodic temperature waves
- sigUss can be amplitude information or an amplitude signal that can depend on the information about the amplitude of the detector signal from the first detector and on the information about the amplitude of the detector signal from the second detector.
- the term sigPhi can be phase information or an added phase signal that can depend on the information about the first phase difference and the information about the second phase difference, and the factors Ka and Kp can be constants.
- Ka and Kp can separately weight the amplitude information and the phase information, respectively, so that the evaluation arrangement can obtain the combination signal sigX.
- the amplitude information sigUss can be a linear combination of the information about the amplitude of the detector signal from the first detector and the information about the amplitude of the detector signal from the second detector.
- the phase information sigPhi can be a linear combination of the information about the first phase difference and the information about the second phase difference.
- the constants Ka and Kp can, for example, represent conversion factors. According to one embodiment, Ka and Kp are weighting factors for an optimized combination signal, whereby the factors Ka and Kp can represent unitless quantities (for an embedded system such as the one used here, which supplies a CO2 concentration, for example, this is not necessary).
- the embedded system supplies, for example, AD digits for the amplitude and phase information is determined, for example, from the timing unit of the embedded system, which measures, for example, the times until the comparator flips over.
- a conversion to amplitude and time/angle is therefore specified, for example, by the technical data of a circuit and the embedded system ( ⁇ Controller) of the evaluation arrangement.
- the factors are, for example,
- the factors Ka and Kp are chosen so that both signal components (amplitude and phase) are included in the combined signal SigX in approximately equal proportions over the measuring range of the CO2 calibration, so that, for example, the greatest measurement resolution is achieved in SigX.
- the factors Ka and Kp are determined empirically, for example, to obtain the best signal for SigX.
- the constants Ka and Kp can, for example, depend on a concentration, a The temperature or pressure of a gas to be analyzed can be determined.
- the amplitude information sigUss can be coordinated with the phase information sigPhi. This allows the evaluation system to further process both amplitude information and phase information simultaneously using the combined signal, allowing the evaluation system, for example, to analyze the gas detected by the gas sensor very quickly, efficiently, and accurately.
- the term Hz.Uss can be information about a heater amplitude
- the term D1.Uss can be information about the amplitude of the detector signal of the first detector
- D2.Uss can be information about the amplitude of the detector signal of the second detector.
- the amplitude information sigUss can represent a relative amplitude signal.
- the amplitude information can be a difference between twice the heater amplitude and a sum of the information about the amplitude of the detector signal of the first detector and the information about the amplitude of the detector signal of the second detector.
- the amplitude information sigUss depends essentially on heat transfer through the fluid, and unknown heat transfers, for example, from the at least one heater into the gas to be analyzed and from the gas to be analyzed into the first or second detector, are not or only barely taken into account.
- the combination signal sigX which may depend on the amplitude information sigUss, is not influenced at all or only barely by unknown heat transfers, allowing the evaluation system to very precisely determine properties of the gas to be analyzed, such as information about the gas concentration or information about the thermal diffusivity of the fluid.
- the evaluation arrangement can be designed to calculate a polynomial (for example, first-degree, for example Ay(sigX)) of the combination signal in order to obtain the information about the gas concentration or the information about the thermal conductivity of the fluid.
- a drift correction of the combination signal can be performed. For example, concentration drift, pressure drift, and temperature drift can be corrected by the polynomial formation.
- the evaluation arrangement can calculate three polynomials of the combination signal, where A first polynomial can represent a relationship between the gas concentration and the combination signal, a second polynomial can represent a relationship between pressure and signal shift (pressure drift of the combination signal), and a third polynomial can represent a relationship between temperature and pressure shift.
- a first polynomial can represent a relationship between the gas concentration and the combination signal
- a second polynomial can represent a relationship between pressure and signal shift (pressure drift of the combination signal)
- a third polynomial can represent a relationship between temperature and pressure shift.
- the evaluation arrangement can be designed to multiply a polynomial of the combination signal by a correction term in order to obtain information about the gas concentration or information about the thermal conductivity.
- the correction term can be dependent on the combination signal, information about a pressure (p), and information about a temperature (T).
- the correction term can, for example, compensate for a pressure and temperature dependence of the combination signal.
- a polynomial representing a relationship between a gas concentration and the combination signal can be corrected for pressure and temperature drift using the correction term.
- a reduction of possible error influences from the evaluation arrangement can be carried out, whereby the evaluation arrangement can be designed to obtain very precise information about the gas concentration or information about the thermal conductivity. This makes it possible to minimize pressure and temperature-dependent errors, for example, which arise when a detector signal is detected by the first detector or the second detector of the gas sensor.
- sigX can be the combination signal
- pol(sigX) can be a polynomial of the combination signal sigX
- f(p) can be a function of the pressure p (or a measured pressure p in an environment of the thermal gas sensor)
- const1 can be a first constant
- f(T) can be a function of the temperature T (or a measured temperature T in an environment of the thermal gas sensor)
- const2 can be a second constant.
- the function f(p) can, for example, be a polynomial that can represent a relationship between a pressure and a signal shift
- f(T) can be a A polynomial that can represent a relationship between a temperature and a signal shift.
- sigX can be the combination signal
- Ay(sigX) can be a polynomial (e.g.
- By(p) can be a function of the pressure p (or a measured pressure p in an environment of the thermal gas sensor), B.ref can be a constant, Cy(T) can be a function of the temperature T (or a measured temperature T in an environment of the thermal gas sensor) and C.ref can be a second constant.
- B.ref can be a constant
- Cy(T) can be a function of the temperature T (or a measured temperature T in an environment of the thermal gas sensor)
- C.ref can be a second constant.
- By(p) is, for example, a polynomial function (e.g. second order) that can represent a relationship between the pressure p and a signal shift (e.g. of the combination signal sigX).
- the function Cy(T) is, for example, a polynomial function (e.g.
- the evaluation arrangement is designed to determine very precisely, for example, information about the gas concentration of a fluid to be analyzed, since the function By(p) of the pressure p and the function Cy(T) of the temperature T can form a correction term that can correct the combination signal sigX.
- the evaluation arrangement can be designed to take into account a pressure and/or a temperature in an environment of the thermal gas sensor when determining the information about the gas concentration.
- the evaluation arrangement can, for example, receive information about the pressure and/or the temperature in the environment of the thermal gas sensor.
- the pressure in the environment of the thermal gas sensor is determined, for example, by a pressure sensor and the temperature in the environment of the thermal gas sensor is determined, for example, by a temperature sensor and transmitted to the evaluation arrangement.
- the pressure sensor and/or the temperature sensor can be arranged in the environment of the thermal gas sensor. This enables the evaluation arrangement to makes corrections based on the pressure and/or temperature, and can therefore analyze the fluid very precisely and obtain very precise information, for example, about the gas concentration or the thermal conductivity of the fluid.
- the evaluation arrangement can be designed to use the combination signal, information about the temperature in an environment of the thermal gas sensor, and information about a pressure in an environment of the thermal gas sensor as input variables for a drift correction when determining the information about the gas concentration, and to obtain the information about the gas concentration as a result of the drift correction.
- the drift correction for example, no longer receives any further variables, but instead uses, for example, only (e.g., additional) previously obtained constants—determined, for example, during calibration.
- the evaluation arrangement can be configured to eliminate possible errors in the calculation of the gas concentration caused by drift and thus perform a drift correction. Drift can occur at different temperatures and pressures and thus falsify a determination of the gas concentration, which can be prevented or suppressed with this feature. This makes it possible to determine information about the gas concentration very precisely using the evaluation arrangement.
- the evaluation arrangement is designed to obtain the combination signal, or a further combination signal, based on a quotient between amplitude information, which is dependent on the information about the amplitude of the detector signal of at least the first detector and optionally also on the information about the amplitude of the detector signal of the second detector, and phase information, which is dependent on the information about the first phase difference and optionally on the information about the second phase difference.
- the evaluation arrangement can be designed to determine information about a concentration of a gas, e.g., a third gas of a gas mixture, depending on the combination signal.
- the quotient is a ratio between the information about the amplitude and the phase information.
- the third gas shifts this ratio, whereby the evaluation arrangement can be designed to infer the concentration of the third gas component based on this ratio.
- sigUss can be amplitude information that depends on the information about the amplitude of the detector signal from the first detector and optionally on the information about the amplitude of the detector signal from the second detector.
- sigPhi can be phase information that depends on the information about the first phase difference and optionally on the information about the second phase difference.
- Kav and Kpv represent constants.
- the combination signal sigV represents, for example, the ratio between the information about the amplitude and the phase information.
- the evaluation arrangement is designed to determine a further physical gas parameter using the ratio sigV of the amplitude and phase signals, which can be used by the evaluation arrangement to draw conclusions about the unknown concentration of a known third gas in the gas mixture to be analyzed, for example by correlation.
- Kav and Kpv are new weighting factors that amplify changes in the ratio of the amplitudes and phases.
- the evaluation arrangement is designed to obtain information about how much heat is dissipated by the heater during a heating period and to determine information about a concentration of a gas, e.g. a third gas of a gas mixture, depending on the information about how much energy is dissipated by the heater during the heating period.
- a heating period can be understood as a period of time between a first zero crossing of a heating voltage and a second zero crossing of the heating voltage.
- the heating period can also be understood as a period of time from a first point in time at which the heating voltage changes from zero volts to greater than or less than zero volts, to a second point in time at which the heating voltage changes from greater than or less than zero volts to zero volts.
- the heating signal can, for example, have a sine signal, a cosine signal, a square wave signal, a triangular wave signal or a sawtooth wave signal.
- the heat is dissipated to the gas mixture surrounding the heater during the heating period. How much heat is dissipated from the heater to the surrounding gas is, for example, determined by the temperature of the surrounding gas. For example, it depends on the thermal conductivity of the surrounding gas or the thermal conductivity of gas components of the surrounding gas mixture.
- the evaluation system can be designed to determine the thermal conductivity of the unknown gas or gas mixture using the heat dissipated by the heater.
- the evaluation arrangement is designed to obtain information on how much heat is dissipated by the heater during a heating period based on a measurement of a current flow through the heater at a predetermined heating voltage.
- the heating voltage applied to the heater is fixed during the heating period, and the current flow changes depending on how much heat is dissipated to the gas or gas mixture.
- TCR temperature coefficient of resistance
- the evaluation arrangement is designed to obtain the current flow shortly after the predetermined heating voltage is switched on and shortly before the predetermined heating voltage is switched off. From a difference between these two current flow data, the evaluation arrangement can determine a change in the current flow during the heating period. The greater the difference, the lower the thermal conductivity of the gas or gas mixture to be analyzed. Thus, the evaluation arrangement is designed to use the thermal conductivity of the gas or gas mixture, for example, as an additional parameter in an analysis of the gas or gas mixture.
- the evaluation arrangement can be designed to use the thermal conductivity measurement as a further physical parameter of the unknown gas mixture by the evaluation arrangement being designed, for example, to evaluate the difference in the heater current at an initial maximum shortly after the heating voltage is switched on and shortly before the heating voltage is switched off (per period). Shortly after switching on the heating voltage can mean a time within a period of 10 ⁇ s to 1ms, 100 ⁇ s to 800 ⁇ s or 300 ⁇ s to 500 ⁇ s, such as 400 ⁇ s, after switching on.
- One embodiment provides a method for evaluating signals from a thermal gas sensor having at least one heater and at least one detector.
- Heat can be transferred, for example, from the heater to the detector via a gas to be analyzed.
- the method can include obtaining information about an amplitude of a detector signal from a first detector (for example, D1.Uss) and information about a first phase difference between a heater signal and the detector signal of the first detector (for example (D1-Hz).phi).
- a combination signal can be formed as an intermediate variable depending on the information about the amplitudes of the detector signal and depending on the information about the first phase difference.
- the combination signal can, for example, combine amplitude information and phase information.
- One embodiment provides a method for evaluating signals from a thermal gas sensor having at least one heater and two detectors arranged at different or equal distances from the heater.
- Heat can, for example, be transferred from the heater to the two detectors via a gas to be analyzed.
- the method can include obtaining information about an amplitude of a detector signal from a first detector (e.g., D1.Uss), information about an amplitude of a detector signal from a second detector (e.g., D2.Uss), information about a first phase difference between a heater signal and the detector signal from the first detector (e.g., (D1-Hz).phi), and information about a second phase difference between the heater signal and the detector signal from the second detector (e.g., (D2-Hz).phi).
- a first detector e.g., D1.Uss
- information about an amplitude of a detector signal from a second detector e.g., D2.Uss
- a combination signal can be formed as an intermediate variable depending on the information about the amplitudes of the detector signals and depending on the information about the first phase difference and depending on the information about the second phase difference.
- the combined signal can, for example, combine amplitude and phase information.
- Information about a gas concentration or information about the thermal diffusivity of a fluid can be determined based on the combined signal. This determination can be made, for example, without having to separately consider the individual pieces of information included in the combined signal in the subsequent calculations.
- An embodiment according to the present invention relates to an evaluation arrangement for a thermal gas sensor with at least one heater and two detectors.
- the two detectors can, for example, but not necessarily, be arranged at different distances from the heater.
- the evaluation arrangement is designed to regulate a heating power applied to the heater as a function of at least one sensor signal from at least one of the two detectors, in order to bring the at least one sensor signal into a predetermined value range.
- the evaluation arrangement is designed to take into account information about the heating power (for example, Hz.Uss) when deriving information about a gas concentration from the sensor signals from the two detectors.
- This exemplary embodiment of the evaluation arrangement is based on the knowledge that the evaluation arrangement can vary the heating power in order to keep the at least one sensor signal within the predetermined value range for different gases or gas mixtures. By keeping the at least one sensor signal within the predetermined value range, it can be optimally analyzed without having to accept major information losses. If, for example, the evaluation arrangement receives information that an amplitude of the sensor signal is lower than the predetermined value range, the evaluation arrangement can apply heating power to the heater in order to increase the heating power of the heater and thus raise the amplitude of the sensor signal into the predetermined value range.
- the evaluation arrangement can apply heating power to the heater in order to reduce the heating power of the heater and thus lower the amplitude of the sensor signal into the predetermined value range.
- the evaluation arrangement can, for example, keep the at least one sensor signal constant within the predetermined value range by applying or adjusting the heating power to the heater depending on the at least one sensor signal.
- the evaluation arrangement can derive information about a gas concentration or thermal conductivity of a gas. Furthermore, the evaluation arrangement can thereby enable precise flow measurement and rapid gas analysis.
- the evaluation arrangement can be designed to apply a periodic signal to the heater.
- the periodic signal defines, for example, a square-wave signal or a pulse with a defined power or a sinusoidal signal.
- the evaluation arrangement has a processor that processes the periodic signal. can generate. It should be noted here that, due to the timer structures present in the processor, a square wave signal can be generated with significantly greater temporal precision than a synthetic sine wave signal, which would be output by the processor on its digital/analog (DA) port.
- DA digital/analog
- the evaluation device can determine thermal conductivity, thermal diffusivity, and, given a known density of a gas (a gas to be analyzed by the thermal gas sensor), also a specific heat capacity.
- a gas a gas to be analyzed by the thermal gas sensor
- the variation in heating power which can represent information about the heating power
- information about a gas concentration or thermal conductivity/thermal diffusivity can be derived.
- the heater of the thermal gas sensor has a low thermal mass, the periodic signal applied to the heater can currently be modulated by the evaluation system at frequencies up to 300 Hz, since heat can be rapidly added and removed.
- a periodic signal enables accurate, fast, and efficient gas analysis.
- the periodic signal is, for example, a pulse with a defined power
- the electrical crosstalk of the steep edges of the heater signal to the detectors would be clearly distinguishable in time from the thermal wave, which arrives later.
- the switch-off edge at the heater could electrically crosstalk into the sensor signal if the heater receives the heat wave at the same time and at least one detector is measuring.
- the electronics R-C elements
- the heater edges can be slightly rounded and the detector signals shifted outside the crosstalk interference.
- heater operation with a shorter duty cycle could become more important, as a clear temporal separation between electrical interference and signal can be achieved.
- the pulse should be wide enough for the heater to emit enough power/heat so that at least one detector can measure, which can represent a lower limit for the duty cycle of 5%.
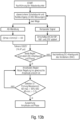
- the evaluation arrangement can be designed to switch the heating power applied to the heater between two values.
- the heater to be supplied with a heating output in the form of a periodic square-wave signal, for example.
- the two values e.g., in the form of heater voltages
- An analog switch can be used to alternately apply one of two voltages to a heater amplifier. This feature makes it possible to determine very precisely at any time which heating output and phase position is applied to the heater. This allows at least one sensor signal to be compared very precisely with the heater signal, allowing the evaluation device to perform a very accurate gas analysis.
- the evaluation arrangement can be designed to regulate an amplitude of the heating power such that both a minimum value of the at least one sensor signal and a maximum value of the at least one sensor signal lie within the predetermined value range. This ensures that, for example, an amplitude of the at least one sensor signal lies within the predetermined value range for the entire at least one sensor signal (for example, for the entire time in which the thermal gas sensor has detected the at least one sensor signal via at least one of the two detectors).
- the minimum value can, for example, represent a minimum amplitude of the at least one sensor signal, and the maximum value a maximum amplitude.
- the amplitude of the heating power can be regulated at least twice, e.g., when checking whether the minimum value of the at least one sensor signal lies within the predetermined value range and when checking whether the maximum value of the at least one sensor signal lies within the predetermined value range.
- the accuracy of the evaluation system can be improved, since this feature allows at least two values (a minimum value and a maximum value) of the at least one sensor signal to be determined, and based on these, the amplitude of the heating power can be controlled.
- the evaluation system can be configured accordingly to achieve a very precise gas analysis.
- the predetermined value range can have a minimum value range and a maximum value range.
- the evaluation arrangement can be designed to regulate the amplitude of the heating power such that the minimum value of the at least one sensor signal lies within the minimum value range of the predetermined value range and the maximum value of the at least one sensor signal lies within the maximum value range of the predetermined value range. This enables the at least one sensor signal covers almost the entire value range, so that little to no information is lost.
- the minimum value or the maximum value of the at least one sensor signal can define a phase position or an offset of the at least one sensor signal.
- the predetermined value range can, for example, represent an operating range of an analog-to-digital converter. If the minimum value of the at least one sensor signal and/or a maximum value of the at least one sensor signal lies outside the predetermined value range, the analog-to-digital converter cannot convert the at least one sensor signal correctly, which may cause the evaluation system to derive erroneous information about the gas concentration or thermal conductivity from the at least one sensor signal. This can be prevented or reduced by the feature described herein.
- the evaluation arrangement can be designed to set or regulate an amplitude of the heating power such that an amplitude of the at least one sensor signal lies within a predetermined amplitude range.
- the predetermined amplitude range can be determined/defined, for example, by the predetermined value range) can, for example, represent an operating range of an analog-to-digital converter.
- the amplitude of the at least one sensor signal should utilize at least 50%, at least 65%, or at least 75% of the predetermined amplitude range so that a meaningful analysis of the at least one sensor signal can be carried out by the evaluation arrangement.
- the predetermined amplitude range can also define that the amplitude of the at least one sensor signal utilizes at least 50%, at least 65%, or at least 75% of the value range of the analog-to-digital converter. If the amplitude of the at least one sensor signal is outside the predetermined amplitude range, information can be lost and, for example, For example, only an incorrect derivation of information about gas concentration or thermal conductivity can be obtained from the sensor signal.
- the evaluation arrangement can be designed to set or regulate sampling times at which a sensor signal is sampled.
- the sensor signal can, for example, be a preprocessed sensor signal and/or one with a DC offset. This allows, for example, the evaluation arrangement to set sampling times at which the evaluation arrangement expects the sensor signal to be within the predetermined value range. If the sensor signal is not within the predetermined value range, the evaluation arrangement can apply heating power to the heater in order to bring the sensor signal into the predetermined value range at the sampling time.
- the evaluation arrangement is thus designed to set or regulate optimized sampling times at which the evaluation arrangement can perform a very fast and accurate gas analysis of the gas detected by the thermal gas sensor.
- the evaluation arrangement is designed to set the sampling times such that sampling occurs at a time (e.g., a first sampling time) at which the sensor signal reaches a maximum value, and such that sampling occurs at a time (e.g., a second sampling time) at which the sensor signal reaches a minimum value.
- Sampling can occur, for example, with a maximum phase difference of +/- 0.5%, +/- 1%, +/- 2%, or +/- 5%.
- sampling can occur at that time with a deviation of +/- 15 ⁇ s, +/- 100 ⁇ s, +/- 2.1 ms, +/- 4.2 ms, +/- 6.3 ms, or +/- 10 ms.
- the evaluation device can set the sampling times so precisely enables the evaluation device to check whether the minimum value and/or the maximum value thus detected lies within the predetermined value range. Furthermore, the maximum value and the minimum value of the sensor signal can be compared very precisely with the maximum values and minimum values of the sensor signals of other gas types, respectively, whereby the evaluation arrangement is designed to perform a very precise, efficient gas analysis using the sampling times thus set.
- the evaluation device can be configured to combine a sensor signal from at least one of the detectors with an offset signal generated by a digital-to-analog converter to obtain an input signal for the analog-to-digital converter. Furthermore, the evaluation device can be configured to adjust the offset signal to ensure that the input signal of the analog-to-digital converter remains within a predetermined range (e.g., the predetermined value range) throughout an entire period of the sensor signal.
- the offset signal can be adjusted, for example, in response to a detection that an input value of the analog-to-digital converter exceeds a predetermined upper threshold value (e.g.
- the offset signal can thus, for example, change an offset of the sensor signal in order to bring the sensor signal into the predetermined range.
- the offset signal can, for example, be used by the evaluation device to generate the input signal, which can represent an offset-shifted sensor signal.
- the evaluation arrangement can thus shift the sensor signal into the predetermined range by combining the at least one sensor signal with the offset signal throughout the entire period. If, for example, the input signal nevertheless exceeds the predetermined range, the evaluation device can apply heating power to the heater in order to bring the at least one sensor signal within the predetermined range throughout the entire period.
- the predetermined range can, for example, represent an operating range of an analog-to-digital converter.
- the feature described herein can enable the evaluation device, which can comprise the analog-to-digital converter, to derive very precise information about the gas concentration or the thermal conductivity from the at least one sensor signal.
- the evaluation device can be designed to regulate the heating power only when a setting or adjustment of the sampling times is in a steady state and when an adjustment of the offset signal is in a steady state.
- a steady state is understood, for example, to mean that the evaluation device the sampling times have been determined within possible tolerances and thus the sampling times do not need to be further adjusted or regulated.
- the sampling times are adjusted, for example, such that both a maximum value (within tolerances) and a minimum value (within tolerances) of the at least one sensor signal are sampled.
- a steady state can define that the offset signal adjusted by the evaluation device, when combined with the at least one sensor signal, generates an input signal that remains within a predetermined range throughout the entire period of the sensor signal.
- the steady state can mean that the evaluation device has precisely determined all the necessary output parameters (such as the sampling times (and from them, for example, the maximum and minimum values of the sensor signals) or the offset signal) in order to analyze the at least one sensor signal very precisely and derive information about the gas concentration or thermal conductivity. From information about the heating power controlled by the evaluation device and the information derived from the at least one sensor signal by means of the evaluation device, the evaluation device can very precisely determine information about the gas concentration or thermal conductivity of the gas detected by the gas sensor.
- the necessary output parameters such as the sampling times (and from them, for example, the maximum and minimum values of the sensor signals) or the offset signal
- the evaluation device can be configured to pause the control of the heating power while the sampling times are being adjusted or adjusted and/or while the offset signal is being adjusted. This feature can reduce errors during the adjustment or adjustment of the sampling times and/or during the adjustment of the offset signal, or enable very fast and efficient adjustment, whereby the evaluation device can be configured to very quickly and very accurately determine information about the gas concentration and the thermal diffusivity of a gas.
- the evaluation arrangement can be designed to control both an average heating power or a maximum heating power as well as an amplitude of the heating power.
- the average heating power can be, for example, a power averaged over a time in which the excitation signal is applied to the heater.
- the amplitude of the heating power can vary.
- the maximum heating power can, for example, correspond to a maximum amplitude of the heating power of the heater within a time period.
- the amplitude of the heating power can also be nearly constant. Accordingly, for example, the amplitude of the heating power can be controlled to vary over time.
- An embodiment according to the present invention provides a method for operating an evaluation arrangement for a thermal gas sensor with at least one heater and two detectors, which are arranged, for example, at different distances from the heater or at the same distance from the heater.
- the method comprises regulating a heating power applied to the heater as a function of at least one sensor signal from at least one of the two detectors in order to bring the at least one sensor signal into a predetermined value range.
- the method comprises taking into account information about the heating power (for example Hz.Uss) when deriving information about a gas concentration from the sensor signals from the two detectors.
- An embodiment according to the present invention relates to a computer program with a program code for carrying out a method when the program runs on a computer.
- One embodiment relates to an evaluation arrangement for a thermal gas sensor with at least one heater and at least one detector, or two detectors arranged at different distances from the heater, or two detectors arranged at the same distance from the heater.
- the evaluation arrangement can be designed to apply a periodic signal with a predetermined period to the heater.
- the evaluation arrangement can be designed to sample at least one sensor signal from one of the detectors at three points in time, wherein a second sampling time is offset by 90° from a first sampling time, relative to the period, and wherein a third sampling time is offset by 180° from the first sampling time, relative to the period.
- the evaluation arrangement can also be designed to detect, based on three samples based on a sample of the sensor signal at the first sampling time, the second sampling time, and the third sampling time, whether a first sampling value and a third sampling value represent a maximum value and a minimum value of the sensor signal.
- the sampling times e.g., the first sampling time, the second sampling time, and/or the third sampling time
- the sampling times can deviate from the sampling time specified by the evaluation arrangement by +/- 0.5°, +/- 1°, +/- 2°, or +/- 5°.
- the second sampling time can deviate from the first sampling time by, for example, 1/4 of a period, 5/4 of a period, or 9/4 of a period.
- the third sampling time can be time-shifted from the first sampling time, for example, by 1/2 period, by 3/2 period or by 5/2 period.
- This exemplary embodiment of the evaluation arrangement is based on the finding that an amplitude of the at least one sensor signal, detected by one of the at least two detectors of the thermal gas sensor arranged at different distances from the heater, can be measured very precisely if an analog/digital conversion of the at least one sensor signal occurs at the correct times. This is, for example, the time at which the at least one sensor signal has the maximum or minimum value.
- the evaluation arrangement can be designed to detect that the first sampling time and the third sampling time are incorrectly selected by sampling the at least one sensor signal at the second sampling time, at which a "zero crossing" of the at least one sensor signal is suspected. If the first sampling time, the second sampling time, and the third sampling time are correct, the evaluation arrangement can detect whether the first sampling value and the third sampling value represent a maximum value and a minimum value of the sensor signal. The second sampling time can thus ensure this check for the evaluation arrangement.
- a value range e.g., from the minimum value to the maximum value
- the sampling times in the form of the minimum and/or maximum values represent very well-defined positions of the sensor signals, whereby phase differences and/or amplitude differences between the periodic signal of the heater and the at least one sensor signal from at least one of the detectors can be determined very precisely, simply, and efficiently by the evaluation device. From the phase differences and amplitude differences thus determined, the evaluation device can, for example, perform a very precise gas analysis.
- the evaluation arrangement can carry out a very accurate, fast and efficient gas analysis of the gas detected by the thermal gas sensor by very precisely determining, for example, amplitudes (e.g. minimum value, maximum value) of the sensor signal (a signal detected by at least one of the two detectors, transmitted from the heater via the gas) by precisely determining the first sampling time, the second sampling time and the third sampling time.
- amplitudes e.g. minimum value, maximum value
- the evaluation arrangement can be designed to change sampling times depending on the detection of whether the first sample value and the third sample value represent a maximum value and a minimum value of the sensor signal.
- the evaluation arrangement can detect whether the sampling times have been incorrectly selected.
- the first sample value and the third sample value represent a maximum value or a minimum value of the sensor signal and if, for example, there is a deviation of the sampling time of less than ⁇ 0.5°, ⁇ 0.7° or ⁇ 1° or less than ⁇ 10 ⁇ s, ⁇ 15 ⁇ s or ⁇ 20 ⁇ s, the evaluation device decides, for example, that no change to the sampling values will be made. This makes it possible to correct the sampling times and to set them so precisely by the evaluation arrangement that the evaluation arrangement can perform a very accurate, fast and efficient gas analysis.
- the evaluation arrangement can be designed to set or adjust the sampling times such that the first sample value represents a first extreme value of the sensor signal, for example a maximum value or a minimum value, and the third sample value represents a second extreme value, for example the minimum value or the maximum value, of the sensor signal.
- the second sample value can, for example, represent an average value or a DC component of the sensor signal (e.g., a zero crossing of the sensor signal).
- the evaluation arrangement can be designed to sample the at least one sensor signal and check whether the first sample value and the third sample value represent a maximum value or a minimum value of the sensor signal until the first sample value represents the first extreme value of the sensor signal and the third sample value represents the second extreme value of the sensor signal. This ensures that the evaluation arrangement is adjusted such that an amplitude of the sensor signal can be determined very precisely.
- the evaluation arrangement thus performs, for example, a very precise gas analysis of the gas detected by the thermal gas sensor.
- the evaluation arrangement can be designed to consider information about the time at which the sensor signal passes through a predetermined threshold when setting or adjusting the sampling times.
- the predetermined threshold can, for example, correspond to a DC component or an average value of the sensor signal.
- the time at which the sensor signal passes through the predetermined threshold can, for example, correspond to the second sampling time.
- the predetermined threshold can, for example, define a "zero crossing" of the sensor signal, whereby the "zero crossing" can be provided with an offset.
- the evaluation arrangement can very quickly and easily check or detect whether the first sampling value and the third sampling value correspond to the maximum and minimum values of the sensor signal.
- the sampling times can be determined very precisely and accurately by the evaluation device, which also enables a very precise gas analysis by the evaluation device.
- the evaluation arrangement can be designed to check whether a second sample value at the second sampling time is equal to an average value of the first sample value at the first sampling time and the third sample value at the third sampling time, and to detect, depending on the check, whether the first sample value and the third sample value represent a maximum value and/or a minimum value of the sensor signal.
- the second sample value can deviate from the average value with a tolerance of at most ⁇ 0.5%, ⁇ 1%, or ⁇ 5% of a difference between the first sample value and the third sample value. This feature enables the evaluation arrangement to detect, using the second sampling time, whether the first sample value and the third sample value correspond to the maximum value or the minimum value of the sensor signal. Thus, possible errors of the evaluation arrangement in determining the first sample value, the second sample value, and the third sample value can be reduced, and a very precise gas analysis can be performed.
- the evaluation arrangement can be designed to generate a periodic square-wave signal or a pulse with a defined power with a duty cycle of preferably 50% to the heater.
- the duty cycle can also be in a range from 5 to 50%. In this case, for example, a duty cycle tolerance of ⁇ 1%, ⁇ 2% or ⁇ 5% is possible.
- the evaluation arrangement can be designed to change the duty cycle at a fixed operating voltage of the heater in order to adapt a heating power of the heater.
- the evaluation arrangement can be designed to combine a sensor signal from at least one of the detectors with an offset signal generated by a digital-to-analog converter in order to obtain an input signal for an analog-to-digital converter and to adjust the offset signal in order to ensure that the input signal of the analog-to-digital converter remains within a predetermined range (e.g., a value range) throughout an entire period of the sensor signal.
- the evaluation arrangement can be designed to adjust the sampling times after adjusting the offset signal and, after changing the sampling times, to perform a new check to determine whether the sampled values obtained with the changed setting of the sampling times still lie within the predetermined range.
- the analog-to-digital converter digitizes, for example, signal values present at the sampling times and thus samples the sensor signal.
- the evaluation device can adjust the offset signal, for example, in response to a detection that an input value of the analog-to-digital converter exceeds a predetermined upper threshold (e.g., 95%, 90%, or 85% of a maximum processable input value of the analog-to-digital converter), or in response to a detection that an input value of the analog-to-digital converter falls below a predetermined lower threshold (e.g., 5%, 10%, or 15% of a maximum processable input value of the analog-to-digital converter).
- the sampling times can be adjusted, for example, as part of a tracking of the sampling times after adjustment of the offset signal.
- the offset signal can be used, for example, to ensure that the input signal combined from the sensor signal and the offset signal remains within the predetermined range, wherein the predetermined range can be defined, for example, as the detectable limit of the analog-to-digital converter (e.g., an operating range of the analog-to-digital converter). can be defined.
- the offset signal can, for example, amplify or reduce the sensor signal and thus continuously (e.g., during the entire period) keep it within an optimal operating range or operating window (e.g., the specified range) of the analog-to-digital converter.
- the specified range within which the input signal of the analog-to-digital converter should remain throughout the entire period of the sensor signal can be defined both by a specified range for the amplitude of the sensor signal and by a specified range for the offset of the sensor signal.
- the offset signal can not only offset the sensor signal within the specified range of the analog-to-digital converter, but also regulate the amplitude of the sensor signal such that the input signal has an amplitude that occupies a large part of the specified range in terms of amplitude. If the evaluation system has changed the sampling times, the sampling times are checked again using the obtained sampling values (or input values of the analog-to-digital converter).
- the specified range within which the obtained sampling values should lie can, for example, be between the specified lower threshold value and the specified upper threshold value.
- the evaluation system can be designed to readjust the offset signal and/or the heater's heating power if necessary after re-checking the obtained sample values.
- the evaluation system enables the sensor signal to be analyzed very precisely by an analog-to-digital converter, since the sensor signal is converted with an offset signal, for example, into an input signal that can occupy an optimal operating range of the analog-to-digital converter (the specified range). This enables the evaluation system to perform a very precise gas analysis using the characteristic.
- the evaluation arrangement can be designed to regulate a heating power applied to the heater depending on at least one sensor signal from at least one of the detectors in order to bring the at least one sensor signal into a predetermined value range. Furthermore, the evaluation arrangement can be designed to take into account information about the heating power (for example Hz.Uss) when deriving information about a gas concentration from the sensor signals. The evaluation arrangement can, for example, be designed to regulate a heating power such that an amplitude of the sensor signal can be brought within the predetermined value range. The amplitude can be the minimum value and/or the maximum value of the sensor signal or a Difference between maximum value and minimum value.
- the heater can be supplied with a heating power by the evaluation arrangement so that the sensor signal detected by a detector has an amplitude that covers at least almost the entire predetermined value range.
- the predetermined value range can, for example, represent an operating range of an analog-to-digital converter with which the sensor signal can be processed by the evaluation arrangement.
- the evaluation arrangement can, for example, supply the heater with a heating power so that the at least one sensor signal occupies at least 70%, 75%, or 80% of the operating range of the analog-to-digital converter.
- the evaluation arrangement can be designed to determine information about the gas concentration or the thermal conductivity of the sensor signal depending on information about the heating power and depending on information about the sensor signal.
- the information about the heating power can, for example, define an amplitude of the heating power, a phase of the heating power, and/or an offset of the heating power.
- the information about the sensor signal can, for example, define the amplitude of the sensor signal, the phase of the sensor signal, and/or the offset of the sensor signal.
- One embodiment provides a method for operating a thermal gas sensor with at least one heater and two detectors arranged at different distances from the heater.
- the method can comprise applying a periodic signal with a predetermined period to the heater.
- At least one sensor signal can be sampled by one of the detectors at three points in time, wherein a second sampling time can be offset from a first sampling time by 90°, relative to the period (for example, +/- 2% or +/- 2°) (i.e., for example, by 1/4 period, 5/4 period, or 9/4 period), and wherein a third sampling time can be offset from the first sampling time by 180°, relative to the period (for example, +/- 2% or +/- 2°) (i.e., for example, by 1/2 period, 3/2 period, or 5/2 period).
- a first sample value and a third sample value represent a maximum value and a minimum value of the sensor signal (for example up to a DC offset). That the first sample value and the third sample value represent a maximum value and a Represent minimum value of the sensor signal may mean that the first sample value represents, for example, a maximum value and the third sample value a minimum value or that the first sample value represents a minimum value and the third sample value a maximum value (this applies to all embodiments listed herein).
- One embodiment relates to a computer program having a program code for carrying out a method when the program runs on a computer.
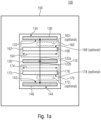
- Fig. 1a shows a schematic representation of a gas sensor 100.
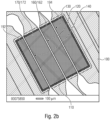
- the gas sensor 100 can have a membrane 110 (e.g., a thin-film membrane), a heating element 120, a first thermocouple structure 130, and a second thermocouple structure 140.
- the gas sensor can also have only the first thermocouple structure 130 or the second thermocouple structure 140.
- the membrane 110 can be spanned by a frame 150 and have a first interruption region 160 and a second interruption region 170.
- the first interruption region 160 of the membrane 110 can have at least one interruption 162, and the second interruption region 170 of the membrane 110 can also have at least one interruption 172.
- the heating element 120 can, for example, be arranged as a self-supporting bridge structure on the membrane 110 between the first interruption region 160 and the second interruption region 170 of the membrane 110.
- the first thermocouple structure 130 may have a hot end 132 and a cold end 134.
- the hot end 132 of the first thermocouple structure 130 may be disposed on the membrane 110 on a side of the first break region 160 opposite the heating element 120.
- the second thermocouple structure 140 may also have a hot end 142 and a cold end 144.
- the hot end 142 may be disposed on the membrane 110 on a side of the second break region 170 opposite the heating element 120.
- the membrane 110 can be a thin-film membrane with a thickness between 200 nm and 4000 nm, 300 nm and 3000 nm, 400 nm and 2000 nm, or between 1 ⁇ m and 10 ⁇ m. According to one embodiment, the thickness of the entire membrane is approximately 2 ⁇ m (it consists, for example, of several membrane, sensor, and passivation layers).
- the membrane layer can comprise, for example, Si oxide and/or Si nitride. The thickness can be defined as an extension of the membrane 110 into the plane of the sheet, i.e., for example, perpendicular to a surface of the membrane 110 on which the heating element 120, the first thermocouple structure 130, and the second thermocouple structure 140 are arranged.
- the membrane 110 may comprise conductive material, insulating material, or semiconductor material, wherein the material may have a very low thermal conductivity, for example, below 5 W/(m*K), below 100 mW/(m*K), or below 50 mW/(m*K).
- a semiconductor with matched basic doping can serve as a cost-effective substrate for fabricating the membrane 110 in a simple five-mask MEMS process.
- the heating element 120 may form a cantilevered bridge structure and/or comprise a wire.
- the heating element 120 may be spanned from one side of the frame 150 to an opposite side of the frame 150.
- a voltage may be applied to the heating element 120, whereby the heating element 120 can transfer heating power to a gas to be analyzed, located, for example, in the first interruption region 162 and/or in the second interruption region 172.
- the voltage applied to the heating element 120 may, for example, be a periodic voltage signal, such as a sine signal or a periodic square wave signal.
- the heating element 120 can, for example, provide a periodic heater signal (for example, the heating power).
- the heater signal may be transmitted, for example, via the membrane 110 and/or via a gas located, for example, in the first interruption 162 or the second interruption 172, to the first thermocouple structure 130 and/or the second thermocouple structure 140.
- the first thermocouple structure 130 and/or the second thermocouple structure 140 are, for example, formed in a meandering shape, which can correspond, for example, to series-connected thermocouples forming a thermocouple chain.
- the first thermocouple structure 130 and/or the second thermocouple structure 140 can thus serve as a detector, wherein the first thermocouple structure 130 and/or the second thermocouple structure 140 can detect, for example, the heater signal.
- the first thermocouple structure 130 and/or the second thermocouple structure 140 can be arranged entirely on the membrane 110, or at least partially on the membrane 110 and at least partially on the frame 150.
- a temperature of the frame 150 can serve as a comparison temperature (here, for example, the cold ends 134 of the first thermocouple structure 130 and/or the cold ends 144 of the second thermocouple structure 140 can be arranged), and the part of the thermocouple structure arranged on the membrane 110 (e.g., the hot ends 132, 142) can detect a measurement temperature (e.g., the heater signal).
- the hot ends 132, 142 and the cold ends 134, 144 are connected, for example, to a conductor.
- a conductor comprising a first material may connect a first cold end to a first hot end
- a second conductor comprising a second material may connect the first hot end to a second cold end.
- This connection a first conductor and a second conductor can represent a thermocouple, which can be connected in series to a thermocouple chain, for example, and can thus represent, for example, the first thermocouple structure 130 or the second thermocouple structure 140.
- a temperature difference e.g., between the comparison temperature and the measurement temperature
- first thermocouple structure 130 and/or the second thermocouple structure 140 can be designed, for example, to convert heat into electrical energy.
- first thermocouple structure 130 and/or the second thermocouple structure 140 can be a wire or a self-supporting bridge structure.
- the membrane 110 can be spanned by the frame 150 made of carrier material, which is designed such that the thermal expansion coefficient and/or thermal conductivity of the membrane material differs from the thermal expansion coefficient and/or thermal conductivity of the carrier material.
- the frame 150 can comprise carrier material or substrate material with which the membrane 110 can be supported, for example.
- a comparison temperature can be set on the frame 150, for example.
- the frame 150 and the membrane 110 can also have the same thermal expansion coefficient.
- the membrane 110 may have a lower thermal conductivity than the frame 150.
- the membrane 110 in particular should, for example, have a very low thermal conductivity so that, for example, the heater signal from the heating element 120 is transmitted mainly via the gas to be analyzed (arranged, for example, in the first interruption 162 and/or in the second interruption 172) to the first thermocouple structure 130 and/or the second thermocouple structure 140, instead of via the membrane 110.
- heat transport via the membrane 110 can be suppressed, reduced, or slowed down.
- the membrane 110 can thus be designed to suppress parasitic heat conduction from the heating element 120 to the first thermocouple structure 130 or to the second thermocouple structure 140.
- the thermal conductivity of the membrane 110 can, for example, be selected such that little to no heat is conducted from the heating element 120 via the membrane 110 to the first thermocouple structure 130 or the second thermocouple structure 140 and a large part of the heat or all of the heat is conducted via the gas to be analyzed.
- the thermal conductivity of the carrier material of the frame 150 can be very high.
- silicon with a thermal conductivity of 150 W/(m*K) can be used as the carrier material.
- the carrier material can thus serve as a heat sink.
- the first thermocouple structure 130 or the second thermocouple structure 140 is arranged at least partially, e.g., with the hot ends 132, 142, on the membrane and at least partially, e.g., with the cold ends 134, 144, on the carrier material, whereby a temperature difference can occur within the first thermocouple structure 130 or the second thermocouple structure 140, which can be used to detect the heat transport from the heating element 120 to the respective thermocouple structure 130, 140.
- the cold ends of the first thermocouple structure 130 and the cold ends of the second thermocouple structure 140 can thus be arranged on the carrier material of the frame 150. They are located, for example, where the membrane 110 is supported by the carrier material.
- the first interruption region 160 of the membrane 110 may have a continuous interruption 162 whose longitudinal extent 164 is large enough to completely cover the area between the first thermocouple structure 130 and the heating element 120.
- the second interruption region 170 of the membrane 110 may have a continuous interruption 172 whose longitudinal extent 174 is large enough to completely cover the area between the second thermocouple structure 140 and the heating element 120.
- the longitudinal extent 164, 174 is, for example, as large as the complete length of the heating element 120 and/or at least as long as the complete length of the first thermocouple structure 130 and/or the second thermocouple structure 140.
- thermocouple structure 130 This enables as little heat as possible to be transferred from the heating element 120 to the first thermocouple structure 130 or the second thermocouple structure 140 via the membrane 110, but rather a large portion via a gas in the first interruption 162 in the first interruption region 160 and/or in the second interruption 172 in the second interruption region 170.
- the transverse extent 166 of the at least one interruption 162 of the first interruption region 160 may be different from the transverse extent 176 of the at least one interruption 172 of the second interruption region 170.
- the transverse extent 166, 176 of the first interruption 162 or the second interruption 172 may, for example, be oriented in a direction perpendicular to a direction of maximum extension of the heating element 120 or in a direction from the heating element 120 to the respective thermocouple structures (e.g., the first thermocouple structure 130 and/or the second thermocouple structure 140).
- Fig. 1a For example, the first interruption 162 and the second interruption 172 have the same transverse extent 166, 176.
- the first interruption 162 can have a longitudinal extent 164 and a transverse extent 166, such that the first interruption 162 corresponds to the extents of the first interruption region 160.
- the second interruption 172 can, for example, have a longitudinal extent 174 and a transverse extent 176, such that the second interruption 172 corresponds to the extents of the second interruption region 170.
- the entire first interruption region 160 can represent the first interruption 162
- the entire interruption region 170 can represent the interruption 172.
- the membrane 110 can have a third and/or a fourth interruption region on the side of the cold ends 134, 144 of the first thermocouple structure 130 and/or the second thermocouple structure 140.
- the first thermocouple structure 130 can be arranged in the form of a wire or a self-supporting bridge structure between the first interruption region 160 and a third interruption region
- the second thermocouple structure 140 can be arranged, for example, as a wire or as a self-supporting bridge structure between the second interruption region 170 and the fourth interruption region.
- the first thermocouple structure 130 and/or the second thermocouple structure 140 can be surrounded, for example, on two sides by the gas to be analyzed.
- the first thermocouple structure 130 may have a different distance from the heating element 120 than the second thermocouple structure 140.
- the first thermocouple structure 130 has the same Distance from the heating element 120, like the second thermocouple structure 140.
- the heater signal from the heating element 120 detected by the first thermocouple structure 130 can be referred to, for example, as a first sensor signal, and the heater signal from the heating element 120 detected by the second thermocouple structure 140 can be referred to, for example, as a second sensor signal.
- the first sensor signal and/or the second sensor signal can, for example, comprise the two unknown heat transitions (e.g.: heating element -> gas, gas -> thermocouple structure) and a heat transfer via the gas to be analyzed.
- a difference signal from the gas sensor can be created from the first sensor signal and the second sensor signal, for example by subtracting the unknown heat transitions (the first sensor signal can have the same heat transitions as the second sensor signal), and thus the difference signal only comprises, or to a large extent, the heat transfer via the gas to be analyzed from the heating element 120 to the respective thermocouple structure 130, 140, but does not comprise, or comprises to a very small extent, the unknown heat transitions.
- the first interruption region 160 and the second interruption region 170 can have a plurality of interruptions (e.g., the interruption 162 and the interruption 162 1 or the interruption 172 and the interruption 172 1 ), which can be arranged such that (e.g., due to the remaining membrane material 110) a lattice structure is created (e.g., in the first interruption region 160 or the second interruption region 170), in which the interruptions are arranged in rows parallel to the heating element 120 and the rows are offset from one another.
- the interruptions in an interruption region 160, 170 can differ from one another both in the longitudinal extent 164, 174 and in the transverse extent 166, 176. According to Fig.
- the interruption 162 1 of the first interruption region 160 has a smaller longitudinal extent than the longitudinal extent 164 of the interruption 162.
- the interruption 172 1 of the second interruption region 170 can have a smaller longitudinal extent than the longitudinal extent 174 of the interruption 172.
- the first interruption region 160 and the second interruption region 170 can have a plurality of interruptions, which can be arranged to create a lattice structure in which a path of heat conduction through the membrane 110 is longer than a direct path 122a, 122b.
- the direct path 122a, 122b can, for example, be a straight path perpendicular to the heating element 120, from the heating element 120 to the thermocouple structure 130, 140.
- the direct path 122a, 122b can run through the interruptions 162 and 1621 or through the interruptions 172 and 1721 , respectively, whereby heat conduction through the gas to be analyzed can be detected by the first thermocouple structure 130 and/or the second thermocouple structure 140.
- the direct path 122a, 122b were to occur only via the membrane 110 and not via the gas to be analyzed, the gas sensor 100 cannot ensure a meaningful analysis of the gas.
- the at least one interruption 162, 172 in the first interruption region 160 and in the second interruption region 170 can form rectangular cutouts with optionally rounded corners. This is, for example, an elongated hole. These can also be oval holes, for example. Even if in Fig. 1a While the interruption 162 of the first interruption region 160 and the interruption 172 of the second interruption region 170 are depicted as rectangular interruptions (holes), the interruptions can have any shape (such as triangular, circular, square, polygonal, etc.).
- the shape of the interruptions 162, 172 can be adapted so that a heat path from the heating element to the first thermocouple structure 130 and/or to the second thermocouple structure 140 via the membrane 110 is as long as possible and a path via the gas to be analyzed represents a very short path. This makes it possible to transport as much heat as possible via the gas to be analyzed and not via the membrane 110, whereby the gas sensor 100 can analyze the gas very precisely.
- the at least one interruption 162, 172 may be at least three times longer than it is wide.
- the longitudinal extent 164 of the interruption 162 may be three times longer than the transverse extent 166
- the longitudinal extent 174 of the interruption 172 may be three times longer than the transverse extent 176.
- the length represents, for example, the longitudinal extent 164, 174
- the width represents, for example, the transverse extent 166, 176.
- the length may, for example, be defined as a direction parallel to the heating element 120 (or to a direction of maximum extent of the heating element 120), and the width may be defined as a direction perpendicular to the heating element 120 (or to a direction of maximum extent of the heating element 120).
- a distance 168 between a plurality of interruptions 162, 162 in the first interruption region 160 and a distance 178 between a plurality of interruptions 172, 172 in the second interruption region 170 can correspond to the smallest structure width that can be realized and results in a mechanically durable lattice structure.
- the distance 168, 178 can define a width of webs between two interruptions consisting of membrane material of the membrane 110. The smaller the distance 168, 178, the less heat is transferred via the membrane 110 from the heating element 120 to the first thermocouple structure 130 and/or the second thermocouple structure 140, and the more heat is transferred via the gas to be analyzed.
- the first thermocouple structure 130 and the second thermocouple structure 140 can be passivated with a protective layer.
- the protective layer can protect the first thermocouple structure 130 and the second thermocouple structure 140 from damage caused by the gas to be analyzed and thus prevent possible inaccuracies of the gas sensor during gas analysis due to damage to the first thermocouple structure 130 or the second thermocouple structure 140.
- the hot end 132 of the first thermocouple structure can extend to an edge of the first interruption region 160 of the membrane 110 and the hot end 142 of the second thermocouple structure 140 can extend to an edge of the second interruption region 170 of the membrane 110.
- the distance between the hot end 132 and the first interruption region 160 or the distance between the hot end 142 and the second interruption region 170 should, for example, not be greater than 0.5 mm, 100 nm or 10 ⁇ m.
- the membrane 110 has only a very small distance between the respective hot ends and the respective interruption. This allows the membrane material of the membrane 110 to not impair, or only slightly impair, the detection of the heater signal by the first thermocouple structure 130 or by the second thermocouple structure 140, respectively, allowing the gas sensor 100 to analyze the gas very precisely.
- Fig. 1b shows a schematic representation of an evaluation arrangement 200, which can also be referred to herein as an evaluation device, for a thermal gas sensor 100 with at least one heater 120 and two detectors arranged at different distances 180 1 , 180 2 from the heater 120 (a first detector 130 and a second detector 140).
- the first detector 130 can be spaced from the heater 120 by the distance 180 1
- the second detector 140 can be spaced from the heater 120 by the distance 180 2 .
- the evaluation arrangement 200 can be designed to obtain information 210 about an amplitude of a detector signal of a first detector 130, information 220 about an amplitude of a detector signal of a second detector 140, information 210 about a first phase difference between a heater signal and the detector signal of the first detector 130 and information 220 about a second phase difference between the heater signal and the detector signal of the second detector 140.
- the information 210 can include both the amplitude of the detector signal of the first detector 130 and the first phase difference between the heater signal and the detector signal of the first detector 130, just as the information 220 can include both the amplitude of the detector signal of the second detector 140 and the second phase difference between the heater signal and the detector signal of the second detector 140.
- the amplitude of the detector signal of the respective detector of the first detector 130 or the second detector 140
- the evaluation arrangement 200 can be designed to determine as an intermediate variable depending on the information 210, 220 about the amplitudes of the detector signals and to form a combination signal 230 depending on the information 210, 220 about the first phase difference and the second phase difference.
- the combination signal 230 can combine amplitude information and phase information of the detector signal of the first detector 130 and the detector signal of the second detector 140.
- the evaluation arrangement 200 can be designed to determine information 240 about a gas concentration or a thermal conductivity of a fluid, for example a gas or gas mixture, based on the combination signal 230. The evaluation arrangement 200 can perform this determination, for example, without separately considering the individual pieces of information 210, 220 flowing into the combination signal 230 again in the further course of the calculations.
- the amplitude of the detector signal can, for example, be provided directly as information 210, 220 from the respective detector 130, 140.
- the information 210, 220 about the first phase difference and second phase difference between the heater signal 122 and the detector signal of the respective detector 130, 140 can, for example, be determined by the thermal gas sensor 100 and transmitted to the evaluation arrangement 200.
- the detector signal of the first detector 130 or the detector signal of the second detector 140 can be transmitted to the evaluation arrangement 200 via the information 210 or the information 220, respectively, and the heater signal 122 can additionally be transmitted directly to the evaluation arrangement 200.
- the evaluation arrangement can be configured to determine the respective amplitude from the detector signal of the first detector 130 and from the detector signal of the second detector 140 and to determine the first phase difference and the second phase difference in order to form the combination signal 230 depending on the information thus determined.
- the evaluation arrangement 200 can correct possible errors of the thermal gas sensor 100 very easily and much more quickly in order to obtain the information 240 about the gas concentration and a thermal conductivity than if the evaluation arrangement 200 separately corrects the information 210 about the amplitude of the detector signal of the first detector 130 and the first phase difference, as well as the information 220 about the amplitude of the detector signal of the second detector 140 and the second phase difference.
- the combination signal 230 can thus facilitate the determination of the information 240 about the gas concentration and the thermal conductivity of the gas to be analyzed, as well as enable errors generated by the thermal gas sensor 100 to be suppressed or reduced.
- the evaluation arrangement 200 can be designed to obtain information about a heater amplitude, for example information about a heating power from the heater signal 122, and to form a linear combination of the information about the heater amplitude, the information 210 and the information 220 in order to determine the combination signal 230.
- the evaluation arrangement 200 can not only obtain the information about the heater amplitude from the heater signal 122, but also, as already described above, calculate information about the first phase difference and about the second phase difference if the information 210 comprises, for example, the detector signal of the first detector 130 and the information 220 comprises the detector signal of the second detector 140.
- the combination signal 230 includes not only the phase of the heater signal in the form of the first phase difference and the second phase difference, but also the heater amplitude, which enables the evaluation arrangement 200 to determine the information 240 about the gas concentration and the thermal conductivity of the gas to be analyzed as a function of the first distance 180 1 and the second distance 180 2 of the two detectors from the heater 120.
- the detector signal of the first detector 130 has a greater amplitude than the detector signal of the second detector 140 because the distance 180 2 of the second detector 140 from the heater 120 is greater than the distance 180 1 of the first detector 130 from the heater 120.
- the heater amplitude detected by the respective detector 130, 140 can decrease.
- the additional information about the heater amplitude allows the evaluation arrangement 200 to determine the information 240 about the gas concentration and the thermal conductivity even more accurately because the heater amplitude of the heater signal 122 can be considered a reference, and thus the combination signal 230 can have a relative amplitude signal.
- a relative amplitude signal for example, is less prone to errors than an absolute amplitude signal.
- Term sigUss can be amplitude information or an amplitude signal that can depend on information 210 about the amplitude of the detector signal of the first detector 130 and on information 220 about the amplitude of the detector signal of the second detector 140.
- sigUss can be a linear combination of information 210 about the amplitude of the detector signal of the first detector 130 and information 220 about the amplitude of the detector signal of the second detector 140.
- sigPhi can be phase information or an added phase signal that can depend on information 210 about a first phase difference and information 220 about the second phase difference.
- sigPhi can be an addition of information 210 about the first phase difference and information 220 about the second phase difference.
- Ka and Kp can be constants.
- the combination signal 230 thus determined can comprise amplitude information sigUss and phase information sigPhi, whereby four pieces of information (e.g., information 210 about the amplitude of the detector signal of the first detector 130, information 220 about the amplitude of the detector signal of the second detector 140, information 210 about a first phase difference between the heater signal and the detector signal of the first detector 130, and information 220 about the second phase difference between the heater signal and the detector signal of the second detector 140) are combined in the combination signal 230, whereby the evaluation arrangement 200 can use less power to process the information 210, 220.
- the evaluation arrangement 200 can be designed to determine information 240 about the gas concentration and thermal conductivity very efficiently, quickly, and accurately.
- Hz.Uss can be information about the heater amplitude, which can be obtained from the heater signal 122.
- D1.Uss can be information 210 about the amplitude of the detector signal of the first detector 130, and D2.Uss can be information 220 about the amplitude of the detector signal of the second detector 140.
- the amplitude information sigUss can represent a relative amplitude signal, since the information 210 about the amplitude of the detector signal of the first detector 130, the information 220 about the amplitude of the detector signal of the second detector 140, and the heater amplitude Hz.Uss are offset against each other, so that the information 210 about the amplitude of the detector signal of the first detector 130 and the information 220 about the amplitude of the detector signal of the second detector 140 can be viewed relative to the heater amplitude. By viewing the amplitudes relative to each other, possible errors of absolute amplitude values are avoided, whereby the evaluation arrangement 200 can determine the information 240 about the gas concentration and thermal conductivity very precisely.
- the evaluation arrangement 200 can be configured to calculate a polynomial, for example, of the first degree, of the combination signal 230 in order to obtain the information 240 about the gas concentration or the thermal diffusivity.
- the polynomial e.g., polynomial y
- y A0+A1*sigX+A2*sigX 2 .
- the evaluation arrangement 200 can be configured to multiply the polynomial of the combination signal 230 by a correction term to obtain the information 240 about the gas concentration and/or the thermal diffusivity.
- the correction term of the combination signal 230 can be dependent on information about a pressure and on information about a temperature and, for example, compensate for a pressure and temperature dependence. In other words, the correction term of the combination signal 230 can compensate for a pressure drift and/or a temperature drift. Thus, a possible misinterpretation by the evaluation arrangement 200 of the signals detected by the thermal gas sensor 100 is reduced.
- sigX can be the combination signal 230
- pol(sigX) can be a polynomial of the combination signal sigX 230
- f(p) can be a function of a pressure p
- const1 can be a constant
- f(T) can be a function of the temperature T
- const2 can be a second constant.
- f(p) can be a function of a measured pressure p in an environment of the thermal gas sensor 100
- f(T) can be a function of a measured temperature T in an environment of the thermal gas sensor 100.
- the second term of the multiplication 1 ⁇ f p sigX ⁇ const 1 ⁇ 1 ⁇ f T p ⁇ const 2 can also be used as a correction term of the combination signal 230.
- the correction term can depend on the measurement conditions of the gas sensor 100 (such as an ambient pressure/measurement pressure or an ambient temperature/measurement temperature).
- the correction term can thus correct possible influences of an ambient pressure or an ambient temperature of the thermal gas sensor 100 on the determination of the information 240 about the gas concentration. Thus, possible pressure drift or temperature drift can be suppressed.
- sigX can be the combination signal 230
- Ay(sigX) can be a polynomial of the combination signal sigX 230 (e.g., first order)
- By(p) can be a function of the pressure p (e.g., a polynomial function, e.g., second order)
- B.ref can be a constant
- Cy(T) can be a function of the temperature T (e.g., a polynomial function, e.g., second order)
- C.ref can be a second constant.
- the function By(p) can, for example, be a function of a measured pressure p in an environment of the thermal gas sensor 100
- the function Cy(T) can be a function of a measured temperature T in an environment of the thermal gas sensor 100.
- the multiplication for calculating the information C 240 about the gas concentration can define a correction term.
- the correction term can depend, for example, on the pressure p and the temperature T.
- By(p) can be a polynomial function dependent on the pressure p, whereby, for example, a correction for possible pressure influences on the calculation of the information 240 about the gas concentration can be taken into account.
- Cy(T) a possible influence of the temperature T on the calculation of the information 240 about the gas concentration can be taken into account very precisely.
- the evaluation arrangement 200 can be designed to take into account a pressure and/or a temperature in an environment of the thermal gas sensor 100 when determining the information 240 about the gas concentration and/or the thermal conductivity.
- the thermal gas sensor 100 can, for example, have pressure and temperature sensors with which it can detect the pressure and/or the temperature in the environment and transmit it to the evaluation arrangement 200.
- the evaluation arrangement 200 can, for example, take into account and correct possible miscalculations of the information 240 about the gas concentration and/or the thermal conductivity due to different pressure and/or temperature conditions in the environment of the thermal gas sensor 100.
- the evaluation arrangement 200 can react to the pressure and/or the temperature in the environment of the thermal gas sensor 100 and, accordingly, determine the information 240 about the gas concentration and/or the thermal conductivity very precisely.
- the evaluation arrangement 200 can be designed to use the combination signal 230, information about the temperature in an environment of the thermal gas sensor 100, and information about a pressure in an environment of the thermal gas sensor 100 as input variables for a drift correction when determining the information 240 about the gas concentration and/or the thermal conductivity in order to obtain the information about the gas concentration and/or the thermal conductivity as a result of the drift correction.
- the drift correction can be applied to the combination signal depending on the information about the temperature and the pressure in order to obtain the information 240 about the gas concentration and/or the thermal conductivity.
- the drift correction can no longer receive any further variables apart from the three aforementioned input variables (the combination signal, the information about the temperature, and the information about the pressure), but can only use previously obtained constants, for example, determined during calibration.
- the constants can be specific to the thermal gas sensor 100 used.
- the evaluation arrangement 200 can be designed to account for small differences between thermal gas sensors 100 in the calculation of the information 240 about the gas concentration and/or thermal conductivity in order to obtain a very accurate result (information 240).
- the drift correction can, for example, correct a temperature drift and/or a pressure drift.
- Fig. 1c shows a schematic representation of an evaluation arrangement 200 according to the invention for a thermal gas sensor 100 with at least one heater 120 and two detectors (a first detector 130 and a second detector 140).
- the first detector 130 can have a first distance 180 1 from the heater 120
- the second detector 140 can have a second distance 180 2 from the heater 120.
- the first detector 130 and the second detector 140 have the same distance 180 1 , 180 2 from the heater 120.
- the first distance 180 1 can differ from the second distance 180 2 .
- the first detector 130 can be arranged at a different distance from the heater 120 than the second detector 140.
- the evaluation arrangement 200 is designed to regulate a heating power with which the heater 120 can be acted upon, depending on at least one sensor signal (e.g. a first sensor signal 210 and/or a second sensor signal 220) from at least one of the detectors (e.g. the first detector 130 and/or the second detector 140) (for example with a control unit 250 for controlling a heating power), in order to bring the at least one sensor signal 210, 220 into a predetermined value range.
- at least one sensor signal e.g. a first sensor signal 210 and/or a second sensor signal 220
- the detectors e.g. the first detector 130 and/or the second detector 140
- the at least one sensor signal 210, 220 is brought into the predetermined value range by the evaluation arrangement 200. If the heating power is increased, for example, an amplitude or a frequency of the at least one sensor signal 210, 220 can also be increased. This can be done, for example, by the evaluation arrangement 200 if the at least one sensor signal 210, 220 is too small and the predetermined value range is very large. Thus, after the heating power has been regulated by the control unit 250, the new sensor signal 210, 220 can fill the predetermined value range or lie within it.
- the predetermined value range can, for example, depend on the components used in the evaluation arrangement 200, such as an analog-to-digital converter (ADC).
- ADC analog-to-digital converter
- the ADC can further process the at least one sensor signal 210, 220 very well if the at least one sensor signal 210, 220 is adapted in the predetermined value range adapted to the ADC (e.g. ADC working range).
- the evaluation arrangement 200 can also be designed to control the heating power of the heater 120 with the control unit 250 in such a way that the heating power of the heater 120 is reduced.
- the at least one sensor signal 210, 220 can also be reduced. This can be advantageous, for example, if the at least one sensor signal 210, 220 exceeds the predetermined value range, i.e., is too large.
- the fact that the evaluation arrangement 200 is designed to control the heating power of the heater 120 with the control unit 250 makes it possible for no or only minimal information of the at least one sensor signal 210, 220 to be lost during further processing of the at least one sensor signal 210, 220 by, for example, components of the evaluation arrangement 200, such as the ADC.
- control unit 250 of the evaluation arrangement 200 can transmit a control signal 252 to the heater 120 for controlling the heating power of the heater 120.
- control unit 250 can provide information 122 about the controlled heating power of the heater 120 to the evaluation arrangement 200.
- the evaluation arrangement 200 is designed to take into account information 122 about the heating power when deriving information 240 about a gas concentration and/or a thermal conductivity from the at least one sensor signal 210, 220. This makes it possible for the control unit 250 to bring the sensor signal 210, 220 into the predetermined value range and additionally to take into account the information 122 about the heating power in the analysis, since the at least one sensor signal 210, 220 is dependent on the heating power.
- this evaluation arrangement 200 makes it possible for one sensor signal, e.g., the first sensor signal 210 or the second sensor signal 220, to be sufficient to derive the information 240 about the gas concentration and/or the thermal conductivity of a gas or fluid (e.g., a gas or gas mixture) with a certain degree of accuracy. If both the first sensor signal 210 and the second sensor signal 220 and the heating power 122 are used to derive the information 240, the determination of the information 240 is overdetermined, whereby the information 240 can be determined very precisely by the evaluation arrangement 200.
- one sensor signal e.g., the first sensor signal 210 or the second sensor signal 220
- the information 240 about the gas concentration and/or the thermal conductivity of a gas can, for example, also be derived only from the first sensor signal 210 and the second sensor signal 220, without the information 122 about the heating power of the heater 120.
- the evaluation arrangement 200 can also receive the information 122 about the heating power from the thermal gas sensor 100 instead of from the control unit 250.
- the evaluation arrangement 200 can be designed to apply a periodic signal (e.g., the control signal 252) to the heater 120.
- the periodic signal can be, for example, a periodic square-wave signal or sinusoidal signal. If the control signal 252, and thus the heat emitted by the heater 120 to the gas to be analyzed, is a periodic signal, the first sensor signal 210 detected by the first detector 130 and the second sensor signal 220 detected by the second detector 140 can also be periodic. However, due to the first distance 180 1 and the second distance 180 2 , the first sensor signal 210 and/or the second sensor signal 220 can differ in phase from the periodic signal of the heater 120 and also in amplitude from the periodic signal of the heater 120. These differences can, for example, be used by the evaluation arrangement 200 to determine the information 240 about the gas concentration and/or the thermal conductivity very precisely.
- the evaluation arrangement 200 can be configured to switch the heating power applied to the heater 120 (for example, via the control signal 252) between two values.
- a periodic square-wave signal can be applied to the heater 120.
- the heater 120 can, for example, alternately transmit a first heating power and a second heating power to the gas to be analyzed.
- the evaluation arrangement 200 can be designed to regulate an amplitude of the heating power (for example, with the control unit 250) such that both a minimum value of the at least one sensor signal 210, 220 and a maximum value of the at least one sensor signal 210, 220 lie within the predetermined value range. If the amplitude of the heating power of the heater 120 is increased, for example, by the control signal 252, the minimum value of the at least one sensor signal 210, 220 can be reduced and the maximum value of the at least one sensor signal 210, 220 can be increased, for example. If the amplitude of the heating power is reduced, for example, by the control signal 252, the minimum value of the at least one sensor signal 210, 220 can be increased and the maximum value of the at least one sensor signal 210, 220 can be reduced.
- the predetermined value range can be dependent on a value range of a component, such as an ADC, of the evaluation arrangement 200.
- the predetermined value range can be determined depending on a component value range (for example, a component of the evaluation arrangement 200).
- the predetermined value range can specify that the minimum value of the at least one sensor signal 210, 220 should be in a range from 0% to 30%, 1% to 25%, or 2% to 20% of the component value range, and that the maximum value of the at least one sensor signal 210, 220 should be in a range from 70% to 100%, 75% to 99%, or 80% to 98% of the component value range.
- the predetermined value range can, for example, have a lower value range in which the minimum value should lie and an upper value range in which the maximum value should lie.
- the evaluation arrangement 200 can be designed to set or regulate an amplitude of the heating power (for example, with the control unit 250) such that an amplitude of the at least one sensor signal 210, 220 lies within a predetermined amplitude range. If the at least one sensor signal 210, 220 has, for example, a periodic sinusoidal signal, the amplitude should lie within the predetermined amplitude range at any time of the sensor signal. In this case, the amplitude of the at least one sensor signal should utilize the entire predetermined amplitude range.
- the predetermined amplitude range can, for example, have/be divided into an upper, middle, and lower amplitude range.
- a maximum amplitude of the at least one sensor signal should, for example, lie in the upper range and a minimum amplitude in the lower range.
- the specified amplitude range can, for example, depend on the component range.
- the specified amplitude range can be determined such that the amplitude of the at least one sensor signal utilizes at least 50%, at least 65%, or at least 75% of a component value range of, for example, an analog-to-digital converter.
- the evaluation arrangement 200 can be designed to set or adjust sampling times at which a sensor signal 210, 220 can be sampled.
- the sensor signal 210, 220 can optionally be preprocessed and/or be subjected to a DC offset. According to one embodiment, it may be advantageous if the sensor signal 210, 220 is sampled at a time of maximum amplitude and at a time of minimum amplitude. These two sampling times can, for example, be set or adjusted by the evaluation arrangement 200 if the evaluation arrangement 200 determines that the sampling times have been incorrectly selected.
- the evaluation arrangement 200 can very precisely determine or derive the information 240 about the gas concentration and/or thermal conductivity of the gas to be analyzed.
- the evaluation arrangement 200 can be configured to adjust the sampling times such that sampling occurs, for example, with a phase difference of a maximum of +/- 2°, at a time at which the sensor signal 210, 220 reaches a maximum value, and such that sampling occurs, for example, with a phase difference of a maximum of +/- 2°, at a time at which the sensor signal 210, 220 reaches a minimum value.
- the maximum value can, for example, define a maximum amplitude of the sensor signal 210, 220
- the minimum value can define a minimum amplitude of the sensor signal 210, 220, as already explained above.
- the evaluation device 200 can be designed to combine a sensor signal 210, 220 from at least one of the detectors 130, 140 with an offset signal generated by a digital-to-analog converter in order to obtain an input signal for the analog-to-digital converter.
- the evaluation device 200 can be designed to adjust the offset signal in order to ensure that the input signal of the analog-to-digital converter remains within a predetermined range during an entire period of the sensor signal 210, 220.
- the offset signal can be designed, for example, to adjust the sensor signal 210, 220 such that the input signal is produced that lies within a component value range of the analog-to-digital converter.
- the offset signal can be adjusted/adjusted in order to be able to react to different sensor signals 210, 220 from different gases to be analyzed.
- the offset signal can be designed to to reduce the sensor signal 210, 220 that is too large so that the resulting input signal lies within the specified range.
- the offset signal can be configured to increase the sensor signal 210, 220 if the sensor signal 210, 220 is too small so that an input signal is created that lies within the specified range.
- the evaluation arrangement 200 can be designed, on the one hand, to bring the amplitude of the sensor signal 210, 220 into the predetermined value range by regulating the heating power and, by combining the sensor signal 210, 220 with the offset signal, to change an offset of the sensor signal 210, 220 such that the sensor signal 210, 220 lies within the predetermined value range.
- This enables the sensor signal 210, 220 to be analyzed very precisely, and thus very precise information 240 about the gas concentration and/or thermal conductivity of the gas to be analyzed can be determined by the evaluation arrangement 200.
- the evaluation device 200 can be configured to regulate the heating power only when a setting or adjustment of the sampling times is in a steady state and when an adjustment of the offset signal is in a steady state.
- a steady state can be understood to mean that the sampling times have been determined by the evaluation device 200 such that the sensor signal 210, 220 can be sampled at predefined events (such as a maximum amplitude (maximum value), a zero crossing, or a minimum amplitude (minimum value)).
- the steady state can mean that the offset signal has been adjusted such that the sensor signal 210, 220, when combined with the offset signal, generates an input signal that lies within the specified range, in order to analyze the sensor signal 210, 220 very precisely, with no or only minimal loss of information, using the evaluation device.
- presets such as the sampling times in the steady state or the offset signal in the steady state
- the new sensor signal 210, 220 can be analyzed very precisely with the presets, and under certain circumstances, no new control of the sampling times or the offset signal is necessary to derive the information 240 about the gas concentration and/or the thermal conductivity from the sensor signal 210, 220.
- the evaluation arrangement 200 can be configured to pause the control of the heating power (for example, by the control unit 250) while the sampling times are being adjusted or adjusted and/or while the offset signal is being adjusted. This can ensure, for example, that no changes are made to the sensor signal 210, 220 while the sampling times and the offset signal are not yet in a steady state. This can ensure that the sensor signal 210, 220 can be analyzed very precisely, since the sampling times and the offset signal can be determined very precisely with very little or no susceptibility to error.
- the evaluation arrangement 200 can be configured to regulate both an average heating power or a maximum heating power as well as an amplitude of the heating power.
- the control unit 250 can transmit, for example, as a control signal 252, a new heater signal for the heater 120 to the thermal gas sensor 100, wherein the control signal has, for example, a changed average heating power, maximum heating power, or amplitude of the heating power.
- the control signal 152 it is also possible for the control signal 152 to include information indicating how the average heating power, the maximum heating power, or the amplitude of the heating power should be changed by the thermal gas sensor for the heater 120.
- Fig. 1d shows a schematic representation of an evaluation arrangement 200 for a thermal gas sensor 100 with at least one heater 120 and two detectors (e.g. a first detector 130 and a second detector 140) arranged at different distances (e.g. a first distance 180 1 and a second distance 180 2 ) from the heater 120.
- the first detector 130 can, for example, have the first distance 180 from the heater 120 and the second detector 140 can have the second distance 180 2 from the heater 120.
- the evaluation arrangement 200 can be designed to apply a periodic signal 260 with a predetermined period to the heater 120.
- the periodic signal can be, for example, a square-wave signal, a pulse signal with known power, or a sine-wave signal.
- the periodic signal may also be referred to as a heater signal and may be transferred from the heater 120 in the form of heat via a gas to be analyzed to the first detector 130 and/or to the second detector 140.
- the transferred heat may be detected by the first detector 130 as a first sensor signal 210 and detected by the second detector 140 as a second sensor signal 220.
- the first sensor signal 210 and the second sensor signal 220 can have a first periodic signal and a second periodic signal, respectively, each with the predetermined period duration. This enables the gas to be analyzed very precisely with regard to its gas concentration and/or thermal conductivity by the thermal gas sensor 100 or the evaluation arrangement 200.
- the evaluation arrangement 200 can be designed to sample at least one sensor signal (e.g., the first sensor signal 210 and/or the second sensor signal 220) from one of the detectors 130, 140 at three points in time (for example, by a sampling device 270).
- a second sampling time can, for example, be offset from a first sampling time by 90°, based on the period duration (for example, by +/- 2°).
- the second sampling time can be offset from the first sampling time by 1/4 of a period, 5/4 of a period, or 9/4 of a period.
- a third sampling time can be offset from the first sampling time by 180° or from the second sampling time by 90°, based on the period.
- the first sampling time, the second sampling time, and the third sampling time can have a tolerance of +/- 2%.
- the third sampling time can therefore be offset from the first sampling time by, for example, 1/2 of a period, 3/2 of a period, or 5/2 of a period.
- the sensor signal 210, 220 can be sampled at precisely defined locations, whereby information 240 about a gas concentration and/or a thermal conductivity can be determined very precisely from the sensor signal 210, 220.
- the evaluation arrangement 200 can be designed to detect, based on three sample values based on a sample of the sensor signal at the first sampling time, at the second sampling time, and at the third sampling time (for example, performed by the sampling device 270), whether a first sample value and a third sample value represent a maximum value and a minimum value of the sensor signal 210, 220. This can be done, for example, by the checking device 280.
- the checking device 280 can, for example, ignore a DC offset and thus check, except for a DC offset, whether the first sample value represents, for example, a maximum value and the third sample value represents, for example, a minimum value of the sensor signal 210, 220.
- the second sampling time can thus, for example, be a "zero crossing" of the sensor signal 210, 220 and can be taken into account by the checking device 280.
- the first sampling time, the second sampling time, and/or the third sampling time, as well as the first sensor signal 210 and the second sensor signal 220, can be used to determine the information 240 about the gas concentration and/or the thermal conductivity of a gas detected by the thermal gas sensor 100.
- the heater signal 122 can also be included in the determination of the information 240.
- a phase difference between the first sensor signal 210 and the second sensor signal 220, as well as an amplitude difference between the first sensor signal 210 and the second sensor signal 220 can be determined, for example, based on the sampling times/sampling values.
- a phase difference and/or an amplitude difference between the first sensor signal 210 and the heater signal 122, or between the second sensor signal 220 and the heater signal 122, can also be determined. From the phase differences and amplitude differences thus determined, the information 240 about the gas concentration and/or thermal diffusivity can be determined.
- the evaluation arrangement 200 can be designed to change the sampling times depending on a detection of whether the first sample value and the third sample value represent a maximum value and/or a minimum value of the sensor signal 210, 220. This can be done, for example, by means of a sampling control device 290. Thus, for example, new sampling times can be determined if the first sample value and the third sample value do not correspond to a maximum value and/or a minimum value of the sensor signal 210, 220. By controlling the sampling times, it can be ensured that the sampling values correspond to predetermined values. If the checking device 280 determines, for example, that deviations outside a tolerance occur (for example, +/- 2°), the sampling times can be changed/adjusted by the sampling control device 290.
- the evaluation arrangement 200 can be configured to adjust or regulate the sampling times such that the first sample represents a first extreme value of the sensor signal 210, 220, for example, a maximum value or minimum value, and the third sample represents a second extreme value, for example, the minimum value or the maximum value of the sensor signal 210, 220.
- the second sample can, for example, represent an average value or DC component of the sensor signal 210, 220, such as a "zero crossing.”
- the evaluation arrangement 200 can be designed to take into account information about a time at which the sensor signal 210, 220 passes through a predetermined threshold value when setting or adjusting the sampling times.
- This time can be, for example, the second time, which can represent, for example, a DC component or an average value of the sensor signal 210, 220.
- the checking device 280 can use the second sampling time to check the first sampling time and/or the second sampling time.
- the evaluation arrangement 200 can be designed to check whether a second sample at the second sampling time is equal to an average value of the sample at the first sampling time and the third sample at the third sampling time, and to detect, depending on the check, whether the first sample and the third sample represent a maximum value and a minimum value of the sensor signal.
- the second sample should, for example, be within a tolerance of at most ⁇ 1% of a difference between the first sample and the third sample, or equal to an average value of the sample and the second sample. If this is not the case, the checking device 280 can detect that the sampling times have been incorrectly selected.
- the second sample can lie exactly halfway between the first sampling time and the second sampling time.
- the second sample may correspond to the average of the other two samples. This may therefore represent an efficient and accurate method for verifying the samples using the verification device 280.
- the evaluation arrangement 200 can be designed to apply a periodic square-wave signal 260 with a duty cycle of preferably 50% to the heater 120.
- the periodic square-wave signal may have a duty cycle in the range of 5% to 50%, 8% to 48%, or 10% to 45%.
- the periodic square wave signal 260 applied to the heater 120 may have a tolerance of +/- 2%.
- the duty cycle for a periodic sequence of pulses indicates a ratio of a pulse duration to a period duration.
- the evaluation arrangement 200 can be configured to combine a sensor signal 210, 220 with an offset signal generated by a digital-to-analog converter to obtain an input signal for an analog-to-digital converter.
- the analog-to-digital converter can, for example, digitize the signal values present at the sampling times (e.g., the first sample value, the second sample value, and/or the third sample value) and thus sample the sensor signal 210, 220.
- the sampling device 270 can, for example, comprise the analog-to-digital converter.
- the evaluation arrangement 200 can be designed to adjust the offset signal to ensure that the input signal of the analog-to-digital converter remains within a predetermined range throughout an entire period of the sensor signal 210, 220.
- the offset signal can change an offset of the sensor signal 210, 220 such that an input signal is created that lies within a working range (e.g., the predetermined range) of the analog-to-digital converter, so that no information from the sensor signal 210, 220 is lost during digitization or so that information loss is reduced.
- the sampling device 270 can check whether an input value of the analog-to-digital converter exceeds a predetermined upper threshold value, for example, of the predetermined range, or falls below a predetermined lower threshold value, for example, of the predetermined range. Accordingly, the sampling device 270 can generate the offset signal, which can be combined with the sensor signal 210, 220 so that the input value, for example, a value of the input signal, remains within the specified range.
- the evaluation arrangement 200 can be designed to adjust the sampling times after adjusting the offset signal and, after changing the sampling times, to perform a new check to determine whether the sample values obtained with the changed setting of the sampling times still lie within the specified range.
- the offset signal can first be generated by the evaluation arrangement 200 for the sensor signal 210, 220, and then the sampling times can be determined, checked, and, if necessary, adjusted by the sampling device 270 (this can, for example, represent a tracking of the sampling times). This tracking can result in new sample values. which may result in a renewed adjustment of the offset signal by the evaluation arrangement 200.
- the offset signal and the sampling times can always be adjusted or tracked alternately until, for example, the analog-to-digital converter can further process the sensor signal 210, 220.
- the offset signal and the sampling times can be in a steady state.
- the sampling time settings changed by the sampling control device 290 generate, for example, new sampling values that can be considered input values of the analog-to-digital converter.
- both the offset signal and the heating power of the heater 120 can be adjusted.
- the offset signal can, for example, adjust an offset of the sensor signal 210, 220, and the change in the heating power can adjust an amplitude of the sensor signal 210, 220, resulting in an input signal that lies within the specified range.
- the evaluation arrangement 200 can be configured to regulate a heating power applied to the heater 120 depending on at least one sensor signal 210, 220 from at least one of the detectors 130, 140 in order to bring the at least one sensor signal 210, 220 into a predetermined value range.
- the evaluation arrangement 200 can be configured to take into account information about the heating power (e.g., the heater signal 122) when deriving information 240 about a gas concentration and/or thermal conductivity from the sensor signals 210, 220.
- the sensor signal 210, 220 can experience an increase in the amplitude of the sensor signal 210, 220, or if the heating power is reduced, the at least one sensor signal 210, 220 can experience a reduction in the amplitude of the sensor signal 210, 220.
- the sensor signal 210, 220 can be brought into the predetermined value range by regulating the heating power of heater 120.
- Fig. 2a and Fig. 2b each show a schematic representation of a gas sensor 100 for measuring physical gas properties.
- the thermal gas sensor 100 can have a thin-film membrane 110 and a heating element 120, which can be arranged, for example, as a self-supporting bridge structure on the membrane 110 between a first interruption region 160 of the membrane 110 and a second interruption region 170 of the membrane 110.
- a thickness of the thin-film membrane 110 (it consists, for example, of several base, sensor, and passivation layers) in the case of a wire sensor (an example of the temperature sensor structures 130, 140; see Fig. 2 and Fig. 3 ) e.g. between 1-10 ⁇ m.
- the heating element 120 can also be referred to as a heater.
- the entire first interruption region 160 can have an interruption 162 in the membrane 110, and the entire second interruption region 170 can have an interruption 172 in the membrane.
- the heating element 120 can be arranged in a cantilevered manner between the first interruption 162 and the second interruption 172.
- the first interruption 162 can be delimited by the heating element 120 and a first temperature sensor structure 130, in the form of a cantilevered bridge structure.
- the second interruption 172 can be delimited by the heating element 120 and a second temperature sensor structure 140, for example in the form of a cantilevered bridge structure.
- the first temperature sensor structure 130 and/or the second temperature sensor structure can be a wire sensor, thermopiles, temperature-variable resistors, or thermistors.
- the gas sensor 100 comprises, for example, a frame 150 made of carrier material.
- the frame 150 made of carrier material can, for example, span the membrane 110.
- the membrane 110 can have a thickness 111 (for example, an extension perpendicular to a surface of the membrane 110 on which the first thermocouple structure 130, the second thermocouple structure 140, and the heating element 120 are arranged) in a range from 1 ⁇ m to 50 ⁇ m, 2 ⁇ m to 25 ⁇ m, or 3 ⁇ m to 10 ⁇ m, such as 8 ⁇ m.
- the membrane 110 can be realized by a recess 190 in the frame 150.
- the recess 190 can be selected such that a membrane 110 with the desired thickness 111 can be realized.
- the recess 190 can be designed such that only the heating element 120, the first thermocouple structure 130, and the second thermocouple structure 140 remain spanned between the frame 150.
- a surface of the membrane 110 on which the first thermocouple structure 130, the second thermocouple structure 140, and the heating element 120 are arranged can have an extent in a range from 200x200 ⁇ m 2 to 5x5 mm 2 , 500x500 ⁇ m 2 to 2000x2000 ⁇ m 2 , or 800x800 ⁇ m 2 to 1200x1200 ⁇ m 2 , wherein the extent can be square or rectangular.
- the gas sensor 100 can have a thickness 101 (for example, parallel to the thickness 111 of the membrane 110) in a range from 500 nm to 5 mm, 1 ⁇ m to 1 mm, or from 200 ⁇ m to 600 ⁇ m, such as 400 ⁇ m.
- An extension of the gas sensor 100, parallel to the surface of the membrane 110 on which the heating element 120 is arranged, can be in a range from 1x1 mm 2 to 1x1 cm 2 , 1.5x1.5 mm 2 to 9x9 mm 2 , or from 2x2 mm 2 to 8x8 mm 2 , such as 6.5x2.5 mm 2 .
- the first thermocouple structure 130, the second thermocouple structure 140 and/or the heating element 120 may be part of the membrane 110.
- a microchip (example for the thermal gas sensor 100) with three filigree bridge structures (e.g., the heating element 120, the first thermocouple structure 130, and the second thermocouple structure 140) can be used, which can be self-supporting between a frame and surrounded by the gas to be analyzed as microwires.
- the gas to be analyzed can, for example, be arranged in the first interruption 162, the second interruption 172, the first outer interruption 192, and/or the second outer interruption 194.
- a middle bridge structure can be designed as a heater 120 and can have two different Detector structures located at distances from the heater 120 (e.g., the first thermocouple structure 130 and the second thermocouple structure 140) can be used as temperature sensors to measure a transfer response from the gas mixture.
- the middle wire (the heating element 120) is subjected to a heating signal, for example a periodic one, whereby, for example, heat is radiated from the heating element.
- Heat transfer can occur via unknown heat transfers from the heater 120 into the gas to be analyzed and from the gas into the sensor wire (e.g., into the first thermocouple structure 130 and/or the second thermocouple structure 140).
- the heat transfer thus detected by the first thermocouple structure 130 and/or the second thermocouple structure 140 can be understood as a transfer response or as a sensor signal (e.g., a first sensor signal detected by the first thermocouple structure 130 and a second sensor signal detected by the second thermocouple structure 140).
- thermocouple structure 130 By measuring a temperature response (e.g., the transfer response) with, for example, two identical sensors (e.g., the first thermocouple structure 130 and/or the second thermocouple structure 140) at different distances from the heater 120, the unknown heat transfers in the measurement setup can be eliminated.
- the phase and amplitude of the two sensor signals can depend essentially on the heat transfer through the gas.
- a first variant of the thermal gas sensor 100 can be constructed on the basis of a silicon-on-insulator (SOI) wafer substrate. It consists, for example, of a microchip with self-supporting, filigree bridge structures made of silicon microwires (e.g., the first temperature sensor structure 130 and the second temperature sensor structure 140) that are spanned in the gas space to be analyzed.
- a central wire can be designed as a heater 120, and two detector wires (e.g., the first temperature sensor structure 130 and the second temperature sensor structure 140) can serve as temperature sensors on either side of the heater at different distances from it (see Fig. 2a , Fig. 2b ).
- Fig. 2a shows, for example, a photo of the MEMS wire sensor chip (the gas sensor 100) on a light microscope (left) and Fig. 2b For example, shows a close-up of structures in a scanning electron microscope (right).
- Fig. 3 shows a schematic representation of a silicon bridge 120/130/140, which can be used, for example, for a heating element, a first thermocouple structure and/or a second thermocouple structure of a gas sensor.
- Fig. 3 A detail of a micro-bridge (SEM, scanning electron microscope) of a thermal MEMS wire sensor (e.g., a gas sensor).
- the illustrated silicon bridge 120/130/140 can be manufactured, for example, using SOI technology.
- a substrate or carrier material of a frame 150 can comprise oxide material 152, silicon material 154, and aluminum material 156.
- silicon material 154 can be at least partially removed, for example, to create incisions 158 (e.g., trenches) in the carrier material of the frame 150 and thereby create the silicon bridge 120/130/140.
- the silicon bridge 120/130/140 can be arranged on the membrane 110 (e.g., consisting of oxide material 152).
- the membrane 110 can, for example, have a first interruption region 160/162 and a second interruption region 170/172. Both the first interruption region 160/162 and the second interruption region 170/172 have, for example, an interruption, which can be, for example, a cavity.
- the membrane 110 can have a first interruption 162 and a second interruption 172, in which the gas to be analyzed can be arranged and, for example, receives heat from the silicon bridge 120/130/140 if the silicon bridge represents a heating element 120 or can transfer heat to the silicon bridge 120/130/140 if the silicon bridge 120/130/140 represents the first thermocouple structure 130 and/or the second thermocouple structure 140.
- the silicon bridge 120/130/140 can be contacted by the aluminum material 156, allowing the aluminum material 156 to serve, for example, as a bonding pad. Through the bonding pad, for example, an exciting heater signal can be applied to the heating element 120 or the first thermocouple structure 130 and/or the second thermocouple structure 140 can be read (for example, a first or second sensor signal).
- Fig. 4 shows a schematic representation of a gas sensor 100 on the left side and a detailed view of the gas sensor 100 on the right side.
- the gas sensor 100 may include a membrane 110 and a heating element 120 that may be disposed on the membrane 110 between a first discontinuity region 160 of the membrane 110 and a second discontinuity region 170 of the membrane 110.
- the first discontinuity region 160 may include a discontinuity 162
- the second discontinuity region 170 may include a discontinuity 172.
- the first interruption 162 and/or the second interruption 172 may have a longitudinal extension parallel to a direction of maximum extension of the heating element 120 (which may be referred to as a heater, for example) and a transverse extension, for example in a direction perpendicular to a direction of maximum extension of the heating element 120. According to Fig. 4 Thus, the first interruption 162 can have a greater transverse extent than the second interruption 172. Furthermore, the first interruption 162 and the second interruption 172 can be arranged according to Fig. 4 have the same longitudinal extent.
- the first interruption 162 and the second interruption 172 for example, have a longitudinal extent that is large enough that the first interruption 162 and the second interruption 172 completely cover the area between the first thermocouple structure 130 and the second thermocouple structure 140, respectively, and the heating element 120.
- the longitudinal extent of both the first interruption 162 and the second interruption 172 is along the entire length of the heating element 120. This prevents a large portion of the heat radiated by the heating element 120 from being transported via the membrane 110. Thus, it is possible to ensure that a large portion of the heat is transferred to the respective thermocouple structure 130, 140 via the gas arranged in the first interruption 162 and the second interruption 172.
- the first thermocouple structure 130 may, for example, have a different distance from the heating element 120 than the second thermocouple structure 140. Thus, according to Fig. 4 For example, the first thermocouple structure 130 has a greater distance from the heating element 120 than the second thermocouple structure 140.
- the first Thermocouple structure 130 can, for example, detect a first heat transfer 210 from the heating element 120 to the gas in the first interruption 162 and from the gas to the first thermocouple structure 130 and record it as a first sensor signal.
- the second thermocouple structure 140 can, for example, detect a second heat transfer 220 from the heating element 120 to the gas in the second interruption 172 and from the gas to the second thermocouple structure 140 and provide it as a second sensor signal.
- thermocouple structure 130 and the second thermocouple structure 140 and the heating element 120 Due to the different distances between the first thermocouple structure 130 and the second thermocouple structure 140 and the heating element 120, a difference signal can be formed from the first sensor signal and the second sensor signal, whereby unknown transitions (such as a transition from the heating element to the gas or from the gas to the respective thermocouple structure) can be calculated out and thus, for example, B. mainly or only the heat transfer via the gas in the first interruption 162 or the second interruption 172 by the gas sensor 100 is considered.
- the gas sensor 100 may further comprise a frame 150 that can span the membrane 110.
- the first thermocouple structure 130 and the second thermocouple structure 140 may be arranged at least partially on the membrane 110 and at least partially on the frame 150.
- the first thermocouple structure 130 and the second thermocouple structure 140 may have hot ends 132, 142 arranged facing the heating element 120.
- the first thermocouple structure 130 and the second thermocouple structure 140 may have cold ends 134, 144, which may be arranged on a side of the first thermocouple structure 130 or the second thermocouple structure 140 opposite the side with the hot ends 132, 142 and are thus arranged facing away from the heating element 120.
- the hot ends 132, 142 can be arranged on the membrane 110, and the cold ends 134, 144 can be arranged on the frame 150.
- the frame 150 can be made of a different material than the membrane 110. This allows, for example, the cold ends 134, 144 to be exposed to a reference temperature through the frame material of the frame 150, relative to a temperature measured by the hot ends 130, 142, transmitted by the heating element 120.
- the left side of the gas sensor 100 may be a layout and the right side of the Fig. 4 a photo of the gas sensor 100 (e.g. a MEMS membrane sensor) for measuring, for example, a gas-type-dependent heat transport (embodiment according to aspect 1).
- the gas sensor 100 e.g. a MEMS membrane sensor
- a gas-type-dependent heat transport embodiment according to aspect 1.
- a variant of the gas sensor 100 with a constant interruption (e.g., a first interruption 162 and a second interruption 172) of a membrane 110 can be seen.
- the constant interruption 162, 172 causes, for example, that a major portion of heat transport between a heater 120 and the detectors (e.g., the first thermocouple structure 130 and the second thermocouple structure 140) necessarily occurs via the measurement gas volume enclosed between the two elements, for example, via the measurement gas arranged in the first interruption 162 and in the second interruption 172.
- thermopile structures 130, 140 detectors
- the membrane sensor e.g., gas sensor 100
- the heater structure e.g., heating element 120
- the heater structure is positioned centrally as a self-supporting, filigree bridge structure in a measuring chamber containing the gas to be detected.
- thermocouple thermocouple structures
- first thermocouple structure 130 and/or the second thermocouple structure 140 thermocouple structures
- the pit edge e.g., an edge of the first interruption 162 or the second interruption 172
- the cold ends 134, 144 of the thermopiles 130, 140 should directly contact the carrier material (e.g., frame 150), which can have high thermal conductivity (e.g., silicon approximately 150 W/(m*K)) and can serve as a heat sink (heat sink near room temperature).
- the carrier material e.g., frame 150
- high thermal conductivity e.g., silicon approximately 150 W/(m*K)
- heat sink heat sink near room temperature
- the excess temperature (e.g., measured using the hot ends 132, 142) can be measured as a direct difference to the room temperature (e.g., measured using the cold ends 134, 144).
- a measuring point for temperature compensation is, for example, directly on or mechanically connected to the silicon chip (e.g., the frame 150).
- membrane 110 can be consistently interrupted, so that heat transport 210, 220 from heater 120 to detectors 130, 140 can occur primarily over a shortest lateral distance and thus, for example, travels a distance across an intermediate volume of the measurement gas (e.g., arranged in the first interruption 162 and the second interruption 172). This can significantly increase the gas-type-dependent transmission response (e.g., the first sensor signal and the second sensor signal) of sensor 130, 140 to periodic heat pulses from heater 120.
- the gas-type-dependent transmission response e.g., the first sensor signal and the second sensor signal
- Fig. 5 on the left side a schematic representation of the gas sensor 100 and on the right side an enlarged detailed view of the gas sensor 100.
- the gas sensor 100 from Fig. 5 can provide the same features and functionalities as the gas sensor 100 from Fig. 4 wherein the gas sensor 100 consists of Fig. 5 from the gas sensor 100 to Fig. 4 in one embodiment of the first interruption region 160 or the second interruption region 170.
- the first interruption region 160 of the gas sensor 100 can be Fig. 5 a plurality of interruptions 162 i and the second interruption region 170 may also have a plurality of interruptions 172 i .
- the index i of the interruptions 162 i of the first interruption region 160 of the gas sensor 100 may range from 1 to 23, since the first interruption region 160 according to the embodiment in Fig. 5 23 interruptions.
- the index i of the interruptions 172 i of the second interruption region 170 of the gas sensor 100 can, for example, range from 1 to 14, since the second interruption region 170 according to an embodiment of the Fig. 5 14 interruptions.
- the index i of both the interruptions 162 i and the interruptions 172 i can define a natural number, where the index i specifies, for example, how many interruptions 162 i , 172 i are present in an interruption range 160, 170.
- the interruptions 162i , 172i can be arranged in the first interruption region 160 and the second interruption region 170, respectively, in rows parallel to a direction of maximum extension of the heating element 120, and the rows can also be offset from one another.
- transverse webs 112 formed by membrane material extending, for example, in a direction perpendicular to a direction of maximum extension of the heating element 120, from the heating element 120 to the respective thermocouple structure 130, 140
- This has the effect, for example, that a parasitic heat conduction 114a, 114b in the membrane 110 travels the longest possible path.
- the interruptions 162 i , 172 i are arranged, for example, such that a lattice structure is created in the membrane 110, in which a path of a parasitic heat conduction 114a, 114b through the membrane 110 is longer than a direct path 210, 220.
- a direct path 210, 220 can, for example, be a straight path perpendicular to the heating element 120, from the heating element 120 to the respective thermocouple structure 130, 140, wherein the direct path 210, 220 can be passed through by a gas to be analyzed, arranged in the interruptions 162 i , 172 i .
- the path of the parasitic heat conduction 114a, 114b through the membrane 110 should, for example, not run in a straight line, but rather a winding path, as shown in Fig. 5 , form.
- the interruptions 162 i , 172 i can, for example, be elongated interruptions which can be located perpendicular to a main direction of heat conduction (for example the direct path 210, 220 from the heating element 120 to the thermocouple structures 130, 140) with a tolerance of +/- 20°.
- the interruptions 162 i , 172 i can be rectangular cutouts with rounded corners. These can also be referred to as elongated holes, for example, and they can also be oval holes, for example.
- the interruptions 162 i , 172 i can be at least three times longer than they are wide.
- the length can be defined, for example, as a direction parallel to a maximum extension of the heating element 120 and the width as a direction perpendicular to the maximum extension of the heating element 120.
- the interruptions 162i , 172i in the first interruption region 160 and the second interruption region 170, respectively, can be arranged such that a distance 116a, 116b between the interruptions 162i , 172i corresponds to a smallest structural width that can be realized and results in a mechanically durable lattice structure.
- the distance 116a, 116b is, for example, a width of webs made of membrane material of the membrane 110. The smaller the distance 116a, 116b is realized, the lower the parasitic heat conduction 114a, 114b can be, whereby the quality of an analysis of a gas by the gas sensor 100 can be increased.
- the distance 116a, 116b should be selected such that the grid structure in the membrane 110 created by the interruptions 162i , 172i is mechanically durable in order to ensure a high quality of the gas analysis by the gas sensor 100.
- Fig. 5 a layout of a MEMS membrane sensor (e.g., the gas sensor 100), for example, for measuring the gas-type-dependent heat transport (e.g., via the direct path 210, 220) (embodiment according to aspect 1).
- the gas sensor 100 can be made of Fig. 5 a variant with a grid structure made of the membrane material of the membrane 110 to increase the mechanical stability of the gas sensor 100.
- the geometric shape of the grid can be selected such that the parasitic heat conduction 114a, 114b in the membrane material has to travel the longest possible path.
- Fig. 5 shows a further embodiment of the gas sensor 100, which has a grid structure between the heater 120 and detector elements (e.g., the first thermocouple structure 130 or the second thermocouple structure 140), which is intended to improve the mechanical stability of the gas sensor 100 during long-term operation.
- detector elements e.g., the first thermocouple structure 130 or the second thermocouple structure 140
- Such an arrangement can reduce the gas-type-dependent sensitivity of the thermal gas sensor 100, since heat conduction can now also occur parasitically 114a, 114b via the grid webs of the membrane material.
- a portion of the heat energy periodically introduced into the heater 120 can reach the detector structures (e.g., the first thermocouple structure 130 or the second thermocouple structure 140) earlier in time than the portion of the heat energy that is transported through the measurement gas over the laterally shortest distance 210, 220.
- both heat wave propagation times e.g., the parasitic heat conduction 114a with the heat transfer via the direct path 210 or the parasitic heat conduction 114b with the heat transfer via the direct path 220
- a single sinusoidal detector signal e.g., a first sensor signal or a second sensor signal
- the geometric shape of the grid is selected, for example, so that the parasitic heat conduction 114a, 114b in the membrane material must travel the longest possible path.
- the oval holes e.g., the interruptions 162i , 172i
- the aspect ratio of the oval holes is, for example, at least three times longer than they are wide, and the web width (e.g., the spacing 116a, 116b) corresponds, for example, to the smallest achievable structure width that results in a mechanically durable grid structure with the available layer technology.
- Fig. 6a , Fig. 6b and Fig. 6c show schematic representations of further embodiments of a gas sensor 100.
- the gas sensor 100 can be made of Fig. 6a , Fig. 6b and Fig. 6c the same features and functionalities as the Gas Sensor 100 from Fig. 4 and/or Fig. 5 Differences between the gas sensors 100 may occur in the first interruption region 160 and the second interruption region 170 of the gas sensor 100.
- the gas sensor 100 can be Fig. 6a
- the interruptions 162 i can have a greater transverse extent than the interruptions 172 i .
- the interruptions 162 i , 172 i can have different longitudinal extents within their respective interruption regions 160 and 170, respectively.
- the gas sensor 100 from Fig. 6b has a first interruption area 160 with eight interruptions 162 i and a second interruption area 170 with a continuous interruption 172.
- the variant of Fig. 6b for example in the interruption areas 160, 170 the variants from Fig. 6a or Fig. 5 and from Fig. 4 combined with each other.
- the gas sensor 100 from Fig. 6c has a first interruption region 160 and a second interruption region 170 with a plurality of interruptions 162 i , 172 i , wherein the first interruption region 160 can have, for example, 23 interruptions 162 i and the second interruption region 170 can have, for example, 14 interruptions 172 i .
- the interruptions 162 i , 172 i of an interruption region 160 or 170 can have the same transverse extent and/or the same longitudinal extent.
- Fig. 6a , Fig. 6b and 6c represent further layout variants of the MEMS membrane sensor (for example the gas sensor 100), which differ in the number and size of the perforations of the membrane (e.g. the interruptions 162 i , 172 i ) (embodiments according to aspect 1).
- thermopile structures e.g., the first thermocouple structure 130 or the second thermocouple structure 140
- membrane technology examples:
- Fig. 7 schematically illustrates a basic principle of the thermal sensor 100 (the gas sensor can also be referred to herein as a thermal sensor): Clearly visible is the spatial separation between heater 120 and sensor structures 130, 140 (the first temperature sensor structure and the second temperature sensor structure can also be referred to herein as sensor structures, detector structures, sensors, temperature sensors or detectors) with thermal coupling through the gas mixture to be analyzed; as well as the measurement with sensor structures 130, 140.
- the sensor structures 130, 140 can be arranged at different distances from the heater 120 or at the same distance.
- unknown heat transitions 122a 1 , 122b 1 , 122a 2 , 122b 2 also occur here.
- a very precise gas analysis can also be carried out and, under certain circumstances, the unknown heat transitions 122a 1 , 122b 1 , 122a 2 , 122b 2 can also be taken into account in the analysis.
- an evaluation of a sum signal is preferred over an evaluation of a difference signal, since the signal-to-noise ratio of the difference signal is smaller than that of the sum signal.
- Optimizing heat loss is an essential factor in increasing the sensitivity of the sensor 130, 140 without having to supply excessive heating power, e.g., via the heating element 120.
- Fig. 8 Features and functionalities of the gas sensor 100 from Fig. 7
- Fig. 8 a schematic representation of the heat transport at the gas sensor 100.
- the heat transport from the heater 120 (temperature T H ) to the sensor 130, 140 (temperature T S ) takes place essentially through the gas to be measured.
- the sensor signals 210, 220 have a sinusoidal curve (see e.g. Fig. 9 ), which is highly dependent on the thermal properties of the gas surrounding the sensor structures.
- transmitted and received periodic temperature waves are compared (see Fig. 9 ).
- the CO2 content in air can be resolved to 0.2 vol%, e.g., using the gas sensor. Since gases are compressible and their density changes due to pressure and temperature, the corresponding drifts should be compensated.
- Fig. 2 shows a comparison of signals 210, 220 when excited with sinusoidal heating power 122 for CO2 and N2 .
- the received sensor signals 210, 220 differ in amplitude, offset, and phase.
- the signals 210, 220 are differential signals from a signal of a first thermocouple structure and a second thermocouple structure of the gas sensor.
- thermal conductivity By evaluating additional measured values provided by the sensor, thermal conductivity, thermal diffusivity and, if the density of the gas is known, also the specific heat capacity can be determined - a possible way to analyze even unknown gas mixtures.
- T x t T m + T A ⁇ ⁇ ⁇ e ⁇ k 1 ⁇ x ⁇ sin 2 ⁇ f ⁇ t ⁇ k 1 ⁇ x + ⁇
- the attenuation of the amplitude is therefore also a measure of the thermal conductivity of the medium.
- the thermal conductivity ⁇ of the medium is represented by the average temperature distribution in the measuring chamber.
- an average temperature is established at the temperature detectors, which is proportional to the heat flow through the gaseous medium from the heater via the detectors to the housing wall.
- the temperatures of the heater and the detectors must be known. With appropriate calibration, for example, it is sufficient to regulate one detector (preferably the one closest to the heater) to a constant (excess) temperature, if the required average heating energy is determined as a measure of the thermal conductivity.
- the basic principle for measuring the thermal conductivity of gases is to create an excess temperature above the ambient temperature in a flow-free measuring chamber using a heating element (e.g., a hot wire or a hot plate) suspended in the gas.
- a condition for correct measurement is a static gas in the measuring space, e.g., in a dead volume or behind a diffusion barrier, since convective heat flow leads to measurement errors [Baar 2001].
- the task of the electronics and signal evaluation is to generate, for example, a reliable measurement result directly dependent on the gas concentration using a miniaturized system that is as cost-effective as possible.
- the gas sensor according to the invention should be usable in a respiratory gas monitor in which the carbon concentration in the air mixture can change with high dynamics.
- the gas sensor should be able to resolve changes in the gas composition during the inspiration and expiration cycle up to a rate of 60 breaths per minute. Rapid evaluation of the sensor signals is therefore desirable.
- Fig. 10 shows an electrical circuit diagram of a heater control for a thermal gas sensor according to an embodiment of the present invention.
- a CPU specifies, for example, a lower and upper heater voltage and switches between these two values in a timer-controlled manner.
- a CPU can measure the current heater current at specific times to calculate the heater power.
- Fig. 10 a heater supply with voltage setting and current measurement.
- the developed ⁇ Controller electronics generates a square wave signal (for example). Due to the timer structures present in the processor, this signal can be generated with significantly greater temporal precision than a synthetic sinusoidal signal that would be output by the processor on its digital/analog (DA) port.
- DA digital/analog
- two heater voltages are specified via a DA converter.
- the DA converter is controlled via SPI, and the point in time at which a new DA value is adopted does not exactly correspond to the selected Processor module (CPU) can be determined.
- This is a prerequisite for determining the phase position of the sensor response. Therefore, one of the two voltages is alternately applied to the heater amplifier via an analog switch, for example.
- They are smoothed, for example, by a downstream low-pass filter.
- the operational amplifier (OP) circuit raises the voltage to the voltage level required by the heater.
- Another OP compensates, for example, for the voltage drop occurring across the current measuring resistor. Since the current is measured and the heater voltage is known, the heater power can be calculated. This is important because the heater resistance can change with temperature.
- a heater duty cycle of 50% can be used (where, for example, a periodic square wave signal with a duty cycle of, for example, 50% +/-2% is applied to the heater).
- shorter duty cycles can also be used, for example in the range 5..50%.
- a duty cycle of 42% is required, for example, for the equivalent square wave or for an "equivalent" or square wave signal with the same power.
- the adjustment of the heater power by controlling the duty cycle is not realized - this is more difficult on the MSP430, but interesting when using more powerful ⁇ Controllers: You can work with a fixed operating voltage and only change the duty cycle (a type of PWM control).
- the heater power can be adjusted by changing the voltage level (the voltage applied to the heater) or the current level (the current flowing through the heater or heating element). The two options can also be combined.
- Fig. 11 shows an electrical circuit diagram of a detector signal evaluation of a thermal gas sensor according to an embodiment of the present invention.
- Both a first thermocouple structure and a second thermocouple structure of the gas sensor can be Fig. 11 illustrated detector signal evaluation to evaluate heat transferred from a heating element of the gas sensor to the first thermocouple structure and the second thermocouple structure via a gas to be analyzed in a respective detector signal (e.g. detected by means of the first thermocouple structure or the second thermocouple structure and can also be referred to herein as a sensor signal).
- a sensor signal e.g. detected by means of the first thermocouple structure or the second thermocouple structure and can also be referred to herein as a sensor signal.
- the detector signal evaluation is configured, for example, to receive a first input signal, e.g., a DAC signal CO2_S1_Win from a CPU (magnifying glass function), and a second input signal, e.g., a detector signal CO2_Sensor1, and to provide a first output signal, such as an amplified detector signal CO2_S1_an, and a second output signal, such as a comparator signal for a phase evaluation CO2_S1_dig.
- a first input signal e.g., a DAC signal CO2_S1_Win from a CPU (magnifying glass function)
- a second input signal e.g., a detector signal CO2_Sensor1
- a first output signal such as an amplified detector signal CO2_S1_an
- a second output signal such as a comparator signal for a phase evaluation CO2_S1_dig.
- a CPU controls a heater so that the amplitude of the sensor signal remains within an ADC range.
- a magnifying glass function for example, keeps the sensor signal within the ADC limits.
- Phase evaluation is performed, for example, via the comparator using the MSP430 timer structures.
- the resistance change of the sensor wire (e.g., the thermocouple structure) is very small. For this reason, an amplifier with a high gain is preferred or required. Since the absolute value of an input voltage (e.g., the sensor signals) depends on many factors, it is recommended to compensate for this value.
- a direct current (DC) amplifier was used that has no phase shift.
- the negative input terminal at the differential input of the operational amplifier (OP) is raised to the average value of the detector signal and actively tracked using a software controller, the digital-to-analog converter (DAC) of the The processor outputs this voltage directly. Due to the differential operation of the differential input on the op-amp, the DC components of the input voltages are subtracted from each other, and only the AC component of the signal is amplified.
- the analog-to-digital conversion (ADC) signal is measured and checked to see whether it lies within reasonable limits detectable by the ADC.
- the DAC value is adjusted accordingly. This creates an amplifier in which the amplified signal is continuously kept within the optimal operating range or window. By removing the DC component, the gain factor of the op-amp can be increased, a kind of "magnifying glass function.”
- the DAC value required for compensation can serve as an additional parameter for evaluation, with which the absolute mean detector temperature can be determined, and the thermal conductivity of the gas mixture can be determined using the relationship in equation (5).
- a Schmitt trigger for example, was used. It is set to switch just above or below the zero crossing of the sensor signal. This is where the signal is steepest and thus causes the least phase noise.
- the DC component is removed, for example, using a capacitor. This allows the phase of the sensor response to be determined.
- Fig. 12 shows a schematic representation of nested controllers of the software for a thermal gas sensor according to an embodiment of the present invention.
- the software contains several nested controllers. The innermost is the DC operating point controller. For example, only when this has stabilized (no adjustment of the DC offset was necessary) is the sampling time adjusted. In the amplitude control loop, the amplitude of S1, for example, is kept constant - but only when no adjustment of the DC offset and sampling time was necessary. In the outer control loop, the heating energy required to regulate the S1 amplitude can be adjusted (optionally) in such a way that the thermal System can dynamically adapt to a wide range of different gas mixtures.
- Fig. 11 a shows a block diagram illustrating the control and tracking of the DC operating points of the two detector amplifiers according to an embodiment of the present invention.
- FIG. 13b A block diagram is shown illustrating the tracking of the sampling times for the amplitude measurement of the detector signals and the S1 amplitude controller. Once all controllers are adjusted, the gas mixture is evaluated using the measured values for amplitude and phase of the detectors.
- Figures 13a and 13b be viewed as a block diagram, where Fig. 13b with Fig. 13a is connected via the "Tracking of the sampling times" block.
- Fig. 14 As an example, a CO 2 dependence of the sensor in the phase signal at constant temperature and constant pressure is shown. Three phase shifts are shown: A phase difference D1-Hz.dPhi (red) between heater and detector 1, with a 200 ⁇ m distance, a phase difference D2-Hz.dPhi (blue) between heater and detector 2, with a 300 ⁇ m distance and a phase difference D2-D1.dPhi (green, right y-axis) between detector 2 and detector 1. According to one embodiment, Fig.
- Fig. 15 measured amplitudes at detectors D1 and D2 as well as a sum signal of the amplitudes formed relative to the heater amplitude are shown over the CO2 dependence of the sensor. For example, the amplitude D1.Uss (red) at detector 1 and the amplitude D2.Uss (blue) at detector 2 are shown. Both amplitude signals decrease, e.g., when the CO2 concentration increases, i.e., when the thermal diffusivity in the gas mixture increases.
- a sensor signal can be highly dependent on pressure and temperature. To correctly determine gas properties, the cross-effects should be known and corrected by the algorithms.
- Fig. 16 For example, the cross-sensitivity of the sensor signal in air to absolute pressure and for different temperatures is shown.
- the pressure influence shows a linear relationship, while the temperature influence shows a quadratic relationship, as theoretically calculated. Both cross-sensitivities are in the order of magnitude of the signal for the gas concentration itself.
- Fig. 17a shows a plot of a sensor signal for phase versus frequency when measured in CO 2 .
- Fig. 17a A diagram of a phase shift in 100% CO2 as a function of frequency. The phase goes into saturation.
- Fig. 17b shows a plot of a sensor signal for amplitude versus frequency when measured in CO 2 .
- Fig. 17b A graph of the amplitude in 100% CO2 as a function of frequency. The amplitude decreases towards zero.
- the heating power should be reduced somewhat when measuring in combustible gases to prevent the system from exceeding its A/D range.
- the heating power it has been found that in practice it is more sensible to operate the system with the largest possible sensor amplitudes and thus obtain more stable signals than setting the heating power to a minimum, which, although less thermally influenced, also reduces the signal-to-noise ratio.
- the heating energy periodically introduced into the sensor must be able to leave the sample volume within this period to prevent it from heating up continuously. For example, a peak heating power of approximately 26 mW at 120 Hz was set up for three measuring systems.
- the sensor's behavior represents an ideal first-order low-pass filter, with no harmonic spectral components in the sensor signal. Therefore, actively sweeping through a frequency spectrum yields no additional information. Therefore, it was decided to operate the sensor at a fixed frequency, reducing the system's electronics complexity and significantly shortening the measurement time required to obtain a reliable value. (All optional)
- the higher the excitation frequency at the heater the less energy can be transferred between the heater and the detector through the gas, because the thermal mass of the sensor itself limits the transfer speeds between the solid and the gas.
- the amplitude decreases with increasing frequency to a vanishing signal approaching zero (see Fig. 17b ), the phase shift saturates to a maximum (see Fig. 17a ).
- Optimizing phase resolution, phase difference, and amplitude for different gas mixtures resulted in the best phase response at a frequency of, for example, 120 Hz with a heating power of 26 mW for the microwire sensor and 160 Hz with approximately 8 mW for the MEMS thermopile sensor on a thin-film membrane. (Details optional)
- Fig. 18 shows a change in the phase signal of a methane sensor with increasing nitrogen admixture as an almost linear behavior.
- the phase signal is shown as a function of the nitrogen concentration in methane as a phase difference D1-Hz.dPhi (red) between heater and detector 1, with a 200 ⁇ m separation, a phase difference D2-Hz.dPhi (blue) between heater and detector 2, with a 300 ⁇ m separation, and a phase difference D2-D1.dPhi (green, right y-axis) between detector 2 and detector 1.
- Fig. 19 shows a diagram of the amplitude D1.Uss (red), recorded by the first detector, and the amplitude D2.Uss (blue), recorded by the second detector.
- Both amplitude signals D1.Uss and D2.Uss decrease, for example, when the N 2 concentration in methane increases, i.e., when the thermal diffusivity in the gas mixture decreases.
- the relative amplitude signal sigUss 2*Hz.Uss-(D1.Uss+D2.Uss) (green, right y-axis) increases with increasing N 2 concentration.
- Fig. 20 shows a diagram of a calculated sensor signal sigX (an example of a combination signal of the gas sensor) consisting of phase and amplitude for different fuel gas mixtures.
- Fig. 20 shows the sensor signal (an example of a combination signal from the gas sensor) for various fuel gases and their mixtures: methane, ethane, and propane, as well as the mixtures: methane95-ethane05, methane93-ethane05-CO202, methane91-ethane05-CO204, methane91-ethane05-CO202-propane02, methane90-ethane10, and natural gas-L (the two-digit numbers indicate the proportion of the gas components in volume percent).
- the sensor signal exhibits strong pressure and temperature dependencies.
- the cross-effects for example, must be known and corrected.
- the pressure influence exhibits a linear relationship
- the temperature influence exhibits a quadratic relationship. Both cross-sensitivities are of the order of magnitude of the signal for the gas concentration itself.
- Ka and Kp are constants by which both partial signals are multiplied.
- Ka 1/3500
- Kp 1/276 for CO2- air mixtures up to 30 vol% CO2 .
- the signal sigX calculated from phase and amplitude ranges between (1.7..2.0) for (0..6) vol% CO 2 .
- the device e.g., the gas sensor
- the device was measured in a temperature range between (16..28)°C and in the barometric pressure field between (900..1200) mbar.
- the strong pressure and temperature dependence of the sensor signal should be compensated in order to be able to infer a gas concentration from the measured value.
- Fig. 21 shows the matrix of measurement data for a variation in the gas concentration of (0..5) vol% CO2 in nitrogen in the pressure range (900..1200) mbar and in a temperature range of (16..28)°C.
- the green line 230b of the calibration curve can be shifted to a current working pressure.
- the red line 230a corresponds to the mean of all blue lines 2301 to 23016 and is a characteristic curve of the sensor signal relative to the gas concentration, normalized to an average temperature and an average pressure.
- Fig. 22 This shows a pressure dependence of the sensor signal sigX for a fixed average gas concentration, a set of curves from different temperatures.
- the lowest line 230 1 describes the relationship at the highest temperature of 28°C in the variation, and the top line 230 7 represents the pressure dependence of the signal at 16°C.
- Fig. 23 shows a slightly quadratic relationship between gas pressure and gas temperature (for an average gas concentration and an average sensor signal sigX).
- Regression level A describes the relationship between the gas concentration of the calibration reference and the sensor signal sigX.
- the mean characteristic curve 230a over the entire measured value variation 230 1 to 230 16 is shown in red. This must be shifted along the x-axis according to the drift influence of the pressure.
- the corresponding offset A.c0 is sought, which is inserted into the equation of regression level A.
- Regression level B describes the pressure drift of the sensor signal sigX.
- the first derivative of the curve should be calculated and the slope at the reference point calculated from it.
- CO 2 vol% A . y sigX ⁇ 1 ⁇ B . y p ⁇ B . ref sigX ⁇ B . ref ⁇ 1 ⁇ C . y T ⁇ C . ref p ⁇ C . ref
- Ay(sigX), By(p) and Cy(T) correspond to the complete polynomials for the measurement signal, the gas pressure and the gas temperature.
- Fig. 24 shows a block diagram of a schematic procedure for determining a gas concentration taking into account the influences of pressure and temperature from the generated sensor signal sigX.
- Fig. 24 a schematic representation of the formation of the sensor signal sigX from amplitudes and phases as well as the determination of a gas concentration from sigX taking into account the influence of pressure and temperature (example).
- Fig. 25 The theoretically calculated thermal diffusivity was plotted against the sensor signal sigX. In other words, Fig. 25 the thermal diffusivity versus the sensor signal sigX at constant pressure and constant temperature in a mixture of carbon dioxide CO 2 in nitrogen N 2 .
- the thermal diffusivity 240 1 red line
- decreases with increasing CO 2 concentration 240 2 green line).
- Fig. 26 , Fig. 27 and Fig. 28 show a diagram in which a heating voltage 300 applied to a heater of a gas sensor, a current flow 310 during a heating period 302, measurement times 320 for an optional ADC (analog-to-digital converter) of an evaluation arrangement according to the invention and a comparator signal for a detector (e.g. for a first detector or for a second detector) are shown.
- the evaluation arrangement according to the invention is designed, for example, to obtain the information on how much heat is dissipated by the heater during the heating period 302, based on a measurement of the current flow 310 through the heater at a predetermined heating voltage 300.
- the evaluation arrangement is designed to obtain the current flow 310 shortly after the predetermined heating voltage 300 is switched on and shortly before the predetermined heating voltage is switched off. This means, for example, B. that a start peak 312 of the heating current 310 and a heating current end value 314 of the current flow 310 can be processed by the evaluation arrangement.
- the start peak 312 always has the same value for one and the same gas sensor (small fluctuations of less than 1%, 0.5%, or 0.1% may occur). According to the Figures 26 to 28 In the illustrated embodiments, the start peak 312 is always at 2.93V and approximately 400 ⁇ s after switching on. This value of the start peak 312 is for a gas sensor in the Figures 26 to 28 For other gas sensors, the value of the start peak 312 may differ from that shown in the Figures 26 to 28 may differ from the value shown. Please note that that the value of the start peak 312 can differ not only between different gas sensors, but also between identical gas sensors.
- TCR temperature coefficient
- I Hz U/R Hz ⁇ I Hz ⁇ 1/R Hz
- a gas or gas mixture is analyzed by a gas sensor according to the invention and/or an evaluation arrangement according to the invention.
- a gas mixture with 10% CO 2 and 90% N 2 (nitrogen) was analyzed
- the gas nitrogen (100% N 2 ) is analyzed
- the gas oxygen (100% O 2 ) is analyzed.
- These components have different thermal conductivities, such as oxygen with a thermal conductivity ⁇ of 0.0263 W/(m*K), nitrogen with a thermal conductivity ⁇ of 0.0260 W/(m*K), and CO 2 with a thermal conductivity ⁇ of 0.0168 W/(m*K).
- the evaluation system processes (examines) the difference in the heating current (current flow 310) between the switch-on and switch-off moments, i.e., between the cold and hot heater.
- the CO 2 mixture of Fig. 26 Compared with the examples shown Fig. 27 and Fig. 28 the highest heater temperature and thus the lowest heating current (e.g. the lowest heating current final value 314) is achieved here, since CO 2 has only half the thermal conductivity compared to N 2 and O 2.
- the heater according to Fig. 27 in 100 vol.% N 2 does not reach the final temperature (e.g. the heating current final value 314) as in the 10%CO 2 -90%N 2 mixture of Fig. 26 .
- the heater reaches Fig. 28 in 100 vol.% O 2 does not reach the final temperature (e.g. the heating current final value 314) as in the 10%CO 2 -90%N 2 mixture of Fig. 26 .
- inrush and cut-off current in Fig. 28 is the lowest at 210 mV and accordingly the gas analyzed here also has the highest thermal conductivity compared to the 10%CO 2 -90%N 2 mixture (see Fig. 26 ) and the 100 vol.% N 2 (see Fig. 27 ) on.
- a measurement effect is minimal because the heater according to the invention is highly doped, for example, to enable heating with 3 V. Furthermore, the TCR (temperature coefficient) of the heater can be low (e.g., ⁇ 6*10 -3 1/K, ⁇ 4.1*10 -3 1/K, ⁇ 3.9*10 -3 1/K).
- a sensor signal (e.g. the current flow 310) is used to differentiate the concentration of a third gas.
- increased oxygen concentrations are used.
- the gas sensor e.g. a CO 2 sensor, such as the gas sensor according to the invention
- the change in the third gas component, a change in the concentration of oxygen, in the mixture may lead to an error signal in the CO 2 sensor.
- a concentration mixture of approximately 56% oxygen and 5% CO 2 in nitrogen N 2 also shows the same value on the sensor, for example.
- B. assumes a CO 2 concentration of 0 vol.%, as in the fresh gas calibration with 21 vol.% O 2 and approx. 78 vol.% N 2 .
- the sensor would, for example, display incorrect values.
- the heater is operated with a constant voltage (which is determined according to the Figures 26 to 28 corresponds to a value of 3000 digits at a D/A output, but is only an example here and can be freely selected).
- a constant voltage which is determined according to the Figures 26 to 28 corresponds to a value of 3000 digits at a D/A output, but is only an example here and can be freely selected.
- a voltage signal is obtained that is proportional to the heating current.
- Figures 26 to 28 Screenshots of the signals recorded on the oscilloscope are shown, with the heater current curve (current flow 310) greatly enlarged (noise can be reduced by shielding the test leads).
- a product of heater voltage 300 and measured heater current 310 allows a statement to be made about the heater power.
- the heater current 310 decreases slightly over time because the heater heats up and, due to its temperature gradient of the resistor (TKR), its internal resistance increases. Due to the higher internal resistance, less current can flow at the same heater voltage (I Hz ⁇ 1/R Hz ).
- phase signals can represent the phase information sigPhi for the evaluation arrangement according to one embodiment.
- information 210 about the first phase difference information 220 about the second phase difference
- a phase sum 400 information 210 + information 220
- a phase difference 410 information 220 - information 210) are shown.
- phase information 210, 220, 400, and 410 can also be acquired with other environmental parameter settings (different temperature, different pressure).
- a first section (e.g., measuring points 4520 to 4620) represents the respective phase information 210, 220, 400, and 410 for a 10 vol.% CO2 in N2 gas mixture
- a second section (e.g., measuring points 4670 to 4780) represents the respective phase information 210, 220, 400, and 410 for a 100 vol.% N2 gas
- a third section (e.g., measuring points 4960 to 5070) represents the respective phase information 210, 220, 400, and 410 for a 100 vol.% O2 gas. Times between the individual sections are, for example, waiting times until the respective mixture is adjusted.
- the phase sum 400 represents, for example, a stable sum signal D1+D2 (D1 corresponds to detector 1 and D2 corresponds to detector 2) of the phase positions.
- D1 corresponds to detector 1
- D2 corresponds to detector 2 of the phase positions.
- a distinction between 100 vol.% O 2 and 100 vol.% N 2 is present for all phase information, for example.
- the largest signal difference occurs between 10 vol.% CO 2 and 0 vol.% CO 2 in N 2. Since the phase difference signal 410 is currently very noisy, the phase sum 400 is preferred as phase information.
- Information 210 about an amplitude of a detector signal from a first detector and information 220 about an amplitude of a detector signal from a second detector are displayed.
- the amplitude information 210 and 220 can also be acquired with other environmental parameter settings (different temperature, different pressure).
- a first section (e.g., measuring points 4520 to 4650) represents the respective amplitude information 210, 220 for a 10 vol.% CO2 in N2 gas mixture
- a second section (e.g., measuring points 4670 to 4810) represents the respective amplitude information 210, 220 for a 100 vol.% N2 gas
- a third section (e.g., measuring points 4960 to 5120) represents the respective amplitude information 210, 220 for a 100 vol.% O2 gas. Times between the individual sections are, for example, waiting times until the respective mixture is adjusted.
- the information 210 about the amplitude of the detector signal of the first detector and the information 220 about the amplitude of the detector signal of the second detector represent, for example, stable amplitude signals, with D2 (the second detector) according to this embodiment having greater noise because its amplitude is lower than the amplitude at D1 (the first detector) (approximately 5 mV compared to 1.8 mV in air).
- D2 the second detector
- D1 the first detector
- a clearer distinction between 100 vol.% O 2 and 100 vol.% N 2 occurs than for the phase signals (see 210, 220, 400, and 410 in Fig. 29 ).
- a comparison of the relationships between phase and amplitude may be useful in order to determine the concentration of the third gas O 2 using the evaluation system (e.g., if the system has drifted too far from the fresh air calibration).
- Fig. 31 shows a combination signal sigX 230 (with the right y-axis) and a CO2 reference signal 500 (with the left y-axis).
- the combination signal sigX 230 can also be recorded with other environmental parameter settings (different temperature, different pressure).
- a first section (e.g. measuring points 4610 to 4650) represents the combination signal sigX 230 for a 10 vol.% CO 2 in N 2 gas mixture
- a second section (e.g. measuring points 4700 to 4810) represents the combination signal sigX 230 for a 100 vol.% N 2 gas
- a third section (e.g. measuring points 4960 to 5100) represents the combination signal sigX 230 for a 100 vol.% O 2 gas.
- Times between the individual sections are, for example, waiting times until the respective mixture is adjusted.
- An NDIR reference detector (see reference signal 500), for example, only detects a CO 2 concentration and cannot distinguish between N 2 and O 2 .
- the gas sensor is a membrane sensor.
- the thermal gas sensor based on membrane and thermopile technology with a perforated membrane can be designed to minimize parasitic heat transfer via the membrane or the suspensions of the structures in order to obtain a higher gas-sensitive signal.
- the gas sensor can comprise electronics, wherein the electronics can comprise one or more of the following aspects, individually or in combination.
- the electronics can comprise a DC sensor amplifier with a software-adjusted operating point.
- the electronics can be designed to perform a phase position measurement via the internal timer structure of the ⁇ Controller (MSP430), for example, using the precise generation of the heater excitation signal via the analog switch via the internal timer structure of the ⁇ Controller (MSP430).
- the electronics can be designed to perform a phase position measurement of the sensor signals via a Schmitt trigger, which measures the sensor signals freed from the DC offset at the zero point crossing, since this is where the signals are steepest and thus the phase noise is minimized.
- the electronics comprise a control of the heating power via S1 amplitude controllers and/or a control of the sampling timing.
- the gas sensor may have a calibration.
- the calibration may be configured to generate a pseudo-signal from phase and amplitude, with the focus on a pseudo-signal in the signal generation and formula.
- an evaluation arrangement 200 for a thermal gas sensor 100 with at least one heater 120 and at least one detector 130, 140 is designed to obtain information 210 about an amplitude of a detector signal of a first detector 130 and information 210 about a first phase difference between a heater signal and the detector signal of the first detector 130; and to form a combination signal 230 as an intermediate variable depending on the information 210, 220 about the amplitudes of the detector signal and depending on the information 210, 220 about the first phase difference, and to determine information 240 about a gas concentration or information 240 about a thermal conductivity of a fluid based on the combination signal 230.
- an evaluation arrangement 200 for a thermal gas sensor 100 with at least one heater 120 and two detectors 130, 140 arranged at different distances from the heater 120 is designed to obtain information 210 about an amplitude of a detector signal of a first detector 130, information 220 about an amplitude of a detector signal of a second detector 140, information 210 about a first phase difference between a heater signal and the detector signal of the first detector 130, and information 220 about a second phase difference between the heater signal and the detector signal of the second detector 140; and to form a combination signal 230 as an intermediate variable depending on the information 210, 220 about the amplitudes of the detector signals and depending on the information 210, 220 about the first phase difference and depending on the information about the second phase difference, and to determine information 240 about a gas concentration or information 240 about a thermal conductivity of a fluid based on the combination signal 230.
- the evaluation arrangement 200 is designed to obtain information 122 about a heater amplitude and to form a linear combination of the information 122 about the heater amplitude, the information 210, 220 about amplitudes of the detector signals, the information 210 about the first phase difference and the information 220 about the second phase difference in order to determine the combination signal 230.
- the evaluation arrangement 200 is designed to calculate a polynomial of the combination signal 230 in order to obtain the information 240 about the gas concentration.
- the evaluation arrangement 200 is designed to multiply a polynomial of the combination signal 230 by a correction term in order to obtain the information 240 about the gas concentration, wherein the correction term is dependent on the combination signal 230, information about a pressure and information about a temperature.
- the evaluation arrangement 200 is designed to take into account a pressure and/or a temperature in an environment of the thermal gas sensor 100 when determining the information 240 about the gas concentration.
- the evaluation arrangement 200 is designed to use the combination signal 230, information about the temperature in an environment of the thermal gas sensor 100 and information about a pressure in an environment of the thermal gas sensor 100 as input variables of a drift correction when determining the information 240 about the gas concentration, and to obtain the information 240 about the gas concentration as a result of the drift correction.
- the evaluation arrangement 200 is designed to generate the combination signal 230 based on a quotient between amplitude information 210, 220 derived from the information 210 about the amplitude of the detector signal of at least the first detector 130; and phase information 210, 220, 400, 410, which is dependent on the information 210 about the first phase difference; and wherein the evaluation arrangement 200 is designed to determine the information 240 about a concentration of a gas depending on the combination signal 230.
- the evaluation arrangement 200 is designed to obtain information about how much heat is dissipated by the heater during a heating period 302 and to determine the information 240 about a concentration of a gas depending on the information about how much energy is dissipated by the heater during the heating period 302.
- the evaluation arrangement 200 is designed to obtain the information on how much heat is dissipated by the heater during a heating period 302 based on a measurement of a current flow 310 through the heater at a predetermined heating voltage 300.
- the evaluation arrangement 200 is designed to obtain the current flow 310 shortly after the predetermined heating voltage 300 is switched on and shortly before the predetermined heating voltage 300 is switched off.
- a method for evaluating signals from a thermal gas sensor having at least one heater and at least one detector comprises the following step: Obtaining information about an amplitude of a detector signal from a first detector and information about a first phase difference between a heater signal and the detector signal of the first detector; and wherein, as an intermediate variable, a combination signal is formed depending on the information about the amplitudes of the detector signal and depending on the information about the first phase difference, and wherein information about a gas concentration or information about a thermal conductivity of a fluid is determined based on the combination signal.
- a method for evaluating signals from a thermal gas sensor having at least one heater and two detectors arranged at different distances from the heater comprises the following step: obtaining information about an amplitude of a detector signal from a first detector, information about an amplitude of a detector signal from a second detector, information about a first phase difference between a heater signal and the detector signal from the first detector, and information about a second phase difference between the heater signal and the detector signal from the second detector; and wherein, as an intermediate variable, a combination signal is formed depending on the information about the amplitudes of the detector signals and depending on the information about the first phase difference and depending on the information about the second phase difference, and wherein information about a gas concentration or information about a thermal conductivity of a fluid is determined based on the combination signal.
- a nineteenth aspect relates to a computer program comprising program code for carrying out the method according to aspect 17 or aspect 18 when the program runs on a computer.
- an evaluation arrangement 200 for a thermal gas sensor 100 having at least one heater 120 and at least one detector 130, 140 is designed to regulate 250, 252 a heating power applied to the heater 120 as a function of at least one sensor signal from at least one detector 130, 140, in order to bring the at least one sensor signal into a predetermined value range; and to take into account information 122 about the heating power when deriving information 240 about a gas concentration from the sensor signals.
- the evaluation arrangement 200 is designed to apply a periodic signal 260 to the heater 120.
- the evaluation arrangement 200 is designed to switch the heating power applied to the heater 120 between two values.
- the evaluation arrangement 200 is designed to regulate 250, 252 an amplitude of the heating power such that both a minimum value of the at least one sensor signal and a maximum value of the at least one sensor signal lie within the predetermined value range.
- the evaluation arrangement 200 is designed to adjust or regulate 250, 252 an amplitude of the heating power such that an amplitude of the at least one sensor signal lies in a predetermined amplitude range.
- the evaluation arrangement 200 is designed to set or regulate sampling times at which a sensor signal is sampled 270, 280, 290.
- the evaluation arrangement 200 is designed to set the sampling times 270, 280, 290 such that sampling occurs at a time at which the sensor signal reaches a maximum value and such that sampling occurs at a time at which the sensor signal reaches a minimum value.
- the evaluation arrangement 200 is designed to combine a sensor signal from at least one detector 130, 140 with an offset signal generated by a digital-to-analog converter in order to generate an input signal for the Analog-to-digital converter to adjust the offset signal to ensure that the input signal of the analog-to-digital converter remains within a specified range during an entire period of the sensor signal.
- the evaluation arrangement 200 is designed to regulate 250, 252 the heating power only when an adjustment or regulation 270, 280, 290 of the sampling times is in a steady state and when an adjustment of the offset signal is in a steady state.
- the evaluation arrangement 200 is designed to stop the control 250, 252 of the heating power while an adjustment or regulation 270, 280, 290 of the sampling times takes place and/or while an adjustment of the offset signal takes place.
- the evaluation arrangement 200 is designed to regulate both an average heating power or a maximum heating power and an amplitude of the heating power 250, 252.
- a method for operating an evaluation arrangement for a thermal gas sensor having at least one heater and at least one detector comprises regulating a heating power applied to the heater as a function of at least one sensor signal from at least one detector in order to bring the at least one sensor signal into a predetermined value range; and taking into account information about the heating power when deriving information about a gas concentration from the at least one sensor signal.
- a thirty-second aspect relates to a computer program for carrying out the method according to aspect 31 when the computer program is executed on a computer.
- an evaluation arrangement 200 for a thermal gas sensor 100 with at least one heater 120 and at least one detector 130, 140 designed to apply a periodic signal 260 with a predetermined period to the heater 120, and to sample 270 at least one sensor signal from a detector 130, 140 at three points in time, wherein a second sampling time is offset by 90 degrees with respect to the period from a first sampling time, and wherein a third sampling time is offset by 180 degrees with respect to the period from the first sampling time, and to detect 280, based on three samples based on a sample of the sensor signal at the first sampling time, at the second sampling time and at the third sampling time, whether a first sample and a third sample represent a maximum value and a minimum value of the sensor signal.
- the evaluation arrangement 200 is designed to change 290 sampling times depending on the detection 280 of whether the first sample value and the third sample value represent a maximum value and a minimum value of the sensor signal.
- the evaluation arrangement 200 is designed to set or adjust 270, 280, 290 the sampling times such that the first sample value represents a first extreme value of the sensor signal and the third sample value represents a second extreme value of the sensor signal.
- the evaluation arrangement 200 is designed to take into account information about a time of passage of the sensor signal through a predetermined threshold value when setting or adjusting 270, 280, 290 the sampling times.
- the evaluation arrangement 200 is designed to check 280 whether a second sample value at the second sampling time is equal to an average value of the first sample value at the first sampling time and the third sample value at the third sampling time, and to detect, depending on the check 280, whether the first sample value and the third sample value represent a maximum value and a minimum value of the sensor signal.
- the evaluation arrangement 200 is designed to apply a periodic square-wave signal with a duty cycle of preferably 50% to the heater 120.
- the evaluation arrangement 200 is designed to combine a sensor signal from at least one detector 130, 140 with an offset signal generated by a digital-to-analog converter in order to obtain an input signal for an analog-to-digital converter, and to adjust the offset signal in order to ensure that the input signal of the analog-to-digital converter remains within a predetermined range throughout an entire period of the sensor signal, and to adjust the sampling times 270, 280, 290 after adjusting the offset signal; and to perform a renewed check 280 after changing the sampling times 290 to determine whether sample values obtained with the changed setting of the sampling times continue to lie within the predetermined range.
- the evaluation arrangement 200 is designed to regulate a heating power applied to the heater 120 as a function of at least one sensor signal from at least one detector 130, 140, in order to bring the at least one sensor signal into a predetermined value range; and to take into account information 122 about the heating power when deriving information 240 about a gas concentration from the sensor signals.
- a method for operating a thermal gas sensor having at least one heater and at least one detector comprises applying a periodic signal having a predetermined period to the heater, and wherein at least one sensor signal is sampled by a detector at three points in time 270, wherein a second sampling time is offset by 90 degrees relative to a first sampling time, with respect to the period, and wherein a third sampling time is offset by 180 degrees relative to the first sampling time, and wherein, based on three sampling values based on a sampling of the sensor signal at the first sampling time, at the second sampling time, and at the third sampling time, it is detected 280 whether a first sampling value and a third sampling value represent a maximum value and a minimum value of the sensor signal.
- aspects have been described in connection with a device, it should be understood that these aspects also represent a description of the corresponding method, so that a block or component of a device can also be understood as a corresponding method step or as a feature of a method step. Analogously, aspects described in connection with or as a method step also represent a description of a corresponding block, detail, or feature of a corresponding device.
- Some or all of the method steps can be carried out by (or using) a hardware apparatus, such as a microprocessor, a programmable computer, or an electronic circuit. In some embodiments, some or more of the key method steps can be carried out by such an apparatus.
- embodiments of the invention may be implemented in hardware or software.
- the implementation may using a digital storage medium, such as a floppy disk, DVD, Blu-ray Disc, CD, ROM, PROM, EPROM, EEPROM, or FLASH memory, a hard disk, or other magnetic or optical storage device, on which electronically readable control signals are stored that can interact or interact with a programmable computer system to perform the respective method. Therefore, the digital storage medium may be computer-readable.
- Some embodiments according to the invention thus comprise a data carrier having electronically readable control signals capable of interacting with a programmable computer system such that one of the methods described herein is carried out.
- embodiments of the present invention may be implemented as a computer program product having program code, wherein the program code is operable to perform one of the methods when the computer program product is run on a computer.
- the program code can, for example, also be stored on a machine-readable medium.
- inventions include the computer program for performing one of the methods described herein, wherein the computer program is stored on a machine-readable carrier.
- an embodiment of the method according to the invention is thus a computer program which has a program code for carrying out one of the methods described herein when the computer program runs on a computer.
- a further embodiment of the method according to the invention is thus a data carrier (or a digital storage medium or a computer-readable medium) on which the computer program for performing one of the methods described herein is recorded.
- the data carrier, the digital storage medium, or the computer-readable medium are typically physical and/or non-perishable or non-transitory.
- a further embodiment of the method according to the invention is thus a data stream or a sequence of signals that represents the computer program for carrying out one of the methods described herein.
- the data stream or the sequence of signals can be configured, for example, to be transferred via a data communication connection, for example via the Internet.
- a further embodiment comprises a processing device, for example a computer or a programmable logic device, which is configured or adapted to carry out one of the methods described herein.
- a processing device for example a computer or a programmable logic device, which is configured or adapted to carry out one of the methods described herein.
- a further embodiment comprises a computer on which the computer program for performing one of the methods described herein is installed.
- a further embodiment according to the invention comprises a device or a system designed to transmit a computer program for performing at least one of the methods described herein to a recipient.
- the transmission can be electronic or optical, for example.
- the recipient can be, for example, a computer, a mobile device, a storage device, or a similar device.
- the device or system can, for example, comprise a file server for transmitting the computer program to the recipient.
- a programmable logic device e.g., a field-programmable gate array, an FPGA
- a field-programmable gate array may interact with a microprocessor to perform any of the methods described herein.
- the methods are performed by any hardware device. This may be general-purpose hardware, such as a computer processor (CPU), or method-specific hardware, such as an ASIC.
- the devices described herein may be implemented, for example, using a hardware apparatus, or using a computer, or using a combination of a hardware apparatus and a computer.
- the devices described herein, or any components of the devices described herein may be implemented at least partially in hardware and/or in software (computer program).
- the methods described herein may be implemented, for example, using a hardware apparatus, or using a computer, or using a combination of a hardware apparatus and a computer.
Landscapes
- Health & Medical Sciences (AREA)
- Life Sciences & Earth Sciences (AREA)
- Physics & Mathematics (AREA)
- General Physics & Mathematics (AREA)
- Chemical & Material Sciences (AREA)
- Engineering & Computer Science (AREA)
- Analytical Chemistry (AREA)
- Biochemistry (AREA)
- General Health & Medical Sciences (AREA)
- Immunology (AREA)
- Pathology (AREA)
- Molecular Biology (AREA)
- Biomedical Technology (AREA)
- Fluid Mechanics (AREA)
- Biophysics (AREA)
- Hematology (AREA)
- Urology & Nephrology (AREA)
- Food Science & Technology (AREA)
- Medicinal Chemistry (AREA)
- Investigating Or Analyzing Materials Using Thermal Means (AREA)
- Investigating Or Analyzing Materials By The Use Of Electric Means (AREA)
- Investigating Or Analyzing Materials By The Use Of Fluid Adsorption Or Reactions (AREA)
Applications Claiming Priority (4)
| Application Number | Priority Date | Filing Date | Title |
|---|---|---|---|
| EP18150496 | 2018-01-05 | ||
| EP21190705.0A EP3926335B1 (de) | 2018-01-05 | 2019-01-07 | Auswerteanordnung für einen thermischen gassensor, verfahren und computerprogramm |
| EP19700107.6A EP3735580B1 (de) | 2018-01-05 | 2019-01-07 | Auswerteanordnung für einen thermischen gassensor, verfahren und computerprogramme |
| PCT/EP2019/050261 WO2019135002A2 (de) | 2018-01-05 | 2019-01-07 | Auswerteanordnung für einen thermischen gassensor, verfahren und computerprogramme |
Related Parent Applications (3)
| Application Number | Title | Priority Date | Filing Date |
|---|---|---|---|
| EP19700107.6A Division EP3735580B1 (de) | 2018-01-05 | 2019-01-07 | Auswerteanordnung für einen thermischen gassensor, verfahren und computerprogramme |
| EP21190705.0A Division EP3926335B1 (de) | 2018-01-05 | 2019-01-07 | Auswerteanordnung für einen thermischen gassensor, verfahren und computerprogramm |
| EP21190705.0A Division-Into EP3926335B1 (de) | 2018-01-05 | 2019-01-07 | Auswerteanordnung für einen thermischen gassensor, verfahren und computerprogramm |
Publications (2)
| Publication Number | Publication Date |
|---|---|
| EP4141430A1 EP4141430A1 (de) | 2023-03-01 |
| EP4141430B1 true EP4141430B1 (de) | 2025-06-18 |
Family
ID=60990632
Family Applications (3)
| Application Number | Title | Priority Date | Filing Date |
|---|---|---|---|
| EP22196711.0A Active EP4141430B1 (de) | 2018-01-05 | 2019-01-07 | Auswerteanordnung für einen thermischen gassensor, verfahren und computerprogramm |
| EP21190705.0A Active EP3926335B1 (de) | 2018-01-05 | 2019-01-07 | Auswerteanordnung für einen thermischen gassensor, verfahren und computerprogramm |
| EP19700107.6A Active EP3735580B1 (de) | 2018-01-05 | 2019-01-07 | Auswerteanordnung für einen thermischen gassensor, verfahren und computerprogramme |
Family Applications After (2)
| Application Number | Title | Priority Date | Filing Date |
|---|---|---|---|
| EP21190705.0A Active EP3926335B1 (de) | 2018-01-05 | 2019-01-07 | Auswerteanordnung für einen thermischen gassensor, verfahren und computerprogramm |
| EP19700107.6A Active EP3735580B1 (de) | 2018-01-05 | 2019-01-07 | Auswerteanordnung für einen thermischen gassensor, verfahren und computerprogramme |
Country Status (8)
| Country | Link |
|---|---|
| US (3) | US11686695B2 (enExample) |
| EP (3) | EP4141430B1 (enExample) |
| JP (3) | JP7561619B2 (enExample) |
| KR (2) | KR102558160B1 (enExample) |
| CN (2) | CN112055811B (enExample) |
| AU (2) | AU2019205103B2 (enExample) |
| CA (2) | CA3185299C (enExample) |
| WO (1) | WO2019135002A2 (enExample) |
Families Citing this family (12)
| Publication number | Priority date | Publication date | Assignee | Title |
|---|---|---|---|---|
| EP4141430B1 (de) | 2018-01-05 | 2025-06-18 | Hahn-Schickard-Gesellschaft für angewandte Forschung e. V. | Auswerteanordnung für einen thermischen gassensor, verfahren und computerprogramm |
| US11073415B2 (en) | 2019-10-21 | 2021-07-27 | Flusso Limited | Thermal fluid flow sensor having a dielectric membrane comprising discontinuities between the heating element and an edge |
| JP7452323B2 (ja) * | 2020-08-18 | 2024-03-19 | 株式会社デンソー | ガス濃度検出装置 |
| EP4228568A2 (en) * | 2020-10-13 | 2023-08-23 | Alcon Inc. | Apparatus and methods for gas verification |
| EP4009008B1 (en) * | 2020-12-03 | 2024-01-31 | Sensirion AG | Fault detection in a thermal sensor device |
| EP4521102A1 (en) * | 2021-12-17 | 2025-03-12 | Sensirion AG | Thermal sensor device and method for determining concentration of a target gas in a gas sample |
| DE102022209906A1 (de) * | 2022-09-20 | 2024-03-21 | Hahn-Schickard-Gesellschaft für angewandte Forschung e.V. | Sensoranordnung |
| DE102022209905A1 (de) * | 2022-09-20 | 2024-03-21 | Hahn-Schickard-Gesellschaft für angewandte Forschung e.V. | Sensoranordnung |
| DE102022127043B4 (de) * | 2022-10-15 | 2024-05-23 | Sensirion Ag | Driftkompensation für einen Sensor zur Messung der Konzentration eines Stoffes in einem Fluid |
| DE102022214190A1 (de) * | 2022-12-21 | 2024-06-27 | Vitesco Technologies GmbH | Verfahren zur Diagnose eines Gaskonzentrationssensors, Gaskonzentrationssensor, Computerprogramm und computerlesbares Medium |
| US12596085B2 (en) * | 2023-07-17 | 2026-04-07 | Posifa Technologies Inc. | Method and apparatus for simultaneously measuring air contained hydrogen and water vapor concentrations via a single MEMS thermal conductivity sensor |
| EP4610642A1 (de) * | 2024-02-29 | 2025-09-03 | Hahn-Schickard-Gesellschaft für angewandte Forschung e. V. | Verfahren und thermischer sensor zur detektion von mikroplastik |
Citations (1)
| Publication number | Priority date | Publication date | Assignee | Title |
|---|---|---|---|---|
| EP1144958B1 (de) * | 1998-12-22 | 2004-03-24 | Sensirion AG | Verfahren und sensor zur messung eines massenflusses |
Family Cites Families (58)
| Publication number | Priority date | Publication date | Assignee | Title |
|---|---|---|---|---|
| US3866108A (en) * | 1971-12-06 | 1975-02-11 | Westinghouse Electric Corp | Control system and method for controlling dual fuel operation of industrial gas turbine power plants, preferably employing a digital computer |
| US4259835A (en) * | 1978-02-06 | 1981-04-07 | Westinghouse Electric Corp. | System and method for monitoring industrial gas turbine operating parameters and for providing gas turbine power plant control system inputs representative thereof |
| JPH0493648A (ja) | 1990-08-03 | 1992-03-26 | Yamatake Honeywell Co Ltd | ガスクロマトグラフ |
| DE4338200A1 (de) * | 1993-11-09 | 1995-05-11 | Efu Ges Fuer Ur Umformtechnik | Verfahren zur Messung der Temperatur von metallischen Werkstücken oder ihres Feststoffanteils im teilerstarrten Zustand |
| JP3370801B2 (ja) | 1994-11-02 | 2003-01-27 | リコーエレメックス株式会社 | 温度補償付き雰囲気検出装置 |
| US5897836A (en) * | 1996-12-19 | 1999-04-27 | J And N Associates, Inc. | Thermal gas sensing apparatus |
| US10130787B2 (en) | 1997-06-17 | 2018-11-20 | Fisher & Paykel Healthcare Limited | Humidity controller |
| US6019505A (en) | 1997-12-31 | 2000-02-01 | Honeywell Inc. | Time lag approach for measuring thermal conductivity and specific heat |
| US6169965B1 (en) | 1997-12-31 | 2001-01-02 | Honeywell International Inc. | Fluid property and flow sensing via a common frequency generator and FFT |
| US6079253A (en) | 1997-12-31 | 2000-06-27 | Honeywell Inc. | Method and apparatus for measuring selected properties of a fluid of interest using a single heater element |
| JP4093333B2 (ja) | 1998-07-08 | 2008-06-04 | アルバック理工株式会社 | 熱物性測定方法と装置 |
| DE19944181A1 (de) * | 1999-09-15 | 2001-04-12 | Bosch Gmbh Robert | Sensor zur Bestimmung der Konzentration von Gaskomponenten in Gasgemischen |
| DE19949327A1 (de) * | 1999-10-13 | 2001-04-19 | Grunewald Axel Ulrich | Verfahren und Einrichtung zur Bestimmung der Gaskonzentrationen in einem Gasgemisch |
| JP3843880B2 (ja) | 2001-05-31 | 2006-11-08 | 株式会社デンソー | ガス濃度センサのヒータ制御装置 |
| GR1004040B (el) | 2001-07-31 | 2002-10-31 | Μεθοδος για την κατασκευη αιωρουμενων μεμβρανων πορωδους πυριτιου και εφαρμογης της σε αισθητηρες αεριων | |
| US20080044939A1 (en) * | 2002-01-24 | 2008-02-21 | Nassiopoulou Androula G | Low power silicon thermal sensors and microfluidic devices based on the use of porous sealed air cavity technology or microchannel technology |
| AU2003201271B2 (en) * | 2003-01-23 | 2006-09-28 | Ems-Patent Ag | Increased-accuracy gas energy meter |
| JP4500904B2 (ja) * | 2005-01-31 | 2010-07-14 | 一平 鳥越 | 熱伝達特性測定方法および装置 |
| JP4662339B2 (ja) | 2005-02-04 | 2011-03-30 | エプソンイメージングデバイス株式会社 | 液晶表示パネル |
| DE102005023695A1 (de) * | 2005-05-23 | 2006-11-30 | Robert Bosch Gmbh | Verfahren und Vorrichtung zur Korrektur der Alterung eines Gasmessfühlers |
| DE102005059304B3 (de) * | 2005-12-09 | 2007-05-31 | Areva Np Gmbh | Verfahren und Einrichtung zum Kalibrieren eines Feuchtigkeitssensors |
| EP1840535B1 (en) * | 2006-03-31 | 2011-01-12 | Sensirion Holding AG | Flow sensor with thermocouples |
| DE102006054505A1 (de) | 2006-11-20 | 2008-05-29 | Escube Gmbh & Co. Kg | Vorrichtung und Verfahren zur Bestimmung der Konzentration eines Stoffes in einem Gas |
| US7780343B2 (en) | 2007-07-09 | 2010-08-24 | Siargo Ltd. | Micromachined gas and liquid concentration sensor and method of making the same |
| DE102008047511A1 (de) | 2007-09-13 | 2009-03-19 | Weinmann Geräte für Medizin GmbH + Co. KG | Vorrichtung und Verfahren zur Atemgasanalyse |
| CN101809863A (zh) | 2007-09-28 | 2010-08-18 | Nxp股份有限公司 | 自动共模抑制校准 |
| US8331892B2 (en) | 2008-03-29 | 2012-12-11 | Qualcomm Incorporated | Method and system for DC compensation and AGC |
| JP4983726B2 (ja) | 2008-05-29 | 2012-07-25 | トヨタ自動車株式会社 | ガス濃度センサの暖機制御装置 |
| JP5745205B2 (ja) | 2008-08-22 | 2015-07-08 | 木村 光照 | 加熱励振を利用した熱伝導型気圧センサ |
| EP2175246B1 (en) * | 2008-10-09 | 2017-07-19 | Sensirion AG | A method for measuring a fluid composition parameter by means of a flow sensor |
| FR2949155B1 (fr) * | 2009-08-14 | 2012-04-06 | Neosens | Procede de mesure ou de detection de l'encrassement d'un reacteur |
| JP5055349B2 (ja) | 2009-12-28 | 2012-10-24 | 日立オートモティブシステムズ株式会社 | 熱式ガスセンサ |
| EP2348292A1 (en) * | 2010-01-13 | 2011-07-27 | Sensirion AG | Sensor device |
| DE102011075519A1 (de) * | 2011-05-09 | 2012-11-15 | Innovative Sensor Technology Ist Ag | Verfahren und Vorrichtung zum thermischen Bestimmen des Massedurchflusses eines Mediums in einer Leitung |
| DE102011081922B4 (de) | 2011-08-31 | 2021-12-23 | Hahn-Schickard-Gesellschaft für angewandte Forschung e.V. | Strömumgssensor zur Bestimmung eines Strömungsparameters |
| WO2013112287A1 (en) | 2012-01-09 | 2013-08-01 | David Martin | Networked air quality monitoring |
| US20130234330A1 (en) | 2012-03-08 | 2013-09-12 | Infineon Technologies Ag | Semiconductor Packages and Methods of Formation Thereof |
| JP5779131B2 (ja) | 2012-03-27 | 2015-09-16 | アズビル株式会社 | 発熱量測定システム及び発熱量の測定方法 |
| DE102012102979A1 (de) | 2012-04-05 | 2013-10-24 | Endress + Hauser Flowtec Ag | Durchflussmessgerät, Messrohr sowie Verfahren zur Herstellung eines Durchflussmessgeräts |
| JP5782406B2 (ja) | 2012-06-14 | 2015-09-24 | 日本特殊陶業株式会社 | ガスセンサシステム |
| DE102013102398B8 (de) * | 2013-03-11 | 2024-06-27 | Innovative Sensor Technology Ist Ag | Thermischer Strömungssensor zur Bestimmung der Zusammensetzung eines Gasgemisches, sowie dessen Strömungsgeschwindigkeit |
| DE102014000939A1 (de) | 2013-06-20 | 2014-12-24 | Hydrometer Gmbh | Verfahren zum Bestimmen wenigstens eines Gasparameters eines strömenden Gases |
| EP2840385A1 (en) * | 2013-08-23 | 2015-02-25 | DCG Systems, Inc. | Lock-in thermography method and system for determining material layer parameters of a sample |
| JP2015064305A (ja) | 2013-09-25 | 2015-04-09 | 木村 光照 | 熱型センサとこれを用いた熱計測モジュール |
| EP3071936B1 (de) | 2013-11-19 | 2020-07-15 | Endress+Hauser Flowtec AG | Messgerät und verfahren zur bestimmung eines korrigierten massedurchflusses und verwendungen des messgerätes |
| DE102014106729A1 (de) * | 2014-05-13 | 2015-11-19 | Endress + Hauser Flowtec Ag | Verfahren zum Betreiben eines Messgerätes und Messgerät |
| EP2887057A1 (en) * | 2013-12-17 | 2015-06-24 | Sensirion AG | Device and method of humidity compensated gas concentration monitoring by thermal conductivity measurements |
| US9453807B2 (en) | 2014-04-08 | 2016-09-27 | Ams International Ag | Thermal conductivity gas sensor with amplification material |
| EP2985592B1 (de) * | 2014-08-13 | 2017-09-27 | Siemens Aktiengesellschaft | Absorptionsspektrometer und Verfahren zur Messung der Konzentration einer interessierenden Gaskomponente eines Messgases |
| JP6470985B2 (ja) | 2015-01-27 | 2019-02-13 | 日本特殊陶業株式会社 | マイクロヒータ及びセンサ |
| US10211673B2 (en) | 2015-03-04 | 2019-02-19 | Siemens Industry, Inc. | Apparatus and methods for timestamping electrical data in a panel meter |
| DE102015107584A1 (de) | 2015-05-13 | 2016-11-17 | Innovative Sensor Technology Ist Ag | Verfahren zur Bestimmung eines Produktes aus Wärmekapazität und Dichte |
| JP6459788B2 (ja) | 2015-06-12 | 2019-01-30 | 株式会社デンソー | センサの印加電圧制御装置 |
| GB2545426B (en) | 2015-12-14 | 2021-08-04 | Sciosense Bv | Sensing Layer Formation |
| JP7253551B2 (ja) | 2017-08-14 | 2023-04-06 | ハーン-シッカート-ゲゼルシャフト フュア アンゲヴァンテ フォアシュング アインゲトラーゲナー フェライン | 呼吸空気の呼気co2濃度を決定するためのガスセンサ |
| EP3502687B1 (en) * | 2017-12-20 | 2022-06-29 | Sensirion AG | Determination of gas parameters |
| EP4141430B1 (de) | 2018-01-05 | 2025-06-18 | Hahn-Schickard-Gesellschaft für angewandte Forschung e. V. | Auswerteanordnung für einen thermischen gassensor, verfahren und computerprogramm |
| JPWO2022091230A1 (enExample) | 2020-10-27 | 2022-05-05 |
-
2019
- 2019-01-07 EP EP22196711.0A patent/EP4141430B1/de active Active
- 2019-01-07 EP EP21190705.0A patent/EP3926335B1/de active Active
- 2019-01-07 CA CA3185299A patent/CA3185299C/en active Active
- 2019-01-07 CN CN201980017444.7A patent/CN112055811B/zh active Active
- 2019-01-07 JP JP2020537150A patent/JP7561619B2/ja active Active
- 2019-01-07 EP EP19700107.6A patent/EP3735580B1/de active Active
- 2019-01-07 KR KR1020227016489A patent/KR102558160B1/ko active Active
- 2019-01-07 CN CN202310885655.0A patent/CN117309929A/zh active Pending
- 2019-01-07 WO PCT/EP2019/050261 patent/WO2019135002A2/de not_active Ceased
- 2019-01-07 KR KR1020207022725A patent/KR102400465B1/ko active Active
- 2019-01-07 CA CA3088990A patent/CA3088990C/en active Active
- 2019-01-07 AU AU2019205103A patent/AU2019205103B2/en active Active
-
2020
- 2020-07-06 US US16/921,407 patent/US11686695B2/en active Active
-
2022
- 2022-01-21 AU AU2022200416A patent/AU2022200416B2/en active Active
- 2022-05-02 JP JP2022075661A patent/JP7460682B2/ja active Active
- 2022-08-16 US US17/820,164 patent/US11874242B2/en active Active
-
2023
- 2023-11-20 JP JP2023196781A patent/JP2024020474A/ja active Pending
-
2024
- 2024-01-12 US US18/412,417 patent/US12385862B2/en active Active
Patent Citations (1)
| Publication number | Priority date | Publication date | Assignee | Title |
|---|---|---|---|---|
| EP1144958B1 (de) * | 1998-12-22 | 2004-03-24 | Sensirion AG | Verfahren und sensor zur messung eines massenflusses |
Also Published As
Similar Documents
| Publication | Publication Date | Title |
|---|---|---|
| EP3926335B1 (de) | Auswerteanordnung für einen thermischen gassensor, verfahren und computerprogramm | |
| EP3735581B1 (de) | Gassensor und verfahren für einen betrieb des gassensors | |
| KR101547021B1 (ko) | 4 단자 센서와 사용하기 위한 제어 회로, 및 그러한 제어 회로를 포함하는 측정 시스템 | |
| EP3887770B1 (de) | Thermischer strömungssensor und verfahren zum betreiben desselben | |
| Dominguez-Pumar et al. | Smart control of chemical gas sensors for the reduction of their time response | |
| DE102016200270A1 (de) | Vorrichtung und Verfahren zum Detektieren eines Fluids | |
| DE102014210122B4 (de) | Vorrichtung zum Bestimmen eines Werts einer zu messenden Eigenschaft eines Fluids, Verfahren zum Betreiben einer Vorrichtung zum Bestimmen eines Werts einer zu messenden Eigenschaft eines Fluids | |
| DE102013002598B4 (de) | Abweichungskompensation für Flusssensorelemente | |
| EP3390976B1 (de) | Verfahren zur bestimmung einer flussrate bzw. strömungsgeschwindigkeit eines mediums | |
| DE102015222064A1 (de) | Vorrichtung und Verfahren zum Detektieren einer Gaskomponente | |
| WO2017174410A1 (de) | Kalorimetrische bestimmung einer gaskonzentration | |
| EP3588081B1 (de) | Verfahren und vorrichtung zum kalibrieren eines fluiddetektors mit präkonzentrator | |
| WO2025257145A1 (de) | Thermischer sensor und verfahren zur bestimmung einer messgrösse unter berücksichtigung eines thermischen und elektrischen signalanteils des messsignals | |
| WO2002059588A1 (de) | Vorrichtung und verfahren zum messen einer wärmeleitfähigkeit | |
| CH720800A2 (de) | Kompensation von schwankungen der umgebungstemperatur in einer thermischen sensorvorrichtung | |
| EP4591036A1 (de) | Sensoranordnung | |
| Tangsrirat et al. | Simple current-mode square-rooting circuit with temperature compensation using only OTAs | |
| Fiedler et al. | On the Usage of Cyclic Voltammetry and Impedance Spectroscopy for Measuring the Concentration of Aqueous Solutions | |
| Martin | A description of properties and errors of simple and stacked sensors |
Legal Events
| Date | Code | Title | Description |
|---|---|---|---|
| PUAI | Public reference made under article 153(3) epc to a published international application that has entered the european phase |
Free format text: ORIGINAL CODE: 0009012 |
|
| STAA | Information on the status of an ep patent application or granted ep patent |
Free format text: STATUS: THE APPLICATION HAS BEEN PUBLISHED |
|
| AC | Divisional application: reference to earlier application |
Ref document number: 3735580 Country of ref document: EP Kind code of ref document: P Ref document number: 3926335 Country of ref document: EP Kind code of ref document: P |
|
| AK | Designated contracting states |
Kind code of ref document: A1 Designated state(s): AL AT BE BG CH CY CZ DE DK EE ES FI FR GB GR HR HU IE IS IT LI LT LU LV MC MK MT NL NO PL PT RO RS SE SI SK SM TR |
|
| STAA | Information on the status of an ep patent application or granted ep patent |
Free format text: STATUS: REQUEST FOR EXAMINATION WAS MADE |
|
| TPAC | Observations filed by third parties |
Free format text: ORIGINAL CODE: EPIDOSNTIPA |
|
| 17P | Request for examination filed |
Effective date: 20230901 |
|
| RBV | Designated contracting states (corrected) |
Designated state(s): AL AT BE BG CH CY CZ DE DK EE ES FI FR GB GR HR HU IE IS IT LI LT LU LV MC MK MT NL NO PL PT RO RS SE SI SK SM TR |
|
| RAP3 | Party data changed (applicant data changed or rights of an application transferred) |
Owner name: GS ELEKTROMEDIZINISCHE GERAETE G. STEMPLE GMBH Owner name: HAHN-SCHICKARD-GESELLSCHAFT FUER ANGEWANDTE FORSCHUNG E. V. |
|
| STAA | Information on the status of an ep patent application or granted ep patent |
Free format text: STATUS: EXAMINATION IS IN PROGRESS |
|
| 17Q | First examination report despatched |
Effective date: 20240925 |
|
| GRAP | Despatch of communication of intention to grant a patent |
Free format text: ORIGINAL CODE: EPIDOSNIGR1 |
|
| STAA | Information on the status of an ep patent application or granted ep patent |
Free format text: STATUS: GRANT OF PATENT IS INTENDED |
|
| INTG | Intention to grant announced |
Effective date: 20250114 |
|
| GRAS | Grant fee paid |
Free format text: ORIGINAL CODE: EPIDOSNIGR3 |
|
| GRAA | (expected) grant |
Free format text: ORIGINAL CODE: 0009210 |
|
| STAA | Information on the status of an ep patent application or granted ep patent |
Free format text: STATUS: THE PATENT HAS BEEN GRANTED |
|
| P01 | Opt-out of the competence of the unified patent court (upc) registered |
Free format text: CASE NUMBER: APP_20568/2025 Effective date: 20250430 |
|
| AC | Divisional application: reference to earlier application |
Ref document number: 3735580 Country of ref document: EP Kind code of ref document: P Ref document number: 3926335 Country of ref document: EP Kind code of ref document: P |
|
| AK | Designated contracting states |
Kind code of ref document: B1 Designated state(s): AL AT BE BG CH CY CZ DE DK EE ES FI FR GB GR HR HU IE IS IT LI LT LU LV MC MK MT NL NO PL PT RO RS SE SI SK SM TR |
|
| REG | Reference to a national code |
Ref country code: GB Ref legal event code: FG4D Free format text: NOT ENGLISH |
|
| REG | Reference to a national code |
Ref country code: CH Ref legal event code: EP |
|
| REG | Reference to a national code |
Ref country code: DE Ref legal event code: R096 Ref document number: 502019013483 Country of ref document: DE |
|
| REG | Reference to a national code |
Ref country code: CH Ref legal event code: EP |
|
| REG | Reference to a national code |
Ref country code: IE Ref legal event code: FG4D Free format text: LANGUAGE OF EP DOCUMENT: GERMAN |
|
| REG | Reference to a national code |
Ref country code: NL Ref legal event code: FP |
|
| PG25 | Lapsed in a contracting state [announced via postgrant information from national office to epo] |
Ref country code: FI Free format text: LAPSE BECAUSE OF FAILURE TO SUBMIT A TRANSLATION OF THE DESCRIPTION OR TO PAY THE FEE WITHIN THE PRESCRIBED TIME-LIMIT Effective date: 20250618 |
|
| REG | Reference to a national code |
Ref country code: LT Ref legal event code: MG9D |
|
| PG25 | Lapsed in a contracting state [announced via postgrant information from national office to epo] |
Ref country code: GR Free format text: LAPSE BECAUSE OF FAILURE TO SUBMIT A TRANSLATION OF THE DESCRIPTION OR TO PAY THE FEE WITHIN THE PRESCRIBED TIME-LIMIT Effective date: 20250919 Ref country code: NO Free format text: LAPSE BECAUSE OF FAILURE TO SUBMIT A TRANSLATION OF THE DESCRIPTION OR TO PAY THE FEE WITHIN THE PRESCRIBED TIME-LIMIT Effective date: 20250918 |
|
| REG | Reference to a national code |
Ref country code: SE Ref legal event code: TRGR |
|
| PG25 | Lapsed in a contracting state [announced via postgrant information from national office to epo] |
Ref country code: BG Free format text: LAPSE BECAUSE OF FAILURE TO SUBMIT A TRANSLATION OF THE DESCRIPTION OR TO PAY THE FEE WITHIN THE PRESCRIBED TIME-LIMIT Effective date: 20250618 |
|
| PG25 | Lapsed in a contracting state [announced via postgrant information from national office to epo] |
Ref country code: HR Free format text: LAPSE BECAUSE OF FAILURE TO SUBMIT A TRANSLATION OF THE DESCRIPTION OR TO PAY THE FEE WITHIN THE PRESCRIBED TIME-LIMIT Effective date: 20250618 |
|
| PG25 | Lapsed in a contracting state [announced via postgrant information from national office to epo] |
Ref country code: RS Free format text: LAPSE BECAUSE OF FAILURE TO SUBMIT A TRANSLATION OF THE DESCRIPTION OR TO PAY THE FEE WITHIN THE PRESCRIBED TIME-LIMIT Effective date: 20250918 |
|
| PG25 | Lapsed in a contracting state [announced via postgrant information from national office to epo] |
Ref country code: LV Free format text: LAPSE BECAUSE OF FAILURE TO SUBMIT A TRANSLATION OF THE DESCRIPTION OR TO PAY THE FEE WITHIN THE PRESCRIBED TIME-LIMIT Effective date: 20250618 |
|
| PG25 | Lapsed in a contracting state [announced via postgrant information from national office to epo] |
Ref country code: PT Free format text: LAPSE BECAUSE OF FAILURE TO SUBMIT A TRANSLATION OF THE DESCRIPTION OR TO PAY THE FEE WITHIN THE PRESCRIBED TIME-LIMIT Effective date: 20251020 |
|
| PG25 | Lapsed in a contracting state [announced via postgrant information from national office to epo] |
Ref country code: IS Free format text: LAPSE BECAUSE OF FAILURE TO SUBMIT A TRANSLATION OF THE DESCRIPTION OR TO PAY THE FEE WITHIN THE PRESCRIBED TIME-LIMIT Effective date: 20251018 |
|
| PG25 | Lapsed in a contracting state [announced via postgrant information from national office to epo] |
Ref country code: SM Free format text: LAPSE BECAUSE OF FAILURE TO SUBMIT A TRANSLATION OF THE DESCRIPTION OR TO PAY THE FEE WITHIN THE PRESCRIBED TIME-LIMIT Effective date: 20250618 |
|
| PG25 | Lapsed in a contracting state [announced via postgrant information from national office to epo] |
Ref country code: CZ Free format text: LAPSE BECAUSE OF FAILURE TO SUBMIT A TRANSLATION OF THE DESCRIPTION OR TO PAY THE FEE WITHIN THE PRESCRIBED TIME-LIMIT Effective date: 20250618 |
|
| PG25 | Lapsed in a contracting state [announced via postgrant information from national office to epo] |
Ref country code: PL Free format text: LAPSE BECAUSE OF FAILURE TO SUBMIT A TRANSLATION OF THE DESCRIPTION OR TO PAY THE FEE WITHIN THE PRESCRIBED TIME-LIMIT Effective date: 20250618 |
|
| PG25 | Lapsed in a contracting state [announced via postgrant information from national office to epo] |
Ref country code: EE Free format text: LAPSE BECAUSE OF FAILURE TO SUBMIT A TRANSLATION OF THE DESCRIPTION OR TO PAY THE FEE WITHIN THE PRESCRIBED TIME-LIMIT Effective date: 20250618 |
|
| PG25 | Lapsed in a contracting state [announced via postgrant information from national office to epo] |
Ref country code: SK Free format text: LAPSE BECAUSE OF FAILURE TO SUBMIT A TRANSLATION OF THE DESCRIPTION OR TO PAY THE FEE WITHIN THE PRESCRIBED TIME-LIMIT Effective date: 20250618 |
|
| PG25 | Lapsed in a contracting state [announced via postgrant information from national office to epo] |
Ref country code: ES Free format text: LAPSE BECAUSE OF FAILURE TO SUBMIT A TRANSLATION OF THE DESCRIPTION OR TO PAY THE FEE WITHIN THE PRESCRIBED TIME-LIMIT Effective date: 20250618 |
|
| PGFP | Annual fee paid to national office [announced via postgrant information from national office to epo] |
Ref country code: NL Payment date: 20260129 Year of fee payment: 8 |
|
| REG | Reference to a national code |
Ref country code: DE Ref legal event code: R097 Ref document number: 502019013483 Country of ref document: DE |
|
| PGFP | Annual fee paid to national office [announced via postgrant information from national office to epo] |
Ref country code: SE Payment date: 20260121 Year of fee payment: 8 |
|
| PGFP | Annual fee paid to national office [announced via postgrant information from national office to epo] |
Ref country code: GB Payment date: 20260219 Year of fee payment: 8 |
|
| PG25 | Lapsed in a contracting state [announced via postgrant information from national office to epo] |
Ref country code: DK Free format text: LAPSE BECAUSE OF FAILURE TO SUBMIT A TRANSLATION OF THE DESCRIPTION OR TO PAY THE FEE WITHIN THE PRESCRIBED TIME-LIMIT Effective date: 20250618 |
|
| PGFP | Annual fee paid to national office [announced via postgrant information from national office to epo] |
Ref country code: IE Payment date: 20260130 Year of fee payment: 8 Ref country code: DE Payment date: 20260120 Year of fee payment: 8 |
|
| PG25 | Lapsed in a contracting state [announced via postgrant information from national office to epo] |
Ref country code: IT Free format text: LAPSE BECAUSE OF FAILURE TO SUBMIT A TRANSLATION OF THE DESCRIPTION OR TO PAY THE FEE WITHIN THE PRESCRIBED TIME-LIMIT Effective date: 20250618 |
|
| PGFP | Annual fee paid to national office [announced via postgrant information from national office to epo] |
Ref country code: FR Payment date: 20260129 Year of fee payment: 8 |
|
| PLBE | No opposition filed within time limit |
Free format text: ORIGINAL CODE: 0009261 |
|
| STAA | Information on the status of an ep patent application or granted ep patent |
Free format text: STATUS: NO OPPOSITION FILED WITHIN TIME LIMIT |
|
| REG | Reference to a national code |
Ref country code: CH Ref legal event code: L10 Free format text: ST27 STATUS EVENT CODE: U-0-0-L10-L00 (AS PROVIDED BY THE NATIONAL OFFICE) Effective date: 20260430 |
|
| 26N | No opposition filed |
Effective date: 20260319 |
|
| PG25 | Lapsed in a contracting state [announced via postgrant information from national office to epo] |
Ref country code: LT Free format text: LAPSE BECAUSE OF FAILURE TO SUBMIT A TRANSLATION OF THE DESCRIPTION OR TO PAY THE FEE WITHIN THE PRESCRIBED TIME-LIMIT Effective date: 20250618 |