EP3904859B1 - System und verfahren zur bestimmung eines blutplättchenvolumens einer blutprobe, computerprogramm und computerlesbares medium - Google Patents
System und verfahren zur bestimmung eines blutplättchenvolumens einer blutprobe, computerprogramm und computerlesbares medium Download PDFInfo
- Publication number
- EP3904859B1 EP3904859B1 EP21179105.8A EP21179105A EP3904859B1 EP 3904859 B1 EP3904859 B1 EP 3904859B1 EP 21179105 A EP21179105 A EP 21179105A EP 3904859 B1 EP3904859 B1 EP 3904859B1
- Authority
- EP
- European Patent Office
- Prior art keywords
- platelet
- cell
- sample
- volume
- illumination
- Prior art date
- Legal status (The legal status is an assumption and is not a legal conclusion. Google has not performed a legal analysis and makes no representation as to the accuracy of the status listed.)
- Active
Links
- 238000000034 method Methods 0.000 title claims description 105
- 210000004369 blood Anatomy 0.000 title claims description 52
- 239000008280 blood Substances 0.000 title claims description 52
- 238000004590 computer program Methods 0.000 title claims description 12
- 230000003287 optical effect Effects 0.000 claims description 103
- 238000005286 illumination Methods 0.000 claims description 87
- 239000000203 mixture Substances 0.000 claims description 21
- 238000002360 preparation method Methods 0.000 claims description 14
- 238000004159 blood analysis Methods 0.000 claims description 3
- 210000004027 cell Anatomy 0.000 description 332
- 239000000523 sample Substances 0.000 description 199
- 210000003743 erythrocyte Anatomy 0.000 description 80
- 210000001772 blood platelet Anatomy 0.000 description 77
- 239000000470 constituent Substances 0.000 description 70
- 108010054147 Hemoglobins Proteins 0.000 description 59
- 102000001554 Hemoglobins Human genes 0.000 description 59
- 238000005259 measurement Methods 0.000 description 51
- 238000004458 analytical method Methods 0.000 description 41
- 230000001413 cellular effect Effects 0.000 description 34
- 230000000875 corresponding effect Effects 0.000 description 26
- 239000000758 substrate Substances 0.000 description 26
- 230000008569 process Effects 0.000 description 25
- 230000003595 spectral effect Effects 0.000 description 20
- 238000003860 storage Methods 0.000 description 19
- 238000010521 absorption reaction Methods 0.000 description 17
- 230000015654 memory Effects 0.000 description 16
- 238000010586 diagram Methods 0.000 description 14
- 210000000265 leukocyte Anatomy 0.000 description 14
- 238000012549 training Methods 0.000 description 13
- 238000012937 correction Methods 0.000 description 11
- 239000010410 layer Substances 0.000 description 10
- 239000012472 biological sample Substances 0.000 description 9
- 238000004364 calculation method Methods 0.000 description 9
- 230000003628 erosive effect Effects 0.000 description 9
- 238000012545 processing Methods 0.000 description 9
- 238000009826 distribution Methods 0.000 description 8
- YQGOJNYOYNNSMM-UHFFFAOYSA-N eosin Chemical compound [Na+].OC(=O)C1=CC=CC=C1C1=C2C=C(Br)C(=O)C(Br)=C2OC2=C(Br)C(O)=C(Br)C=C21 YQGOJNYOYNNSMM-UHFFFAOYSA-N 0.000 description 8
- 230000006870 function Effects 0.000 description 8
- 239000000243 solution Substances 0.000 description 8
- 238000001228 spectrum Methods 0.000 description 8
- 239000003086 colorant Substances 0.000 description 7
- 210000000805 cytoplasm Anatomy 0.000 description 7
- 238000003384 imaging method Methods 0.000 description 7
- 238000003908 quality control method Methods 0.000 description 7
- 238000002835 absorbance Methods 0.000 description 6
- 210000000601 blood cell Anatomy 0.000 description 6
- 210000004940 nucleus Anatomy 0.000 description 5
- 238000012546 transfer Methods 0.000 description 5
- 238000000151 deposition Methods 0.000 description 4
- 230000000694 effects Effects 0.000 description 4
- 238000000684 flow cytometry Methods 0.000 description 4
- 239000012530 fluid Substances 0.000 description 4
- 238000012417 linear regression Methods 0.000 description 4
- 239000000463 material Substances 0.000 description 4
- 230000009897 systematic effect Effects 0.000 description 4
- 239000006096 absorbing agent Substances 0.000 description 3
- 208000007502 anemia Diseases 0.000 description 3
- 230000005540 biological transmission Effects 0.000 description 3
- 238000004891 communication Methods 0.000 description 3
- 230000008021 deposition Effects 0.000 description 3
- 238000001035 drying Methods 0.000 description 3
- 238000001914 filtration Methods 0.000 description 3
- 238000007689 inspection Methods 0.000 description 3
- 238000002372 labelling Methods 0.000 description 3
- 230000003278 mimic effect Effects 0.000 description 3
- 230000036961 partial effect Effects 0.000 description 3
- 238000010186 staining Methods 0.000 description 3
- RBTBFTRPCNLSDE-UHFFFAOYSA-N 3,7-bis(dimethylamino)phenothiazin-5-ium Chemical compound C1=CC(N(C)C)=CC2=[S+]C3=CC(N(C)C)=CC=C3N=C21 RBTBFTRPCNLSDE-UHFFFAOYSA-N 0.000 description 2
- 241001465754 Metazoa Species 0.000 description 2
- 206010033546 Pallor Diseases 0.000 description 2
- 238000000862 absorption spectrum Methods 0.000 description 2
- 238000013459 approach Methods 0.000 description 2
- 238000004820 blood count Methods 0.000 description 2
- 239000007853 buffer solution Substances 0.000 description 2
- 239000011248 coating agent Substances 0.000 description 2
- 238000000576 coating method Methods 0.000 description 2
- 230000002596 correlated effect Effects 0.000 description 2
- 230000001419 dependent effect Effects 0.000 description 2
- 230000010339 dilation Effects 0.000 description 2
- 239000000428 dust Substances 0.000 description 2
- 239000000834 fixative Substances 0.000 description 2
- 239000011521 glass Substances 0.000 description 2
- 238000005534 hematocrit Methods 0.000 description 2
- 108010036302 hemoglobin AS Proteins 0.000 description 2
- 230000001788 irregular Effects 0.000 description 2
- 239000004973 liquid crystal related substance Substances 0.000 description 2
- 230000002934 lysing effect Effects 0.000 description 2
- 229960000907 methylthioninium chloride Drugs 0.000 description 2
- 238000012986 modification Methods 0.000 description 2
- 230000004048 modification Effects 0.000 description 2
- 230000000877 morphologic effect Effects 0.000 description 2
- 102000004169 proteins and genes Human genes 0.000 description 2
- 108090000623 proteins and genes Proteins 0.000 description 2
- 230000002829 reductive effect Effects 0.000 description 2
- 230000011218 segmentation Effects 0.000 description 2
- 210000001519 tissue Anatomy 0.000 description 2
- 230000007723 transport mechanism Effects 0.000 description 2
- 206010002536 Anisocytosis Diseases 0.000 description 1
- 101100117236 Drosophila melanogaster speck gene Proteins 0.000 description 1
- 108010068308 Hemoglobin H Proteins 0.000 description 1
- 206010028980 Neoplasm Diseases 0.000 description 1
- 241001510071 Pyrrhocoridae Species 0.000 description 1
- 239000011358 absorbing material Substances 0.000 description 1
- 230000009471 action Effects 0.000 description 1
- 230000004075 alteration Effects 0.000 description 1
- 239000012491 analyte Substances 0.000 description 1
- PGWTYMLATMNCCZ-UHFFFAOYSA-M azure A Chemical compound [Cl-].C1=CC(N)=CC2=[S+]C3=CC(N(C)C)=CC=C3N=C21 PGWTYMLATMNCCZ-UHFFFAOYSA-M 0.000 description 1
- KFZNPGQYVZZSNV-UHFFFAOYSA-M azure B Chemical compound [Cl-].C1=CC(N(C)C)=CC2=[S+]C3=CC(NC)=CC=C3N=C21 KFZNPGQYVZZSNV-UHFFFAOYSA-M 0.000 description 1
- IRERQBUNZFJFGC-UHFFFAOYSA-L azure blue Chemical compound [Na+].[Na+].[Na+].[Na+].[Na+].[Na+].[Na+].[Na+].[Al+3].[Al+3].[Al+3].[Al+3].[Al+3].[Al+3].[S-]S[S-].[O-][Si]([O-])([O-])[O-].[O-][Si]([O-])([O-])[O-].[O-][Si]([O-])([O-])[O-].[O-][Si]([O-])([O-])[O-].[O-][Si]([O-])([O-])[O-].[O-][Si]([O-])([O-])[O-] IRERQBUNZFJFGC-UHFFFAOYSA-L 0.000 description 1
- 239000013060 biological fluid Substances 0.000 description 1
- 210000001124 body fluid Anatomy 0.000 description 1
- 239000010839 body fluid Substances 0.000 description 1
- 210000001185 bone marrow Anatomy 0.000 description 1
- 210000000170 cell membrane Anatomy 0.000 description 1
- 230000008859 change Effects 0.000 description 1
- 239000002178 crystalline material Substances 0.000 description 1
- 238000013500 data storage Methods 0.000 description 1
- 238000001514 detection method Methods 0.000 description 1
- 201000010099 disease Diseases 0.000 description 1
- 208000037265 diseases, disorders, signs and symptoms Diseases 0.000 description 1
- 238000000295 emission spectrum Methods 0.000 description 1
- SEACYXSIPDVVMV-UHFFFAOYSA-L eosin Y Chemical compound [Na+].[Na+].[O-]C(=O)C1=CC=CC=C1C1=C2C=C(Br)C(=O)C(Br)=C2OC2=C(Br)C([O-])=C(Br)C=C21 SEACYXSIPDVVMV-UHFFFAOYSA-L 0.000 description 1
- 210000000981 epithelium Anatomy 0.000 description 1
- 230000005284 excitation Effects 0.000 description 1
- 238000009472 formulation Methods 0.000 description 1
- 230000003116 impacting effect Effects 0.000 description 1
- 238000007373 indentation Methods 0.000 description 1
- 230000003993 interaction Effects 0.000 description 1
- 230000002452 interceptive effect Effects 0.000 description 1
- 230000000670 limiting effect Effects 0.000 description 1
- 238000013507 mapping Methods 0.000 description 1
- 239000003550 marker Substances 0.000 description 1
- 238000000691 measurement method Methods 0.000 description 1
- 239000012528 membrane Substances 0.000 description 1
- 238000012544 monitoring process Methods 0.000 description 1
- 238000009828 non-uniform distribution Methods 0.000 description 1
- 238000000424 optical density measurement Methods 0.000 description 1
- 238000004445 quantitative analysis Methods 0.000 description 1
- 239000013074 reference sample Substances 0.000 description 1
- 238000000611 regression analysis Methods 0.000 description 1
- 238000012552 review Methods 0.000 description 1
- 239000012487 rinsing solution Substances 0.000 description 1
- 210000000582 semen Anatomy 0.000 description 1
- 239000004065 semiconductor Substances 0.000 description 1
- 239000002356 single layer Substances 0.000 description 1
- -1 stains Substances 0.000 description 1
- 239000000126 substance Substances 0.000 description 1
- 230000009885 systemic effect Effects 0.000 description 1
- 238000012360 testing method Methods 0.000 description 1
- 230000001225 therapeutic effect Effects 0.000 description 1
- 210000002700 urine Anatomy 0.000 description 1
- 239000002699 waste material Substances 0.000 description 1
Images


Classifications
-
- G—PHYSICS
- G01—MEASURING; TESTING
- G01N—INVESTIGATING OR ANALYSING MATERIALS BY DETERMINING THEIR CHEMICAL OR PHYSICAL PROPERTIES
- G01N15/00—Investigating characteristics of particles; Investigating permeability, pore-volume, or surface-area of porous materials
- G01N15/02—Investigating particle size or size distribution
- G01N15/0205—Investigating particle size or size distribution by optical means, e.g. by light scattering, diffraction, holography or imaging
- G01N15/0227—Investigating particle size or size distribution by optical means, e.g. by light scattering, diffraction, holography or imaging using imaging, e.g. a projected image of suspension; using holography
-
- G01N15/1433—
-
- G—PHYSICS
- G01—MEASURING; TESTING
- G01N—INVESTIGATING OR ANALYSING MATERIALS BY DETERMINING THEIR CHEMICAL OR PHYSICAL PROPERTIES
- G01N33/00—Investigating or analysing materials by specific methods not covered by groups G01N1/00 - G01N31/00
- G01N33/48—Biological material, e.g. blood, urine; Haemocytometers
- G01N33/483—Physical analysis of biological material
- G01N33/487—Physical analysis of biological material of liquid biological material
- G01N33/49—Blood
-
- G—PHYSICS
- G06—COMPUTING; CALCULATING OR COUNTING
- G06T—IMAGE DATA PROCESSING OR GENERATION, IN GENERAL
- G06T7/00—Image analysis
- G06T7/60—Analysis of geometric attributes
- G06T7/62—Analysis of geometric attributes of area, perimeter, diameter or volume
-
- G—PHYSICS
- G06—COMPUTING; CALCULATING OR COUNTING
- G06V—IMAGE OR VIDEO RECOGNITION OR UNDERSTANDING
- G06V20/00—Scenes; Scene-specific elements
- G06V20/60—Type of objects
- G06V20/69—Microscopic objects, e.g. biological cells or cellular parts
-
- G—PHYSICS
- G06—COMPUTING; CALCULATING OR COUNTING
- G06V—IMAGE OR VIDEO RECOGNITION OR UNDERSTANDING
- G06V20/00—Scenes; Scene-specific elements
- G06V20/60—Type of objects
- G06V20/69—Microscopic objects, e.g. biological cells or cellular parts
- G06V20/695—Preprocessing, e.g. image segmentation
-
- G01N2015/012—
-
- G01N2015/018—
-
- G—PHYSICS
- G01—MEASURING; TESTING
- G01N—INVESTIGATING OR ANALYSING MATERIALS BY DETERMINING THEIR CHEMICAL OR PHYSICAL PROPERTIES
- G01N15/00—Investigating characteristics of particles; Investigating permeability, pore-volume, or surface-area of porous materials
- G01N15/10—Investigating individual particles
- G01N15/14—Electro-optical investigation, e.g. flow cytometers
- G01N15/1468—Electro-optical investigation, e.g. flow cytometers with spatial resolution of the texture or inner structure of the particle
- G01N2015/1472—Electro-optical investigation, e.g. flow cytometers with spatial resolution of the texture or inner structure of the particle with colour
-
- G—PHYSICS
- G06—COMPUTING; CALCULATING OR COUNTING
- G06T—IMAGE DATA PROCESSING OR GENERATION, IN GENERAL
- G06T2207/00—Indexing scheme for image analysis or image enhancement
- G06T2207/10—Image acquisition modality
- G06T2207/10056—Microscopic image
-
- G—PHYSICS
- G06—COMPUTING; CALCULATING OR COUNTING
- G06T—IMAGE DATA PROCESSING OR GENERATION, IN GENERAL
- G06T2207/00—Indexing scheme for image analysis or image enhancement
- G06T2207/30—Subject of image; Context of image processing
- G06T2207/30004—Biomedical image processing
- G06T2207/30024—Cell structures in vitro; Tissue sections in vitro
Definitions
- This disclosure relates to measurement of the volume of platelets.
- the volume of blood cells is an important metric that can be used to determine other physiologically and therapeutically relevant quantities.
- the mean cell volume measurement of a patient's red blood cells can be used to assess whether the patient suffers from anemia.
- Measurement of blood cell constituents is another important metric that can be used for a variety of diagnostic purposes.
- the mean cell hemoglobin content of a patient's red blood cells also can be used to assess whether a patient suffers from anemia.
- Such relevant quantities of cell volumes and constituents such as hemoglobin can then be used for a variety of diagnostic purposes, including identifying disease conditions present in a patient, and evaluating possible therapeutic courses of action.
- US 2009/0238438 A1 discusses a method for the determination of the red blood cell indices including the volume, and haemoglobin content and concentration for individual red blood cells, as well as red blood cell population statistics, including total number of red blood cells present in the sample, and mean values for each of the aforementioned indices within a substantially undiluted blood sample.
- US 6,235,536 B1 discusses a method for measuring components of a complete blood count in a substantially undiluted quiescent sample of anticoagulated whole blood.
- US 2003/030783 A1 concerns a flow cytometry-based hematology system.
- Independent method claim 1 to which the user should now refer, defines a method of determining a volume of a platelet.
- Independent claim 9 defines an associated system.
- Dependent embodiments are defined in the dependent claims.
- Embodiments of the methods, systems, and devices can also include any of the other features and steps disclosed herein, as appropriate.
- Disclosed herein are methods and systems for automated measurement of the volumes of individual cells and the concentrations of cellular constituents in cells of prepared biological samples.
- the methods and systems can be used on samples that are manually prepared by a trained human operator.
- the methods and systems can be used to analyze samples prepared in an automated system. In this way, the methods and systems disclosed herein permit high-throughput, fully-automated analysis of a variety of biological samples extracted from patients.
- the present disclosure describes measuring the volumes and determining the hemoglobin content of individual red blood cells in a blood sample taken from a human patient.
- the methods and systems disclosed herein can be used to measure, in an automated fashion, volumes of a variety of different types of cells including platelets.
- other cellular constituents such as proteins other than hemoglobin can be measured using the methods and systems disclosed herein.
- the samples to be analyzed need not be from human patients; the methods and systems disclosed herein can also be used on samples from animals, or on compositions designed to mimic whole blood to control, calibrate, and verify the linearity of results obtained from an automated hematology system.
- the measurement system acquires one or more two-dimensional images of the cells in the sample, and uses the images to determine, among other quantities, the volumes and hemoglobin content of cells within the sample.
- the volumes and hemoglobin content of cells are determined from information derived from images of the cells obtained by directing incident light on the cells, and then detecting the portion of the incident light that is either transmitted through, or reflected from, the cells.
- Each image is a two-dimensional image, where an individual pixel intensity value within the image corresponds to the amount of transmitted or reflected light emerging from a spatial location on the cell that corresponds to the pixel.
- the volume of any cell is a three-dimensional quantity. Determining the cell volume based on information derived from a two-dimensional image of the cell is one of the challenges that is addressed herein. Obtaining a measurement of the cell volume from a two-dimensional image involves estimating the shape of the cell in the direction transverse to the two-dimensional plane of the image from information derived from the image. If all cells were the same shape, determining the volume would be relatively straightforward: the volume of any such cell would be proportional to the cross-sectional area of the cell (which can be obtained from a two-dimensional image) raised to the 3/2 power. Cells are not uniformly shaped, however, so the above assumption is not reliable in all instances or sufficiently accurate for diagnostic purposes.
- red blood cells typically exhibit a variety of shapes: some are approximately spherical, while others have a shape that is closer to toroidal.
- red blood cells have a central indentation of variable depth. Images of such cells depict edge regions where the intensity of transmitted light is relatively smaller, and a central region of increased light transmission referred to as the "central pallor.”
- FIG. 1A is a schematic diagram showing a red blood cell 10 positioned on a substrate 20. The thickness of cell 10 along the x-direction varies; the thickness is largest near the edges of the cell and reduced in the center region 15 of the cell.
- FIG. 1A is a schematic diagram showing a red blood cell 10 positioned on a substrate 20. The thickness of cell 10 along the x-direction varies; the thickness is largest near the edges of the cell and reduced in the center region 15 of the cell.
- FIG. 1A is a schematic diagram showing a red blood cell 10 positioned on a substrate 20. The thickness of cell 10 along the x-direction varies; the thickness is
- FIG. 1B is a schematic plot of transmitted light intensity as a function of position along the x-direction for a particular cross-sectional position through the transmitted light distribution from cell 10.
- the intensity distribution shown in FIG. 1B includes a local intensity maximum 25 within the central pallor of the cell, and local intensity minima 27 and 28 of lower light transmission that corresponds to the edges of the cell. Even unstained red blood cells will exhibit the phenomenon shown in FIG. 1B because these cells contain hemoglobin, which absorbs blue light.
- Cell 10 is typically prepared (as part of a sample) by applying one or more stains to the cell to obtain the intensity distribution shown in FIG. 1B .
- the stain binds to the cell's cytoplasm, and serves as a marker for the cytoplasm in cell images.
- the stain absorbs a portion of the incident light; the amount of absorption at a particular location in the sample depends on the amount of stain present at that location. If it is assumed that the applied stain binds in a uniform manner to all cytoplasm, then the transmitted light intensity at a given image pixel should be proportional to the thickness of the cytoplasm at a corresponding location within the cell.
- a quantity proportional to a cell volume could be obtained by summing contributions to the transmitted light intensity from all pixels within an image that correspond to the particular cell.
- prepared samples of blood cells exhibit some variability in the extent that applied stains uniformly bind to all cytoplasm.
- the amount of transmitted light at each pixel location also depends on amounts of various sample constituents - such as hemoglobin in red blood cells - present at each location in a cell. Further, the distribution of stain from one spatial location to the next also affects the amount of measured transmitted light at each pixel location for a given cell or blood constituent.
- the methods and systems disclosed herein are adapted to determine cell volume based on information derived from two-dimensional cell images by decoupling the estimate of cell thickness from the absorptive effects of locally-varying concentrations of cellular constituents (e.g., hemoglobin) and various applied stains.
- pixel intensities are scaled according to the maximum pixel intensity for each cell.
- cell volume calculations are based on a weighted combination of optical density values for each color of illumination used to acquire cell images, and cell area. The processes described herein can be repeated for each member of a set of cells selected for volume measurement, and the results for each cell can be used to calculate a mean cell volume for the sample.
- Concentrations of cellular constituents such as hemoglobin content of red blood cells, also can be determined from calculations based on optical density values for each color of illumination used to acquire cell images, as will be described further below, and the following disclosure also encompasses methods and systems for automated measurement of one or more constituents of cells from prepared biological samples.
- the present disclosure focuses on the measurement of hemoglobin in red blood cells in a blood sample taken from a human patient.
- the methods and systems disclosed herein can be used to measure, in automated fashion, a variety of different constituents in a variety of different types of cells.
- cell samples need not be taken from human patients; the methods and systems disclosed herein can also be used on samples taken from animals, or on compositions manufactured to mimic whole blood, which are typically used to verify the performance of an automated measurement system.
- Conventional automated measurement systems such as flow cytometers, typically determine cellular hemoglobin content by lysing red blood cells and measuring the absorbance of the lysed sample in solution, or by measuring light scattered from individual red blood cells in a flow stream.
- the methods and systems disclosed herein can be implemented without lysing of any component of the blood sample or a flow cell. Rather, cellular constituents such as hemoglobin can be measured from two-dimensional images of a sample deposited on a microscope slide, which preserves the natural morphology of the cells for other measurements and classification.
- the sample preparation process for utilizing the automated methods and systems described herein typically involves applying multiple stains to the sample.
- the applied stains bind differently to different chemical and/or structural entities within the sample, permitting selective analysis of different sample features (e.g., certain stains bind preferentially to blood cell nuclei, while others bind to cell membranes, and still others may bind preferentially to certain constituents within the cytoplasm).
- the applied stains enable automated systems to perform several measurements on the sample such as identifying and counting red blood cells, white blood cells, and platelets, and performing a five-part white blood cell differential. With multiple stains present in the samples, however, spectroscopic measurements performed on the samples can conceivably suffer from interfering effects produced by the various stains.
- multiple stains may be significant absorbers of incident light.
- the methods and systems disclosed herein account for the presence of multiple spectral contributors (e.g., absorbing stains and/or cellular constituents) within a sample, and determine amounts of one or more contributors present in the cells based on information measured at multiple wavelengths.
- the amount of hemoglobin in red blood cells is a quantity of interest, as the cellular hemoglobin content can be used to calculate a variety of blood-related quantities for a sample (e.g., mean cell hemoglobin concentration, hematocrit) that are used by physicians for diagnostic purposes.
- Hemoglobin absorbs incident light more strongly within certain regions of the electromagnetic spectrum than in others, and therefore has a characteristic spectral signature.
- the stain(s) also have characteristic spectral signatures and absorb incident light more strongly at certain wavelengths than others.
- both an analyte of interest such as hemoglobin and one or more applied stains may have non-negligible absorption at particular wavelengths.
- the amount of incident light transmitted through the sample at a particular wavelength is related to the amount of absorption by hemoglobin, by the other stains applied to the sample, and by the other sample constituents.
- the methods and systems disclosed herein are not limited to application of only two stains or solely to eosin and azure.
- the methods and systems are capable of performing measurements on samples to which fewer stains (e.g., one stain, or no stains) or more stains (e.g., a red stain comprising eosin and a blue stain comprising azure and methylene blue, three or more stains, four or more stains, five or more stains) have been applied.
- FIG. 2 shows a schematic diagram of a system 100 (which can be part of a larger sample processing and analysis system) for performing automated measurements of cell volumes and constituents of cells from a biological sample.
- System 100 includes an illumination source 102, a detector 106, and an electronic control system 108.
- Electronic control system 108 can include a display 110, a human interface unit 112, and an electronic processor 114.
- Electronic control system 108 is connected to illumination source 102 and to detector 106 via control lines 120 and 122, respectively.
- the prepared sample 104 (e.g., a blood sample deposited on a microscope slide and subsequently fixed, stained, and rinsed) is positioned automatically in proximity to source 102.
- Source 102 directs incident light 116 toward sample 104. A portion of the incident light passes through sample 104 as transmitted light 118 and is detected by detector 106. Transmitted light 118 forms an image of sample 104 on the active surface of detector 106; the detector captures the image, and then transmits the image information to electronic control system 108.
- electronic control system 108 directs source 102 to produce incident light 116, and also directs detector 106 to detect the image of sample 104. Control system 108 can instruct source 102 to use different illumination wavelengths when detector 106 acquires images of sample 104 from transmitted light 118.
- the process discussed above can be repeated on multiple images of sample 104 if desired.
- electronic control system 108 can change the wavelength of incident light 116 produced by source 102.
- the images of sample 104 each correspond to different wavelengths of incident light 116 and therefore, different wavelengths of transmitted light 118.
- the process repeats until at least enough information has been acquired to perform an accurate determination of the volume of cells in the sample or the amount of one or more constituents in the sample.
- the amount of information that yields an accurate determination of the volume of cells in the sample or the amount of one or more constituents in the sample is determined during a calibration process.
- the calibration process can be used to determine (as further described below) that accurate determination of the volume of cells in the sample and/or the amount of one or more constituents in the sample can be achieved when the number of sample images obtained is equal to or greater than the number of spectral contributors (e.g., absorbers) factored into the analysis of the sample.
- spectral contributors e.g., absorbers
- system 100 can continue to acquire sample images until it has obtained images at a minimum of three different wavelengths. Additional images - corresponding to further different wavelengths - can also be obtained and used in the determination of cellular constituents and cell volumes for the sample.
- Illumination source 102 can include one source or a plurality of the same or different sources for directing incident light to a sample.
- source 102 can include multiple light emitting elements such as diodes (LEDs), laser diodes, fluorescent lamps, incandescent lamps, and/or flashlamps.
- LEDs diodes
- source 102 can include four LEDs having output wavelengths in the red, yellow, green, and blue regions of the electromagnetic spectrum, respectively (e.g., 635, 598, 525, and 415 nm), or more generally, about 620 to 750 nm (red), about 575 to 600 nm (yellow), about 525 to 570 nm (green), and about 400 to 475 nm (blue).
- source 102 can include one or more laser sources. Instead of having multiple light emitters, in other embodiments, source 102 can include a single broadband emitter than can be configured to alter its output wavelength (e.g., under the control of electronic control system 108).
- source 102 can include a broadband source (e.g., an incandescent lamp) coupled to a configurable filter system (e.g., a plurality of mechanically adjustable filters, and/or a liquid-crystal-based electronically-adjustable filter) that produces a variable output spectrum under the control of system 108.
- a broadband source e.g., an incandescent lamp
- a configurable filter system e.g., a plurality of mechanically adjustable filters, and/or a liquid-crystal-based electronically-adjustable filter
- source 102 does not output illumination light 116 at a single wavelength, but in a band of wavelengths centered around a central wavelength (e.g., the wavelength of maximum intensity in the band).
- a central wavelength e.g., the wavelength of maximum intensity in the band.
- Detector 106 can include a variety of different types of detectors.
- detector 106 includes a charge-coupled device (CCD).
- CCD charge-coupled device
- detector 106 can include photodiodes (e.g., a two-dimensional photodiode array).
- detector 106 can include other light-sensitive elements such as CMOS-based sensors and/or photomultipliers.
- Detector 106 can also include one or more filtering elements, as described above in connection with source 102.
- sample images corresponding to different wavelengths are obtained by illuminating sample 104 with illumination light 116 having a relatively broad distribution of wavelengths, and then filtering transmitted light 118 to select only a portion of the transmitted light corresponding to a small band of the wavelengths. Filtering can be performed on either or both the excitation side (e.g., in source 102) and the detection side (e.g., in detector 106) to ensure that images obtained using detector 106 each correspond to a specific distribution of light wavelengths with a particular central wavelength.
- the excitation side e.g., in source 102
- the detection side e.g., in detector 106
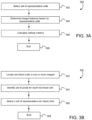
- FIG. 3A shows a flowchart 300 that includes various steps for determining these quantities.
- a set of representative cells are selected.
- the images of the cells in the representative set are the ones that are used for subsequent determination of cellular quantities for the sample.
- various image features are determined based on the images of the cells in the representative set.
- image features can include intensity values that are measured directly by a detector, and other values that are calculated from image data.
- step 306 cellular metrics such as cell volume and the amount of cellular constituents (e.g., hemoglobin) are calculated based on the image features determined in step 304.
- the process terminates at step 308.
- cellular metrics such as cell volume and the amount of cellular constituents (e.g., hemoglobin) are calculated based on the image features determined in step 304.
- the process terminates at step 308.
- the systems and methods disclosed herein identify a set of representative cells for further analysis from a plurality of cells in a prepared biological sample. For example and as further described below for blood samples, such systems and methods use optical density measurements obtained from sample images to identify a representative set of red blood cells suitable for volume and constituent analysis. This process typically involves differentiating and excluding other cells types such as white blood cells and platelets, overlapped or misshapen red blood cells, and non-cellular artifacts and debris from further analysis.
- intensity values for each pixel in a sample image can be correlated to an optical density value used in the selection of a representative set of cells and subsequent cell volume and constituent analysis.
- the ratio of the pixel intensity to the maximum possible pixel intensity represents the fraction of light transmitted at the spatial location of the pixel.
- FIG. 3B shows a flowchart 320 that includes a series of steps for selecting a set of representative red blood cells in a prepared sample of blood.
- electronic control system 108 and, in particular electronic processor 114 processes the image information to differentiate cells for inclusion in the set of representative red blood cells from the other cell types, cell clusters, and artifacts present in the sample.
- system 100 locates red blood cells in one or more sample images for further processing.
- Red blood cells typically absorb blue light (e.g., 415 nm) due to the presence of hemoglobin in the cells.
- White blood cells do not contain hemoglobin and therefore do not absorb blue light in the same manner as red blood cells.
- An image of the sample acquired under blue light can be used to identify red blood cells; white blood cells in such images appear faintly and distorted because these cells minimally absorb blue light, thereby reducing contributions to the image and typically making them unidentifiable.
- a thresholding step can be used to ensure that system 100 identifies only red blood cells for further analysis.
- system 100 can utilize only image pixels below an intensity (or gray) value of 160 (for images captured at 8-bit resolution).
- intensity value thresholds ranging from 100 to 180 can be used to identify red blood cells from the image, while excluding white blood cells from further analysis.
- system 100 identifies a set of pixels for each red blood cell in the sample image.
- a variety of different methods can be used to identify sets of pixels associated with the cells.
- system 100 performs the identification step using a connected components labeling process. This process correlates individual pixels from the sample image to an object in the image. For example, any two pixels in the image not separated by a pixel assigned to the background are assigned to the same cell.
- system 100 can exclude pixels positioned within a border region of a cell from certain measurements relating to the cell volume and constituent analysis.
- red blood cells often have thick, dark borders due to the manner in which these cells refract illumination light, for example, as shown in FIG. 9 .
- Optical densities for these pixels are typically unreliable due to this refraction.
- system 100 can apply a pixel erosion mask to the identified cells to remove the outermost n layers of pixels (e.g., the pixel(s) that correspond to the boundary region where refraction is greatest).
- the pixel erosion mask can be selected to remove any number n of pixel layers (e.g., one pixel layer or more, two pixel layers or more, three pixel layers or more, four pixel layers or more, five pixel layers or more, six pixel layers or more, eight pixel layers or more, ten pixel layers or more) depending on the magnification of the image. It has been determined experimentally that a pixel erosion mask comprising the outermost 0.5 ⁇ m for the red cell perimeter is generally suitable for significantly reducing erroneous contributions to the measurement of cell volume and hemoglobin content for red blood cells where each pixel corresponds to a portion of the cell that is 0.148 ⁇ m x 0.148 ⁇ m. Utilizing the sets of pixels corrected by erosion masks, various cell features can be measured, such as a mean and maximum optical density for each cell, which contribute to the cell volume and constituent analysis.
- step 326 system 100 continues the process of identifying a set of representative red blood cells from the sample image(s) by confirming that the set contains only complete and normally shaped and sized red blood cells.
- step 326 functions to discard partial cells, overlapping cells, cell clusters, platelets, and non-cellular artifacts from inclusion in the set of representative red blood cells. For example, cells that are either cut off by, or touching, the edge of the image frame can be excluded from further analysis, thereby preventing inaccurate measurements.
- misshapen cells - which can exhibit variations in the determined cell volume that are related to their non-standard shapes - can be excluded from the analysis.
- FIG. 4 shows a schematic diagram of such a comparison.
- a cell 400 has been identified as a set of pixels in a sample image.
- the pixels corresponding to the boundary of cell 400 are shaded lighter in FIG. 4 than the interior pixels for purposes of demonstration - they do not necessarily appear this way in the actual image.
- the area of cell 400 can be determined by counting the number of pixels in the set.
- the cell perimeter is determined from the boundary pixels using the set of pixels corresponding to cell 400. This can be accomplished by connecting a line through the center of each perimeter pixel to create a polygon in the image and measuring the perimeter of the polygon.
- the ratio of this cell perimeter value squared to the cell area value (i.e., the area of the polygon) is determined to check the shape of the cell.
- the value of this ratio is 4 ⁇ for an ideal, perfectly circular cell.
- the value of the ratio increases as the cell shape departs from a circular outline.
- cells with a ratio of the perimeter squared to the area, which exceeds the minimum value of 4 ⁇ by a threshold amount or more are excluded from further analysis.
- the threshold amount is a percentage of the minimum value of 4 ⁇ (e.g., 5% or more, 10% or more, 15% or more, 20% or more, 25% or more).
- overlapping cells In addition to excluding misshapen individual cells from further analysis, the procedure discussed above can also exclude overlapping cells.
- overlapping cells typically appear as large, misshapen individual cells (with variations in transmitted light intensity due to the increased thickness of material through which the incident light propagates).
- Overlapping cells are generally identified as large single cells with irregular boundaries when analysis algorithms are applied to such images. As such, when the comparison of the cell perimeter and area is performed, the ratio falls well beyond the threshold for allowable variance from the ideal value, and the overlapping cells are excluded.
- FIG. 5 is a schematic diagram that includes two cells 500A and 500B. The perimeters of cells 500A and 500B are marked as 502A and 502B, respectively, in FIG. 5 .
- a convex hull 504A is drawn around cell 500A
- a convex hull 504B is drawn around cell 500B.
- the discrepancy between the convex hull area and the cell area is greater for cell 500A than for cell 500B.
- cell 500A can be excluded from the set of representative red blood cells.
- cell area measurements can be used in step 326 to exclude artifacts and overlapping cells from the set of representative blood cells. For example, only cells with an area ranging from 35 square microns to 65 square microns can be considered for red blood cell volume measurements. Imaged objects with an area less than 35 square microns are typically not red blood cells, but artifacts, such as a speck of dust in the sample. Similarly, imaged objects with an area greater than 65 square microns are typically not red blood cells; such object might correspond to a blob of stain or to several overlapping cells.
- ranges can be used to select red blood cells for measurement (e.g., 20 square microns to 80 square microns), and the range can be scaled based on the average cell size in the sample, thereby accounting for patient-to-patient variability. It has been determined experimentally that while the 35-to-65 square micron range can exclude some red blood cells, such range is more effective at removing artifacts from the sample image as compared to the 20-to-80 square micron range.
- Optical density values can be used to select the set of representative red blood cells in the sample. For example, if the mean optical density value of an object imaged under blue light is too low, the object may be a white blood cell nucleus instead of a red blood cell.
- a mean optical density threshold can be used (e.g., mean optical density less than or equal to 0.33) for images acquired using blue light to exclude white blood cells from the set of representative red blood cells for the sample (e.g., a cell with a mean optical density less than or equal to 0.33 is likely to be a white blood cell).
- a mean optical density value for an object exceeding a certain threshold can be used to identify stacked, overlapping, and/or clustered red blood cells, which can be excluded from further analysis (e.g., a red blood cell with a mean optical density greater than or equal to 0.66 is likely to be overlapping another red blood cell).
- step 328 The process shown in FIG. 3B terminates at step 328 with the final determination of a set of representative cells for further analysis.
- the systems and methods disclosed herein use combinations of image features to calculate cellular volume and constituent values.
- the combinations typically include (but are not limited to) linear combinations of such image features that the inventors have discovered yield accurate, reproducible results for a wide variety of samples.
- IOD(c) the color-specific integrated optical density
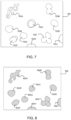
- FIG. 6 shows a schematic image, obtained with illumination light of color c, of a representative cell 600 identified through the process described in connection with flowchart 320.
- the image of cell 600 includes a plurality of pixels.
- the mean optical density of pixels in cell 600, OD mean (c) corresponds to the sum of the pixel intensities in FIG. 6 divided by the number of pixels in the image.
- a second set of features that can be calculated for each cell in the representative set is the color-specific volume of the cell, Vol(c).
- the volume of cell 600 in FIG. 6 is calculated by summing optical density values for each of the pixels that correspond to cell 600.
- pixel 620 in the image of cell 600 has an optical density that is smaller than the maximum optical density associated with pixel 610.
- the contribution of pixel 620 to the volume of cell 600 is the ratio OD 620 / OD max , where OD 620 is the optical density of pixel 620 and OD max is the optical density of pixel 610.
- the optical density for pixels near the edge of a cell is not a valid contributor to the volume measurement because light refracted at the edge of the cell creates an artificially dark border around the cell.
- the system can erode the mask at the cell periphery by one or more pixels as previously described, measure the mean optical density and the maximum optical density of the masked region of the cell, and, thereafter, extrapolate to the edge of the cell by multiplying by the area of the full, non-eroded mask.
- the calculated color-specific cell volume Vol(c) can be scaled to express the cell volume in appropriate units (e.g., femtoliters).
- Equation (6) it is useful to add one or more correction factors to Equation (6) to adjust for the fact that some of the darkness of a cell image may not truly be due to the hemoglobin content of the cell.
- a scaling factor can be applied to convert the volume measurement to a unit of measurement such as femtoliters (fL).
- fL femtoliters
- the correction factor, scaling factor, and intercept value can be determined experimentally using a data set of known volume values for multiple blood samples processed on, for example, a calibrated flow cytometer.
- a slightly different set of correction factors will, in general, provide the best result for each different sample, although correction factors can be determined based on the results across an entire data set. For example, for a data set containing known volume values for 1,000 blood samples, a correction factor that works best on average across the entire data set can be determined by selecting the correction factor that minimizes the sum of squared differences between measured and expected volume values across the entire data set.
- a scaling factor can be determined across the entire data set by selecting the scaling factor that best converts raw volume values to a desirable measurement unit such as femtoliters.
- the intercept value B can be selected for the data set to ensure that Equation (7) passes through the origin when the data are presented on a two-dimensional plot.
- the correction factor, scaling factor, and intercept value can be stored in a memory unit associated with electronic control system 108, and retrieved from memory when determining color-specific cell volumes as shown in Equation (7) for analysis of new samples.
- two features e.g., integrated optical density IOD(c) and volume Vol(c)
- IOD(c) and volume Vol(c) two features
- a total of eight different features can be determined for each cell in the representative set.
- the area A of each individual cell can be determined from an image of the cell. The color-specific integrated optical densities and cell volumes, and the cellular area, can then be used to calculate metrics for each cell.
- Amounts of cellular constituents can be determined in similar fashion.
- Equations (9) and (10) above is in the values of the weight coefficients and the offset K.
- cell volumes and constituent amounts can be determined for multiple cells in the sample.
- the results can be averaged to determine mean cell volume and mean concentrations of constituents (e.g., mean cell hemoglobin) for the sample.
- the determination of cell volumes and the amount of cellular constituents based on weighted combinations of color-specific image features and cell area has been observed to significantly improve the accuracy of such measurements, as compared to volume and constituent measurements based on single-color optical density values and cell area.
- the weight coefficients associated with the color-specific features in Equation (8) can be determined based on available training data, for example, by determining linear regression coefficients that map the experimentally determined sample features onto training data comprising known volume and/or constituent concentration values for such samples. Using a linear regression approach to determine color-specific weights can improve the accuracy of sample mean cell volume and mean constituent concentration measurements by correcting for uncontrollable factors that impact the volume measurement such as cell-to-cell variability in membrane thickness and stain absorption. After color-specific weight values have been determined from training data, the weight values can be stored and later retrieved from a storage unit (e.g., an electronic memory unit) prior to analysis of each sample.
- a storage unit e.g., an electronic memory unit
- samples to determine appropriate weight coefficients can be used to determine appropriate weight coefficients.
- training data that span the entire range of values of quantities that are calculated.
- samples to be analyzed include unusual morphological features such as cell clumps, it can be advantageous to use training data that include representative samples of such features.
- the systems and methods disclosed herein can be used to analyze both whole blood samples (e.g., samples taken from patients) and quality control compositions.
- the weight coefficients shown in Equations (9)-(12) can be used to analyze both whole blood samples and quality control compositions.
- Quality control compositions typically include various types of preserved mammalian blood cells, and are designed to mimic whole blood samples when processed on an automated hematology system.
- Quality control compositions can be analyzed to assess the operating condition of a blood analysis device such as an automated hematology system that embodies and executes the methods disclosed herein.
- a blood analysis device such as an automated hematology system that embodies and executes the methods disclosed herein.
- the device can be used to analyze one or more control compositions multiple times.
- the analysis results e.g., the determination of quantities such as cell hemoglobin, cell volume, mean cell hemoglobin, and mean cell volume
- the analysis results e.g., the determination of quantities such as cell hemoglobin, cell volume, mean cell hemoglobin, and mean cell volume
- a device can be used to analyze control compositions to assess the accuracy of the results produced by the device. For example, results from analysis of control compositions by the device (e.g., the determination of quantities such as cell hemoglobin, cell volume, mean cell hemoglobin, and mean cell volume) can be compared to reference values of these quantities for the control compositions to assess the device's accuracy. If a difference between the determined and reference values for one or more of these quantities exceeds a threshold value, the device can be re-calibrated. Re-calibration can include, for example, redetermining values of some or all of the weight coefficients in Equations (9)-(12) from reference blood samples, as described herein.
- Equations (9)-(12) four colors of illumination light (red, yellow, green, and blue) are used to illuminate the sample, and integrated optical densities and cell volumes are calculated from images that correspond to each of these colors.
- the illumination wavelengths used to calculate the color-specific integrated optical density values and volumes can be, e.g., 635nm, 598nm, 525nm, and 415nm, although other values within the red, yellow, green, and blue regions of the electromagnetic spectrum can be used in other embodiments. More generally, different numbers of illumination wavelengths can be used, and images corresponding to each of the illumination wavelengths can be obtained and used to calculate color-specific values of integrated optical density and/or cell volume. For example, in some embodiments, three different wavelengths of light are used to illuminate a sample.
- wavelengths of illumination light can be used, and color-specific integrated optical densities, cell volumes, and weight coefficients can be determined at some or all of the illumination wavelengths.
- the wavelengths of illumination light can be selected such that each images at each of the different wavelengths include different information about the sample. For example, if the sample includes three spectral contributors, three wavelengths of illumination light can be selected for use such that each of the three wavelengths is most strongly absorbed by a different one of the spectral contributors.
- color-specific weight coefficients in Equation (8) can be determined by mapping linear regression coefficients for experimentally determined features for a large number (e.g., 1,000) of blood samples onto a training data set comprising known values of cell volume and/or concentrations of various cellular constituents for such samples, obtained for example from a calibrated flow cytometry system.
- sample preparation parameters e.g., modifications to stain compositions affecting the appearance of stained cells or other factors impacting how cells absorb stain such as the extent of sample drying before fixing and staining
- the process of determining color-specific weights and an intercept value for Equation 8 can be repeated to ensure determination of accurate volume and cell constituent measurement values for a given set of sample preparation parameters.
- the experimentally derived weight coefficients and other parameter values in Equation (8) will generate accurate and reproducible measurements of cell volume and/or cell constituent amounts.
- metric M is calculated as a weighted linear combination of the color-specific integrated optical densities, the color-specific volumes, and the cell area. Not all of these features are used to determine values of metrics in all embodiments, however.
- a metric M can be calculated as a weighted combination of only the color-specific integrated optical densities or the color-specific volumes.
- a metric M can be calculated as a weighted combination of the cell area and either the color-specific integrated optical densities or the color-specific volumes.
- a metric M can be calculated as a weighted linear combination of the color-specific integrated optical densities and the color-specific volumes.
- a suitable combination of features used to calculate a particular metric M can be determined using reference samples for which values of the metric M are known.
- the amount of a particular constituent in sample cells if only a single spectral contributor is present in the sample (e.g., an absorptive contributor such as hemoglobin), than the total amount of that contributor present in a particular cell can be determined by summing intensity contributions from each of the pixels in the image that correspond to the selected cell. As the intensity contributions correspond only to absorption by hemoglobin, only one sample image would be needed to determine the total amount of hemoglobin present in the cell.
- an absorptive contributor such as hemoglobin
- samples are typically prepared with one or more stains to assist a technologist or an automated imaging system to identify, count and classify various cell types.
- the absorption at each illumination wavelength is a combination of absorption due to each contributor in the sample; the total contribution at any wavelength for a particular cell still corresponds to the sum of contributions at that wavelength from each of the pixels representing the cell.
- Each of the central wavelengths of light can be determined by passing a known spectrum of light through the sample to the detector and measuring the absorbance of the sample.
- the detector can acquire three images of the sample using an illumination source with narrow illumination spectra in the yellow, green, and blue regions, respectively.
- illumination sources can be selected such that the emission spectra correspond to or best approximate the spectral contributor local maxima.
- the blue illumination can be selected as the wavelength that corresponds to the peak absorbance of hemoglobin in the sample (e.g., 415 nm).
- the yellow illumination can be correlated to the wavelength that corresponds to the peak absorbance of azure stain in the sample (e.g., 598 nm).
- the green illumination wavelength can be selected at the wavelength that corresponds to the peak absorbance of eosin stain in the sample (e.g., 525 nm). Additional illumination wavelengths can be selected to correlate with peak absorbance values for additional spectral contributors in the sample.
- the optical density quantities OD(y), OD(g), and OD(b) can be determined from the image information, and the absorption coefficients ⁇ i,j can be obtained from literature sources or determined experimentally.
- the system of Equation (13) includes three unknowns - H, E, and A - and can be solved to yield the amounts of each of these three spectral contributors present in each particular cell, or collectively for all cells in the sample if the pixels selected for analysis collectively correspond to all of the identified cells in the images.
- Equation (8) with suitable weight coefficients - can be used to determine constituent amounts of only those constituents of interest, increasing the speed with which sample analysis can be completed. Further, in complex samples where the number of spectral contributors is not well known, it can be difficult to construct a system of equations such as in Equation (13). Equation (8), however, permits amounts of specific cellular constituents to be determined even if the presence of other spectral contributors in the cell is not well established.
- the spectral contributions from hemoglobin, eosin, and azure in the system of Equation (13) can be distinguished by obtaining images at three different illumination wavelengths, using more than three features and/or more than three illumination wavelengths as described herein to determine values of cell metrics such as cell hemoglobin, cell volume, mean cell hemoglobin, and mean cell volume permits correction for other systematic and non-systematic sources of error when measuring blood samples.
- Equation (8) can include an extra term that corresponds to the product of a cell's perimeter and a weigh coefficient.
- An appropriate weighting factor can be determined for the cell perimeter term from training data, as described above.
- additional terms derived from cell images, with suitable weight coefficients determined from training data can be included in Equation (8).
- Such terms can include geometrical image features relating to the morphology of the cells and/or color-specific measurements of integrated optical density and volume at more than three or four illumination wavelengths.
- the additional terms may allow the fitting - which is performed simultaneously on reference sample information to determine values of all weighting factors - to correct for effects such as imaging aberrations, absorption from other sample components, and systemic measurement errors, that are not fully accounted for by the model of Equation (8).
- the inclusion of integrated optical density and cell volume terms corresponding to a red illumination wavelength and a term corresponding to cell area improves the accuracy of determination of cell hemoglobin in many samples as compared to measurement techniques that do not use sample images acquired at a red illumination wavelength or cell area measurements.
- the methods and systems disclosed herein can be used to determine amounts of naturally present constituents in samples (e.g., hemoglobin in red blood cells) and/or amounts of constituents that have been added to samples (e.g., stains that have been applied, and that bind to cellular components). Further, in some embodiments, the methods and systems disclosed herein can be used to determine the amounts of more than one constituent present in the sample. For example, by applying suitable stains and/or selecting appropriate central wavelengths for the sample images, amounts of two or more constituents can be determined. Consider a sample that includes hemoglobin as a naturally-occurring absorbing constituent.
- the sample can be stained with two broadly absorptive stains S(1) and S(2), and with a third stain S(3) with a relatively narrow absorption band.
- S(3) selectively binds to a particular constituent of interest in cells such that measuring the amount of S(3) present yields a measurement of the constituent.
- the amount of cellular hemoglobin can be determined according to the methods disclosed herein for measuring cell constituent amounts from images of the sample corresponding to illumination wavelengths ⁇ 1 , ⁇ 2 , and ⁇ 3 , and the amount of S(3) can be determined according to the same methods from images of the sample corresponding to illumination wavelengths ⁇ 2 , ⁇ 3 , and ⁇ 4 .
- These approaches can be generalized further to larger numbers of constituents of interest, and larger or smaller numbers of broadly absorptive spectral contributors such as S(1) and S(2).
- the determined cell volumes, constituent amounts, mean cell volume, and mean constituent concentrations can be displayed to a system operator using, e.g., display 110.
- the results can be displayed on a per cell basis, or as averaged results for the whole sample.
- calculated numerical results e.g., for individual cells
- a system operator can exercise control over the manner in which results are displayed using human interface unit 112 (e.g., a keyboard and/or mouse and/or any other input device).
- the system operator can also exercise control over any of the other parameters, conditions, and options associated with the methods disclosed herein through interface unit 112 and display 110.
- One or more metrics can also be calculated from the mean cell volume and/or mean cell hemoglobin measurements, and displayed in step 210.
- red blood cell distribution width can be calculated and displayed for a human operator.
- the red cell distribution width can be used to calculate and display the possibility of anisocytosis and/or anemia.
- mean cell hemoglobin measurements can be used with a hematocrit value for the sample to calculate mean cell hemoglobin concentration.
- Cell volume and constituent concentration measurements and/or metrics calculated therefrom can be stored along with sample images in an electronic storage unit associated with control system 108.
- this information can be stored in an electronic record associated with the patient to whom sample 104 corresponds.
- the information can be transmitted to one or more physicians or other treatment personnel.
- the information can be transmitted via a network (e.g., a computer network) to a computing device.
- the information can be transmitted to a handheld device such as a mobile phone, and the transmission can include an alert or warning if the metrics fall outside a predetermined range of values.
- Equation (8) can be used to determine values of cellular metrics for a variety of different types of cells.
- the systems and methods disclosed herein can use a linear combination of color-specific optical density and volume measurements - with suitably determined weight coefficients - to compute a platelet volume for platelets within a given blood sample. Measurements of platelet volume within a sample can be averaged to yield a measurement of mean platelet volume.
- images of the blood sample are acquired using multiple wavelengths of light. The sample images are then analyzed according to the steps in flow chart 300 to yield measurements of platelet volumes.
- the first step in flow chart 300 is the selection of a set of representative platelets in step 302.
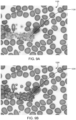
- An example of a prepared blood sample containing platelets is illustrated in FIGs. 9A and 9B.
- FIG. 9A shows an image 1100 of a specimen of blood that includes a large cluster or clump of platelets 1120.
- additional image processing may be required to identify the individual platelets within a clump or cluster for possible inclusion in the set of representative platelets.
- FIG. 9B An example of such processing is illustrated in FIG. 9B .
- Objects in the image are segmented to identify individual platelets within the cluster. As shown in the segmented cluster 1220 of FIG. 9B , the individual platelets are identified by borders.
- the segmentation process can proceed in three stages. In a first stage, central regions of the individual platelets are identified in each image. Platelet central regions are shown as the nearly-circular regions in FIG. 9B . The platelet central regions appear as the darkest regions of the platelets.
- pixels in the image that may be part of a platelet are identified. Pixels can be determined as being part of a platelet based on one or more threshold conditions on the value of a given pixel. In some embodiments, if the intensity value of a pixel is greater than 120 in an image acquired at a blue illumination wavelength (e.g., 415 nm), and the intensity value is also at least 30 levels higher than an intensity value of the same pixel in an image acquired at a green illumination wavelength (e.g., 525 nm), the pixel is identified as being part of a platelet.
- a blue illumination wavelength e.g., 415 nm
- a green illumination wavelength e.g., 525 nm
- each of the pixels identified in the second stage as being part of a platelet is assigned to a platelet corresponding to the platelet center that is nearest to the pixel. If the distance between a particular pixel and its nearest platelet center exceeds a threshold value, the pixel is not assigned to any platelet.
- This stage results in assignment of a set of pixels corresponding to each of the identified platelets. Sets of pixels corresponding individual platelets are depicted in FIG. 9B as irregularly encircling platelet central regions.
- the boundaries between platelets can be subjected to morphological operations such as dilation. Dilation can be halted, for example, when platelet boundaries do not overlap. However, erosion of the pixel mask (e.g., the subset of pixels) corresponding to each platelet is typically not performed as described above in connection with red blood cells. Platelet boundaries are typically thinner and less refractive than those of red blood cells. As a result, platelet boundaries do not appear dark in images, in contrast to the appearance of red blood cells, and typically erosion of the pixel masks corresponding to individual platelets is not performed. With platelet boundaries identified and pixels assigned to a given platelet, the area of each platelet within the representative set can be calculated.
- segmentation algorithms can be used to segment a cluster of platelets into individual platelets. Examples of such algorithms are described in U.S. Patents 7,689,038 and 7,881,532 .
- Applying integrated optical density thresholds can further refine the set of representative platelets. For example, platelets with an integrated optical density value greater than 600 when illuminated with light at a yellow illumination wavelength can be excluded from the representative platelet set; such objects are typically bigger than a platelet and are often red blood cells. In addition, platelets with an integrated optical density value greater than 200 when illuminated with light at a blue illumination wavelength can be excluded from the representative platelet set; set; such objects arc typically too dark to be a platelet and often indicate dust or other debris in the sample.
- a classifier such as a linear discriminant classifier is applied to identify platelets that have settled on top of red blood cells within the sample.
- the classifier utilizes a combination of multiple platelet candidate features (e.g., five or more, ten or more, fifteen or more, etc.) relating to the shape, texture, and color of platelet candidates to identify and exclude overlapped platelets from the set of representative platelets
- step 304 color-specific optical density and volume values for the set of representative platelets are determined according to Equations (3) and (6) or (7).
- step 306. platelet metrics such as platelet volume arc calculated using the features determined in step 304 according to Equation (8).
- the weights associated with the features can be determined based on training data, for example, by determining linear regression coefficients that map the features onto training data comprising known platelet volume values for multiple blood samples (e.g., as reported by a calibrated flow cytometry system)
- the systems and methods disclosed herein can be used to analyze both whole blood samples (e.g., samples taken from patients) and quality control compositions.
- the weight coefficients shown in Equation (9) and (14) can be used to analyze both whole blood samples and quality control compositions.
- Quality control compositions can be analyzed to assess the operating condition of a blood analysis device such as an automated hematology system that embodies and executes the methods disclosed herein. For example, to perform an assessment of a device, the device can be used to analyze one or more control compositions multiple times.
- the analysis results (e.g., the determination of quantities such as platelet volume and mean platelet volume) from repeated analysis of the same control compositions can be compared to assess the linearity and/or accuracy of the results produced by the device, and can be used to determine whether re-calibration of the device is warranted.
- Platelet volumes can be determined for all platelets within one or more sets of representative platelets to calculate a mean platelet volume (MPV) value for the sample. While other illumination wavelengths in the electromagnetic spectrum are useful for calculating platelet volumes, the inventors have found that including color-specific features for platelets imaged with a red illumination wavelength in Equation (8) did not significantly increase the accuracy of calculating platelet volumes or sample MPV values.
- MPV mean platelet volume
- the systems and methods disclosed herein can also be used to determine other cellular metrics for platelets.
- the systems and methods can be used to determine amounts of constituents in platelets using Equation (8) with weight coefficients determined from reference samples, as described above.
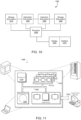
- FIG. 10 shows a schematic diagram of an embodiment of an automated sample preparation system 1000.
- System 1000 includes multiple sub-systems for storing substrates, depositing samples on substrates, inspecting samples prepared on substrates, and storing prepared samples.
- Substrate storage sub-system 1010 is configured to store substrates prior to the deposition of samples thereon.
- Substrates can include, for example, microscope slides, coverslips, and similar planar, optically transparent substrates.
- the substrates can be formed from a variety of different amorphous or crystalline materials including various types of glasses.
- Sub-system 1010 can include a manipulator that selects individual substrates from a storage container and transfers the selected substrates to sample deposition sub-system 1020.
- Sample deposition sub-system 1020 deposits a selected quantity of a sample of interest - such as a blood sample - onto a substrate.
- Sub-system 1020 includes, in general, a variety of fluid transfer components (e.g., pumps, fluid tubes, valves) configured to deposit the sample.
- the fluid transfer components can also be configured to expose the substrate to solutions of various types, including wash solutions, one or more stains that bind to the sample, fixing solutions, and buffer solutions.
- Sub-system 1020 can also feature fluid removal components (e.g., a vacuum sub-system) and a drying apparatus to ensure that the sample is fixed to the substrate.
- a substrate manipulator can transfer the substrate supporting the sample to imaging sub-system 1030.
- Inspection sub-system 1030 includes various components for obtaining images of samples on substrates, and for analyzing the images to determine information about the samples.
- inspection sub-system 1030 can include one or more light sources (e.g., light emitting diodes, laser diodes, and/or lasers) for directing incident light to a sample.
- Imaging sub-system 1030 can also include an optical apparatus (e.g., a microscope objective) for capturing transmitted and/or reflected light from a sample.
- a detector e.g., a CCD detector coupled to the optical apparatus can be configured to capture images of the sample.
- Information derived from analysis of the images of the sample can be stored on a variety of optical and/or electronic storage media for later retrieval and/or further analysis.
- a substrate manipulator can transfer the substrate to storage sub-system 1040.
- Storage sub-system 1040 can label individual substrates, for example, with information relating to the source of the sample applied to the substrate, the time of analysis, and/or any irregularities identified during analysis.
- Storage sub-system can also store processed substrates in multi-substrate racks, which can be removed from system 1000 as they are filled with substrates.
- each of the various sub-systems of system 1000 can be linked to a common electronic processor 1050.
- Processor 1050 can be configured to control the operation of each of the sub-systems of system 1000 in automated fashion, with relatively little (or no) input from a system operator.
- Results from the analysis of samples can be displayed on system display 1060 for a supervising operator.
- Interface 1070 permits the operator to issue commands to system 1000 and to manually review the automated analysis results.
- the method steps and procedures described herein can be implemented in hardware or in software, or in a combination of both.
- electronic processor 114 can include software and/or hardware instructions to perform any of the methods discussed above.
- the methods can be implemented in computer programs using standard programming techniques following the method steps and figures disclosed herein.
- Program code is applied to input data to perform the functions described herein.
- the output information is applied to one or more output devices such as a printer, or a display device, or a web page on a computer monitor with access to a website, e.g., for remote monitoring.
- Each program is preferably implemented in a high level procedural or object oriented programming language to communicate with a processor.
- the programs can be implemented in assembly or machine language, if desired. In any case, the language can be a compiled or interpreted language.
- Each computer program can be stored on a storage medium or device (e.g., an electronic memory) readable by the processor. for configuring and operating the processor to perform the procedures described herein.
- FIG. 11 is a schematic diagram of a computer system 1300 that can be used to control the operations described in association with any of the computer-implemented methods described herein, according to one embodiment.
- the system 1300 includes a processor 1310, a memory 1320, a storage device 1330, and an input/output device 1340. Each of the components 1310, 1320, 1330, and 1340 are interconnected using a system bus 1350.
- the processor 1310 is capable of processing instructions for execution within the system 1300. In one embodiment, the processor 1310 is a single-threaded processor. In another embodiment, the processor 1310 is a multi-threaded processor.
- the processor 1310 is capable of processing instructions stored in the memory 1320 or on the storage device 1330 to display graphical information for a user interface on the input/output device 1340.
- the processor 1310 can be substantially similar to the processor 1050 described above with reference to FIG. 10 .
- the memory 1320 stores information within the system 1300.
- the memory 1320 is a computer-readable medium.
- the memory 1320 can include volatile memory and/or non-volatile memory.
- the storage device 1330 is capable of providing mass storage for the system 1300.
- the storage device 1330 can include any non-transitory tangible media configured to store computer readable instructions.
- the storage device 1330 is a computer-readable medium.
- the storage device 1330 may be a floppy disk device, a hard disk device, an optical disk device, or a tape device.
- the input/output device 1340 provides input/output operations for the system 1300.
- the input/output device 1340 includes a keyboard and/or pointing device.
- the input/output device 1340 includes a display unit for displaying graphical user interfaces.
- the input/output device 1340 includes one or more of the display 1060 and interface 1070 described above with reference to FIG. 10 .
- the features described can be implemented in digital electronic circuitry, or in computer hardware, firmware, or in combinations of them.
- the features can be implemented in a computer program product tangibly embodied in an information carrier, e.g., in a machine-readable storage device, for execution by a programmable processor, and features can be performed by a programmable processor executing a program of instructions to perform functions of the described embodiments by operating on input data and generating output.
- the described features can be implemented in one or more computer programs that are executable on a programmable system including at least one programmable processor coupled to receive data and instructions from, and to transmit data and instructions to, a data storage system, at least one input device, and at least one output device.
- a computer program includes a set of instructions that can be used, directly or indirectly, in a computer to perform a certain activity or bring about a certain result.
- a computer program can be written in any form of programming language, including compiled or interpreted languages, and it can be deployed in any form, including as a stand-alone program or as a module, component, subroutine, or other unit suitable for use in a computing environment.
- a publish/subscribe messaging pattern can be used in implementing the methods and systems described herein.
- the system includes several hardware and software modules that communicate only via a messaging module. Each module can be configured to perform a specific function.
- the system can include one or more of a hardware module, a camera module, and a focus module.
- the hardware module can send commands to the imaging hardware implementing auto-focus functions, which in turn triggers a camera to acquire images.
- the hardware module can include the control system 108 described above with reference to FIG. 2 .
- a camera module can receive images from the camera and determine camera parameters such as shutter time or focus. Images can also be buffered in the computer's memory before being processed by the camera module. When performing the initial search for the tilt of the slide, the camera module can also send a message interrupting the hardware module when it has seen enough images to determine the proper shutter time or focus.
- the camera module includes the detector 106 described above with reference to FIG. 2 .
- the system can also include a focus module that can be implemented as software, hardware or a combination of software and hardware.
- the focus module examines all the frames in a stack and estimates how far the stack is from the ideal or ideal focal distance.
- the focus module can also be responsible for assigning a focus score to each frame in a stack of images.
- Suitable processors for the execution of a program of instructions include, by way of example, both general and special purpose microprocessors, and the sole processor or one of multiple processors of any kind of computer.
- a processor will receive instructions and data from a read-only memory or a random access memory or both.
- Computers include a processor for executing instructions and one or more memories for storing instructions and data.
- a computer will also include, or be operatively coupled to communicate with, one or more mass storage devices for storing data files; such devices include magnetic disks, such as internal hard disks and removable disks; magneto-optical disks; and optical disks.
- Storage devices suitable for tangibly embodying computer program instructions and data include all forms of non-volatile memory, including by way of example semiconductor memory devices, such as EPROM, EEPROM, and flash memory devices; magnetic disks such as internal hard disks and removable disks; magneto-optical disks; and CD-ROM and DVD-ROM disks.
- semiconductor memory devices such as EPROM, EEPROM, and flash memory devices
- magnetic disks such as internal hard disks and removable disks
- magneto-optical disks and CD-ROM and DVD-ROM disks.
- the processor and the memory can be supplemented by, or incorporated in, ASICs (application-specific integrated circuits).
- ASICs application-specific integrated circuits
- the features can be implemented on a computer having a display device such as a CRT (cathode ray tube) or LCD (liquid crystal display) monitor for displaying information to the user and a keyboard and a pointing device such as a mouse or a trackball by which the user can provide input to the computer.
- a display device such as a CRT (cathode ray tube) or LCD (liquid crystal display) monitor for displaying information to the user and a keyboard and a pointing device such as a mouse or a trackball by which the user can provide input to the computer.
- the computer can have no keyboard, mouse, or monitor attached and can be controlled remotely by another computer
- the features can be implemented in a computer system that includes a back-end component, such as a data server, or that includes a middleware component, such as an application server or an Internet server, or that includes a front-end component, such as a client computer having a graphical user interface or an Internet browser, or any combination of them.
- the components of the system can be connected by any form or medium of digital data communication such as a communication network. Examples of communication networks include, e.g., a LAN, a WAN, and the computers and networks forming the Internet.
- the computer system can include clients and servers.
- a client and server are generally remote from each other and typically interact through a network, such as the described one.
- the relationship of client and server arises by virtue of computer programs running on the respective computers and having a client-server relationship to each other.
- the processor 1310 carries out instructions related to a computer program.
- the processor 1310 can include hardware such as logic gates, adders, multipliers and counters.
- the processor 1310 can further include a separate arithmetic logic unit (ALU) that performs arithmetic and logical operations.
- ALU arithmetic logic unit
- sample 104 can be positioned atop a substrate such as a microscope slide with a reflective coating. The reflective coating can function to direct once-transmitted light back through the sample a second time, so that the measured ⁇ reflected ⁇ light actually corresponds to incident light that has twice been transmitted through the sample.
- cell volumes and constituent contents such as hemoglobin or other proteins can be determined for samples that include cells from body fluids and tissues, including blood, bone marrow, urine, epithelial tissue, tumors, semen, spittle, and other tissues or circulating or non-circulating biological fluids.
- a I ⁇ L sample of blood was deposited on a microscope slide to form a monolayer of red blood cells on the slide.
- the blood sample was deposited using the system disclosed in co-pending U.S. Patent Application Serial No. 12/430,885 .
- the sample was then prepared using fixative, red stain (e.g., comprising eosin Y), blue stain (e.g., comprising azure B and methylene blue), and rinse formulations disclosed in co-pending U.S. Patent Application Serial No. 61/505,0 1 1 in an automated system of the type disclosed in co-pending U.S. Patent Application Serial No. 13/293,050 .
- fixative e.g., comprising eosin Y
- blue stain e.g., comprising azure B and methylene blue
- an automated transport mechanism loaded the slide onto an automated stage at a low magnification (e.g., under a 10x objective lens) imaging station.
- the automated transport mechanism positioned the sample between a light source (e.g., source 106) and a detector (e.g., detector 102).
- a light source e.g., source 106
- a detector e.g., detector 102
- High magnification images of the sample were acquired at locations corresponding to objects of interest.
- the detector was paired with a 50x objective lens and included a 640-by-480 pixel CCD sensor.
- the pixel size for images acquired via the detector was 7.4 ⁇ m; the dimensions of the field of view were:
- FIG. 7 shows a schematic image 700 of a sample, acquired with blue illumination light (e.g., at a wavelength of 415 nm), although more generally, other illumination wavelengths (e.g.. 635, 598, 525 nm) or combinations thereof can be used to acquire images, identify red blood cells, and determine cell volumes and constituent contents.
- Image 700 includes multiple identified objects 702A-J.
- Red blood cells were located within image 700 by applying a threshold condition to image 700. Specifically, only pixels having an intensity gray level of 160 or less (for an image at 8-bit resolution) were processed further, to exclude white blood cells from the red blood cell volume analysis.
- FIG. 8 is a schematic image 800 of the same sample that is shown in FIG. 7 after the threshold condition has been applied to the image. Objects 802A-J are present in image 800.
- a connected components labeling process was then performed to correlate individual pixels in image 800 to objects 802A-J.
- a pixel erosion mask was applied to each of the sets of pixels corresponding to objects 802A-J to remove the pixels representing the outermost 0.5 microns from the perimeter of each object.
- the pixel erosion reduces image artifacts that are due to refraction of light from cell boundaries; these artifacts, if uncompensated, can lead to errors in cell volume determination.
- the roundness of objects 802A-J was also assessed by determining the deviation of the cross-sectional shape of each object from the profile of a perfect circle. As disclosed above, the ratio of the square of the perimeter to the area for a perfect circle is 4 ⁇ .
- the roundness column in Table 1 reflects the square-perimeter-to-area ratio for each object in image 800 divided by 4 ⁇ . A perfectly circular object will have a roundness value of 1, and the roundness value departs from 1 as the shape of the object becomes increasingly non-circular.
- Optical density values were also measured for objects 802A-J.
- the gray level value for each pixel in each object was converted to an optical density value using Equation (2).
- the optical density values were determined for only the image pixels that were within the eroded mask. In turn, these optical density values were used to calculate a mean optical density and a maximum optical density value for each of the objects.
- integrated optical density values were calculated from the cell area and mean optical density values.
- Objects 802A-J in FIG. 8 were each identified as possible red blood cells. Before calculating cell volumes, however, a representative set of red blood cells was selected from the group of objects 802A-J. To select representative red blood cells, the objects were evaluated with regard to their geometric and optical density properties to ensure they had suitable shapes and features corresponding to red blood cells.
- image 800 was scanned to determine whether any of the objects were cut off or otherwise obscured by the edge of the image (e.g., objects only partially contained within the image). Objects 802H and 802J were each cut-off by at the edge of image 800. Accordingly, objects 802H and 802J were excluded from further analysis; the results of this process are shown in Table 1 in the "Partial Cell" column.
- the next step in the identification of the set of representative red blood cells was to determine whether the remaining objects (objects 802A-G and 8021) should be included in the set.
- objects 802A-G and 8021 To eliminate artifacts and/or groups of overlapping cells from the representative set, objects with an area larger than 65 square microns or an area smaller than 35 square microns were excluded from further analysis.
- images 800 objects 802A, 802B, and 8021 each had an area larger than 65 square microns (97, 76, and 103 square microns, respectively, as shown in Table 1). Accordingly, these objects were eliminated from the set of representative red blood cells.
- the shape of object 802A in FIG. 8 suggests this object corresponds to either a highly irregular single cell or to multiple cells.
- Objects 802B and 8021 each appear to correspond to several clustered or overlapping cells.
- optical density values of the remaining objects 802C-G were then analyzed to determine whether these objects should be included in the set of representative red blood cells.
- a mean minimum optical density threshold value of 0.33 was applied to each object to exclude objects that corresponded to white blood cells.
- object 800C had a mean optical density value of 0.29, which suggested that object 802C was not a red blood cell, but perhaps a white blood cell nucleus.
- a comparison of object 802C in image 800 and corresponding object 702C in image 700 suggested that object 802C corresponded to a white blood cell nucleus, and was therefore properly excluded from the representative set by application of the optical density threshold.
- the pixel intensity threshold removed contributions from the cytoplasm that were apparent in object 702C, leaving only the nucleus of the white blood cell visible in object 802C.
- a mean maximum optical density threshold of 0.66 was applied to each of objects 802C-G to ensure that the objects did not correspond to multiple overlapping cells where the degree of overlap was sufficiently high such that the objects could not be rejected on the basis of shape irregularity.
- the optical density value for object 802F exceeded the threshold, and object 802F was therefore excluded from the set of representative red blood cells.
- the representative set of red blood cells was reduced to objects 802D, 802E, and 802G. These representative red blood cells were then used to calculate the mean cell volume for the blood sample.
- the area, OD mean , and OD max values from Table 1 for each of these objects were used in Equation (5) to calculate the volume for each object.
- the results of these volume calculations are shown in the "Volume” column of Table 1. Applying a correction factor of 0.5 to these Volume values expressed the cell volumes in femtoliters as shown in the "Volume (fL)" column in Table 1.
- the individual volumes for each of these cells were then used to calculate a mean cell volume for the sample, which was 11.36 fL.
- the foregoing process can be repeated for a plurality of image locations on the sample (e.g., several hundred or more), yielding a mean cell volume calculation based on hundreds or thousands of representative red blood cells in the sample.
- the process described above can be repeated to calculate color-specific integrated optical density, IOD(c), and color-specific cell volume, Vol (c), values from images acquired at a plurality of illumination wavelengths. For example, using a total of four colors of illumination (635, 598, 525, and 415nm), the color specific integrated optical density and cell volume values can be used with Equation 8 to calculate a mean cell volume for the sample.
- Table 2 illustrates an example implementation of Equation (11) to calculate mean cell hemoglobin values for blood samples based, in part, on a set of known MCH values for such samples.
- Six blood samples were processed using a known reference system, a calibrated automated hematology system using fluorescent flow cytometry methods to calculate the various parameters of a complete blood count including MCH.
- the "Reference MCH” column in Table 2 reports the mean cell hemoglobin value in picograms for each sample processed using this reference system.
- the six samples were then processed and imaged, including the identification of sets of representative red blood cells for each sample, in the same manner as described above.
- the system calculated an integrated optical density value for each color of illumination used to acquire images of the sample (i.e., yellow - 635 nm; green - 598 nm, and blue - 415 nm).
- the integrated optical density values for each sample based on images obtained using the yellow, green, and blue light are reported in the Table 2 columns marked IOD(y), IOD(g), and IOD(b), respectively.
- Preliminary cell hemoglobin values for each sample are reported in the "H" column of Table 2.
- the preliminary cell hemoglobin values for each sample were then scaled to the corresponding mean cell hemoglobin values determined using the reference system.
- This scaling process included performing a regression analysis to correlate the preliminary cell hemoglobin values to the reported reference mean cell hemoglobin values for each sample.
Claims (15)
- Verfahren zum Bestimmen eines Blutplättchenvolumens, wobei das Verfahren umfasst:(a) Beleuchten des Blutplättchens mit einfallendem Licht mit einer Vielzahl von Beleuchtungswellenlängen;(b) Erhalten mindestens eines zweidimensionalen Bilds der Probe entsprechend jeder Beleuchtungswellenlänge; und gekennzeichnet durch:(c) für jede Beleuchtungswellenlänge Bestimmen einer mittleren optischen Dichte und einer maximalen optischen Dichte für das Blutplättchen;(d) Bestimmen einer Fläche des Blutplättchens;(e) für jede Beleuchtungswellenlänge Bestimmen eines Volumens des Blutplättchens basierend auf der Fläche des Blutplättchens und der mittleren optischen Dichte und der maximalen optischen Dichte für das Blutplättchen entsprechend der Beleuchtungswellenlänge;(f) für jede Beleuchtungswellenlänge Bestimmen einer integrierten optischen Dichte für das Blutplättchen basierend auf der Fläche des Blutplättchens und der mittleren optischen Dichte und der maximalen optischen Dichte für das Blutplättchen entsprechend der Beleuchtungswellenlänge; und(g) Bestimmen des Volumens des Blutplättchens basierend auf einer gewichteten Kombination der Fläche des Blutplättchens, der Volumina des Blutplättchens entsprechend jeder der Beleuchtungswellenlängen und der integrierten optischen Dichten für das Blutplättchen entsprechend jeder der Beleuchtungswellenlängen.
- Verfahren nach Anspruch 1, ferner umfassend:Wiederholen der Schritte (a) bis (g) für eine Vielzahl von Blutplättchen aus einer Blutprobe, um die Volumina für jedes von der Vielzahl von Blutplättchen zu bestimmen; undBestimmen eines mittleren Blutplättchenvolumens für die Probe anhand der Volumina für jedes von der Vielzahl von Blutplättchen.
- Verfahren nach Anspruch 1 oder 2, ferner umfassend das Identifizieren einer Gruppe von Pixeln in jedem Bild des Blutplättchens, die dem Blutplättchen entspricht, wobei das Identifizieren der Gruppe von Pixeln umfasst:Identifizieren einer ersten Gruppe von Pixeln, die einer zentralen Region des Blutplättchens entspricht;Identifizieren einer zweiten Gruppe von Pixeln, die einer nicht zentralen Region des Blutplättchens entspricht; undZusammenführen der ersten und der zweiten Gruppe von Pixeln, um die Gruppe von Pixeln zu bilden, die dem Blutplättchen entspricht.
- Verfahren nach Anspruchs 1 bis 3, ferner umfassend das Bestimmen des Volumens des Blutplättchens bei jeder Beleuchtungswellenlänge basierend auf einem Verhältnis der mittleren optischen Dichte zu der maximalen optischen Dichte entsprechend der Beleuchtungswellenlänge.
- Verfahren nach Anspruch 1 bis 4, wobei die Vielzahl von Beleuchtungswellenlängen mindestens drei Beleuchtungswellenlängen umfasst, gegebenenfalls ausgewählt aus mindestens einer Wellenlänge zwischen 575 nm und 600 nm, mindestens einer Wellenlänge zwischen 525 nm und 570 nm und mindestens einer Wellenlänge zwischen 400 nm und 475 nm.
- Verfahren zum Bewerten eines Betriebszustands einer automatisierten Blutanalysevorrichtung, wobei das Verfahren umfasst:Betreiben der Vorrichtung, sodass die Vorrichtung das Verfahren nach Anspruch 2 verwendet, um ein mittleres Blutplättchenvolumen für eine Kontrollzusammensetzung zu bestimmen; undVergleichen eines Referenzwerts des mittleren Blutplättchenvolumens für die Kontrollzusammensetzung mit dem bestimmten Wert des mittleren Blutplättchenvolumens, um den Betriebszustand der Vorrichtung zu bewerten.
- Verfahren nach Anspruch 6, ferner umfassend:Bestimmen einer Differenz zwischen dem bestimmmten und dem Referenzwert des mittleren Blutplättchenvolumens für die Kontrollzusammensetzung; undRekalibrieren der Vorrichtung, wenn die Differenz einen Schwellenwert übersteigt.
- Verfahren nach Anspruch 7, wobei das Rekalibrieren der Vorrichtung das Bestimmen einer Vielzahl von Gewichtskoeffizienten, die verwendet werden, um das Volumen des Blutplättchens basierend auf der Fläche des Blutplättchens zu bestimmen, anhand einer Referenzgruppe von Blutproben umfasst, wobei die Volumina des Blutplättchens jeder der Beleuchtungswellenlängen entsprechen und die integrierten optischen Dichten für das Blutplättchen jeder der Beleuchtungswellenlängen entsprechen.
- System (100) zum Bestimmen eines Volumens eines Blutplättchens, wobei das System umfasst:- eine Beleuchtungsquelle (102), die ausgestaltet ist, um das Blutplättchen mit einfallendem Licht (116) mit einer Vielzahl von Beleuchtungswellenlängen zu beleuchten;- einen Detektor (106), der ausgestaltet ist, um mindestens ein zweidimensionales Bilder des Blutplättchens entsprechend jeder Beleuchtungswellenlänge zu erhalten, und gekennzeichnet durch:- einen elektronischen Prozessor (114), der ausgestaltet ist zum:(a) Bestimmen einer mittleren optischen Dichte und einer maximalen optischen Dichte für das Blutplättchen mit jeder Beleuchtungswellenlänge;(b) Bestimmen einer Fläche des Blutplättchens;(c) für jede Beleuchtungswellenlänge Bestimmen eines Volumens des Blutplättchens basierend auf der Fläche des Blutplättchens und der mittleren optischen Dichte und der maximalen optischen Dichte für das Blutplättchen entsprechend der Beleuchtungswellenlänge;(d) für jede Beleuchtungswellenlänge Bestimmen einer integrierten optischen Dichte für das Blutplättchen basierend auf der Fläche des Blutplättchens und der mittleren optischen Dichte für das Blutplättchen entsprechend der Beleuchtungswellenlänge; und(e) Bestimmen des Volumens des Blutplättchens basierend auf einer gewichteten Kombination der Fläche des Blutplättchens, der Volumina des Blutplättchens entsprechend jeder der Beleuchtungswellenlängen und der integrierten optischen Dichten für das Blutplättchen entsprechend jeder der Beleuchtungswellenlängen.
- System (100) nach Anspruch 9, wobei der elektronische Prozessor ferner ausgestaltet ist zum:Wiederholen der Schritte (a) bis (e) für eine Vielzahl von Blutplättchen aus einer Blutprobe, um die Volumina für jedes von der Vielzahl von Blutplättchen zu bestimmen; undBestimmen eines mittleren Blutplättchenvolumens für die Probe anhand der Volumina für jedes von der Vielzahl von Blutplättchen.
- System (100) nach Anspruch 9 oder 10, wobei der elektronische Prozessor ferner ausgestaltet ist zum Bestimmen des Volumens des Blutplättchens bei jeder Beleuchtungswellenlänge basierend auf einem Verhältnis der mittleren optischen Dichte zu der maximalen optischen Dichte entsprechend der Beleuchtungswellenlänge.
- System (100) nach einem der Ansprüche 9 bis 11, wobei die Vielzahl von Beleuchtungswellenlängen mindestens eine Wellenlänge zwischen 575 nm und 600 nm, mindestens eine Wellenlänge zwischen 525 nm und 570 nm und mindestens eine Wellenlänge zwischen 400 nm und 475 nm umfasst.
- System (100) nach einem der Ansprüche 9 bis 12, ferner umfassend ein automatisiertes Blutprobenherstellungssystem.
- Computerprogramm, umfassend Programmanweisungen, die ausgestaltet sind, um zu bewirken, dass das System zum Bestimmen eines Volumens eines Blutplättchens nach einem der Ansprüche 9 bis 13 die Schritte des Verfahrens nach einem der Ansprüche 1 bis 8 ausführt.
- Computerlesbares Medium, auf dem das Computerprogramm nach Anspruch 14 gespeichert ist.
Applications Claiming Priority (7)
| Application Number | Priority Date | Filing Date | Title |
|---|---|---|---|
| US201161476170P | 2011-04-15 | 2011-04-15 | |
| US201161476179P | 2011-04-15 | 2011-04-15 | |
| US201161510614P | 2011-07-22 | 2011-07-22 | |
| US201161510710P | 2011-07-22 | 2011-07-22 | |
| US201261589672P | 2012-01-23 | 2012-01-23 | |
| PCT/US2012/033636 WO2012142496A1 (en) | 2011-04-15 | 2012-04-13 | Measuring volume and constituents of cells |
| EP12718805.0A EP2697623B1 (de) | 2011-04-15 | 2012-04-13 | System und verfahren zur bestimmung eines mittleren zellvolumens einer blutprobe |
Related Parent Applications (1)
| Application Number | Title | Priority Date | Filing Date |
|---|---|---|---|
| EP12718805.0A Division EP2697623B1 (de) | 2011-04-15 | 2012-04-13 | System und verfahren zur bestimmung eines mittleren zellvolumens einer blutprobe |
Publications (2)
| Publication Number | Publication Date |
|---|---|
| EP3904859A1 EP3904859A1 (de) | 2021-11-03 |
| EP3904859B1 true EP3904859B1 (de) | 2023-08-30 |
Family
ID=46026936
Family Applications (2)
| Application Number | Title | Priority Date | Filing Date |
|---|---|---|---|
| EP12718805.0A Active EP2697623B1 (de) | 2011-04-15 | 2012-04-13 | System und verfahren zur bestimmung eines mittleren zellvolumens einer blutprobe |
| EP21179105.8A Active EP3904859B1 (de) | 2011-04-15 | 2012-04-13 | System und verfahren zur bestimmung eines blutplättchenvolumens einer blutprobe, computerprogramm und computerlesbares medium |
Family Applications Before (1)
| Application Number | Title | Priority Date | Filing Date |
|---|---|---|---|
| EP12718805.0A Active EP2697623B1 (de) | 2011-04-15 | 2012-04-13 | System und verfahren zur bestimmung eines mittleren zellvolumens einer blutprobe |
Country Status (9)
| Country | Link |
|---|---|
| US (7) | US8488111B2 (de) |
| EP (2) | EP2697623B1 (de) |
| JP (3) | JP5997256B2 (de) |
| CN (3) | CN107402178B (de) |
| AU (2) | AU2012242587B2 (de) |
| CA (1) | CA2833258A1 (de) |
| ES (2) | ES2890413T3 (de) |
| HK (1) | HK1198262A1 (de) |
| WO (1) | WO2012142496A1 (de) |
Families Citing this family (82)
| Publication number | Priority date | Publication date | Assignee | Title |
|---|---|---|---|---|
| US9342893B1 (en) * | 2008-04-25 | 2016-05-17 | Stratovan Corporation | Method and apparatus of performing image segmentation |
| US9075225B2 (en) | 2009-10-28 | 2015-07-07 | Alentic Microscience Inc. | Microscopy imaging |
| EP2494400B1 (de) | 2009-10-28 | 2021-12-08 | Alentic Microscience Inc. | Mikroskopische bildgebung |
| US8965076B2 (en) | 2010-01-13 | 2015-02-24 | Illumina, Inc. | Data processing system and methods |
| US9522396B2 (en) | 2010-12-29 | 2016-12-20 | S.D. Sight Diagnostics Ltd. | Apparatus and method for automatic detection of pathogens |
| CA2833258A1 (en) * | 2011-04-15 | 2012-10-18 | Constitution Medical, Inc. | Measuring volume and constituents of cells |
| US8792693B2 (en) | 2011-07-09 | 2014-07-29 | Gauss Surgical | System and method for estimating extracorporeal blood volume in a physical sample |
| US10426356B2 (en) | 2011-07-09 | 2019-10-01 | Gauss Surgical, Inc. | Method for estimating a quantity of a blood component in a fluid receiver and corresponding error |
| US9646375B2 (en) | 2011-07-09 | 2017-05-09 | Gauss Surgical, Inc. | Method for setting a blood transfusion parameter |
| US9870625B2 (en) | 2011-07-09 | 2018-01-16 | Gauss Surgical, Inc. | Method for estimating a quantity of a blood component in a fluid receiver and corresponding error |
| CN106840812B (zh) | 2011-12-29 | 2019-12-17 | 思迪赛特诊断有限公司 | 用于检测生物样品中病原体的方法和系统 |
| EP2797695A1 (de) * | 2011-12-30 | 2014-11-05 | Abbott Point Of Care, Inc. | Verfahren zur schnellen bildgebung von biologischen flüssigkeitsproben |
| WO2013173356A1 (en) | 2012-05-14 | 2013-11-21 | Gauss Surgical | System and methods for managing blood loss of a patient |
| EP2850559B1 (de) | 2012-05-14 | 2021-02-24 | Gauss Surgical, Inc. | System und verfahren zur schätzung einer menge von blutbestandteilen in einem flüssigkeitskanister |
| WO2013176879A1 (en) * | 2012-05-25 | 2013-11-28 | Metavi Labs Inc. | Automated detection, tracking and analysis of cell migration in a 3-d matrix system |
| TW201404878A (zh) * | 2012-07-27 | 2014-02-01 | Hsian-Chang Chen | 自動快速分析生物細胞的裝置和其相關的方法 |
| JP5333635B1 (ja) * | 2012-08-23 | 2013-11-06 | 富士ゼロックス株式会社 | 画像処理装置、プログラム及び画像処理システム |
| US20140119633A1 (en) * | 2012-10-30 | 2014-05-01 | Prodo Laboratories | Systems, processes, methods and machines for transforming image data into sizing and volume measurements for tissue |
| WO2014071399A1 (en) | 2012-11-05 | 2014-05-08 | Gauss Surgical | Method for triggering blood salvage |
| EP2929345A4 (de) * | 2012-12-06 | 2015-11-18 | Abbott Point Of Care Inc | Abbildung biologischer flüssigkeiten mittels einer vorbestimmten verteilung |
| IN2015DN02927A (de) | 2012-12-31 | 2015-09-18 | Beckman Coulter Inc | |
| JP5771635B2 (ja) | 2013-02-01 | 2015-09-02 | 株式会社Screenホールディングス | キャリブレーション方法 |
| US10502666B2 (en) | 2013-02-06 | 2019-12-10 | Alentic Microscience Inc. | Sample processing improvements for quantitative microscopy |
| CA2904401A1 (en) * | 2013-03-11 | 2014-10-09 | Roche Diagnostics Hematology, Inc. | Imaging blood cells |
| SE537088C2 (sv) * | 2013-05-08 | 2015-01-07 | Cellavision Ab | Grafiskt användargränssnitt för analys av röda blodkroppar |
| CN105408745B (zh) * | 2013-05-09 | 2018-10-23 | 艾博特健康公司 | 确定未裂解血液样本中基于血红蛋白的参数的方法和装置 |
| EP2999988A4 (de) | 2013-05-23 | 2017-01-11 | S.D. Sight Diagnostics Ltd. | Verfahren und system zur bildgebung einer zellprobe |
| CN105765440B (zh) | 2013-06-26 | 2020-08-18 | 阿兰蒂克微科学股份有限公司 | 用于显微的样品处理改进装置及方法 |
| IL227276A0 (en) | 2013-07-01 | 2014-03-06 | Parasight Ltd | A method and system for obtaining a monolayer of cells, for use specifically for diagnosis |
| EP3039477B1 (de) | 2013-08-26 | 2021-10-20 | S.D. Sight Diagnostics Ltd. | Digitale mikroskopiesysteme, verfahren und computerprogrammprodukte |
| US9824441B2 (en) | 2014-04-15 | 2017-11-21 | Gauss Surgical, Inc. | Method for estimating a quantity of a blood component in a fluid canister |
| EP3132253B1 (de) | 2014-04-15 | 2019-02-13 | Gauss Surgical, Inc. | Verfahren zur schätzung einer menge eines blutbestandteils in einem flüssigkeitskanister |
| WO2016030897A1 (en) | 2014-08-27 | 2016-03-03 | S.D. Sight Diagnostics Ltd | System and method for calculating focus variation for a digital microscope |
| US9747490B2 (en) * | 2014-11-05 | 2017-08-29 | Vanderbilt University | Cell size imaging |
| US20170328924A1 (en) | 2014-11-26 | 2017-11-16 | Ronald Jones | Automated microscopic cell analysis |
| US11478789B2 (en) | 2014-11-26 | 2022-10-25 | Medica Corporation | Automated microscopic cell analysis |
| US10625259B1 (en) | 2014-11-26 | 2020-04-21 | Medica Corporation | Automated microscopic cell analysis |
| JP6395739B2 (ja) * | 2015-03-10 | 2018-09-26 | 富士フイルム株式会社 | 測定方法及び測定装置 |
| WO2016187071A1 (en) | 2015-05-15 | 2016-11-24 | Gauss Surgical, Inc. | Systems and methods for assessing fluids from a patient |
| US10555675B2 (en) | 2015-05-15 | 2020-02-11 | Gauss Surgical, Inc. | Method for projecting blood loss of a patient during a surgery |
| WO2016187072A1 (en) | 2015-05-15 | 2016-11-24 | Gauss Surgical, Inc. | Methods and systems for characterizing fluids from a patient |
| CA2993629A1 (en) | 2015-08-26 | 2017-03-02 | Kurashiki Boseki Kabushiki Kaisha | Cell measurement method |
| CA2998829A1 (en) | 2015-09-17 | 2017-03-23 | S.D. Sight Diagnostics Ltd | Methods and apparatus for detecting an entity in a bodily sample |
| US10002410B2 (en) * | 2015-09-30 | 2018-06-19 | Konica Minolta Laboratory U.S.A, Inc. | Method and system for enhancement of cell analysis |
| JP6934253B2 (ja) | 2015-12-23 | 2021-09-15 | ガウス サージカル, インコーポレイテッドGauss Surgical, Inc. | 外科織物内の血液構成要素の量の評価方法 |
| JP6968427B2 (ja) | 2015-12-23 | 2021-11-17 | ガウス サージカル, インコーポレイテッドGauss Surgical, Inc. | ある体積の流体における血液成分の量を推定するためのシステム及び方法 |
| WO2017132166A1 (en) * | 2016-01-28 | 2017-08-03 | Siemens Healthcare Diagnostics Inc. | Methods and apparatus adapted to quantify a specimen from multiple lateral views |
| US10746665B2 (en) | 2016-01-28 | 2020-08-18 | Siemens Healthcare Diagnostics Inc. | Methods and apparatus for classifying an artifact in a specimen |
| JP6522535B2 (ja) * | 2016-02-29 | 2019-05-29 | 富士フイルム株式会社 | 細胞観察装置および方法 |
| WO2017152285A1 (en) * | 2016-03-09 | 2017-09-14 | Lab Improvements | Apparatus and method for indicating at least one property related to an object |
| US11733150B2 (en) | 2016-03-30 | 2023-08-22 | S.D. Sight Diagnostics Ltd. | Distinguishing between blood sample components |
| US11307196B2 (en) | 2016-05-11 | 2022-04-19 | S.D. Sight Diagnostics Ltd. | Sample carrier for optical measurements |
| CA3022770A1 (en) | 2016-05-11 | 2017-11-16 | S.D. Sight Diagnostics Ltd | Performing optical measurements on a sample |
| JP2017219479A (ja) | 2016-06-09 | 2017-12-14 | 住友電気工業株式会社 | 微小粒子計測装置及び分析方法 |
| JP6791245B2 (ja) * | 2016-06-23 | 2020-11-25 | コニカミノルタ株式会社 | 画像処理装置、画像処理方法及び画像処理プログラム |
| EP3491381A1 (de) | 2016-07-29 | 2019-06-05 | Streck, Inc. | Suspensionszusammensetzung zur kontrolle einer hämatologischen analyse |
| US10451566B2 (en) * | 2016-09-30 | 2019-10-22 | Intelligent Virus Imaging Inc. | Method for quantification of purity of sub-visible particle samples |
| EP3523628B1 (de) * | 2016-10-06 | 2023-02-22 | Iris International, Inc. | System und verfahren für dynamischen fokus |
| WO2018125812A1 (en) | 2017-01-02 | 2018-07-05 | Gauss Surgical, Inc. | Tracking surgical items with prediction of duplicate imaging of items |
| US11229368B2 (en) | 2017-01-13 | 2022-01-25 | Gauss Surgical, Inc. | Fluid loss estimation based on weight of medical items |
| JP6832165B2 (ja) * | 2017-01-16 | 2021-02-24 | オリンパス株式会社 | 観察システム |
| CN107084984A (zh) * | 2017-04-18 | 2017-08-22 | 湖南大学 | 一种肌纤维细胞参数的图像测量方法 |
| US11189027B2 (en) * | 2017-05-15 | 2021-11-30 | Sigtuple Technologies Private Limited | Method and system for determining area to be scanned in peripheral blood smear for analysis |
| EP3633350A4 (de) | 2017-05-29 | 2020-06-03 | Sumitomo Electric Industries, Ltd. | Beobachtungsbehälter und mikroteilchenmessvorrichtung |
| EP3451253A1 (de) * | 2017-09-01 | 2019-03-06 | F. Hoffmann-La Roche AG | Verfahren zum betrieb eines laborsystems |
| WO2019090126A1 (en) * | 2017-11-03 | 2019-05-09 | Streck, Inc. | Linearity control materials |
| JP7214729B2 (ja) | 2017-11-14 | 2023-01-30 | エス.ディー.サイト ダイアグノスティクス リミテッド | 光学測定用試料収容器 |
| US11047845B1 (en) * | 2017-11-15 | 2021-06-29 | Medica Corporation | Control material and methods for cell analyzers |
| US11551043B2 (en) * | 2018-02-28 | 2023-01-10 | Visiongate, Inc. | Morphometric detection of malignancy associated change |
| WO2019181803A1 (ja) | 2018-03-20 | 2019-09-26 | 住友電気工業株式会社 | 微小粒子計測装置 |
| FR3079617B1 (fr) | 2018-03-29 | 2023-12-22 | Office National Detude Et De Rech Aerospatiales Onera | Methode de detection de cellules presentant au moins une anomalie dans un echantillon cytologique |
| BR112020016080A2 (pt) * | 2018-03-30 | 2020-12-15 | Idexx Laboratories, Inc. | Sistema de diagnóstico médico no ponto de atendimento. |
| GB201806002D0 (en) * | 2018-04-11 | 2018-05-23 | Univ Liverpool | Methods of spectroscopic analysis |
| EP3575848A1 (de) * | 2018-05-30 | 2019-12-04 | Siemens Healthcare Diagnostics Inc. | Analyzer zur dreidimensionalen analyse einer medizinischen probe mittels einer lichtfeldkamera |
| JP7018006B2 (ja) * | 2018-09-27 | 2022-02-09 | 富士フイルム株式会社 | 試料撮影装置 |
| US10746652B1 (en) * | 2019-04-03 | 2020-08-18 | Redeye Inc. | Hemoglobin sensor and detecting method thereof |
| TWI717910B (zh) * | 2019-11-21 | 2021-02-01 | 長庚大學 | 計算細胞體積之方法 |
| WO2021224900A2 (en) * | 2020-05-07 | 2021-11-11 | NewSight Imaging Ltd. | Device and method for spectral analysis of a compound specimen |
| CN112697655B (zh) * | 2020-12-11 | 2023-08-25 | 南京工业大学 | Od检测仪 |
| CN112697654B (zh) * | 2020-12-11 | 2023-08-25 | 南京工业大学 | Od检测仪传感器 |
| CN114778418B (zh) * | 2022-06-17 | 2022-09-27 | 深圳安侣医学科技有限公司 | 基于显微放大数字图像的血红蛋白分析方法及系统 |
| CN114813522B (zh) * | 2022-06-29 | 2022-10-21 | 深圳安侣医学科技有限公司 | 基于显微放大数字图像的血液细胞分析方法及系统 |
Family Cites Families (118)
| Publication number | Priority date | Publication date | Assignee | Title |
|---|---|---|---|---|
| US3770349A (en) | 1969-03-17 | 1973-11-06 | Sanchez G Legorreta | Method and apparatus for automatically classifying complex, microscopic particles such as human cells |
| US4207554A (en) | 1972-08-04 | 1980-06-10 | Med-El Inc. | Method and apparatus for automated classification and analysis of cells |
| US4125828A (en) | 1972-08-04 | 1978-11-14 | Med-El Inc. | Method and apparatus for automated classification and analysis of cells |
| US4199748A (en) | 1976-11-01 | 1980-04-22 | Rush-Presbyterian-St. Luke's Medical Center | Automated method and apparatus for classification of cells with application to the diagnosis of anemia |
| US4097845A (en) | 1976-11-01 | 1978-06-27 | Rush-Presbyterian-St. Luke's Medical Center | Method of and an apparatus for automatic classification of red blood cells |
| US4242730A (en) * | 1979-03-09 | 1980-12-30 | Helena Laboratories Corporation | Single scan microprocessor-controlled densitometer |
| US4453266A (en) | 1980-04-21 | 1984-06-05 | Rush-Presbyterian-St. Luke's Medical Center | Method and apparatus for measuring mean cell volume of red blood cells |
| US4447725A (en) * | 1981-06-15 | 1984-05-08 | Biggs Delmar A | Quantitative measurement of fat, protein and lactose in dairy products |
| US4392864A (en) * | 1982-02-01 | 1983-07-12 | Miles Laboratories, Inc. | Stabilized Romanowsky stain solution |
| US4741043B1 (en) | 1985-11-04 | 1994-08-09 | Cell Analysis Systems Inc | Method of and apparatus for image analyses of biological specimens |
| US4998533A (en) | 1986-07-15 | 1991-03-12 | Winkelman James W | Apparatus and method for in vivo analysis of red and white blood cell indices |
| JPH02164341A (ja) | 1988-12-19 | 1990-06-25 | Nippon Koden Corp | ヘモグロビン濃度測定装置 |
| US5045529A (en) | 1989-03-27 | 1991-09-03 | Bionostics, Inc. | Tonometric fluid for blood gas and co-oximetry instruments |
| DE4203587C2 (de) | 1991-02-15 | 1997-04-17 | Horiba Ltd | Quantitatives spektralanalytisches Verfahren |
| DE4203588C2 (de) | 1991-02-16 | 1996-11-14 | Horiba Ltd | Quantitatives spektralanalytisches Verfahren |
| US5784162A (en) | 1993-08-18 | 1998-07-21 | Applied Spectral Imaging Ltd. | Spectral bio-imaging methods for biological research, medical diagnostics and therapy |
| US5548395A (en) | 1991-09-20 | 1996-08-20 | Toa Medical Electronics Co., Ltd. | Particle analyzer |
| US5360739A (en) * | 1991-12-05 | 1994-11-01 | Miles Inc. | Methods for the identification and characterization of reticulocytes in whole blood |
| CA2084099C (en) * | 1991-12-06 | 1996-06-18 | James V. Bacus | Method and apparatus for automated cell analysis |
| US5385143A (en) | 1992-02-06 | 1995-01-31 | Nihon Kohden Corporation | Apparatus for measuring predetermined data of living tissue |
| JP3364819B2 (ja) | 1994-04-28 | 2003-01-08 | 日本光電工業株式会社 | 血中吸光物質濃度測定装置 |
| EP0770216A1 (de) | 1994-07-14 | 1997-05-02 | Abbott Laboratories | Verfahren und reagenzien zur cyanidfreien bestimmung von hämoglobin und leukocyten in vollblut |
| US5891734A (en) | 1994-08-01 | 1999-04-06 | Abbott Laboratories | Method for performing automated analysis |
| US5978497A (en) | 1994-09-20 | 1999-11-02 | Neopath, Inc. | Apparatus for the identification of free-lying cells |
| JP3562847B2 (ja) | 1994-11-15 | 2004-09-08 | 謙 石原 | ヘモグロビン濃度測定装置 |
| DE19612425C2 (de) | 1995-03-31 | 2000-08-31 | Nihon Kohden Corp | Apparat zur Messung von Hämoglobinkonzentration |
| US5882933A (en) | 1995-06-08 | 1999-03-16 | Coulter International Corp. | Method for determination of leukocytes and hemoglobin concentration in blood |
| US5741113A (en) | 1995-07-10 | 1998-04-21 | Kensington Laboratories, Inc. | Continuously rotatable multiple link robot arm mechanism |
| JP2000501829A (ja) | 1995-07-19 | 2000-02-15 | モルフォメトリックス テクノロジーズ インク. | 画像解析用の多スペクトル分割 |
| KR100269563B1 (ko) | 1995-10-23 | 2000-12-01 | 사이토메트릭스, 인코오포레이티드 | 반사적영상화분석을위한장치 |
| US5741213A (en) | 1995-10-25 | 1998-04-21 | Toa Medical Electronics Co., Ltd. | Apparatus for analyzing blood |
| DE69627183T2 (de) | 1995-11-30 | 2004-01-29 | Chromavision Med Sys Inc | Verfahren zur automatischen bildanalyse biologischer proben |
| US6151405A (en) | 1996-11-27 | 2000-11-21 | Chromavision Medical Systems, Inc. | System and method for cellular specimen grading |
| DE19653082A1 (de) | 1995-12-21 | 1997-06-26 | Bionostics Inc | Flüssige Kontrollösungen für die Blutanalyse |
| JP3587607B2 (ja) | 1995-12-22 | 2004-11-10 | シスメックス株式会社 | 粒子測定装置およびその方法 |
| RU2177721C2 (ru) | 1995-12-27 | 2002-01-10 | Сисмекс Корпорэйшн | Атравматичный анализатор крови |
| DE69625581T2 (de) | 1996-03-07 | 2003-09-25 | Coulter Int Corp | Cyanidfreies Reagenz und Verfahren zur Bestimmung von Hämoglobin und Leukozytendifferenzierung |
| US5882934A (en) | 1997-01-21 | 1999-03-16 | Coulter International Corp. | Composition and method for hemoglobin and cell analysis |
| JP3830613B2 (ja) | 1997-04-18 | 2006-10-04 | シスメックス株式会社 | 血液中の白血球及びヘモグロビン濃度測定試薬 |
| US6169816B1 (en) | 1997-05-14 | 2001-01-02 | Applied Imaging, Inc. | Identification of objects of interest using multiple illumination schemes and finding overlap of features in corresponding multiple images |
| US6070093A (en) | 1997-12-02 | 2000-05-30 | Abbott Laboratories | Multiplex sensor and method of use |
| US6006119A (en) | 1998-02-04 | 1999-12-21 | Polestar Technologies, Inc. | Non-invasive optical measurement of blood hematocrit |
| US6251615B1 (en) | 1998-02-20 | 2001-06-26 | Cell Analytics, Inc. | Cell analysis methods |
| US6350613B1 (en) | 1998-03-07 | 2002-02-26 | Belton Dickinson & Co. | Determination of white blood cell differential and reticulocyte counts |
| US5948686A (en) | 1998-03-07 | 1999-09-07 | Robert A. Leuine | Method for performing blood cell counts |
| US6235536B1 (en) * | 1998-03-07 | 2001-05-22 | Robert A. Levine | Analysis of quiescent anticoagulated whole blood samples |
| US6929953B1 (en) | 1998-03-07 | 2005-08-16 | Robert A. Levine | Apparatus for analyzing biologic fluids |
| US6087182A (en) | 1998-08-27 | 2000-07-11 | Abbott Laboratories | Reagentless analysis of biological samples |
| WO2000023799A1 (en) * | 1998-10-21 | 2000-04-27 | Steven Jay Smith | Protein quantitation with cell imaging densitometry |
| FR2791138B1 (fr) | 1999-03-19 | 2001-04-27 | Abx Sa | Reactif pour la determination des leucocytes et la mesure de l'hemoglobine dans un echantillon de sang |
| US6743576B1 (en) | 1999-05-14 | 2004-06-01 | Cytokinetics, Inc. | Database system for predictive cellular bioinformatics |
| US6200500B1 (en) | 1999-08-20 | 2001-03-13 | Streck Laboratories, Inc. | Hematology control and system for multi-parameter hematology measurements |
| WO2001022741A2 (en) | 1999-09-23 | 2001-03-29 | Nadeau Richard G | Medical applications of orthogonal polarization spectral imaging |
| US6593102B2 (en) | 1999-10-29 | 2003-07-15 | Cytyc Corporation | Cytological stain composition |
| US6622095B2 (en) | 1999-11-30 | 2003-09-16 | Nihon Kohden Corporation | Apparatus for determining concentrations of hemoglobins |
| US6784981B1 (en) * | 2000-06-02 | 2004-08-31 | Idexx Laboratories, Inc. | Flow cytometry-based hematology system |
| US8071051B2 (en) * | 2004-05-14 | 2011-12-06 | Honeywell International Inc. | Portable sample analyzer cartridge |
| CA2417917C (en) | 2000-08-04 | 2014-10-14 | Photonify Technologies, Inc. | Systems and methods for providing information concerning chromophores in physiological media |
| US6748337B2 (en) | 2001-03-14 | 2004-06-08 | Wardlaw Partners, Lp | Method and apparatus for providing quality control in an instrument for medical analysis |
| US6519355B2 (en) | 2001-03-28 | 2003-02-11 | Alan C. Nelson | Optical projection imaging system and method for automatically detecting cells having nuclear and cytoplasmic densitometric features associated with disease |
| US7050620B2 (en) * | 2001-03-30 | 2006-05-23 | Heckman Carol A | Method of assaying shape and structural features in cells |
| US6577754B2 (en) * | 2001-05-29 | 2003-06-10 | Tissueinformatics, Inc. | Robust stain detection and quantification for histological specimens based on a physical model for stain absorption |
| US6569682B2 (en) | 2001-07-27 | 2003-05-27 | Coulter International Corp. | Hematology control product with increased closed vial stability |
| US6930773B2 (en) | 2001-08-23 | 2005-08-16 | Cambridge Research And Instrumentation, Inc. | Spectral imaging |
| CA2468861C (en) * | 2001-12-05 | 2012-06-12 | The Regents Of The University Of California | Robotic microscopy systems |
| GB0227160D0 (en) * | 2002-11-21 | 2002-12-24 | Qinetiq Ltd | Histological assessment of pleomorphism |
| US6916662B2 (en) | 2003-01-31 | 2005-07-12 | Abbott Laboratories | Performance improvement for hematology analysis |
| JP4284674B2 (ja) | 2003-01-31 | 2009-06-24 | 日本光電工業株式会社 | 血中吸光物質濃度測定装置 |
| US7379167B2 (en) | 2003-02-11 | 2008-05-27 | International Technidyne Corporation | Hemoglobin test strip and analysis system |
| WO2004104922A2 (en) | 2003-05-16 | 2004-12-02 | Board Of Regents, The University Of Texas System | Image and part recognition technology |
| WO2005050563A2 (en) * | 2003-11-17 | 2005-06-02 | Aureon Biosciences Corporation | Pathological tissue mapping |
| US7095492B2 (en) | 2003-12-19 | 2006-08-22 | Beckman Coulter, Inc. | Method and apparatus for measuring cell-by-cell hemoglobin |
| US9176121B2 (en) | 2004-02-13 | 2015-11-03 | Roche Diagnostics Hematology, Inc. | Identification of blood elements using inverted microscopy |
| JP4417143B2 (ja) | 2004-03-11 | 2010-02-17 | シスメックス株式会社 | 試料分析装置、プログラムおよびそのプログラムを記録した記録媒体 |
| US8953866B2 (en) | 2004-03-16 | 2015-02-10 | Amnis Corporation | Method for imaging and differential analysis of cells |
| JP4614047B2 (ja) | 2004-03-29 | 2011-01-19 | 日本光電工業株式会社 | 血中光吸収物質濃度測定装置。 |
| US7689038B2 (en) | 2005-01-10 | 2010-03-30 | Cytyc Corporation | Method for improved image segmentation |
| JP2006277424A (ja) | 2005-03-30 | 2006-10-12 | Sysmex Corp | 分析システム、データ処理装置、測定装置、及びアプリケーションプログラム |
| US7709249B2 (en) | 2005-04-01 | 2010-05-04 | 3M Innovative Properties Company | Multiplex fluorescence detection device having fiber bundle coupling multiple optical modules to a common detector |
| US7587078B2 (en) * | 2005-05-02 | 2009-09-08 | Cytyc Corporation | Automated image analysis |
| WO2006119314A2 (en) * | 2005-05-04 | 2006-11-09 | Uab Research Foundation | System for determining oxygen saturation of hemoglobin, hematocrit of blood and/or macular degeneration |
| US7796815B2 (en) * | 2005-06-10 | 2010-09-14 | The Cleveland Clinic Foundation | Image analysis of biological objects |
| US7482165B2 (en) | 2005-08-24 | 2009-01-27 | Beckman Coulter, Inc. | Method of preventing white blood cell interferences to red blood cell measurements of a blood sample |
| US20070054404A1 (en) | 2005-09-08 | 2007-03-08 | Beckman Coulter, Inc. | Method of hemoglobin correction due to temperature variation |
| US7796797B2 (en) | 2005-09-28 | 2010-09-14 | Sysmex Corporation | Apparatus for obtaining an image of a blood cell and method for obtaining an image of a blood cell |
| US8958990B2 (en) | 2005-10-03 | 2015-02-17 | Sysmex Corporation | Sample analyzer and sample analyzing method |
| US20070140543A1 (en) * | 2005-12-19 | 2007-06-21 | Cytyc Corporation | Systems and methods for enhanced cytological specimen review |
| CN101484792B (zh) * | 2006-03-24 | 2011-05-18 | 爱科来株式会社 | 糖基血红蛋白浓度测定方法和浓度测定装置 |
| JP4831168B2 (ja) | 2006-04-21 | 2011-12-07 | 日本光電工業株式会社 | 粒子分類方法および装置 |
| JP5032792B2 (ja) | 2006-05-22 | 2012-09-26 | 浜松ホトニクス株式会社 | 細胞選別装置 |
| SE531041C2 (sv) | 2006-07-17 | 2008-11-25 | Hemocue Ab | Räkning av trombocyter |
| CN100473416C (zh) * | 2006-08-18 | 2009-04-01 | 贵阳中医学院 | 治疗胃病的中药制剂及其制备方法 |
| CN101535804B (zh) | 2006-11-14 | 2013-04-24 | 贝克曼考尔特公司 | 血液学线性对照组合物、体系和使用方法 |
| US7952692B2 (en) | 2006-12-12 | 2011-05-31 | Orsense Ltd. | Method and apparatus for determination of analyte concentration |
| US7561329B2 (en) | 2006-12-14 | 2009-07-14 | Cytyc Corporation | Illumination source for stained biological samples |
| US20080144005A1 (en) | 2006-12-19 | 2008-06-19 | Cytyc Corporation | Method for analyzing blood content of cytological specimens |
| US8265359B2 (en) * | 2007-06-18 | 2012-09-11 | New Jersey Institute Of Technology | Computer-aided cytogenetic method of cancer diagnosis |
| US8326014B2 (en) * | 2007-09-28 | 2012-12-04 | Cytyc Corporation | Methods and systems for processing biological specimens utilizing multiple wavelengths |
| WO2009117652A1 (en) | 2008-03-21 | 2009-09-24 | Abbott Point Of Care, Inc. | Method and apparatus for determining the hematocrit of a blood sample utilizing the intrinsic pigmentation of hemoglobin contained within the red blood cells |
| WO2009117664A2 (en) * | 2008-03-21 | 2009-09-24 | Abbott Point Of Care, Inc. | Method and apparatus for determining red blood cell indices of a blood sample utilizing the intrinsic pigmentation of hemoglobin contained within the red blood cells |
| US8081303B2 (en) | 2008-03-21 | 2011-12-20 | Abbott Point Of Care, Inc. | Method and apparatus for analyzing individual cells or particulates using fluorescent quenching and/or bleaching |
| US7929121B2 (en) * | 2008-03-21 | 2011-04-19 | Abbott Point Of Care, Inc. | Method and apparatus for detecting and counting platelets individually and in aggregate clumps |
| US8194964B2 (en) * | 2008-04-25 | 2012-06-05 | Stratovan Corporation | Analysis of anatomic regions delineated from image data |
| JP2012515931A (ja) * | 2008-04-25 | 2012-07-12 | ウィンケルマン、ジェイムズ | 全血球数及び白血球百分率を決定するシステム及び方法 |
| US7968279B2 (en) | 2008-08-13 | 2011-06-28 | Beckman Coulter, Inc. | Reference control for cell by cell analysis |
| US8603773B2 (en) | 2008-09-19 | 2013-12-10 | Beckman Coulter | Method and system for analyzing a blood sample |
| EP2356465B1 (de) | 2008-11-13 | 2014-10-01 | Beckman Coulter, Inc. | Verfahren zur korrektur von partikelinterferenz bei hämoglobinmessungen |
| JP5438962B2 (ja) * | 2008-12-25 | 2014-03-12 | シスメックス株式会社 | 細胞画像表示装置 |
| EP2216095A1 (de) * | 2009-01-27 | 2010-08-11 | Koninklijke Philips Electronics N.V. | Mikrofluidische Vorrichtung für die Vollblutzählung |
| US8748186B2 (en) | 2009-12-22 | 2014-06-10 | Abbott Laboratories | Method for performing a blood count and determining the morphology of a blood smear |
| ES2438841T3 (es) | 2009-12-31 | 2014-01-20 | Abbott Point Of Care, Inc. | Método y aparato para determinar el volumen celular medio de los glóbulos rojos en la sangre |
| US8472693B2 (en) | 2010-03-18 | 2013-06-25 | Abbott Point Of Care, Inc. | Method for determining at least one hemoglobin related parameter of a whole blood sample |
| US8645306B2 (en) * | 2010-07-02 | 2014-02-04 | Idexx Laboratories, Inc. | Automated calibration method and system for a diagnostic analyzer |
| AU2012230858A1 (en) | 2011-03-23 | 2013-10-17 | Hologic, Inc. | Method for automatically seeding previously-classified images among images of objects of interest from a specimen |
| CA2833258A1 (en) | 2011-04-15 | 2012-10-18 | Constitution Medical, Inc. | Measuring volume and constituents of cells |
| WO2012174542A2 (en) * | 2011-06-17 | 2012-12-20 | Constitution Medical, Inc. | Systems and methods for sample display and review |
| CN103827658B (zh) * | 2011-07-22 | 2016-04-13 | 罗氏血液诊断股份有限公司 | 识别和测量网状细胞 |
| US9459196B2 (en) * | 2011-07-22 | 2016-10-04 | Roche Diagnostics Hematology, Inc. | Blood analyzer calibration and assessment |
-
2012
- 2012-04-13 CA CA2833258A patent/CA2833258A1/en not_active Abandoned
- 2012-04-13 EP EP12718805.0A patent/EP2697623B1/de active Active
- 2012-04-13 JP JP2014505367A patent/JP5997256B2/ja active Active
- 2012-04-13 CN CN201710217495.7A patent/CN107402178B/zh active Active
- 2012-04-13 CN CN202010272696.9A patent/CN111610138B/zh active Active
- 2012-04-13 US US13/447,045 patent/US8488111B2/en active Active
- 2012-04-13 ES ES12718805T patent/ES2890413T3/es active Active
- 2012-04-13 CN CN201280029617.5A patent/CN104094099B/zh active Active
- 2012-04-13 AU AU2012242587A patent/AU2012242587B2/en active Active
- 2012-04-13 US US13/446,967 patent/US8345227B2/en active Active
- 2012-04-13 EP EP21179105.8A patent/EP3904859B1/de active Active
- 2012-04-13 US US13/446,996 patent/US8339586B2/en active Active
- 2012-04-13 WO PCT/US2012/033636 patent/WO2012142496A1/en active Application Filing
- 2012-04-13 ES ES21179105T patent/ES2961409T3/es active Active
- 2012-11-16 US US13/679,664 patent/US8477294B2/en active Active
-
2013
- 2013-06-18 US US13/920,607 patent/US8922761B2/en active Active
-
2014
- 2014-11-21 HK HK14111782.3A patent/HK1198262A1/xx not_active IP Right Cessation
- 2014-12-10 US US14/566,000 patent/US9588033B2/en active Active
-
2016
- 2016-02-26 AU AU2016201248A patent/AU2016201248A1/en not_active Abandoned
- 2016-08-25 JP JP2016164520A patent/JP6363666B2/ja active Active
-
2017
- 2017-03-06 US US15/451,040 patent/US10281382B2/en active Active
-
2018
- 2018-06-28 JP JP2018123266A patent/JP6726704B2/ja active Active
Also Published As
Similar Documents
| Publication | Publication Date | Title |
|---|---|---|
| US10281382B2 (en) | Measuring volume and constituents of cells | |
| EP2734828B1 (de) | Identifizierung und messung von retikulozyten |
Legal Events
| Date | Code | Title | Description |
|---|---|---|---|
| PUAI | Public reference made under article 153(3) epc to a published international application that has entered the european phase |
Free format text: ORIGINAL CODE: 0009012 |
|
| STAA | Information on the status of an ep patent application or granted ep patent |
Free format text: STATUS: THE APPLICATION HAS BEEN PUBLISHED |
|
| AC | Divisional application: reference to earlier application |
Ref document number: 2697623 Country of ref document: EP Kind code of ref document: P |
|
| AK | Designated contracting states |
Kind code of ref document: A1 Designated state(s): AL AT BE BG CH CY CZ DE DK EE ES FI FR GB GR HR HU IE IS IT LI LT LU LV MC MK MT NL NO PL PT RO RS SE SI SK SM TR |
|
| B565 | Issuance of search results under rule 164(2) epc |
Effective date: 20211001 |
|
| STAA | Information on the status of an ep patent application or granted ep patent |
Free format text: STATUS: REQUEST FOR EXAMINATION WAS MADE |
|
| 17P | Request for examination filed |
Effective date: 20220421 |
|
| RBV | Designated contracting states (corrected) |
Designated state(s): AL AT BE BG CH CY CZ DE DK EE ES FI FR GB GR HR HU IE IS IT LI LT LU LV MC MK MT NL NO PL PT RO RS SE SI SK SM TR |
|
| GRAP | Despatch of communication of intention to grant a patent |
Free format text: ORIGINAL CODE: EPIDOSNIGR1 |
|
| STAA | Information on the status of an ep patent application or granted ep patent |
Free format text: STATUS: GRANT OF PATENT IS INTENDED |
|
| RIC1 | Information provided on ipc code assigned before grant |
Ipc: G06V 20/69 20220101ALI20230316BHEP Ipc: G06T 7/62 20170101ALI20230316BHEP Ipc: G06T 7/60 20170101ALI20230316BHEP Ipc: G06T 7/00 20170101ALI20230316BHEP Ipc: G01N 15/00 20060101ALI20230316BHEP Ipc: G01N 15/14 20060101AFI20230316BHEP |
|
| INTG | Intention to grant announced |
Effective date: 20230330 |
|
| P01 | Opt-out of the competence of the unified patent court (upc) registered |
Effective date: 20230530 |
|
| GRAS | Grant fee paid |
Free format text: ORIGINAL CODE: EPIDOSNIGR3 |
|
| GRAA | (expected) grant |
Free format text: ORIGINAL CODE: 0009210 |
|
| STAA | Information on the status of an ep patent application or granted ep patent |
Free format text: STATUS: THE PATENT HAS BEEN GRANTED |
|
| AC | Divisional application: reference to earlier application |
Ref document number: 2697623 Country of ref document: EP Kind code of ref document: P |
|
| AK | Designated contracting states |
Kind code of ref document: B1 Designated state(s): AL AT BE BG CH CY CZ DE DK EE ES FI FR GB GR HR HU IE IS IT LI LT LU LV MC MK MT NL NO PL PT RO RS SE SI SK SM TR |
|
| REG | Reference to a national code |
Ref country code: GB Ref legal event code: FG4D |
|
| REG | Reference to a national code |
Ref country code: CH Ref legal event code: EP |
|
| REG | Reference to a national code |
Ref country code: DE Ref legal event code: R096 Ref document number: 602012080039 Country of ref document: DE |
|
| REG | Reference to a national code |
Ref country code: IE Ref legal event code: FG4D |
|
| REG | Reference to a national code |
Ref country code: NL Ref legal event code: FP |
|
| REG | Reference to a national code |
Ref country code: LT Ref legal event code: MG9D |
|
| REG | Reference to a national code |
Ref country code: DE Ref legal event code: R082 Ref document number: 602012080039 Country of ref document: DE Representative=s name: KRAUS & LEDERER PARTGMBB, DE |
|
| REG | Reference to a national code |
Ref country code: AT Ref legal event code: MK05 Ref document number: 1606043 Country of ref document: AT Kind code of ref document: T Effective date: 20230830 |
|
| PG25 | Lapsed in a contracting state [announced via postgrant information from national office to epo] |
Ref country code: GR Free format text: LAPSE BECAUSE OF FAILURE TO SUBMIT A TRANSLATION OF THE DESCRIPTION OR TO PAY THE FEE WITHIN THE PRESCRIBED TIME-LIMIT Effective date: 20231201 |
|
| PG25 | Lapsed in a contracting state [announced via postgrant information from national office to epo] |
Ref country code: IS Free format text: LAPSE BECAUSE OF FAILURE TO SUBMIT A TRANSLATION OF THE DESCRIPTION OR TO PAY THE FEE WITHIN THE PRESCRIBED TIME-LIMIT Effective date: 20231230 |
|
| PG25 | Lapsed in a contracting state [announced via postgrant information from national office to epo] |
Ref country code: SE Free format text: LAPSE BECAUSE OF FAILURE TO SUBMIT A TRANSLATION OF THE DESCRIPTION OR TO PAY THE FEE WITHIN THE PRESCRIBED TIME-LIMIT Effective date: 20230830 Ref country code: RS Free format text: LAPSE BECAUSE OF FAILURE TO SUBMIT A TRANSLATION OF THE DESCRIPTION OR TO PAY THE FEE WITHIN THE PRESCRIBED TIME-LIMIT Effective date: 20230830 Ref country code: NO Free format text: LAPSE BECAUSE OF FAILURE TO SUBMIT A TRANSLATION OF THE DESCRIPTION OR TO PAY THE FEE WITHIN THE PRESCRIBED TIME-LIMIT Effective date: 20231130 Ref country code: LV Free format text: LAPSE BECAUSE OF FAILURE TO SUBMIT A TRANSLATION OF THE DESCRIPTION OR TO PAY THE FEE WITHIN THE PRESCRIBED TIME-LIMIT Effective date: 20230830 Ref country code: LT Free format text: LAPSE BECAUSE OF FAILURE TO SUBMIT A TRANSLATION OF THE DESCRIPTION OR TO PAY THE FEE WITHIN THE PRESCRIBED TIME-LIMIT Effective date: 20230830 Ref country code: IS Free format text: LAPSE BECAUSE OF FAILURE TO SUBMIT A TRANSLATION OF THE DESCRIPTION OR TO PAY THE FEE WITHIN THE PRESCRIBED TIME-LIMIT Effective date: 20231230 Ref country code: HR Free format text: LAPSE BECAUSE OF FAILURE TO SUBMIT A TRANSLATION OF THE DESCRIPTION OR TO PAY THE FEE WITHIN THE PRESCRIBED TIME-LIMIT Effective date: 20230830 Ref country code: GR Free format text: LAPSE BECAUSE OF FAILURE TO SUBMIT A TRANSLATION OF THE DESCRIPTION OR TO PAY THE FEE WITHIN THE PRESCRIBED TIME-LIMIT Effective date: 20231201 Ref country code: FI Free format text: LAPSE BECAUSE OF FAILURE TO SUBMIT A TRANSLATION OF THE DESCRIPTION OR TO PAY THE FEE WITHIN THE PRESCRIBED TIME-LIMIT Effective date: 20230830 Ref country code: AT Free format text: LAPSE BECAUSE OF FAILURE TO SUBMIT A TRANSLATION OF THE DESCRIPTION OR TO PAY THE FEE WITHIN THE PRESCRIBED TIME-LIMIT Effective date: 20230830 |
|
| PG25 | Lapsed in a contracting state [announced via postgrant information from national office to epo] |
Ref country code: PL Free format text: LAPSE BECAUSE OF FAILURE TO SUBMIT A TRANSLATION OF THE DESCRIPTION OR TO PAY THE FEE WITHIN THE PRESCRIBED TIME-LIMIT Effective date: 20230830 |
|
| REG | Reference to a national code |
Ref country code: ES Ref legal event code: FG2A Ref document number: 2961409 Country of ref document: ES Kind code of ref document: T3 Effective date: 20240311 |
|
| PGFP | Annual fee paid to national office [announced via postgrant information from national office to epo] |
Ref country code: NL Payment date: 20240320 Year of fee payment: 13 |