EP3427656B1 - Biological information analysis device, system, and program - Google Patents
Biological information analysis device, system, and program Download PDFInfo
- Publication number
- EP3427656B1 EP3427656B1 EP17782513.0A EP17782513A EP3427656B1 EP 3427656 B1 EP3427656 B1 EP 3427656B1 EP 17782513 A EP17782513 A EP 17782513A EP 3427656 B1 EP3427656 B1 EP 3427656B1
- Authority
- EP
- European Patent Office
- Prior art keywords
- indicator
- state
- cardiac
- blood pressure
- value
- Prior art date
- Legal status (The legal status is an assumption and is not a legal conclusion. Google has not performed a legal analysis and makes no representation as to the accuracy of the status listed.)
- Active
Links
- 238000004458 analytical method Methods 0.000 title claims description 51
- 230000036772 blood pressure Effects 0.000 claims description 131
- 230000000747 cardiac effect Effects 0.000 claims description 111
- 238000005259 measurement Methods 0.000 claims description 88
- 238000012545 processing Methods 0.000 claims description 76
- 230000036581 peripheral resistance Effects 0.000 claims description 67
- 238000000605 extraction Methods 0.000 claims description 44
- 230000002123 temporal effect Effects 0.000 claims description 20
- 230000036316 preload Effects 0.000 claims description 13
- 238000009530 blood pressure measurement Methods 0.000 description 29
- 238000000034 method Methods 0.000 description 23
- 208000019622 heart disease Diseases 0.000 description 20
- 208000020446 Cardiac disease Diseases 0.000 description 19
- 206010007572 Cardiac hypertrophy Diseases 0.000 description 14
- 208000006029 Cardiomegaly Diseases 0.000 description 14
- 230000035485 pulse pressure Effects 0.000 description 14
- 238000010586 diagram Methods 0.000 description 10
- 230000008859 change Effects 0.000 description 9
- 238000004891 communication Methods 0.000 description 8
- 230000007246 mechanism Effects 0.000 description 7
- 210000002321 radial artery Anatomy 0.000 description 7
- 210000000707 wrist Anatomy 0.000 description 7
- 208000008784 apnea Diseases 0.000 description 5
- 210000001367 artery Anatomy 0.000 description 5
- 238000001514 detection method Methods 0.000 description 5
- 230000000694 effects Effects 0.000 description 5
- 238000005516 engineering process Methods 0.000 description 5
- 230000007613 environmental effect Effects 0.000 description 5
- 230000006870 function Effects 0.000 description 5
- 230000029058 respiratory gaseous exchange Effects 0.000 description 5
- 230000035488 systolic blood pressure Effects 0.000 description 5
- 208000007536 Thrombosis Diseases 0.000 description 4
- 230000007423 decrease Effects 0.000 description 4
- 238000011156 evaluation Methods 0.000 description 4
- 238000003825 pressing Methods 0.000 description 4
- 230000000284 resting effect Effects 0.000 description 4
- 239000008280 blood Substances 0.000 description 3
- 210000004369 blood Anatomy 0.000 description 3
- 230000035487 diastolic blood pressure Effects 0.000 description 3
- 230000036541 health Effects 0.000 description 3
- 208000024584 respiratory abnormality Diseases 0.000 description 3
- 230000035945 sensitivity Effects 0.000 description 3
- 201000002859 sleep apnea Diseases 0.000 description 3
- 101000692225 Homo sapiens Selenocysteine insertion sequence-binding protein 2 Proteins 0.000 description 2
- 102100026077 Selenocysteine insertion sequence-binding protein 2 Human genes 0.000 description 2
- 230000001133 acceleration Effects 0.000 description 2
- 230000009471 action Effects 0.000 description 2
- 210000001765 aortic valve Anatomy 0.000 description 2
- 230000003416 augmentation Effects 0.000 description 2
- 238000004364 calculation method Methods 0.000 description 2
- 239000002131 composite material Substances 0.000 description 2
- 239000000470 constituent Substances 0.000 description 2
- 230000003247 decreasing effect Effects 0.000 description 2
- 230000002526 effect on cardiovascular system Effects 0.000 description 2
- 230000000630 rising effect Effects 0.000 description 2
- 208000024172 Cardiovascular disease Diseases 0.000 description 1
- 208000003417 Central Sleep Apnea Diseases 0.000 description 1
- 206010062519 Poor quality sleep Diseases 0.000 description 1
- 238000009825 accumulation Methods 0.000 description 1
- 230000004872 arterial blood pressure Effects 0.000 description 1
- 230000035581 baroreflex Effects 0.000 description 1
- 230000006399 behavior Effects 0.000 description 1
- 230000004397 blinking Effects 0.000 description 1
- 210000004204 blood vessel Anatomy 0.000 description 1
- 230000036760 body temperature Effects 0.000 description 1
- 210000004556 brain Anatomy 0.000 description 1
- 230000007211 cardiovascular event Effects 0.000 description 1
- 238000006243 chemical reaction Methods 0.000 description 1
- 208000020020 complex sleep apnea Diseases 0.000 description 1
- 230000008602 contraction Effects 0.000 description 1
- 230000018044 dehydration Effects 0.000 description 1
- 238000006297 dehydration reaction Methods 0.000 description 1
- 238000011161 development Methods 0.000 description 1
- 239000006185 dispersion Substances 0.000 description 1
- 239000003814 drug Substances 0.000 description 1
- 238000002474 experimental method Methods 0.000 description 1
- 239000000284 extract Substances 0.000 description 1
- 239000000835 fiber Substances 0.000 description 1
- 239000004973 liquid crystal related substance Substances 0.000 description 1
- 238000012423 maintenance Methods 0.000 description 1
- 235000012054 meals Nutrition 0.000 description 1
- 230000003340 mental effect Effects 0.000 description 1
- 201000006646 mixed sleep apnea Diseases 0.000 description 1
- 238000012986 modification Methods 0.000 description 1
- 230000004048 modification Effects 0.000 description 1
- 238000012544 monitoring process Methods 0.000 description 1
- 230000002107 myocardial effect Effects 0.000 description 1
- 210000004165 myocardium Anatomy 0.000 description 1
- 208000001797 obstructive sleep apnea Diseases 0.000 description 1
- 230000003287 optical effect Effects 0.000 description 1
- 230000002093 peripheral effect Effects 0.000 description 1
- 230000002265 prevention Effects 0.000 description 1
- 230000005180 public health Effects 0.000 description 1
- 230000000241 respiratory effect Effects 0.000 description 1
- 238000013349 risk mitigation Methods 0.000 description 1
- 238000005070 sampling Methods 0.000 description 1
- 229920006395 saturated elastomer Polymers 0.000 description 1
- 230000002269 spontaneous effect Effects 0.000 description 1
- 239000000126 substance Substances 0.000 description 1
Images


Classifications
-
- A—HUMAN NECESSITIES
- A61—MEDICAL OR VETERINARY SCIENCE; HYGIENE
- A61B—DIAGNOSIS; SURGERY; IDENTIFICATION
- A61B5/00—Measuring for diagnostic purposes; Identification of persons
- A61B5/02—Detecting, measuring or recording pulse, heart rate, blood pressure or blood flow; Combined pulse/heart-rate/blood pressure determination; Evaluating a cardiovascular condition not otherwise provided for, e.g. using combinations of techniques provided for in this group with electrocardiography or electroauscultation; Heart catheters for measuring blood pressure
- A61B5/021—Measuring pressure in heart or blood vessels
- A61B5/02108—Measuring pressure in heart or blood vessels from analysis of pulse wave characteristics
-
- A—HUMAN NECESSITIES
- A61—MEDICAL OR VETERINARY SCIENCE; HYGIENE
- A61B—DIAGNOSIS; SURGERY; IDENTIFICATION
- A61B5/00—Measuring for diagnostic purposes; Identification of persons
- A61B5/02—Detecting, measuring or recording pulse, heart rate, blood pressure or blood flow; Combined pulse/heart-rate/blood pressure determination; Evaluating a cardiovascular condition not otherwise provided for, e.g. using combinations of techniques provided for in this group with electrocardiography or electroauscultation; Heart catheters for measuring blood pressure
- A61B5/026—Measuring blood flow
- A61B5/029—Measuring or recording blood output from the heart, e.g. minute volume
-
- A—HUMAN NECESSITIES
- A61—MEDICAL OR VETERINARY SCIENCE; HYGIENE
- A61B—DIAGNOSIS; SURGERY; IDENTIFICATION
- A61B5/00—Measuring for diagnostic purposes; Identification of persons
- A61B5/0002—Remote monitoring of patients using telemetry, e.g. transmission of vital signals via a communication network
-
- A—HUMAN NECESSITIES
- A61—MEDICAL OR VETERINARY SCIENCE; HYGIENE
- A61B—DIAGNOSIS; SURGERY; IDENTIFICATION
- A61B5/00—Measuring for diagnostic purposes; Identification of persons
- A61B5/02—Detecting, measuring or recording pulse, heart rate, blood pressure or blood flow; Combined pulse/heart-rate/blood pressure determination; Evaluating a cardiovascular condition not otherwise provided for, e.g. using combinations of techniques provided for in this group with electrocardiography or electroauscultation; Heart catheters for measuring blood pressure
- A61B5/02028—Determining haemodynamic parameters not otherwise provided for, e.g. cardiac contractility or left ventricular ejection fraction
-
- A—HUMAN NECESSITIES
- A61—MEDICAL OR VETERINARY SCIENCE; HYGIENE
- A61B—DIAGNOSIS; SURGERY; IDENTIFICATION
- A61B5/00—Measuring for diagnostic purposes; Identification of persons
- A61B5/02—Detecting, measuring or recording pulse, heart rate, blood pressure or blood flow; Combined pulse/heart-rate/blood pressure determination; Evaluating a cardiovascular condition not otherwise provided for, e.g. using combinations of techniques provided for in this group with electrocardiography or electroauscultation; Heart catheters for measuring blood pressure
- A61B5/0205—Simultaneously evaluating both cardiovascular conditions and different types of body conditions, e.g. heart and respiratory condition
- A61B5/02055—Simultaneously evaluating both cardiovascular condition and temperature
-
- A—HUMAN NECESSITIES
- A61—MEDICAL OR VETERINARY SCIENCE; HYGIENE
- A61B—DIAGNOSIS; SURGERY; IDENTIFICATION
- A61B5/00—Measuring for diagnostic purposes; Identification of persons
- A61B5/02—Detecting, measuring or recording pulse, heart rate, blood pressure or blood flow; Combined pulse/heart-rate/blood pressure determination; Evaluating a cardiovascular condition not otherwise provided for, e.g. using combinations of techniques provided for in this group with electrocardiography or electroauscultation; Heart catheters for measuring blood pressure
- A61B5/021—Measuring pressure in heart or blood vessels
- A61B5/02108—Measuring pressure in heart or blood vessels from analysis of pulse wave characteristics
- A61B5/02116—Measuring pressure in heart or blood vessels from analysis of pulse wave characteristics of pulse wave amplitude
-
- A—HUMAN NECESSITIES
- A61—MEDICAL OR VETERINARY SCIENCE; HYGIENE
- A61B—DIAGNOSIS; SURGERY; IDENTIFICATION
- A61B5/00—Measuring for diagnostic purposes; Identification of persons
- A61B5/02—Detecting, measuring or recording pulse, heart rate, blood pressure or blood flow; Combined pulse/heart-rate/blood pressure determination; Evaluating a cardiovascular condition not otherwise provided for, e.g. using combinations of techniques provided for in this group with electrocardiography or electroauscultation; Heart catheters for measuring blood pressure
- A61B5/021—Measuring pressure in heart or blood vessels
- A61B5/02108—Measuring pressure in heart or blood vessels from analysis of pulse wave characteristics
- A61B5/02125—Measuring pressure in heart or blood vessels from analysis of pulse wave characteristics of pulse wave propagation time
-
- A—HUMAN NECESSITIES
- A61—MEDICAL OR VETERINARY SCIENCE; HYGIENE
- A61B—DIAGNOSIS; SURGERY; IDENTIFICATION
- A61B5/00—Measuring for diagnostic purposes; Identification of persons
- A61B5/02—Detecting, measuring or recording pulse, heart rate, blood pressure or blood flow; Combined pulse/heart-rate/blood pressure determination; Evaluating a cardiovascular condition not otherwise provided for, e.g. using combinations of techniques provided for in this group with electrocardiography or electroauscultation; Heart catheters for measuring blood pressure
- A61B5/021—Measuring pressure in heart or blood vessels
- A61B5/022—Measuring pressure in heart or blood vessels by applying pressure to close blood vessels, e.g. against the skin; Ophthalmodynamometers
- A61B5/02225—Measuring pressure in heart or blood vessels by applying pressure to close blood vessels, e.g. against the skin; Ophthalmodynamometers using the oscillometric method
-
- A—HUMAN NECESSITIES
- A61—MEDICAL OR VETERINARY SCIENCE; HYGIENE
- A61B—DIAGNOSIS; SURGERY; IDENTIFICATION
- A61B5/00—Measuring for diagnostic purposes; Identification of persons
- A61B5/02—Detecting, measuring or recording pulse, heart rate, blood pressure or blood flow; Combined pulse/heart-rate/blood pressure determination; Evaluating a cardiovascular condition not otherwise provided for, e.g. using combinations of techniques provided for in this group with electrocardiography or electroauscultation; Heart catheters for measuring blood pressure
- A61B5/021—Measuring pressure in heart or blood vessels
- A61B5/022—Measuring pressure in heart or blood vessels by applying pressure to close blood vessels, e.g. against the skin; Ophthalmodynamometers
- A61B5/02233—Occluders specially adapted therefor
-
- A—HUMAN NECESSITIES
- A61—MEDICAL OR VETERINARY SCIENCE; HYGIENE
- A61B—DIAGNOSIS; SURGERY; IDENTIFICATION
- A61B5/00—Measuring for diagnostic purposes; Identification of persons
- A61B5/02—Detecting, measuring or recording pulse, heart rate, blood pressure or blood flow; Combined pulse/heart-rate/blood pressure determination; Evaluating a cardiovascular condition not otherwise provided for, e.g. using combinations of techniques provided for in this group with electrocardiography or electroauscultation; Heart catheters for measuring blood pressure
- A61B5/024—Detecting, measuring or recording pulse rate or heart rate
- A61B5/02438—Detecting, measuring or recording pulse rate or heart rate with portable devices, e.g. worn by the patient
-
- A—HUMAN NECESSITIES
- A61—MEDICAL OR VETERINARY SCIENCE; HYGIENE
- A61B—DIAGNOSIS; SURGERY; IDENTIFICATION
- A61B5/00—Measuring for diagnostic purposes; Identification of persons
- A61B5/08—Detecting, measuring or recording devices for evaluating the respiratory organs
-
- A—HUMAN NECESSITIES
- A61—MEDICAL OR VETERINARY SCIENCE; HYGIENE
- A61B—DIAGNOSIS; SURGERY; IDENTIFICATION
- A61B5/00—Measuring for diagnostic purposes; Identification of persons
- A61B5/08—Detecting, measuring or recording devices for evaluating the respiratory organs
- A61B5/0816—Measuring devices for examining respiratory frequency
-
- A—HUMAN NECESSITIES
- A61—MEDICAL OR VETERINARY SCIENCE; HYGIENE
- A61B—DIAGNOSIS; SURGERY; IDENTIFICATION
- A61B5/00—Measuring for diagnostic purposes; Identification of persons
- A61B5/24—Detecting, measuring or recording bioelectric or biomagnetic signals of the body or parts thereof
- A61B5/316—Modalities, i.e. specific diagnostic methods
- A61B5/318—Heart-related electrical modalities, e.g. electrocardiography [ECG]
- A61B5/346—Analysis of electrocardiograms
- A61B5/349—Detecting specific parameters of the electrocardiograph cycle
- A61B5/352—Detecting R peaks, e.g. for synchronising diagnostic apparatus; Estimating R-R interval
-
- A—HUMAN NECESSITIES
- A61—MEDICAL OR VETERINARY SCIENCE; HYGIENE
- A61B—DIAGNOSIS; SURGERY; IDENTIFICATION
- A61B5/00—Measuring for diagnostic purposes; Identification of persons
- A61B5/48—Other medical applications
- A61B5/4836—Diagnosis combined with treatment in closed-loop systems or methods
-
- A—HUMAN NECESSITIES
- A61—MEDICAL OR VETERINARY SCIENCE; HYGIENE
- A61B—DIAGNOSIS; SURGERY; IDENTIFICATION
- A61B5/00—Measuring for diagnostic purposes; Identification of persons
- A61B5/48—Other medical applications
- A61B5/4884—Other medical applications inducing physiological or psychological stress, e.g. applications for stress testing
-
- A—HUMAN NECESSITIES
- A61—MEDICAL OR VETERINARY SCIENCE; HYGIENE
- A61B—DIAGNOSIS; SURGERY; IDENTIFICATION
- A61B5/00—Measuring for diagnostic purposes; Identification of persons
- A61B5/68—Arrangements of detecting, measuring or recording means, e.g. sensors, in relation to patient
- A61B5/6801—Arrangements of detecting, measuring or recording means, e.g. sensors, in relation to patient specially adapted to be attached to or worn on the body surface
- A61B5/6802—Sensor mounted on worn items
- A61B5/681—Wristwatch-type devices
-
- A—HUMAN NECESSITIES
- A61—MEDICAL OR VETERINARY SCIENCE; HYGIENE
- A61B—DIAGNOSIS; SURGERY; IDENTIFICATION
- A61B5/00—Measuring for diagnostic purposes; Identification of persons
- A61B5/68—Arrangements of detecting, measuring or recording means, e.g. sensors, in relation to patient
- A61B5/6801—Arrangements of detecting, measuring or recording means, e.g. sensors, in relation to patient specially adapted to be attached to or worn on the body surface
- A61B5/6813—Specially adapted to be attached to a specific body part
- A61B5/6824—Arm or wrist
-
- A—HUMAN NECESSITIES
- A61—MEDICAL OR VETERINARY SCIENCE; HYGIENE
- A61B—DIAGNOSIS; SURGERY; IDENTIFICATION
- A61B5/00—Measuring for diagnostic purposes; Identification of persons
- A61B5/72—Signal processing specially adapted for physiological signals or for diagnostic purposes
- A61B5/7203—Signal processing specially adapted for physiological signals or for diagnostic purposes for noise prevention, reduction or removal
- A61B5/7207—Signal processing specially adapted for physiological signals or for diagnostic purposes for noise prevention, reduction or removal of noise induced by motion artifacts
- A61B5/721—Signal processing specially adapted for physiological signals or for diagnostic purposes for noise prevention, reduction or removal of noise induced by motion artifacts using a separate sensor to detect motion or using motion information derived from signals other than the physiological signal to be measured
-
- A—HUMAN NECESSITIES
- A61—MEDICAL OR VETERINARY SCIENCE; HYGIENE
- A61B—DIAGNOSIS; SURGERY; IDENTIFICATION
- A61B5/00—Measuring for diagnostic purposes; Identification of persons
- A61B5/72—Signal processing specially adapted for physiological signals or for diagnostic purposes
- A61B5/7235—Details of waveform analysis
- A61B5/7239—Details of waveform analysis using differentiation including higher order derivatives
-
- A—HUMAN NECESSITIES
- A61—MEDICAL OR VETERINARY SCIENCE; HYGIENE
- A61B—DIAGNOSIS; SURGERY; IDENTIFICATION
- A61B5/00—Measuring for diagnostic purposes; Identification of persons
- A61B5/72—Signal processing specially adapted for physiological signals or for diagnostic purposes
- A61B5/7271—Specific aspects of physiological measurement analysis
- A61B5/7275—Determining trends in physiological measurement data; Predicting development of a medical condition based on physiological measurements, e.g. determining a risk factor
-
- A—HUMAN NECESSITIES
- A61—MEDICAL OR VETERINARY SCIENCE; HYGIENE
- A61B—DIAGNOSIS; SURGERY; IDENTIFICATION
- A61B5/00—Measuring for diagnostic purposes; Identification of persons
- A61B5/72—Signal processing specially adapted for physiological signals or for diagnostic purposes
- A61B5/7271—Specific aspects of physiological measurement analysis
- A61B5/7278—Artificial waveform generation or derivation, e.g. synthesising signals from measured signals
-
- A—HUMAN NECESSITIES
- A61—MEDICAL OR VETERINARY SCIENCE; HYGIENE
- A61B—DIAGNOSIS; SURGERY; IDENTIFICATION
- A61B5/00—Measuring for diagnostic purposes; Identification of persons
- A61B5/72—Signal processing specially adapted for physiological signals or for diagnostic purposes
- A61B5/7271—Specific aspects of physiological measurement analysis
- A61B5/7282—Event detection, e.g. detecting unique waveforms indicative of a medical condition
-
- A—HUMAN NECESSITIES
- A61—MEDICAL OR VETERINARY SCIENCE; HYGIENE
- A61B—DIAGNOSIS; SURGERY; IDENTIFICATION
- A61B5/00—Measuring for diagnostic purposes; Identification of persons
- A61B5/74—Details of notification to user or communication with user or patient ; user input means
- A61B5/742—Details of notification to user or communication with user or patient ; user input means using visual displays
- A61B5/743—Displaying an image simultaneously with additional graphical information, e.g. symbols, charts, function plots
-
- A—HUMAN NECESSITIES
- A61—MEDICAL OR VETERINARY SCIENCE; HYGIENE
- A61B—DIAGNOSIS; SURGERY; IDENTIFICATION
- A61B5/00—Measuring for diagnostic purposes; Identification of persons
- A61B5/74—Details of notification to user or communication with user or patient ; user input means
- A61B5/746—Alarms related to a physiological condition, e.g. details of setting alarm thresholds or avoiding false alarms
-
- A—HUMAN NECESSITIES
- A61—MEDICAL OR VETERINARY SCIENCE; HYGIENE
- A61F—FILTERS IMPLANTABLE INTO BLOOD VESSELS; PROSTHESES; DEVICES PROVIDING PATENCY TO, OR PREVENTING COLLAPSING OF, TUBULAR STRUCTURES OF THE BODY, e.g. STENTS; ORTHOPAEDIC, NURSING OR CONTRACEPTIVE DEVICES; FOMENTATION; TREATMENT OR PROTECTION OF EYES OR EARS; BANDAGES, DRESSINGS OR ABSORBENT PADS; FIRST-AID KITS
- A61F5/00—Orthopaedic methods or devices for non-surgical treatment of bones or joints; Nursing devices; Anti-rape devices
- A61F5/56—Devices for preventing snoring
-
- A—HUMAN NECESSITIES
- A61—MEDICAL OR VETERINARY SCIENCE; HYGIENE
- A61M—DEVICES FOR INTRODUCING MEDIA INTO, OR ONTO, THE BODY; DEVICES FOR TRANSDUCING BODY MEDIA OR FOR TAKING MEDIA FROM THE BODY; DEVICES FOR PRODUCING OR ENDING SLEEP OR STUPOR
- A61M16/00—Devices for influencing the respiratory system of patients by gas treatment, e.g. mouth-to-mouth respiration; Tracheal tubes
- A61M16/021—Devices for influencing the respiratory system of patients by gas treatment, e.g. mouth-to-mouth respiration; Tracheal tubes operated by electrical means
- A61M16/022—Control means therefor
- A61M16/024—Control means therefor including calculation means, e.g. using a processor
-
- A—HUMAN NECESSITIES
- A61—MEDICAL OR VETERINARY SCIENCE; HYGIENE
- A61M—DEVICES FOR INTRODUCING MEDIA INTO, OR ONTO, THE BODY; DEVICES FOR TRANSDUCING BODY MEDIA OR FOR TAKING MEDIA FROM THE BODY; DEVICES FOR PRODUCING OR ENDING SLEEP OR STUPOR
- A61M21/00—Other devices or methods to cause a change in the state of consciousness; Devices for producing or ending sleep by mechanical, optical, or acoustical means, e.g. for hypnosis
-
- G—PHYSICS
- G06—COMPUTING; CALCULATING OR COUNTING
- G06F—ELECTRIC DIGITAL DATA PROCESSING
- G06F1/00—Details not covered by groups G06F3/00 - G06F13/00 and G06F21/00
- G06F1/16—Constructional details or arrangements
- G06F1/1613—Constructional details or arrangements for portable computers
- G06F1/163—Wearable computers, e.g. on a belt
-
- G—PHYSICS
- G16—INFORMATION AND COMMUNICATION TECHNOLOGY [ICT] SPECIALLY ADAPTED FOR SPECIFIC APPLICATION FIELDS
- G16H—HEALTHCARE INFORMATICS, i.e. INFORMATION AND COMMUNICATION TECHNOLOGY [ICT] SPECIALLY ADAPTED FOR THE HANDLING OR PROCESSING OF MEDICAL OR HEALTHCARE DATA
- G16H10/00—ICT specially adapted for the handling or processing of patient-related medical or healthcare data
- G16H10/40—ICT specially adapted for the handling or processing of patient-related medical or healthcare data for data related to laboratory analysis, e.g. patient specimen analysis
-
- G—PHYSICS
- G16—INFORMATION AND COMMUNICATION TECHNOLOGY [ICT] SPECIALLY ADAPTED FOR SPECIFIC APPLICATION FIELDS
- G16H—HEALTHCARE INFORMATICS, i.e. INFORMATION AND COMMUNICATION TECHNOLOGY [ICT] SPECIALLY ADAPTED FOR THE HANDLING OR PROCESSING OF MEDICAL OR HEALTHCARE DATA
- G16H50/00—ICT specially adapted for medical diagnosis, medical simulation or medical data mining; ICT specially adapted for detecting, monitoring or modelling epidemics or pandemics
- G16H50/20—ICT specially adapted for medical diagnosis, medical simulation or medical data mining; ICT specially adapted for detecting, monitoring or modelling epidemics or pandemics for computer-aided diagnosis, e.g. based on medical expert systems
-
- A—HUMAN NECESSITIES
- A61—MEDICAL OR VETERINARY SCIENCE; HYGIENE
- A61B—DIAGNOSIS; SURGERY; IDENTIFICATION
- A61B2560/00—Constructional details of operational features of apparatus; Accessories for medical measuring apparatus
- A61B2560/02—Operational features
- A61B2560/0242—Operational features adapted to measure environmental factors, e.g. temperature, pollution
-
- A—HUMAN NECESSITIES
- A61—MEDICAL OR VETERINARY SCIENCE; HYGIENE
- A61B—DIAGNOSIS; SURGERY; IDENTIFICATION
- A61B2562/00—Details of sensors; Constructional details of sensor housings or probes; Accessories for sensors
- A61B2562/02—Details of sensors specially adapted for in-vivo measurements
- A61B2562/029—Humidity sensors
-
- A—HUMAN NECESSITIES
- A61—MEDICAL OR VETERINARY SCIENCE; HYGIENE
- A61B—DIAGNOSIS; SURGERY; IDENTIFICATION
- A61B5/00—Measuring for diagnostic purposes; Identification of persons
- A61B5/02—Detecting, measuring or recording pulse, heart rate, blood pressure or blood flow; Combined pulse/heart-rate/blood pressure determination; Evaluating a cardiovascular condition not otherwise provided for, e.g. using combinations of techniques provided for in this group with electrocardiography or electroauscultation; Heart catheters for measuring blood pressure
- A61B5/021—Measuring pressure in heart or blood vessels
- A61B5/02141—Details of apparatus construction, e.g. pump units or housings therefor, cuff pressurising systems, arrangements of fluid conduits or circuits
-
- A—HUMAN NECESSITIES
- A61—MEDICAL OR VETERINARY SCIENCE; HYGIENE
- A61B—DIAGNOSIS; SURGERY; IDENTIFICATION
- A61B5/00—Measuring for diagnostic purposes; Identification of persons
- A61B5/02—Detecting, measuring or recording pulse, heart rate, blood pressure or blood flow; Combined pulse/heart-rate/blood pressure determination; Evaluating a cardiovascular condition not otherwise provided for, e.g. using combinations of techniques provided for in this group with electrocardiography or electroauscultation; Heart catheters for measuring blood pressure
- A61B5/021—Measuring pressure in heart or blood vessels
- A61B5/022—Measuring pressure in heart or blood vessels by applying pressure to close blood vessels, e.g. against the skin; Ophthalmodynamometers
-
- A—HUMAN NECESSITIES
- A61—MEDICAL OR VETERINARY SCIENCE; HYGIENE
- A61B—DIAGNOSIS; SURGERY; IDENTIFICATION
- A61B5/00—Measuring for diagnostic purposes; Identification of persons
- A61B5/02—Detecting, measuring or recording pulse, heart rate, blood pressure or blood flow; Combined pulse/heart-rate/blood pressure determination; Evaluating a cardiovascular condition not otherwise provided for, e.g. using combinations of techniques provided for in this group with electrocardiography or electroauscultation; Heart catheters for measuring blood pressure
- A61B5/026—Measuring blood flow
-
- A—HUMAN NECESSITIES
- A61—MEDICAL OR VETERINARY SCIENCE; HYGIENE
- A61B—DIAGNOSIS; SURGERY; IDENTIFICATION
- A61B5/00—Measuring for diagnostic purposes; Identification of persons
- A61B5/103—Detecting, measuring or recording devices for testing the shape, pattern, colour, size or movement of the body or parts thereof, for diagnostic purposes
- A61B5/11—Measuring movement of the entire body or parts thereof, e.g. head or hand tremor, mobility of a limb
- A61B5/1118—Determining activity level
-
- A—HUMAN NECESSITIES
- A61—MEDICAL OR VETERINARY SCIENCE; HYGIENE
- A61B—DIAGNOSIS; SURGERY; IDENTIFICATION
- A61B5/00—Measuring for diagnostic purposes; Identification of persons
- A61B5/145—Measuring characteristics of blood in vivo, e.g. gas concentration, pH value; Measuring characteristics of body fluids or tissues, e.g. interstitial fluid, cerebral tissue
- A61B5/14532—Measuring characteristics of blood in vivo, e.g. gas concentration, pH value; Measuring characteristics of body fluids or tissues, e.g. interstitial fluid, cerebral tissue for measuring glucose, e.g. by tissue impedance measurement
-
- A—HUMAN NECESSITIES
- A61—MEDICAL OR VETERINARY SCIENCE; HYGIENE
- A61B—DIAGNOSIS; SURGERY; IDENTIFICATION
- A61B5/00—Measuring for diagnostic purposes; Identification of persons
- A61B5/145—Measuring characteristics of blood in vivo, e.g. gas concentration, pH value; Measuring characteristics of body fluids or tissues, e.g. interstitial fluid, cerebral tissue
- A61B5/14542—Measuring characteristics of blood in vivo, e.g. gas concentration, pH value; Measuring characteristics of body fluids or tissues, e.g. interstitial fluid, cerebral tissue for measuring blood gases
-
- A—HUMAN NECESSITIES
- A61—MEDICAL OR VETERINARY SCIENCE; HYGIENE
- A61B—DIAGNOSIS; SURGERY; IDENTIFICATION
- A61B5/00—Measuring for diagnostic purposes; Identification of persons
- A61B5/48—Other medical applications
- A61B5/4806—Sleep evaluation
-
- A—HUMAN NECESSITIES
- A61—MEDICAL OR VETERINARY SCIENCE; HYGIENE
- A61B—DIAGNOSIS; SURGERY; IDENTIFICATION
- A61B5/00—Measuring for diagnostic purposes; Identification of persons
- A61B5/48—Other medical applications
- A61B5/4806—Sleep evaluation
- A61B5/4818—Sleep apnoea
-
- A—HUMAN NECESSITIES
- A61—MEDICAL OR VETERINARY SCIENCE; HYGIENE
- A61B—DIAGNOSIS; SURGERY; IDENTIFICATION
- A61B5/00—Measuring for diagnostic purposes; Identification of persons
- A61B5/68—Arrangements of detecting, measuring or recording means, e.g. sensors, in relation to patient
- A61B5/6801—Arrangements of detecting, measuring or recording means, e.g. sensors, in relation to patient specially adapted to be attached to or worn on the body surface
- A61B5/683—Means for maintaining contact with the body
-
- A—HUMAN NECESSITIES
- A61—MEDICAL OR VETERINARY SCIENCE; HYGIENE
- A61B—DIAGNOSIS; SURGERY; IDENTIFICATION
- A61B5/00—Measuring for diagnostic purposes; Identification of persons
- A61B5/72—Signal processing specially adapted for physiological signals or for diagnostic purposes
- A61B5/7203—Signal processing specially adapted for physiological signals or for diagnostic purposes for noise prevention, reduction or removal
-
- A—HUMAN NECESSITIES
- A61—MEDICAL OR VETERINARY SCIENCE; HYGIENE
- A61B—DIAGNOSIS; SURGERY; IDENTIFICATION
- A61B5/00—Measuring for diagnostic purposes; Identification of persons
- A61B5/72—Signal processing specially adapted for physiological signals or for diagnostic purposes
- A61B5/7221—Determining signal validity, reliability or quality
-
- A—HUMAN NECESSITIES
- A61—MEDICAL OR VETERINARY SCIENCE; HYGIENE
- A61B—DIAGNOSIS; SURGERY; IDENTIFICATION
- A61B5/00—Measuring for diagnostic purposes; Identification of persons
- A61B5/72—Signal processing specially adapted for physiological signals or for diagnostic purposes
- A61B5/7235—Details of waveform analysis
- A61B5/7253—Details of waveform analysis characterised by using transforms
- A61B5/7257—Details of waveform analysis characterised by using transforms using Fourier transforms
-
- A—HUMAN NECESSITIES
- A61—MEDICAL OR VETERINARY SCIENCE; HYGIENE
- A61M—DEVICES FOR INTRODUCING MEDIA INTO, OR ONTO, THE BODY; DEVICES FOR TRANSDUCING BODY MEDIA OR FOR TAKING MEDIA FROM THE BODY; DEVICES FOR PRODUCING OR ENDING SLEEP OR STUPOR
- A61M21/00—Other devices or methods to cause a change in the state of consciousness; Devices for producing or ending sleep by mechanical, optical, or acoustical means, e.g. for hypnosis
- A61M2021/0005—Other devices or methods to cause a change in the state of consciousness; Devices for producing or ending sleep by mechanical, optical, or acoustical means, e.g. for hypnosis by the use of a particular sense, or stimulus
- A61M2021/0022—Other devices or methods to cause a change in the state of consciousness; Devices for producing or ending sleep by mechanical, optical, or acoustical means, e.g. for hypnosis by the use of a particular sense, or stimulus by the tactile sense, e.g. vibrations
-
- A—HUMAN NECESSITIES
- A61—MEDICAL OR VETERINARY SCIENCE; HYGIENE
- A61M—DEVICES FOR INTRODUCING MEDIA INTO, OR ONTO, THE BODY; DEVICES FOR TRANSDUCING BODY MEDIA OR FOR TAKING MEDIA FROM THE BODY; DEVICES FOR PRODUCING OR ENDING SLEEP OR STUPOR
- A61M21/00—Other devices or methods to cause a change in the state of consciousness; Devices for producing or ending sleep by mechanical, optical, or acoustical means, e.g. for hypnosis
- A61M2021/0005—Other devices or methods to cause a change in the state of consciousness; Devices for producing or ending sleep by mechanical, optical, or acoustical means, e.g. for hypnosis by the use of a particular sense, or stimulus
- A61M2021/0027—Other devices or methods to cause a change in the state of consciousness; Devices for producing or ending sleep by mechanical, optical, or acoustical means, e.g. for hypnosis by the use of a particular sense, or stimulus by the hearing sense
-
- A—HUMAN NECESSITIES
- A61—MEDICAL OR VETERINARY SCIENCE; HYGIENE
- A61M—DEVICES FOR INTRODUCING MEDIA INTO, OR ONTO, THE BODY; DEVICES FOR TRANSDUCING BODY MEDIA OR FOR TAKING MEDIA FROM THE BODY; DEVICES FOR PRODUCING OR ENDING SLEEP OR STUPOR
- A61M21/00—Other devices or methods to cause a change in the state of consciousness; Devices for producing or ending sleep by mechanical, optical, or acoustical means, e.g. for hypnosis
- A61M2021/0005—Other devices or methods to cause a change in the state of consciousness; Devices for producing or ending sleep by mechanical, optical, or acoustical means, e.g. for hypnosis by the use of a particular sense, or stimulus
- A61M2021/0044—Other devices or methods to cause a change in the state of consciousness; Devices for producing or ending sleep by mechanical, optical, or acoustical means, e.g. for hypnosis by the use of a particular sense, or stimulus by the sight sense
-
- A—HUMAN NECESSITIES
- A61—MEDICAL OR VETERINARY SCIENCE; HYGIENE
- A61M—DEVICES FOR INTRODUCING MEDIA INTO, OR ONTO, THE BODY; DEVICES FOR TRANSDUCING BODY MEDIA OR FOR TAKING MEDIA FROM THE BODY; DEVICES FOR PRODUCING OR ENDING SLEEP OR STUPOR
- A61M21/00—Other devices or methods to cause a change in the state of consciousness; Devices for producing or ending sleep by mechanical, optical, or acoustical means, e.g. for hypnosis
- A61M2021/0005—Other devices or methods to cause a change in the state of consciousness; Devices for producing or ending sleep by mechanical, optical, or acoustical means, e.g. for hypnosis by the use of a particular sense, or stimulus
- A61M2021/0083—Other devices or methods to cause a change in the state of consciousness; Devices for producing or ending sleep by mechanical, optical, or acoustical means, e.g. for hypnosis by the use of a particular sense, or stimulus especially for waking up
Definitions
- the present invention relates to technology for acquiring useful information from a blood pressure waveform that has been measured.
- JP 2008-61824A discloses that a blood pressure waveform is measured using a tonometry method, and pieces of information such as an AI (Augmentation Index) value, a pulse wave period, a baseline fluctuation rate, sharpness, and an ET (Ejection Time) are acquired from the blood pressure waveform.
- AI Algmentation Index
- ET Ejection Time
- JP 2005-532111A discloses that a blood pressure waveform is measured using a wristwatch-type blood pressure meter, in which a mean arterial pressure, a mean systolic pressure, a mean diastolic pressure, a mean systolic pressure indicator, and a mean diastolic pressure indicator are calculated from the blood pressure waveform, and an alert is output when any of these values deviates from a reference value.
- US 2015/109124 A1 describes determining a cardiac state from neighboring RR intervals and extracting HRV (heart-rate variability) to detect that a subject is under higher pressure than usual.
- US 2014/303509 A1 discloses a technique for determining a stroke volume (SV) from measured blood pressure puls waves, wherein the SV and a cardiac index are displayed in a tabular form, a numerical form, or in histogram form for interpretation together with a pulse wave form.
- SV stroke volume
- the inventors of the present invention have worked hard to develop a blood pressure measurement device that can accurately measure an ambulatory blood pressure waveform for each heartbeat, and to put such a device into practical use. Through experiments performed on subjects during the development phase, the inventors have found that various kinds of useful information can be extracted from data regarding ambulatory blood pressure waveforms that have been consecutively measured.
- Afterload can be evaluated using a stroke volume (SV, which is also referred to as "cardiac output"), and preload can be evaluated using total peripheral resistance (TPR).
- SV stroke volume
- TPR total peripheral resistance
- the blood pressure measurement devices disclosed in the documents above measure afterload and preload for each heartbeat, and the subject needs to be in a resting state. Therefore, the devices cannot measure ambulatory blood pressure when the heart is actually under a load. There also is a problem in which the devices cannot perform measurement for a long period of time (e.g. overnight).
- the inventors of the present invention have found that it is possible to evaluate a cardiac state and the risk of cardiac diseases occurring, based on pieces of ambulatory blood pressure waveform data that have been consecutively measured.
- the present invention aims to provide a novel technology for evaluating a cardiac state.
- the present invention employs a biological information analysis device having the features of claim 1, a system having the features of claim 6, a program having the features of claim 7, and a method having the features of claim 8.
- a biological information analysis device includes: an indicator extraction unit configured to extract an indicator indicating a cardiac state (hereinafter referred to as a cardiac state indicator), from data regarding blood pressure waveforms that are consecutively measured by a sensor that is configured to be worn on a body part of a user and to be capable of non-invasively measuring a blood pressure waveform for each heartbeat; and a processing unit configured to output the indicator extracted by the indicator extraction unit.
- the indicator extraction unit is configured to extract a value of the cardiac load indicator for each heartbeat, from the data regarding blood pressure waveforms, and calculate the indicator indicating the cardiac state, based on characteristics related to distribution of values of the cardiac load indicator corresponding to a plurality of heartbeats.
- a stroke volume (SV) or a value determined based on the stroke volume is employed as the cardiac load indicator.
- the stroke volume is the volume of blood ejected from a ventricle per contraction, and is an indicator indicating preload.
- the stroke volume per heartbeat is also referred to as an instantaneous stroke volume.
- the indicator extraction unit is configured to determine the cardiac state indicator based on the frequency (the proportion of the frequency) with which the value of the instantaneous stroke volume exceeds a first threshold value in the distribution of values of the instantaneous stroke volume.
- the cardiac state indicator may be the frequency itself or a value determined based on the frequency.
- the first threshold value is determined based on the maximum value of the instantaneous stroke volume of the user. For example, a value within the range of 60% to 99%, preferably a value within the range of 70% to 90%, or further preferably a value within the range of 75% to 85% of the maximum instantaneous stroke volume may be employed as the first threshold value.
- the maximum instantaneous stroke volume may be determined as the maximum value of the instantaneous stroke volume acquired during the aforementioned consecutive measurement, or determined using another method.
- a state in which the instantaneous stroke volume is greater than the first threshold value is a state in which excessive preload has occurred, and therefore the frequency of occurrence thereof is related to the risk of cardiac expansion occurring. That is, it is possible to evaluate the risk of cardiac expansion occurring, using the cardiac state indicator calculated as described above.
- the indicator extraction unit is configured to determine the cardiac state indicator based on the frequency (the proportion of the frequency) with which the value of the instantaneous stroke volume falls below a second threshold value in the distribution of values of the instantaneous stroke volume.
- the cardiac state indicator may be the frequency itself or a value determined based on the frequency.
- the second threshold value to be used may be the same predetermined value for every user, or unique to each user. The second threshold value is determined based on the lower limit of a typical reference value.
- a state in which the instantaneous stroke volume is smaller than the second threshold value is a state in which preload is excessively low, and the frequency of occurrence thereof is related to the risk of a blood clot being formed. That is, it is possible to evaluate the risk of a blood clot being formed, using the cardiac state indicator calculated as described above.
- the indicator extraction unit in the present aspect may determine the cardiac state indicator based on the maximum value of the stroke volume (the maximum instantaneous stroke volume) in the distribution.
- the cardiac state indicator may be the maximum value itself or a value determined based on the maximum value. Note that it is preferable that blood pressure waveforms are measured by the sensor while the user is performing exercise at an intensity that is no less than a predetermined intensity.
- the maximum value (the saturation point) of the instantaneous stroke volume is related to the capacity of the heart, and a decrease therein is related to the risk of cardiac hypertrophy occurring. That is, it is possible to evaluate the risk of cardiac hypertrophy occurring, using the cardiac state indicator calculated as described above.
- a total peripheral resistance (TPR) or a value determined based on a total peripheral resistance is employed as the cardiac load indicator.
- Total peripheral resistance is the resistance against the flow of blood in a blood vessel, and is an indicator indicating afterload.
- Total peripheral resistance is also referred to as systemic vascular resistance (SVR).
- SVR systemic vascular resistance
- a total peripheral resistance per heartbeat is also referred to as an instantaneous total peripheral resistance or an instantaneous TPR.
- the indicator extraction unit in the present aspect is configured to determine the cardiac state indicator based on the frequency (the proportion of the frequency) with which the value of the instantaneous TPR exceeds a third threshold value in the distribution of values of the instantaneous TPR.
- the cardiac state indicator may be the frequency itself or a value determined based on the frequency.
- the third threshold value to be used may be the same predetermined value for every user, or unique to each user.
- the third threshold value is determined based on the upper limit of a typical reference value.
- a state in which the instantaneous total peripheral resistance is greater than the third threshold value is a state in which excessive afterload has occurred, and therefore the frequency of occurrence thereof is related to the risk of cardiac hypertrophy occurring. That is, it is possible to evaluate the risk of cardiac hypertrophy occurring, using the cardiac state indicator calculated as described above.
- the processing unit in the present aspect may be configured to output temporal changes in values of the cardiac load indicator corresponding to a plurality of heartbeats, and an indicator indicating the cardiac state.
- the processing unit in the present aspect may be configured to acquire, from a second sensor, data indicating at least one of the user's body movement and the state of the environment during measurement of blood pressure waveforms, and output temporal changes in the cardiac load indicator in association with at least one of the user's body movement and the state of the environment.
- Such an output makes it possible to ascertain the relationship between the cardiac load indicator and the state of the user or the environment, and makes it easier to identify the cause of an increase in cardiac load.
- the processing unit in the present aspect may be configured to acquire, from a second sensor, time-series data indicating the state of the environment during measurement of blood pressure waveforms, and output the cardiac load indicator and the state of the environment in association with each other.
- Data indicating the state of the environment may be any data as long as it is data regarding an influencing factor that is presumably related to cardiac load or the risk of a cardiac disease occurring.
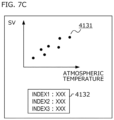
- the processing unit may output time-series data regarding the cardiac load indicator and time-series data regarding the influencing factor superimposed on each other. Also, the processing unit may output a graph that shows an influencing factor and a cardiac load indicator at the same point in time as a first coordinate value and a second coordinate value, respectively. Such an output makes it easier to identify the cause of an increase in cardiac load.
- a biological information analysis system is a system including: a sensor that is configured to be worn on a body part of a user and to be capable of non-invasively measuring a blood pressure waveform for each heartbeat; and a biological information analysis device configured to analyze biological information, using data regarding blood pressure waveforms consecutively measured by the sensor.
- a program according to the present invention is a program that causes a processor to function as the indicator extraction unit and the processing unit of the biological information analysis device.
- the present invention can be interpreted as a biological information analysis device or system that is provided with at least one of the above-described configurations or at least one of the above-described functions.
- the present invention can also be interpreted as a biological information analysis method that includes at least part of the above-described processing, or a program that causes a computer to execute such a method, or a computer-readable recording medium on which such a program is recorded in a non-transitory manner.
- the present invention can be formed by combining the above-described configurations and the above-described kinds of processing with each other unless no technical inconsistency occurs.
- FIG. 1 shows a schematic external configuration of a biological information analysis system 10 according to an embodiment of the present invention.
- FIG. 1 shows a state in which the biological information analysis system 10 is worn on the left wrist.
- the biological information analysis system 10 includes a main body 11 and a belt 12 that is fixed to the main body 11.
- the biological information analysis system 10 is a so-called wearable device, and is worn such that the main body 11 is in contact with the skin on the palm side of the wrist, and the main body 11 is located over a radial artery TD that lies beneath the skin.
- the device is configured to be worn on the radial artery TD in the present embodiment, the device may be configured to be worn on another superficial artery.
- FIG. 2 is a block diagram showing a hardware configuration of the biological information analysis system 10.
- the biological information analysis system 10 includes a measurement unit 2 and the biological information analysis device 1.
- the measurement unit 2 is a device that performs measurement to acquire information that is used to analyze biological information, and includes a blood pressure measurement unit 20, a body movement measurement unit 21, and an environment measurement unit 22.
- the configuration of the measurement unit 2 is not limited to that shown in FIG. 2 .
- a unit that measures biological information other than blood pressure or a body movement e.g. body temperature, blood-sugar level, or brain waves
- any unit that is not used in the example described below is not an essential component, and may be omitted from the biological information analysis system 10.
- the biological information analysis device 1 is a device that analyzes biological information based on information acquired from the measurement unit 2, and includes a control unit 23, an input unit 24, an output unit 25, a communication unit 26, and a storage unit 27.
- the units 20 to 27 are connected to each other so that signals can be exchanged between them via a local bus or other signal lines.
- the biological information analysis system 10 also includes a power supply (a battery), which is not shown.
- the blood pressure measurement unit 20 measures a pressure pulse wave from the radial artery TD by using a tonometry method.
- the tonometry method is for forming a flat area in the artery TD by pressing the artery from the skin with appropriate pressure, adjusting the balance between the internal pressure and the external pressure of the artery, and non-invasively measuring the pressure pulse wave using a pressure sensor.
- the body movement measurement unit 21 includes a tri-axis acceleration sensor, and measures the movement of the user's body (body movement) using this sensor.
- the body movement measurement unit 21 may include a circuit that converts the format of an output from the tri-axis acceleration sensor into a format that is readable to the control unit 23.
- the environment measurement unit 22 measures environmental information that may affect mental and physical conditions of the user (in particular the blood pressure).
- the environment measurement unit 22 may include, for example, an atmospheric temperature sensor, a humidity sensor, an illuminance sensor, an altitude sensor, a position sensor, and so on.
- the environment measurement unit 22 may include a circuit that converts the format of outputs from these sensors and so on into a format that is readable to the control unit 23.
- the control unit 23 performs various kinds of processing, such as controlling each unit of the biological information analysis system 10, acquiring data from the measurement unit 2, storing the acquired data in the storage unit 27, processing and analyzing data, and inputting and outputting data.
- the control unit 23 includes a hardware processor (hereinafter referred to as the "CPU") a ROM (Read Only Memory), a RAM (Random Access Memory), and so on. Processing that is performed by the control unit 23, which will be described later, is realized by the CPU reading and executing a program stored in the ROM or the storage unit 27.
- the RAM functions as a work memory that is used by the control unit 23 when performing various kinds of processing.
- Each of the constituent components of the embodiment such as a measurement unit, an indicator extraction unit, a processing unit, a determination unit, a risk database, an input unit, an output unit, a case database, and so on may be implemented as pieces of hardware in the biological information analysis system 10.
- the indicator extraction unit, the processing unit, and the determination unit may receive an executable program stored in the storage unit 27, and execute the program.
- the indicator extraction unit, the processing unit, and the determination unit may receive data from the blood pressure measurement unit 20, the body movement measurement unit 21, the environment measurement unit 22, the input unit 24, the output unit 25, the communication unit 26, the storage unit 27, and so on as required.
- Databases such as the risk database and the case database may be implemented using the storage unit 27 and so on, and store pieces of information that are arranged such that a data search and data accumulation can be easily performed.
- the configuration, operations, and so on of the biological information analysis system 10 are disclosed in JP 2016-082069A .
- the configuration, operations, and so on of the blood pressure measurement unit are disclosed in JP 2016-087003A .
- the input unit 24 provides an operation interface for the user.
- an operation button for example, an operation button, a switch, a touch panel, and so on may be used.
- the output unit 25 provides an interface that outputs information to the user.
- a display device such as a liquid crystal display
- an audio output device or a beeper that outputs information using audio
- an LED that outputs information by blinking
- a vibration device that outputs information by vibrating, and so on may be used.
- the communication unit 26 performs data communication with another device. Any data communication method such as a wireless LAN or Bluetooth (registered trademark) may be used.
- the storage unit 27 is a storage medium that can store data and from which data can be read out, and stores programs that are to be executed by the control unit 23, pieces of measurement data acquired from the measurement units, and various kinds of data acquired by processing the pieces of measurement data, and so on.
- the storage unit 27 is a medium that accumulates pieces of information that are to be stored, through an electrical, magnetic, optical, mechanical, or chemical action. For example, a flash memory is used.
- the storage unit 27 may be a portable unit such as a memory card, or built into the biological information analysis system 10.
- At least one unit or all units out of the body movement measurement unit 21, environment measurement unit 22, the control unit 23, the input unit 24, the output unit 25, and the storage unit 27 may be configured as a device that is separate from the main body 11. That is, as long as the blood pressure measurement unit 20 and the main body 11 that incorporates a circuit that controls the blood pressure measurement unit 20 are configured to be wearable on a wrist, the configurations of other units can be freely designed. If this is the case, the main body 11 cooperates with another unit via the communication unit 26.
- the functions of the control unit 23, the input unit 24, and the output unit 25 may be realized using a smartphone application, and required data may be acquired from an activity monitor that has the functions of the body movement measurement unit 21 and the environment measurement unit 22.
- a sensor that measures biological information other than blood pressure may be provided.
- a sleep sensor a pulse oximeter (SpO 2 sensor), a respiration sensor (a flow sensor), a blood-sugar level sensor, and the like may be combined.
- SpO 2 sensor pulse oximeter
- respiration sensor a flow sensor
- blood-sugar level sensor a blood-sugar level sensor
- the sensor (the blood pressure measurement unit 20) that measures blood pressure and the component (including the control unit 23 and so on) that performs processing to analyze blood pressure waveform data
- the component (including the control unit 23 and so on) that performs processing to analyze biological information
- the device that includes the combination of the measurement unit and the biological information analysis device is referred to as a biological information analysis system.
- these names are given for descriptive purposes, and the measurement unit and the component that performs processing to analyze biological information may be referred to as a biological information analysis device as a whole, or other names may be used.
- FIG. 3 is a cross-sectional view schematically showing the configuration of the blood pressure measurement unit 20 and a state in which measurement is performed.
- the blood pressure measurement unit 20 includes a pressure sensor 30 and a pressurizing mechanism 31 for pressing the pressure sensor 30 against a wrist.
- the pressure sensor 30 includes a plurality of pressure detection elements 300.
- the pressure detection elements 300 detect pressure and convert the pressure into an electrical signal.
- elements that utilize a piezoresistive effect may be preferably used.
- the pressurizing mechanism 31 includes, for example, an air bag and a pump that adjusts the internal pressure of the air bag. As a result of the control unit 23 controlling the pump to increase the internal pressure of the air bag, the air bag expands and the pressure sensor 30 is pressed against the surface of the skin.
- the pressurizing mechanism 31 may be any mechanism as long as it can adjust the pressing force of the pressure sensor 30 applied to the surface of the skin, and is not limited to a mechanism that uses an air bag.
- the control unit 23 controls the pressurizing mechanism 31 of the blood pressure measurement unit 20 to keep the pressing force of the pressure sensor 30 in an appropriate state (a tonometry state). Then, pressure signals detected by the pressure sensor 30 are sequentially acquired by the control unit 23. Pressure signals acquired from the pressure sensor 30 are generated by digitizing analogue physical amounts (e.g. voltage values) output by the pressure detection elements 300, through an A/D converter circuit or the like that employs a well-known technology. Preferable analogue values such as current values or resistance values may be employed as the analogue physical amounts, depending on the type of the pressure detection elements 300.
- analogue physical amounts e.g. voltage values
- Preferable analogue values such as current values or resistance values may be employed as the analogue physical amounts, depending on the type of the pressure detection elements 300.
- Signal processing such as the aforementioned A/D conversion may be performed using a predetermined circuit provided in the blood pressure measurement unit 20, or performed by another unit (not shown) provided between the blood pressure measurement unit 20 and the control unit 23.
- Each pressure signal acquired by the control unit 23 corresponds to an instantaneous value of the internal pressure of the radial artery TD. Therefore, it is possible to acquire time-series data regarding blood pressure waveforms by acquiring pressure signals with time granularity and continuity that make it possible to ascertain a blood pressure waveform for each heartbeat.
- the control unit 23 stores the pressure signals sequentially acquired from the pressure sensor 30, in the storage unit 27, together with information regarding points in time at which the pressure signals were measured.
- the control unit 23 may store the acquired pressure signals in the storage unit 27 without change, or store the pressure signals in the storage unit 27 after performing required signal processing on the pressure signals.
- Required signal processing includes, for example, processing that is performed to calibrate each pressure signal such that the amplitude of the pressure signal matches the blood pressure value (e.g. the brachial blood pressure), processing that is performed to reduce or remove noise in each pressure signal, and so on.
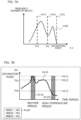
- FIG. 4 shows a blood pressure waveform measured by the blood pressure measurement unit 20.
- the horizontal axis indicates time and the vertical axis indicates blood pressure.
- the sampling frequency may be set to any value, it is preferably set to be no less than 100 Hz so that characteristics of the shape of a waveform corresponding to one heartbeat can be reproduced.
- the period of one heartbeat is approximately one second, and therefore approximately one hundred or more data points can be acquired on a waveform corresponding to one heartbeat.
- the blood pressure measurement unit 20 according to the present embodiment is advantageous in terms of the following.
- the blood pressure measurement unit 20 can measure a blood pressure waveform for each heartbeat. As a result, it is possible to acquire various indicators related to blood pressure, the state of the heart, cardiovascular risks, and so on, based on the characteristics of the shape of the blood pressure waveform. In addition, it is possible to monitor for instantaneous values of blood pressure. Therefore, it is possible to instantaneously detect a blood pressure surge (a sudden rise in the blood pressure value), and to detect changes in blood pressure and irregularities in a blood pressure waveform that may occur in a very short period of time (corresponding to one to several heartbeats) without missing them.
- a blood pressure surge a sudden rise in the blood pressure value
- a blood pressure meter As a portable blood pressure meter, a blood pressure meter that is to be worn on a wrist or an upper arm and employs an oscillometric method to measure blood pressure has come into practical use.
- a conventional portable blood pressure meter can only measure the mean value of blood pressure based on changes in the internal pressure of a cuff during a period of several seconds to a dozen or so seconds corresponding to a plurality of heartbeats, and cannot acquire time-series data regarding a blood pressure waveform for each heartbeat, unlike the blood pressure measurement unit 20 according to the present embodiment.
- the blood pressure measurement unit 20 can record time-series data regarding blood pressure waveforms. By acquiring time-series data regarding blood pressure waveforms, and, for example, discerning characteristics of the blood pressure waveform related to temporal changes, or performing a frequency analysis on the time-series data to extract a specific frequency component, it is possible to acquire various indicators related to blood pressure, the state of the heart, cardiovascular risks, and so on.
- the device employs a portable (wearable) type configuration, and less burden is placed on the user during measurement. Therefore, continuous measurement for a long time, and even 24-hour blood pressure monitoring, can be relatively easily performed. Also, since the device is of a portable type, changes in not only blood pressure under resting conditions, but also an ambulatory blood pressure (for example, during daily life or exercise) can be measured. As a result, it is possible to grasp how blood pressure is affected by behaviours in daily life (such as sleeping, eating, commuting, working, and taking medicine) and exercise, for example.
- the blood pressure measurement unit 20 can be easily combined or linked with other sensors. For example, it is possible to make an evaluation of a cause-effect relationship or a composite evaluation with information that can be acquired by other sensors (e.g. a body movement, environmental information such as an atmospheric temperature, biological information such as SpO 2 and respiration information).
- other sensors e.g. a body movement, environmental information such as an atmospheric temperature, biological information such as SpO 2 and respiration information.
- FIG. 5 is a block diagram illustrating processing that is performed by the biological information analysis device 1.
- the biological information analysis device 1 includes an indicator extraction unit 50 and a processing unit 51.
- processing performed by the indicator extraction unit 50 and the processing unit 51 may be realized by the control unit 23 executing a program that is required for the processing.
- the program may be stored in the storage unit 27.
- the control unit 23 executes the required program, the subject program stored in the ROM or storage unit 27 is loaded to the RAM. Then, the control unit 23 interprets and executes the program loaded to the RAM, using the CPU, to control each constituent component.
- At least one or all of the processing procedures executed by the indicator extraction unit 50 and the processing unit 51 may be realized using a circuit such as an ASIC or an FPGA.
- at least one or all of the processing procedures executed by the indicator extraction unit 50 and the processing unit 51 may be realized using a computer (e.g. a smartphone, a tablet terminal, a personal computer, or a cloud server) that is separate from the main body 11.
- the indicator extraction unit 50 acquires time-series data regarding blood pressure waveforms, which have been consecutively measured by the blood pressure measurement unit 20, from the storage unit 27.
- the indicator extraction unit 50 extracts, from the acquired time-series data regarding blood pressure waveforms, indicators that are related to characteristics of the blood pressure waveforms.
- characteristics of a blood pressure waveform include, for example, characteristics of the shape of a blood pressure waveform corresponding to one heartbeat, temporal changes in a blood pressure waveform, and frequency components of a blood pressure waveform.
- characteristics of a blood pressure waveform are not limited to those listed above.
- the extracted indicators are output to the processing unit 51.
- characteristics and indicators regarding a blood pressure waveform there are various characteristics and indicators regarding a blood pressure waveform, and the characteristics and indicators that are to be extracted may be designed or selected as appropriate according to the purpose of processing that is to be performed by the processing unit 51. Characteristics and indicators that can be extracted from measurement data regarding blood pressure waveforms according to the present embodiment will be described later in detail.
- the indicator extraction unit 50 may use measurement data that has been acquired by the body movement measurement unit 21 and/or measurement data that has been acquired by the environment measurement unit 22, in addition to measurement data regarding blood pressure waveforms. Also, although not shown in the drawings, pieces of measurement data that have been acquired by a sleep sensor, a SpO 2 sensor, a respiration sensor (a flow sensor), a blood-sugar level sensor, and the like may be combined with one another. By performing complex analysis on a plurality of kinds of measurement data acquired by a plurality of sensors, it is possible to perform more advanced information analysis of a blood pressure waveform.
- apnea examples include obstructive sleep apnea, central sleep apnea, and mixed sleep apnea.
- the processing unit 51 receives the indicators extracted by the indicator extraction unit 50.
- the processing unit 51 performs processing that is based on the received indicators.
- Various kinds of processing can be conceived of as processing that is based on the indicators.
- the processing unit 51 may provide the values of the extracted indicators or changes in the values to a user, a doctor, a public health nurse, or the like to prompt the utilization of the indicators in the fields of health care, treatment, health guidance, and so on.
- the processing unit 51 may estimate respiratory risks from the extracted indicators, or present guidelines for health maintenance or risk mitigation.
- the processing unit 51 may inform the user or his/her doctor, or perform control to prevent the user from performing an action that places burden on his/her heart and so on, or to prevent a cardiovascular event from occurring.
- FIG. 6 shows a waveform (a blood pressure waveform) of a pressure pulse wave from a radial artery corresponding to one heartbeat.
- the horizontal axis indicates time t (msec) and the vertical axis indicates blood pressure BP (mmHg).
- a blood pressure waveform is the waveform of a composite wave constituted by an "ejection wave” that is generated when the heart contracts and pumps out blood, and a “reflection wave” that is generated when an ejection wave is reflected at a branch point of a peripheral vessel or an artery.
- the following shows examples of characteristic points that can be extracted from a blood pressure waveform corresponding to one heartbeat.
- the indicator extraction unit 50 may use any algorithm to detect the above-described characteristic points.
- the indicator extraction unit 50 may perform computations to obtain an nth order differential waveform of a blood pressure waveform, and detect the zero-crossing points to extract the characteristic points (the inflection points) of the blood pressure waveform (the points F1, F2, F4, F5, and F6 can be detected from the first order differential waveform, and the point F3 can be detected from the second order differential waveform or the fourth order differential waveform).
- the indicator extraction unit 50 may read out, from the storage unit 27, a waveform pattern on which the characteristic points have been arranged in advance, and perform fitting of the waveform pattern to the target blood pressure waveform to specify the respective positions of the characteristic points.
- the indicator extraction unit 50 performs computations based on time t and pressure BP of each of the above-described characteristic points F1 to F6, and can thus obtain various kinds of information (values, characteristic amounts, indicators, etc.) from the blood pressure waveform of one heartbeat.
- information values, characteristic amounts, indicators, etc.
- tx and BPx respectively represent time and blood pressure corresponding to a characteristic point Fx.
- Basic statistics of these pieces of information can also be used as indicators.
- Basic statistics include, for example, representative values (a mean value, a median value, a mode value, the maximum value, the minimum value, and so on) and the degree of scatter (dispersion, a standard deviation, a coefficient of variation, and so on).
- Temporal changes in these pieces of information can also be used as indicators.
- the indicator extraction unit 50 can also acquire an indicator called BRS (Baroreflex Sensitivity) by performing computations on pieces of heartbeat information.
- BRS Baroreflex Sensitivity
- This indicator indicates the ability to regulate blood pressure to be constant.
- methods for calculating the indicator include a spontaneous sequence method. This is a method for only extracting a sequence in which the maximum blood pressure SBP and the pulse wave interval TA consecutively rise or fall over the period of three or more heartbeats in synchronization with each other, plotting the maximum blood pressure SBP and the pulse wave interval TA onto a two-dimensional plane, and defining the inclination of the regression line obtained through a least squares method as the BRS.
- the present example is an example in which a cardiac state and the risk of a cardiac disease occurring are represented as indicators based on instantaneous stroke volumes corresponding to blood pressure waveforms that are consecutively measured.
- a stroke volume (SV, which is also referred to as "cardiac output”) is known as an evaluation indicator that indicates a cardiac state and the risk of cardiac hypertrophy or cardiac expansion occurring.
- the stroke volume (SV) also indicates cardiac preload.
- Stiffness PP/Stiffness.
- ⁇ P denotes the difference between the value of blood pressure at the end of ejection and the value of blood pressure at the start of ejection
- P AV denotes the mean value of blood pressure during ejection
- T denotes the duration of ejection.
- the stroke volume cannot be measured for each heartbeat (spot blood pressure meters), accuracy is not satisfactory (pulse oximeters), and ambulatory blood pressure cannot be measured for a long period of time (e.g. overnight) (conventional devices using an invasive method or a tonometry method). Therefore, the present example proposes a method for easily ascertaining the cardiac state and the risk of a cardiac disease occurring, by using the stroke volume of every single beat measured over a long period of time.
- blood pressure waveform data is measured over a long period of time (e.g. overnight, or over several days), and the SV value of every single beat is obtained, and indicators that represent a cardiac state (cardiac state indicators) are obtained based on the distribution of SV values.
- the cardiac state indicators can be regarded as indicators that indicate the risk of a cardiac disease occurring.
- the SV value per heartbeat is an indicator that represents instantaneous cardiac load, and is an example of an instantaneous cardiac load indicator.
- the SV value per heartbeat is also referred to as an instantaneous SV value (an instantaneous stroke volume).
- cardiac state indicators are calculated based on the distribution of instantaneous SV values.
- FIG. 7(A) is a graph 4100 showing the distribution of instantaneous SV values measured in a measurement period.
- a dotted line 4101 in the figure represents the maximum value (saturation point) of the SV value of a user that is the subject of measurement. It is preferable that the SV value at the saturation point has been determined in advance by performing measurement under an exercise load. Alternatively, if the user performs exercise at more than a predetermined intensity in the measurement period, the maximum value of the SV value in the period may be employed as the saturation point.
- Exercise at a predetermined intensity is exercise at an intensity that saturates the SV value of a user that is the subject of measurement.
- a first cardiac state indicator INDEX 1 in the present example indicates the proportion of the frequency of SV values that are higher than a threshold value Th1. That is, the indicator INDEX 1 indicates the proportion of the frequency of the SV values between the dotted line 4101 and a dotted line 4102, relative to the overall frequency.
- the threshold value Th1 can be determined based on the SV value at the saturation point, and can be 80% of the SV value at the saturation point, for example. It can be said that the indicator INDEX1 indicates the proportion of the frequency of excessive preload. Therefore, it is possible to ascertain the risk of cardiac expansion occurring, based on the magnitude of the indicator INDEX1.
- the threshold value Th1 is not necessarily 80% of the SV value at the saturation point, and may be a value within the range of 70% to 90% of the SV value at the saturation point, or another value.
- a second cardiac state indicator INDEX2 in the present example indicates the proportion of the frequency of SV values that are lower than a threshold value Th2. That is, the indicator INDEX2 indicates the proportion of the frequency of the SV values that are no greater than the value indicated by a dotted line 4103, relative to the overall frequency.
- the threshold value Th2 is determined based on the lower limit of a typical reference value, and may be the same value for every user. For example, the threshold value Th2 may be a value that is based on 60 ml/beat. It can be said that the indicator INDEX2 indicates the proportion of the frequency of a drop in preload. Therefore, it is possible to ascertain the risk of a blood clot being formed, based on the magnitude of the indicator INDEX2.
- a third indicator INDEX3 in the present example indicates the SV value at the saturation point (the maximum instantaneous stroke volume).
- the saturation point SV value has been measured in advance by performing measurement under an exercise load.
- the saturation point SV value may be measured while the user is performing exercise during a measurement period, at an intensity that is no less than a predetermined intensity, and determined as the maximum value of the instantaneous SV value.
- the stroke volume SV is saturated when the expansion of the myocardial fibers exceeds the limit. If the saturation point SV value is small, it can be determined that the limit of expansion of the cardiac muscle has decreased and the capacity of the heart has decreased.
- the threshold value SV Th can be determined based on the lower limit of a typical reference value.
- the threshold value SV Th may be a value that is based on 60 ml/beat.
- a histogram of SV values as shown in FIG. 7(A) or the above-described indicators INDEX1 to INDEX3 that can be obtained from the histogram are displayed through screen display.
- a graph 4110 shows temporal changes in the SV value
- a dotted line 4111 shows the maximum value of the SV value
- a dotted line 4112 shows the threshold value Th1
- a dotted line 4113 shows the threshold value Th2.
- a display 4120 shows the values of the cardiac state indicators INDEX 1 to INDEX3.
- the values of the indicators INDEX1 to INDEX3 may be displayed in a different display mode with a different color or size so as to be emphasized, or displayed with a message indicating that the risk is high.
- the values of the indicators INDEX1 to INDEX3 may be displayed only when it has been determined that the risk is high.
- Such graph display makes it easier to ascertain the cardiac state of the user and the risk of a cardiac disease occurring, and also makes it easier to ascertain when a change in the stroke volume that may cause a cardiac disease has occurred.
- the instantaneous SV value is displayed in association with the state of the user and the state of the environment.
- a graph showing temporal changes in the SV value is displayed in a mode in which a bedtime period 4114 and a high-temperature period 4115 are discernible. This makes it possible to determine a probable cause of a change in the SV value. For example, it is possible to determine that a cause of an increase in the SV value during the bedtime period is a respiratory abnormality, and a cause of a decrease in the SV value during the high-temperature period is dehydration.
- the graph is useful for prevention and treatment.
- a sleeping state can be identified based on measurement data or measurement time data acquired by the body movement measurement unit 21. Temperature information such as that indicating a high temperature can be identified based on measurement data acquired by the environment measurement unit 22. These pieces of information may be acquired based on information that has been input by the user or a third party (such as a doctor) to the input unit 24.
- measurement data displayed in the form of a scatter diagram that is defined by an axis indicating the SV value and an axis indicating the influencing factor, as shown in FIG. 7(C) is also useful.
- a scatter diagram in which each of the plotted points has an SV value and a measurement value of the influencing factor corresponding to the same point in time as the x coordinate value and the y coordinate value, respectively may be used.
- Such display is useful when determining whether or not the influencing factor thus displayed is a cause of a cardiac load. Therefore, by displaying a plurality of influencing factors as in FIG. 7(C) , it is possible to identify the cause of a cardiac load.
- FIG. 8 is a flowchart for processing according to the present example.
- step S101 the user's data regarding consecutive blood pressure waveforms is measured. That is, the user goes about his/her life as usual wearing the biological information analysis system 10.
- the blood pressure measurement unit 20 measures blood pressure waveforms, and store the measurement data in the local storage unit 27 or in a memory in a cloud server by transmitting the measurement data using the communication unit 26.
- the body movement measurement unit 21 and the environment measurement unit 22 stores data acquired from sensors in a memory in a similar manner.
- the length of the measurement period in step S101 is not specifically limited, and may be one night, several days, or longer.
- the output unit 25 may output, to the user, an instruction to perform exercise at least once in the measurement period, at an intensity that is no less than a predetermined intensity.
- the indicator extraction unit 50 calculates an SV value for each heartbeat, as an instantaneous cardiac load indicator. Specifically, the indicator extraction unit 50 first acquires measurement data regarding the measured blood pressure waveforms from the storage unit 27 or a cloud server, and divides the data into pieces that each correspond to one beat. This division can be realized by calculating ejection start points (the point F1 in FIG. 6 ) from the blood pressure waveform data, and determining data between two ejection start points that are adjacent to each other as data corresponding to one beat. Then, the indicator extraction unit 50 calculates an SV value for each beat.
- the indicator extraction unit 50 calculates a cardiac state indicator based on the distribution of SV values that each correspond to one heartbeat. More specifically, the indicator extraction unit 50 calculates, as the indicator INDEX1, the proportion of the number of beats that correspond to an SV value that is no less than the threshold value Th1, relative to the total number of beats. Also, the indicator extraction unit 50 calculates, as the indicator INDEX2, the proportion of the number of beats that correspond to an SV value that is less than the threshold value Th2, relative to the total number of beats. Also, the indicator extraction unit 50 calculates, as the indicator INDEX3, the maximum value of the instantaneous SV value, i.e. the saturation point SV value, in the measurement data.
- the INDEX1 and the INDEX2 are not necessarily the above-described proportions themselves, and may be values determined based on the proportions.
- the INDEX3 is not necessarily the saturation SV value, and may be a value determined based on the saturation SV value.
- step S104 the processing unit 51 outputs an image display that includes the cardiac state indicators INDEX1 to INDEX3 calculated in step S103.
- the processing unit 51 generates image data that includes the display 4120 that indicates the numerical values of the cardiac state indicators INDEX1 to INDEX3, and the graph 4110 that indicates temporal changes in the instantaneous SV value during the measurement period, and outputs the image data using the output unit 25.
- the horizontal axis and the vertical axis of the graph 4110 respectively indicate time and the SV value (the cardiac load indicator).
- the graph is displayed in a mode in which the threshold values Th1 and Th2 are discernible. Therefore, the user or a doctor or the like can easily ascertain a period of time in which cardiac load increases or decreases.
- the processing unit 51 may specify a period of time in which the user is in a specific state, based on the measurement data (and periods of time) acquired by the body movement measurement unit 21, and display a graph in a mode in which the period of time is discernible.
- the period 4114 is a period of time in which the user's body moves less frequently, and is a night-time period. Therefore, the processing unit 51 may specify the period 4114 as a bedtime period.
- the processing unit 51 may specify a period of time in which the user is in a moving state, based on a large amount of body movement of the user, or specify, as a wake-up time, a point in time at which the user's body movement starts increasing from that in the sleeping state.
- the processing unit 51 may specify a period of time in which the environment is in a specific state, based on the measurement data acquired by the environment measurement unit 22, and, for example, display a graph in a mode in which the period of time is discernible.
- the processing unit 51 may acquire an environmental temperature, and specify, as a high-temperature state period, a period of time in which the environmental temperature is no less than a threshold value.
- the processing unit 51 may display the cardiac state indicators INDEX1 to INDEX3 in a mode other than numerical values. Also, the processing unit 51 may display, for example, a message indicating that the risk of cardiac expansion occurring is high if the indicator INDEX1 is no less than a threshold value, a message indicating that the risk of a blood clot being formed if the indicator INDEX2 is no greater than a threshold value, and a message indicating that the risk of cardiac hypertrophy occurring is high if the indicator INDEX3 is no greater than a threshold value.
- FIG. 7(C) is an example of an output screen that includes a scatter diagram 4131 showing a relationship between an influencing factor (the temperature in this example) and the SV value, and a display 4132 showing the cardiac state indicators INDEX1 to INDEX3.
- the processing unit 51 acquires an SV value and measurement data regarding the temperature corresponding to the same point in time, from the storage unit 27 (or a cloud server), and generates image data for a scatter diagram 4131 that includes a plurality of points each having a temperature value and an SV value as the x coordinate value and the y coordinate value, respectively.
- the cardiac state indicators INDEX1 to INDEX3 are the same as those in FIG. 7(B) , and therefore descriptions thereof are omitted.
- the present example it is possible to make it easier to ascertain the cardiac state and the risk of a cardiac disease occurring, and also identify a cause that increase the risk of a cardiac disease occurring, using the SV value of every single beat measured during a long period of time.
- blood pressure waveform data of each beat is available, it is possible to ascertain an instantaneous cardiac load at the time a sharp change occurs in blood pressure.
- the present example is an example in which the risk of a cardiac disease occurring is represented as an indicator.
- Total peripheral resistance is known as an evaluation indicator indicating a cardiac state and the risk of cardiac hypertrophy occurring.
- the total peripheral resistance (TPR) is also an indicator that indicates cardiac afterload.
- MBP denotes a mean blood pressure
- PP denotes a pulse pressure
- PR denotes a pulse rate
- Stiffness denotes an aortic stiffness (the inverse of compliance C).
- the present example proposes a method for easily ascertaining a cardiac state and the risk of a cardiac disease occurring, by using the total peripheral resistance of every single beat measured over a long period of time.
- blood pressure waveform data is measured over a long period of time (e.g. overnight, or over several days), and the TPR value of every single beat is obtained, and indicators that represent a cardiac state (cardiac state indicators) are obtained based on the distribution of TPR values.
- the cardiac state indicators can be regarded as indicators that indicate the risk of a cardiac disease occurring.
- the TPR value per heartbeat is an indicator that represents instantaneous cardiac load, and is an example of an instantaneous cardiac load indicator.
- the TPR value per heartbeat is also referred to as an instantaneous TPR value (an instantaneous total peripheral resistance).
- cardiac state indicators are calculated based on the distribution of instantaneous TPR values.
- FIG. 9(A) is a graph 4200 showing the distribution of instantaneous TPR values measured in a measurement period.
- a cardiac state indicator INDEX4 in the present example indicates the proportion of the frequency of TPR values that are no less than a threshold value Th3. That is, the indicator INDEX4 indicates the proportion of the frequency of the TPR values that are no less than the value indicated by a dotted line 4201, relative to the overall frequency.
- Th3 can be determined based on the upper limit of a typical reference value. For example, the threshold value Th3 may be 1200 dynes ⁇ sec/cm 5 .
- a TPR value no less than the threshold value Th3 indicates that excessive afterload has occurred. Therefore, it can be said that the indicator INDEX4 indicates the proportion of the frequency of excessive afterload. Therefore, it is possible to ascertain the risk of cardiac hypertrophy occurring, based on the magnitude of the indicator INDEX4.
- a histogram of TPR values as shown in FIG. 9(A) or the above-described indicator INDEX4 that can be obtained from the histogram is displayed through screen display.
- the above-described indicator INDEX4 is displayed together with a graph showing temporal changes in the TPR value as shown in FIG. 9(B) .
- a graph 4210 shows temporal changes in the TPR value.
- a display 4220 shows the value of the cardiac state indicator INDEX4. If it has been determined that the risk of a cardiac disease occurring is high, the value of the indicator INDEX4 may be displayed in a different display mode with a different color or size so as to be emphasized, or displayed with a message indicating that the risk is high. Alternatively, the value of the indicator INDEX 4 may be displayed only when it has been determined that the risk is high.
- Such graph display makes it easier to ascertain the cardiac state of the user and the risk of a cardiac disease occurring, and also makes it easier to ascertain when a change in the TPR value that may cause a cardiac disease has occurred.
- a graph is displayed in a mode in which a bedtime 4214 and a wake-up time 4215 are discernible as shown in FIG. 9(B) .
- a meal period, an exercise period, and on are displayed.
- measurement data in the form of a scatter diagram that is defined by an axis indicating the TPR value and an axis indicating the influencing factor. Such display is useful for identification of the cause of cardiac load.
- influencing factors such as the wake-up time, the bedtime, and the atmospheric temperature can be acquired from the body movement measurement unit 21 and the environment measurement unit 22, or acquired based on an input from the user to the input unit 24.
- Example 1 Processing in the present example is performed according to the flowchart shown in FIG. 8 , as in Example 1. The following mainly describes differences from Example 1.
- step S101 is the same as that in Example 1.
- Step S102 is the same as that in Example 1 in that a blood pressure waveform is divided into pieces of data that each correspond to one beat.
- an instantaneous cardiac load indicator that is calculated from a piece of data corresponding to one beat is different from that in Example 1.
- the indicator extraction unit 50 calculates a TPR value for each heartbeat, as an instantaneous cardiac load indicator.
- step S103 the indicator extraction unit 50 calculates, as the indicator INDEX4, the proportion of the number of beats that correspond to a TPR value that is no less than the threshold value Th3, relative to the total number of beats.
- step S104 the processing unit 51 outputs a screen display as shown in FIG. 9(B) .
- the processing unit 51 displays a message indicating that there is a risk of cardiac hypertrophy occurring.
- the processing unit 51 generates a display screen in a mode in which points in time at which the user performed particular operations (such as the bedtime and the wake-up time) are discernible.
- the processing unit 51 may generate a display screen in a mode in which points in time at which the user or the environment is in a particular state are discernible as in Example 1.
- the present example it is possible to make it easier to ascertain the risk of a cardiac disease occurring, and also identify a cause that increases the risk of a cardiac disease occurring, using the TPR value of every single beat measured during a long period of time.
- TPR value of every single beat measured during a long period of time.
- blood pressure waveform data of each beat is available, it is possible to ascertain instantaneous cardiac load at the time a sharp change occurs in blood pressure.
- An increase in the instantaneous TPR value may be caused by apnea. Therefore, an increase in the instantaneous TPR value that occurs while the user is sleeping can be used as a sign indicating a risk of a respiratory abnormality (a cardiovascular disease) such as sleep apnea occurring.
- a respiratory abnormality a cardiovascular disease
- the processing unit 51 may output a message indicating that there is the risk of a respiratory abnormality occurring, from the output unit 25. Sleep can be detected based on measurement data and measurement time acquired by the body movement measurement unit 21, for example.
- an increase in the instantaneous TPR value may be caused by the atmospheric temperature.
- the cause of the increase may be a rise in the atmospheric temperature. Therefore, it is possible to determine whether or not the cause of an increase in the instantaneous TPR value is a rise in the atmospheric temperature by referring to measurement data of the atmospheric temperature at the time the instantaneous TPR value has increased. That is, it is possible to ascertain the atmospheric-temperature sensitivity of the user's blood pressure by examining the correlation between an increase in the instantaneous TPR value and the atmospheric temperature.
- the processing unit 51 may output, from the output unit 25, a message indicating that the atmospheric-temperature sensitivity of the user's blood pressure is high.
- the processing unit 51 may acquire temperature data during a period in which the instantaneous TPR has increased, and determine whether or not the atmospheric temperature has increased in the period. If it is determined that the atmospheric temperature has increased in the period, the processing unit 51 may specify the atmospheric temperature as the cause of the increase in the instantaneous TPR value in the morning-time period, and output a message indicating that, from the output unit 25.
Description
- The present invention relates to technology for acquiring useful information from a blood pressure waveform that has been measured.
- There is a known technology for measuring changes in the internal pressure of a radial artery and recording the shape of a pressure pulse wave (blood pressure waveform).
JP 2008-61824A JP 2005-532111A -
US 2015/109124 A1 describes determining a cardiac state from neighboring RR intervals and extracting HRV (heart-rate variability) to detect that a subject is under higher pressure than usual.US 2014/303509 A1 discloses a technique for determining a stroke volume (SV) from measured blood pressure puls waves, wherein the SV and a cardiac index are displayed in a tabular form, a numerical form, or in histogram form for interpretation together with a pulse wave form. - The inventors of the present invention have worked hard to develop a blood pressure measurement device that can accurately measure an ambulatory blood pressure waveform for each heartbeat, and to put such a device into practical use. Through experiments performed on subjects during the development phase, the inventors have found that various kinds of useful information can be extracted from data regarding ambulatory blood pressure waveforms that have been consecutively measured.
- Several kinds of loads on the heart, such as afterload and preload, are known as factors that promote cardiac hypertrophy and cardiac expansion. Afterload can be evaluated using a stroke volume (SV, which is also referred to as "cardiac output"), and preload can be evaluated using total peripheral resistance (TPR). However, the blood pressure measurement devices disclosed in the documents above measure afterload and preload for each heartbeat, and the subject needs to be in a resting state. Therefore, the devices cannot measure ambulatory blood pressure when the heart is actually under a load. There also is a problem in which the devices cannot perform measurement for a long period of time (e.g. overnight).
- The inventors of the present invention have found that it is possible to evaluate a cardiac state and the risk of cardiac diseases occurring, based on pieces of ambulatory blood pressure waveform data that have been consecutively measured.
- The present invention aims to provide a novel technology for evaluating a cardiac state.
- To achieve the above-described aim, the present invention employs a biological information analysis device having the features of
claim 1, a system having the features of claim 6, a program having the features of claim 7, and a method having the features of claim 8. - A biological information analysis device according to one aspect of the present invention includes: an indicator extraction unit configured to extract an indicator indicating a cardiac state (hereinafter referred to as a cardiac state indicator), from data regarding blood pressure waveforms that are consecutively measured by a sensor that is configured to be worn on a body part of a user and to be capable of non-invasively measuring a blood pressure waveform for each heartbeat; and a processing unit configured to output the indicator extracted by the indicator extraction unit. The indicator extraction unit is configured to extract a value of the cardiac load indicator for each heartbeat, from the data regarding blood pressure waveforms, and calculate the indicator indicating the cardiac state, based on characteristics related to distribution of values of the cardiac load indicator corresponding to a plurality of heartbeats.
- In this aspect, according to one alternative, a stroke volume (SV) or a value determined based on the stroke volume is employed as the cardiac load indicator. The stroke volume is the volume of blood ejected from a ventricle per contraction, and is an indicator indicating preload. In the following description, the stroke volume per heartbeat is also referred to as an instantaneous stroke volume.
- The indicator extraction unit according to this alternative, in a first variant, is configured to determine the cardiac state indicator based on the frequency (the proportion of the frequency) with which the value of the instantaneous stroke volume exceeds a first threshold value in the distribution of values of the instantaneous stroke volume. The cardiac state indicator may be the frequency itself or a value determined based on the frequency. The first threshold value is determined based on the maximum value of the instantaneous stroke volume of the user. For example, a value within the range of 60% to 99%, preferably a value within the range of 70% to 90%, or further preferably a value within the range of 75% to 85% of the maximum instantaneous stroke volume may be employed as the first threshold value. The maximum instantaneous stroke volume may be determined as the maximum value of the instantaneous stroke volume acquired during the aforementioned consecutive measurement, or determined using another method.
- It can be said that a state in which the instantaneous stroke volume is greater than the first threshold value is a state in which excessive preload has occurred, and therefore the frequency of occurrence thereof is related to the risk of cardiac expansion occurring. That is, it is possible to evaluate the risk of cardiac expansion occurring, using the cardiac state indicator calculated as described above.
- The indicator extraction unit according to this alternative, in another variant, is configured to determine the cardiac state indicator based on the frequency (the proportion of the frequency) with which the value of the instantaneous stroke volume falls below a second threshold value in the distribution of values of the instantaneous stroke volume. The cardiac state indicator may be the frequency itself or a value determined based on the frequency. The second threshold value to be used may be the same predetermined value for every user, or unique to each user. The second threshold value is determined based on the lower limit of a typical reference value.
- It can be said that a state in which the instantaneous stroke volume is smaller than the second threshold value is a state in which preload is excessively low, and the frequency of occurrence thereof is related to the risk of a blood clot being formed. That is, it is possible to evaluate the risk of a blood clot being formed, using the cardiac state indicator calculated as described above.
- The indicator extraction unit in the present aspect may determine the cardiac state indicator based on the maximum value of the stroke volume (the maximum instantaneous stroke volume) in the distribution. The cardiac state indicator may be the maximum value itself or a value determined based on the maximum value. Note that it is preferable that blood pressure waveforms are measured by the sensor while the user is performing exercise at an intensity that is no less than a predetermined intensity.
- The maximum value (the saturation point) of the instantaneous stroke volume is related to the capacity of the heart, and a decrease therein is related to the risk of cardiac hypertrophy occurring. That is, it is possible to evaluate the risk of cardiac hypertrophy occurring, using the cardiac state indicator calculated as described above.
- In the present aspect, according to a further alternative, a total peripheral resistance (TPR) or a value determined based on a total peripheral resistance is employed as the cardiac load indicator. Total peripheral resistance is the resistance against the flow of blood in a blood vessel, and is an indicator indicating afterload. Total peripheral resistance is also referred to as systemic vascular resistance (SVR). In the following description, a total peripheral resistance per heartbeat is also referred to as an instantaneous total peripheral resistance or an instantaneous TPR.
- The indicator extraction unit in the present aspect, according to the further alternative, is configured to determine the cardiac state indicator based on the frequency (the proportion of the frequency) with which the value of the instantaneous TPR exceeds a third threshold value in the distribution of values of the instantaneous TPR. The cardiac state indicator may be the frequency itself or a value determined based on the frequency. The third threshold value to be used may be the same predetermined value for every user, or unique to each user. The third threshold value is determined based on the upper limit of a typical reference value.
- It can be said that a state in which the instantaneous total peripheral resistance is greater than the third threshold value is a state in which excessive afterload has occurred, and therefore the frequency of occurrence thereof is related to the risk of cardiac hypertrophy occurring. That is, it is possible to evaluate the risk of cardiac hypertrophy occurring, using the cardiac state indicator calculated as described above.
- The processing unit in the present aspect may be configured to output temporal changes in values of the cardiac load indicator corresponding to a plurality of heartbeats, and an indicator indicating the cardiac state. By outputting temporal changes in the cardiac load indicator, it is possible to make it easier to ascertain when a cardiac load that may cause a cardiac disease has occurred.
- The processing unit in the present aspect may be configured to acquire, from a second sensor, data indicating at least one of the user's body movement and the state of the environment during measurement of blood pressure waveforms, and output temporal changes in the cardiac load indicator in association with at least one of the user's body movement and the state of the environment. Such an output makes it possible to ascertain the relationship between the cardiac load indicator and the state of the user or the environment, and makes it easier to identify the cause of an increase in cardiac load.
- The processing unit in the present aspect may be configured to acquire, from a second sensor, time-series data indicating the state of the environment during measurement of blood pressure waveforms, and output the cardiac load indicator and the state of the environment in association with each other. Data indicating the state of the environment may be any data as long as it is data regarding an influencing factor that is presumably related to cardiac load or the risk of a cardiac disease occurring. The processing unit may output time-series data regarding the cardiac load indicator and time-series data regarding the influencing factor superimposed on each other. Also, the processing unit may output a graph that shows an influencing factor and a cardiac load indicator at the same point in time as a first coordinate value and a second coordinate value, respectively. Such an output makes it easier to identify the cause of an increase in cardiac load.
- A biological information analysis system according to one aspect of the present invention is a system including: a sensor that is configured to be worn on a body part of a user and to be capable of non-invasively measuring a blood pressure waveform for each heartbeat; and a biological information analysis device configured to analyze biological information, using data regarding blood pressure waveforms consecutively measured by the sensor.
- A program according to the present invention is a program that causes a processor to function as the indicator extraction unit and the processing unit of the biological information analysis device.
- Note that the present invention can be interpreted as a biological information analysis device or system that is provided with at least one of the above-described configurations or at least one of the above-described functions. The present invention can also be interpreted as a biological information analysis method that includes at least part of the above-described processing, or a program that causes a computer to execute such a method, or a computer-readable recording medium on which such a program is recorded in a non-transitory manner. The present invention can be formed by combining the above-described configurations and the above-described kinds of processing with each other unless no technical inconsistency occurs.
- According to the present invention, it is possible to provide a novel technology for evaluating a cardiac state.
-
-
FIG. 1 shows a schematic external configuration of a biologicalinformation analysis system 10. -
FIG. 2 is a block diagram showing a hardware configuration of the biologicalinformation analysis system 10. -
FIG. 3 is a cross-sectional view schematically showing a configuration of a bloodpressure measurement unit 20 and a state in which measurement is performed. -
FIG. 4 shows a blood pressure waveform that is measured by the bloodpressure measurement unit 20. -
FIG. 5 is a block diagram illustrating processing that is performed by a biologicalinformation analysis device 1. -
FIG. 6 shows a waveform (a blood pressure waveform) of a pressure pulse wave from a radial artery corresponding to one heartbeat. -
FIG. 7A is a graph showing distribution of SV values according to Example 1,FIG. 7B is a graph showing temporal changes, andFIG. 7C is a scatter diagram. -
FIG. 8 is a flowchart for indicator calculation processing according to Examples 1 and 2. -
FIG. 9A is a graph showing distribution of TPR values according to Example 2, andFIG. 9B is a graph showing temporal changes. - The following describes a preferred embodiment of the present invention with reference to the drawings. Note that the following descriptions of components may be modified as appropriate depending on the configuration of a device to which the present invention is applied, and on various conditions, and the scope of the present invention is not intended to be limited to the following descriptions.
-
FIG. 1 shows a schematic external configuration of a biologicalinformation analysis system 10 according to an embodiment of the present invention.FIG. 1 shows a state in which the biologicalinformation analysis system 10 is worn on the left wrist. The biologicalinformation analysis system 10 includes amain body 11 and abelt 12 that is fixed to themain body 11. The biologicalinformation analysis system 10 is a so-called wearable device, and is worn such that themain body 11 is in contact with the skin on the palm side of the wrist, and themain body 11 is located over a radial artery TD that lies beneath the skin. Although the device is configured to be worn on the radial artery TD in the present embodiment, the device may be configured to be worn on another superficial artery. -
FIG. 2 is a block diagram showing a hardware configuration of the biologicalinformation analysis system 10. In general, the biologicalinformation analysis system 10 includes ameasurement unit 2 and the biologicalinformation analysis device 1. Themeasurement unit 2 is a device that performs measurement to acquire information that is used to analyze biological information, and includes a bloodpressure measurement unit 20, a bodymovement measurement unit 21, and anenvironment measurement unit 22. However, note that the configuration of themeasurement unit 2 is not limited to that shown inFIG. 2 . For example, a unit that measures biological information other than blood pressure or a body movement (e.g. body temperature, blood-sugar level, or brain waves) may be added. Also, any unit that is not used in the example described below is not an essential component, and may be omitted from the biologicalinformation analysis system 10. The biologicalinformation analysis device 1 is a device that analyzes biological information based on information acquired from themeasurement unit 2, and includes acontrol unit 23, aninput unit 24, anoutput unit 25, acommunication unit 26, and astorage unit 27. Theunits 20 to 27 are connected to each other so that signals can be exchanged between them via a local bus or other signal lines. The biologicalinformation analysis system 10 also includes a power supply (a battery), which is not shown. - The blood
pressure measurement unit 20 measures a pressure pulse wave from the radial artery TD by using a tonometry method. The tonometry method is for forming a flat area in the artery TD by pressing the artery from the skin with appropriate pressure, adjusting the balance between the internal pressure and the external pressure of the artery, and non-invasively measuring the pressure pulse wave using a pressure sensor. - The body
movement measurement unit 21 includes a tri-axis acceleration sensor, and measures the movement of the user's body (body movement) using this sensor. The bodymovement measurement unit 21 may include a circuit that converts the format of an output from the tri-axis acceleration sensor into a format that is readable to thecontrol unit 23. - The
environment measurement unit 22 measures environmental information that may affect mental and physical conditions of the user (in particular the blood pressure). Theenvironment measurement unit 22 may include, for example, an atmospheric temperature sensor, a humidity sensor, an illuminance sensor, an altitude sensor, a position sensor, and so on. Theenvironment measurement unit 22 may include a circuit that converts the format of outputs from these sensors and so on into a format that is readable to thecontrol unit 23. - The
control unit 23 performs various kinds of processing, such as controlling each unit of the biologicalinformation analysis system 10, acquiring data from themeasurement unit 2, storing the acquired data in thestorage unit 27, processing and analyzing data, and inputting and outputting data. Thecontrol unit 23 includes a hardware processor (hereinafter referred to as the "CPU") a ROM (Read Only Memory), a RAM (Random Access Memory), and so on. Processing that is performed by thecontrol unit 23, which will be described later, is realized by the CPU reading and executing a program stored in the ROM or thestorage unit 27. The RAM functions as a work memory that is used by thecontrol unit 23 when performing various kinds of processing. Although acquisition of data from themeasurement unit 2 and the storing of data in thestorage unit 27 are performed by thecontrol unit 23 in the present embodiment, it is possible to employ a configuration in which themeasurement unit 2 directly stores (writes) data in thestorage unit 27. - Each of the constituent components of the embodiment such as a measurement unit, an indicator extraction unit, a processing unit, a determination unit, a risk database, an input unit, an output unit, a case database, and so on may be implemented as pieces of hardware in the biological
information analysis system 10. The indicator extraction unit, the processing unit, and the determination unit may receive an executable program stored in thestorage unit 27, and execute the program. The indicator extraction unit, the processing unit, and the determination unit may receive data from the bloodpressure measurement unit 20, the bodymovement measurement unit 21, theenvironment measurement unit 22, theinput unit 24, theoutput unit 25, thecommunication unit 26, thestorage unit 27, and so on as required. Databases such as the risk database and the case database may be implemented using thestorage unit 27 and so on, and store pieces of information that are arranged such that a data search and data accumulation can be easily performed. Here, for example, the configuration, operations, and so on of the biologicalinformation analysis system 10 are disclosed inJP 2016-082069A JP 2016-087003A - The
input unit 24 provides an operation interface for the user. For example, an operation button, a switch, a touch panel, and so on may be used. - The
output unit 25 provides an interface that outputs information to the user. For example, a display device (such as a liquid crystal display) that outputs information using images, an audio output device or a beeper that outputs information using audio, an LED that outputs information by blinking, a vibration device that outputs information by vibrating, and so on may be used. - The
communication unit 26 performs data communication with another device. Any data communication method such as a wireless LAN or Bluetooth (registered trademark) may be used. - The
storage unit 27 is a storage medium that can store data and from which data can be read out, and stores programs that are to be executed by thecontrol unit 23, pieces of measurement data acquired from the measurement units, and various kinds of data acquired by processing the pieces of measurement data, and so on. Thestorage unit 27 is a medium that accumulates pieces of information that are to be stored, through an electrical, magnetic, optical, mechanical, or chemical action. For example, a flash memory is used. Thestorage unit 27 may be a portable unit such as a memory card, or built into the biologicalinformation analysis system 10. - At least one unit or all units out of the body
movement measurement unit 21,environment measurement unit 22, thecontrol unit 23, theinput unit 24, theoutput unit 25, and thestorage unit 27 may be configured as a device that is separate from themain body 11. That is, as long as the bloodpressure measurement unit 20 and themain body 11 that incorporates a circuit that controls the bloodpressure measurement unit 20 are configured to be wearable on a wrist, the configurations of other units can be freely designed. If this is the case, themain body 11 cooperates with another unit via thecommunication unit 26. Various configurations can be conceived of. For example, the functions of thecontrol unit 23, theinput unit 24, and theoutput unit 25 may be realized using a smartphone application, and required data may be acquired from an activity monitor that has the functions of the bodymovement measurement unit 21 and theenvironment measurement unit 22. Also, a sensor that measures biological information other than blood pressure may be provided. For example, a sleep sensor, a pulse oximeter (SpO2 sensor), a respiration sensor (a flow sensor), a blood-sugar level sensor, and the like may be combined. - Although the sensor (the blood pressure measurement unit 20) that measures blood pressure and the component (including the
control unit 23 and so on) that performs processing to analyze blood pressure waveform data are provided in one device in the present embodiment, they may be provided in separate members. In the present embodiment, the component (including thecontrol unit 23 and so on) that performs processing to analyze biological information is referred to as a biological information analysis device, and the device that includes the combination of the measurement unit and the biological information analysis device is referred to as a biological information analysis system. However, these names are given for descriptive purposes, and the measurement unit and the component that performs processing to analyze biological information may be referred to as a biological information analysis device as a whole, or other names may be used. -
FIG. 3 is a cross-sectional view schematically showing the configuration of the bloodpressure measurement unit 20 and a state in which measurement is performed. The bloodpressure measurement unit 20 includes apressure sensor 30 and apressurizing mechanism 31 for pressing thepressure sensor 30 against a wrist. Thepressure sensor 30 includes a plurality ofpressure detection elements 300. Thepressure detection elements 300 detect pressure and convert the pressure into an electrical signal. For example, elements that utilize a piezoresistive effect may be preferably used. Thepressurizing mechanism 31 includes, for example, an air bag and a pump that adjusts the internal pressure of the air bag. As a result of thecontrol unit 23 controlling the pump to increase the internal pressure of the air bag, the air bag expands and thepressure sensor 30 is pressed against the surface of the skin. Note that thepressurizing mechanism 31 may be any mechanism as long as it can adjust the pressing force of thepressure sensor 30 applied to the surface of the skin, and is not limited to a mechanism that uses an air bag. - Upon the biological
information analysis system 10 being worn on a wrist and activated, thecontrol unit 23 controls thepressurizing mechanism 31 of the bloodpressure measurement unit 20 to keep the pressing force of thepressure sensor 30 in an appropriate state (a tonometry state). Then, pressure signals detected by thepressure sensor 30 are sequentially acquired by thecontrol unit 23. Pressure signals acquired from thepressure sensor 30 are generated by digitizing analogue physical amounts (e.g. voltage values) output by thepressure detection elements 300, through an A/D converter circuit or the like that employs a well-known technology. Preferable analogue values such as current values or resistance values may be employed as the analogue physical amounts, depending on the type of thepressure detection elements 300. Signal processing such as the aforementioned A/D conversion may be performed using a predetermined circuit provided in the bloodpressure measurement unit 20, or performed by another unit (not shown) provided between the bloodpressure measurement unit 20 and thecontrol unit 23. Each pressure signal acquired by thecontrol unit 23 corresponds to an instantaneous value of the internal pressure of the radial artery TD. Therefore, it is possible to acquire time-series data regarding blood pressure waveforms by acquiring pressure signals with time granularity and continuity that make it possible to ascertain a blood pressure waveform for each heartbeat. Thecontrol unit 23 stores the pressure signals sequentially acquired from thepressure sensor 30, in thestorage unit 27, together with information regarding points in time at which the pressure signals were measured. Thecontrol unit 23 may store the acquired pressure signals in thestorage unit 27 without change, or store the pressure signals in thestorage unit 27 after performing required signal processing on the pressure signals. Required signal processing includes, for example, processing that is performed to calibrate each pressure signal such that the amplitude of the pressure signal matches the blood pressure value (e.g. the brachial blood pressure), processing that is performed to reduce or remove noise in each pressure signal, and so on. -
FIG. 4 shows a blood pressure waveform measured by the bloodpressure measurement unit 20. The horizontal axis indicates time and the vertical axis indicates blood pressure. Although the sampling frequency may be set to any value, it is preferably set to be no less than 100 Hz so that characteristics of the shape of a waveform corresponding to one heartbeat can be reproduced. Typically, the period of one heartbeat is approximately one second, and therefore approximately one hundred or more data points can be acquired on a waveform corresponding to one heartbeat. - The blood
pressure measurement unit 20 according to the present embodiment is advantageous in terms of the following. - The blood
pressure measurement unit 20 can measure a blood pressure waveform for each heartbeat. As a result, it is possible to acquire various indicators related to blood pressure, the state of the heart, cardiovascular risks, and so on, based on the characteristics of the shape of the blood pressure waveform. In addition, it is possible to monitor for instantaneous values of blood pressure. Therefore, it is possible to instantaneously detect a blood pressure surge (a sudden rise in the blood pressure value), and to detect changes in blood pressure and irregularities in a blood pressure waveform that may occur in a very short period of time (corresponding to one to several heartbeats) without missing them. - As a portable blood pressure meter, a blood pressure meter that is to be worn on a wrist or an upper arm and employs an oscillometric method to measure blood pressure has come into practical use. However, a conventional portable blood pressure meter can only measure the mean value of blood pressure based on changes in the internal pressure of a cuff during a period of several seconds to a dozen or so seconds corresponding to a plurality of heartbeats, and cannot acquire time-series data regarding a blood pressure waveform for each heartbeat, unlike the blood
pressure measurement unit 20 according to the present embodiment. - The blood
pressure measurement unit 20 can record time-series data regarding blood pressure waveforms. By acquiring time-series data regarding blood pressure waveforms, and, for example, discerning characteristics of the blood pressure waveform related to temporal changes, or performing a frequency analysis on the time-series data to extract a specific frequency component, it is possible to acquire various indicators related to blood pressure, the state of the heart, cardiovascular risks, and so on. - The device employs a portable (wearable) type configuration, and less burden is placed on the user during measurement. Therefore, continuous measurement for a long time, and even 24-hour blood pressure monitoring, can be relatively easily performed. Also, since the device is of a portable type, changes in not only blood pressure under resting conditions, but also an ambulatory blood pressure (for example, during daily life or exercise) can be measured. As a result, it is possible to grasp how blood pressure is affected by behaviours in daily life (such as sleeping, eating, commuting, working, and taking medicine) and exercise, for example.
- Conventional products are types of devices that measure blood pressure under resting conditions, with an arm or a wrist fixed to a blood pressure measurement unit, and cannot measure changes in blood pressure in daily life or during exercise, unlike the biological
information analysis system 10 according to the present embodiment. - The blood
pressure measurement unit 20 can be easily combined or linked with other sensors. For example, it is possible to make an evaluation of a cause-effect relationship or a composite evaluation with information that can be acquired by other sensors (e.g. a body movement, environmental information such as an atmospheric temperature, biological information such as SpO2 and respiration information). -
FIG. 5 is a block diagram illustrating processing that is performed by the biologicalinformation analysis device 1. As shown inFIG. 5 , the biologicalinformation analysis device 1 includes anindicator extraction unit 50 and aprocessing unit 51. In the present embodiment, processing performed by theindicator extraction unit 50 and theprocessing unit 51 may be realized by thecontrol unit 23 executing a program that is required for the processing. The program may be stored in thestorage unit 27. When thecontrol unit 23 executes the required program, the subject program stored in the ROM orstorage unit 27 is loaded to the RAM. Then, thecontrol unit 23 interprets and executes the program loaded to the RAM, using the CPU, to control each constituent component. Note that at least one or all of the processing procedures executed by theindicator extraction unit 50 and theprocessing unit 51 may be realized using a circuit such as an ASIC or an FPGA. Alternatively, at least one or all of the processing procedures executed by theindicator extraction unit 50 and theprocessing unit 51 may be realized using a computer (e.g. a smartphone, a tablet terminal, a personal computer, or a cloud server) that is separate from themain body 11. - The
indicator extraction unit 50 acquires time-series data regarding blood pressure waveforms, which have been consecutively measured by the bloodpressure measurement unit 20, from thestorage unit 27. Theindicator extraction unit 50 extracts, from the acquired time-series data regarding blood pressure waveforms, indicators that are related to characteristics of the blood pressure waveforms. Here, characteristics of a blood pressure waveform include, for example, characteristics of the shape of a blood pressure waveform corresponding to one heartbeat, temporal changes in a blood pressure waveform, and frequency components of a blood pressure waveform. However, characteristics of a blood pressure waveform are not limited to those listed above. The extracted indicators are output to theprocessing unit 51. There are various characteristics and indicators regarding a blood pressure waveform, and the characteristics and indicators that are to be extracted may be designed or selected as appropriate according to the purpose of processing that is to be performed by theprocessing unit 51. Characteristics and indicators that can be extracted from measurement data regarding blood pressure waveforms according to the present embodiment will be described later in detail. - When obtaining indicators, the
indicator extraction unit 50 may use measurement data that has been acquired by the bodymovement measurement unit 21 and/or measurement data that has been acquired by theenvironment measurement unit 22, in addition to measurement data regarding blood pressure waveforms. Also, although not shown in the drawings, pieces of measurement data that have been acquired by a sleep sensor, a SpO2 sensor, a respiration sensor (a flow sensor), a blood-sugar level sensor, and the like may be combined with one another. By performing complex analysis on a plurality of kinds of measurement data acquired by a plurality of sensors, it is possible to perform more advanced information analysis of a blood pressure waveform. For example, it is possible to classify pieces of data regarding blood pressure waveforms according to states of the user, such as a resting state and a moving state, a state when an atmospheric temperature is high and a state when it is low, a light sleep state and a deep sleep state, a breathing state and an apnea state, and so on. Alternatively, it is possible to extract information regarding the influence of body movement, an activity amount, activity intensity, a temperature change, apnea, the user's breathing, etc. on blood pressure, and thus evaluate the cause-effect relationship, the correlation, etc. between pieces of measurement data. Note that examples of apnea include obstructive sleep apnea, central sleep apnea, and mixed sleep apnea. - The
processing unit 51 receives the indicators extracted by theindicator extraction unit 50. Theprocessing unit 51 performs processing that is based on the received indicators. Various kinds of processing can be conceived of as processing that is based on the indicators. For example, theprocessing unit 51 may provide the values of the extracted indicators or changes in the values to a user, a doctor, a public health nurse, or the like to prompt the utilization of the indicators in the fields of health care, treatment, health guidance, and so on. Alternatively, theprocessing unit 51 may estimate respiratory risks from the extracted indicators, or present guidelines for health maintenance or risk mitigation. Furthermore, when an increase in the risk of a cardiac disease occurring is detected or predicted based on an indicator, theprocessing unit 51 may inform the user or his/her doctor, or perform control to prevent the user from performing an action that places burden on his/her heart and so on, or to prevent a cardiovascular event from occurring. -
FIG. 6 shows a waveform (a blood pressure waveform) of a pressure pulse wave from a radial artery corresponding to one heartbeat. The horizontal axis indicates time t (msec) and the vertical axis indicates blood pressure BP (mmHg). - A blood pressure waveform is the waveform of a composite wave constituted by an "ejection wave" that is generated when the heart contracts and pumps out blood, and a "reflection wave" that is generated when an ejection wave is reflected at a branch point of a peripheral vessel or an artery. The following shows examples of characteristic points that can be extracted from a blood pressure waveform corresponding to one heartbeat.
- A point F1 is the rising point of the pressure pulse wave. The point F1 corresponds to the ejection start point of the heart, i.e. the point at which the aortic valve opens.
- A point F2 is a point at which the amplitude (the pressure) of the ejection wave is at the maximum (a first peak).
- A point F3 is an inflection point that appears midway in a drop in the ejection wave, due to a reflection wave being superimposed.
- A point F4 is the minimum point, which appears between the ejection wave and the reflection wave, and is also referred to as a notch. This point corresponds to the point at which the aortic valve closes.
- A point F5 is the peak of the reflection wave (a second peak), which appears after the point F4.
- A point F6 is the end point of one heartbeat, and corresponds to the ejection start point of the next heartbeat, i.e. the start point of the next heartbeat.
- The
indicator extraction unit 50 may use any algorithm to detect the above-described characteristic points. For example, theindicator extraction unit 50 may perform computations to obtain an nth order differential waveform of a blood pressure waveform, and detect the zero-crossing points to extract the characteristic points (the inflection points) of the blood pressure waveform (the points F1, F2, F4, F5, and F6 can be detected from the first order differential waveform, and the point F3 can be detected from the second order differential waveform or the fourth order differential waveform). Alternatively, theindicator extraction unit 50 may read out, from thestorage unit 27, a waveform pattern on which the characteristic points have been arranged in advance, and perform fitting of the waveform pattern to the target blood pressure waveform to specify the respective positions of the characteristic points. - The
indicator extraction unit 50 performs computations based on time t and pressure BP of each of the above-described characteristic points F1 to F6, and can thus obtain various kinds of information (values, characteristic amounts, indicators, etc.) from the blood pressure waveform of one heartbeat. The following are typical examples of information that can be acquired from a blood pressure waveform. Note that tx and BPx respectively represent time and blood pressure corresponding to a characteristic point Fx. - Pulse Wave Interval (Period of Heartbeat) TA = t6 - t1
- Heart Rate PR = 1/TA
- Pulse Wave Rising Time UT = t2 - t1
- Systole TS = t4 - t1
- Diastole TD = t6 - t4
- Reflection Wave Delay Time = t3 - t1
- Maximum Blood Pressure (Systolic Blood Pressure) SBP = BP2
- Minimum Blood Pressure (Diastolic Blood Pressure) DBP = BP1
- Mean Blood Pressure MAP = (Area of Blood Pressure Waveform from t1 to t6)/Period of Heartbeat TA
- Mean Blood Pressure during Systole = (Area of Blood Pressure Waveform from t1 to t4)/Systole TS
- Mean Blood Pressure during Diastole = (Area of Blood Pressure Waveform from t4 to t6)/Diastole TD
- Pulse Pressure PP = Maximum Blood Pressure SBP - Minimum Blood Pressure DBP
- Late Systolic Pressure SBP2 = BP3
- AI (Augmentation Index) = (Late Systolic Pressure SBP2 - Minimum Blood Pressure DBP)/Pulse Pressure PP
- Basic statistics of these pieces of information (values, characteristic amounts, and indicators) can also be used as indicators. Basic statistics include, for example, representative values (a mean value, a median value, a mode value, the maximum value, the minimum value, and so on) and the degree of scatter (dispersion, a standard deviation, a coefficient of variation, and so on). Temporal changes in these pieces of information (values, characteristic values, and indicators) can also be used as indicators.
- In addition, the
indicator extraction unit 50 can also acquire an indicator called BRS (Baroreflex Sensitivity) by performing computations on pieces of heartbeat information. This indicator indicates the ability to regulate blood pressure to be constant. Examples of methods for calculating the indicator include a spontaneous sequence method. This is a method for only extracting a sequence in which the maximum blood pressure SBP and the pulse wave interval TA consecutively rise or fall over the period of three or more heartbeats in synchronization with each other, plotting the maximum blood pressure SBP and the pulse wave interval TA onto a two-dimensional plane, and defining the inclination of the regression line obtained through a least squares method as the BRS. - The following illustrates several examples, which are specific applications, of the biological
information analysis system 10. - The present example is an example in which a cardiac state and the risk of a cardiac disease occurring are represented as indicators based on instantaneous stroke volumes corresponding to blood pressure waveforms that are consecutively measured.
- A stroke volume (SV, which is also referred to as "cardiac output") is known as an evaluation indicator that indicates a cardiac state and the risk of cardiac hypertrophy or cardiac expansion occurring. The stroke volume (SV) also indicates cardiac preload. The stroke volume (SV) can be calculated as follows, using a pulse pressure (PP) and an aortic stiffness (denoted as Stiffness, which is the inverse of compliance C): SV = PP/Stiffness. Here, provided that a period in which aortic stiffness (Stiffness) does not change is used, the stroke volume may be represented as follows: SV = PP.
- Also, the stroke volume (SV) can also be calculated as follows, based on blood pressure waveform data acquired by using a tonometry method: SV = ΔP + PAV × T. Here, ΔP denotes the difference between the value of blood pressure at the end of ejection and the value of blood pressure at the start of ejection, PAV denotes the mean value of blood pressure during ejection, and T denotes the duration of ejection. This calculation formula shows better correlation with the stroke volume.
- Although it is possible to use the stroke volume to evaluate the risk of cardiac expansion or cardiac hypertrophy occurring, conventional blood pressure measurement devices have issues, i.e. the stroke volume cannot be measured for each heartbeat (spot blood pressure meters), accuracy is not satisfactory (pulse oximeters), and ambulatory blood pressure cannot be measured for a long period of time (e.g. overnight) (conventional devices using an invasive method or a tonometry method). Therefore, the present example proposes a method for easily ascertaining the cardiac state and the risk of a cardiac disease occurring, by using the stroke volume of every single beat measured over a long period of time.
- In the present example, blood pressure waveform data is measured over a long period of time (e.g. overnight, or over several days), and the SV value of every single beat is obtained, and indicators that represent a cardiac state (cardiac state indicators) are obtained based on the distribution of SV values. The cardiac state indicators can be regarded as indicators that indicate the risk of a cardiac disease occurring.
- The SV value per heartbeat is an indicator that represents instantaneous cardiac load, and is an example of an instantaneous cardiac load indicator. In the following description, the SV value per heartbeat is also referred to as an instantaneous SV value (an instantaneous stroke volume). In the present example, cardiac state indicators are calculated based on the distribution of instantaneous SV values.
-
FIG. 7(A) is agraph 4100 showing the distribution of instantaneous SV values measured in a measurement period. A dottedline 4101 in the figure represents the maximum value (saturation point) of the SV value of a user that is the subject of measurement. It is preferable that the SV value at the saturation point has been determined in advance by performing measurement under an exercise load. Alternatively, if the user performs exercise at more than a predetermined intensity in the measurement period, the maximum value of the SV value in the period may be employed as the saturation point. Exercise at a predetermined intensity is exercise at an intensity that saturates the SV value of a user that is the subject of measurement. - A first cardiac
state indicator INDEX 1 in the present example indicates the proportion of the frequency of SV values that are higher than a threshold value Th1. That is, theindicator INDEX 1 indicates the proportion of the frequency of the SV values between the dottedline 4101 and a dottedline 4102, relative to the overall frequency. Here, the threshold value Th1 can be determined based on the SV value at the saturation point, and can be 80% of the SV value at the saturation point, for example. It can be said that the indicator INDEX1 indicates the proportion of the frequency of excessive preload. Therefore, it is possible to ascertain the risk of cardiac expansion occurring, based on the magnitude of the indicator INDEX1. Note that the threshold value Th1 is not necessarily 80% of the SV value at the saturation point, and may be a value within the range of 70% to 90% of the SV value at the saturation point, or another value. - A second cardiac state indicator INDEX2 in the present example indicates the proportion of the frequency of SV values that are lower than a threshold value Th2. That is, the indicator INDEX2 indicates the proportion of the frequency of the SV values that are no greater than the value indicated by a dotted
line 4103, relative to the overall frequency. Here, the threshold value Th2 is determined based on the lower limit of a typical reference value, and may be the same value for every user. For example, the threshold value Th2 may be a value that is based on 60 ml/beat. It can be said that the indicator INDEX2 indicates the proportion of the frequency of a drop in preload. Therefore, it is possible to ascertain the risk of a blood clot being formed, based on the magnitude of the indicator INDEX2. - A third indicator INDEX3 in the present example indicates the SV value at the saturation point (the maximum instantaneous stroke volume). As described above, it is preferable that the saturation point SV value has been measured in advance by performing measurement under an exercise load. However, the saturation point SV value may be measured while the user is performing exercise during a measurement period, at an intensity that is no less than a predetermined intensity, and determined as the maximum value of the instantaneous SV value. The stroke volume SV is saturated when the expansion of the myocardial fibers exceeds the limit. If the saturation point SV value is small, it can be determined that the limit of expansion of the cardiac muscle has decreased and the capacity of the heart has decreased. That is, it is possible to ascertain the risk of cardiac hypertrophy occurring, based on the saturation point SV value. It is also possible to determine that the risk of cardiac hypertrophy occurring is high if the saturation point SV value is no greater than a threshold value SVTh. The threshold value SVTh can be determined based on the lower limit of a typical reference value. For example, the threshold value SVTh may be a value that is based on 60 ml/beat.
- In the present example, it is preferable that a histogram of SV values as shown in
FIG. 7(A) or the above-described indicators INDEX1 to INDEX3 that can be obtained from the histogram are displayed through screen display. - It is also preferable that the above-described indicators INDEX1 to INDEX3 are displayed together with a graph showing temporal changes in the SV value as shown in
FIG. 7(B) . Agraph 4110 shows temporal changes in the SV value, a dottedline 4111 shows the maximum value of the SV value, a dottedline 4112 shows the threshold value Th1, and a dottedline 4113 shows the threshold value Th2. Adisplay 4120 shows the values of the cardiacstate indicators INDEX 1 to INDEX3. If it has been determined that the risk of a cardiac disease occurring is high, the values of the indicators INDEX1 to INDEX3 may be displayed in a different display mode with a different color or size so as to be emphasized, or displayed with a message indicating that the risk is high. Alternatively, the values of the indicators INDEX1 to INDEX3 may be displayed only when it has been determined that the risk is high. Such graph display makes it easier to ascertain the cardiac state of the user and the risk of a cardiac disease occurring, and also makes it easier to ascertain when a change in the stroke volume that may cause a cardiac disease has occurred. - It is also preferable that the instantaneous SV value is displayed in association with the state of the user and the state of the environment. For example, as shown in
FIG. 7(B) , it is preferable that a graph showing temporal changes in the SV value is displayed in a mode in which abedtime period 4114 and a high-temperature period 4115 are discernible. This makes it possible to determine a probable cause of a change in the SV value. For example, it is possible to determine that a cause of an increase in the SV value during the bedtime period is a respiratory abnormality, and a cause of a decrease in the SV value during the high-temperature period is dehydration. Thus, the graph is useful for prevention and treatment. Note that a sleeping state can be identified based on measurement data or measurement time data acquired by the bodymovement measurement unit 21. Temperature information such as that indicating a high temperature can be identified based on measurement data acquired by theenvironment measurement unit 22. These pieces of information may be acquired based on information that has been input by the user or a third party (such as a doctor) to theinput unit 24. - In another example in which the instantaneous SV value and the state of the environment are displayed in association with each other, it is also preferable that temporal changes in an influencing factor (such as an atmospheric temperature) and another indicator are superimposed and displayed on the above-described
graph 4110. Superimposed display of an influencing factor and temporal changes in the SV value is useful for identification of the cause of an increase in the SV value. - In yet another example in which the instantaneous SV value and the state of the environment are displayed in association with each other, measurement data displayed in the form of a scatter diagram that is defined by an axis indicating the SV value and an axis indicating the influencing factor, as shown in
FIG. 7(C) , is also useful. For example, a scatter diagram in which each of the plotted points has an SV value and a measurement value of the influencing factor corresponding to the same point in time as the x coordinate value and the y coordinate value, respectively, may be used. Such display is useful when determining whether or not the influencing factor thus displayed is a cause of a cardiac load. Therefore, by displaying a plurality of influencing factors as inFIG. 7(C) , it is possible to identify the cause of a cardiac load. -
FIG. 8 is a flowchart for processing according to the present example. In step S101, the user's data regarding consecutive blood pressure waveforms is measured. That is, the user goes about his/her life as usual wearing the biologicalinformation analysis system 10. During the measurement period, the bloodpressure measurement unit 20 measures blood pressure waveforms, and store the measurement data in thelocal storage unit 27 or in a memory in a cloud server by transmitting the measurement data using thecommunication unit 26. At the same time, the bodymovement measurement unit 21 and theenvironment measurement unit 22 stores data acquired from sensors in a memory in a similar manner. The length of the measurement period in step S101 is not specifically limited, and may be one night, several days, or longer. - The
output unit 25 may output, to the user, an instruction to perform exercise at least once in the measurement period, at an intensity that is no less than a predetermined intensity. - Upon completion of the measurement in step S101, the
indicator extraction unit 50 calculates an SV value for each heartbeat, as an instantaneous cardiac load indicator. Specifically, theindicator extraction unit 50 first acquires measurement data regarding the measured blood pressure waveforms from thestorage unit 27 or a cloud server, and divides the data into pieces that each correspond to one beat. This division can be realized by calculating ejection start points (the point F1 inFIG. 6 ) from the blood pressure waveform data, and determining data between two ejection start points that are adjacent to each other as data corresponding to one beat. Then, theindicator extraction unit 50 calculates an SV value for each beat. Here, although SV=PP may be employed, SV= ΔP + PAV × T is preferable. - In step S103, the
indicator extraction unit 50 calculates a cardiac state indicator based on the distribution of SV values that each correspond to one heartbeat. More specifically, theindicator extraction unit 50 calculates, as the indicator INDEX1, the proportion of the number of beats that correspond to an SV value that is no less than the threshold value Th1, relative to the total number of beats. Also, theindicator extraction unit 50 calculates, as the indicator INDEX2, the proportion of the number of beats that correspond to an SV value that is less than the threshold value Th2, relative to the total number of beats. Also, theindicator extraction unit 50 calculates, as the indicator INDEX3, the maximum value of the instantaneous SV value, i.e. the saturation point SV value, in the measurement data. Note that the INDEX1 and the INDEX2 are not necessarily the above-described proportions themselves, and may be values determined based on the proportions. Similarly, the INDEX3 is not necessarily the saturation SV value, and may be a value determined based on the saturation SV value. - In step S104, the
processing unit 51 outputs an image display that includes the cardiac state indicators INDEX1 to INDEX3 calculated in step S103. - For example, as shown in
FIG. 7(B) , theprocessing unit 51 generates image data that includes thedisplay 4120 that indicates the numerical values of the cardiac state indicators INDEX1 to INDEX3, and thegraph 4110 that indicates temporal changes in the instantaneous SV value during the measurement period, and outputs the image data using theoutput unit 25. The horizontal axis and the vertical axis of thegraph 4110 respectively indicate time and the SV value (the cardiac load indicator). The graph is displayed in a mode in which the threshold values Th1 and Th2 are discernible. Therefore, the user or a doctor or the like can easily ascertain a period of time in which cardiac load increases or decreases. - Furthermore, the
processing unit 51 may specify a period of time in which the user is in a specific state, based on the measurement data (and periods of time) acquired by the bodymovement measurement unit 21, and display a graph in a mode in which the period of time is discernible. For example, theperiod 4114 is a period of time in which the user's body moves less frequently, and is a night-time period. Therefore, theprocessing unit 51 may specify theperiod 4114 as a bedtime period. Also, theprocessing unit 51 may specify a period of time in which the user is in a moving state, based on a large amount of body movement of the user, or specify, as a wake-up time, a point in time at which the user's body movement starts increasing from that in the sleeping state. Also, theprocessing unit 51 may specify a period of time in which the environment is in a specific state, based on the measurement data acquired by theenvironment measurement unit 22, and, for example, display a graph in a mode in which the period of time is discernible. For example, theprocessing unit 51 may acquire an environmental temperature, and specify, as a high-temperature state period, a period of time in which the environmental temperature is no less than a threshold value. By displaying a user state or an environmental state together, it is possible to allow the user or a doctor to easily understand what is the cause of an increase or a decrease in cardiac load. - Although the cardiac state indicators INDEX1 to INDEX3 in the example in
FIG. 7(B) are displayed as numerical values, theprocessing unit 51 may display the cardiac state indicators INDEX1 to INDEX3 in a mode other than numerical values. Also, theprocessing unit 51 may display, for example, a message indicating that the risk of cardiac expansion occurring is high if the indicator INDEX1 is no less than a threshold value, a message indicating that the risk of a blood clot being formed if the indicator INDEX2 is no greater than a threshold value, and a message indicating that the risk of cardiac hypertrophy occurring is high if the indicator INDEX3 is no greater than a threshold value. -
FIG. 7(C) is an example of an output screen that includes a scatter diagram 4131 showing a relationship between an influencing factor (the temperature in this example) and the SV value, and adisplay 4132 showing the cardiac state indicators INDEX1 to INDEX3. Theprocessing unit 51 acquires an SV value and measurement data regarding the temperature corresponding to the same point in time, from the storage unit 27 (or a cloud server), and generates image data for a scatter diagram 4131 that includes a plurality of points each having a temperature value and an SV value as the x coordinate value and the y coordinate value, respectively. The cardiac state indicators INDEX1 to INDEX3 are the same as those inFIG. 7(B) , and therefore descriptions thereof are omitted. - According to the present example, it is possible to make it easier to ascertain the cardiac state and the risk of a cardiac disease occurring, and also identify a cause that increase the risk of a cardiac disease occurring, using the SV value of every single beat measured during a long period of time. In particular, since blood pressure waveform data of each beat is available, it is possible to ascertain an instantaneous cardiac load at the time a sharp change occurs in blood pressure.
- The present example is an example in which the risk of a cardiac disease occurring is represented as an indicator.
- Total peripheral resistance (TPR) is known as an evaluation indicator indicating a cardiac state and the risk of cardiac hypertrophy occurring. The total peripheral resistance (TPR) is also an indicator that indicates cardiac afterload.
- The total peripheral resistance (TPR) can be calculated as follows, based on blood pressure waveform data acquired by using a tonometry method: TPR = MBP·Stiffness/(PP·PR). Here, MBP denotes a mean blood pressure, PP denotes a pulse pressure, PR denotes a pulse rate, and Stiffness denotes an aortic stiffness (the inverse of compliance C).
- With respect to a period of time that is not so long that the aortic stiffness (Stiffness) does not change in the period, the total peripheral resistance may be represented as follows: TPR = MBP/(PP·PR).
- Although it is possible to use the total peripheral resistance to evaluate the risk of cardiac hypertrophy occurring, conventional blood pressure measurement devices have problems, i.e. the total peripheral resistance cannot be measured for each beat (spot blood pressure meters), accuracy is unsatisfactory (pulse oximeters), and ambulatory blood pressure cannot be measured for a long period of time (e.g. overnight) (conventional devices using an invasive method or a tonometry method). Therefore, the present example proposes a method for easily ascertaining a cardiac state and the risk of a cardiac disease occurring, by using the total peripheral resistance of every single beat measured over a long period of time.
- In the present example, blood pressure waveform data is measured over a long period of time (e.g. overnight, or over several days), and the TPR value of every single beat is obtained, and indicators that represent a cardiac state (cardiac state indicators) are obtained based on the distribution of TPR values. The cardiac state indicators can be regarded as indicators that indicate the risk of a cardiac disease occurring.
- The TPR value per heartbeat is an indicator that represents instantaneous cardiac load, and is an example of an instantaneous cardiac load indicator. In the following description, the TPR value per heartbeat is also referred to as an instantaneous TPR value (an instantaneous total peripheral resistance). In the present example, cardiac state indicators are calculated based on the distribution of instantaneous TPR values.
-
FIG. 9(A) is agraph 4200 showing the distribution of instantaneous TPR values measured in a measurement period. A cardiac state indicator INDEX4 in the present example indicates the proportion of the frequency of TPR values that are no less than a threshold value Th3. That is, the indicator INDEX4 indicates the proportion of the frequency of the TPR values that are no less than the value indicated by a dottedline 4201, relative to the overall frequency. Here, if a value is no less than the threshold value Th3, it is determined that excessive afterload has occurred. The threshold value Th3 can be determined based on the upper limit of a typical reference value. For example, the threshold value Th3 may be 1200 dynes·sec/cm5. - A TPR value no less than the threshold value Th3 indicates that excessive afterload has occurred. Therefore, it can be said that the indicator INDEX4 indicates the proportion of the frequency of excessive afterload. Therefore, it is possible to ascertain the risk of cardiac hypertrophy occurring, based on the magnitude of the indicator INDEX4.
- In the present example, it is preferable that a histogram of TPR values as shown in
FIG. 9(A) or the above-described indicator INDEX4 that can be obtained from the histogram is displayed through screen display. - It is also preferable that the above-described indicator INDEX4 is displayed together with a graph showing temporal changes in the TPR value as shown in
FIG. 9(B) . Agraph 4210 shows temporal changes in the TPR value. Adisplay 4220 shows the value of the cardiac state indicator INDEX4. If it has been determined that the risk of a cardiac disease occurring is high, the value of the indicator INDEX4 may be displayed in a different display mode with a different color or size so as to be emphasized, or displayed with a message indicating that the risk is high. Alternatively, the value of the indicator INDEX 4 may be displayed only when it has been determined that the risk is high. Such graph display makes it easier to ascertain the cardiac state of the user and the risk of a cardiac disease occurring, and also makes it easier to ascertain when a change in the TPR value that may cause a cardiac disease has occurred. - It is also preferable that a graph is displayed in a mode in which a
bedtime 4214 and a wake-up time 4215 are discernible as shown inFIG. 9(B) . In addition, it is also preferable that a meal period, an exercise period, and on are displayed. - By displaying the TPR value and the wake-up time, the bedtime, and so on together, it is possible to make it easier to identify the cause of an increase in the TPR value. For example, increases in the TPR value at a
point 4211 and apoint 4212 occurred in a night-time period, and therefore it can be envisaged that these increases were caused by sleep apnea. Therefore, a comparison with another apnea indicator makes it possible to identify the cause. Also, an increase in the TPR value after the wake-up time (in the morning) is likely to be an increase caused by a rise in the atmospheric temperature. Therefore, a comparison with the atmospheric temperature makes it possible to identify the cause. - It is also preferable to superimpose and display temporal changes in another indicator (e.g. an indicator indicating a sleep apnea) or an influencing factor (e.g. an atmospheric temperature) on the above-described graph. Superimposed display of temporal changes in the TPR value is useful for identification of the cause of an increase in the TPR value.
- Furthermore, it is also preferable to display measurement data in the form of a scatter diagram that is defined by an axis indicating the TPR value and an axis indicating the influencing factor. Such display is useful for identification of the cause of cardiac load.
- Note that influencing factors such as the wake-up time, the bedtime, and the atmospheric temperature can be acquired from the body
movement measurement unit 21 and theenvironment measurement unit 22, or acquired based on an input from the user to theinput unit 24. - Processing in the present example is performed according to the flowchart shown in
FIG. 8 , as in Example 1. The following mainly describes differences from Example 1. - The processing in step S101 is the same as that in Example 1. Step S102 is the same as that in Example 1 in that a blood pressure waveform is divided into pieces of data that each correspond to one beat. However, an instantaneous cardiac load indicator that is calculated from a piece of data corresponding to one beat is different from that in Example 1. In the present example, the
indicator extraction unit 50 calculates a TPR value for each heartbeat, as an instantaneous cardiac load indicator. Here, theindicator extraction unit 50 calculates a TPR value as follows: TPR = MBP/(PP·PR). - In step S103, the
indicator extraction unit 50 calculates, as the indicator INDEX4, the proportion of the number of beats that correspond to a TPR value that is no less than the threshold value Th3, relative to the total number of beats. - In step S104, the
processing unit 51 outputs a screen display as shown inFIG. 9(B) . At this time, if the indicator INDEX4 is no less than the threshold value, theprocessing unit 51 displays a message indicating that there is a risk of cardiac hypertrophy occurring. InFIG. 9(B) , theprocessing unit 51 generates a display screen in a mode in which points in time at which the user performed particular operations (such as the bedtime and the wake-up time) are discernible. However, theprocessing unit 51 may generate a display screen in a mode in which points in time at which the user or the environment is in a particular state are discernible as in Example 1. - According to the present example, it is possible to make it easier to ascertain the risk of a cardiac disease occurring, and also identify a cause that increases the risk of a cardiac disease occurring, using the TPR value of every single beat measured during a long period of time. In particular, since blood pressure waveform data of each beat is available, it is possible to ascertain instantaneous cardiac load at the time a sharp change occurs in blood pressure.
- An increase in the instantaneous TPR value may be caused by apnea. Therefore, an increase in the instantaneous TPR value that occurs while the user is sleeping can be used as a sign indicating a risk of a respiratory abnormality (a cardiovascular disease) such as sleep apnea occurring. Thus, upon detecting that the instantaneous TPR value has increased to be no less than the threshold value Th3 while the user is sleeping, the
processing unit 51 may output a message indicating that there is the risk of a respiratory abnormality occurring, from theoutput unit 25. Sleep can be detected based on measurement data and measurement time acquired by the bodymovement measurement unit 21, for example. - Also, an increase in the instantaneous TPR value may be caused by the atmospheric temperature. For example, if the instantaneous TPR value has increased in the morning, the cause of the increase may be a rise in the atmospheric temperature. Therefore, it is possible to determine whether or not the cause of an increase in the instantaneous TPR value is a rise in the atmospheric temperature by referring to measurement data of the atmospheric temperature at the time the instantaneous TPR value has increased. That is, it is possible to ascertain the atmospheric-temperature sensitivity of the user's blood pressure by examining the correlation between an increase in the instantaneous TPR value and the atmospheric temperature. For example, upon detecting that the user's instantaneous TPR value has increased to be no less than the threshold value Th3 in a morning-time period, the
processing unit 51 may output, from theoutput unit 25, a message indicating that the atmospheric-temperature sensitivity of the user's blood pressure is high. Alternatively, if temperature data acquired during a blood pressure measurement period is available, theprocessing unit 51 may acquire temperature data during a period in which the instantaneous TPR has increased, and determine whether or not the atmospheric temperature has increased in the period. If it is determined that the atmospheric temperature has increased in the period, theprocessing unit 51 may specify the atmospheric temperature as the cause of the increase in the instantaneous TPR value in the morning-time period, and output a message indicating that, from theoutput unit 25. -
- 1 ... biological information analysis device, 2 ... measurement unit
- 10 ... biological information analysis system, 11 ... main body, 12 ... belt
- 20 ... blood pressure measurement unit, 21 ... body movement measurement unit, 22 ... environment measurement unit, 23 ... control unit, 24 ... input unit, 25 ... output unit, 26 ... communication unit, 27 ... storage unit
- 30 ... pressure sensor, 31 ... pressurizing mechanism, 300 ... pressure detection element
- 50 ... indicator extraction unit, 51 ... processing unit
- 90... configuration table
Claims (8)
- A biological information analysis device (1) comprising:an indicator extraction unit (50) configured to extract an indicator indicating a cardiac state, from data regarding blood pressure waveforms that are consecutively measured by a sensor (30) that is configured to be wearable on a body part of a user and that is capable of non-invasively measuring a blood pressure waveform for each heartbeat; anda processing unit (51) configured to output the indicator extracted by the indicator extraction unit (50),wherein the indicator extraction unit (50) is configured to extract a value of a cardiac load indicator for each heartbeat, from the data regarding blood pressure waveforms, and calculate the indicator indicating the cardiac state, based on characteristics related to distribution of values of the cardiac load indicator corresponding to a plurality of heartbeats,wherein the indicator extraction unit is configured to determine the cardiac load indicator based on a stroke volume, and wherein the indicator extraction unit is configured to determine the indicator indicating the cardiac state based on at least one of:a frequency with which the stroke volume exceeds a first threshold value in the distribution, wherein a state in which the instantaneous stroke volume is greater than the first threshold value is a state in which excessive preload has occurred, and the first threshold value is a value which is determined based on the maximum value of the instantaneous stroke volume of the user, anda frequency with which the stroke volume falls below a second threshold value in the distribution, wherein a state in which the instantaneous stroke volume is smaller than the second threshold value is a state in which preload is excessively low, and the second threshold value is determined based on the lower limit of a typical reference value, orwherein the indicator extraction unit is configured to determine the cardiac load indicator based on a total peripheral resistance, and wherein the indicator extraction unit is configured to determine the indicator indicating the cardiac state based on a frequency with which the total peripheral resistance exceeds a third threshold value in the distribution, wherein a state in which the instantaneous total peripheral resistance is greater than the third threshold value is a state in which excessive afterload has occurred, and the third threshold value is determined based on the upper limit of a typical reference value.
- The biological information analysis device (1) according to claim 1,
wherein the indicator extraction unit is configured to determine the indicator indicating the cardiac state based on the maximum value of the stroke volume in the distribution. - The biological information analysis device (1) according to claim 1 or 2,
wherein the processing unit (51) is configured to output temporal changes in values of the cardiac load indicator corresponding to a plurality of heartbeats, and an indicator indicating the cardiac state. - The biological information analysis device (1) according to claim 3,
wherein the processing unit (51) is configured to acquire, from a second sensor, data indicating at least one of the user's body movement and the state of the environment during measurement of blood pressure waveforms, and output temporal changes in the cardiac load indicator in association with at least one of the user's body movement and the state of the environment. - The biological information analysis device (1) according to claim 3 or 4,
wherein the processing unit (51) is configured to acquire, from a second sensor, time-series data indicating the state of the environment during measurement of blood pressure waveforms, and output the cardiac load indicator and the state of the environment in association with each other. - A system (10) comprising:a sensor (30) that is configured to be wearable on a body part of a user and that is capable of non-invasively measuring a blood pressure waveform for each heartbeat; andthe biological information analysis device (1) according to any one of claims 1 to 5, the biological information analysis device (1) being configured to analyze biological information, using data regarding blood pressure waveforms consecutively measured by the sensor (30).
- A program that causes a processor to function as the indicator extraction unit (50) and the processing unit (51) of the biological information analysis device (1) according to any one of claims 1 to 5.
- A biological information analysis method comprising:a step of acquiring data regarding blood pressure waveforms that are consecutively measured by a sensor (30) that is configured to be wearable on a body part of a user and that is capable of non-invasively measuring a blood pressure waveform for each heartbeat;a step of extracting a value of a cardiac load indicator for each heartbeat, from the data regarding blood pressure waveforms, using at least one hardware processor;a step of calculating an indicator indicating a cardiac state, based on characteristics related to distribution of values of the cardiac load indicator corresponding to a plurality of heartbeats, using at least one hardware processor; anda step of outputting an indicator indicating the cardiac state, using at least one hardware processor,wherein the cardiac load indicator is determined based on a stroke volume, and wherein the indicator indicating the cardiac state is determined based on at least one of:a frequency with which the stroke volume exceeds a first threshold value in the distribution, wherein a state in which the instantaneous stroke volume is greater than the first threshold value is a state in which excessive preload has occurred, and the first threshold value is a value which is determined based on the maximum value of the instantaneous stroke volume of the user, anda frequency with which the stroke volume falls below a second threshold value in the distribution, wherein a state in which the instantaneous stroke volume is smaller than the second threshold value is a state in which preload is excessively low, and the second threshold value is determined based on the lower limit of a typical reference value, orwherein the cardiac load indicator is determined based on a total peripheral resistance, and wherein the indicator indicating the cardiac state is determined based on a frequency with which the total peripheral resistance exceeds a third threshold value in the distribution, wherein a state in which the instantaneous total peripheral resistance is greater than the third threshold value is a state in which excessive afterload has occurred, and the third threshold value is determined based on the upper limit of a typical reference value.
Applications Claiming Priority (2)
| Application Number | Priority Date | Filing Date | Title |
|---|---|---|---|
| JP2016082463 | 2016-04-15 | ||
| PCT/JP2017/015281 WO2017179700A1 (en) | 2016-04-15 | 2017-04-14 | Biological information analysis device and system, and program |
Publications (3)
| Publication Number | Publication Date |
|---|---|
| EP3427656A1 EP3427656A1 (en) | 2019-01-16 |
| EP3427656A4 EP3427656A4 (en) | 2019-12-11 |
| EP3427656B1 true EP3427656B1 (en) | 2023-03-29 |
Family
ID=60041783
Family Applications (11)
| Application Number | Title | Priority Date | Filing Date |
|---|---|---|---|
| EP17782515.5A Active EP3427653B1 (en) | 2016-04-15 | 2017-04-14 | Biological information analysis device, system, and program |
| EP17782513.0A Active EP3427656B1 (en) | 2016-04-15 | 2017-04-14 | Biological information analysis device, system, and program |
| EP17782514.8A Active EP3427652B1 (en) | 2016-04-15 | 2017-04-14 | Biological information analysis device, system, and program |
| EP17782509.8A Active EP3427655B1 (en) | 2016-04-15 | 2017-04-14 | Biological information analyzing device, system, and program |
| EP17782508.0A Active EP3427649B1 (en) | 2016-04-15 | 2017-04-14 | Biological information analyzing device, system, and program |
| EP17782506.4A Pending EP3427648A4 (en) | 2016-04-15 | 2017-04-14 | Biological information analysis device, biological information analysis system, program, and biological information analysis method |
| EP17782510.6A Active EP3427650B1 (en) | 2016-04-15 | 2017-04-14 | Biological information analyzing device, system, and program |
| EP17782507.2A Active EP3430989B1 (en) | 2016-04-15 | 2017-04-14 | Biological information analysis device, system, program, and biological information analysis method |
| EP17782516.3A Ceased EP3427654A4 (en) | 2016-04-15 | 2017-04-14 | Biological information analysis device and system, and program |
| EP17782511.4A Pending EP3427651A4 (en) | 2016-04-15 | 2017-04-14 | Biological information analysis device and system, and program |
| EP17782512.2A Active EP3440995B1 (en) | 2016-04-15 | 2017-04-14 | Biological information analysis device, system, and program |
Family Applications Before (1)
| Application Number | Title | Priority Date | Filing Date |
|---|---|---|---|
| EP17782515.5A Active EP3427653B1 (en) | 2016-04-15 | 2017-04-14 | Biological information analysis device, system, and program |
Family Applications After (9)
| Application Number | Title | Priority Date | Filing Date |
|---|---|---|---|
| EP17782514.8A Active EP3427652B1 (en) | 2016-04-15 | 2017-04-14 | Biological information analysis device, system, and program |
| EP17782509.8A Active EP3427655B1 (en) | 2016-04-15 | 2017-04-14 | Biological information analyzing device, system, and program |
| EP17782508.0A Active EP3427649B1 (en) | 2016-04-15 | 2017-04-14 | Biological information analyzing device, system, and program |
| EP17782506.4A Pending EP3427648A4 (en) | 2016-04-15 | 2017-04-14 | Biological information analysis device, biological information analysis system, program, and biological information analysis method |
| EP17782510.6A Active EP3427650B1 (en) | 2016-04-15 | 2017-04-14 | Biological information analyzing device, system, and program |
| EP17782507.2A Active EP3430989B1 (en) | 2016-04-15 | 2017-04-14 | Biological information analysis device, system, program, and biological information analysis method |
| EP17782516.3A Ceased EP3427654A4 (en) | 2016-04-15 | 2017-04-14 | Biological information analysis device and system, and program |
| EP17782511.4A Pending EP3427651A4 (en) | 2016-04-15 | 2017-04-14 | Biological information analysis device and system, and program |
| EP17782512.2A Active EP3440995B1 (en) | 2016-04-15 | 2017-04-14 | Biological information analysis device, system, and program |
Country Status (5)
| Country | Link |
|---|---|
| US (11) | US20190159722A1 (en) |
| EP (11) | EP3427653B1 (en) |
| JP (11) | JP6687263B2 (en) |
| CN (11) | CN109069035B (en) |
| WO (11) | WO2017179693A1 (en) |
Families Citing this family (84)
| Publication number | Priority date | Publication date | Assignee | Title |
|---|---|---|---|---|
| US11253205B2 (en) * | 2017-08-16 | 2022-02-22 | Seiko Epson Corporation | Pulse pressure and blood pressure analysis device, pulse pressure and blood pressure analysis method, and program |
| JP7124460B2 (en) * | 2018-05-31 | 2022-08-24 | セイコーエプソン株式会社 | Biological analysis device, biological analysis method and program |
| US11317873B2 (en) * | 2017-08-16 | 2022-05-03 | Seiko Epson Corporation | Biological analysis device, biological analysis method, and program |
| US11116414B2 (en) * | 2017-08-16 | 2021-09-14 | Seiko Epson Corporation | Biological analysis device, biological analysis method, and program |
| CN107550481A (en) * | 2017-08-24 | 2018-01-09 | 京东方科技集团股份有限公司 | A kind of portable equipment and blood pressure measuring method |
| CN109833037B (en) * | 2017-11-29 | 2022-05-17 | 华为终端有限公司 | Equipment for monitoring blood pressure state and computer readable storage medium |
| JP2019115602A (en) * | 2017-12-27 | 2019-07-18 | オムロンヘルスケア株式会社 | Biological information measuring device, measurement control method, and program |
| JP6897558B2 (en) * | 2017-12-27 | 2021-06-30 | オムロンヘルスケア株式会社 | Information processing equipment, information processing methods and information processing programs |
| WO2019138327A1 (en) * | 2018-01-09 | 2019-07-18 | Shankar Rohini | Wearable ecg and auscultation monitoring system with sos and remote monitoring |
| JP7091701B2 (en) * | 2018-02-22 | 2022-06-28 | オムロンヘルスケア株式会社 | Blood pressure measuring device, blood pressure measuring method and program, breathing support device |
| JP6626951B2 (en) * | 2018-03-12 | 2019-12-25 | パラマウントベッド株式会社 | Electric furniture |
| EP3808278A4 (en) * | 2018-06-05 | 2022-06-01 | Kazuo Tani | Blood flow volume measurement system |
| WO2020037599A1 (en) * | 2018-08-23 | 2020-02-27 | 深圳迈瑞生物医疗电子股份有限公司 | Medical device, apnea event monitoring method and apparatus |
| JP6988001B2 (en) * | 2018-08-30 | 2022-01-05 | オリンパス株式会社 | Recording device, image observation device, observation system, observation system control method, and observation system operation program |
| CN111012323A (en) * | 2018-10-10 | 2020-04-17 | 三星电子株式会社 | Device for estimating blood pressure and device for supporting blood pressure estimation |
| WO2020096311A1 (en) | 2018-11-06 | 2020-05-14 | Samsung Electronics Co., Ltd. | Electronic device and method for identifying occurrence of hypotension |
| CN109674474B (en) * | 2018-11-30 | 2021-12-03 | 深圳和而泰智能控制股份有限公司 | Sleep apnea recognition method, device and computer readable medium |
| CN109731314B (en) * | 2019-01-25 | 2020-12-29 | 杨彬 | Cerebral infarction rehabilitation training device based on high in clouds |
| JP7320807B2 (en) * | 2019-02-14 | 2023-08-04 | デルタ工業株式会社 | Physical condition determination device and computer program |
| JP7225893B2 (en) * | 2019-02-18 | 2023-02-21 | オムロンヘルスケア株式会社 | Blood pressure value analysis support device, blood pressure value analysis support system, blood pressure value analysis support method, and program |
| JP7127571B2 (en) * | 2019-02-18 | 2022-08-30 | オムロンヘルスケア株式会社 | Blood pressure level change detection device, blood pressure level change detection method, and program |
| US20200289889A1 (en) | 2019-03-11 | 2020-09-17 | Rom Technologies, Inc. | Bendable sensor device for monitoring joint extension and flexion |
| US11541274B2 (en) | 2019-03-11 | 2023-01-03 | Rom Technologies, Inc. | System, method and apparatus for electrically actuated pedal for an exercise or rehabilitation machine |
| JP6871546B2 (en) * | 2019-03-12 | 2021-05-12 | 群馬県 | Detection method and detection device for detecting abnormalities in pulse pressure waveform |
| JP7326802B2 (en) * | 2019-03-25 | 2023-08-16 | オムロンヘルスケア株式会社 | Measurement facilitator, method and program |
| JP7256049B2 (en) * | 2019-03-25 | 2023-04-11 | オムロンヘルスケア株式会社 | Blood pressure-related information display device, blood pressure-related information display method, and program |
| CN113711270A (en) * | 2019-04-12 | 2021-11-26 | 株式会社半导体能源研究所 | Display device and system |
| US11904207B2 (en) | 2019-05-10 | 2024-02-20 | Rehab2Fit Technologies, Inc. | Method and system for using artificial intelligence to present a user interface representing a user's progress in various domains |
| US11433276B2 (en) | 2019-05-10 | 2022-09-06 | Rehab2Fit Technologies, Inc. | Method and system for using artificial intelligence to independently adjust resistance of pedals based on leg strength |
| US11801423B2 (en) | 2019-05-10 | 2023-10-31 | Rehab2Fit Technologies, Inc. | Method and system for using artificial intelligence to interact with a user of an exercise device during an exercise session |
| US11957960B2 (en) | 2019-05-10 | 2024-04-16 | Rehab2Fit Technologies Inc. | Method and system for using artificial intelligence to adjust pedal resistance |
| JP7328044B2 (en) * | 2019-07-22 | 2023-08-16 | マクセル株式会社 | Detection device and detection method |
| KR102567952B1 (en) * | 2019-09-11 | 2023-08-16 | 삼성전자주식회사 | Apparatus and method for estimating bio-information |
| JP2021040969A (en) * | 2019-09-11 | 2021-03-18 | オムロンヘルスケア株式会社 | Method for generating determination algorithm, determination algorithm, determination system, determination method, program, and recording medium |
| US11071597B2 (en) | 2019-10-03 | 2021-07-27 | Rom Technologies, Inc. | Telemedicine for orthopedic treatment |
| US11701548B2 (en) | 2019-10-07 | 2023-07-18 | Rom Technologies, Inc. | Computer-implemented questionnaire for orthopedic treatment |
| US11915816B2 (en) | 2019-10-03 | 2024-02-27 | Rom Technologies, Inc. | Systems and methods of using artificial intelligence and machine learning in a telemedical environment to predict user disease states |
| US11955221B2 (en) | 2019-10-03 | 2024-04-09 | Rom Technologies, Inc. | System and method for using AI/ML to generate treatment plans to stimulate preferred angiogenesis |
| US11955220B2 (en) | 2019-10-03 | 2024-04-09 | Rom Technologies, Inc. | System and method for using AI/ML and telemedicine for invasive surgical treatment to determine a cardiac treatment plan that uses an electromechanical machine |
| US11282599B2 (en) | 2019-10-03 | 2022-03-22 | Rom Technologies, Inc. | System and method for use of telemedicine-enabled rehabilitative hardware and for encouragement of rehabilitative compliance through patient-based virtual shared sessions |
| US20210142893A1 (en) | 2019-10-03 | 2021-05-13 | Rom Technologies, Inc. | System and method for processing medical claims |
| US20210128080A1 (en) | 2019-10-03 | 2021-05-06 | Rom Technologies, Inc. | Augmented reality placement of goniometer or other sensors |
| US20210127974A1 (en) | 2019-10-03 | 2021-05-06 | Rom Technologies, Inc. | Remote examination through augmented reality |
| US11282608B2 (en) | 2019-10-03 | 2022-03-22 | Rom Technologies, Inc. | Method and system for using artificial intelligence and machine learning to provide recommendations to a healthcare provider in or near real-time during a telemedicine session |
| US11325005B2 (en) | 2019-10-03 | 2022-05-10 | Rom Technologies, Inc. | Systems and methods for using machine learning to control an electromechanical device used for prehabilitation, rehabilitation, and/or exercise |
| US11139060B2 (en) | 2019-10-03 | 2021-10-05 | Rom Technologies, Inc. | Method and system for creating an immersive enhanced reality-driven exercise experience for a user |
| US11955222B2 (en) | 2019-10-03 | 2024-04-09 | Rom Technologies, Inc. | System and method for determining, based on advanced metrics of actual performance of an electromechanical machine, medical procedure eligibility in order to ascertain survivability rates and measures of quality-of-life criteria |
| US11282604B2 (en) | 2019-10-03 | 2022-03-22 | Rom Technologies, Inc. | Method and system for use of telemedicine-enabled rehabilitative equipment for prediction of secondary disease |
| US20210134458A1 (en) | 2019-10-03 | 2021-05-06 | Rom Technologies, Inc. | System and method to enable remote adjustment of a device during a telemedicine session |
| US11337648B2 (en) | 2020-05-18 | 2022-05-24 | Rom Technologies, Inc. | Method and system for using artificial intelligence to assign patients to cohorts and dynamically controlling a treatment apparatus based on the assignment during an adaptive telemedical session |
| US20210134432A1 (en) | 2019-10-03 | 2021-05-06 | Rom Technologies, Inc. | Method and system for implementing dynamic treatment environments based on patient information |
| US11075000B2 (en) | 2019-10-03 | 2021-07-27 | Rom Technologies, Inc. | Method and system for using virtual avatars associated with medical professionals during exercise sessions |
| US20210134425A1 (en) | 2019-10-03 | 2021-05-06 | Rom Technologies, Inc. | System and method for using artificial intelligence in telemedicine-enabled hardware to optimize rehabilitative routines capable of enabling remote rehabilitative compliance |
| US20210134412A1 (en) | 2019-10-03 | 2021-05-06 | Rom Technologies, Inc. | System and method for processing medical claims using biometric signatures |
| US20210134463A1 (en) | 2019-10-03 | 2021-05-06 | Rom Technologies, Inc. | Systems and methods for remotely-enabled identification of a user infection |
| US11830601B2 (en) | 2019-10-03 | 2023-11-28 | Rom Technologies, Inc. | System and method for facilitating cardiac rehabilitation among eligible users |
| US11961603B2 (en) | 2019-10-03 | 2024-04-16 | Rom Technologies, Inc. | System and method for using AI ML and telemedicine to perform bariatric rehabilitation via an electromechanical machine |
| US11069436B2 (en) | 2019-10-03 | 2021-07-20 | Rom Technologies, Inc. | System and method for use of telemedicine-enabled rehabilitative hardware and for encouraging rehabilitative compliance through patient-based virtual shared sessions with patient-enabled mutual encouragement across simulated social networks |
| US11270795B2 (en) | 2019-10-03 | 2022-03-08 | Rom Technologies, Inc. | Method and system for enabling physician-smart virtual conference rooms for use in a telehealth context |
| US11887717B2 (en) | 2019-10-03 | 2024-01-30 | Rom Technologies, Inc. | System and method for using AI, machine learning and telemedicine to perform pulmonary rehabilitation via an electromechanical machine |
| US11915815B2 (en) | 2019-10-03 | 2024-02-27 | Rom Technologies, Inc. | System and method for using artificial intelligence and machine learning and generic risk factors to improve cardiovascular health such that the need for additional cardiac interventions is mitigated |
| US11515021B2 (en) | 2019-10-03 | 2022-11-29 | Rom Technologies, Inc. | Method and system to analytically optimize telehealth practice-based billing processes and revenue while enabling regulatory compliance |
| US11515028B2 (en) | 2019-10-03 | 2022-11-29 | Rom Technologies, Inc. | Method and system for using artificial intelligence and machine learning to create optimal treatment plans based on monetary value amount generated and/or patient outcome |
| US11101028B2 (en) | 2019-10-03 | 2021-08-24 | Rom Technologies, Inc. | Method and system using artificial intelligence to monitor user characteristics during a telemedicine session |
| US11955223B2 (en) | 2019-10-03 | 2024-04-09 | Rom Technologies, Inc. | System and method for using artificial intelligence and machine learning to provide an enhanced user interface presenting data pertaining to cardiac health, bariatric health, pulmonary health, and/or cardio-oncologic health for the purpose of performing preventative actions |
| US11923065B2 (en) | 2019-10-03 | 2024-03-05 | Rom Technologies, Inc. | Systems and methods for using artificial intelligence and machine learning to detect abnormal heart rhythms of a user performing a treatment plan with an electromechanical machine |
| US11756666B2 (en) | 2019-10-03 | 2023-09-12 | Rom Technologies, Inc. | Systems and methods to enable communication detection between devices and performance of a preventative action |
| US11317975B2 (en) | 2019-10-03 | 2022-05-03 | Rom Technologies, Inc. | Method and system for treating patients via telemedicine using sensor data from rehabilitation or exercise equipment |
| US11826613B2 (en) | 2019-10-21 | 2023-11-28 | Rom Technologies, Inc. | Persuasive motivation for orthopedic treatment |
| KR102605901B1 (en) * | 2020-03-10 | 2023-11-23 | 삼성전자주식회사 | Apparatus and method for estimating bio-information |
| JP7462300B2 (en) | 2020-05-08 | 2024-04-05 | 公立大学法人北九州市立大学 | BLOOD PRESSURE MEASURING DEVICE, BLOOD PRESSURE MEASURING SYSTEM, VEHICLE, AND BLOOD PRESSURE MEASURING METHOD |
| CN111528825A (en) * | 2020-05-14 | 2020-08-14 | 浙江大学 | Photoelectric volume pulse wave signal optimization method |
| JP6916573B1 (en) * | 2020-06-01 | 2021-08-11 | 株式会社Arblet | Information processing systems, servers, information processing methods and programs |
| WO2021246346A1 (en) * | 2020-06-01 | 2021-12-09 | 株式会社Arblet | Information processing system, server, information processing method, and program |
| CN111685749B (en) * | 2020-06-18 | 2022-09-02 | 郑昕 | Construction method of pulse pressure wave mathematical model |
| DE102020124582A1 (en) * | 2020-09-22 | 2022-03-24 | Drägerwerk AG & Co. KGaA | Medical device for evaluating a pulsatile signal |
| JP2022080166A (en) * | 2020-11-17 | 2022-05-27 | 旭化成メディカル株式会社 | Heart beat information acquisition device and heart beat information acquisition program |
| JP2022121340A (en) * | 2021-02-08 | 2022-08-19 | 阿部 真一 | Calculating blood flow rate, blood vessel diameter, blood vessel flow resistance, heart load factor, and the like according to measurement result of blood pressure manometer and displaying them to blood pressure manometer |
| WO2022196144A1 (en) * | 2021-03-18 | 2022-09-22 | テルモ株式会社 | Arterial pressure estimation device, arterial pressure estimation system, and arterial pressure estimation method |
| CN113555082B (en) * | 2021-07-26 | 2023-06-16 | 无锡市第二人民医院 | Intelligent guiding training method for respiratory function |
| JPWO2023021970A1 (en) * | 2021-08-19 | 2023-02-23 | ||
| WO2023048158A1 (en) * | 2021-09-22 | 2023-03-30 | 国立大学法人電気通信大学 | Sleep apnea syndrome determination device, sleep apnea syndrome determination method, and program |
| CN113995396B (en) * | 2021-12-24 | 2022-04-15 | 北京乾合晶芯电子技术有限公司 | Be applied to cardiovascular internal medicine's blood pressure monitor |
| CN115990001B (en) * | 2023-03-21 | 2024-04-05 | 首都医科大学宣武医院 | Wearable monitoring system, wearable device and storage medium |
Family Cites Families (186)
| Publication number | Priority date | Publication date | Assignee | Title |
|---|---|---|---|---|
| US4649929A (en) * | 1981-06-11 | 1987-03-17 | Sri International | Method and apparatus for diagnosis of coronary artery disease |
| US4365636A (en) | 1981-06-19 | 1982-12-28 | Medicon, Inc. | Method of monitoring patient respiration and predicting apnea therefrom |
| NL9100150A (en) * | 1991-01-29 | 1992-08-17 | Tno | METHOD FOR DETERMINING THE BATTLE VOLUME AND THE HEART MINUTE VOLUME OF THE HUMAN HEART. |
| US7081095B2 (en) | 2001-05-17 | 2006-07-25 | Lynn Lawrence A | Centralized hospital monitoring system for automatically detecting upper airway instability and for preventing and aborting adverse drug reactions |
| JP3219325B2 (en) | 1992-11-05 | 2001-10-15 | 日本コーリン株式会社 | Respiratory rate measuring device |
| US5836884A (en) * | 1993-12-17 | 1998-11-17 | Pulse Metric, Inc. | Method for diagnosing, monitoring and treating hypertension and other cardiac problems |
| JP3595593B2 (en) | 1995-03-01 | 2004-12-02 | コーリンメディカルテクノロジー株式会社 | Blood ejection function evaluation device |
| JP3583494B2 (en) | 1995-03-01 | 2004-11-04 | コーリンメディカルテクノロジー株式会社 | Blood ejection function evaluation device |
| JPH08317912A (en) | 1995-03-23 | 1996-12-03 | Seiko Instr Inc | Pulse rate meter |
| AUPN236595A0 (en) | 1995-04-11 | 1995-05-11 | Rescare Limited | Monitoring of apneic arousals |
| DE69632116T2 (en) | 1995-05-12 | 2004-08-19 | Seiko Epson Corp. | DEVICE FOR DIAGNOSTICING THE STATE OF THE LIVING ORGANISM AND CONTROL UNIT |
| CN1140582A (en) | 1995-07-20 | 1997-01-22 | 阿兹里尔·佩雷尔 | Method of assessing cardiovascular function |
| JP3794410B2 (en) | 1995-09-13 | 2006-07-05 | セイコーエプソン株式会社 | Health condition management device |
| JP3794409B2 (en) | 1995-09-13 | 2006-07-05 | セイコーエプソン株式会社 | Health condition management device |
| JP3641830B2 (en) | 1995-11-01 | 2005-04-27 | セイコーエプソン株式会社 | Biological condition measuring device |
| US5941837A (en) | 1995-12-18 | 1999-08-24 | Seiko Epson Corporation | Health management device and exercise support device |
| JPH09220207A (en) | 1996-02-19 | 1997-08-26 | Omron Corp | Blood pressure calculation device |
| DE69735683T2 (en) | 1996-03-22 | 2006-10-19 | Seiko Epson Corp. | Device for measuring the intensity of movement |
| CN1155332C (en) | 1996-04-17 | 2004-06-30 | 精工爱普生株式会社 | Arrhythmia detector |
| JP3876889B2 (en) * | 1996-06-12 | 2007-02-07 | セイコーエプソン株式会社 | Body temperature measuring device |
| US6030342A (en) | 1996-06-12 | 2000-02-29 | Seiko Epson Corporation | Device for measuring calorie expenditure and device for measuring body temperature |
| JP4096376B2 (en) * | 1996-07-09 | 2008-06-04 | セイコーエプソン株式会社 | Relaxation instruction equipment |
| US5720292A (en) * | 1996-07-31 | 1998-02-24 | Medwave, Inc. | Beat onset detector |
| US5772601A (en) | 1996-08-26 | 1998-06-30 | Colin Corporation | Apparatus for evaluating cardiac function of living subject |
| DE69618457T2 (en) | 1996-08-28 | 2002-09-12 | Colin Corp | Device for evaluating the heart function of a living being |
| US6081742A (en) | 1996-09-10 | 2000-06-27 | Seiko Epson Corporation | Organism state measuring device and relaxation instructing device |
| US5865755A (en) * | 1996-10-11 | 1999-02-02 | Dxtek, Inc. | Method and apparatus for non-invasive, cuffless, continuous blood pressure determination |
| US5980464A (en) | 1996-12-19 | 1999-11-09 | Colin Corporation | Apparatus for evaluating exercise function of person |
| JPH10185639A (en) | 1996-12-27 | 1998-07-14 | Tokyo Gas Co Ltd | Flowmeter |
| JP3870514B2 (en) | 1997-10-31 | 2007-01-17 | セイコーエプソン株式会社 | Stroke volume detection device and cardiac function diagnosis device |
| US5865756A (en) | 1997-06-06 | 1999-02-02 | Southwest Research Institute | System and method for identifying and correcting abnormal oscillometric pulse waves |
| JP3842390B2 (en) | 1997-07-16 | 2006-11-08 | 元治 長谷川 | Blood pressure measurement device and cardiac function analysis device |
| EP0947160B1 (en) | 1997-08-26 | 2006-03-01 | Seiko Epson Corporation | Pulse wave diagnosing device |
| JP3882204B2 (en) | 1997-11-19 | 2007-02-14 | セイコーエプソン株式会社 | Pulse wave detector |
| CN1326489C (en) | 1997-11-20 | 2007-07-18 | 精工爱普生株式会社 | Pulse wave diagnostic apparatus, blood pressure monitor, pulse shape monitor and pharmacologic effect moritor |
| JP3820719B2 (en) | 1997-12-24 | 2006-09-13 | セイコーエプソン株式会社 | Biological condition measuring device |
| JP3921775B2 (en) * | 1998-01-27 | 2007-05-30 | オムロンヘルスケア株式会社 | Blood pressure monitoring device |
| IL128482A (en) * | 1999-02-11 | 2003-06-24 | Ultrasis Internat 1993 Ltd | Method and device for continuous analysis of cardiovascular activity of a subject |
| NZ521115A (en) | 2000-03-02 | 2004-05-28 | Itamar Medical Ltd | Method and apparatus for the non-invasive detection of particular sleep-state conditions by monitoring the peripheral vascular system |
| US7806831B2 (en) | 2000-03-02 | 2010-10-05 | Itamar Medical Ltd. | Method and apparatus for the non-invasive detection of particular sleep-state conditions by monitoring the peripheral vascular system |
| US6955648B2 (en) | 2000-09-29 | 2005-10-18 | New Health Sciences, Inc. | Precision brain blood flow assessment remotely in real time using nanotechnology ultrasound |
| US6918879B2 (en) * | 2000-10-09 | 2005-07-19 | Healthstats International Pte. Ltd. | Method and device for monitoring blood pressure |
| SG94349A1 (en) | 2000-10-09 | 2003-02-18 | Healthstats Int Pte Ltd | Method and device for monitoring blood pressure |
| JP2002224059A (en) | 2001-01-31 | 2002-08-13 | Omron Corp | Electronic sphygmomanometer |
| JP2002224061A (en) * | 2001-01-31 | 2002-08-13 | Omron Corp | Electronic sphygmomanometer |
| JP3495344B2 (en) | 2001-05-16 | 2004-02-09 | 日本コーリン株式会社 | Pressure pulse wave detector |
| JP4759860B2 (en) | 2001-07-11 | 2011-08-31 | セイコーエプソン株式会社 | Anoxic work threshold detection device |
| US6773397B2 (en) | 2001-10-11 | 2004-08-10 | Draeger Medical Systems, Inc. | System for processing signal data representing physiological parameters |
| US6730038B2 (en) | 2002-02-05 | 2004-05-04 | Tensys Medical, Inc. | Method and apparatus for non-invasively measuring hemodynamic parameters using parametrics |
| US6805673B2 (en) | 2002-02-22 | 2004-10-19 | Datex-Ohmeda, Inc. | Monitoring mayer wave effects based on a photoplethysmographic signal |
| TW570769B (en) | 2002-04-26 | 2004-01-11 | Chin-Yu Lin | Method and device for measuring pulse signals for simultaneously obtaining pulse pressure and blood flow rate |
| US6869402B2 (en) | 2002-08-27 | 2005-03-22 | Precision Pulsus, Inc. | Method and apparatus for measuring pulsus paradoxus |
| DE10243265A1 (en) | 2002-09-17 | 2004-03-25 | Andreas Nuske | Heart condition diagnosis method is based on analysis of bioelectrical signals recorded using a measurement glove that has a pulse sensor and electronics with an evaluation algorithm stored in ROM |
| US8672852B2 (en) * | 2002-12-13 | 2014-03-18 | Intercure Ltd. | Apparatus and method for beneficial modification of biorhythmic activity |
| US20050096557A1 (en) * | 2003-01-08 | 2005-05-05 | Frederick Vosburgh | Noninvasive cardiovascular monitoring methods and devices |
| JP4025220B2 (en) | 2003-03-03 | 2007-12-19 | ▲苅▼尾 七臣 | Blood pressure monitor and cardiovascular disease risk analysis program |
| US7524292B2 (en) | 2003-04-21 | 2009-04-28 | Medtronic, Inc. | Method and apparatus for detecting respiratory disturbances |
| JP4327524B2 (en) | 2003-07-03 | 2009-09-09 | ▲苅▼尾 七臣 | Blood pressure abnormality inspection device at load change |
| US7244225B2 (en) * | 2003-10-07 | 2007-07-17 | Cardiomedics, Inc. | Devices and methods for non-invasively improving blood circulation |
| EP1711102A4 (en) * | 2004-01-27 | 2009-11-04 | Spirocor Ltd | Method and system for cardiovascular system diagnosis |
| JP2005237472A (en) | 2004-02-24 | 2005-09-08 | 七臣 ▲苅▼尾 | Sphygmomanometry instrument |
| JP3987053B2 (en) * | 2004-03-30 | 2007-10-03 | 株式会社東芝 | Sleep state determination device and sleep state determination method |
| US7828711B2 (en) | 2004-08-16 | 2010-11-09 | Cardiac Pacemakers, Inc. | Method and apparatus for modulating cellular growth and regeneration using ventricular assist device |
| US20060047202A1 (en) | 2004-09-02 | 2006-03-02 | Elliott Stephen B | Method and system of breathing therapy for reducing sympathetic predominance with consequent positive modification of hypertension |
| CN1284512C (en) * | 2004-10-21 | 2006-11-15 | 中国人民解放军空军航空医学研究所 | Digital medical information monitoring and control system for full ward |
| JP4752259B2 (en) | 2004-12-10 | 2011-08-17 | オムロンヘルスケア株式会社 | Electronic blood pressure monitor and blood pressure measurement system |
| WO2006079829A1 (en) * | 2005-01-27 | 2006-08-03 | Uws Ventures Limited | Phosphoglycerides for use in improving heart rate recovery and increasing exercise capacity |
| JP4342455B2 (en) | 2005-02-03 | 2009-10-14 | 株式会社東芝 | Health management device and health management system |
| US20060195035A1 (en) * | 2005-02-28 | 2006-08-31 | Dehchuan Sun | Non-invasive radial artery blood pressure waveform measuring apparatus system and uses thereof |
| CA2602899A1 (en) * | 2005-03-21 | 2006-09-28 | Software Solutions Limited | System for continuous blood pressure monitoring |
| US8423108B2 (en) * | 2005-03-24 | 2013-04-16 | Intelomed, Inc. | Device and system that identifies cardiovascular insufficiency |
| DE102005014950A1 (en) * | 2005-04-01 | 2006-10-12 | Braun Gmbh | Method for determining cardiovascular parameters and device and computer program product for carrying out the method |
| JP5687741B2 (en) | 2005-04-22 | 2015-03-18 | フクダ電子株式会社 | Biological information output device and method, and biological information report |
| WO2006121455A1 (en) | 2005-05-10 | 2006-11-16 | The Salk Institute For Biological Studies | Dynamic signal processing |
| CN1723839A (en) * | 2005-07-21 | 2006-01-25 | 高春平 | Method and device for testing health-index of individualized and three-D type |
| CN1903117A (en) * | 2005-07-27 | 2007-01-31 | 孙德铨 | Non penetration type system for measuring radial artery blood pressure wave and its application |
| US8277387B2 (en) * | 2005-10-24 | 2012-10-02 | Koninklijke Philips Electronics N.V. | System and method for determining the blood pressure of a patient |
| JP2007117591A (en) | 2005-10-31 | 2007-05-17 | Konica Minolta Sensing Inc | Pulse wave analyzer |
| EP1785088A1 (en) | 2005-11-14 | 2007-05-16 | Congener Wellness Corp. | A system and method for the management and control of cardiovascular related diseases, such as hypertension |
| CN1985750B (en) * | 2005-12-21 | 2011-03-23 | 深圳迈瑞生物医疗电子股份有限公司 | Pulse wave detecting method and device by means of cardiac symbol signal |
| JP2007190275A (en) | 2006-01-20 | 2007-08-02 | Omron Healthcare Co Ltd | Respiration training device |
| US7607243B2 (en) * | 2006-05-03 | 2009-10-27 | Nike, Inc. | Athletic or other performance sensing systems |
| JP4901309B2 (en) | 2006-05-31 | 2012-03-21 | 株式会社デンソー | Biological state detection device, control device, and pulse wave sensor mounting device |
| JP2008005964A (en) * | 2006-06-28 | 2008-01-17 | Omron Healthcare Co Ltd | Apnea controller and program for apnea control |
| JP2008061824A (en) | 2006-09-07 | 2008-03-21 | Omron Healthcare Co Ltd | Medical measuring instrument, biosignal waveform extraction method and biosignal waveform extraction program |
| US20080064965A1 (en) | 2006-09-08 | 2008-03-13 | Jay Gregory D | Devices and methods for measuring pulsus paradoxus |
| CN100466968C (en) * | 2006-09-29 | 2009-03-11 | 北京新兴阳升科技有限公司 | Detection method with blood pressure monitor and korotkoff sound delaying and pulse wave conducting time signal generator |
| JP4789203B2 (en) * | 2006-10-02 | 2011-10-12 | フクダ電子株式会社 | Blood pressure reflex function measuring device |
| US8652040B2 (en) * | 2006-12-19 | 2014-02-18 | Valencell, Inc. | Telemetric apparatus for health and environmental monitoring |
| US9044136B2 (en) | 2007-02-16 | 2015-06-02 | Cim Technology Inc. | Wearable mini-size intelligent healthcare system |
| US8047998B2 (en) | 2007-04-17 | 2011-11-01 | General Electric Company | Non-invasive blood pressure determination method |
| DE102007020038A1 (en) | 2007-04-27 | 2008-10-30 | Fraunhofer-Gesellschaft zur Förderung der angewandten Forschung e.V. | Evidence of apnea with blood pressure dependent detected signals |
| US20080319327A1 (en) | 2007-06-25 | 2008-12-25 | Triage Wireless, Inc. | Body-worn sensor featuring a low-power processor and multi-sensor array for measuring blood pressure |
| JP4714194B2 (en) | 2007-08-09 | 2011-06-29 | オムロンヘルスケア株式会社 | Blood pressure measurement device |
| US20090124914A1 (en) | 2007-11-08 | 2009-05-14 | Kuo Terry B J | Analysis system and a method for pulse diagnosis in chinese medicine |
| US20090156946A1 (en) | 2007-12-13 | 2009-06-18 | Welch Allyn, Inc. | Blood pressure motion sensing |
| JP5045514B2 (en) | 2008-03-19 | 2012-10-10 | オムロンヘルスケア株式会社 | Electronic blood pressure monitor |
| JP5151690B2 (en) | 2008-05-27 | 2013-02-27 | オムロンヘルスケア株式会社 | Blood pressure information measuring device and index acquisition method |
| JP5211910B2 (en) | 2008-07-23 | 2013-06-12 | オムロンヘルスケア株式会社 | Biological information management system and measuring instrument |
| JP5336803B2 (en) | 2008-09-26 | 2013-11-06 | 株式会社東芝 | Pulse wave measuring device |
| JP5185785B2 (en) * | 2008-11-19 | 2013-04-17 | オムロンヘルスケア株式会社 | Health condition judgment device |
| EP2189111A1 (en) | 2008-11-21 | 2010-05-26 | Pulsion Medical Systems AG | Apparatus and method for determining a physiologic parameter |
| CN101773387B (en) | 2009-01-08 | 2011-12-14 | 香港中文大学 | Body feeling network-based sleeveless driven pulse pressure measurement and automatic calibration device |
| JP2010200901A (en) * | 2009-03-02 | 2010-09-16 | Nippon Koden Corp | Biological signal measuring apparatus |
| JP5209545B2 (en) | 2009-03-09 | 2013-06-12 | 株式会社デンソー | Biopsy device, program, and recording medium |
| US20100268097A1 (en) | 2009-03-20 | 2010-10-21 | Edwards Lifesciences Corporation | Monitoring Peripheral Decoupling |
| US8057400B2 (en) * | 2009-05-12 | 2011-11-15 | Angiologix, Inc. | System and method of measuring changes in arterial volume of a limb segment |
| KR101640498B1 (en) | 2009-05-22 | 2016-07-19 | 삼성전자주식회사 | Blood pressure estimating apparatus and method by using variable characteristic ratio |
| CN201409913Y (en) | 2009-06-10 | 2010-02-24 | 吕景文 | Individual physical index monitoring system |
| SG10201502886VA (en) | 2009-08-13 | 2015-05-28 | Hidetsugu Asanoi | Device For Calculating Respiratory Waveform Information And Medical Device Using Respiratory Waveform Information |
| CN102043893A (en) * | 2009-10-13 | 2011-05-04 | 北京大学 | Disease pre-warning method and system |
| JP5536582B2 (en) | 2009-10-22 | 2014-07-02 | 日本光電工業株式会社 | Biological parameter display device |
| WO2011094487A2 (en) | 2010-01-29 | 2011-08-04 | Edwards Lifesciences Corporation | Elimination of the effects of irregular cardiac cycles in the determination of cardiovascular parameters |
| US8668649B2 (en) * | 2010-02-04 | 2014-03-11 | Siemens Medical Solutions Usa, Inc. | System for cardiac status determination |
| EP2364640A1 (en) | 2010-03-11 | 2011-09-14 | BIOTRONIK SE & Co. KG | Monitoring device and method for operating a monitoring device |
| JP5504477B2 (en) * | 2010-03-16 | 2014-05-28 | 国立大学法人富山大学 | Fingertip pulse wave analyzer and vascular endothelial function evaluation system using the same |
| US8834378B2 (en) | 2010-07-30 | 2014-09-16 | Nellcor Puritan Bennett Ireland | Systems and methods for determining respiratory effort |
| US8315812B2 (en) | 2010-08-12 | 2012-11-20 | Heartflow, Inc. | Method and system for patient-specific modeling of blood flow |
| EP2752156B1 (en) * | 2011-01-24 | 2017-09-27 | Act Medical Service Co., Ltd. | Blood vessel pulse-wave measuring system |
| JP5605269B2 (en) * | 2011-02-28 | 2014-10-15 | セイコーエプソン株式会社 | Beat detector |
| JP5623955B2 (en) * | 2011-03-29 | 2014-11-12 | シチズンホールディングス株式会社 | Sphygmomanometer |
| EP2524647A1 (en) * | 2011-05-18 | 2012-11-21 | Alain Gilles Muzet | System and method for determining sleep stages of a person |
| JP5738673B2 (en) | 2011-05-24 | 2015-06-24 | オムロンヘルスケア株式会社 | Blood pressure measurement device |
| BR112014001283A2 (en) * | 2011-07-18 | 2017-02-21 | Critical Care Diagnostics Inc | Cardiovascular disease treatment methods and prevention of the effectiveness of exercise therapy |
| JP2013031568A (en) | 2011-08-02 | 2013-02-14 | Tdk Corp | Method and apparatus for monitoring respiration, and sphygmomanometer with respiration monitoring function |
| EP2755551B1 (en) | 2011-09-16 | 2016-08-17 | Koninklijke Philips N.V. | Device and method for estimating the heart rate during motion |
| SG11201400904SA (en) | 2011-09-30 | 2014-04-28 | Somalogic Inc | Cardiovascular risk event prediction and uses thereof |
| JP5927843B2 (en) | 2011-10-28 | 2016-06-01 | セイコーエプソン株式会社 | Congestion determination device, pulse wave measurement device, and congestion determination method |
| US9049995B2 (en) * | 2012-01-12 | 2015-06-09 | Pacesetter, Inc. | System and method for detecting pulmonary congestion based on stroke volume using an implantable medical device |
| WO2013113055A1 (en) | 2012-01-30 | 2013-08-08 | Campbell Duncan Islay | Method and apparatus for non-invasive determination of cardiac output |
| JP5953878B2 (en) | 2012-03-30 | 2016-07-20 | 富士通株式会社 | State change detection method, program, and apparatus |
| US10405791B2 (en) * | 2013-03-15 | 2019-09-10 | Yingchang Yang | Method and continuously wearable noninvasive apparatus for automatically detecting a stroke and other abnormal health conditions |
| CN102697506B (en) | 2012-05-29 | 2014-11-26 | 广州乾华生物科技有限公司 | Method and system for monitoring action response condition |
| JP5984088B2 (en) * | 2012-06-15 | 2016-09-06 | 国立大学法人 東京大学 | Noninvasive continuous blood pressure monitoring method and apparatus |
| JP2014014556A (en) | 2012-07-10 | 2014-01-30 | Omron Healthcare Co Ltd | Electronic sphygmomanometer and sphygmomanometry method |
| JP6019854B2 (en) | 2012-07-13 | 2016-11-02 | セイコーエプソン株式会社 | Blood pressure measuring device and parameter correction method for central blood pressure estimation |
| JP2015013635A (en) * | 2012-12-27 | 2015-01-22 | 株式会社東海理化電機製作所 | Tire position determination system |
| EP2759257B1 (en) | 2013-01-25 | 2016-09-14 | UP-MED GmbH | Method, logic unit and system for determining a parameter representative for the patient's volume responsiveness |
| JP2014171589A (en) | 2013-03-07 | 2014-09-22 | Seiko Epson Corp | Atrial fibrillation analyzation equipment and program |
| US9345436B2 (en) | 2013-03-14 | 2016-05-24 | HighDim GmbH | Apparatus and methods for computing cardiac output of a living subject |
| US9949696B2 (en) | 2013-03-14 | 2018-04-24 | Tensys Medical, Inc. | Apparatus and methods for computing cardiac output of a living subject via applanation tonometry |
| CN103126655B (en) | 2013-03-14 | 2014-10-08 | 浙江大学 | Non-binding goal non-contact pulse wave acquisition system and sampling method |
| CN103230268B (en) | 2013-03-22 | 2016-02-03 | 浙江理工大学 | A kind of human body detection device that can carry out remote monitoring |
| US10390761B2 (en) | 2013-04-16 | 2019-08-27 | Kyocera Corporation | Device, device control method and control program, and system |
| CN104138253B (en) * | 2013-05-11 | 2016-06-15 | 吴健康 | A kind of noinvasive arteriotony method for continuous measuring and equipment |
| CN103230267B (en) | 2013-05-14 | 2015-06-03 | 北京理工大学 | Anti-movement-interference extraction method for pulse rates |
| US9314211B2 (en) | 2013-07-31 | 2016-04-19 | Omron Healthcare Co., Ltd. | Blood pressure measurement device having function of determining rest condition of patient |
| CN103479343B (en) * | 2013-09-27 | 2015-02-25 | 上海交通大学 | Central aortic pressure detection system and method based on oscillating sphygmomanometer signals |
| JP6347097B2 (en) | 2013-10-07 | 2018-06-27 | セイコーエプソン株式会社 | Portable device and heartbeat arrival time measurement control method |
| US20150164351A1 (en) * | 2013-10-23 | 2015-06-18 | Quanttus, Inc. | Calculating pulse transit time from chest vibrations |
| US20150112208A1 (en) * | 2013-10-23 | 2015-04-23 | Quanttus, Inc. | Medication management |
| JP5911840B2 (en) | 2013-11-25 | 2016-04-27 | 株式会社カオテック研究所 | Diagnostic data generation device and diagnostic device |
| US20150196209A1 (en) * | 2014-01-15 | 2015-07-16 | Microsoft Corporation | Cardiovascular risk factor sensing device |
| CN104055496B (en) | 2014-01-15 | 2016-04-20 | 中国航天员科研训练中心 | A kind of method of estimation of the sports load level based on heart source property signal |
| CN103892811B (en) * | 2014-01-22 | 2016-09-07 | 杭州优体科技有限公司 | A kind of ambulatory blood pressure joint-detection and the system of analysis |
| CN104808776A (en) * | 2014-01-24 | 2015-07-29 | 北京奇虎科技有限公司 | Device and method for detecting continuous attaching of head-wearing intelligent device on human body |
| JP6282887B2 (en) | 2014-02-28 | 2018-02-21 | 国立大学法人広島大学 | Blood pressure measuring device and blood pressure measuring method |
| WO2015153569A1 (en) | 2014-03-31 | 2015-10-08 | The Regents Of The University Of Michigan | Miniature piezoelectric cardiovascular monitoring system |
| WO2015162566A1 (en) * | 2014-04-24 | 2015-10-29 | Ecole Polytechnique Federale De Lausanne (Epfl) | A method and a device for non invasive blood pressure measurement |
| WO2015178439A2 (en) | 2014-05-20 | 2015-11-26 | 株式会社Ainy | Device and method for supporting diagnosis of central/obstructive sleep apnea, and computer-readable medium having stored thereon program for supporting diagnosis of central/obstructive sleep apnea |
| JP6358865B2 (en) | 2014-06-13 | 2018-07-18 | 株式会社デンソー | Sphygmomanometer |
| CN104091080B (en) * | 2014-07-14 | 2017-02-22 | 中国科学院合肥物质科学研究院 | Intelligent bodybuilding guidance system and closed-loop guidance method thereof |
| CN107072594B (en) | 2014-07-28 | 2020-11-06 | S V Siu联合有限责任公司 | Method and apparatus for assessing respiratory distress |
| WO2016017579A1 (en) * | 2014-07-28 | 2016-02-04 | シナノケンシ株式会社 | Biological information reading device |
| CN105455797B (en) | 2014-08-19 | 2020-01-07 | 南京茂森电子技术有限公司 | Autonomic nerve heart regulation function measuring method and device |
| WO2016031196A1 (en) * | 2014-08-27 | 2016-03-03 | 日本電気株式会社 | Blood pressure determination device, blood pressure determination method, recording medium for recording blood pressure determination program, and blood pressure measurement device |
| CN104188639B (en) * | 2014-09-10 | 2017-02-15 | 朱宇东 | Ambulatory blood pressure continuous monitoring and real-time analysis system |
| JP6280487B2 (en) | 2014-10-16 | 2018-02-14 | 東京エレクトロン株式会社 | Substrate processing method and substrate processing apparatus |
| JP6366463B2 (en) | 2014-10-31 | 2018-08-01 | オムロンヘルスケア株式会社 | Blood pressure measurement device |
| CN104352228A (en) | 2014-11-10 | 2015-02-18 | 小米科技有限责任公司 | Method and device for processing application program |
| CN104382569B (en) * | 2014-12-08 | 2017-04-12 | 天津工业大学 | Fiber-optic sensing intelligent garment and heart sound parameter processing methods thereof |
| CN104665799A (en) | 2015-01-26 | 2015-06-03 | 周常安 | Blood pressure managing device and blood pressure managing method |
| WO2016119656A1 (en) | 2015-01-26 | 2016-08-04 | 周常安 | Cardiovascular health monitoring device and method |
| CN104665821A (en) | 2015-01-26 | 2015-06-03 | 周常安 | Cardiovascular health monitoring device and cardiovascular health monitoring method |
| CN204618202U (en) | 2015-03-11 | 2015-09-09 | 佛山职业技术学院 | A kind of intelligent bangle of athlete's status data remote capture |
| CN204708829U (en) | 2015-04-24 | 2015-10-21 | 吉林大学 | A kind of wireless breathing, pulse monitoring device |
| CN104856661A (en) | 2015-05-11 | 2015-08-26 | 北京航空航天大学 | Wearable continuous blood pressure estimating system and method based on dynamic compensation of diastolic blood pressure |
| CN105030195A (en) | 2015-06-02 | 2015-11-11 | 牛欣 | Three-position and nine-indicator multi-information acquisition and recognition device based on finger feel pressure application and microarray sensing |
| CN104958064A (en) | 2015-07-15 | 2015-10-07 | 四川宇峰科技发展有限公司 | Wearable arteriosclerosis detector and pulse wave velocity detecting method |
| CN105054918B (en) | 2015-07-28 | 2018-05-22 | 杭州暖芯迦电子科技有限公司 | A kind of blood pressure computational methods and blood pressure instrument based on the pulse reflective wave transmission time |
| CN105078474A (en) | 2015-08-21 | 2015-11-25 | 武汉苏酷科技有限公司 | Blood glucose and blood pressure monitoring and control system |
| CN105266828A (en) | 2015-09-05 | 2016-01-27 | 于清 | Sports psychology index data acquisition analysis and processing device |
| CN204909471U (en) | 2015-09-05 | 2015-12-30 | 于清 | Acquisition and analysis processing apparatus of sports psychology index data |
| CN105361858B (en) | 2015-12-10 | 2018-04-03 | 广东小天才科技有限公司 | A kind of method and wearable device of blood pressure data processing |
| JP6631376B2 (en) | 2016-04-15 | 2020-01-15 | オムロンヘルスケア株式会社 | Pulse wave detecting device, biological information measuring device, control method of pulse wave detecting device, and control program of pulse wave detecting device |
| US11076813B2 (en) | 2016-07-22 | 2021-08-03 | Edwards Lifesciences Corporation | Mean arterial pressure (MAP) derived prediction of future hypotension |
-
2017
- 2017-04-14 CN CN201780022528.0A patent/CN109069035B/en active Active
- 2017-04-14 EP EP17782515.5A patent/EP3427653B1/en active Active
- 2017-04-14 WO PCT/JP2017/015274 patent/WO2017179693A1/en active Application Filing
- 2017-04-14 US US16/092,060 patent/US20190159722A1/en not_active Abandoned
- 2017-04-14 EP EP17782513.0A patent/EP3427656B1/en active Active
- 2017-04-14 US US16/092,097 patent/US11617516B2/en active Active
- 2017-04-14 US US16/092,134 patent/US20190090818A1/en not_active Abandoned
- 2017-04-14 JP JP2018512087A patent/JP6687263B2/en active Active
- 2017-04-14 US US16/092,136 patent/US20190117084A1/en not_active Abandoned
- 2017-04-14 EP EP17782514.8A patent/EP3427652B1/en active Active
- 2017-04-14 CN CN201780022527.6A patent/CN108882867B/en active Active
- 2017-04-14 US US16/092,076 patent/US20190159723A1/en not_active Abandoned
- 2017-04-14 US US16/092,159 patent/US11246501B2/en active Active
- 2017-04-14 US US16/092,095 patent/US20190150755A1/en not_active Abandoned
- 2017-04-14 CN CN201780022781.6A patent/CN108882878B/en active Active
- 2017-04-14 EP EP17782509.8A patent/EP3427655B1/en active Active
- 2017-04-14 CN CN201780022530.8A patent/CN109069013B/en active Active
- 2017-04-14 WO PCT/JP2017/015278 patent/WO2017179697A1/en active Application Filing
- 2017-04-14 CN CN201780022567.0A patent/CN108882872B/en active Active
- 2017-04-14 EP EP17782508.0A patent/EP3427649B1/en active Active
- 2017-04-14 JP JP2018512092A patent/JP6679006B2/en active Active
- 2017-04-14 WO PCT/JP2017/015277 patent/WO2017179696A1/en active Application Filing
- 2017-04-14 US US16/092,126 patent/US20190159682A1/en not_active Abandoned
- 2017-04-14 JP JP2018512094A patent/JP6721155B2/en active Active
- 2017-04-14 EP EP17782506.4A patent/EP3427648A4/en active Pending
- 2017-04-14 WO PCT/JP2017/015283 patent/WO2017179702A1/en active Application Filing
- 2017-04-14 JP JP2018512091A patent/JP6721154B2/en active Active
- 2017-04-14 US US16/092,151 patent/US11363961B2/en active Active
- 2017-04-14 JP JP2018512095A patent/JP6721156B2/en active Active
- 2017-04-14 EP EP17782510.6A patent/EP3427650B1/en active Active
- 2017-04-14 JP JP2018512089A patent/JP6679005B2/en active Active
- 2017-04-14 US US16/092,167 patent/US20190110700A1/en not_active Abandoned
- 2017-04-14 WO PCT/JP2017/015280 patent/WO2017179699A1/en active Application Filing
- 2017-04-14 EP EP17782507.2A patent/EP3430989B1/en active Active
- 2017-04-14 US US16/092,113 patent/US20190159685A1/en not_active Abandoned
- 2017-04-14 JP JP2018512086A patent/JP6835395B2/en active Active
- 2017-04-14 JP JP2018512088A patent/JP6659830B2/en active Active
- 2017-04-14 CN CN201780022537.XA patent/CN108882877B/en active Active
- 2017-04-14 CN CN201780022565.1A patent/CN108882870B/en active Active
- 2017-04-14 WO PCT/JP2017/015276 patent/WO2017179695A1/en active Application Filing
- 2017-04-14 WO PCT/JP2017/015281 patent/WO2017179700A1/en active Application Filing
- 2017-04-14 JP JP2018512090A patent/JP6721153B2/en active Active
- 2017-04-14 EP EP17782516.3A patent/EP3427654A4/en not_active Ceased
- 2017-04-14 CN CN201780022536.5A patent/CN108882869B/en active Active
- 2017-04-14 CN CN201780022568.5A patent/CN108882873B/en active Active
- 2017-04-14 WO PCT/JP2017/015279 patent/WO2017179698A1/en active Application Filing
- 2017-04-14 WO PCT/JP2017/015284 patent/WO2017179703A1/en active Application Filing
- 2017-04-14 WO PCT/JP2017/015275 patent/WO2017179694A1/en active Application Filing
- 2017-04-14 JP JP2018512093A patent/JP6679051B2/en active Active
- 2017-04-14 CN CN201780022529.5A patent/CN108882868B/en active Active
- 2017-04-14 WO PCT/JP2017/015282 patent/WO2017179701A1/en active Application Filing
- 2017-04-14 JP JP2018512096A patent/JP6659831B2/en active Active
- 2017-04-14 EP EP17782511.4A patent/EP3427651A4/en active Pending
- 2017-04-14 CN CN201780022566.6A patent/CN108882871B/en active Active
- 2017-04-14 EP EP17782512.2A patent/EP3440995B1/en active Active
Also Published As
Similar Documents
| Publication | Publication Date | Title |
|---|---|---|
| EP3427656B1 (en) | Biological information analysis device, system, and program |
Legal Events
| Date | Code | Title | Description |
|---|---|---|---|
| STAA | Information on the status of an ep patent application or granted ep patent |
Free format text: STATUS: THE INTERNATIONAL PUBLICATION HAS BEEN MADE |
|
| PUAI | Public reference made under article 153(3) epc to a published international application that has entered the european phase |
Free format text: ORIGINAL CODE: 0009012 |
|
| STAA | Information on the status of an ep patent application or granted ep patent |
Free format text: STATUS: REQUEST FOR EXAMINATION WAS MADE |
|
| 17P | Request for examination filed |
Effective date: 20181008 |
|
| AK | Designated contracting states |
Kind code of ref document: A1 Designated state(s): AL AT BE BG CH CY CZ DE DK EE ES FI FR GB GR HR HU IE IS IT LI LT LU LV MC MK MT NL NO PL PT RO RS SE SI SK SM TR |
|
| AX | Request for extension of the european patent |
Extension state: BA ME |
|
| DAV | Request for validation of the european patent (deleted) | ||
| DAX | Request for extension of the european patent (deleted) | ||
| A4 | Supplementary search report drawn up and despatched |
Effective date: 20191113 |
|
| RIC1 | Information provided on ipc code assigned before grant |
Ipc: A61B 5/145 20060101ALN20191107BHEP Ipc: A61B 5/11 20060101ALN20191107BHEP Ipc: A61B 5/021 20060101AFI20191107BHEP Ipc: A61B 5/00 20060101ALN20191107BHEP Ipc: A61B 5/022 20060101ALN20191107BHEP Ipc: A61B 5/08 20060101ALN20191107BHEP |
|
| STAA | Information on the status of an ep patent application or granted ep patent |
Free format text: STATUS: EXAMINATION IS IN PROGRESS |
|
| 17Q | First examination report despatched |
Effective date: 20200914 |
|
| STAA | Information on the status of an ep patent application or granted ep patent |
Free format text: STATUS: EXAMINATION IS IN PROGRESS |
|
| REG | Reference to a national code |
Ref country code: DE Ref legal event code: R079 Ref document number: 602017067216 Country of ref document: DE Free format text: PREVIOUS MAIN CLASS: A61B0005022000 Ipc: A61B0005021000 |
|
| GRAP | Despatch of communication of intention to grant a patent |
Free format text: ORIGINAL CODE: EPIDOSNIGR1 |
|
| STAA | Information on the status of an ep patent application or granted ep patent |
Free format text: STATUS: GRANT OF PATENT IS INTENDED |
|
| RIC1 | Information provided on ipc code assigned before grant |
Ipc: A61B 5/00 20060101ALN20221102BHEP Ipc: A61B 5/145 20060101ALN20221102BHEP Ipc: A61B 5/11 20060101ALN20221102BHEP Ipc: A61B 5/08 20060101ALN20221102BHEP Ipc: A61B 5/022 20060101ALN20221102BHEP Ipc: A61B 5/021 20060101AFI20221102BHEP |
|
| RIC1 | Information provided on ipc code assigned before grant |
Ipc: A61B 5/00 20060101ALN20221111BHEP Ipc: A61B 5/145 20060101ALN20221111BHEP Ipc: A61B 5/11 20060101ALN20221111BHEP Ipc: A61B 5/08 20060101ALN20221111BHEP Ipc: A61B 5/022 20060101ALN20221111BHEP Ipc: A61B 5/021 20060101AFI20221111BHEP |
|
| INTG | Intention to grant announced |
Effective date: 20221128 |
|
| RIN1 | Information on inventor provided before grant (corrected) |
Inventor name: TSUTSUMI, MASAKAZU Inventor name: MIYAGAWA, KEN Inventor name: SATO, HIRONORI Inventor name: KUWABARA, MITSUO Inventor name: SHIGA, TOSHIKAZU Inventor name: OTA, YUYA Inventor name: KOKUBO, AYAKO Inventor name: OBAYASHI, KEIICHI Inventor name: UENOYAMA, TORU Inventor name: KAN, ERIKO Inventor name: KASAI, MASAAKI Inventor name: TSUCHIYA, NAOKI Inventor name: WADA, HIROTAKA Inventor name: NAKAJIMA, HIROSHI |
|
| GRAS | Grant fee paid |
Free format text: ORIGINAL CODE: EPIDOSNIGR3 |
|
| GRAA | (expected) grant |
Free format text: ORIGINAL CODE: 0009210 |
|
| STAA | Information on the status of an ep patent application or granted ep patent |
Free format text: STATUS: THE PATENT HAS BEEN GRANTED |
|
| AK | Designated contracting states |
Kind code of ref document: B1 Designated state(s): AL AT BE BG CH CY CZ DE DK EE ES FI FR GB GR HR HU IE IS IT LI LT LU LV MC MK MT NL NO PL PT RO RS SE SI SK SM TR |
|
| RAP3 | Party data changed (applicant data changed or rights of an application transferred) |
Owner name: OMRON HEALTHCARE CO., LTD. Owner name: OMRON CORPORATION |
|
| REG | Reference to a national code |
Ref country code: CH Ref legal event code: EP |
|
| REG | Reference to a national code |
Ref country code: DE Ref legal event code: R096 Ref document number: 602017067216 Country of ref document: DE |
|
| REG | Reference to a national code |
Ref country code: AT Ref legal event code: REF Ref document number: 1556111 Country of ref document: AT Kind code of ref document: T Effective date: 20230415 |
|
| REG | Reference to a national code |
Ref country code: IE Ref legal event code: FG4D |
|
| REG | Reference to a national code |
Ref country code: LT Ref legal event code: MG9D |
|
| PG25 | Lapsed in a contracting state [announced via postgrant information from national office to epo] |
Ref country code: RS Free format text: LAPSE BECAUSE OF FAILURE TO SUBMIT A TRANSLATION OF THE DESCRIPTION OR TO PAY THE FEE WITHIN THE PRESCRIBED TIME-LIMIT Effective date: 20230329 Ref country code: NO Free format text: LAPSE BECAUSE OF FAILURE TO SUBMIT A TRANSLATION OF THE DESCRIPTION OR TO PAY THE FEE WITHIN THE PRESCRIBED TIME-LIMIT Effective date: 20230629 Ref country code: LV Free format text: LAPSE BECAUSE OF FAILURE TO SUBMIT A TRANSLATION OF THE DESCRIPTION OR TO PAY THE FEE WITHIN THE PRESCRIBED TIME-LIMIT Effective date: 20230329 Ref country code: LT Free format text: LAPSE BECAUSE OF FAILURE TO SUBMIT A TRANSLATION OF THE DESCRIPTION OR TO PAY THE FEE WITHIN THE PRESCRIBED TIME-LIMIT Effective date: 20230329 Ref country code: HR Free format text: LAPSE BECAUSE OF FAILURE TO SUBMIT A TRANSLATION OF THE DESCRIPTION OR TO PAY THE FEE WITHIN THE PRESCRIBED TIME-LIMIT Effective date: 20230329 |
|
| PGFP | Annual fee paid to national office [announced via postgrant information from national office to epo] |
Ref country code: DE Payment date: 20230425 Year of fee payment: 7 |
|
| REG | Reference to a national code |
Ref country code: NL Ref legal event code: MP Effective date: 20230329 |
|
| REG | Reference to a national code |
Ref country code: AT Ref legal event code: MK05 Ref document number: 1556111 Country of ref document: AT Kind code of ref document: T Effective date: 20230329 |
|
| PG25 | Lapsed in a contracting state [announced via postgrant information from national office to epo] |
Ref country code: SE Free format text: LAPSE BECAUSE OF FAILURE TO SUBMIT A TRANSLATION OF THE DESCRIPTION OR TO PAY THE FEE WITHIN THE PRESCRIBED TIME-LIMIT Effective date: 20230329 Ref country code: NL Free format text: LAPSE BECAUSE OF FAILURE TO SUBMIT A TRANSLATION OF THE DESCRIPTION OR TO PAY THE FEE WITHIN THE PRESCRIBED TIME-LIMIT Effective date: 20230329 Ref country code: GR Free format text: LAPSE BECAUSE OF FAILURE TO SUBMIT A TRANSLATION OF THE DESCRIPTION OR TO PAY THE FEE WITHIN THE PRESCRIBED TIME-LIMIT Effective date: 20230630 Ref country code: FI Free format text: LAPSE BECAUSE OF FAILURE TO SUBMIT A TRANSLATION OF THE DESCRIPTION OR TO PAY THE FEE WITHIN THE PRESCRIBED TIME-LIMIT Effective date: 20230329 |
|
| PG25 | Lapsed in a contracting state [announced via postgrant information from national office to epo] |
Ref country code: SM Free format text: LAPSE BECAUSE OF FAILURE TO SUBMIT A TRANSLATION OF THE DESCRIPTION OR TO PAY THE FEE WITHIN THE PRESCRIBED TIME-LIMIT Effective date: 20230329 Ref country code: RO Free format text: LAPSE BECAUSE OF FAILURE TO SUBMIT A TRANSLATION OF THE DESCRIPTION OR TO PAY THE FEE WITHIN THE PRESCRIBED TIME-LIMIT Effective date: 20230329 Ref country code: PT Free format text: LAPSE BECAUSE OF FAILURE TO SUBMIT A TRANSLATION OF THE DESCRIPTION OR TO PAY THE FEE WITHIN THE PRESCRIBED TIME-LIMIT Effective date: 20230731 Ref country code: ES Free format text: LAPSE BECAUSE OF FAILURE TO SUBMIT A TRANSLATION OF THE DESCRIPTION OR TO PAY THE FEE WITHIN THE PRESCRIBED TIME-LIMIT Effective date: 20230329 Ref country code: EE Free format text: LAPSE BECAUSE OF FAILURE TO SUBMIT A TRANSLATION OF THE DESCRIPTION OR TO PAY THE FEE WITHIN THE PRESCRIBED TIME-LIMIT Effective date: 20230329 Ref country code: AT Free format text: LAPSE BECAUSE OF FAILURE TO SUBMIT A TRANSLATION OF THE DESCRIPTION OR TO PAY THE FEE WITHIN THE PRESCRIBED TIME-LIMIT Effective date: 20230329 |
|
| PG25 | Lapsed in a contracting state [announced via postgrant information from national office to epo] |
Ref country code: SK Free format text: LAPSE BECAUSE OF FAILURE TO SUBMIT A TRANSLATION OF THE DESCRIPTION OR TO PAY THE FEE WITHIN THE PRESCRIBED TIME-LIMIT Effective date: 20230329 Ref country code: PL Free format text: LAPSE BECAUSE OF FAILURE TO SUBMIT A TRANSLATION OF THE DESCRIPTION OR TO PAY THE FEE WITHIN THE PRESCRIBED TIME-LIMIT Effective date: 20230329 Ref country code: IS Free format text: LAPSE BECAUSE OF FAILURE TO SUBMIT A TRANSLATION OF THE DESCRIPTION OR TO PAY THE FEE WITHIN THE PRESCRIBED TIME-LIMIT Effective date: 20230729 |
|
| REG | Reference to a national code |
Ref country code: CH Ref legal event code: PL |
|
| PG25 | Lapsed in a contracting state [announced via postgrant information from national office to epo] |
Ref country code: LU Free format text: LAPSE BECAUSE OF NON-PAYMENT OF DUE FEES Effective date: 20230414 |
|
| REG | Reference to a national code |
Ref country code: DE Ref legal event code: R097 Ref document number: 602017067216 Country of ref document: DE |
|
| REG | Reference to a national code |
Ref country code: BE Ref legal event code: MM Effective date: 20230430 |
|
| PG25 | Lapsed in a contracting state [announced via postgrant information from national office to epo] |
Ref country code: MC Free format text: LAPSE BECAUSE OF FAILURE TO SUBMIT A TRANSLATION OF THE DESCRIPTION OR TO PAY THE FEE WITHIN THE PRESCRIBED TIME-LIMIT Effective date: 20230329 |
|
| PG25 | Lapsed in a contracting state [announced via postgrant information from national office to epo] |
Ref country code: MC Free format text: LAPSE BECAUSE OF FAILURE TO SUBMIT A TRANSLATION OF THE DESCRIPTION OR TO PAY THE FEE WITHIN THE PRESCRIBED TIME-LIMIT Effective date: 20230329 Ref country code: LI Free format text: LAPSE BECAUSE OF NON-PAYMENT OF DUE FEES Effective date: 20230430 Ref country code: DK Free format text: LAPSE BECAUSE OF FAILURE TO SUBMIT A TRANSLATION OF THE DESCRIPTION OR TO PAY THE FEE WITHIN THE PRESCRIBED TIME-LIMIT Effective date: 20230329 Ref country code: CZ Free format text: LAPSE BECAUSE OF FAILURE TO SUBMIT A TRANSLATION OF THE DESCRIPTION OR TO PAY THE FEE WITHIN THE PRESCRIBED TIME-LIMIT Effective date: 20230329 Ref country code: CH Free format text: LAPSE BECAUSE OF NON-PAYMENT OF DUE FEES Effective date: 20230430 |
|
| PLBE | No opposition filed within time limit |
Free format text: ORIGINAL CODE: 0009261 |
|
| STAA | Information on the status of an ep patent application or granted ep patent |
Free format text: STATUS: NO OPPOSITION FILED WITHIN TIME LIMIT |
|
| REG | Reference to a national code |
Ref country code: IE Ref legal event code: MM4A |
|
| GBPC | Gb: european patent ceased through non-payment of renewal fee |
Effective date: 20230629 |
|
| PG25 | Lapsed in a contracting state [announced via postgrant information from national office to epo] |
Ref country code: BE Free format text: LAPSE BECAUSE OF NON-PAYMENT OF DUE FEES Effective date: 20230430 |
|
| 26N | No opposition filed |
Effective date: 20240103 |
|
| PG25 | Lapsed in a contracting state [announced via postgrant information from national office to epo] |
Ref country code: IE Free format text: LAPSE BECAUSE OF NON-PAYMENT OF DUE FEES Effective date: 20230414 |