EP2228733A2 - Elektronischer Rechner und Steuerungsverfahren dafür - Google Patents
Elektronischer Rechner und Steuerungsverfahren dafür Download PDFInfo
- Publication number
- EP2228733A2 EP2228733A2 EP10155763A EP10155763A EP2228733A2 EP 2228733 A2 EP2228733 A2 EP 2228733A2 EP 10155763 A EP10155763 A EP 10155763A EP 10155763 A EP10155763 A EP 10155763A EP 2228733 A2 EP2228733 A2 EP 2228733A2
- Authority
- EP
- European Patent Office
- Prior art keywords
- graph
- display unit
- calculation
- display control
- unit
- Prior art date
- Legal status (The legal status is an assumption and is not a legal conclusion. Google has not performed a legal analysis and makes no representation as to the accuracy of the status listed.)
- Withdrawn
Links
Images






Classifications
-
- G—PHYSICS
- G06—COMPUTING OR CALCULATING; COUNTING
- G06F—ELECTRIC DIGITAL DATA PROCESSING
- G06F15/00—Digital computers in general; Data processing equipment in general
- G06F15/02—Digital computers in general; Data processing equipment in general manually operated with input through keyboard and computation using a built-in program, e.g. pocket calculators
- G06F15/0225—User interface arrangements, e.g. keyboard, display; Interfaces to other computer systems
Definitions
- the present invention relates to an electronic computer suitable for a graphical function calculator or the like and a method of controlling the same.
- Some of the known electronic computers including scientific electronic calculators, are so-called graphical function calculators which display a graph corresponding to a function expression input by the user.
- the graphical function calculator draws and displays a graph of the function on the orthogonal coordinate axes.
- Some graphical function calculators have a trace function.
- the trace function is to move a pointer on the function graph according to the key operation and display the coordinate values of the position of the pointer on the graph at the time.
- an electronic computer comprising: a display unit; a graph display control unit that performs display control of a graph corresponding to a function expression on the display unit; a position specify unit that specifies a plurality of point positions on the graph displayed on the display unit according to a user operation; a pointer display control unit that performs display control of a pointer for each of the plurality of point positions on the display unit specified by the position specify unit; a calculation result display control unit that does a specific calculation on the basis of positional information on a plurality of pointers displayed on the display unit and the function expression of the graph and performs display control of a result of calculation on the display unit; and a pointer movement control unit that performs movement display control on the graph of an arbitrary one of the plurality of pointers displayed on the display unit according to a user operation, wherein the calculation result display control unit does the calculation again, updates the result of calculation, and performs display control of the updated result on the display unit each time the pointer movement control unit perform
- a graphical function calculator 10 includes a processor 11.
- the processor 11 controls the operation of each part of the circuitry of the graphical function calculator 10 by use of a work storage area 17 (e.g., random access memory [RAM]) according to a system program previously stored in a storage area 12 (e.g., a flash memory), a computer control program read into the storage area 12 from an external storage medium 13 (e.g., a memory card) via a storage medium controller 14, or a computer control program downloaded into the storage area 12 from a Web server (or a program server) 15 on a communication network N via a communication control unit 16.
- a work storage area 17 e.g., random access memory [RAM]
- a storage area 12 e.g., a flash memory
- a computer control program read into the storage area 12 from an external storage medium 13 e.g., a memory card
- a Web server or a program server
- the system program or computer control program previously stored in the storage area 12 is activated in response to a key input signal from an input unit 18.
- the storage area 12 Connected to the processor 11 are the storage area 12, the storage medium controller 14, the communication control unit 16, the work storage area 17, the input unit 18, and a display unit 19.
- the storage area 12 stores a computer control program which supervises the entire operation of the graphical function calculator 10, a mathematical operation program 12a which performs arithmetic processing according to various function expressions arbitrarily input by the user, a graphing program 12b which causes the display unit 19 to display various function expressions used by the mathematical operation program 12a in the form of graphs, a multipoint trace program 12c which is for displaying a plurality of pointers that move while tracing a function expression graph displayed on the display unit 19, and a inter-points analysis program 12d which is for making analyses by various calculations in each of the intervals sectionalized by the plurality of pointers.
- the input unit 18 is provided with function keys 18a which are operated to specify functions in various compute modes provided on the graphical function calculator 10, alphanumeric keys 18b which are operated to input various numbers, characters, and others used in function expressions, a confirmation key 18c which is operated to specify the confirmation of input data or the execution of mathematical operations, cursor keys 18d, " ⁇ ,” “ ⁇ ,” “ ⁇ ,” “ ⁇ ,” which are operated to move and display cursor C or the input position of an item on the display screen or specify the movement of a pointer on the displayed graph, a touch panel 18e composed of a transparent electrode layer integrally formed on the display unit 19, and others.
- a function name to specify the execution of the function or a symbol or the like corresponding to the function name may be displayed on the display unit 19 in the form of a rectangular button.
- the function can be executed by pressing the display position of the button on the touch panel 18e.
- the display unit 19 is composed of, for example, a Liquid Crystal Display (LCD) that provides a dot-matrix display with a backlight.
- the display unit 19 displays an input function expression, a graph of the function expression with the orthogonal coordinate axes, and a plurality of pointers on the graph.
- LCD Liquid Crystal Display
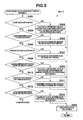
- FIGS. 2 and 3 are flowcharts to mainly explain the process of displaying a graph when a function expression is input. A detailed explanation of the processes not directly related to the embodiment will not be given, provided that other suitable processes are performed.
- step S101 it is determined whether a key operation has been performed to specify graphing for the input function expression.
- the graphing program 12b causes the display unit 19 to draw and display a graph under graphing conditions set at the time (step S102).
- the graphing conditions are such that, for example, an x-coordinate binary value representing a range of the graph on the x-axis and a y-coordinate binary value representing a range of the graph on the y-axis are input and set in advance.
- step S104 After it has been determined that an analysis point for analyzing the vicinity of a specific point on the graph have not been set (step S103), it is determined whether an operation to add a first trace pointer which moves on the graph has been performed (step S104).
- the multipoint trace program 12c causes the display unit 19 to display not only the first trace pointer at a point on the graph, such as a position corresponding to the midpoint of the x-coordinate in the display range, but also the x-coordinate value and the y-coordinate value of the position (step S105).
- step S106 it is further determined whether an operation to add a second trace pointer which moves over the graph has been performed.
- the multipoint trace program 12c displays not only the second trace pointer at a point on the graph on the display unit 19, for example, at a position shifted one graduation from the first trace pointer in the positive direction of the x-axis, but also the x- and y-coordinate values of the position (step S107).
- step S108 a first process is performed (step S108).
- the inter-points analysis program 12d carries out an operation between two points in the preset calculation mode and the result of the calculation is displayed together with the graph.
- step S109 it is further determined whether operations to add a third and later trace pointers have been performed.
- control returns to step S107 and the multipoint trace program 12c causes the display unit 19 to display not only the trace pointer at one other point on the graph but also the x- and y-coordinate values of the one other point.
- the inter-points analysis program 12d performs a first process in response to the added trace pointer (step S108).
- the inter-points analysis program 12d carries out an operation between the third and later pointers in the preset calculation mode and displays the result of calculation together with the graph.
- step S112 if it has been determined that the distance between the trace pointers is not set, it is determined whether a key operation to specify the movement of any one of the plurality of trace pointers has been performed.
- step S114 If it has been determined that a key operation to specify the movement has not been performed, it is determined whether an operation to terminate the operation at the graphical function calculator 10 and shut down the power supply has been performed (step S114).
- control returns to the process in step S112.
- steps S112 and S114 are performed repeatedly, thereby waiting for either a key operation to specify the movement of a trace pointer or a key operation to terminate the operation and shut down the power supply to be performed.
- step S114 if a key operation to terminate the operation and shut down the power supply has been performed, it is determined in step S114 that the key operation has been performed and the power supply is shut down as requested by the operation, which terminates the processes of FIGS. 2 and 3 .
- step S112 If it has been determined in step S112 that a key operation to specify the movement of a trace pointer has been performed, the multipoint trace program 12c moves the specified trace pointer on the graph according to the operation of the cursor keys (" ⁇ " and " ⁇ " keys) 18d on the input unit 18 and displays the x-and y-coordinate values after the movement of the pointer (step S113).
- step S108 control is passed to the processes in step S108 and forward and a first process is carried out.
- the inter-points analysis program 12d carries out a new operation between trace pointers on the basis of the trace pointer moved on the graph and displays the result of calculation together with the graph.
- step S201 it is determined whether the calculation mode set at the time is the slope calculation mode in which a slope between points is calculated.
- step S203 the display unit 19 is caused to display the results of calculation together with the graph (step S203), which terminates the subroutine and returns control to the main routine of FIG. 2 .
- FIG. 6 shows an example of the transition of the screen on the display unit 19 when the slope calculation mode has been set.
- trace pointer P2 for a second point is displayed in a position shifted a specific distance, for example, only 2, from trace pointer P1 in the positive direction of the x-axis, as shown in FIG. 6 (D) .
- a slope of dY/dX with respect to an increment in the x-direction and a slope of dX/dY with respect to an increment in the y-direction are calculated.
- One of the two slopes is the reciprocal of the other unless both of the two slopes are not zero.
- the confirmation key 18c is operated to determine the selection of trace pointer P2 and then " ⁇ " key or " ⁇ ” key in the cursor keys 18d is operated to move trace pointer P2 arbitrarily on the graph.
- FIG. 6 (E) shows a state where trace pointer P2 is moved to the coordinate position (4, 14) by operating, for example, " ⁇ " key in the cursor keys 18d.
- trace pointers for the third and later points can be specified.
- the third trace pointer (P3) is displayed in a position greater in the x-direction than the coordinate position of trace pointer P2
- an increment in the x-coordinate, an increment in the y-coordinate, and a slope between trace pointer P2 and trace pointer P3 are displayed as the results of calculation.
- step S201 of FIG. 4 if it has been determined that the set calculation mode is not the slope calculation mode, it is determined whether the set calculation mode is the maximum/minimum value calculation mode in which the maximum and minimum values between points is found (step S204).
- step S205 the maximum and minimum values which Y between two adjacent trace pointers can take are calculated (step S205) and the results of calculation are displayed together with the graph on the display unit 19 (step S203), which completes the subroutine and returns control to the main routine of FIG. 2 .
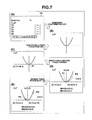
- FIG. 7 shows an example of the transition of the screen on the display unit 19 when the maximum/minimum value calculation mode has been set.
- trace pointer P2 for the second point is displayed in a position shifted a specific distance, for example, only 2, from trace pointer P1 in the positive direction of the x-axis, as shown in FIG. 7 (D) .
- a y-coordinate range of "0 ⁇ Y ⁇ 4" between two trace pointers is displayed in the upper part of the y-axis and an x-coordinate range of "0 ⁇ X ⁇ 2" is displayed above the right end of the x-axis.
- the confirmation key 18c is operated to determine the selection of trace pointer P1 and then " ⁇ " key or " ⁇ ” key in the cursor keys 18d is operated to move trace pointer P1 arbitrarily on the graph.
- the confirmation key 18c is operated to determine the selection of trace pointer P2 and then " ⁇ " key or " ⁇ ” key in the cursor keys 18d is operated to move trace pointer P2 arbitrarily on the graph.
- FIG. 7 (E) shows a state where trace pointer P1 is moved to the coordinate position (-2, 4) by operating, for example, " ⁇ " key in the cursor keys 18d and trace pointer P2 is moved to the coordinate position (5, 25) by operating " ⁇ " key in the cursor keys 18d.
- trace pointers for the third and later points can be specified.
- trace pointer (P3) for the third point is displayed in a position greater in the x-direction than the coordinate position of trace pointer P2
- the maximum and minimum values between trace pointer P1 and trace pointer P2 and the maximum and minimum values between trace pointer P2 and trace pointer P3 are displayed as the results of calculation.
- step S204 of FIG. 4 if it has been determined that the set calculation mode is not the maximum/minimum value calculation mode, it is determined whether the set calculation mode is the integration calculation mode in which an integration value between points is found (step S206).
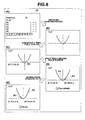
- FIG. 8 shows an example of the transition of the screen on the display unit 19 when the integration calculation mode has been set.
- trace pointer P1 for the first point is displayed in the position of the origin, the intersection of the x- and y-axes, as shown in FIG. 8 (C) .
- trace pointer P2 for the second point is displayed in a position shifted a specific distance, for example, only 2, from trace pointer P1 in the positive direction of the x-axis, as shown in FIG. 8 (D) .
- the confirmation key 18c is operated to determine the selection of trace pointer P1 and then " ⁇ " key or " ⁇ ” key in the cursor keys 18d is operated to move trace pointer P1 arbitrarily on the graph.
- the confirmation key 18c is operated to determine the selection of trace pointer P2 and then " ⁇ " key or " ⁇ ” key in the cursor keys 18d is operated to move trace pointer P2 arbitrarily on the graph.
- FIG. 8 (E) shows a state where trace pointer P1 has been moved to the coordinate position (-2, 4) by operating, for example, " ⁇ " key in the cursor keys 18d and trace pointer P2 has been moved to the coordinate position (4, 16) by operating " ⁇ " key in the cursor keys 18d.
- trace pointers for the third and later points can be specified.
- trace pointer (P3) for the third point is displayed in a position greater in the x-direction than the coordinate position of trace pointer P2
- the integration value between trace pointer P1 and trace pointer P2 and the integration value between trace pointer P2 and trace pointer P3 are displayed as the results of calculation.
- step S206 of FIG. 4 if it has been determined that the set calculation mode is not the integration calculation mode, it is determined that the set calculation mode is the maximum/minimum differential value calculation mode in which the maximum and minimum differential values between points is found (step S208).
- step S209 the maximum and minimum differential values between two adjacent trace pointers are calculated (step S209) and the results of calculation are displayed together with the graph on the display unit 19 (step S203), which completes the subroutine and returns control to the main routine of FIG. 2 .
- FIG. 9 shows an example of the transition of the screen on the display unit 19 when the maximum/minimum differential value calculation mode has been set.
- trace pointer P2 for the second point is displayed in a position shifted a specific distance, for example, only 2, from trace pointer P1 in the positive direction of the x-axis.
- the confirmation key 18c is operated to determine the selection of trace pointer P2 and then " ⁇ " key or " ⁇ ” key in the cursor keys 18d is operated to move trace pointer P2 arbitrarily on the graph.
- FIG. 9 (E) shows a state where trace pointer P2 is moved to the coordinate position (4, -0.77) by operating, for example, " ⁇ " key in the cursor keys 18d.
- trace pointers for the third and later points can be specified.
- trace pointer (P3) for the third point is displayed in a position greater in the x-direction than the coordinate position of trace pointer P2
- the maximum and minimum differential values between trace pointer P1 and trace pointer P2 and the maximum and minimum differential values between trace pointer P2 and trace pointer P3 are displayed as the results of calculation.
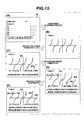
- step S208 of FIG. 4 if it has been determined that the set calculation mode is not the maximum/minimum differential value calculation mode, it is determined whether the set calculation mode is the continuity/discontinuity determination mode in which it is determined whether the graph is continuous or discontinuous between points is found (step S210).
- step S211 it is determined whether the graph between two adjacent trace pointers is continuous or discontinuous and the determination result is displayed together with the graph on the display unit 19 (step S203), which completes the subroutine and returns control to the main routine of FIG. 2 .
- trace pointer P2 for the second point is displayed in a position shifted a specific distance, for example, only 2, from trace pointer P1 in the positive direction of the x-axis.
- step S211 is displayed as "the interval between P1 and P2 is discontinuous" together with the graph.
- trace pointer P3 for the third point is displayed in a position shifted a specific distance, for example, only 2, from trace pointer P2 in the positive direction of the x-axis.
- the confirmation key 18c is operated to determine the selection of trace pointer P2 and then " ⁇ " key or " ⁇ ” key in the cursor keys 18d is operated to move trace pointer P2 arbitrarily on the graph.
- step S210 of FIG. 4 if it has been determined that the set calculation mode is not the continuity/discontinuity determination mode, it is determined whether the set calculation mode is the local maximum/minimum value calculation mode in which a local maximum value and a local minimum value between points are found (step S212).
- step S212 If it has been determined in step S212 that the local maximum/minimum value calculation mode has been set, a local maximum value and a local minimum value between two adjacent trace pointers are calculated (step S213) and the results of calculation are displayed together with the graph on the display unit 19 (step S203), which completes the subroutine and returns control to the main routine of FIG. 2 .
- FIG. 11 shows an example of the transition of the screen on the display unit 19 when the local maximum/minimum value calculation mode has been set.
- trace pointer P2 for the second point is displayed in a position shifted a specific distance, for example, only 2, from trace pointer P1 in the positive direction of the x-axis, as shown in FIG. 11 (D) .
- the confirmation key 18c is operated to determine the selection of trace pointer P1 and then " ⁇ " key or " ⁇ ” key in the cursor keys 18d is operated to move trace pointer P1 arbitrarily on the graph.
- the confirmation key 18c is operated to determine the selection of trace pointer P2 and then " ⁇ " key or " ⁇ ” key in the cursor keys 18d is operated to move trace pointer P2 arbitrarily on the graph.
- FIG. 11 (E) shows a state where trace pointer P1 for the first point has been moved to the coordinate position (-1, 0.672) by operating, for example, " ⁇ " key in the cursor keys 18d.
- trace pointers for the third and later points can be specified.
- trace pointer (P3) for the third point is displayed, the local maximum and minimum values between trace pointer P1 and trace pointer P2 and the local maximum and minimum values between trace pointer P2 and trace pointer P3 are displayed as the results of calculation.
- the local maximum/minimum value calculation mode it is determined whether there are a local maximum value and a local minimum value between two trace pointers.
- a local maximum value and a local minimum value its value is calculated and the result of calculation is displayed together with the graph. Therefore, when the graph takes at least one of a local maximum value and a local minimum value, its coordinate position can easily understood.
- step S110 of FIG. 2 If it has been determined in step S110 of FIG. 2 that the distance between the trace pointers input at the time is set, the individual trace pointers are rearranged on the graph so that the distance may be equal to the distance in the x-axis direction previously set by the multipoint trace program 12c and, from this point on, setting is done so that the distance in the x-axis direction between the individual trace pointers may always be constant (step S111).
- FIG. 12 shows an example of the transition of the screen on the display unit 19 concerning the setting of trace pointer interval when the slope calculation mode has been set.
- trace pointer P1 for the first point is displayed in the position of the origin, the intersection of the x-and y-axes, and trace pointer P2 for the second point is displayed in a position shifted a specific distance, for example, only 2, from trace pointer P1 in the positive direction of the x-axis, as shown in FIG. 12 (C) .
- the confirmation key 18c is operated twice, which passes control to a state where the distance between trace pointers is set.
- FIG. 12 (D) illustrates a trace pointer distance setting window WS displayed almost in the center of the display unit 19.
- the following is displayed:
- the default distance "1" is highlighted. On the basis of the distance at the time, the value is updated and set by operating " ⁇ " key or " ⁇ " key in the cursor keys 18d and the confirmation key 18c is operated to complete the setting.
- the graph display on the display unit 19 changes as shown in FIG. 12 (E) as a result of the setting.
- trace pointer P1 of the specified first point moves on the graph automatically so that the distance from trance pointer P2 for the second point may be equal to the set value "1."
- an increment in the y-direction 4
- step S115 If it has been determined in step S103 of FIG. 2 that an analysis point for analyzing the vicinity of a specific position on the graph has been set, the position of a point to be analyzed by the graphing program 12b and its coordinate value are displayed on the graph on the display unit 19 (step S115).
- trace pointers for two points which are each equally spaced from the displayed analysis point in the positive and negative directions along the x-axis, for example, X T 0.5 from the analysis point, are displayed on the graph as a pair of pointers with the analysis point at midpoint between the pointers (step S16).
- step S117 a second process is performed (step S117).
- the second process calculations between two points forming a pair are done by the inter-points analysis program 12d in the preset calculation mode and the results of calculation are displayed together with the graph.
- step S118 it is determined whether a key operation to specify the movement of one of the two trace pointers has been performed.
- step S120 If it has been determined that a key operation to specify the movement has not been performed, it is determined whether an operation to terminate the operation of the graphical function calculator 10 and shut down the power supply has been performed (step S120).
- control returns to step S118. Then, the processes in steps S118 and S120 are carried out repeatedly, thereby waiting for either a key operation to specify the movement of the trace pointer or a key operation to terminate the operation and shut down the power supply to be performed.
- step S120 if a key operation to terminate the operation and shut down the power supply has been performed, it is determined in step S120 that the key operation has been performed and the power supply is shut down as requested by the operation, which completes the processes of FIGS. 2 and 3 .
- step S118 If it has been determined in step S118 that a key operation to specify the movement of the trace pointer has been performed, the specified trace pointer is moved on the graph by the multipoint trace program 12c according to the operation of the cursor keys (" ⁇ " and " ⁇ " keys) 18d on the input unit 18 and, at the same time, the other of the pair of trace pointers is also moved so that the distance from the analysis point in the x-direction may be the same, interlocking with the positional relationship between the moved trace pointer and the analysis point (step S119).
- step S117 control proceeds to the process in step S117 and a second process is performed.
- the inter-points analysis program 12d does calculations between two trace pointers on the basis of the trace pointer whose position has been moved on the graph and the results of calculation are displayed together with the graph.
- FIG. 5 shows a subroutine to explain the details of the second process related to the calculations between trace pointers and the display of the results of calculation in step S117.
- step S301 it is determined whether the calculation mode set at the time is the slope calculation mode in which a slope between points is calculated.
- a differential value at the analysis point, an increment in each of the x- and y-coordinates between two trace pointers, and a slope between the two points are calculated (step S302).
- step S303 the display unit 19 is caused to display the result of calculation together with the graph (step S303), which terminates the subroutine and returns control to the main routine of FIG. 3 .
- FIG. 13 shows an example of the transition of the screen on the display unit 19 when the slope calculation mode has been set.
- a pair of trace pointers P1, P2 whose x-coordinate values are ⁇ 0.5 with respect to analysis point A is displayed on the graph, as shown in FIG. 13 (D) .
- a slope of dY/dX with respect to an increment in the x-direction and a slope of dX/dY with respect to an increment in the y-direction are determined.
- One of the two slopes is the reciprocal of the other unless both of them are not zero.
- the confirmation key 18c is operated to determine the selection of trace pointer P1 and then " ⁇ " key or " ⁇ ” key in the cursor keys 18d is operated to move trace pointer P1 arbitrarily on the graph.
- FIG. 13 (E) shows a state where trace pointer P1 has been moved to the coordinate position (1.7, 2.89) by operating, for example, " ⁇ " key in the cursor keys 18d.
- trace pointer P2 moves automatically, interlocking with the movement of trace pointer P1. Since the distance between trace pointer P1 and the analysis point on the x-axis is 0.3, trace pointer P2 moves automatically to the coordinates (2.3, 5.29) to keep the equal distance in the x-axis direction.
- a differential value at analysis point A an increment in each of the x- and y-coordinates between two trace pointers P1 and P2 with the analysis point at mid-point between them, and a slope between two points are calculated and the results of calculation are displayed together with the graph.
- step S301 of FIG. 5 if it has been determined that the set calculation mode is not the slope calculation mode, it is determined whether the set calculation mode is the maximum/minimum value calculation mode in which the maximum and minimum values between points is found (step S304).
- step S305 the maximum and minimum values between two adjacent trace pointers are calculated (step S305) and the results of calculation are displayed together with the graph on the display unit 19 (step S303), which completes the subroutine and returns control to the main routine of FIG. 3 .
- step S304 of FIG. 5 if it has been determined that the set calculation mode is not the maximum/minimum value calculation mode, it is determined whether the set calculation mode is the integration calculation mode in which an integration value between points is found (step S306).
- step S307 an integration value between two adjacent trace pointers is calculated (step S307) and the result of calculation is displayed together with the graph on the display unit 19 (step S303), which completes the subroutine and returns control to the main routine of FIG. 3 .
- step S306 of FIG. 5 if it has been determined that the set calculation mode is not the integration calculation mode, it is determined whether the set calculation mode is the maximum/minimum differential value calculation mode in which the maximum and minimum differential values between points is found (step S308). If it has been determined that the maximum/minimum differential value calculation mode has been set, not only a differential value at the analysis point but also the maximum and minimum differential values between two adjacent trace pointers are calculated (step S309) and the results of calculation are displayed together with the graph on the display unit 19 (step S303), which completes the subroutine and returns control to the main routine of FIG. 3 .
- step S308 of FIG. 5 if it has been determined that the set calculation mode is not the maximum/minimum differential value calculation mode, it is determined whether the set calculation mode is the continuity/discontinuity determination mode in which it is determined whether the graph is continuous or discontinuous between points is found (step S310).
- step S311 If it has been determined that the continuity/discontinuity determination mode has been set, it is determined whether the graph is continuous or discontinuous between two adjacent trace pointers (step S311) and the determination result is displayed together with the graph on the display unit 19 (step S303), which completes the subroutine and returns control to the main routine of FIG. 3 .
- step S310 of FIG. 5 if it has been determined that the set calculation mode is not the continuity/discontinuity determination mode, it is determined whether the set calculation mode is the local maximum/minimum value calculation mode in which a local maximum value and a local minimum value between two trace pointers are found (step S312).
- step S312 if it has been determined that the local maximum/minimum value calculation mode has been set, a local maximum value and a local minimum value between two adjacent trace pointers are calculated (step S313) and the results of calculation are displayed together with the graph on the display unit 19 (step S303), which completes the subroutine and returns control to the main routine of FIG. 3 .
- the local maximum/minimum value calculation mode it is determined whether there are a local maximum value and a local minimum value between two trace pointers and, if at least one of a local maximum value and a local minimum value exists, the value of it is calculated and the result of calculation is displayed together with the graph. Therefore, when the graph takes at least one of a local maximum value and a local minimum value, its coordinate position can be known easily.
- the set calculation mode is performed in a state where the analysis point is displayed in the process of FIG. 5 , thereby displaying the contents of the calculation together with the graph in each of the calculation modes, particularly including the position of an arbitrary point to be analyzed, which enables the user to gain a better understanding of the graph.
- the calculation mode is set in advance and a graph of the input function expression is displayed
- the invention is not limited to this. For instance, after a graph of the input function expression is displayed and then trace pointers are displayed on the graph, each of the calculation modes may be selected and set. In that case, the selected calculation mode can be changed in a state where the graph of the function expression is displayed, which contributes to a better understanding of the graph of the function expression.
- the x-coordinate value may be input directly with the alphanumeric keys 18b. In that case, it is conceivable that, for example, infinity can be input.
- the methods of operating in the mathematical operation modes on the graphical function calculator 10 described in the embodiment, including the process shown in the flowchart of FIG. 3 , the subroutine of inter-pointer calculation result display process 1 shown in FIG. 4 , and the subroutine of inter-pointer calculation result display process 2 shown in FIG. 5 can be stored in an external storage medium 13, such as a memory card (e.g., a ROM card or a RAM card), a magnetic disk (e.g., a floppy disk or a hard disk), an optical disk (e.g., a CD-ROM or a DVD), or a semiconductor memory, in the form of programs the computer can execute. Then, the mediums can be delivered.
- a memory card e.g., a ROM card or a RAM card
- a magnetic disk e.g., a floppy disk or a hard disk
- an optical disk e.g., a CD-ROM or a DVD
- semiconductor memory e.g., a semiconductor
- the computer 11 of the graphical function calculator 10 reads the program stored in the external storage medium 13 into a storage unit 12 or work unit 17.
- the computer is controlled by the read-in program, thereby realizing the functions explained in the embodiment, which enables the same processes in the aforementioned methods to be carried out.
- the data of the programs which realize the above methods can be transferred in the form of program code through a communication network (public line) N.
- the program data can be loaded into the computer 11 of the graphical function calculator 10 by the communication control unit 16 connected to the communication network N, thereby realizing the aforementioned functions.
- program data can be loaded into a personal computer, thereby realizing the aforementioned functions.
Landscapes
- Engineering & Computer Science (AREA)
- Computer Hardware Design (AREA)
- Computing Systems (AREA)
- General Engineering & Computer Science (AREA)
- Theoretical Computer Science (AREA)
- Human Computer Interaction (AREA)
- Physics & Mathematics (AREA)
- General Physics & Mathematics (AREA)
- Calculators And Similar Devices (AREA)
- Controls And Circuits For Display Device (AREA)
- Image Generation (AREA)
- User Interface Of Digital Computer (AREA)
Applications Claiming Priority (1)
| Application Number | Priority Date | Filing Date | Title |
|---|---|---|---|
| JP2009059670A JP4775463B2 (ja) | 2009-03-12 | 2009-03-12 | 電子計算機及びプログラム |
Publications (1)
| Publication Number | Publication Date |
|---|---|
| EP2228733A2 true EP2228733A2 (de) | 2010-09-15 |
Family
ID=42315935
Family Applications (1)
| Application Number | Title | Priority Date | Filing Date |
|---|---|---|---|
| EP10155763A Withdrawn EP2228733A2 (de) | 2009-03-12 | 2010-03-08 | Elektronischer Rechner und Steuerungsverfahren dafür |
Country Status (5)
| Country | Link |
|---|---|
| US (1) | US8514227B2 (de) |
| EP (1) | EP2228733A2 (de) |
| JP (1) | JP4775463B2 (de) |
| CN (1) | CN101840389B (de) |
| AU (1) | AU2010200876B2 (de) |
Families Citing this family (17)
| Publication number | Priority date | Publication date | Assignee | Title |
|---|---|---|---|---|
| JP5811781B2 (ja) * | 2011-11-07 | 2015-11-11 | カシオ計算機株式会社 | グラフ表示装置およびプログラム |
| JP5929156B2 (ja) * | 2011-12-16 | 2016-06-01 | カシオ計算機株式会社 | グラフ表示装置およびプログラム |
| US9361713B2 (en) * | 2012-04-30 | 2016-06-07 | Masdar Institute Of Science And Technology | Systems and methods for analyzing graphs and/or physical bodies |
| CN102819519A (zh) * | 2012-07-31 | 2012-12-12 | 苏州萃智新技术开发有限公司 | 一种手表式计算器 |
| JP5768787B2 (ja) * | 2012-09-18 | 2015-08-26 | カシオ計算機株式会社 | グラフ表示制御装置及びグラフ表示制御プログラム |
| JP5892094B2 (ja) * | 2013-03-21 | 2016-03-23 | カシオ計算機株式会社 | グラフ表示制御装置、グラフ表示制御方法及びグラフ表示制御プログラム |
| JP6237043B2 (ja) * | 2013-03-29 | 2017-11-29 | カシオ計算機株式会社 | 数式表示制御装置、数式表示制御方法、数式表示制御プログラム |
| JP6221323B2 (ja) | 2013-04-22 | 2017-11-01 | カシオ計算機株式会社 | グラフ表示装置およびその制御プログラム |
| JP5692317B2 (ja) * | 2013-09-10 | 2015-04-01 | カシオ計算機株式会社 | 計算装置及び計算プログラム |
| JP6318615B2 (ja) | 2013-12-27 | 2018-05-09 | カシオ計算機株式会社 | グラフ表示制御装置、電子機器およびプログラム |
| JP6287412B2 (ja) | 2014-03-19 | 2018-03-07 | カシオ計算機株式会社 | 図形描画装置、図形描画方法およびプログラム |
| JP6318822B2 (ja) * | 2014-04-24 | 2018-05-09 | カシオ計算機株式会社 | グラフ表示制御装置、グラフ表示制御方法、およびプログラム |
| JP6394163B2 (ja) | 2014-08-07 | 2018-09-26 | カシオ計算機株式会社 | グラフ表示装置、グラフ表示方法およびプログラム |
| JP6939135B2 (ja) * | 2017-06-23 | 2021-09-22 | カシオ計算機株式会社 | 電子機器、プログラム、サーバ、グラフ画像生成方法およびグラフ画像生成システム |
| JP7087393B2 (ja) * | 2018-01-12 | 2022-06-21 | カシオ計算機株式会社 | 表示制御装置、表示制御方法、およびプログラム |
| JP7192342B2 (ja) * | 2018-09-20 | 2022-12-20 | カシオ計算機株式会社 | 電子機器、電子機器の制御方法、及び電子機器の制御プログラム |
| CN114491377B (zh) * | 2020-11-13 | 2024-07-26 | 北京广利核系统工程有限公司 | 应用于核电站的斜率计算方法及装置 |
Citations (1)
| Publication number | Priority date | Publication date | Assignee | Title |
|---|---|---|---|---|
| JP2001216273A (ja) | 2000-02-02 | 2001-08-10 | Casio Comput Co Ltd | n進グラフ表示装置及びn進グラフ表示処理プログラムを記憶した記憶媒体 |
Family Cites Families (13)
| Publication number | Priority date | Publication date | Assignee | Title |
|---|---|---|---|---|
| JPH0792789B2 (ja) * | 1985-05-24 | 1995-10-09 | カシオ計算機株式会社 | グラフ表示装置 |
| JPH0719240B2 (ja) * | 1985-05-31 | 1995-03-06 | カシオ計算機株式会社 | グラフ表示機能を備えた小型電子式計算機 |
| JPS63103353A (ja) * | 1986-10-21 | 1988-05-09 | Sharp Corp | グラフ表示装置 |
| JP3358809B2 (ja) * | 1990-11-28 | 2002-12-24 | カシオ計算機株式会社 | グラフ表示制御装置及びグラフ表示制御方法 |
| JP2686008B2 (ja) * | 1991-11-26 | 1997-12-08 | 富士通株式会社 | 分子動力学計算装置 |
| CN1068688C (zh) * | 1994-10-05 | 2001-07-18 | 吴胜远 | 一种文字信息处理方法和装置 |
| JP3109421B2 (ja) * | 1995-09-08 | 2000-11-13 | 富士ゼロックス株式会社 | 図表処理装置 |
| JP3663697B2 (ja) * | 1995-11-09 | 2005-06-22 | カシオ計算機株式会社 | グラフ表示装置およびグラフ表示制御方法 |
| US6867777B2 (en) * | 2000-12-20 | 2005-03-15 | Texas Instruments Incorporated | Tracing and storing points of interest on a graphing calculator |
| JP2002351848A (ja) * | 2001-05-30 | 2002-12-06 | Casio Comput Co Ltd | グラフ表示制御装置及びグラフトレースプログラム |
| JP3988506B2 (ja) * | 2002-03-29 | 2007-10-10 | カシオ計算機株式会社 | グラフ表示機能付き電子機器、プログラム、およびグラフ表示方法 |
| EP2453345B1 (de) * | 2002-09-30 | 2016-03-23 | Casio Computer Co., Ltd. | Grafische Anzeigesteuerungsvorrichtung und Programm |
| US8280935B2 (en) * | 2006-12-12 | 2012-10-02 | Casio Computer Co., Ltd. | Graphing calculation apparatus and controlling method of graphing calculation apparatus |
-
2009
- 2009-03-12 JP JP2009059670A patent/JP4775463B2/ja not_active Expired - Fee Related
-
2010
- 2010-03-08 EP EP10155763A patent/EP2228733A2/de not_active Withdrawn
- 2010-03-09 US US12/720,097 patent/US8514227B2/en active Active
- 2010-03-09 AU AU2010200876A patent/AU2010200876B2/en active Active
- 2010-03-11 CN CN2010101363324A patent/CN101840389B/zh active Active
Patent Citations (1)
| Publication number | Priority date | Publication date | Assignee | Title |
|---|---|---|---|---|
| JP2001216273A (ja) | 2000-02-02 | 2001-08-10 | Casio Comput Co Ltd | n進グラフ表示装置及びn進グラフ表示処理プログラムを記憶した記憶媒体 |
Also Published As
| Publication number | Publication date |
|---|---|
| JP4775463B2 (ja) | 2011-09-21 |
| US20100231596A1 (en) | 2010-09-16 |
| CN101840389A (zh) | 2010-09-22 |
| AU2010200876B2 (en) | 2012-06-14 |
| US8514227B2 (en) | 2013-08-20 |
| CN101840389B (zh) | 2012-08-15 |
| AU2010200876A1 (en) | 2010-09-30 |
| JP2010211723A (ja) | 2010-09-24 |
Similar Documents
| Publication | Publication Date | Title |
|---|---|---|
| US8514227B2 (en) | Electronic computer and method of controlling the same | |
| EP2237230B1 (de) | Steuerungsvorrichtung für Graphenanzeige und Steuerungsverfahren für Graphenanzeige | |
| US20090307587A1 (en) | Graphing calculator having touchscreen display unit | |
| US20040227738A1 (en) | Graphic display control device for displaying graph and graphic and recording medium | |
| EP2367116A2 (de) | Graphikanzeigevorrichtung, Aufzeichnungsmedium mit darauf aufgezeichnetem Programm und Graphikanzeigeverfahren | |
| EP1710670A2 (de) | Speichermedium zum Speichern eines Eingabepositionsverarbeitungsprogramms und Eingabepositionsverarbeitungsvorrichtung | |
| CN104111811A (zh) | 图形显示装置以及图形显示方法 | |
| US20150310646A1 (en) | Graph display control apparatus, graph display control method, and recording medium storing graph display control program | |
| US20180101298A1 (en) | Graph display apparatus, graph display method and storage medium | |
| JP7806775B2 (ja) | 電子機器、表示制御方法及びプログラム | |
| JPH07334463A (ja) | 複数グラフ表示機能付き情報処理装置 | |
| CN102200880A (zh) | 曲线图显示装置以及曲线图显示方法 | |
| JP2025070436A (ja) | 電子機器、表示制御方法、及びプログラム | |
| JP2004118727A (ja) | 図形表示制御装置及びプログラム | |
| CN103677626B (zh) | 图表显示控制装置以及图表显示控制方法 | |
| JP4547774B2 (ja) | グラフ表示制御装置、及び記憶媒体 | |
| EP4712060A2 (de) | Elektronische vorrichtung, informationsverarbeitungsverfahren und aufzeichnungsmedium | |
| US20150379749A1 (en) | Object display control apparatus, object display control method, and storage medium storing object display control program | |
| US9734604B2 (en) | Graphic display control device, graphic display control method, and storage medium having stored therein graphic display control program | |
| JP3932709B2 (ja) | グラフ表示装置及びグラフ表示処理プログラムを記録した記録媒体 | |
| JP2004126759A (ja) | 図形表示制御装置及びプログラム | |
| JP4325591B2 (ja) | グラフ表示装置およびグラフ表示処理プログラム | |
| JP2007299220A (ja) | 表示制御装置および表示制御プログラム | |
| JP2011158945A (ja) | グラフ表示制御装置及びプログラム | |
| JP2001357021A (ja) | グラフ表示制御装置、及び記憶媒体 |
Legal Events
| Date | Code | Title | Description |
|---|---|---|---|
| PUAI | Public reference made under article 153(3) epc to a published international application that has entered the european phase |
Free format text: ORIGINAL CODE: 0009012 |
|
| 17P | Request for examination filed |
Effective date: 20100308 |
|
| AK | Designated contracting states |
Kind code of ref document: A2 Designated state(s): AT BE BG CH CY CZ DE DK EE ES FI FR GB GR HR HU IE IS IT LI LT LU LV MC MK MT NL NO PL PT RO SE SI SK SM TR |
|
| AX | Request for extension of the european patent |
Extension state: AL BA ME RS |
|
| STAA | Information on the status of an ep patent application or granted ep patent |
Free format text: STATUS: THE APPLICATION HAS BEEN WITHDRAWN |
|
| 18W | Application withdrawn |
Effective date: 20160318 |